galactic accretion and the outer structure of galaxies in ... · galactic accretion and the outer...
TRANSCRIPT

Mon. Not. R. Astron. Soc. 000, 1–21 (2013) Printed 22 July 2013 (MN LATEX style file v2.2)
Galactic accretion and the outer structure of galaxies in the CDMmodel
Andrew P. Cooper1,2?, Richard D’Souza1, Guinevere Kauffmann1, Jing Wang1,Michael Boylan-Kolchin3, Qi Guo2,4, Carlos S. Frenk4 and Simon D.M. White1
1Max-Planck-Institut fur Astrophysik, Karl-Schwarzschild-Str. 1, D-85748, Garching, Germany2National Astronomical Observatories, Chinese Academy of Sciences, 20A Datun Road, Chaoyang, Beijing 100012, China3Center for Cosmology, Department of Physics and Astronomy, 4129 Reines Hall, University of California, Irvine, CA 92697, USA4Institute for Computational Cosmology, Department of Physics, University of Durham, South Road, Durham, DH1 3LE, UK
Accepted xxxx. Received xxxx; in original form xxxx
ABSTRACTWe have combined the semi-analytic galaxy formation model of Guo et al. (2011) with theparticle-tagging technique of Cooper et al. (2010) to predict galaxy surface brightness pro-files in a representative sample of ∼ 1900 massive dark matter haloes (1012–1014 M) fromthe Millennium II ΛCDM N-body simulation. Here we present our method and basic resultsfocusing on the outer regions of galaxies, consisting of stars accreted in mergers. These simu-lations cover scales from the stellar haloes of Milky Way-like galaxies to the ‘cD envelopes’ ofgroups and clusters, and resolve low surface brightness substructure such as tidal streams. Wefind that the surface density of accreted stellar mass around the central galaxies of dark matterhaloes is well described by a Sersic profile, the radial scale and amplitude of which vary sys-tematically with halo mass (M200). The total stellar mass surface density profile breaks at theradius where accreted stars start to dominate over stars formed in the galaxy itself. This breakdisappears with increasing M200 because accreted stars contribute more of the total mass ofgalaxies, and is less distinct when the same galaxies are averaged in bins of stellar mass, be-cause of scatter in the relation between M? and M200. To test our model we have derivedaverage stellar mass surface density profiles for massive galaxies at z ≈ 0.08 by stackingSDSS images. Our model agrees well with these stacked profiles and with other data fromthe literature and makes predictions that can be more rigorously tested by future surveys thatextend the analysis of the outer structure of galaxies to fainter isophotes. We conclude that it islikely that the outer structure of the spheroidal components of galaxies is largely determinedby collisionless merging during their hierarchical assembly.
Key words: galaxies: structure; galaxies: elliptical and lenticular, cD; galaxies: bulges; galax-ies: evolution
1 INTRODUCTION
Hierarchical clustering leads to the coalescence of dark matterhaloes. Galaxies are formed ‘in situ’ by the cooling and conden-sation of gas in the cores of these haloes (White & Rees 1978) andaccrete additional stars from the debris of their hierarchical pro-genitors. The aim of this paper is to predict how the surface densityprofiles of galaxies reflect changes in the balance between in situstar formation and stellar accretion during their hierarchical growthover the lifetime of the universe.
The idea of using observations of accreted stars to test theoriesof galaxy evolution has its roots in the study of the stellar halo andglobular clusters of the Milky Way and M31 (Baade 1944; Eggen,
? E-mail: [email protected]
Lynden-Bell & Sandage 1962; Searle & Zinn 1978). The recentdiscovery of cold stellar streams in these haloes, some with iden-tifiable progenitors, has provided direct evidence that they grow atleast partly through the tidal disruption of companion galaxies (e.g.Ibata, Gilmore & Irwin 1995; Belokurov et al. 2006; Niederste-Ostholt et al. 2010; McConnachie et al. 2009). Stellar haloes andstreams appear to be a generic feature of late-type galaxies (Zi-betti, White & Brinkmann 2004; Richardson et al. 2009; Martınez-Delgado et al. 2010a; Bailin et al. 2011; Radburn-Smith et al.2011). Shell-like structures have been detected around both earlyand late type galaxies (Malin & Carter 1983; Schweizer 1980;Schweizer et al. 1990; Schweizer & Seitzer 1992; Tal et al. 2009;Martınez-Delgado et al. 2010a) and can also be readily explainedas the result of galactic accretion in a cold dark matter (CDM)universe (e.g Cooper et al. 2011). Galaxies at the centres of mas-
c© 2013 RAS
arX
iv:1
303.
6283
v3 [
astr
o-ph
.CO
] 9
Jul
201
3
2 Cooper et al.
sive clusters are often surrounded by extended envelopes of dif-fuse ‘intracluster light’ (ICL) (Matthews, Morgan & Schmidt 1964;Oemler 1976; Thuan & Romanishin 1981; Schombert 1988; Gra-ham et al. 1996; Lin & Mohr 2004; Gonzalez, Zabludoff, & Zarit-sky 2005; Mihos et al. 2005; Krick, Bernstein, & Pimbblet 2006;Donzelli, Muriel, & Madrid 2011) which is also thought to orig-inate from the stripping and disruption of satellite galaxies (Gal-lagher & Ostriker 1972).
Semi-analytic models of galaxy formation aim to quantify theimportance of the accretion of stars and gas in different types ofgalaxy (White & Frenk 1991; Cole 1991; Kauffmann, White &Guiderdoni 1993; Somerville & Primack 1999; Cole et al. 2000;Baugh et al. 2005; De Lucia & Blaizot 2007; Benson & Bower2010; Guo et al. 2011). In particular, they predict how the massof stars accreted by a galaxy depends on the mass and assemblytime of its dark matter halo, as well as the number of progenitorsof the halo and their individual star formation histories. Such mod-els predict that only the most massive galaxies at the present dayare dominated by stars accreted in mergers; in galaxies less mas-sive than the Milky Way, most stars form in situ from gas coolingdirectly from their halo (Baugh, Cole & Frenk 1996; Kauffmann1996; De Lucia et al. 2006; Naab et al. 2007; Purcell, Bullock, &Zentner 2007; Guo & White 2008; Parry, Eke, & Frenk 2009).
Accretion and merger events may still affect the colour, sizeand morphology of a galaxy even if they make a limited contri-bution to its mass. They are therefore thought to be relevant tothe dichotomy between early and late-type morphologies in theHubble sequence (e.g. Toomre 1977; Fall 1979; Frenk et al. 1985;Cowie et al. 1994; Zepf 1997; Kauffmann & Charlot 1998; Coleet al. 2000; Bell et al. 2004; Sales et al. 2012) and many well-known scaling relations between observable properties of massivegalaxies (Faber & Jackson 1976; Kormendy 1977; Djorgovski &Davis 1987; Peletier et al. 1990; Bender, Burstein & Faber 1992;Kauffmann et al. 2003b; Bernardi et al. 2003), including correla-tions between the luminosity of massive elliptical galaxies and theamplitude and shape of their projected surface brightness profiles(Kormendy 1977; Binggeli, Sandage & Tarenghi 1984; Schombert1986; Graham & Guzman 2003; Kormendy et al. 2009; Graham2011, and references therein).
The effects of stellar accretion on galactic structure dependon the population of infalling galaxies and the rate at which haloescoalesce as well as the gravitational dynamics of the accretion pro-cess. This means that galactic accretion cannot be studied in isola-tion from galaxy formation. The way in which accreted stars are de-posited in the outer regions of galaxies and the consequent changein observables such as half-light radius and stellar mass has beenconsidered extensively in recent literature (Daddi et al. 2005; Tru-jillo et al. 2006; van Dokkum et al. 2010). Simulations focussingon this issue by e.g. Naab, Khochfar & Burkert (2006); Naab et al.(2007); Naab, Johansson, & Ostriker (2009) and Oser et al. (2010)have highlighted the importance of N-body dynamical simulationswhen making quantitative predictions for the evolution of galaxysizes and velocity dispersions in CDM (compare Gonzalez et al.2009; Guo et al. 2011; Shankar et al. 2013). Notably, these simula-tions suggest that high mass ratio mergers contribute significantlyto the structure of massive elliptical galaxies (Hilz et al. 2012; Hilz,Naab & Ostriker 2013).
In this paper we use an extension of the Guo et al. (2011,hereafter G11) semi-analytic galaxy formation model to predict thespatial distribution of all stars accreted on to present-day massivegalaxies. Like many recent numerical studies of the size evolutionof massive quiescent galaxies (Meza et al. 2003; Naab et al. 2009;
Oser et al. 2010) and Milky Way-like galaxies (Abadi, Navarro &Steinmetz 2006; Cooper et al. 2010; Font et al. 2011; Sales et al.2012) we emphasize the difference between in situ star formationand galactic accretion in our analysis. The semi-analytic compo-nent of our model provides the full in situ star formation histories ofgalaxies and all their hierarchical progenitors, matching constraintssuch as the galaxy stellar mass function. In addition, we use an N-body method to predict how each accreted population evolves inall six dimensions of phase space. Our model is applied to the Mil-lennium II simulation, which contain ∼ 2000 haloes in the massrange 1012 < M200 < 1014 M. We can therefore make a statis-tical comparison to observational data on the total amount of ac-creted light around galaxies and its distribution. In this paper, weonly consider galaxies at the centres of virialised dark haloes atz = 0, although our model can also make predictions for galaxiesat high redshift and for galaxies that are satellites at the present day.We focus on the spatial distribution of accreted stars, but we notethat our model also predicts their kinematic properties and chemi-cal abundances.
A statistical study of this sort is motivated by the availabilityof moderately deep wide-field imaging from surveys such as SDSSStripe 82 and PanSTARRS, which will enable us to determine theextent to which results obtained from the Milky Way and M31 stel-lar haloes are applicable to the galaxy population as a whole. Previ-ous studies of galaxy structure in large surveys have focused on re-gions of high surface brightness (e.g. Shen et al. 2003), because theoutskirts of galaxies are usually much fainter than the sky, even inthe case of the envelopes around brightest cluster galaxies (BCGs).Stacking (e.g. Zibetti et al. 2005; Tal & van Dokkum 2011) is apromising technique for studying the average properties of theseregions. We have therefore carried out our own stacking analysisusing imaging data from SDSS, for comparison to our models.
We proceed as follows. In Section 2 we describe how we se-lect a sample of massive central galaxies from the Millennium IIsimulation. We also summarize how our particle-tagging methodworks. Section 3 shows examples of the stellar haloes of individualgalaxies in our model. In Section 4 we present our main statisticalresults in the form of average stellar mass surface density profilesfor haloes and galaxies of different mass, highlighting differencesbetween in situ and accreted stars. We compare with observationsfrom the literature in Section 5 and from our own stacking analysisin Section 6. Section 7 interprets trends in surface brightness pro-file shape by studying the origin of accreted stars in our simulation.We summarise our findings in Section 8. Appendix A discusses thenumerical convergence of our method and differences with our pre-vious work on particle tagging. Appendix B describes the technicaldetails of our SDSS stacking analysis.
2 SIMULATIONS
2.1 Semi-analytic model
Millennium II (Boylan-Kolchin et al. 2009) is a collisionless N -body simulation of ΛCDM structure formation in a comoving vol-ume of 106 h−3 Mpc3 with a flat ΛCDM cosmology, Ωm = 0.25,ΩΛ = 0.75 and Hubble parameter h = 0.73. The particle massis 6.89 × 10⁶ h−1 M. The semi-analytic galaxy model of G11 isbased on halo merger trees derived from Millennium II and its pa-rameters are tuned to fit the SDSS stellar mass function of Li &White (2009; grey dashed line in Fig. 1). Figure 7 of G11 showsthat when same model is applied to the Millennium Simulation
c© 2013 RAS, MNRAS 000, 1–21

Accretion and galaxy structure in CDM 3
10.8 11.0 11.2 11.4
0.5
1.0
1.5
2.0
2.5
3.0
logdN/d
logM
B/T ≤ 0.9
B/T > 0.9
Total (sample)
Total (MII)
Li & White
10.8 11.0 11.2 11.4
0.5
1.0
f ell
10.8 11.0 11.2 11.4
log10 M?/M
0.0
0.5
1.0
f ins
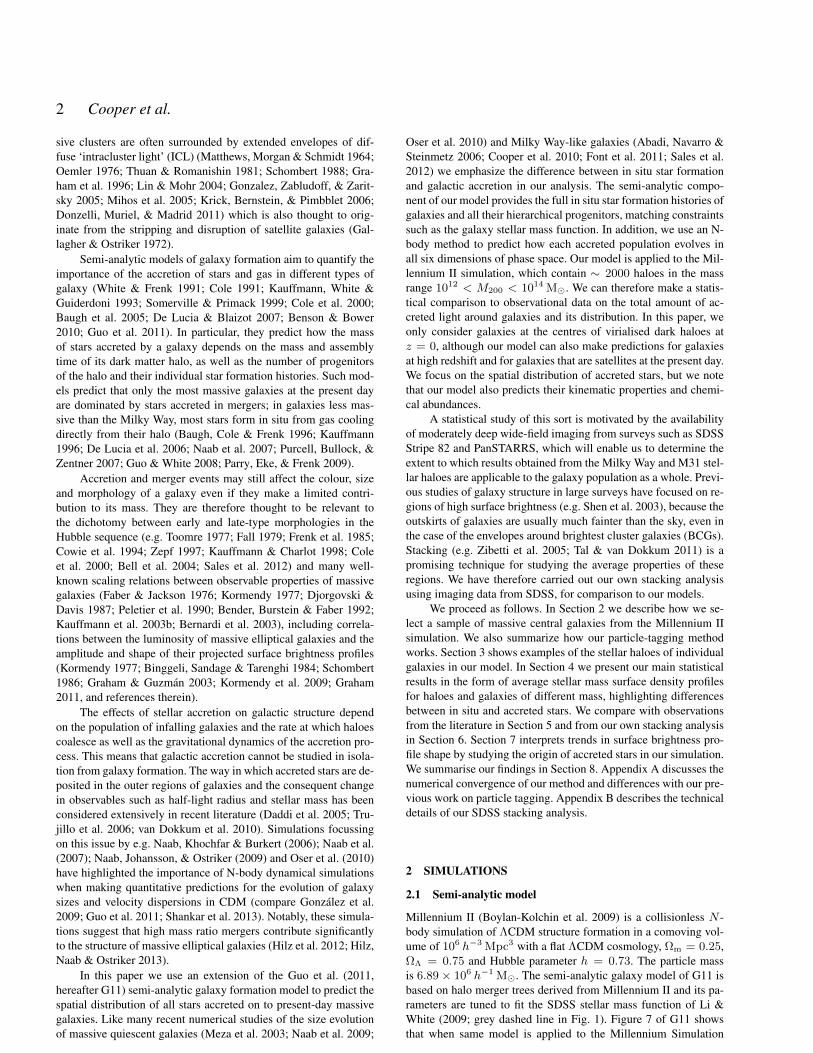
Figure 1. The solid black histogram shows the mass function of our primarysample of central galaxies from the G11 model. The solid grey histogram isthe mass function of all galaxies in the Millennium II simulation, includingsatellite galaxies and all galaxies associated with the merger tree of the mostmassive cluster which we have excluded from our analysis. The dashed greyline shows the Li & White (2009) SDSS mass function normalized to theMillennium II volume, derived as in Appendix A of Guo et al. (2010) andassuming the same Chabrier IMF as our model. Red and blue histogramssplit the mass function of our primary sample into two components basedon bulge-to-total mass ratio, as shown in the legend. Short black horizontallines (between the black and grey histograms) show the effect of includ-ing the G11 prediction of diffuse stellar halo mass for each galaxy in oursample. Considering only our sample galaxies, the lower two panels show(top) the fraction, fell, of galaxies in each mass bin with B/T > 0.9, and(bottom) the fraction of the combined bulge and disc stellar mass in eachbin that was formed in situ, split by B/T as in the main panel.
(Springel et al. 2005), which has a larger volume, it overpredictsthe number of galaxies with log10 M?/M & 11.5. G11 suggestthat this discrepancy is due to sample variance and ∼ 1 mag lumi-nosity uncertainties for the most luminous galaxies in SDSS (seee.g. Bernardi et al. 2013).
From the results of G11 we select 1872 central galaxies moremassive than M? = 5× 10¹⁰ M at z = 0. The stellar mass func-tion of these galaxies is shown by the black histogram in Fig. 1. Wedo not select all the galaxies in the simulation above our thresholdstellar mass (in particular, we exclude satellite galaxies and the cen-tral galaxy of the most massive cluster). The grey histogram showsthe mass function of all galaxies in the simulation to demonstratethat this selection does not bias our sample.
The G11 model uses a combination of two 1D axisymmetricdensity profiles to represent the distribution of stars inside galax-ies (an exponential disc and a Jaffe-model bulge1) and quantifiesgalaxy morphology using the ratio of bulge mass to total stellarmass, B/T . The red histogram in Fig. 1 shows the mass functionof galaxies with B/T > 0.9 (‘ellipticals’) and the blue histogramthe mass function of galaxies with B/T < 0.9. We plot the ratioof these mass functions in the middle panel. The fraction of ‘el-liptical’ galaxies increases from 50 to 100 per cent in the interval11.0 < log10 M?/M < 11.3. This is in good agreement with ob-servations (e.g. Conselice 2006, see figure 4 of G11) and a similartransition scale has been found in other semi-analytic models (DeLucia et al. 2011). These models also predict differences betweenearly and late-type K-band luminosity functions that are qualita-tively similar to those observed (Benson & Devereux 2010).
We define ‘in situ’ stars as those that are still gravitationallybound to the dark matter halo in which they formed. G11 predictthat more massive galaxies form less of their total stellar mass insitu. The lowest panel of Fig. 1 shows that the fraction of stars ineach mass bin formed in situ decreases from almost (but of coursenot exactly) 100 per cent at log10 M?/M = 10.7 to 50 per centat log10 M?/M = 11.1. The mass fraction of in situ stars in sys-tems with B/T > 0.9 is similar to that of other galaxies regardlessof stellar mass. This implies that in the G11 model, the relativecontribution of in situ star formation depends primarily on stellarmass and not morphology2. For the most massive galaxies plottedFig. 1, the fraction of stars formed in situ is ∼19 per cent. Thusthe model makes a clear prediction that accreted stellar populationswill dominate the structure of the most massive galaxies.
2.2 Particle tagging
We use a technique we call particle tagging to predict the stellarpopulation mix and spatial distribution of stars in galaxies, basedon the merger trees and star formation histories of the G11 model.This technique uses additional information from the underlying N-body simulation in order to predict more observables than standardsemi-analytic models, without running a new simulation. Otherstudies using particle tagging techniques include Bullock, Kravtsov& Weinberg (2001), Napolitano et al. (2003), Bullock & Johnston(2005), Penarrubia, Navarro & McConnachie (2008) and Laporteet al. (2013), although these were not coupled to the predictions ofsemi-analytic models. We give a brief summary of our method be-low; for more detail see Cooper et al. (2010, hereafter C10). A dis-cussion of minor differences between our implementation and thatof C10 and a test of convergence with their results can be found inAppendix A.
The particle tagging technique associates (‘tags’) sets of darkmatter particles in an N-body simulation (here Millennium II) with
1 G11 also track the total mass in a diffuse stellar halo component butdo not specify its density profile. The mass in this component is only asignificant fraction of the total galaxy stellar mass above log10 M?/M ∼11.2. Horizontal bars in Fig. 1 show how including the G11 stellar halocomponent in the central galaxy stellar mass affects the stellar mass functionof our sample at z = 0.2 Since galaxies with B/T > 0.9 were formed by low mass ratio merg-ers, one might expect their in situ fractions to be lower than those of galax-ies with the same mass having B/T < 0.9. However, in the G11 model,merger-induced starbursts and disc instabilities can increase the in situ masswhile also increasing B/T .
c© 2013 RAS, MNRAS 000, 1–21

4 Cooper et al.
stellar populations of a single metallicity and age. The tagged par-ticles can be used to track the evolution of their associated popula-tion in phase space, from the time when the stars form to the presentday (z = 0). Our definition of a stellar population comprises all thestars formed in a single galaxy between two consecutive snapshotsof the G11 model. An isolated galaxy that forms stars at a constantrate for a Hubble time will produce a number of these populationsequal to the number of simulation snapshots. All model galaxies atz = 0 are a superposition of many such populations, because theyaccrete populations formed in their hierarchical progenitors as wellas forming their own stars in situ.
For every population, particles are selected according to a tag-ging criterion (described below). An equal fraction of the total massof the population is given to each particle thus selected. Every newpopulation tags a new set of particles, selected from the correspond-ing dark matter halo at the snapshot immediately after the popula-tion forms. This means that a DM particle can be tagged more thanonce, if it meets the tagging criterion for two or more populations(by construction, this can only happen at different snapshots). Insuch cases, each tag is tracked separately. A corollary is that eachtagged particle carries its own unique star formation and enrich-ment history, with the time resolution of the Millennium II snap-shots.
2.3 Tagging criterion and the fmb parameter
The particles we select for tagging are supposed to approximatethe phase space distribution of the stars immediately after theyform. Stars are the end result of dissipative collapse, so a basic re-quirement is that particles tagged with newly-formed stars shouldbe deeply embedded in the potential well of their dark halo whenwe tag them. We achieve this by ranking DM particles in the haloby their binding energy and selecting all those more bound than athreshold value, corresponding to a fixed fraction of the mass ofthe halo. Following C10, we call this free parameter of the methodthe ‘most-bound fraction’, fmb. A value of fmb = 0.01 means weselected the 1 per cent most-bound particles.
The choice of fmb is more-or-less arbitrary, but this freedomallows us to tune the scale length of the in situ components of ourgalaxies in a predictable way. This is because, in an NFW poten-tial (Navarro, Frenk & White 1996), the surface density profile ofdark matter more bound than a given energy is roughly exponential(at least for fmb < 10 per cent), with a scale radius that dependson the threshold energy. This result can be verified easily by inte-grating the cumulative energy distribution of an NFW halo up to agiven fraction of its virial mass, and constructing the correspondingdensity profile from the phase space distribution function. We havedone this using numerical approximations for the distribution func-tion and density of states given by Widrow (2000) for a sphericalNFW halo with an isotropic velocity distribution.
To illustrate this point, Fig. 2 shows the profile of in situ starsin two ‘Milky Way’ mass haloes from Millennium II (top and bot-tom panels), according to our full particle tagging model (dots) withfmb = 1% (blue) and fmb = 10% (red). Dotted lines show theprofile we obtain using the Widrow (2000) distribution function toselect the equivalent most-bound mass fraction at z = 1, by whichtime most of the stars in these galaxies have already formed (thecentral regions of these haloes are very stable thereafter, e.g. Wanget al. 2011). The dotted profiles are not exactly exponential becauseour procedure obviously imposes an energy threshold, which corre-sponds to a truncation radius. Solid lines show exponential profilesthat have the same scale radius as the dotted profiles – these roughly
0.5 1.0 1.5
6.0
6.5
7.0
7.5
8.0
8.5
9.0
9.5
log
10
Σ/M
kp
c−2
1% tagged10% taggedNFW (z = 1)
Exponential
0.5 1.0 1.5
log10R/kpc
6.0
6.5
7.0
7.5
8.0
8.5
9.0
9.5
log
10
Σ/M
kp
c−2
Figure 2. Dots show in situ surface density profiles in two Milky Way-likehaloes at z = 0 from G11, predicted by our particle tagging model withfmb = 1% (blue) and 10% (red). Upper and lower panels respectively cor-respond to galaxies with M200 = (12.1, 12.3), M? = (10.8, 10.9) andNFW concentration c = (7.2, 8.2). Dotted lines show density profiles forthe corresponding fractions of most bound DM particles at z = 1 (assumingan isotropic NFW distribution function with virial radius and concentrationgiven by the N-body halo of each galaxy), normalized to the same stellarmass. Solid lines show exponential profiles with the same amplitude andhalf mass radius as the dotted lines.
approximate the diffusion of tagged particles across the initial en-ergy threshold over time. Note that because we perform our taggingprocedure at every snapshot, each new population in our full modelwill have a different amount of time to diffuse away from its initialconfiguration.
We stress that our model for the structure of merger remnantsis not purely collisionless, because the G11 model explicitly in-cludes enhanced dissipative star formation (in the bulge compo-nent) during mergers. This is important because hydrodynamicalsimulations of galaxy mergers have shown that nuclear starburstsincrease the central phase space density of merger remnants (Hern-quist, Spergel & Heyl 1993; Robertson et al. 2006; Hopkins et al.2008). We include stars formed in these bursts in our tagging in thesame way as those formed in the ‘quiescent’ mode.
2.4 Constraints on fmb from the galaxy mass–size relation
From the above we conclude that our analytic approximation canreproduce the z = 0 density profiles of particles that we tag torepresent in situ stars with reasonable accuracy. This provides anintuitive understanding of why the parameter fmb sets the sizes ofgalaxies dominated by in situ star formation, and how those sizesvary with the scale of the dark matter potential. Based on this,
c© 2013 RAS, MNRAS 000, 1–21

Accretion and galaxy structure in CDM 5
10.0 10.5 11.0 11.5 12.0
log10 M?/M
0.5
1.0
1.5
2.0
log
10R
50/k
pc
fmb = 10%fmb = 5%fmb = 1%
Approx. 10%Approx. 5%Approx. 1%
Guo et al.Shen et al.van Dokkum ‘09
Figure 3. Points plot stellar mass M? against projected half-mass radiusR50 for all galaxies in our full particle tagging models; colours correspondto different values of fmb. Dotted lines of the same colours show our an-alytic approximation for the sizes of all central galaxies in Millennium II,using their in situ stellar mass and z = 1 halo properties. The dashed greyline and shaded region plot the late-type galaxy relation of Shen et al. (2003)and its 1σ range. The dot-dashed grey line shows the early-type galaxy re-lation of Guo et al. (2009) corrected from a Kroupa to a Chabrier IMF using∆ log10M?/M = −0.04. The green triangle corresponds to a stack ofdeep images of 14 nearby ellipticals (van Dokkum et al. 2010).
we can determine a range of suitable fmb values empirically, bycomparing the predicted relation between stellar mass (M?) andprojected half-mass radius (R50) to observations of galaxies dom-inated by in situ star formation, i.e. those with log10 M? . 10.8;e.g. Guo & White 2008). By using only in situ stars to constrainfmb, the distribution of accreted stars remains a valid prediction ofour model. With a similar approach, C10 found that fmb = 1%gave reasonable agreement between their simulations and the M?–R50 relation of dwarf satellite galaxies in the Local Group. We re-examine the choice of fmb because C10 considered only galaxiesthat were predominantly satellites, with very different stellar anddark matter mass scales to those in our simulation.
In Fig. 3 we show the median M?–R50 relation for all galax-ies in our full particle tagging model at z = 0 (red, green and bluepoints, corresponding to fmb = 10%, 5% and 1% respectively).Each galaxy in the model contributes three values ofR50 from threeorthogonal projections to its M? bin. Model galaxies have a con-siderable scatter in R50 at fixed stellar mass (the 16–84 percentilerange for fmb = 1 per cent is shown by the error bars on the bluepoints; other values of fmb have very similar scatter). Note that oursample contains only 13 galaxies with M? > 1011.5M.
At M? . 1011M, where galaxies in our model are dom-inated by in situ stars, we can use our analytic approximation toextrapolate our results below the limit of M? > 5 × 10¹⁰M weimposed when selecting galaxy merger trees for tagging. We takeall central galaxies at z = 0 in the G11 Millennium II cataloguewith 108 6 M? < 1011.1M and use the virial radius (r200) and
concentration3 c of their dark matter haloes at z = 1 to predictR50
at z = 0. These predictions are shown as dotted lines in Fig. 3.They agree roughly with the results of the full tagging model inthe range where they overlap, although we find that R50 is under-estimated by ∼ 33% for fmb = 1%. This is not surprising as thefmb = 1% results are most sensitive to the simple representationof the central dark matter potential.
This extrapolation confirms that our tagging model producesa curved log10 M?–log10 R50 relation similar to the observed re-lation of Shen et al. (2003) for late-type galaxies (grey dashed linewith 1σ scatter). At lower M? the model with fmb = 1% under-predicts the observed relation. Our approximation predicts that amodel with fmb ≈ 3% would be closer to the data; fmb = 5%is also plausible, as the Shen et al. (2003) relation may underpre-dict the sizes of edge-on galaxies by ∼ 0.15 dex (e.g. Dutton et al.2007). On the other hand, the relation from our model also includesearly-type galaxies, which are known to be significantly more com-pact at than late-types at M? . 1011M (Shen et al. 2003). Kauff-mann et al. (2003a) do not separate galaxies by morphology andfind R50 = 2.38 kpc (h = 0.73) for 10.0 < log10 M? < 10.5which supports 1% . fmb . 3%.
Having determined a plausible range of fmb with reference toin situ stars, we can now examine the predictions of these modelsfor more massive galaxies that are dominated by accreted stars. InFig. 3, the mass–size relation clearly steepens at M? > 1011M(e.g. Shen et al. 2003; Hyde & Bernardi 2009). In this regime thefmb = 1% model follows approximately the relation for early-type galaxies found by Guo et al. (2009; grey dot-dashed line4).This relation agrees with the results of van Dokkum et al. (2010)(green triangle), who stacked Sersic fits to individual deep imagesof 14 galaxies with log10〈M?〉/M = 11.45 from a mass-selectedand approximately volume-limited sample of early types (Tal et al.2009).
A value of fmb = 5%, which gives a reasonable scale for insitu stars in lower-mass galaxies, overpredicts R50 from Guo et al.(2009) by ∼ 0.15 dex at M? > 1011 M. A value of fmb = 10%overpredicts R50 by . 0.3 dex, indicating that our predictions forR50 in this mass range are less sensitive to fmb than they are for in-situ dominated galaxies, where R50 changes by∼ 0.5 dex over thesame range in fmb. As we will show in the following section, thissensitivity is still mostly driven by the strong effect of fmb on thescale of in situ stars even in very massive galaxies. The effects onthe accreted component are even weaker, the most notable being anincrease in R50 with fmb because more extended satellite galaxiesare more easily stripped.
The apparent excess in R50 at M? > 1011.5 M even foran fmb ∼ 1% model may arise in part because masses and sizesderived from SDSS photometric measurements miss a substantialfraction of light in the outer regions of massive galaxies with highSersic index (Graham et al. 2005; Bernardi et al. 2007; Lauer et al.2007; Blanton et al. 2011; Bernardi et al. 2012; Meert et al. 2012;Mosleh, Williams & Franx 2013).
Subject to this uncertainty, we conclude that the median half-mass radii of accretion-dominated galaxies in our models are con-sistent with observations for 1% < fmb . 3%. We prefer not to
3 We determine c as c = 2.16 r200/rmax where rmax is the radius ofmaximum circular velocity (e.g Cole & Lacey 1996).4 We note that the observations plotted in figure 8 of Guo et al. (2009)for M? > 1011.5M lie systematically above the linear relation we plot,which suggests that the relation may curve upwards at higher M? (e.g.Bernardi et al. 2011).
c© 2013 RAS, MNRAS 000, 1–21
6 Cooper et al.
fine-tune a ‘best’ choice of fmb. Effects including the treatment ofin situ star formation in G11, the cosmology of Millennium II andthe accuracy of observed M? and R50 values (e.g. Bernardi et al.2013, Mitchell et al. 2013 and references therein) may determinehow well our tagging model matches the observations, because 1%changes in fmb correspond to 0.1 dex differences in R50 and M?.Therefore, in order to bracket the plausible range of fmb and toshow how it affects our conclusions, we will use fiducial values offmb = 1%, 5% and 10% for the remainder of the paper.
2.5 Limitations of the method
The most important limitation of particle tagging is that it neglectsthe gravitational effects of concentrating baryons in the cores ofdark matter haloes. C10 considered only the highly dark matterdominated dwarf satellites of Milky Way-like galaxies. Here, how-ever, we tag dark matter particles in galaxies of Milky Way massand larger, where the gravitational potential within R50 could bemodified significantly by baryons (e.g. Koopmans et al. 2009). Ifthis effect was included in our model, our central galaxies may bemore concentrated and the cores of our satellites more robust totidal stripping. These effects may explain the ∼ 0.1 dex overes-timate of R50 at M? & 1011M in Fig. 3 (for an fmb ∼ 3%model). Another limitation is that a tagging method based on bind-ing energy alone cannot model rotationally supported discs, thuseven ‘late type’ galaxies are represented by dispersion-supportedspheroidal systems5. Finally, we neglect the possibility that in situstars form on very loosely bound orbits far away from galaxies, forexample from cold gas clumps stripped from satellites or ejected ingalactic fountains.
The first two limitations mean that, in the N-body part ofour model, we cannot include the formation and secular evolutionof discs, adiabatic contraction or the destruction of cusps in darkhaloes by feedback (Navarro, Eke & Frenk 1996; Gnedin et al.2004; Dutton et al. 2007; Pontzen & Governato 2012). As dis-cussed in the previous section, the stellar mass surface density pro-files of late-type galaxies in our model are exponential, and theirscale lengths can be roughly matched to observations by choosingfmb appropriately. Nevertheless, the energy and angular momen-tum distribution of stars in disc galaxies may affect the details oftheir stripping and disruption (e.g. Chang, Maccio & Kang 2013).Satellites in our model do not suffer tidal shocking or enhanced(stellar) dynamical friction from the stars of their central galaxy,which may artificially favour their survival. On the other hand, bothlimited numerical resolution and the absence of gravitational bind-ing energy from stars will artificially enhance the rate of satellitedisruption.
We proceed with these approximations nevertheless as a firststep towards modelling the spatial distribution and other propertiesof the diffuse stellar component of galaxies, in the context of a real-istic model of galaxy formation. Our model for in situ stars is onlyintended to serve as a means of creating initial conditions for ac-cretion events with roughly the right scale and concentration, andas a means of quantifying the relative contribution of accreted starsat different radii.
5 We can still separate galaxies by morphology using the G11 B/T ratio,which is independent of our tagging approach.
3 RESULTS FOR INDIVIDUAL GALAXIES
Before we present surface density profiles of galaxies averaged inbins of stellar mass and halo mass, we illustrate the basic output ofour model with 12 examples of individual galaxies from our sampleof 1872.
3.1 Images
Fig. 4 shows 2D images of projected stellar mass surface densityfor twelve of our simulated galaxies (fmb = 1%). The stellar massassociated with each tagged dark matter particle has been smoothedover a cubic spline kernel with a scale radius enclosing its 64 near-est dark matter neighbours (e.g. Springel 2005). Satellite galaxies(tagged particles in self-bound subhalos) have been removed, sothe remaining ‘lumps’ on small scales are due to shot noise in theparticle distribution.
The galaxies labelled A–D in Fig. 4 represent the lowest halomasses in our sample, with M200 ≈ 1012 M and M? ≈ 6 ×10¹⁰ M (similar to the Milky Way, e.g. Li & White 2008; McMil-lan 2011). Those labelled E–H are more massive isolated haloeswith M200 ≈ 1012.5 M and slightly larger M?, while those la-belled I–L represent the central galaxies of groups and poor clus-ters, with 1013.25 < M200 < 1014 M andM? up to 2×10¹¹ M.The G11 model predicts that B, C, D, G and K have B/T < 0.2,and J hasB/T ∼ 0.4. The other examples fall into our ‘early type’category defined by B/T > 0.9.
The colour scale for surface mass density illustrates the ob-servability of different features. Regions with red colours arereadily observable in the Sloan Digital Sky Survey; µr <25 mag arcsec−2) whereas those with yellow/green colours re-quire deep imaging (25 < µV < 28 mag arcsec−2, e.g. Martınez-Delgado et al. 2010b). Careful reduction of SDSS images (in partic-ular those in Stripe 82) can achieve 26 < µr < 28 mag arcsec−2
(e.g. Kaviraj 2010; Bakos & Trujillo 2012) and the next generationof imaging surveys will reach these depths routinely (LSST ScienceCollaborations et al. 2009). Regions with µr ∼ 31 mag arcsec−2
(blue colours) are currently only accessible with resolved star-counts in nearby galaxies (e.g. Bland-Hawthorn et al. 2005; Barkeret al. 2009; Bailin et al. 2011; Radburn-Smith et al. 2011) andthrough stacking enembles of similar galaxies (Zibetti et al. 2004,2005; Tal & van Dokkum 2011).
3.2 Individual density profiles
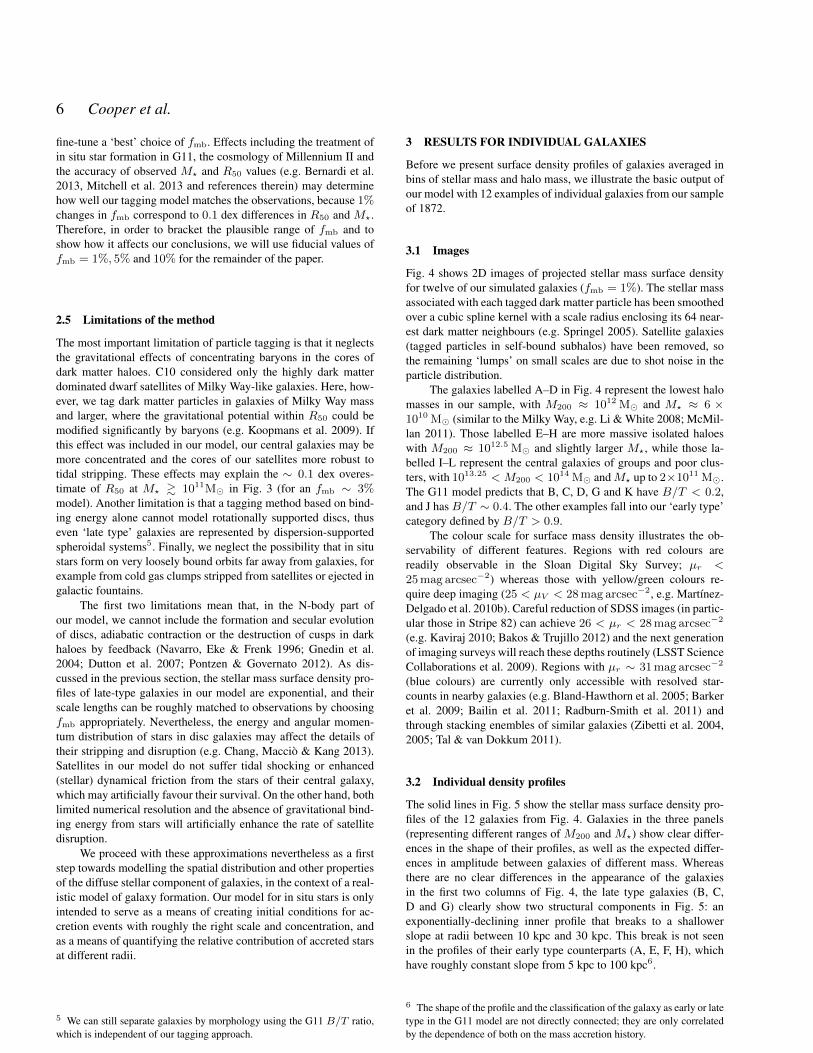
The solid lines in Fig. 5 show the stellar mass surface density pro-files of the 12 galaxies from Fig. 4. Galaxies in the three panels(representing different ranges of M200 and M?) show clear differ-ences in the shape of their profiles, as well as the expected differ-ences in amplitude between galaxies of different mass. Whereasthere are no clear differences in the appearance of the galaxiesin the first two columns of Fig. 4, the late type galaxies (B, C,D and G) clearly show two structural components in Fig. 5: anexponentially-declining inner profile that breaks to a shallowerslope at radii between 10 kpc and 30 kpc. This break is not seenin the profiles of their early type counterparts (A, E, F, H), whichhave roughly constant slope from 5 kpc to 100 kpc6.
6 The shape of the profile and the classification of the galaxy as early or latetype in the G11 model are not directly connected; they are only correlatedby the dependence of both on the mass accretion history.
c© 2013 RAS, MNRAS 000, 1–21

Accretion and galaxy structure in CDM 7
A E I
B F J
C G K
200
100 0
100
200
kpc
D
200
100 0
100
200
kpc
H
200
100 0
100
200
kpc
L
3 4 5 6 7 8 9
log10 Σ?/M kpc−2
Figure 4. Projected stellar mass surface density in regions 500 × 500 kpc around 12 simulated galaxies. In each of the three columns, M200 and M?
are approximately constant, representing (from left to right) Milky Way-like galaxies, massive isolated galaxies, and group/cluster central galaxies. Theseexamples are referred to in the text by their labels A–L (blue where G11 B/T 6 0.9 and red where G11 B/T > 0.9). More details are shown in Fig. 5.Satellite galaxies are included in the model but are not shown for clarity. Σ = 7.0 (6.0, 5.0) M kpc−2 corresponds to a V band surface brightness of∼ 24.8 (27.3, 29.8) mag arcsec−2 assuming a mass-to-light ratio of 2.5 (see Fig. 5 for this approximate conversion scale). We have imposed a minimumsurface density of Σ = 3.0 M kpc−2 (∼ 35 mag arcsec−2) with Poisson noise to create the ‘background’ in these images. The lumpy appearance of thediffuse light is due to shot noise in the adaptively smoothed particle distribution.
c© 2013 RAS, MNRAS 000, 1–21

8 Cooper et al.
0.5 1.0 1.5 2.0 2.5
log10 R/kpc
3
4
5
6
7
8
9
log
10
Σ?/M
kp
c−2
A
B C DB/T ≤ 0.9
B/T > 0.9
0.5 1.0 1.5 2.0 2.5
log10 R/kpc
E F
G
H
B/T ≤ 0.9
B/T > 0.9
0.5 1.0 1.5 2.0 2.5
log10 R/kpc
I J K LB/T > 0.9
Figure 5. Solid lines show stellar mass surface density profiles for the galaxies shown in Fig. 4 (identified by letters A–L). Line colours correspond to G11B/T values as shown in the legend. Short black solid lines show slopes of -1.5, -2.0 and -2.5 for reference. The thick dashed black lines are the average totaldensity profiles for galaxies with the same halo mass as the examples, discussed in section 4. Dotted lines show the density of in situ stars only. A verticaldashed line marks the effective force softening scale.
The inner regions of these galaxies (< 10 kpc) are very similarto each other, even for different halo masses and at radii well out-side the effective force softening scale (shown by a vertical dashedline7). Coloured dotted lines in Fig. 5 show that in situ stars dom-inate these regions. Although the in situ component grows in sizewith halo mass, the mass of the accreted component that dominatesat larger radii increases even more rapidly. The surface density at∼ 100 kpc, which is almost entirely contributed by accreted starsin all our examples, increases by three orders of magnitude acrossthe panels.
Therefore, the physical origin of the break mentioned aboveis the transition from regions dominated by in situ stars to regionsdominated by accreted stars. This implies a clear connection be-tween the typical shapes of galaxy surface brightness profiles andthe relative fraction and distribution of accreted stars. The rest ofthis paper will focus on the importance of accreted stars in chang-ing the surface brightness profile shape as a function of halo mass,using all the galaxies in our sample.
4 AVERAGE SURFACE DENSITY PROFILES
Figure 6 shows the main results of this paper: the median profiles ofstellar mass surface density in circular annuli, for all the galaxies inour sample in logarithmic bins of 0.5 dex in dark halo virial mass(M200). In this figure we only show results for fmb = 1%, forclarity. We do not take projections along the principal axes of thegalaxies or align them in any other way, so the relative orientationsof the profiles we combine are random.
The profiles of total stellar mass surface density (blue lines)show a tight correlation in shape and amplitude with M200, with80 per cent of profiles differing by no more than 0.5 dex from the
7 Forces are exactly Newtonian for particle separations greater than 2.8ε =3.84 kpc with h = 0.73 and Plummer-equivalent softening length ε =
1h−1kpc fixed in comoving coordinates.
median at all radii in all halo mass bins (a large part of this scatter,shown by the light blue band, is due to the 0.5 dex width of our halomass bins). The separate contributions of accreted and in situ starsexplain the shape of the profiles and their variation with halo mass.In situ stars (red dotted lines) dominate the high surface brightnessregions in haloes up to∼ 1013M, while accreted stars (red dashedlines) dominate at radii greater than 30 kpc and in more massivehaloes. Regardless of M200, neither the two subcomponents northe combined stellar profile follow the NFW distribution of the darkmatter (purple lines).
Fig. 7 shows examples of Sersic (1968) functions (c.f. Gra-ham & Driver 2005) fit to our median in situ and accreted surfacedensity profiles. We find that both components are well describedby such fits across the entire M200 range of our sample and for1% < fmb < 10%. By construction, the total profile is best fit bythe sum of these two functions – a single Sersic function is onlyan appropriate model for the total surface density in haloes moremassive than M200 ∼ 1013 M, where the accreted componentdominates at all radii. Even in these haloes, the in situ componentmakes a significant contribution, and a slight change in shape dueto the transition between accreted and in situ stars is still apparentat R < 10 kpc.
Fig. 8 repeats Fig. 6 but bins galaxies by stellar mass, M?,rather than M200. The strong trends with M200 are less clear in thecase of M?, except in the most massive stellar mass bin. The causeof this is the considerable scatter in the M?–M200 relation (e.g.Guo et al. 2010). Below their half-mass radii, the median surfacebrightness profiles are hard to distinguish across a range of 10.7 <log10 M? < 11.2. A stronger variation of the profiles withM? canbe seen at larger radii, ∼ 30–100 kpc.
Fig. 8 also illustrates the effects of varying fmb, over the range1–10 per cent. Relative to the 1 per cent profiles (blue lines), the 10per cent profiles (red lines) are ∼ 30 per cent more extended andhave lower central surface density (see section 2.3). This rescalingof the in situ component is the main effect of changing fmb. Themost significant impact of higher fmb on the accreted component
c© 2013 RAS, MNRAS 000, 1–21

Accretion and galaxy structure in CDM 9
AccretedIn SituTotalDM
3
4
5
6
7
8
9
log
10
Σ?/M
kp
c−2
[11.5, 12.0]260
[12.0, 12.5]852
log10 R/kpc
[12.5, 13.0]506
0.5 1.0 1.5 2.0 2.5
log10 R/kpc
3
4
5
6
7
8
9
log
10
Σ?/M
kp
c−2
[13.0, 13.5]201
0.5 1.0 1.5 2.0 2.5
log10 R/kpc
[13.5, 14.0]50
34.8
32.3
29.8
27.3
24.8
22.3
19.8
µV
[mag
arcs
ec−
2]
Figure 6. Median profiles of circularly averaged stellar mass surface density, Σ?, for accreted stars (red dashed lines) and in situ stars (red dotted lines), inlogarithmic bins of dark halo virial mass (range of log10 M200/M and number of galaxies per bin are shown in the top right of each panel). A blue solidline shows the median profile for fmb = 1% combining accreted and in situ components; a light blue region indicates the 10–90 per cent scatter of the medianprofile. Arrows indicate half-mass radii of the median profiles (from left to right, in situ stars, all stars and accreted stars). Grey lines (dotted, dashed and solid)reproduce the corresponding red and blue lines from the 12.5 < log10 M200/M < 13.0 panel. A purple line and pink shading show the median darkmatter density profile and its 10–90 per cent range. A black horizontal bar shows the range of R200 in each mass bin, and a vertical dotted black line indicatesthe effective softening scale 2.8ε. The scale on the right of the lower central panel gives an approximate conversion from Σ? to surface brightness (in Vegamagnitudes per square arcsecond) for the Johnson-Cousins V band, assuming ΥV = M?/LV = 2.5.
0.5 1.0 1.5 2.0 2.5log10 R/kpc
3
4
5
6
7
8
9
log
10
Σ?/M
kp
c−2
[11.7, 11.9]
TotalAccretedIn SituAccreted fitIn Situ fit
0.5 1.0 1.5 2.0 2.5log10 R/kpc
[13.3, 14.2]
0.5 1.0 1.5 2.0 2.5log10 R/kpc
fmb = 10%
[11.7, 11.9]
Figure 7. Average stellar mass surface density profiles as in Fig. 6 for our 100 least massive haloes (left) and 100 most massive haloes (centre) with fmb = 1%,and our 100 least massive haloes with fmb = 10% (right). Legends indicate the corresponding range of log10M200/M. Grey lines show our simulationresults, red lines show Sersic model fits to the accreted (dashed) and in situ (dotted) components, which overplot the simulation data almost everywhere.From left to right, the Sersic parameters of the accreted star fits are [log10 Σ50/M kpc−2, R50/kpc, n] = [5.31, 10.4, 2.56], [7.21, 24.6, 3.64] and[5.37, 10.1, 2.96]. The in situ star fits are [9.00, 2.3, 0.79], [7.96, 5.5, 1.90] and [8.21, 5.4, 0.88].
c© 2013 RAS, MNRAS 000, 1–21

10 Cooper et al.
fmb = 1%
fmb = 5%
fmb = 10%
0.5 1.0 1.5 2.0 2.5
3
4
5
6
7
8
9
log
10
Σ?/M
kp
c−2
[10.7, 10.8]
0.5 1.0 1.5 2.0 2.5
[10.8, 10.9]
0.5 1.0 1.5 2.0 2.5
log10 R/kpc
[10.9, 11.0]
0.5 1.0 1.5 2.0 2.5
log10 R/kpc
3
4
5
6
7
8
9
log
10
Σ?/M
kp
c−2
[11.0, 11.2]
0.5 1.0 1.5 2.0 2.5
log10 R/kpc
[11.2, 11.4]
35.6
33.1
30.6
28.1
25.6
23.1
20.6
µV
[mag
arcs
ec−
2]
Figure 8. Surface density profiles in bins of total stellar mass, M?. Note that the final two bins are wider than the first three. Different line colours correspondto different choices of fmb, which mainly affect the in situ component; the effect on the accreted component is negligible except in the most massive galaxies(see Appendix A). The light blue region indicates the 10–90 per cent scatter of the median profile for the fmb = 1% case. Arrows show half mass radii andblack lines show the range of R200 in each bin.
0.5 1.0 1.5 2.0 2.5
log10 R/kpc
3
4
5
6
7
8
9
log
10
Σ?/M
kp
c−2
[12.0, 12.5]
B/T < 0.9, fmb = 1%
B/T > 0.9, fmb = 1%
B/T < 0.9, fmb = 10%
B/T > 0.9, fmb = 10%
Figure 9. Average stellar mass surface density profiles for fmb = 1%(solid lines) and 10% (dot-dashed lines) in the halo mass bin 12.0 <log10 M200 < 12.5, subdivided into galaxies with B/T < 0.9 (N =
704, blue lines) and with B/T > 0.9 (N = 132, red lines).
is in the very outer regions of the most massive galaxies, whereslightly more stars are found on weakly bound orbits (perhaps asthe result of earlier stripping). Again we conclude that our densityprofile results do not depend strongly on the value of fmb, at leastwithin a range consistent with the observed mass–size relation.
In Section 3.2 we discussed an interesting relationship be-tween the bulge-to-total stellar mass ratio B/T (predicted by theG11 model) and the shape of the surface density profiles we obtainwith particle tagging. In Figure 9 we show that this result holdson average, plotting the fmb = 1% profile in the bin 12.0 <log10 M200 < 12.5 (top-centre panel of Figure 6) separately forgalaxies withB/T > 0.9 andB/T < 0.9. The latter profile showsa clear inflection at ∼ 10 kpc, which corresponds to the radius atwhich accreted stars begin to dominate over in situ stars. The ab-sence of this break in galaxies with B/T > 0.9 reflects a greatercontribution of accreted stars to the inner parts of galaxies and theaction of violent relaxation in major mergers (the primary cause ofhigh B/T in the G11 model), which makes the profiles of the twocomponents more similar. Figure 9 shows that profiles of galaxieswith low and high G11 B/T can still be distinguished if we usea much higher value of fmb, although the accreted-in situ breakis then much less clear. We caution that the value of B/T is cal-culated in a simple manner and is influenced by other processes inthe G11 model (such as disc instabilities and starbursts). In individ-ual cases it does not correspond perfectly to a separation between
c© 2013 RAS, MNRAS 000, 1–21

Accretion and galaxy structure in CDM 11
0.5 1.0 1.5 2.0 2.5
log10 R/kpc
3
4
5
6
7
8
9
log
10
Σ?/M
kp
c−2
[12.0, 12.5]
0.5 1.0 1.5 2.0 2.5
log10 R/kpc
[13.0, 13.5]
0.5 1.0 1.5 2.0 2.5
log10 R/kpc
[13.5, 14.0]
AccretedIn SituTotal
34.8
32.3
29.8
27.3
24.8
22.3
19.8
µV
[mag
arc
sec−
2]
Figure 10. As Fig. 6. The surface density profiles in each bin of halo mass for fmb = 1% only are shown in grey, and compared with observational data (andother simulations) given in Table 1. The assignment of galaxies to halo mass bins for the observational data is approximate.
Table 1. Surface mass density profile data shown in Fig. 10. From left to right, columns give: the range of halo mass to which the data (or simulations) arecompared (log10M200/M, corresponding to panels in Fig. 10); the target galaxy or galaxies; the source of the data; the symbol or line style used in Fig. 10;the photometric bandpass of the data; the stellar mass-to-light ratio we have assumed (where the original authors do not present their results in terms of stellarmass surface density); and comments on the data (LTG: late type galaxy).
Halo mass Galaxies Reference Marker Band M?/L Comments[12.0, 12.5] M81 Barker et al. (2009) Orange squares V 2.5 LTG
M31 Gilbert et al. (2009) Orange circles V 2.5 LTGM31 Courteau et al. (2011) Cyan line I 1.5 LTG, composite profile from various sourcesNGC 1087 Bakos & Trujillo (2012) Blue squares ugriz – LTG, Σ? from authorsNGC 7716 Bakos & Trujillo (2012) Red squares ugriz – LTG, Σ? from authorsNGC 2403 Barker et al. (2012) Magenta squares V 2.5 LTGGIMIC Font et al. (2011) Green dashes V 2.5 Stack of ∼ 400 simulated LTGs
[13.0, 13.5] LRG stack Tal & van Dokkum (2011) Magenta line r 2.0 Stack, N = 42579, 〈z〉 ∼ 0.34
OBEY sample van Dokkum et al. (2010) Black line r 2.0 Sersic profile fit to stacked Tal et al. (2009) data[13.5, 14.0] NGC 6173 Seigar, Graham & Jerjen (2007) Blue line R 2.0 BCG, Abell 2197
UGC 9799 Seigar et al. (2007) Dark green line R 2.0 BCG, Abell 2052NGC 3551 Seigar et al. (2007) Orange line R 2.0 BCG, Abell 1177GIN 478 Seigar et al. (2007) Purple line R 2.0 BCG, Abell 2148NGC 4874 Seigar et al. (2007) Light green line R 2.0 BCG, Coma clusterM87 Kormendy et al. (2009) Red line V 2.5 BCG, Virgo clusterBCG stack Zibetti et al. (2005) Black squares i 1.5 Stack of SDSS MaxBCG clusters, richness > 15
two-component and quasi-power-law profiles in our tagged particlemodel.
5 COMPARISON WITH LITERATURE DATA
In Fig. 10 we compare the surface density profiles shown in Fig. 6(binned by M200) with deep observational data from a variety ofsources (summarised in Table 1). We do this to illustrate the va-riety of different surface density profiles that have been reportedin the literature, rather than to match any particular observation.In most cases our choice of an M200 bin for each observationaldataset is based on the observed stellar mass (e.g. Guo et al. 2010;Moster et al. 2010) and is thus very rough. Where authors havepresented their data in terms of stellar mass surface density, weuse their values directly. Otherwise, since we find that all but ourlowest-mass simulated galaxies have very shallowM?/L gradientsat R > 10 kpc, we assume a galaxy-wide M?/L appropriate toeach bandpass (listed in Table 1, based on the ages and metallic-
ities of our simulated stars and the models of Bruzual & Charlot2003 with a Chabrier 2003 IMF). There are many systematic dif-ferences between these datasets (including photometric bandpass,surface brightness dimming corrections,K-corrections, cosmologyand in some cases, the choice of IMF). We have attempted to cor-rect for these differences where necessary. Such corrections amountto less than 0.1 dex in most cases.
In the halo mass range 12.0 < log10 M200/M < 12.5 weshow data from galaxies comparable to the Milky Way and M31(M200 ∼ 1012M, e.g. Watkins et al. 2010). The composite I bandprofile of M31 from Courteau et al. (2011, cyan line) agrees wellwith the average profile of accreted stars in our model (dashed greyline) forR . 50 kpc. AtR > 100 kpc Courteau et al. find a highersurface density than our model; this portion of their profile is basedon the individual fields of Gilbert et al. (2009; orange dots), someof which may contain substructure. The galaxies M81 (Barker et al.2009), NGC 2403 (M? ∼ 1010M; Barker et al. 2012), NGC 1087(M? ∼ 1010.4M) and NGC 7716 (M? ∼ 1010.5M; Bakos &
c© 2013 RAS, MNRAS 000, 1–21

12 Cooper et al.
0.5 1.0 1.5 2.0 2.5
3
4
5
6
7
8
9
log
10
Σ?/M
kp
c−2
NDR9 = 1212
[10.7, 10.8]
0.5 1.0 1.5 2.0 2.5
NDR9 = 707
[10.8, 10.9]
0.5 1.0 1.5 2.0 2.5
log10 R/kpc
NDR9 = 606
[10.9, 11.0]
fmb = 1%
fmb = 5%
fmb = 10%
DR9 (con. M/L)DR9 (var. M/L)
0.5 1.0 1.5 2.0 2.5
log10 R/kpc
3
4
5
6
7
8
9
log
10
Σ?/M
kp
c−2
NDR9 = 1010
[11.0, 11.4]
0.5 1.0 1.5 2.0 2.5
log10 R/kpc
SDSS data only
log10〈M?〉 = 10.85
log10〈M?〉 = 10.75
log10〈M?〉 = 11.20
log10〈M?〉 = 10.95
0.5 1.0 1.5 2.0 2.5
log10 R/kpc
[10.7, 10.8]Mpet
M?
Figure 11. Symbols show the average stellar mass surface density profiles obtained from stacks of SDSS DR9 r band images as described in the text andappendix B, assuming a constant stellar mass to light ratio (open circles) and, where significantly different, a colour-dependent M/L (open triangles). Errorbars approximate ‘1σ’ of the distribution of uncertainty in the average profiles combining Poisson errors in flux measurement with the sample variance of thestack (NDR9 given in each panel shows the number of galaxies in the bin). Coloured lines (blue, green and red) show stacks made from our simulations asin Fig. 8 but here binning galaxies by their Petrosian mass Mpet (see text). The lower central panel shows the four SDSS profiles only (colours indicate thecentral mass of each bin). The lower right panel reproduces the fmb = 1% profile from the [10.7, 10.8] panel (solid line) and compares it to the averageprofile of galaxies stacked in the same range of total stellar mass M? (dashed line) rather than Mpet.
Trujillo 2012) show similar profiles. All show hints of breaking toa shallower slope beyond 15–20 kpc, although these upturns occurclose to the limiting depth of the observations.
In the same panel we compare with the GIMIC SPH simula-tions (Crain et al. 2009), the only other large cosmological simula-tion of stellar haloes in thisM200 range (though see also Croft et al.2009), with a particle mass 7.7× larger than Millennium II andthe same force softening length. Font et al. (2011) stacked ∼ 400galaxies from GIMIC. They find circularly averaged density pro-files that are well described by a concentrated in situ componentand a diffuse accreted component. The transition between the twocomponents is less obvious in their profiles than in our fmb = 1%model, and the shallower outer slope seen in the GIMIC simula-tions is in better agreement with the M31 data of Gilbert et al.(2009) at ∼ 100 kpc.
In the range 13.0 < log10 M/M < 13.5 accreted starsdominate the overall surface density profile. We compare with thestacked surface brightness profile of ∼ 42000 SDSS LRGs (lu-minous red galaxies, thought to be mostly group/cluster centrals;M? ∼ 1011 M, M200 ∼ 1013.2 M) at 〈z〉 ∼ 0.34 from Tal &van Dokkum (2011). These data are a good match to the surfacedensity profiles of our simulated galaxies from 10–100 kpc. Below
10 kpc the simulated profile is steeper than the data, although thisregion is sensitive to our treatment of the in situ component. Thesimulation does not reproduce the upturn in the observed profileat ∼ 100 kpc, which Tal & van Dokkum (2011) attribute to limi-tations in their correction for residual light from unresolved com-panion galaxies. Our model supports this interpretation because itdoes not predict a separate physical component with a shallow den-sity profile that could explain the upturn. We also show the stackedprofiles of 14 nearby early type galaxies from the volume-limitedOBEY survey (Tal et al. 2009). This stack includes all ellipticals inthe survey with stellar mass log10 M?/M = 11.45 ± 0.15 (ap-pendix D of van Dokkum et al. 2010). These data match the Tal &van Dokkum (2011) stack at small radii and do not show an excessover our simulated profile at R & 100 kpc, possibly because vanDokkum et al. (2010) stack 2D fits to the OBEY galaxies ratherthan stacking the images directly.
Finally, the most massive haloes in our simulation have13.5 < log10 M200/M < 14.0. We compare these with indi-vidual BCG profiles from Kormendy et al. (2009, M87) and Seigaret al. (2007, Abell cluster cD galaxies; we plot their ‘double Sersic’fits). Our simulations match these profiles well from 10–100 kpc,although some of the observed galaxies could belong to haloes
c© 2013 RAS, MNRAS 000, 1–21

Accretion and galaxy structure in CDM 13
more massive than the median of our bin (e.g. log10 M200/M =15.1 for NGC 4874/Coma and 14.3 for UGC 9799/Abell 2052;Reiprich & Bohringer 2002). We also show the results of Zibettiet al. (2005) who stacked SDSS images for BCGs at 〈z〉 ∼ 0.25.This is deeper than any of the individual profiles and shows a clearexcess over our models beyond 100 kpc. Some of this disagreementmay be due to a mismatch in the averageM200 of the galaxies beingcompared, as mass–richness relations suggest that the typical halomass of the Zibetti et al. sample is M200 & 1014.2 M (e.g. Rozoet al. 2009). It may also indicate that effects neglected by our modelbecome important in this regime. For example, it may be that theangular momentum of disc galaxies affects the orbital energy dis-tribution of their tidal tails, or that ram-pressure stripping of coldgas leads to more rapid disruption of satellites; in both cases, morestripped stars would be deposited on weakly bound orbits with largeapocentres.
6 COMPARISON WITH STACKED SDSS DATA
It is more appropriate to compare the average galaxy surface den-sity profiles from our models with similar averages constructedfrom large galaxy samples (such as the stacking analyses of Tal& van Dokkum 2011 and Zibetti et al. 2005) than with individ-ual galaxies or small surveys as we did in the previous section. Wehave carried out our own simple stacking analysis of massive galax-ies observed by the Sloan Digital Sky Survey (SDSS) Data Release9 (DR9; Ahn et al. 2012) in bins of stellar mass (as given by theMPA-JHU Value-Added Catalogue8). Our method for constructingstacked images is described in appendix B.
The resulting density profiles are shown as open circles inFig. 11, split into four bins of stellar mass, each of which is obtainedfrom a stack of NDR9 galaxies as indicated. The panel labelled‘SDSS data only’ summarises these four profiles, showing a clearshift in amplitude from the least to the most massive bin, out tothe largest measured radius. Each panel assumes a constant r bandmass-to-light ratio (the average of the MPA-JHU M/Lr values inthe corresponding MPA-JHU mass bin, ranging from 2.3 to 2.8from the first to last bin; see appendix B) but this result holds evenif the same M/Lr is used for all panels, or if a colour-dependentM/Lr relation is used (Bell et al. 2003). However, the stacked ob-servational data do not show any significant change in profile shapeof the kind seen in previous figures (including observations of indi-vidual galaxies).
Each panel compares our SDSS stacks to the average pro-files of simulated galaxies9 binned by their Petrosian stellar mass,Mpet (blue, green and red lines for fmb = 1%, 5% and 10%,respectively). We use Mpet rather than the true stellar mass M?
in order to reproduce approximately the bias introduced by SDSSmodelMag magnitudes, from which the MPA-JHU masses are de-rived (see appendix B). Mpet is always an underestimate of M?,thus the galaxies included in each bin of Fig. 11 are different fromthose in the corresponding bin of Fig. 8. The result is a small sys-tematic increase in the amplitude of the average density profile, byup to ∼ 0.5 dex at large radii. This effect is most evident in the10.7 < log10 Mpet < 10.8 bin for fmb = 1%, where it obscures
8 http://www.mpa-garching.mpg.de/SDSS/DR79 The observed and simulated profiles in Fig. 11 should only be comparedat R & 5 kpc. At smaller radii, the point spread function, which we havenot deconvolved, dominates the observed profiles and numerical softeningaffects the simulated profiles.
the inflection seen in Fig. 8 (see lower right panel of Fig. 11). Theweakness of the overall trend in Fig. 11 compared to that in Fig. 6is mainly due to scatter between M? and M200 (see Fig. 8). Forexample, the bin 10.7 < log10 M? < 10.8 corresponds to a ∼ 1.5dex range in M200.
Even though the trends in the simulated data are quite weak,for fmb = 1% they are still clearly stronger than observed. Forfmb = 5%, on the other hand, the agreement with observation isquite good, and a slightly smaller value of fmb would agree evenbetter, consistent with our findings in Section 2.4.
7 ORIGIN AND STRUCTURE OF STELLAR HALOES
Having demonstrated that our particle-tagging model produces sur-face density distributions that agree reasonably well with observa-tions, we now use it to examine the origin of stellar haloes as wellas the relationships between the properties of central galaxies andthe structure of their diffuse light.
The left panel of Fig. 12 shows Macc, the total mass of ac-creted stars in each of our galaxies, as a function of virial mass,M200. The right panel shows Macc as a function of the total stel-lar mass of the system, M?. Macc increases much less steeply withM200 above a characteristic mass M200 ∼ 1012.5 M. This corre-sponds roughly to the transition mass predicted by the G11 model,above and below which the galaxy mass function is dominated byearly and late type galaxies respectively. We see in Fig. 12 thatelliptical (G11 B/T > 0.9) and late type galaxies have a cleanseparation at an accreted stellar mass of Macc ∼ 3 × 10¹⁰ M,which (as shown in the right panel of Fig. 12) corresponds to ∼ 30per cent of the total (accreted plus in situ) central galaxy stellarmass M? (for all M200). This simply reflects the fact that the ‘ma-jor merger’ criterion for the destruction of discs (hence formationof elliptical galaxies) in G11 is a progenitor mass ratio of 1:3 orlower.
Purcell et al. (2007) made similar predictions for Macc as afunction of M200 at z = 0 using prescriptions for halo assemblyhistories and subhalo orbital properties based on numerical simula-tions. As their results demonstrated, the relationship betweenMacc
and M200 seen in Fig. 12 is a natural outcome of the CDM progen-itor halo mass function and the relation between M?–M200, whichis thought to be roughly monotonic (e.g. White & Frenk 1991; Ben-son et al. 2000; van den Bosch, Yang & Mo 2003). To first order,this means thatMacc is set by the typical ratio ofM200 between thefew most massive accreted progenitors and the main halo (∼ 0.1–1%). However,M?–M200 relations derived from galaxy abundancematching (like those predicted by semi-analytic models) show aninflection corresponding to a peak in galaxy formation efficiencyat Mpeak ≈ M200 ∼ 1012 M (e.g. Eke et al. 2004; Conroy,Wechsler & Kravtsov 2006; Vale & Ostriker 2006; Guo et al. 2010;Moster et al. 2010). This creates two regimes in the scaling ofMacc
with M200.In haloes with M200 . Mpeak, in situ star formation effi-
ciency per unit halo mass increases steeply along the halo massfunction, up to a maximum around the Milky Way mass (e.g.Moster et al. 2010). Because even the most massive accreted haloestypically have much lower galaxy formation efficiency than themain halo, Macc remains a small fraction of M? and dependsstrongly on M200
10. For M200 & 10Mpeak, the most massive pro-genitor haloes have a galaxy formation efficiency comparable to or
10 In the extreme case, sharp thresholds for galaxy formation at very low
c© 2013 RAS, MNRAS 000, 1–21

14 Cooper et al.
12.0 12.5 13.0 13.5 14.0
log10 M200/M
8.5
9.0
9.5
10.0
10.5
11.0
11.5
log
10M
acc/M
B/T ≤ 0.2
0.2 < B/T ≤ 0.9
B/T > 0.9
10.8 11.0 11.2 11.4
log10 M?/M
100%
10%
1%
0.1%
30%
Figure 12. Left: points show the total mass of accreted stars, Macc as a function of M200, split by bulge-to-total ratio as shown in the legend. Right: pointsshow Macc as a function of stellar mass, M?. Grey lines correspond to fractions of the total stellar mass as indicated.
even higher than the main halo and Macc makes up a much largerfraction of M?. However, as the M?–M200 relation flattens, thenumber of progenitors continues to scale with M200, but the stel-lar mass per massive progenitor does not. The result is that Macc
scales more slowly with M200 than it does below Mpeak.In the G11 model, lower galaxy formation efficiency above
Mpeak is the result both of longer cooling times and of AGN feed-back (Kauffmann & Haehnelt 2000; Croton et al. 2006; Bower et al.2006). This model follows the entire hierarchy of galaxy formationand, with particle tagging, we have now computed the dynamicalevolution of all satellite disruption events in that model directlyfrom Millennium II. These techniques mean that our model is sig-nificantly more accurate and detailed than the empirical z = 0 scal-ing relations used by Purcell et al. (2007), so it is useful to revisittheir analysis. Fig. 13 presents the data from Fig. 12 in the sameway as figure 4 of Purcell et al. (2007), showing the ratio of Macc
to M? as a function of M200. As expected, our results are quali-tatively similar11 to Purcell et al.. However, our model predicts asignificantly steeper relation: an average accreted stellar mass frac-tion of 30 per cent is reached in haloes with M200 ∼ 1012.5Mrather than M200 ∼ 1013.5M.
Both models appear roughly consistent with the (limited) dataon late type galaxies in haloes of M200 ∼ 1012M, represented inFig. 13 by M31 (black point; Watkins et al. 2010; Courteau et al.2011) and the Milky Way (grey box; Smith et al. 2007; Bell et al.2008; Li & White 2008). In order to compare Macc in our resultsand in those of Purcell et al. to these observations in Fig. 13, wehave assumed that all observed halo stars are accreted while alldisc and bulge stars formed in situ. If this assumption is reasonable,
M200 (the atomic hydrogen cooling limit, reionization etc.) will result incentral galaxies that do not accrete any luminous progenitors and haveMacc = 0.11 Purcell et al. (2007) define their virial quantities at an overdensity of∆ = 337 rather than ∆ = 200 as we do. We have not corrected theirresults for this difference in Fig. 13; doing so would shift their curves to theright (higher virial mass) by . 0.1 dex for plausible NFW concentrations.
12.0 12.5 13.0 13.5 14.0
log M200/M
−2.5
−2.0
−1.5
−1.0
−0.5
0.0
logM?,acc/M
?,c
entr
al+
acc
B/T ≤ 0.9
B/T > 0.9
Purcell et al. (2007)
Figure 13. Solid blue and red lines show the median ratio of accreted stel-lar mass (both halo and bulge) to the total galaxy mass (sum of accretedand in situ stars). Colours separate galaxies by B/T as given in the legend.Dashed lines of the same colour enclose 90 per cent of the distributions.Black solid and dashed lines correspond to the same quantities for the dis-tribution shown in figure 5 (left panel) of Purcell et al. (2007). Grey hatchingand the black point with errorbars indicate likely values for the Milky Way(Smith et al. 2007; Li & White 2008; Bell et al. 2008; McMillan 2011) andM31 (Watkins et al. (2010); Courteau et al. (2011) respectively.)
Fig. 13 may imply that the Milky Way has a less massive stellarhalo than the average for its likely halo mass, or that the lowervalues of M200 are preferred. Fig. 13 reinforces the conclusion ofC10 that considerable scatter is expected in Macc for Milky Way–like galaxies. C10 attributed this to scatter in the accretion time and
c© 2013 RAS, MNRAS 000, 1–21

Accretion and galaxy structure in CDM 15
mass of the most massive progenitor satellite (in the Milky Way, forexample, the Sagittarius dwarf has contributed to the stellar halo,but the Large Magellanic Cloud has not).
Our model disagrees with Purcell et al. (2007) at higherM200,where most galaxies are ellipticals and even a lower limit to the ac-creted component is hard to identify by decomposing the light pro-file. Our model predicts that a late type galaxy in a halo of 1013Mshould have ∼ 30 per cent of its total stellar mass in an extendedn ∼ 3–4 spheroid of accreted stars (Purcell et al. predict ∼ 10per cent). This can be tested with deep images of nearby massivedisc galaxies (including S0s) for which the total mass is well con-strained by the rotation curve.
Finally, we discuss the progenitor galaxies that contribute starsto the accreted component in our models. A progenitor is defined asa galaxy that is disrupted within the ‘main branch’ of a halo mergertree – each progenitor may have many progenitors of its own, butall these are grouped together in this definition based on only thefinal level in the hierarchy. Following the definition given in section4 of C10, we find the most massive galaxies in our sample typicallyhave ∼ 10 significant progenitors to their accreted component (seealso Laporte et al. 2012). Ellipticals have a reasonably tight corre-lation between the number of significant progenitors andM200; thelowest mass ellipticals in our sample typically result from a singlemajor merger and thus have only one significant progenitor. Latetype galaxies have a larger scatter in the number of significant pro-genitors ofMacc. They can be dominated by one massive object, inagreement with the findings of C10, but we also find cases with 10or more significant progenitors.
The left-hand column of Fig. 14 shows the mass of the mostmassive progenitor in each of our galaxies. The upper and lowerpanels of this plot separate two classes of progenitor, according towhere their stars settle in the main halo after they have been ac-creted. We define ‘bulge’ progenitors to be those that deposit morethan half their stars within a radius of 3 kpc from the centre of themain halo at z = 0. The rest are classified as ‘stellar halo’ progen-itors (the same definition was used in C10).
The most massive ‘bulge’ progenitor is typically the mostmassive of all accreted galaxies, which is not surprising becausemore massive satellites suffer more dynamical friction and sinkquickly to the centre of the potential. Thus the relation betweenthe mass of the most massive bulge progenitor and the mass of thedark halo is similar to that shown in Fig. 12, with a steep slopefor late-type galaxies and an approximately constant value for el-lipticals. On the other hand, the mass of the most massive stellarhalo progenitor shows the same trend with M200 in both late typesand ellipticals. Thus our model predicts the outer stellar haloes ofall galaxies to be equally diverse at fixed M200. The most massivebulge progenitor is ∼ 10 times as massive as the most significantcontributor to the halo up to M200 ∼ 1013M; at higher M200
the most significant bulge and stellar halo progenitors have similarmass.
The right-hand column of Fig. 14 shows the mass of the mostmassive bulge and halo progenitors as a fraction of the total ac-creted stellar mass of the main galaxy in the same region. The ac-creted bulges of late type galaxies usually acquire at least ∼ 40per cent of their stars from one progenitor, reaching & 90 per centin many cases. On the other hand, the most massive contributorto the accreted stellar halo typically accounts for no more than∼ 30 per cent of its total mass, and rarely exceeds 50 per cent. Inmore massive galaxies (M? & 1011.2M, which mostly have G11B/T > 0.9) we find very few cases where more than 70 per cent ofaccreted bulge or halo stars originate in a single progenitor. As dis-
7
8
9
10
11
log
10M?,mm/M
< 3 kpc
B/T ≤ 0.9B/T > 0.9
10.8 11.0 11.2 11.4
log10 M?/M
0.2
0.4
0.6
0.8
1.0
M?,mm/M
acc,<
3kp
c
< 3 kpc
12 12.5 13 13.5 14log10 M200/M
7
8
9
10
11
log
10M?,mm/M
> 3 kpc
10.8 11.0 11.2 11.4
log10 M?/M
0.2
0.4
0.6
0.8
1.0
M?,mm/M
acc,>
3kp
c> 3 kpc
Figure 14. The stellar mass of the most massive progenitor, M?,mm, asa function of total halo mass M200 (left) and the fraction of stellar massacrreted from the most massive progenitor as a function of galaxy stellarmass M? (right). Upper and lower panels separate progenitors by the halfmass radius r50 of their stellar debris at z = 0: r50 < 3 kpc (the ‘bulge’)and r50 > 3 kpc (the ‘stellar halo’), respectively. The dashed black lines inthe left-hand panels show the mass corresponding to 1× 10⁻⁴M200.
cussed above, progenitors with M200 > Mpeak (the most efficienthalo mass for galaxy formation) have roughly the same stellar massas the central galaxy that accretes them. This means that massiveellipticals can undergo mergers that are ‘minor’ in terms of M200
(and thus numerous) but ‘major’ in terms of accreted stellar mass.
8 CONCLUSIONS
We have used dark matter particles in the Millennium II simulationas dynamical tracers of stellar populations, in order to study thehierarchical assembly of galactic structure in the CDM model. Wehave constrained the free parameter of our particle tagging method,fmb, by comparison to the galaxy mass–size relation for late-typegalaxies and find acceptable values in the range 1% < fmb < 5%.We have identified several limitations in the treatment of the in situcomponent that could be improved on in future work (see Sec-tion 2.5). In particular, the approximation of a universal constantvalue of fmb could be removed by computing it from other quanti-ties in our semi-analytic model.
Our most important conclusions can be summarised as fol-lows:
(i) The stellar mass surface density profiles of galaxies in ourmodel are well described by the sum of two Sersic models, corre-sponding to the separate contributions of stars formed in situ andstars accreted from other galaxies.
(ii) The surface density of in situ stars falls off more rapidlywith radius than the accreted component. In situ stars only makea significant contribution to surface brightness profiles out to R ∼10 kpc in M200 ∼ 1012M halos or 40 kpc in M200 ∼ 1014Mhaloes for fmb ∼ 1%.
(iii) The outer isophotes of all massive galaxies are dominatedby accreted stars, which extend to the virial radius in most systems.
c© 2013 RAS, MNRAS 000, 1–21

16 Cooper et al.
(iv) Stellar mass surface density profiles show very little scatterfrom galaxy to galaxy at fixed M200, particularly in group-scalehaloes (M200 > 1013.5 M). This is the consequence of strongcorrelations between halo mass, central star formation efficiencyand the galaxy progenitor mass function, and is a basic feature ofgalaxy formation in the CDM model (e.g. Purcell et al. 2007). Com-parison at fixed M? shows more scatter, because of scatter in therelationship between M? and M200.
(v) The stellar content of galaxies can be in situ dominatedor accretion dominated. Accretion-dominated galaxies have moreextended profiles and higher Sersic index than in situ-dominatedgalaxies. They have approximately ‘power law’ profiles from 10–100 kpc that show no clear inflection at the transition between insitu and accreted components and are associated with haloes thathost elliptical galaxies, according to the criteria described by G11.These massive haloes have usually been subject to ‘major’ mergers(violent relaxation) after z ∼ 1, which reshape their in situ compo-nent. They also suffer strong suppression of star formation by AGNfeedback which prevents a compact core of in situ stars forming atlow redshift.
(vi) In situ dominated profiles are typical of less massive haloes(up to M200 ∼ 1013M). In situ stars have a compact exponen-tial distribution by construction in our model. Extended (R50 ∼10 kpc) accreted spheroids begin to dominate only at R & 10 kpc,causing a clear inflection in the circularly-averaged surface bright-ness profile. Neither compact bulges nor compact exponential el-liptical galaxies are created by accretion in our model.
(vii) The transition from in situ dominated profiles to accretiondominated profiles with increasing M200 is less clear when studiedin terms of central stellar mass M?, because of scatter in the M?–M200 relation in our model.
(viii) The central galaxies of massive groups and clusters typi-cally have ∼ 10 accreted progenitors with similar stellar masses.In contrast, the bulges of less massive haloes are dominated by oneprogenitor, typically the most massive of those accreted; their stel-lar haloes are more diverse. The scatter in the number of significantprogenitors of bulges and stellar haloes is larger at lowerM200. Theprogenitor mix is not significantly different in the stellar haloes oflate and early type galaxies in our model. All these findings arereadily explained by trends in star formation efficiency with halomass in the ΛCDM model.
(ix) We have compared the results of our model with data fromthe literature, including deep surface brightness profiles of individ-ual galaxies and stacks of LRGs and BCGs. Subject to the crudeway in which we have assigned galaxies to halo mass bins and oursimplification of a constant mass-to-light ratio, the range of shapes,amplitudes and scales seen in our simulated surface density profilesfor accreted stars agree qualitatively with these observations.
(x) We have stacked SDSS images of galaxies in bins of stellarmass to obtain average surface density profiles that can be com-pared directly to the results of our simulations. We find a weaktrend of surface density amplitude with M? but no clear change inprofile shape. We find this is also the case in our simulations, oncewe account for the well-known bias in stellar mass measurementsfor massive galaxies due to the finite depth of SDSS photometry.
The next generation of deep sky surveys (culminating inLSST) will reach the low surface brightness limits required to de-tect stellar haloes and accretion remnants around the majority oflow-redshift L? galaxies. The dawn of this new era in the observa-tion of galaxy structure is a strong motivation for the further studyof these regions in simulations. We have shown that the particle tag-
ging technique is a straightforward and well-constrained extensionof the semi-analytic method with a number of interesting applica-tions that merit further investigation. These include stellar popula-tion gradients in early-type galaxies; the kinematics of diffuse light;the effects of interactions on the structure of satellite galaxies andenvironmental trends; the frequency of tidal features and their cor-relations with other galaxy properties; and the intracluster light ofmassive clusters.
ACKNOWLEDGMENTS
We thank the anonymous referee for their comments, which greatlyimproved the clarity of the paper, and Stefano Zibetti, for providingdata in electronic form. The Millennium II Simulation databasesused in this paper and the web application providing online ac-cess to them were constructed as part of the activities of the Ger-man Astrophysical Virtual Observatory. APC acknowledges a Na-tional Natural Science Foundation of China cooperation and ex-change grant, no. 11250110509. CSF acknowledges an ERC Ad-vanced Investigator grant (267291, COSMIWAY). This work wassupported in part by an STFC rolling grant to the Institute forComputational Cosmology of Durham University. SW is gratefulfor support from the ERC through an Advanced Investigator Grant(246797, GALFORMOD). MB-K acknowledges support from theSouthern California Center for Galaxy Evolution, a multi-campusresearch program funded by the University of California Officeof Research. APC is grateful to the authors and maintainers ofthe Python language core and its numerous open-source libraries(IPython, NumPy, SciPy and PyTables) and in particular to the lateJohn D. Hunter, author of Matplotlib.
Funding for SDSS-III has been provided by the Alfred P.Sloan Foundation, the Participating Institutions, the National Sci-ence Foundation, and the U.S. Department of Energy Office of Sci-ence. The SDSS-III web site is http://www.sdss3.org/.
SDSS-III is managed by the Astrophysical Research Con-sortium for the Participating Institutions of the SDSS-III Collab-oration including the University of Arizona, the Brazilian Par-ticipation Group, Brookhaven National Laboratory, University ofCambridge, Carnegie Mellon University, University of Florida, theFrench Participation Group, the German Participation Group, Har-vard University, the Instituto de Astrofisica de Canarias, the Michi-gan State/Notre Dame/JINA Participation Group, Johns HopkinsUniversity, Lawrence Berkeley National Laboratory, Max PlanckInstitute for Astrophysics, Max Planck Institute for Extraterres-trial Physics, New Mexico State University, New York University,Ohio State University, Pennsylvania State University, University ofPortsmouth, Princeton University, the Spanish Participation Group,University of Tokyo, University of Utah, Vanderbilt University,University of Virginia, University of Washington, and Yale Uni-versity.
APPENDIX A: DIFFERENCES WITH C10 ANDNUMERICAL CONVERGENCE
There are a number of minor differences between the tagging pro-cedure we use on Millennium II and that used on the Aquarius sim-ulations by C10. First, as discussed at length in the main text, wenow tag particles to represent in situ stars in our 1872 target cen-tral haloes as well as those formed in their progenitors and satellitegalaxies. In C10, the distribution of in situ stars in the main halo
c© 2013 RAS, MNRAS 000, 1–21
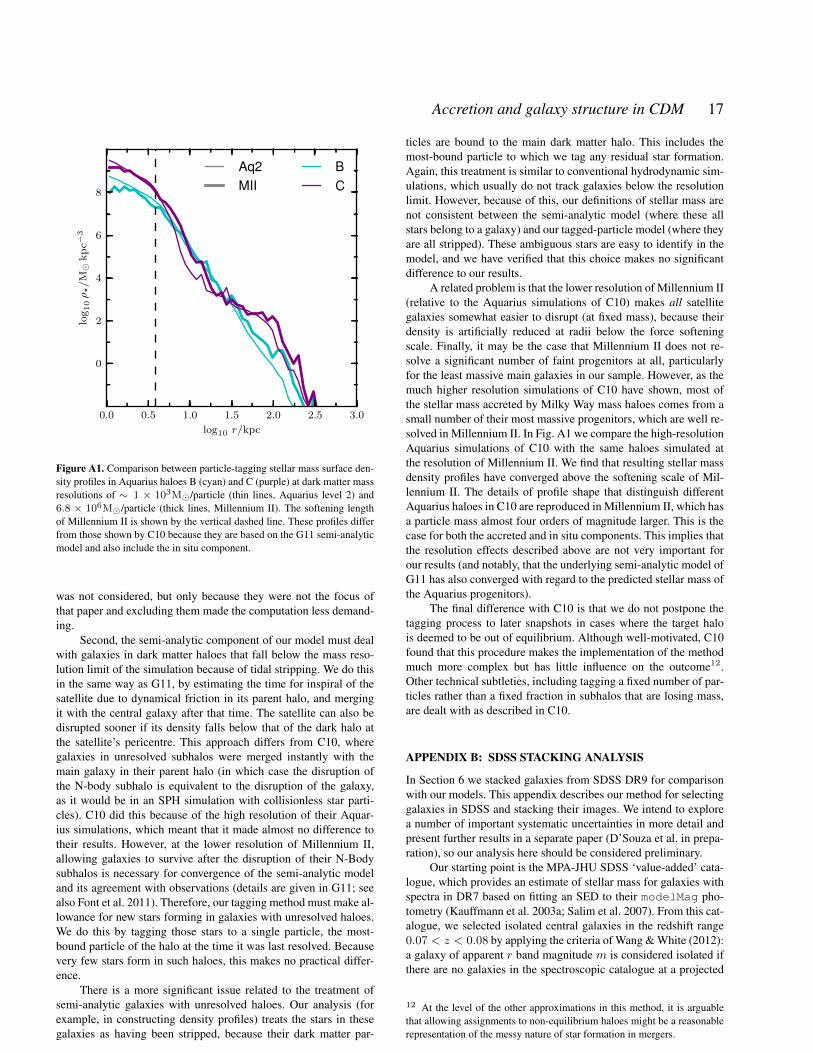
Accretion and galaxy structure in CDM 17
0.0 0.5 1.0 1.5 2.0 2.5 3.0
log10 r/kpc
0
2
4
6
8
log
10ρ?/M
kp
c−3
BC
Aq2MII
Figure A1. Comparison between particle-tagging stellar mass surface den-sity profiles in Aquarius haloes B (cyan) and C (purple) at dark matter massresolutions of ∼ 1 × 10³M/particle (thin lines, Aquarius level 2) and6.8 × 106M/particle (thick lines, Millennium II). The softening lengthof Millennium II is shown by the vertical dashed line. These profiles differfrom those shown by C10 because they are based on the G11 semi-analyticmodel and also include the in situ component.
was not considered, but only because they were not the focus ofthat paper and excluding them made the computation less demand-ing.
Second, the semi-analytic component of our model must dealwith galaxies in dark matter haloes that fall below the mass reso-lution limit of the simulation because of tidal stripping. We do thisin the same way as G11, by estimating the time for inspiral of thesatellite due to dynamical friction in its parent halo, and mergingit with the central galaxy after that time. The satellite can also bedisrupted sooner if its density falls below that of the dark halo atthe satellite’s pericentre. This approach differs from C10, wheregalaxies in unresolved subhalos were merged instantly with themain galaxy in their parent halo (in which case the disruption ofthe N-body subhalo is equivalent to the disruption of the galaxy,as it would be in an SPH simulation with collisionless star parti-cles). C10 did this because of the high resolution of their Aquar-ius simulations, which meant that it made almost no difference totheir results. However, at the lower resolution of Millennium II,allowing galaxies to survive after the disruption of their N-Bodysubhalos is necessary for convergence of the semi-analytic modeland its agreement with observations (details are given in G11; seealso Font et al. 2011). Therefore, our tagging method must make al-lowance for new stars forming in galaxies with unresolved haloes.We do this by tagging those stars to a single particle, the most-bound particle of the halo at the time it was last resolved. Becausevery few stars form in such haloes, this makes no practical differ-ence.
There is a more significant issue related to the treatment ofsemi-analytic galaxies with unresolved haloes. Our analysis (forexample, in constructing density profiles) treats the stars in thesegalaxies as having been stripped, because their dark matter par-
ticles are bound to the main dark matter halo. This includes themost-bound particle to which we tag any residual star formation.Again, this treatment is similar to conventional hydrodynamic sim-ulations, which usually do not track galaxies below the resolutionlimit. However, because of this, our definitions of stellar mass arenot consistent between the semi-analytic model (where these allstars belong to a galaxy) and our tagged-particle model (where theyare all stripped). These ambiguous stars are easy to identify in themodel, and we have verified that this choice makes no significantdifference to our results.
A related problem is that the lower resolution of Millennium II(relative to the Aquarius simulations of C10) makes all satellitegalaxies somewhat easier to disrupt (at fixed mass), because theirdensity is artificially reduced at radii below the force softeningscale. Finally, it may be the case that Millennium II does not re-solve a significant number of faint progenitors at all, particularlyfor the least massive main galaxies in our sample. However, as themuch higher resolution simulations of C10 have shown, most ofthe stellar mass accreted by Milky Way mass haloes comes from asmall number of their most massive progenitors, which are well re-solved in Millennium II. In Fig. A1 we compare the high-resolutionAquarius simulations of C10 with the same haloes simulated atthe resolution of Millennium II. We find that resulting stellar massdensity profiles have converged above the softening scale of Mil-lennium II. The details of profile shape that distinguish differentAquarius haloes in C10 are reproduced in Millennium II, which hasa particle mass almost four orders of magnitude larger. This is thecase for both the accreted and in situ components. This implies thatthe resolution effects described above are not very important forour results (and notably, that the underlying semi-analytic model ofG11 has also converged with regard to the predicted stellar mass ofthe Aquarius progenitors).
The final difference with C10 is that we do not postpone thetagging process to later snapshots in cases where the target halois deemed to be out of equilibrium. Although well-motivated, C10found that this procedure makes the implementation of the methodmuch more complex but has little influence on the outcome12.Other technical subtleties, including tagging a fixed number of par-ticles rather than a fixed fraction in subhalos that are losing mass,are dealt with as described in C10.
APPENDIX B: SDSS STACKING ANALYSIS
In Section 6 we stacked galaxies from SDSS DR9 for comparisonwith our models. This appendix describes our method for selectinggalaxies in SDSS and stacking their images. We intend to explorea number of important systematic uncertainties in more detail andpresent further results in a separate paper (D’Souza et al. in prepa-ration), so our analysis here should be considered preliminary.
Our starting point is the MPA-JHU SDSS ‘value-added’ cata-logue, which provides an estimate of stellar mass for galaxies withspectra in DR7 based on fitting an SED to their modelMag pho-tometry (Kauffmann et al. 2003a; Salim et al. 2007). From this cat-alogue, we selected isolated central galaxies in the redshift range0.07 < z < 0.08 by applying the criteria of Wang & White (2012):a galaxy of apparent r band magnitude m is considered isolated ifthere are no galaxies in the spectroscopic catalogue at a projected
12 At the level of the other approximations in this method, it is arguablethat allowing assignments to non-equilibrium haloes might be a reasonablerepresentation of the messy nature of star formation in mergers.
c© 2013 RAS, MNRAS 000, 1–21

18 Cooper et al.
radius R < 0.5 Mpc and velocity offset |δz| < 1000 km s−1
with magnitude m′ < m + 1, and none within R < 1 Mpc and|δz| < 1000 km s−1 with m′ < m. We make no selection oncolour or morphological type.
We created 1 Mpc2 mosaics in the g, r and i bands centeredon each galaxy in our sample using the ‘corrected’ sky-subtractedframes from the SDSS Data Release 9 image server and SWarp(Bertin et al. 2002). These three mosaics were stacked togetherto make a ‘master image’ from which a ‘master mask’ was ob-tained using SExtractor (Bertin & Arnouts 1996). Other galax-ies in the field were conservatively masked by convolving themaster image with an 8 × 8 pixel top hat kernel before runningSExtractor. The master mask was applied to each individualmosaic. The masked mosaics were then transformed to z = 0.08with the flux-conserving IRAF task geotran, cropped to a uni-form size of 1200× 1200 pixels (690× 690 kpc at z ∼ 0.08) andcorrected for extinction following Schlegel, Finkbeiner & Davis(1998).
We assume that the sky subtraction provided by the SDSSimaging pipeline is adequate for our analysis. The pipeline sky sub-traction was known to have shortcomings in early data releases, butwas revised in DR813 to improve the photometry of extended low-surface brightness regions around low redshift galaxies (Blantonet al. 2011). We confirmed the quality of the sky subtraction in theDR9 images by carrying out tests using the earlier DR7 imageswith our own background subtraction, and also by comparing DR9surface brightness profiles for galaxies in the Virgo cluster with theresults of Kormendy et al. (2009).
We binned our SDSS sample for stacking in mass bins as wedid our simulations in Fig. 10, using the mode of the MPA-JHUmass PDF corrected to a Hubble parameter h = 0.73 for consis-tency with the cosmology of our simulations14. This resulted in∼ 600–1200 SDSS galaxies per bin. Mosaics in the gri bandswere stacked separately using IRAF imcombine, taking the meanvalue15 of each pixel after clipping at the 10th and 90th percentiles.Images were centered before stacking but were not axis-aligned.We also removed a small residual background from each stack suchthat the stellar mass surface density falls to zero at the periphery ofthe mosaic. The g, r and i band mosaics for each galaxy were notincluded in the corresponding stacks if they included stars brighterthan r = 12, if they fell in the upper 10th percentile of the dis-tribution of pixel RMS for each mosaic in their mass bin, if theyhad more than 75% of their central 60 arcseconds masked, or if themasking algorithm failed due to a crowded field.
In a given mass bin, the azimuthally averaged mass profilewas derived from the r band stack assuming a constant mass-to-light ratio. TheM/Lr assumed for each bin is the average ofM/Lfor the galaxies in the bin, derived from their MPA-JHU mass andr band modelMag; in order of M? for the four bins, M/Lr =[2.154, 2.240, 2.391, 2.516]. We also used the g, r and i stacks toderive a radially varying M/Lr profile based on the colour of thelight in each annulus, using the prescriptions of Bell et al. (2003)with a Chabrier IMF. This only makes a significant difference inthe outermost radial bins of each profile. However, the potential forlarge colour errors at faint magnitudes (particularly those involving
13 See www.sdss3.org/dr9/imaging/images.php and www.sdss3.org/dr9/imaging/caveats.php14 We have not accounted for a possible overestimate of the DR7modelMag magnitudes owing to uncertainties in the background subtrac-tion of extended galaxies pre-DR8.15 Median and mode stacking produced very similar results.
the i band) adds considerably to the uncertainty in these radiallyvarying profiles.
We have not carried out deconvolution of the PSF at any stageof our analysis. Galaxies in the mass and redshift range of our sam-ple are typically well resolved, so the PSF mostly affects the veryinner part of the light profile. We have compared the profiles ofindividual galaxies in our stacks with similar galaxies at lower red-shift, with SDSS profMean profiles and with deep data from theVirgo cluster (Kormendy et al. 2009) to verify that the PSF onlyhas a significant effect (very roughly, of the order of & 0.1 mag-nitudes per square arcsecond in the surface brightness profile) atR . 5 kpc. Nevertheless, particularly for the i band magnitudeand the measurement of colours, PSF effects are known to be sig-nificant at much larger radii (de Jong 2008) and a complete analysisshould include a more thorough quantification of the PSF (e.g. Tal& van Dokkum 2011).
We estimated the uncertainty in each annulus in the constantM/L case as the sum in quadrature of Poisson error in the fluxper contributing pixel and the average RMS pixel-by-pixel devia-tion of each image from the stack in that annulus, the latter termaccounting for the sample variance. A bootstrap estimate of vari-ance would be preferable to understand the effects of sample vari-ance, but proved to be computationally expensive. Bootstrappingon sub-samples of 100 galaxies suggested that our algorithm un-derestimates the variance in the outer regions of the profile by afactor of 2, so we multiply our variance estimate by 2 to obtain theerror bar in Fig.11. This crude estimate of uncertainty is sufficientto indicate the largest radius to which each stacked profile is robust,but it could be made substantially more accurate with further work.
In our selection of SDSS galaxies for stacking, we have usedthe MPA-JHU stellar mass estimates. These masses are derivedfrom the galaxy modelMag magnitude, which attempts to correctfor undetected light in regions of low surface brightness by fittingthe observed surface brightness profile to one of two analytic mod-els (exponential and r1/4) and adopting the total magnitude of thebest fit. However, because the fits are to truncated light profiles(owing to the finite surface brightness limit, of more importancefor more extended galaxies) and assume a fixed Sersic index n = 4for the early-type model, they are likely to suffer from a bias rela-tive to the true total light similar to that of the Petrosian magnitudepetroMag. In theory petroMag is a substantial underestimateof the total light for galaxies with Sersic index n & 4, but includesalmost all of the light for galaxies with n ∼ 1 (Graham et al. 2005;Lauer et al. 2007; Blanton et al. 2011).
The bias in modelMag is more difficult to reproduce in oursimulations because it depends on the fitting process itself (for ex-ample, in the behaviour of fits to multi-component galaxies, or withsubstantial noise). Furthermore, we find that the median offset be-tween modelMag and petroMag for galaxies in our SDSS sam-ple is generally small (∼ 0.1 magnitudes). We therefore computethe ‘Petrosian’ mass from the simulations and use this as a proxy forthe SDSS modelMag mass in Fig. 11. We do so with an algorithmanalogous to that used for Petrosian flux reported by SDSS (i.e. themass within 2rp, using the same definition of rp). The resultingMpet underestimates M? for the most massive galaxies, therebyredistributing galaxies with high-n profiles to lower mass bins inour simulated stacks.
REFERENCES
Abadi M. G., Navarro J. F., Steinmetz M., 2006, MNRAS, 365,
c© 2013 RAS, MNRAS 000, 1–21

Accretion and galaxy structure in CDM 19
747Ahn C. P., Alexandroff R., Allende Prieto C., Anderson S. F., An-derton T., Andrews B. H., Aubourg E., Bailey S., et al., 2012,ApJS, 203, 21Baade W., 1944, ApJ, 100, 147Bailin J., Bell E. F., Chappell S. N., Radburn-Smith D. J., de JongR. S., 2011, ApJ, 736, 24Bakos J., Trujillo I., 2012, ArXiv e-prints, astro-ph/1204.3082Barker M. K., Ferguson A. M. N., Irwin M., Arimoto N., JablonkaP., 2009, AJ, 138, 1469Barker M. K., Ferguson A. M. N., Irwin M. J., Arimoto N.,Jablonka P., 2012, MNRAS, 419, 1489Baugh C. M., Cole S., Frenk C. S., 1996, MNRAS, 283, 1361Baugh C. M., Lacey C. G., Frenk C. S., Granato G. L., Silva L.,Bressan A., Benson A. J., Cole S., 2005, MNRAS, 356, 1191Bell E. F., McIntosh D. H., Katz N., Weinberg M. D., 2003, ApJS,149, 289Bell E. F., Wolf C., Meisenheimer K., Rix H.-W., Borch A., DyeS., Kleinheinrich M., Wisotzki L., et al., 2004, ApJ, 608, 752Bell E. F., Zucker D. B., Belokurov V., Sharma S., Johnston K. V.,Bullock J. S., Hogg D. W., Jahnke K., et al., 2008, ApJ, 680, 295Belokurov V., Zucker D. B., Evans N. W., Gilmore G., Vidrih S.,Bramich D. M., Newberg H. J., Wyse R. F. G., et al., 2006, ApJ,642, L137Bender R., Burstein D., Faber S. M., 1992, ApJ, 399, 462Benson A. J., Bower R., 2010, MNRAS, 405, 1573Benson A. J., Cole S., Frenk C. S., Baugh C. M., Lacey C. G.,2000, MNRAS, 311, 793Benson A. J., Devereux N., 2010, MNRAS, 402, 2321Bernardi, M., Meert, A., Sheth, R. K., Vikram, V., Huertas-Company, M., Mei, S., Shankar, F., 2013, ArXiv e-prints, astro-ph/1304.7778Bernardi M., Meert A., Vikram V., Huertas-Company M., Mei S.,Shankar F., Sheth R. K., 2012, ArXiv e-prints, astro-ph/1211.6122Bernardi M., Roche N., Shankar F., Sheth R. K., 2011, MNRAS,412, 684Bernardi, M., Hyde, J. B., Sheth, R. K., Miller, C. J., Nichol, R. C.,2007, AJ, 133, 1741Bernardi M., Sheth R. K., Annis J., Burles S., Eisenstein D. J.,Finkbeiner D. P., Hogg D. W., Lupton R. H., et al., 2003, AJ, 125,1849Bertin E., Arnouts S., 1996, A&AS, 117, 393Bertin E., Mellier Y., Radovich M., Missonnier G., Didelon P.,Morin B., 2002, in Astronomical Society of the Pacific Confer-ence Series, Vol. 281, Astronomical Data Analysis Software andSystems XI, Bohlender D. A., Durand D., Handley T. H., eds., p.228Binggeli B., Sandage A., Tarenghi M., 1984, AJ, 89, 64Bland-Hawthorn J., Vlajic M., Freeman K. C., Draine B. T., 2005,ApJ, 629, 239Blanton M. R., Kazin E., Muna D., Weaver B. A., Price-WhelanA., 2011, AJ, 142, 31Bower R. G., Benson A. J., Malbon R., Helly J. C., Frenk C. S.,Baugh C. M., Cole S., Lacey C. G., 2006, MNRAS, 370, 645Boylan-Kolchin M., Springel V., White S. D. M., Jenkins A.,Lemson G., 2009, MNRAS, 398, 1150Bruzual G., Charlot S., 2003, MNRAS, 344, 1000Bullock J. S., Johnston K. V., 2005, ApJ, 635, 931Bullock J. S., Kravtsov A. V., Weinberg D. H., 2001, ApJ, 548, 33Chabrier G., 2003, PASP, 115, 763Chang, J., Maccio, A. V., & Kang, X. 2013, MNRAS, 431, 3533Cole S., 1991, ApJ, 367, 45
Cole S., Lacey C., 1996, MNRAS, 281, 716Cole S., Lacey C. G., Baugh C. M., Frenk C. S., 2000, MNRAS,319, 168Conselice C. J., 2006, MNRAS, 373, 1389Cooper A. P., Cole S., Frenk C. S., White S. D. M., Helly J., Ben-son A. J., De Lucia G., Helmi A., et al., 2010, MNRAS, 406, 744Cooper A. P., Martınez-Delgado D., Helly J., Frenk C., Cole S.,Crawford K., Zibetti S., Carballo-Bello J. A., et al., 2011, ApJ,743, L21Conroy, C., Wechsler, R. H., & Kravtsov, A. V. 2006, ApJ, 647,201Courteau S., Widrow L. M., McDonald M., Guhathakurta P.,Gilbert K. M., Zhu Y., Beaton R. L., Majewski S. R., 2011, ApJ,739, 20Cowie L. L., Gardner J. P., Hu E. M., Songaila A., Hodapp K.-W.,Wainscoat R. J., 1994, ApJ, 434, 114Crain R. A., Theuns T., Dalla Vecchia C., Eke V. R., Frenk C. S.,Jenkins A., Kay S. T., Peacock J. A., et al., 2009, MNRAS, 399,1773Croft R. A. C., Di Matteo T., Springel V., Hernquist L., 2009,MNRAS, 400, 43Croton D. J., Springel V., White S. D. M., De Lucia G., FrenkC. S., Gao L., Jenkins A., Kauffmann G., et al., 2006, MNRAS,365, 11Daddi E., Renzini A., Pirzkal N., Cimatti A., Malhotra S., StiavelliM., Xu C., Pasquali A., et al., 2005, ApJ, 626, 680de Jong R. S., 2008, MNRAS, 388, 1521De Lucia G., Blaizot J., 2007, MNRAS, 375, 2De Lucia G., Fontanot F., Wilman D., Monaco P., 2011, MNRAS,414, 1439De Lucia G., Springel V., White S. D. M., Croton D., KauffmannG., 2006, MNRAS, 366, 499Djorgovski S., Davis M., 1987, ApJ, 313, 59Donzelli C. J., Muriel H., Madrid J. P., 2011, ApJS, 195, 15Dutton A. A., van den Bosch F. C., Dekel A., Courteau S., 2007,ApJ, 654, 27Eggen O. J., Lynden-Bell D., Sandage A. R., 1962, ApJ, 136, 748Eke V. R., Frenk C. S., Baugh C. M., Cole S., Norberg P., PeacockJ. A., Baldry I. K., Bland-Hawthorn J., et al., 2004, MNRAS, 355,769Faber S. M., Jackson R. E., 1976, ApJ, 204, 668Fall, S. M., 1979, Nature, 281, 200Font A. S., McCarthy I. G., Crain R. A., Theuns T., Schaye J.,Wiersma R. P. C., Dalla Vecchia C., 2011, MNRAS, 416, 2802Frenk C. S., White S. D. M., Efstathiou G., Davis M., 1985, Na-ture, 317, 595Gallagher III J. S., Ostriker J. P., 1972, AJ, 77, 288Gilbert K. M., Font A. S., Johnston K. V., Guhathakurta P., 2009,ApJ, 701, 776Gnedin O. Y., Kravtsov A. V., Klypin A. A., Nagai D., 2004, ApJ,616, 16Gonzalez A. H., Zabludoff A. I., Zaritsky D., 2005, ApJ, 618, 195Gonzalez J. E., Lacey C. G., Baugh C. M., Frenk C. S., BensonA. J., 2009, MNRAS, 397, 1254Graham A., Lauer T. R., Colless M., Postman M., 1996, ApJ, 465,534Graham A. W., 2011, ArXiv e-prints, astro-ph/1108.0997Graham A. W., Driver S. P., Petrosian V., Conselice C. J., Ber-shady M. A., Crawford S. M., Goto T., 2005, AJ, 130, 1535Graham, A. W., & Driver, S. P. 2005, PASA, 22, 118Graham A. W., Guzman R., 2003, AJ, 125, 2936Guo Q., White S., Boylan-Kolchin M., De Lucia G., Kauffmann
c© 2013 RAS, MNRAS 000, 1–21

20 Cooper et al.
G., Lemson G., Li C., Springel V., et al., 2011, MNRAS, 413, 101Guo Q., White S., Li C., Boylan-Kolchin M., 2010, MNRAS, 404,1111Guo Q., White S. D. M., 2008, MNRAS, 384, 2Guo Y., McIntosh D. H., Mo H. J., Katz N., van den Bosch F. C.,Weinberg M., Weinmann S. M., Pasquali A., et al., 2009, MN-RAS, 398, 1129Hernquist L., Spergel D. N., Heyl J. S., 1993, ApJ, 416, 415Hilz, M., Naab, T., Ostriker, J. P., et al. 2012, MNRAS, 425, 3119Hilz, M., Naab, T., & Ostriker, J. P. 2013, MNRAS, 429, 2924Hopkins P. F., Hernquist L., Cox T. J., Dutta S. N., Rothberg B.,2008, ApJ, 679, 156Hyde J. B., Bernardi M., 2009, MNRAS, 394, 1978Ibata R. A., Gilmore G., Irwin M. J., 1995, MNRAS, 277, 781Kauffmann G., 1996, MNRAS, 281, 487Kauffmann G., Charlot S., 1998, MNRAS, 294, 705Kauffmann G., Haehnelt M., 2000, MNRAS, 311, 576Kauffmann G., Heckman T. M., White S. D. M., Charlot S.,Tremonti C., Brinchmann J., Bruzual G., Peng E. W., et al., 2003a,MNRAS, 341, 33Kauffmann G., Heckman T. M., White S. D. M., Charlot S.,Tremonti C., Peng E. W., Seibert M., Brinkmann J., et al., 2003b,MNRAS, 341, 54Kauffmann G., White S. D. M., Guiderdoni B., 1993, MNRAS,264, 201Kaviraj S., 2010, MNRAS, 406, 382Koopmans, L. V. E., Bolton, A., Treu, T., et al. 2009, ApJ, 703,L51Kormendy J., 1977, ApJ, 218, 333Kormendy J., Fisher D. B., Cornell M. E., Bender R., 2009, ApJS,182, 216Krick J. E., Bernstein R. A., Pimbblet K. A., 2006, AJ, 131, 168Laporte C. F. P., White S. D. M., Naab T., Ruszkowski M.,Springel V., 2012, MNRAS, 424, 747Laporte, C. F. P., White, S. D. M., Naab, T., Gao, L. 2013, ArXive-prints, astro-ph/1301.5319Lauer T. R., Faber S. M., Richstone D., Gebhardt K., Tremaine S.,Postman M., Dressler A., Aller M. C., et al., 2007, ApJ, 662, 808Li C., White S. D. M., 2009, MNRAS, 398, 2177Li Y.-S., White S. D. M., 2008, MNRAS, 384, 1459Lin Y.-T., Mohr J. J., 2004, ApJ, 617, 879LSST Science Collaborations, Abell P. A., Allison J., AndersonS. F., Andrew J. R., Angel J. R. P., Armus L., Arnett D., et al.,2009, ArXiv e-prints, astro-ph/0912.0201Malin D. F., Carter D., 1983, ApJ, 274, 534Martınez-Delgado D., Gabany R. J., Crawford K., Zibetti S., Ma-jewski S. R., Rix H.-W., Fliri J., Carballo-Bello J. A., et al., 2010a,AJ, 140, 962—, 2010b, AJ, 140, 962Matthews T. A., Morgan W. W., Schmidt M., 1964, ApJ, 140, 35McConnachie A. W., Irwin M. J., Ibata R. A., Dubinski J., WidrowL. M., Martin N. F., Cote P., Dotter A. L., et al., 2009, Nature, 461,66McMillan P. J., 2011, MNRAS, 414, 2446Meert, A., Vikram, V., Bernardi, M., 2012, ArXiv e-prints, astro-ph/1211.6123Meza A., Navarro J. F., Steinmetz M., Eke V. R., 2003, ApJ, 590,619Mihos J. C., Harding P., Feldmeier J., Morrison H., 2005, ApJ,631, L41Mitchell, P. D., Lacey, C. G., Baugh, C. M., Cole, S., 2013, ArXive-prints, astro-ph/1303.7228
Mosleh M., Williams R. J., Franx M., 2013, ArXiv e-prints, astro-ph/1302.6240Moster B. P., Somerville R. S., Maulbetsch C., van den BoschF. C., Maccio A. V., Naab T., Oser L., 2010, ApJ, 710, 903Naab T., Johansson P. H., Ostriker J. P., 2009, ApJ, 699, L178Naab T., Johansson P. H., Ostriker J. P., Efstathiou G., 2007, ApJ,658, 710Naab T., Khochfar S., Burkert A., 2006, ApJ, 636, L81Napolitano, N. R., Pannella, M., Arnaboldi, M., et al., 2003, ApJ,594, 172Navarro, J. F., Frenk, C. S., & White, S. D. M. 1996, ApJ, 462,563Navarro J. F., Eke V. R., Frenk C. S., 1996, MNRAS, 283, L72Niederste-Ostholt M., Belokurov V., Evans N. W., Penarrubia J.,2010, ApJ, 712, 516Oemler Jr. A., 1976, ApJ, 209, 693Oser L., Ostriker J. P., Naab T., Johansson P. H., Burkert A., 2010,ApJ, 725, 2312Parry O. H., Eke V. R., Frenk C. S., 2009, MNRAS, 396, 1972Penarrubia J., Navarro J. F., McConnachie A. W., 2008, ApJ, 673,226Peletier R. F., Davies R. L., Illingworth G. D., Davis L. E., Caw-son M., 1990, AJ, 100, 1091Pontzen, A., & Governato, F. 2012, MNRAS, 421, 3464Purcell C. W., Bullock J. S., Zentner A. R., 2007, ApJ, 666, 20Radburn-Smith D. J., de Jong R. S., Seth A. C., Bailin J., BellE. F., Brown T. M., Bullock J. S., Courteau S., et al., 2011, ApJS,195, 18Reiprich T. H., Bohringer H., 2002, ApJ, 567, 716Richardson J. C., Ferguson A. M. N., Mackey A. D., Irwin M. J.,Chapman S. C., Huxor A., Ibata R. A., Lewis G. F., et al., 2009,MNRAS, 396, 1842Robertson B., Bullock J. S., Cox T. J., Di Matteo T., Hernquist L.,Springel V., Yoshida N., 2006, ApJ, 645, 986Rozo E., Rykoff E. S., Evrard A., Becker M., McKay T., WechslerR. H., Koester B. P., Hao J., et al., 2009, ApJ, 699, 768Sales L. V., Navarro J. F., Theuns T., Schaye J., White S. D. M.,Frenk C. S., Crain R. A., Dalla Vecchia C., 2012, MNRAS, 423,1544Salim S., Rich R. M., Charlot S., Brinchmann J., Johnson B. D.,Schiminovich D., Seibert M., Mallery R., et al., 2007, ApJS, 173,267Schlegel D. J., Finkbeiner D. P., Davis M., 1998, ApJ, 500, 525Schombert J. M., 1986, ApJS, 60, 603—, 1988, ApJ, 328, 475Schweizer F., 1980, ApJ, 237, 303Schweizer F., Seitzer P., 1992, AJ, 104, 1039Schweizer F., Seitzer P., Faber S. M., Burstein D., Dalle OreC. M., Gonzalez J. J., 1990, ApJ, 364, L33Searle L., Zinn R., 1978, ApJ, 225, 357Seigar M. S., Graham A. W., Jerjen H., 2007, MNRAS, 378, 1575Sersic J. L., 1968, Atlas de galaxias australes. Observatorio As-tronomico, CordobaShankar F., Marulli F., Bernardi M., Mei S., Meert A., Vikram V.,2013, MNRAS, 428, 109Shen S., Mo H. J., White S. D. M., Blanton M. R., Kauffmann G.,Voges W., Brinkmann J., Csabai I., 2003, MNRAS, 343, 978Smith M. C., Ruchti G. R., Helmi A., Wyse R. F. G., FulbrightJ. P., Freeman K. C., Navarro J. F., Seabroke G. M., et al., 2007,MNRAS, 379, 755Somerville R. S., Primack J. R., 1999, MNRAS, 310, 1087Springel, V., White, S. D. M., Jenkins, A., et al., 2005, Nature,
c© 2013 RAS, MNRAS 000, 1–21

Accretion and galaxy structure in CDM 21
435, 629Springel V., 2005, MNRAS, 364, 1105Tal T., van Dokkum P. G., 2011, ApJ, 731, 89Tal T., van Dokkum P. G., Nelan J., Bezanson R., 2009, AJ, 138,1417Thuan T. X., Romanishin W., 1981, ApJ, 248, 439Toomre A., 1977, in Evolution of Galaxies and Stellar Popula-tions, B. M. Tinsley & R. B. G. Larson D. Campbell, ed., pp. 401Trujillo I., Forster Schreiber N. M., Rudnick G., Barden M., FranxM., Rix H.-W., Caldwell J. A. R., McIntosh D. H., et al., 2006,ApJ, 650, 18Vale, A., & Ostriker, J. P. 2006, MNRAS, 371, 1173van den Bosch F. C., Yang X., Mo H. J., 2003, MNRAS, 340, 771van Dokkum P. G., Whitaker K. E., Brammer G., Franx M., KriekM., Labbe I., Marchesini D., Quadri R., et al., 2010, ApJ, 709,1018Wang J., Navarro J. F., Frenk C. S., White S. D. M., Springel V.,Jenkins A., Helmi A., Ludlow A., et al., 2011, MNRAS, 413, 1373Wang W., White S. D. M., 2012, MNRAS, 424, 2574Watkins L. L., Evans N. W., An J. H., 2010, MNRAS, 406, 264White S. D. M., Frenk C. S., 1991, ApJ, 379, 52White S. D. M., Rees M. J., 1978, MNRAS, 183, 341Widrow L. M., 2000, ApJS, 131, 39Zepf S. E., 1997, Nature, 390, 377Zibetti S., White S. D. M., Brinkmann J., 2004, MNRAS, 347,556Zibetti S., White S. D. M., Schneider D. P., Brinkmann J., 2005,MNRAS, 358, 949
This paper has been typeset from a TEX/ LATEX file prepared by theauthor.
c© 2013 RAS, MNRAS 000, 1–21