the 2009 ageing report - european...
TRANSCRIPT
The 2009 Ageing Report:Underlying Assumptions and Projection Methodologies
EUROPEAN ECONOMY 7|2008
ISSN 0379-0991
EUROPEAN COMMISSION

The European Economy series contains important reports and communications from the Commissionto the Council and the Parliament on the economic situation and developments, such as the Economicforecasts, the annual EU economy review and the Public finances in EMU report.
Subscription terms are shown on the back cover and details on how to obtain the list of sales agentsare shown on the inside back cover.
Unless otherwise indicated, the texts are published under the responsibility of theDirectorate-General for Economic and Financial Affairs of the European Commission, BU1, B-1049Brussels, to which enquiries other than those related to sales and subscriptions should be addressed.
LEGAL NOTICE
Neither the European Commission nor any person acting on its behalf may be heldresponsible for the use which may be made of the information contained in thispublication, or for any errors which, despite careful preparation and checking, may appear.
More information on the European Union is available on the Internet (http://europa.eu).
Cataloguing data can be found at the end of this publication.
Luxembourg: Office for Official Publications of the European Communities, 2008
ISBN 978-92-79-08392-1
DOI 10.2765/51050
© European Communities, 2008
Reproduction is authorised provided the source is acknowledged.
Printed in Luxembourg
European CommissionDirectorate-General for Economic and Financial Affairs
The 2009 Ageing Report:Underlying Assumptionsand Projection Methodologies for theEU-27 Member States (2007-2060)
Joint Report prepared bythe European Commission (DG ECFIN) andthe Economic Policy Committee (AWG)
EUROPEAN ECONOMY 7/2008


3
ACkNOwlEDGEMENts
This report has been prepared as part of the mandate the Economic and Financial Affairs (ECOFIN)Council gave to the Economic Policy Committee (EPC) in February 2006 to update and furtherdeepen its common projection exercise of age-related expenditure projections on the basis of a newpopulation projection provided by Eurostat.
The forthcoming projections of the budgetary impact of the ageing population in the 27 EU MemberStates over the period 2007-2060 will be calculated on the basis of the macroeconomic assumptions andthe methodology described in this report and will be presented to the ECOFIN Council in May 2009.
In accordance with its normal practice, the EPC mandated a working group, the Ageing WorkingGroup (AWG) under the chairmanship of Henri Bogaert, to take forward the work needed to dischargethis remit.
This report is presented by the EPC and the European Commission (Directorate General for Economicand Financial Affairs – DG ECFIN) after full discussion on the basis of the AWG’s comprehensivework. The Directorate-General for Economic and Financial Affairs provided the necessary analysisand calculations used in the report. The demographic projections (EUROPOP2008) were carried outby Eurostat. Valuable contributions were also made by staff of the OECD, the IMF and the ECB.
The report was prepared under the supervision of Gert-Jan Koopman (Director of DG ECFIN),Christian Kastrop (Chair of the EPC), Henri Bogaert (Chairman of the AWG), Giuseppe Carone(Head of Unit DG ECFIN). The main contributors were Per Eckefeldt, Kamil Dybczak, BartoszPrzywara, Etienne Sail and the members of the AWG (see list of Members below). The EPC and theEconomic and Financial Affairs DG would like to thank all those concerned.
Comments on the report would be gratefully received at the following addresses:
DG ECFIN – Unit B3Directorate-General for Economic and Financial AffairsEuropean CommissionGiuseppe CaroneRue de la Loi 200B-1049 Brussels
E-mail: [email protected]
Secretariat of the Economic Policy CommitteeEuropean CommissionJens MatthiessenRue de la Loi 200B-1049 Brussels
E-mail: [email protected]

4
MeMbers of the Ageing Working group
CHAIRMANMr. Henri BOGAERT, Commissaire au Plan Bureau fédéral du Plan, Belgique – Federaal
Planbureau, Belgïe
BELGIQUE-BELGÏEMr. Michel ENGLERT Bureau fédéral du Plan – Federaal PlanbureauMme Micheline LAMBRECHT Bureau fédéral du Plan, Federaal Planbureau
BULGARIAMr. Dimitar VASSILEV Agency for Economic Analysis and ForecastingMs. Tsvetelina DIMITROVA Agency for Economic Analysis and ForecastingMs. Antoaneta GANCHEVA National Social Security Institute
Czech RepublicMr. Zbynek STORK Ministry of FinanceMr. Jindrich MARVAL Ministry of Finance
DANMARKMr. Benn VESTERGAARD Ministry of FinanceMs. Vibe MUSAEUS MADSEN Ministry of FinanceMr. Morten GRANZAU NIELSEN Ministry of Finance
BUNDESREPUBLIK DEUTSCHLANDMs. Britta VELLEUER Bundesministerium der FinanzenMr. Konrad HAKER Bundesministerium für Arbeit und Soziales
ESToNIAMr. Tanel STEINBERG Ministry of FinanceMs Pille MIHKELSON Ministry of Finance
ELLASMs. Marianna PAPAMICHAIL National Actuarial AuthorityMr. Dimitris PAPAOIKONOMOU Ministry of Economy and FinanceMs. Charitini KARAKOULAKI Ministry of Economy and Finance
ESPAÑAMs. Virginia ALONSO Ministerio de Economia y HaciendaMr. Juan VARELA Ministerio de Economia y HaciendaMr. Francisco DE CASTRO Bank of Spain
FRANCEMr. Thibault GUYON Ministère de l’économie,
des finances et de l’industrieMr. Falilou FALL Ministère de l’économie,
des finances et de l’industrieMr. Frank ARNAUD Ministère de l’économie,
des finances et de l’industrie
IRELANDMs. Loretta O’SULLIVAN Department of FinanceMr. Shane ENRIGHT Department of Finance

5
ITALIAMr. Rocco APRILE Ministero del TesoroMs. Manuela NENNA Ministero del Tesoro
CyPRUSMs Maria MATSI Ministry of FinancesMr. Zenon KONTOLEMIS Ministry of FinancesMr. Costas STAVRAKIS Ministry of Labour and Social Insurance
LATvIAMr. Ilmārs ŠŅUCINS Ministry of FinanceMs. Sandra STABINA Ministry of Welfare
LITHUANIAMs Vidija PASTUKIENE Ministry of Social Security and LabourMs. Rasa SLIOGERIENE Ministry of FinanceMs. Raimonda ZUTAUTIENE Ministry of Finance
LUXEMBoURGMr. Tom DOMINIQUE Inspection Générale de la Securité SocialeMr. Raymond WAGENER Inspection Générale de la Securité SocialeMs. Laurence WEBER Inspection Générale de la Sécurité SocialeMr. Jean LANGERS STATEC
HUNGARyMs. Edit LENDVAI Ministry of FinanceMr. Marton SZILI Ministry of Finance
MALTAMr. Godwin MIFSUD Ministry of Finance, the Economy and InvestmentMs. Moira CATANIA Ministry of Finance, the Economy and Investment
NEDERLANDMr. Harry TER RELE Centraal PlanbureauMr. Bart BOON Ministry of Finance
ÖSTERREICHMs. Caroline BAAR Bundesministerium für FinanzenMr. Peter PART Bundesministerium für Finanzen
PoLANDMs Joanna STACHURA Ministry of Economy, Labour and Social PolicyMs Agnieszka CHŁOŃ-DOMIŃCZAK Ministry of Economy, Labour and Social PolicyMr. Pawel STRZELECKI National Bank of Poland
PoRTUGALMs. Vanda GERALDES DA CUNHA Ministry of Finance and of Public AdministrationMr. Hélder REIS Ministry of Finance and of Public Administration
RoMANIAMrs Iuliana DASCALU Ministry of Public FinanceMs. Mihaela RUNCAN

6
SLovENIAMr Dusan KIDRIC Institute of Macroeconomic
Analysis and DevelopmentMr. Tomaz KRAIGHER Institute of Macroeconomic
Analysis and DevelopmentMr. Slaven MICKOVIC Ministry of Finance
SLovAKIAMr. Viktor NOVYSEDLAK Ministry of FinanceMr. Marek PORUBSKY Ministry of Finance
SUoMI FINLANDMr. Jorma TUUKKANEN Ministry of FinanceMr. Jussi HUOPANIEMI Ministry of FinanceMs. Maria TUOVINEN Ministry of Finance
SvERIGEMs Anna KLEEN Ministry of FinanceMr. Olle SUNDBERG Ministry of FinanceMr. Joakim HUSSENIUS Ministry of Finance
UNITED KINGDoMMs. Kerstin GREB HM Treasury
NoRWAy (observer)Mr. Yngvar DYVI Ministry of FinanceMr. Per-Mathis KONGSRUD Ministry of Finance
oECDMr. Joaquim OLIVEIRA Economics DepartmentMr. Mark PEARSON Economics Department
EURoPEAN CENTRAL BANKMs. Nadine LEINER-KILLINGER
EURoSTATMs. Bettina KNAUTH
WoRLD BANKMr. Hermann von GERSDORFF
INTERNATIoNAL MoNETARy FUNDMr. Emmanuel VAN DER MENSBRUGGHE BruxellesMr. Luc LERUTH Paris
EPC SECRETARIATMrs. Odile RENAUD-BASSOMr. Jens MATTHIESSEN
EURoPEAN CoMMISSIoNMr. Giuseppe CARONEMr. Per ECKEFELDTMr. Lucio PENCHMr. Peer RITTER

7
CONtENts
lIst OF tABlEs 10
lIst OF GRAPHs 12
EXECUtIVE sUMMARY 13
PARt I
Underlying assumptions and projection methodologies 27
1. Population 29
1.1. BACkGROUND AND GENERAl APPROACH 29
1.2. PROjECtION OF FERtIlItY RAtEs 29
1.2.1. Past trends 29
1.2.2. the EUROPOP2008 projection 31
1.3. PROjECtION OF lIFE EXPECtANCY 32
1.3.1. Past trends 32
1.3.2. the projection used in EUROPOP2008: methodology and results 32
1.4. PROjECtION OF NEt MIGRAtION FlOws 35
1.4.1. Past trends and driving forces 35
1.4.2. the projection used in EUROPOP2008: methodology and results 37
1.5. OVERAll REsUlts OF POPUlAtION PROjECtION tO BE UsED 39
1.6. POPUlAtION AGEING IN tHE EU IN A GlOBAl CONtEXt 49
1.7. COMPARIsON wItH tHE DEMOGRAPHIC PROjECtION UsED IN tHE 2006 AGEING REPORt 51
Annex 1.1: the EUROPOP2008 projection: key assumptions 58
2. labour force projections 59
2.1. lABOUR FORCE PROjECtIONs IN tHE lONG-tERM PROjECtION EXERCIsE 59
2.1.1. the approach used in the 2006 budgetary projections of the EPC 59
2.1.2. Past trends and main determinants of labour market performance 59
2.2. OVERVIEw OF tHE PROjECtION MEtHODOlOGY ANDMAIN AssUMPtIONs IN tHE 2009 EXERCIsE 63
2.3. MEtHODOlOGY UsED tO PROjECt PARtICIPAtION RAtEs 65
2.3.1. Assumptions and adjustments for specific Member States 65
2.3.2. Impact of recently enacted pension reforms 65
2.3.2.1. Recent pension reforms in some EU Member states 65
2.3.2.2. Impact of pension reforms in the baseline labour force projection 70
2.3.2.3. simulating the impact of the pensionreforms on the participation rate of older workers 70
2.4. MAIN REsUlts OF tHE PROjECtION OF lABOUR MARkEt PARtICIPAtION RAtEs 74
2.4.1. Projection of participation rates 74
2.4.2. Projection of labour supply 77
2.4.3. Decomposing the population compositioneffect and the participation effect on labour supply 78
2.5. AssUMPtIONs ON stRUCtURAl UNEMPlOYMENt 82

8
2.6. EMPlOYMENt PROjECtION 82
2.7. ECONOMIC DEPENDENCY RAtIOs EMERGING FROM tHE lABOUR FORCE PROjECtION 90
2.8. PROjECtION OF tOtAl HOURs wORkED 93
2.9. COMPARIsON wItH tHE PROjECtION IN tHE 2006 AGEING REPORt 94
Annex 2.1: Projecting labour force developmentsusing the cohort simulation model 96
Annex 2.2: Estimation of the average exit age from the labour market 98
3. labour productivity and GDP 99
3.1. BACkGROUND AND GENERAl APPROACH 99
3.2. MEtHODOlOGY UsED tO PROjECt POtENtIAl OUtPUt 99
3.2.1. short description of the production function framework 99
3.2.2. Specific assumptions on the componentsof the production function in the short term (2008-2009) 101
3.2.3. Specific assumptions on the componentsof the production function in the longer run (2010-2060) 101
3.3. MAIN REsUlts OF BAsElINE PROjECtIONs 104
3.4. COMPARIsON wItH tHE PREVIOUs 2006 lONG-tERM BUDGEtARY PROjECtION EXERCIsE 107
4. Interest rates 111
4.1. BACkGROUND 111
4.2. AssUMPtIONs ON INtEREst RAtEs tO BE UsEDIN tHE 2009 EPC PROjECtION OF AGE- RElAtED EXPENDItURE 111
5. sENsItIVItY tEsts 113
5.1. BACkGROUND 113
5.2. PROjECtION REsUlts 113
PARt II 119
Age-related expenditure items: coverage,projection methodologies and data sources 119
6. Pensions 121
6.1. MAIN FEAtUREs OF tHE PENsION PROjECtION 121
6.2. COVERAGE OF tHE PENsION PROjECtION 121
6.3. DEFINItIONs AND ClARIFICAtIONs 122
6.3.1. Reporting norms 122
6.3.2. Additional definitions and clarifications 122
6.3.3. Breakdown of social security pensions 124
6.3.4. the level of pensions 125
6.3.5. Additional information on numbers of pensioners,contributors and contributions to pension schemes and assets of pension funds 125
6.4. COUNtRY-sPECIFIC COVERAGE 126
Annex 6.1: Pension projection reporting sheet 141
7. Health care 145
7.1. BACkGROUND 145
9
7.2. CAPtURING tHE VARIOUs DEMOGRAPHIC AND NON-DEMOGRAPHICDRIVERs OF sPENDING: sIX DIFFERENt tYPEs OF sCENARIOs 146
7.2.1. Pure demographic scenario 146
7.2.2. High life expectancy scenario 147
7.2.3. Constant health scenario consideringimprovements in the health status of elderly citizens 148
7.2.4. Death-related costs scenario 149
7.2.5. Income elasticity scenario 151
7.2.6. labour intensity scenario 151
7.2.7. EU12 cost convergence scenario 152
7.3. DAtA sOURCEs 152
8. long term Care 155
8.1. sHORt OVERVIEw OF tHE PROjECtION MEtHODOlOGY 155
8.2. sCENARIOs CARRIED OUt IN tHE PROjECtION EXERCIsE 157
8.2.1. Pure demographic scenario 157
8.2.2. High life expectancy scenario 158
8.2.3. Constant disability scenario 158
8.2.4. Demand-driven spending scenario 158
8.2.5. scenario assessing the effect of a shift from informal to formal care 158
8.2.6. labour market / family structure scenario 158
8.2.7. scenario assessing the budgetary effectof a convergence in formal care coverage 159
8.3. DAtA sOURCEs 159
8.3.1. Public expenditure on long-term care 159
8.3.2. spending on home vs. institutional care 160
8.3.3. Public spending on cash benefits 161
8.3.4. Disability rate 163
9. Education 165
9.1. PROjECtING EDUCAtION EXPENDItURE 165
9.2. DElIMItAtION OF tHE PROjECtIONs 165
9.3. PROjECtION MEtHODOlOGY 166
9.3.1. the base year 167
9.3.2. Methodology used in education projections 169
9.4. DAtA sOURCEs 170
Annex 9.1: Organisational structure of secondary education 172
10. Unemployment benefits 175
10.1. BUIlDING ON tHE MEtHODOlOGY UsED IN tHE 2006 PROjECtION 175
10.2. PROjECtION MEtHODOlOGY FOR UNEMPlOYMENt BENEFIts 175
Annex 10.1: Methodology for projecting unemployment benefits 177
stAtIstICAl ANNEX 179
REFERENCEs 211

10
lIst OF tABlEs
tABlE 0.1 – 2009 and 2006 projections compared, demographic assumptions 22
tABlE 0.2 – 2009 and 2006 projections compared, population projections 23
tABlE 0.3 – 2009 and 2006 projections compared, labour force projections 24
tABlE 0.4 – 2009 and 2006 projections compared, economic growth projections 25
tABlE 1.1 – Past trends in fertility rates, 1950-2006 30
tABlE 1.2 – Projection of fertility rates in EUROPOP2008 31
tABlE 1.3 – Past trends in life expectancy at birth, 1950-2006 33
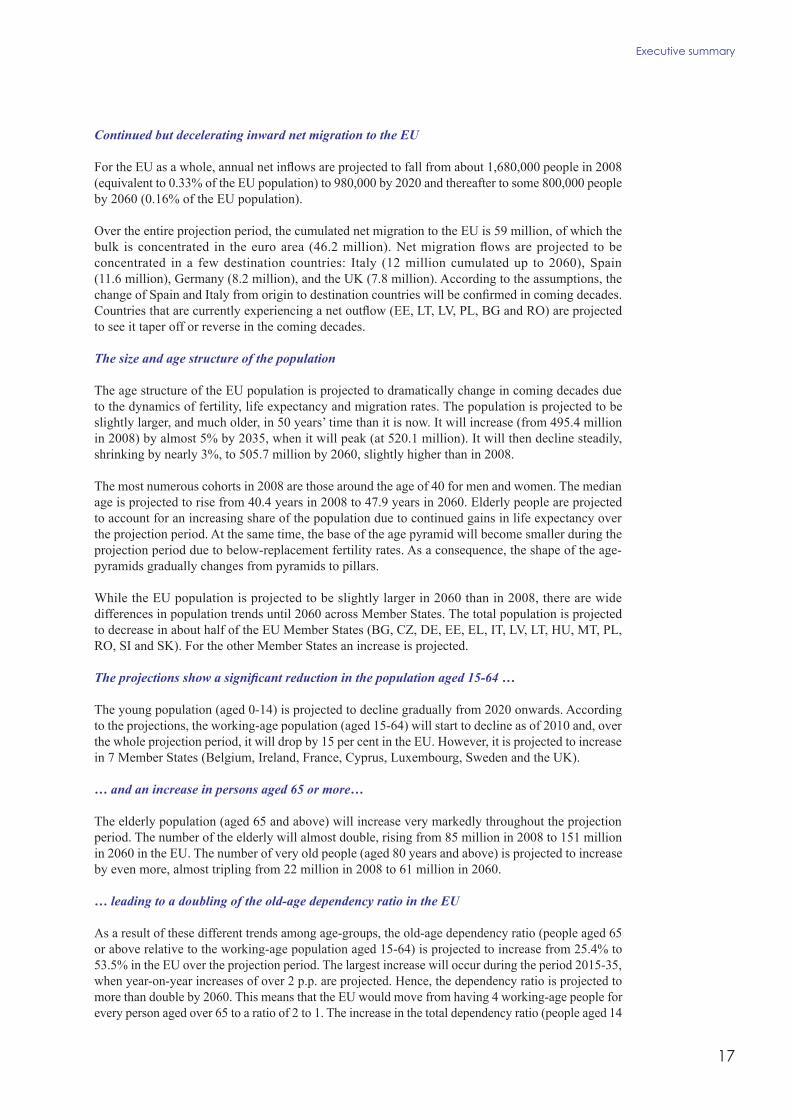
tABlE 1.4 – Projection of life expectancy at birth in EUROPOP2008 34
tABlE 1.5 – Projection of life expectancy at 65 in EUROPOP2008 35
TABLE 1.6 – Past trends in net migration flows 38
TABLE 1.7 – Projection of net migration flows in EUROPOP2008 39
tABlE 1.8 – Projection of the total population (in millions) 40
tABlE 1.9 – Projection of young population aged 0-14 (in millions) 42
tABlE 1.10 – Projection of working age population aged 15-64 (in millions) 43
tABlE 1.11 – Projection of the elderly population aged 65 and over (in millions) 44
tABlE 1.12 – Projection of the very old population aged 80 and over (in millions) 45
tABlE 1.13 – Decomposition of the population by age-groups 46
tABlE 1.14 – Old age dependency ratio (65+/(15-64)) 47
tABlE 1.15 – Very old age dependency ratio (80+/(15-64)) 48
tABlE 1.16 – total age dependency ratio (0-14 plus 65+/(15-64)) 49
tABlE 1.17 – Population as a percentage of worldpopulation based on the 2006 UN revision 50
tABlE 1.18 – Old-age dependency ratio basedon the 2006 UN revision (65 and over/15-64) 50
tABlE 1.19 – Very old-age dependency ratio basedon the 2006 UN revision (80 and over/15-64) 51
tABlE 1.20 – total population compared (EUROPOP2008 – 2006 Ageing Report) (‘000) 52
tABlE 1.21 – working-age (15-64) population compared(EUROPOP2008 – 2006 Ageing Report) (‘000) 53
tABlE 1.22 – Population aged 0-14 compared(EUROPOP2008 – 2006 Ageing Report) (‘000) 54
tABlE 1.23 – Population aged 65 and over compared(EUROPOP2008 – 2006 Ageing Report) (‘000) 55
tABlE 1.24 – Old-age dependency ratio (persons aged 65 and over in relations to personsaged 15-64) compared (EUROPOP2008 – 2006 Ageing Report) (percentagepoints) 56
TABLE 1.25 – Net migration flows compared(EUROPOP2008 – 2006 Ageing Report) (‘000) 57
tABlE 2.1 – Historical participation rates: workers aged 15 to 64 60
tABlE 2.2 – Historical participation rates: young workers ages 15 to 24 61
tABlE 2.3 – Historical participation rates: prime age workers aged 25 to 54 62
tABlE 2.4 – Historical participation rates: older workers aged 55 to 64 63
tABlE 2.5 – Estimated impact of pension reform on participation rates (2020, 2060), inpercentage points (comparison of projections with and without incorporatingrecent pension reforms) 73
tABlE 2.6 – Projected changes in participation rates 75

11
tABlE 2.7 – Projected changes in participation rates by age-groups, 2007-2060 76
tABlE 2.8 – labour supply projections, 2007-2060 (age group: 15 to 64) 79
tABlE 2.9 – Contribution to the overallchange in participation rates, 2007-2060 (changes in %)* 80
tABlE 2.10 – Contribution to the overallchange in labour force, 2007-2060 (changes in %)* 81
tABlE 2.11 – Unemployment rate assumptions (age 15-64, in percentage) 83
tABlE 2.12 – Employment rate projections 2007-2060 (15-64) 84
tABlE 2.13 – Employment projections, 2007-2060 (15-64) 85
tABlE 2.14 – Employment rate projections by age and sex, 2007-2060 (15-64) 86
tABlE 2.15 – Employment composition, 2007-2060 88
tABlE 2.16 – share of older workers (labour force aged55 to 64 as a percentage of the labour force aged 15 to 64) 90
tABlE 2.17 – Effective economic old-age dependency ratio(inactive population aged 65 and above as a percentageof employed population aged 15 to 64) 91
tABlE 2.18 – total economic dependency ratio (total inactive population as a percentageof employed population aged 15 to 64 and 15 to 71) 92
tABlE 2.19 – Hours worked projections, 2007-2060 (15-71) 93
tABlE 2.20 – labour force projections, 2009 projection, 2007-2050 94
tABlE 2.21 – labour force projections,2009 projection – 2006 projection, 2007-2050 95
tABlE 3.1 – Potential GDP per capita in 2007 102
tABlE 3.2 – Assumptions on speed of convergence and criteria for selection 103
tABlE 3.3 – Projected potential growth rates(based on the underlying assumptions used in the projection exercise (annualaverage growth rates) 104
tABlE 3.4 – Determinants of potential growth rates:labour productivity per hour (annual average growth rates) 105
tABlE 3.5 – Determinants of potential growth rates:labour input – total hours worked (annual average growth rates) 105
tABlE 3.6 – Determinants of labour productivity:total Factor Productivity (annual average growth rates) 106
tABlE 3.7 – Determinants of labour productivity:capital deepening (contribution in p.p.) 106
tABlE 3.8 – Projected GDP per capita growth rates (period averages) 107
tABlE 3.9 – Decomposition of GDP growth, 2007-2060 108
tABlE 3.10 – 2009 and 2006 projections compared,2004-2050 (2009 projection minus 2006 projection), % points 109
tABlE 4.1 – Average of real long-term interest rates (1961-2007) (%) 111
tABlE 5.1 – Overview of sensitivity tests:difference in assumptions compared with the baseline scenario 113
tABlE 5.2 – sensitivity tests: higher employment rate of older workers 114
tABlE 5.3 – sensitivity tests: higher employment rate 115
tABlE 5.4 – sensitivity tests: higher productivity growth 116
tABlE 5.5 – sensitivity tests: Higher life expectancy 117
tABlE 5.6 – sensitivity tests: zero migration 118
tABlE 6.1 – Overview of the pension systems in Member states 127
TABLE 6.2 – Coverage and specification ofpension schemes in the 2009 projections 135

12
tABlE 7.1 – Overview of different scenarios to project health care expenditure 146
tABlE 8.1 – Overview different scenarios to project long-term care expenditure 157
tABlE 8.2 – suggested correspondence between EssPROs and sHA items 162
tABlE 9.1 – theoretical starting and ending age for level education 166
lIst OF GRAPHs
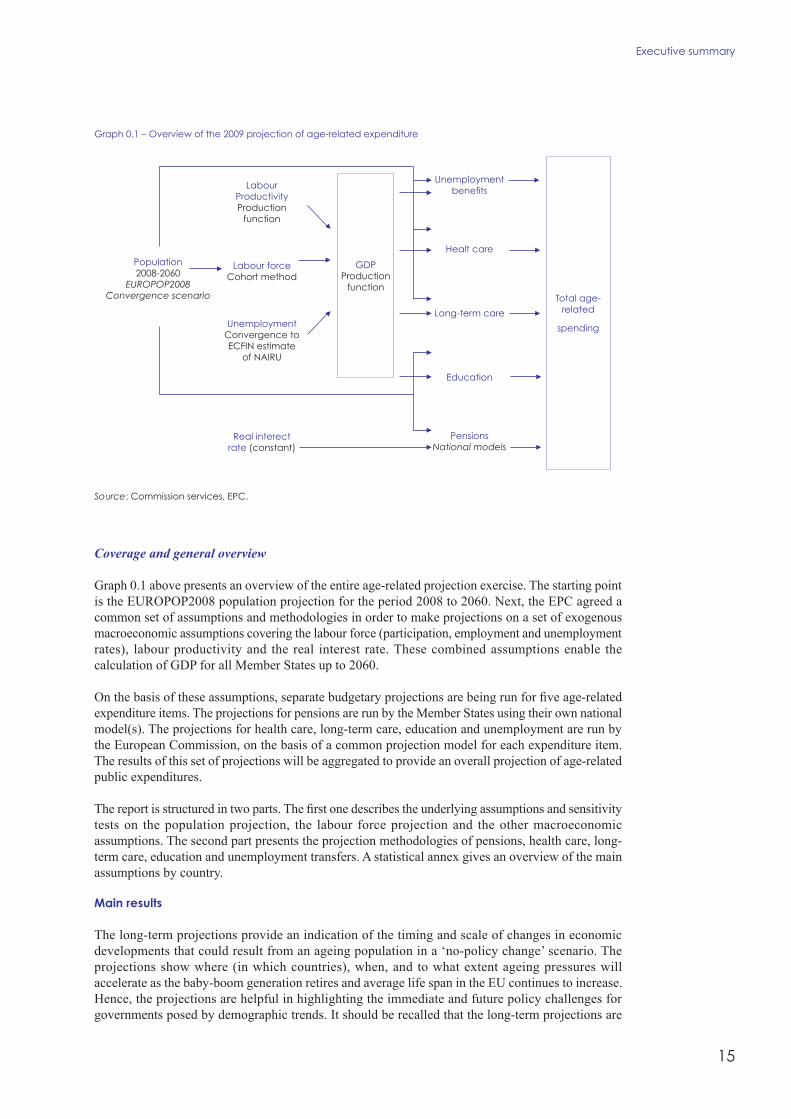
GRAPH 0.1 – Overview of the 2009 projection of age-related expenditure 15
GRAPH 1.1 – Net migration flows, 1965-2007 36
GRAPH 1.2 – Population pyramids (in thousands), EU27/EA, in 2008 and 2060 41
GRAPH 2.1 – Impact of pension reforms onthe average exit age from the labour force 72
GRAPH 2.2 – Participation rates and employment ratesby age profile and by sex in 2007 and 2060 – EU27 74
GRAPH 2.3 – Participation rates and employment ratesby age profile and by sex in 2007 and 2060 – EA 74
GRAPH 2.4 – labour force projections, 2007-2060(percentage change of total people aged 15 to 64) 78
GRAPH 3.1 – Overview of the production function 100
GRAPH 8.1 – Model structure 156
GRAPH 9.1 – Age of pupils at the end of full-time compulsory education,and the structure of lower secondary education, 2002/2003 173
GRAPH 9.2 – Implicit decomposition of expenditure per student 174
GRAPH 9.3 – schematic presentation of the underlying methodology 174

13
Executive summary
EXECUtIVE sUMMARY
overvieW of the 2009 projection of Age-relAted expenditure
the mandate and broad principles
In 2006, the ECOFIN Council gave the Economic Policy Committee (EPC) a mandate to update andfurther deepen its common exercise of age-related expenditure projections by the autumn of 2009 onthe basis of a new population projection to be provided by Eurostat (the EUROPOP2008 demographicprojection was released in April 2008).
The new projection exercise follows those carried out in 2001 and 2006.1 The age-related expenditureprojections feed into a variety of policy debates at EU level. In particular, they are used in the annualassessment of the sustainability of public finances carried out as part of the Stability and GrowthPact; in the context of the open method of co-ordination on pensions; and, in the analysis on theimpact of ageing populations on the labour market and potential growth which is of great relevancefor the Lisbon strategy and the Integrated Guidelines.
This report provides a description of underlying macroeconomic assumptions and projectionmethodologies of the age-related expenditure projections for all Member States. On the basis of theseunderlying assumptions and methodologies, age-related expenditures covering pensions, health care,long-term care, education and unemployment transfers will be calculated and presented to theECOFIN Council in May 2009.
In light of this mandate, the EPC developed a work programme establishing the broad arrangementsfor organising the budgetary projection exercise and for reaching agreement on the assumptions andmethodologies. To this end, it was agreed that the projections should be made on the basis of ademographic projection by Eurostat and common macroeconomic assumptions to be agreed in theEPC, which would be used for the projection of all age-related expenditure items. It was also agreedthat the projections should be made on the basis of a ‘no policy change’ assumption, i.e. reflectingonly enacted legislation but not possible future policy changes.
The work has been carried out by the EPC Working Group on Ageing Populations (AWG) and theCommission (Directorate-General for Economic and Financial Affairs – DG ECFIN) with a view toupdate and further improve the previous projection exercises so as to enhance comparability acrosscountries, consistency across expenditure items and the economic basis for the underlyingassumptions. The work has been guided by the agreed principles of simplicity, comparability,consistency, prudence and transparency. The EPC endorsed the progress report by the AWG, outliningthe progress and agreements reached.2
Participation in the budgetary projection exercise and working method
The work has been prepared by experts from 27 Member States, Norway, and the Commission(represented by DG ECFIN, the Directorate-General for Economic and Financial Affairs). DG ECFINhas provided analysis and calculations. The European Central Bank, the OECD and IMF have also
1 The 2001 projections on pension, health care and long-term were published in DG ECFIN (2001), ‘Budgetary challengesposed by ageing populations’, Note for the attention of the EPC, EPC/ECFIN/655/01-EN of 24 October 2001. Theprojections on education and unemployment transfers were included in DG ECFIN (2003) ‘The impact of ageingpopulations on public finances: overview of analysis carried out at EU level and proposals for a future work programme’,Note for the attention of the AWG, EPC/ECFIN/407/04-rev.3-EN of 22 October 2003. The 2006 projections were publishedin Economic Policy Committee and European Commission (2006), ‘The impact of ageing on public expenditure:projections for the EU25 Member States on pensions, health care, long-term care, education and unemployment transfers(2004-2050)’, European Economy, Special report, No.1/2006.2 See ‘The 2009 budgetary projection exercise of the Ageing Working Group: Second progress report to the EPC’, ECFIN/CEFCPE(2008)REP/ 52951 rev, Brussels, 23/06/2008.

14
European Economy 7/2008the 2009 Ageing Report: Underlying assumptions and projection methodologies for the EU-27 Member states
contributed. Eurostat has played a central role by preparing a population projection. Other Commissionservices have also been associated with the work, especially the Directorate-General for Employment,Social Affairs and Equal Opportunities and the Directorate-General for Health and ConsumerProtection. The EPC and its AWG have coordinated the work with other Council formations, inparticular the Social Protection Committee and the EFC.
In the preparation of the population projection, Eurostat actively consulted national statisticalinstitutes in the Member States.3
Approach to agreeing on the underlying assumptions and specific adjustments
The EPC adopted the following approach to reach agreement on the underlying exogenousassumptions and on the projection methodologies to use:
• a survey of the economic literature was carried out to identify best practices in internationalorganisations and national authorities in making long-run budgetary projections. This has mostlybeen done on the basis of contributions from DG ECFIN and AWG members;
• on issues where specific expertise was required, a series of workshops was organised to whichexternal academics and experts were invited;4
• the EPC has reached agreement on underlying assumptions, projection methodologies andcoverage by consensus on the basis of proposals prepared by DG ECFIN. The underlyingassumptions have been made by applying common methodologies uniformly to all MemberStates. The projections were made sequentially. The approaches and assumptions used were thefollowing:
− a convergence approach for the demographic projection;
− a cohort approach for participation rates used in the labour force projection;
− an assumption of unchanged structural unemployment rates combined with an assumedreduction to the EU15 average for those with high structural unemployment rates initially;
− a production function approach for the potential GDP projection;
− an assumption of a constant real interest rate.
• given the uncertainty surrounding the assumptions underpinning long-run budgetary projections,a number of sensitivity tests will be carried out in addition to the baseline, so as to quantify theresponsiveness of projection results to changes in key underlying assumptions;
• before being finalised, the budgetary projections will be peer-reviewed in the AWG. This will bedone on the basis of country fiches provided by Member States describing the national pensionmodel(s) used to make the pension projection, an analysis of the projection results and otherrelevant information on data sources and institutional factors which could be driving the budgetaryprojections.
3 Through meetings of Eurostat’s Working Group on Population Projection and by using the “Population Projection”Interest Group on CIRCA.4 Workshops on ‘Data issues in health care and long-term care expenditure projection’s and ‘Methodology to project healthcare and long-term care expenditure’ were held on 18 April and 4 October 2007, respectively.
15
Executive summary
Coverage and general overview
Graph 0.1 above presents an overview of the entire age-related projection exercise. The starting pointis the EUROPOP2008 population projection for the period 2008 to 2060. Next, the EPC agreed acommon set of assumptions and methodologies in order to make projections on a set of exogenousmacroeconomic assumptions covering the labour force (participation, employment and unemploymentrates), labour productivity and the real interest rate. These combined assumptions enable thecalculation of GDP for all Member States up to 2060.
On the basis of these assumptions, separate budgetary projections are being run for five age-relatedexpenditure items. The projections for pensions are run by the Member States using their own nationalmodel(s). The projections for health care, long-term care, education and unemployment are run bythe European Commission, on the basis of a common projection model for each expenditure item.The results of this set of projections will be aggregated to provide an overall projection of age-relatedpublic expenditures.
The report is structured in two parts. The first one describes the underlying assumptions and sensitivitytests on the population projection, the labour force projection and the other macroeconomicassumptions. The second part presents the projection methodologies of pensions, health care, long-term care, education and unemployment transfers. A statistical annex gives an overview of the mainassumptions by country.
Main results
The long-term projections provide an indication of the timing and scale of changes in economicdevelopments that could result from an ageing population in a ‘no-policy change’ scenario. Theprojections show where (in which countries), when, and to what extent ageing pressures willaccelerate as the baby-boom generation retires and average life span in the EU continues to increase.Hence, the projections are helpful in highlighting the immediate and future policy challenges forgovernments posed by demographic trends. It should be recalled that the long-term projections are
Graph 0.1 – Overview of the 2009 projection of age-related expenditure
Source: Commission services, EPC.
Population2008-2060
EUROPOP2008Convergence scenario
GDPProduction
functiontotal age-
related
spending
Unemploymentbenefits
Healt care
long-term care
Education
PensionsNational models
labourProductivityProduction
function
labour forceCohort method
UnemploymentConvergence toECFIN estimate
of NAIRU
Real interectrate (constant)

16
European Economy 7/2008the 2009 Ageing Report: Underlying assumptions and projection methodologies for the EU-27 Member states
not forecasts, they are subject to increasing uncertainty over time, and the results are stronglyinfluenced by the underlying assumptions. Moreover, given the current juncture characterized by thefinancial and economic crisis, there is also considerable additional uncertainty concerning themedium-term economic developments.
demographic projections
Changes in the size and age profile of the population depend upon assumptions regarding fertilityrates, life expectancy and migration.
Fertility rates rise slightly and life expectancy continues to increase
The convergence scenario approach employed in the EUROPOP2008 projection entails a process ofconvergence of fertility rates across Member States to that of the forerunners over the very long-termprojection period. For the EU, the total fertility rate (TFR) is projected to rise from 1.52 in 2008 to1.57 by 2030 and 1.64 by 2060. In the euro area, a similar increase is projected, from 1.55 in 2008to 1.66 in 2060.
The fertility rate is projected to increase over the projection period in all Member States exceptIreland and France (where it will nevertheless remain above 1.85), while in Denmark, Finland,Sweden and the UK it is projected to remain stable. In all countries the fertility rate will remain belowthe natural replacement rate of 2.1. The largest increases in fertility rates are projected to take placein Slovakia, Poland and Lithuania which have the lowest rates in the EU in 2008. The increase isprojected to occur gradually, approaching the current EU average rates only in 2060.
Further life expectancy gains projected
In the EU, life expectancy at birth for males is projected to increase by 8.5 years over the projectionperiod, from 76 in 2008 to 84.5 in 2060. For females, life expectancy at birth is projected to increaseby 6.9 years for females, from 82.1 in 2008 to 89 in 2060, implying a narrowing gap between malesand females life expectancy.
The largest increases in life expectancy at birth, for both males and females, are projected to takeplace in the new Member States. Life expectancy for males in 2008 is lowest in Estonia, Latvia,Lithuania, Hungary, Slovakia, Poland, Bulgaria and Romania, at between 66 and 71 years. Somecatching-up will take place over the projection period, as life expectancy in these countries increasesby more than 10 years – a bigger increase than in the rest of the EU. Overall however, life expectancyat birth is projected to remain below the EU average in all new Member States except Cyprusthroughout the projection period, especially for males. This reflects a convergence of life expectancy.Still, by 2060 the life expectancy for many of these countries remains below the average in the EU.
The projection compresses the spread across the Member States of life expectancy at birth for males,from 13.1 years in 2008 (from a high of 79 in Sweden to a low of 65.9 in Lithuania) to 5 years in2060 (85.5 in Italy compared with 80.4 in Lithuania). For females, there is less of a reduction in thedifferential in life expectancy at birth, from 7.7 years in 2008 (84.3 in France to 76.6 in Romania) to4.1 years in 2060 (90.1 in France to 86.5 in Bulgaria).
In the EU, life expectancy at age 65 is projected to increase by 5.4 years for males and by 5.2 yearsfor females over the projection period. In 2060, life expectancy at age 65 will reach 21.8 years formales and 25.1 for females. The projected difference between males and females in 2060 is 3.3 years,less than the 4.5 year difference in life expectancy at birth.
17
Executive summary
Continued but decelerating inward net migration to the EU
For the EU as a whole, annual net inflows are projected to fall from about 1,680,000 people in 2008(equivalent to 0.33% of the EU population) to 980,000 by 2020 and thereafter to some 800,000 peopleby 2060 (0.16% of the EU population).
Over the entire projection period, the cumulated net migration to the EU is 59 million, of which thebulk is concentrated in the euro area (46.2 million). Net migration flows are projected to beconcentrated in a few destination countries: Italy (12 million cumulated up to 2060), Spain(11.6 million), Germany (8.2 million), and the UK (7.8 million). According to the assumptions, thechange of Spain and Italy from origin to destination countries will be confirmed in coming decades.Countries that are currently experiencing a net outflow (EE, LT, LV, PL, BG and RO) are projectedto see it taper off or reverse in the coming decades.
The size and age structure of the population
The age structure of the EU population is projected to dramatically change in coming decades dueto the dynamics of fertility, life expectancy and migration rates. The population is projected to beslightly larger, and much older, in 50 years’ time than it is now. It will increase (from 495.4 millionin 2008) by almost 5% by 2035, when it will peak (at 520.1 million). It will then decline steadily,shrinking by nearly 3%, to 505.7 million by 2060, slightly higher than in 2008.
The most numerous cohorts in 2008 are those around the age of 40 for men and women. The medianage is projected to rise from 40.4 years in 2008 to 47.9 years in 2060. Elderly people are projectedto account for an increasing share of the population due to continued gains in life expectancy overthe projection period. At the same time, the base of the age pyramid will become smaller during theprojection period due to below-replacement fertility rates. As a consequence, the shape of the age-pyramids gradually changes from pyramids to pillars.
While the EU population is projected to be slightly larger in 2060 than in 2008, there are widedifferences in population trends until 2060 across Member States. The total population is projectedto decrease in about half of the EU Member States (BG, CZ, DE, EE, EL, IT, LV, LT, HU, MT, PL,RO, SI and SK). For the other Member States an increase is projected.
The projections show a significant reduction in the population aged 15-64 …
The young population (aged 0-14) is projected to decline gradually from 2020 onwards. Accordingto the projections, the working-age population (aged 15-64) will start to decline as of 2010 and, overthe whole projection period, it will drop by 15 per cent in the EU. However, it is projected to increasein 7 Member States (Belgium, Ireland, France, Cyprus, Luxembourg, Sweden and the UK).
… and an increase in persons aged 65 or more…
The elderly population (aged 65 and above) will increase very markedly throughout the projectionperiod. The number of the elderly will almost double, rising from 85 million in 2008 to 151 millionin 2060 in the EU. The number of very old people (aged 80 years and above) is projected to increaseby even more, almost tripling from 22 million in 2008 to 61 million in 2060.
… leading to a doubling of the old-age dependency ratio in the EU
As a result of these different trends among age-groups, the old-age dependency ratio (people aged 65or above relative to the working-age population aged 15-64) is projected to increase from 25.4% to53.5% in the EU over the projection period. The largest increase will occur during the period 2015-35,when year-on-year increases of over 2 p.p. are projected. Hence, the dependency ratio is projected tomore than double by 2060. This means that the EU would move from having 4 working-age people forevery person aged over 65 to a ratio of 2 to 1. The increase in the total dependency ratio (people aged 14

18
European Economy 7/2008the 2009 Ageing Report: Underlying assumptions and projection methodologies for the EU-27 Member states
and below and aged 65 and above relative to the population aged 15-64) is also large, rising by a twothirds.
labour force projections
Projected increases in overall participation rates…
The overall participation rate (for the age group 15 to 64) in the EU27 is projected to increase by3.5 percentage points over the period 2007-2060 (from 70.6% in 2007 to 74.1% in 2060). For theeuro area, a similar increase is projected, (from 70.8% in 2007 to 74.5% in 2060). For the age-group15-71, the current and projected participation rates as well as the increase are smaller. Almost all ofthe increase is projected to materialise in the period to 2020.
The biggest increase in participation rates is projected for older workers5 (around 20 percentagepoints for females and 10 p.p. for males) in the EU27, and a slightly higher increase in the euro area(22 p.p. for females and 13 p.p. for males). As a result of these dynamics, the gap between male andfemale participation rates is projected to gradually narrow, especially in countries with a large gapin 2007.
… but labour supply will decline because of the projected population trends
The overall labour force (aged 15 to 71) in the EU27 is projected to increase by 3.7% from 2007 to2020. In terms of numbers, this means an increase in the labour force of roughly 8.6 million. In theeuro area, an increase of almost 5% is projected.
The increase in labour supply over the period 2007 to 2020 is mainly due to the increase in femalelabour supply, while the male labour force is projected to remain substantially unchanged. However,the positive trend in female labour supply is projected to reverse during the period 2020-2060 and,as male labour supply drops too, the overall labour force is expected to decrease by as much as 13.6%,equivalent to around 33 million people (24.4 million if compared with the level in 2007) in the EU.In the euro area, the projected fall in labour supply between 2020 and 2060 is 12.6%, which translatesinto 20.4 million people (13 million if compared with the level in 2007).
In the first part of the projection (from 2007 to 2020), a majority of EU countries (excluding DK,NL, FI, CZ, EE, LT, LV, PL, SI, BG, RO), are projected to record an increase in labour supply. Thistrend is projected to reverse in the second part of the projection period (from 2020 to 2060), whenmost countries are projected to record a decrease, except for CY (+19.8%), LU (+19.5%), IE (+11%),FR (+3.1%), SE (+2.2%) and the UK (+9.2%). As already mentioned, the projected negative labourforce growth over the period 2020-2060 in the EU can be ascribed almost exclusively to negativedemographic developments, given that the participation rates over the period 2020-2060 are projectedto continue to increase, albeit at a slower pace than during 2007-2020.
Assumptions on unemployment
The general assumption on unemployment was the projection that the NAIRU (structuralunemployment rate) should remain unchanged over the projection period. To avoid extrapolatingforward high levels of NAIRU for countries which are still above the estimated medium-term EU15average of the NAIRU (6.2%)6 (Belgium, Germany, Greece, Spain, France, Portugal, Hungary, Maltaand Slovakia), the EPC agreed that these countries should converge to this average in the period upto 2020. Overall, a reduction in the EU unemployment rate of around 1 ½ percentage points isprojected (from 7.2% in 2007 to 5.7% in 2020). A fall of a similar magnitude is projected for the euroarea (from 7.5% in 2007 5.9% in 2020).
5 Age group 55-64.6 Based on the spring 2008 economic forecast by DG ECFIN.

19
Executive summary
Employment projections
Given the population projection, the unemployment rate assumptions and the labour force projection,the overall employment rates (of people aged 15 to 64) in the EU are projected to increase from65.5% in 2007 to 66.6% in 2010, 69% in 2020, and almost 70% in 2060. In the euro area, a similardevelopment is projected and employment will surpass 70% at the end of the projection period.
The employment rate of females is projected to rise from 58.4% in 2007 to 63.4% in 2020 and to 65.1%in 2060. The employment rate for older workers (55-64) will increase even more, from 44.9% in 2007to 54.5% in 2020 and further to 59.8% in 2060. For the euro area, the increase in the employment rateof older workers (55-64) is higher than in the EU, rising by 17.7 p.p. compared with 14.9 p.p. in theEU. The older workers employment rate in 2060 is projected to be 60.3% in the euro area.
The number of people employed (according to the European Labour Force Survey definition) isprojected to record an annual growth rate of only 0.4% over the period 2007 to 2020, which willreverse to a negative annual growth rate of a similar magnitude in the subsequent period 2020 to 2060.As a result of these opposite trends, the overall employment in the EU is projected to shrink by about19.4 million people over the period 2007 to 2060. Rises in immigration levels in some countries andincreases in labour force participation rates moderate the fall in employment owed to the ageing ofthe population and the negative population growth projected for the period 2020 to 2060.
Projection of labour input (total hours worked)
Compared with the projections in the 2006 Ageing Report, the definition of labour input has beenchanged from number of employees to number of hours worked so as to ensure consistency with thecommonly agreed production function used to calculate potential GDP growth and output gaps forthe purpose, inter alia, of estimating cyclically adjusted budget balances (CABs) in the context of theEuropean Commission’s multilateral budgetary surveillance.
The population projection, unemployment rate assumptions, labour force projection, projectedemployment rates (of people age 15 to 71) and assumptions on changes in hours worked per person,result in a projection of total hours worked in the EU Member States.
Total hours worked are projected to increase by 5.4% in the period to 2020 in the EU. However, from2020 onwards the situation is projected to reverse and they will fall by 12.9% between 2020 and2060. Over the entire projection period, total hours worked are projected to fall by 8.2% in the EU.For the euro area, the projected fall is less marked (-5.7% between 2007 and 2060). In terms of annualaverage growth rates, hours worked are projected to fall by 0.2% over 2007-2060 in the EU and by0.1% in the euro area. These trends in hours worked reflect the projected employment trends and alsoa composition effect, namely the increasing number of employed persons working part-time, whichwill cause average hours worked per person to change over time.
There are major differences between the Member States. A reduction in the labour input (hoursworked) of 20% or more between 2007 and 2060 is projected for BG, CZ, DE, EE, LV, LT, HU, PL,RO, SI and SK. In contrast, for some other Member States (BE, IE, ES, FR, CY, LU, SE and the UK)an increase is projected over the same period.
Macroeconomic assumptions: labour productivity and potential growth rates
Total Factor Productivity drives labour productivity growth in the long-term
In the long run, the growth in labour productivity (output per hour worked) broadly coincides withTFP growth divided by the labour share (set at 0.65). The EPC has agreed on the following prudentassumption for TFP growth: country-specific TFP growth rates will converge to a long-term historicalaverage TFP growth rate recorded in the EU, of 1.1%; this rate is close to that experienced in the US,the world’s leading economy.

20
European Economy 7/2008the 2009 Ageing Report: Underlying assumptions and projection methodologies for the EU-27 Member states
However, the speed of convergence to this growth rate was assumed to be determined by the relativeincome position in the different Member States. Specifically, it was assumed that the lower the GDPper capita at present, the higher the real catching-up potential, which is assumed to materialise via aperiod of higher TFP growth.
Markedly lower potential growth rates projected for the EU
The annual average potential GDP growth rate in the EU is projected to decline sharply, from 2.4%in the period 2007 to 2020, to 1.7% in the period 2021-30 and to 1.3% in the period 2041-2060. Overthe whole period 2007-2060, output growth rates in the euro area are very close to those in the EU27,as the former represents more than 2/3 of the EU27 total output. Notwithstanding this, the potentialgrowth rate in the euro area at the beginning of the projection period (up to the 2020s) is lower thanfor the EU27 and the decline is therefore less sharp.
While all EU Member States are projected to experience a more or less marked slowdown in theirpotential growth rates in the future owing to the adverse impact of demographic developments,growth rates differ substantially from country to country.
The sources of economic growth are also projected to change
For the EU27, productivity growth is projected to remain fairly stable throughout the projectionperiod at close to 1.7%. The small increase in the growth rate up to the 2030s is due to the assumedhigher productivity growth rate in the catching up Member States, which is eventually assumed toconverge to the 1.7% growth rate by 2050. Since the starting point of productivity growth in the euroarea is below the assumed long-term EU average of 1.7% annual growth, this leads to a higherassumed increase in productivity growth up to the 2030s. Over time, labour productivity will becomethe key driver of growth in the EU.
Labour input in the EU and in the euro area is projected to increase up to the 2020s. Thereafter, thedemographic changes, with a reduction in the working-age population, are projected to act as a dragon growth in both the EU and the euro area.
In the first half of the projection period, productivity growth is the main source of the discrepancyacross countries, reflecting different productivity growth rates at the outset of the projection and thedifferentiation of assumed productivity growth rates according to the catching-up potential. In thelatter part of the projection period, developments in labour input have a dominant role in the divergentpattern, due to different demographic developments and the mechanical effect of productivity growthconvergence.
comparison with the previous 2006 long-term budgetary projection exercise
The EU’s population in 2008 is larger than was projected in the 2006 Ageing Report. By 2050, thepopulation is projected to have grown again, by about 37 million. The higher population in 2050 isconcentrated in the working-age population (15-64), although all age brackets will increase innumber.
As regards fertility rates, they were slightly higher in 2008 than in 2004 in the EU25, and are nowprojected to increase again by 2050 – by 0.1, a marginally lower increase than projected in the 2006exercise. The gain in life expectancy is now projected to be slightly higher than in the previous 2006exercise, rising by 6.8 years for males and 5.6 years for females in the EU25 by 2050, compared with5.6 and 4.7 years, respectively, in the previous exercise. Life expectancy in the EU25 in 2050 is nowprojected to be 1.5 years higher for males at 83.3 and 1.2 years higher for females at 88.1. As a resultof recent observed increases in net migration inflows to the EU, especially in some Member States(ES, IT, UK), net migration flows are projected to be significantly higher in EUROPOP2008 in theEU, although for some Member States (DE, NL, EE, LT, LV, MT, PL, and SI) net migration flowsare projected to be lower than projected in 2006. Overall, net migration inflow into the EU is projected

21
Executive summary
to be about 785 000 higher in 2010 than in the previous projection, and to gradually be reduced toabout 90 000 higher in 2050. Overall, EU net inward migration is projected to be 12.6 million higherand therefore constitutes about one third of the higher total population projected in EUROPOP2008by 2050.
As a result, the increase in the old-age dependency ratio in the EU25 (65+ year olds relative to over15-64 year-olds) is lower in the EUROPOP2008 projection and rising less; by 24.6 percentage pointsbetween 2008 and 2050 according to EUROPOP2008 (by 25.8 percentage points in the previousprojection over the same period). Due to the diverging assumptions, the projected increase in the old-age dependency ratio is significantly lower in UK, ES, PT, CY, IE,AT, EL, BE and IT and significantlyhigher in MT, LV, LT, SK, PL, NL, DE, SI, EE (in descending order).
In the EU25, the participation rate (15-64) is now projected to increase at virtually the same pace asin the 2006 projection up to 2050, by 4 p.p. The structural unemployment rate in was estimated to belower in 2007 (7.3%) than in the 2006 projection, but the decrease in the unemployment rate up to2050 is projected to be smaller in the current projection. Accordingly, the employment rate is higherin 2007 in the current projection exercise, but is projected to increase less over the projection period,but still surpassing 70% in 2050.
The updated projection reveals that annual average potential GDP growth over the period 2004-2050in the EU25 is projected to be 1.8%, compared with 1.7% in the 2006 projection. The higher averagegrowth rate in the EU25 can be attributed to a more favourable demographic outlook in the currentexercise (higher growth in the total population and a less adverse population composition effect),which is partly offset by a worse employment outlook. The projected average annual productivitygrowth is 1.8%, similar to the previous (2006) projection.
There are however marked differences at the Member State level. Greece, Spain and Portugal areprojected to have higher average GDP growth (by 0.4-0.6 p.p.). In the case of Greece this is due tohigher labour productivity growth, following from the assumption of a higher degree of realconvergence over the long term. For Spain and Portugal, the more favourable growth outlook is dueto a more benign demographic outlook. In GDP per capita growth terms, the difference in growthrates between the two projection exercises is smaller, especially for Spain and Portugal.
By contrast, some other countries (Latvia, Lithuania and Malta) are projected to have lower annualaverage GDP growth, by 0.4-0.6 p.p. For Latvia and Lithuania, this is due to a downward revisionof productivity growth over the medium term, while in the case of Malta it is due to lower labourinput growth following from less favourable demographic prospects (which is true also for Lithuaniaand Latvia, albeit to a lesser degree).

22
European Economy 7/2008the 2009 Ageing Report: Underlying assumptions and projection methodologies for the EU-27 Member states
tab
le0.
1–
2009
an
d20
06p
roje
ctio
ns
co
mp
are
d,d
em
og
rap
hic
ass
um
ptio
ns
Proj
ectio
nex
erci
se20
09(E
UR
OPO
P200
8)Pr
ojec
tion
exer
cise
2009
-Pro
ject
ion
exer
cise
2006
Ferti
lity
rate
Life
expe
ctan
cyat
birth
Net
mig
ratio
n(1
000'
s)Fe
rtilit
yra
teLi
feex
pect
ancy
atbi
rthN
etm
igra
tion
(100
0's)
Mal
esFe
mal
esM
ales
Fem
ales
2008
2050
chan
ge20
0820
50ch
ange
2008
2050
chan
ge20
0820
50
cum
ulat
ed20
08-
2050as%oftotal
pop.
in20
0820
0820
50ch
ange
2008
2050
chan
ge20
0820
50ch
ange
2008
2050
cum
ulat
ed20
08-2
050
as%oftotalpop.
in20
08B
E1.
751.
780.03
76.7
83.1
6.5
82.3
87.8
5.5
5125
13.5
0.10
0.08
-0.0
20.3
0.8
0.6
-0.2
-0.5
-0.3
307
5.8
BG
1.38
1.52
0.14
69.7
79.6
9.9
76.7
84.9
8.2
-12
0.5
0.15
0.02
-0.13
-0.5
1.4
1.9
-0.1
2.3
2.4
10-1
3.1
CZ
1.33
1.49
0.16
73.9
81.6
7.7
80.2
86.5
6.4
2422
10.2
0.13
-0.0
1-0
.14
0.7
1.9
1.2
0.7
2.4
1.8
202
4.0
DK
1.85
1.85
0.00
76.4
82.9
6.5
81.0
87.2
6.2
106
6.0
0.08
0.05
-0.03
0.5
2.0
1.5
0.9
3.5
2.6
2-1
0.7
DE
1.34
1.49
0.15
77.3
83.6
6.3
82.6
88.0
5.4
160
136
8.4
-0.0
60.
040.
100.
51.
61.
10.
21.
10.
9-4
7-43
-1.5
EE
1.55
1.64
0.09
68.0
78.8
10.8
78.7
86.1
7.4
-10
-0.1
0.12
0.04
-0.0
81.
83.9
2.1
1.2
3.0
1.8
1-1
-1.7
IE1.
901.
88-0
.02
77.5
83.9
6.4
81.9
88.0
6.1
637
17.9
-0.0
10.
080.
091.
11.
50.
40.
51.
00.
547
-54.
1G
R1.
411.
540.13
77.4
83.6
6.1
82.6
87.6
5.1
4031
14.2
0.04
0.04
0.00
0.5
3.3
2.7
0.7
2.5
1.9
0-4
0.1
ES
1.39
1.52
0.13
77.4
83.7
6.3
83.9
88.6
4.8
623
135
22.8
0.05
0.12
0.07
0.1
2.3
2.2
-0.2
0.7
1.0
472
3412.3
FR1.
981.
94-0
.04
77.5
83.9
6.4
84.3
89.1
4.8
9970
6.0
0.10
0.09
-0.0
10.
41.
20.
80.
20.
0-0
.237
111.
8IT
1.38
1.52
0.14
78.5
84.3
5.8
84.2
89.0
4.8
260
193
17.1
0.02
0.12
0.10
0.4
0.7
0.3
0.4
0.2
-0.2
141
808.
6C
Y1.
451.
570.
1278
.284
.05.
881
.787
.55.
89
742
.80.
020.
070.
051.
12.
11.
00.3
2.4
2.1
32
14.9
LV1.36
1.50
0.14
66.0
78.1
12.2
76.7
85.2
8.5
-11
-0.3
-0.0
2-0
.10
-0.0
80.
63.8
3.3
0.0
2.7
2.7
1-2
-2.0
LT1.35
1.51
0.16
65.9
78.1
12.2
77.4
85.3
7.9
-21
-0.3
0.06
-0.0
9-0
.15
-1.2
2.6
3.8
-0.8
1.6
2.4
4-3
-1.9
LU1.
651.
710.
0676.3
83.2
6.8
81.2
87.3
6.1
43
33.1
-0.0
6-0
.09
-0.03
0.4
1.6
1.1
-0.9
0.6
1.5
20
7.5
HU
1.35
1.50
0.15
69.7
79.9
10.2
78.1
85.8
7.7
2018
8.4
0.04
-0.1
0-0
.14
0.1
1.8
1.7
0.5
2.4
1.9
5-2
1.1
MT
1.38
1.52
0.14
76.0
83.0
7.0
81.1
87.4
6.3
11
10.2
-0.1
5-0
.08
0.07
-1.1
1.2
2.3
-0.3
2.4
2.7
-2-2
-14.
7N
L1.
721.
760.
0477
.983.7
5.8
82.2
87.8
5.6
87
2.6
-0.03
0.01
0.04
1.1
3.5
2.4
1.0
4.2
3.2
-25
-24
-5.7
AT
1.41
1.54
0.13
77.4
83.6
6.2
82.9
88.1
5.2
3325
15.2
0.00
0.09
0.09
0.4
0.0
-0.4
0.1
0.4
0.3
94
4.4
PL1.
271.
440.
1771
.480
.79.3
79.9
86.7
6.8
-16
261.
00.
09-0
.16
-0.2
5-0
.11.
61.
70.
62.3
1.7
14-7
-0.1
PT1.36
1.51
0.15
75.8
82.7
6.9
82.4
87.7
5.3
5239
18.7
-0.1
4-0
.09
0.05
0.8
2.3
1.5
0.6
1.1
0.5
3124
12.4
RO
1.32
1.48
0.16
69.8
79.9
10.2
76.6
85.0
8.4
-613
1.2
0.00
-0.0
2-0
.02
0.5
2.3
1.9
0.5
3.0
2.5
84
3.2
SI1.32
1.48
0.16
74.7
82.2
7.5
81.9
87.6
5.7
63
8.3
0.10
-0.0
2-0
.12
1.3
2.4
1.1
1.0
2.4
1.4
0-4
-4.8
SK1.
251.43
0.18
70.9
80.2
9.3
78.7
85.9
7.2
46
3.9
0.08
-0.1
7-0
.25
0.4
2.5
2.1
0.3
2.5
2.2
61
1.6
FI1.
841.
840.
0076
.183.0
6.8
83.0
88.2
5.2
105
5.4
0.06
0.04
-0.0
2-0
.11.
11.
10.
51.
71.
23
-10.
4SE
1.85
1.85
0.00
79.0
84.3
5.4
83.1
88.3
5.1
4717
11.3
0.03
0.00
-0.03
0.2
1.0
0.9
0.2
1.8
1.5
22-5
0.8
UK
1.84
1.84
0.00
77.4
83.8
6.4
81.5
87.7
6.1
188
126
10.8
0.11
0.09
-0.0
20.
20.
90.
7-0
.21.
11.
266
283.5
NO
1.90
1.89
-0.0
178
.484
.15.
782
.988
.15.3
2210
12.6
EU
271.
541.
650.
1176
.183.2
7.0
82.1
87.9
5.8
1684
924
10.2
0.04
0.05
0.01
0.3
1.6
1.2
0.3
1.3
1.0
863
913.2
EA
1.53
1.64
0.10
77.5
83.7
6.2
83.4
88.5
5.1
1418
687
12.4
0.01
0.07
0.06
0.4
1.6
1.1
0.3
0.9
0.6
702
793.8
EA
121.
541.
640.
1077
.583.8
6.2
83.4
88.5
5.1
1402
676
12.3
0.01
0.07
0.06
0.4
1.6
1.1
0.3
0.8
0.6
701
823.8
EU
151.
591.
680.
0977
.583.8
6.2
83.1
88.3
5.3
1647
825
12.0
0.03
0.07
0.04
0.4
1.4
1.1
0.2
0.9
0.7
792
104
3.7
EU
101.30
1.47
0.16
71.2
80.6
9.4
79.4
86.4
7.0
4485
4.1
0.08
-0.1
1-0
.20
0.1
1.9
1.8
0.5
2.3
1.8
53-1
60.
5E
U25
1.55
1.65
0.10
76.5
83.3
6.8
82.5
88.1
5.6
1691
910
10.7
0.04
0.05
0.01
0.4
1.5
1.2
0.2
1.2
0.9
845
883.2
Sou
rce
:EU
RO
stA
t(E
UR
OPO
P200
8),C
om
miss
ion
serv
ice
s(D
GEC
FIN
),EP
C(A
wG
).

23
Executive summary
tab
le0.
2–
2009
an
d20
06p
roje
ctio
ns
co
mp
are
d,p
op
ula
tion
pro
jec
tion
s
Proj
ectio
nex
erci
se20
09(E
UR
OPO
P200
8)Pr
ojec
tion
exer
cise
2009
-Pro
ject
ion
exer
cise
2006
Tota
lpop
ulat
ion
Old
-age
depe
nden
cyra
tioTo
tald
epen
denc
yra
tioTo
talp
opul
atio
nO
ld-a
gede
pend
ency
ratio
2008
2050
%change
2008
2050
p.p
chan
ge20
0820
50p.
pch
ange
2008
2050
p.p
chan
ge20
0820
50p.
pch
ange
BE
10.7
12.2
14.4%
25.8
43.9
18.1
51.4
70.7
19.3
0.2
1.3
1.1
-0.2
-3.3
-3.1
BG
7.6
5.9
-22.5%
25.0
55.4
30.4
44.3
77.3
33.0
0.1
0.8
0.7
CZ
10.3
9.9
-4.4%
20.6
54.8
34.2
40.7
77.1
36.5
0.2
1.0
0.8
-0.1
0.0
0.0
DK
5.5
5.9
7.7%
23.6
41.3
17.7
51.6
68.8
17.2
0.0
0.5
0.4
0.1
-0.6
-0.7
DE
82.2
74.5
-9.4%
30.3
56.4
26.1
51.0
78.0
26.9
-0.6
-0.2
0.4
0.3
4.7
4.3
EE
1.3
1.2
-11.7%
25.2
47.2
22.0
47.0
72.1
25.1
0.0
0.1
0.0
0.3
4.1
3.7
IE4.
46.
547.9%
16.3
40.4
24.1
46.1
70.2
24.1
0.2
1.1
0.9
-0.6
-4.8
-4.2
GR
11.2
11.4
2.0%
27.8
57.0
29.2
49.1
80.7
31.6
0.0
0.8
0.8
0.2
-3.4
-3.6
ES
45.3
53.2
17.5%
24.1
58.7
34.5
45.4
82.8
37.4
1.1
10.4
9.3
-0.5
-6.9
-6.4
FR61
.971
.014.8%
25.3
44.7
19.4
53.4
74.4
20.9
0.9
5.3
4.5
0.0
-1.7
-1.6
IT59
.561
.22.9%
30.5
59.2
28.8
51.7
81.6
29.8
1.0
8.5
7.5
-0.3
-3.0
-2.6
CY
0.8
1.3
57.5%
17.7
37.7
20.0
42.7
62.1
19.4
0.0
0.3
0.2
-0.8
-5.5
-4.7
LV2.3
1.8
-20.5%
25.0
51.2
26.2
44.9
73.0
28.2
0.0
-0.1
-0.1
-0.1
7.1
7.2
LT3.4
2.7
-18.7%
23.0
51.1
28.1
45.3
72.2
26.9
0.0
-0.1
-0.1
-0.3
6.3
6.5
LU0.
50.
744.6%
20.9
37.8
16.9
47.8
64.5
16.7
0.0
0.1
0.0
-0.5
1.7
2.2
HU
10.0
9.1
-9.8%
23.5
50.8
27.3
45.3
73.2
27.9
0.0
0.1
0.1
-0.1
2.5
2.6
MT
0.4
0.4
1.0%
19.8
49.8
30.0
43.1
71.3
28.2
0.0
-0.1
-0.1
0.8
9.1
8.3
NL
16.4
16.9
3.1%
21.8
45.6
23.8
48.4
71.2
22.8
-0.1
-0.5
-0.4
0.5
5.0
4.5
AT
8.3
9.1
9.5%
25.4
48.3
22.9
48.1
71.5
23.4
0.1
0.9
0.8
-0.1
-4.1
-4.0
PL38.1
33.3
-12.7%
18.9
55.7
36.7
40.7
76.1
35.3
0.2
-0.4
-0.5
0.2
4.7
4.6
PT10
.611
.47.8%
25.9
53.0
27.0
48.7
75.8
27.1
0.0
1.4
1.5
0.1
-5.6
-5.7
RO
21.4
18.1
-15.3%
21.3
54.0
32.7
43.1
74.6
31.5
-0.1
1.0
1.1
SI2.
01.
9-7.2%
23.0
59.4
36.4
42.8
82.7
39.9
0.0
0.0
0.0
0.0
3.8
3.8
SK5.
44.
9-10.0%
16.6
55.5
38.9
38.4
75.3
37.0
0.0
0.1
0.1
0.0
4.8
4.8
FI5.3
5.4
2.8%
24.8
46.6
21.8
50.1
73.9
23.8
0.0
0.2
0.2
0.2
-0.1
-0.3
SE9.
210
.716.2%
26.7
41.9
15.2
52.2
69.5
17.3
0.1
0.5
0.4
0.0
1.0
1.1
UK
61.3
74.5
21.6%
24.3
38.0
13.7
50.7
65.4
14.7
0.8
10.2
9.4
-0.2
-7.1
-6.9
NO
4.7
5.9
24.5%
22.1
41.4
19.3
51.0
69.8
18.8
EU
2749
5.4
515.3
4.0%
25.4
50.4
25.0
48.7
75.0
26.4
4.1
43.3
39.2
EA
319.5
337.3
5.6%
27.1
52.8
25.7
50.3
77.5
27.2
2.8
29.6
26.8
EA
12316.3
333.8
5.5%
27.2
52.8
25.6
50.3
77.5
27.2
2.8
29.4
26.7
-0.1
-0.8
-0.7
EU
15392.2
424.
98.3%
26.7
49.6
22.9
50.5
74.9
24.5
3.6
40.5
36.9
-0.1
-2.0
-1.9
EU
1074
.166
.4-10.5%
20.2
54.1
33.9
41.7
75.3
33.6
0.4
0.9
0.4
0.1
3.7
3.6
EU
25466.3
491.
25.3%
25.6
50.2
24.6
49.0
75.0
26.0
4.1
41.4
37.3
-0.1
-1.2
-1.2
Sou
rce
:EU
RO
stA
t5E
UR
OPO
P200
8),C
om
miss
ion
serv
ice
s(D
GEC
FIN
),EP
C(A
wG
).

24
European Economy 7/2008the 2009 Ageing Report: Underlying assumptions and projection methodologies for the EU-27 Member states
tab
le0.
3–
2009
an
d20
06p
roje
ctio
ns
co
mp
are
d,l
ab
ou
rfo
rce
pro
jec
tion
s
Proj
ectio
nex
erci
se20
09Pr
ojec
tion
exer
cise
2009
-Pro
ject
ion
exer
cise
2006
Empl
oym
entr
ate
(15-
64)
Empl
oym
entr
ate
(55-
64)
Parti
cipa
tion
rate
(15-
64)
Parti
cipa
tion
rate
(55-
64)
Une
mpl
oym
entr
ate
(15-
64)
Empl
oym
entr
ate
(15-
64)
Empl
oym
entr
ate
(55-
64)
Parti
cipa
tion
rate
(15-
64)
Parti
cipa
tion
rate
(55-
64)
Une
mpl
oym
entr
ate
(15-
64)
2007
2050
p.p.
chan
ge20
0720
50p.
p.ch
ange
2007
2050
p.p.
chan
ge20
0720
50p.
p.ch
ange
2007
2050
p.p.
chan
ge20
0720
50p.
p.ch
ange
2007
2050
p.p.
chan
ge20
0720
50p.
p.ch
ange
2007
2050
p.p.
chan
ge20
0720
50p.
p.ch
ange
BE
62.3
65.4
3.1
34.6
47.6
13.0
67.3
69.7
2.3
36.2
49.4
13.2
7.5
6.2
-1.3
1.4
-0.1
-1.5
4.3
3.3
-1.0
1.6
-0.3
-1.9
5.1
4.5
-0.6
0.1
-0.3
-0.4
BG
62.1
64.7
2.5
43.4
45.4
2.0
66.8
67.9
1.0
46.6
47.6
1.0
7.0
4.7
-2.3
CZ
66.2
70.2
4.0
46.6
64.5
17.8
70.0
73.5
3.5
48.9
66.8
17.9
5.4
4.5
-0.9
0.7
0.5
-0.2
0.9
5.6
4.6
-1.1
-1.1
0.0
1.5
6.7
5.2
-2.5
-2.0
0.5
DK
77.2
78.3
1.2
59.1
68.4
9.3
80.3
81.0
0.7
61.3
70.3
9.0
3.9
3.2
-0.6
0.9
0.5
-0.4
-2.6
1.6
4.2
0.6
-0.4
-1.0
-2.6
1.3
3.9
-0.4
-1.0
-0.6
DE
69.6
74.8
5.2
51.4
68.7
17.3
76.2
79.7
3.5
57.3
73.9
16.5
8.7
6.2
-2.5
1.6
1.3
-0.3
6.4
3.0
-3.4
1.5
0.7
-0.7
6.6
4.7
-1.9
-0.4
-0.8
-0.4
EE
69.4
71.2
1.8
60.2
60.1
-0.1
72.9
73.7
0.8
62.4
61.9
-0.5
4.8
3.5
-1.3
3.1
0.4
-2.7
6.1
-1.6
-7.7
0.7
-2.4
-3.1
5.0
-1.8
-6.7
-3.4
-3.5
-0.2
IE69
.172
.53.4
53.8
66.5
12.7
72.5
76.3
3.9
55.1
68.3
13.1
4.7
5.1
0.4
-0.3
-2.1
-1.8
1.0
-2.4
-3.4
0.6
-0.9
-1.5
1.5
-1.3
-2.7
1.3
1.6
0.4
GR
61.4
64.8
3.4
42.8
50.0
7.2
67.1
69.1
1.9
44.3
51.3
7.0
8.5
6.2
-2.3
0.0
-0.3
-0.3
-1.1
-3.0
-1.9
-0.5
-0.9
-0.3
-0.8
-2.4
-1.6
-0.8
-0.8
0.0
ES
65.6
72.8
7.2
44.7
69.7
24.9
71.6
77.6
6.0
47.5
73.1
25.6
8.3
6.2
-2.1
1.4
1.4
0.0
1.0
7.2
6.2
0.7
0.8
0.1
1.3
9.2
7.9
-1.1
-0.8
0.3
FR64
.767
.12.
438.9
46.5
7.7
70.3
71.5
1.2
41.0
48.4
7.5
8.0
6.2
-1.8
0.9
-0.9
-1.8
-3.0
-6.3
-3.3
0.3
-1.6
-1.9
-2.6
-5.7
-3.1
-0.9
-0.8
0.1
IT58
.764
.05.3
33.8
61.3
27.5
62.6
67.9
5.3
34.7
62.8
28.2
6.2
5.8
-0.4
-0.2
-1.6
-1.5
1.1
6.7
5.6
-1.3
-2.3
-1.0
0.9
7.5
6.5
-1.6
-0.7
0.8
CY
69.7
75.3
5.6
55.9
63.7
7.9
72.9
78.0
5.1
57.6
65.4
7.8
4.4
3.4
-0.9
-2.7
-2.0
0.6
-1.6
-5.3
-3.7
-2.2
-2.7
-0.5
-1.7
-5.2
-3.5
0.7
-0.8
-1.5
LV68
.568
.50.
157
.752
.4-5.3
72.9
72.0
-0.9
60.4
54.4
-6.0
6.1
4.8
-1.2
1.4
-2.8
-4.2
8.3
-6.3
-14.
60.
1-4
.7-4
.88.
0-6
.1-1
4.1
-1.7
-2.2
-0.5
LT65
.165
.20.
153.4
53.2
-0.2
68.1
67.6
-0.5
55.5
54.8
-0.7
4.4
3.5
-0.9
-0.1
-6.5
-6.4
3.0-13.0
-16.
0-4
.1-9
.5-5
.50.3-13.6
-13.9
-5.2
-3.5
1.7
LU63.6
64.0
0.4
32.3
41.4
9.1
66.4
67.1
0.6
33.0
42.3
9.3
4.2
4.6
0.4
-0.2
-1.5
-1.3
-1.5
-0.4
1.1
-0.2
-1.3
-1.1
-1.2
0.1
1.3
0.0
0.4
0.4
HU
57.2
60.9
3.7
32.7
47.8
15.1
61.7
64.9
3.2
34.1
49.4
15.2
7.4
6.2
-1.2
-2.5
-2.4
0.1
-2.7
-1.7
1.0
-0.9
-1.5
-0.6
-1.9
-0.7
1.2
2.7
1.4
-1.2
MT
55.8
60.4
4.6
30.5
48.8
18.3
59.5
64.4
4.9
31.6
51.1
19.5
6.2
6.2
0.0
0.4
-1.0
-1.4
-0.5
15.7
16.2
-1.2
-1.6
-0.4
-0.3
17.3
17.6
-2.6
-0.8
1.8
NL
76.1
78.0
1.8
51.4
55.9
4.5
78.7
80.4
1.7
53.3
57.8
4.5
3.2
3.0
-0.2
1.2
0.1
-1.1
4.3
0.8
-3.5
1.2
-0.1
-1.3
5.3
1.8
-3.5
0.0
-0.2
-0.2
AT
71.5
74.2
2.7
38.8
54.6
15.7
74.8
77.5
2.7
40.0
56.0
16.0
4.5
4.3
-0.2
-0.5
-2.2
-1.6
4.2
-3.5
-7.7
0.3
-1.5
-1.8
3.9
-3.2
-7.1
1.1
0.9
-0.2
PL57
.161
.74.
629
.944.3
14.3
63.3
65.5
2.2
32.1
46.2
14.1
9.8
5.9
-3.9
2.5
-4.4
-6.8
-1.5
-4.4
-2.9
-2.9
-5.5
-2.6
-1.7
-3.1
-1.4
-7.7
-1.1
6.6
PT67
.871
.84.
051
.064.3
13.3
74.1
76.6
2.5
54.5
67.5
13.0
8.5
6.2
-2.3
-3.1
-1.5
1.6
-3.8
-0.4
3.4
-1.0
-1.1
-0.1
-2.2
1.3
3.4
2.9
0.6
-2.3
RO
58.7
56.9
-1.9
41.4
43.4
2.0
63.0
60.5
-2.5
42.4
44.2
1.8
6.8
6.0
-0.8
SI67
.868.3
0.4
33.4
47.0
13.6
71.4
71.6
0.3
34.5
48.3
13.8
4.9
4.7
-0.3
1.6
-1.1
-2.7
-0.9
-5.6
-4.7
1.3
-1.8
-3.1
-0.3
-4.8
-4.4
-0.6
-0.9
-0.3
SK61
.266
.04.
936.2
50.2
14.0
68.8
70.4
1.6
39.4
52.6
13.1
11.1
6.2
-4.9
0.7
-2.7
-3.4
2.2
-1.0
-3.2
-3.4
-3.5
-0.1
2.1
0.6
-1.6
-5.2
-0.8
4.4
FI70
.574
.54.
055
.665
.19.
475
.879
.13.3
59.4
68.5
9.1
7.0
5.8
-1.2
0.4
0.1
-0.2
0.9
0.2
-0.7
0.4
-0.5
-0.9
2.0
1.0
-1.0
0.0
-0.7
-0.7
SE74.3
77.5
3.2
70.3
74.1
3.8
79.2
82.4
3.2
73.2
77.1
3.9
6.2
5.9
-0.3
-0.2
-0.1
0.0
-0.4
-2.5
-2.1
1.4
1.3
-0.1
0.1
-2.0
-2.1
1.9
1.6
-0.3
UK
71.5
74.3
2.8
57.8
69.0
11.2
75.6
78.6
3.0
59.7
71.3
11.6
5.4
5.4
0.0
-0.7
-0.4
0.3
2.2
5.1
2.9
-0.1
0.2
0.3
2.6
6.0
3.4
0.8
0.8
0.0
NO
76.8
74.8
-2.1
69.2
65.5
-3.7
78.8
78.0
-0.8
69.9
66.5
-3.4
2.5
4.1
1.6
EU
2765
.569
.74.
244
.959
.414
.570
.673.9
3.3
47.5
62.0
14.5
7.2
5.7
-1.5
EA
65.5
70.4
4.8
42.6
60.8
18.2
70.8
74.7
3.9
45.4
63.7
18.3
7.5
5.8
-1.6
EA
1265
.570
.44.
842
.660
.918
.270
.974
.73.9
45.5
63.8
18.3
7.5
5.9
-1.7
0.4
-0.1
-0.5
0.9
2.1
1.2
0.0
-0.6
-0.6
1.1
3.3
2.1
-0.6
-0.6
0.0
EU
1566
.771
.44.
745
.962
.816
.971
.875
.73.9
48.6
65.6
17.0
7.1
5.7
-1.4
0.1
-0.1
-0.3
0.8
2.5
1.7
-0.1
-0.4
-0.3
1.1
3.6
2.5
-0.3
-0.3
0.0
EU
1059
.965
.05.
234.8
50.9
16.1
65.2
68.8
3.6
36.9
52.9
16.0
8.3
5.5
-2.8
1.1
-2.0
-3.1
-1.7
-1.0
0.7
-2.4
-3.0
-0.6
-1.8
0.1
2.0
-4.8
-1.1
3.7
EU
2565
.670
.55.
044
.160
.916
.870
.774
.84.
146
.763.6
16.9
7.3
5.7
-1.6
0.3
-0.3
-0.6
0.4
2.1
1.6
-0.4
-0.7
-0.2
0.6
3.2
2.5
-1.0
-0.4
0.6
Sou
rce
:Co
mm
issio
nse
rvic
es
(DG
ECFI
N),
EPC
(Aw
G).

25
Executive summary
tab
le0.
4–
2009
an
d20
06p
roje
ctio
ns
co
mp
are
d,e
co
no
mic
gro
wth
pro
jec
tion
s
2009
proj
ectio
nPr
ojec
tion
exer
cise
2009
-Pro
ject
ion
exer
cise
2006
GD
Pgr
owth
in20
08-
2050
Due
togr
owth
in:
GD
Ppe
rca
pita
grow
thin
2004
-20
50
GD
Pgr
owth
in20
08-
2050
Due
togr
owth
in:
GD
Ppe
rca
pita
grow
thin
2004
-20
50
Prod
uctiv
ityTF
PC
apita
lde
epen
ing
Labo
urin
putTo
talp
op.E
mpl
.rat
eSh
are
ofch
ange
inav
erag
ePr
oduc
tivity
TFP
Cap
ital
deep
enin
gLa
bour
inpu
tTota
lpop
.Em
pl.r
ate
Shar
eof
chan
gein
aver
age
(GD
Ppe
rho
urw
orke
d)W
orki
ngag
epo
p.ho
urs
wor
ked
(GD
Ppe
rw
orke
r)W
orki
ngag
epo
p.ho
urs
wor
ked
1=2+
52=3+4
345
=6+7
+8+9
67
89
10=1
-61=
2+5
2=3+4
34
5=6+
7+8+
96
78
910
=1-6
BE
1.9
1.6
1.1
0.6
0.3
0.3
0.1
-0.2
0.0
1.5
BE
0.2
-0.1
-0.1
0.0
0.2
0.2
-0.1
0.1
-0.1
BG
2.4
3.0
1.5
1.4
-0.6
-0.6
0.3
-0.3
0.0
3.0
BG
2.4
3.0
1.5
1.4
-0.6
-0.6
0.3
-0.3
3.0
CZ
2.1
2.5
1.6
0.9
-0.3
-0.1
0.0
-0.3
0.0
2.2
CZ
0.2
-0.2
0.2
-0.3
0.4
0.2
0.0
0.2
-0.1
DK
1.8
1.7
1.1
0.6
0.0
0.2
0.1
-0.2
0.0
1.6
DK
0.1
-0.1
-0.1
0.0
0.1
0.2
0.0
0.0
0.0
DE
1.3
1.7
1.1
0.6
-0.4
-0.2
0.2
-0.3
-0.1
1.5
DE
-0.1
0.1
0.0
0.1
-0.2
-0.1
-0.1
0.0
0.0
EE
2.7
3.1
1.7
1.4
-0.4
-0.3
0.1
-0.2
0.0
3.0
EE
0.0
-0.1
-0.1
0.0
0.1
0.1
-0.1
0.1
-0.1
IE2.
81.
81.
20.
70.
91.
10.
1-0
.1-0
.11.
7IE
-0.1
-0.5
-0.4
-0.1
0.3
0.4
-0.2
0.2
-0.5
GR
2.0
2.1
1.2
0.9
-0.1
0.1
0.1
-0.3
0.0
1.9
EL
0.5
0.3
0.3
0.0
0.0
0.1
-0.2
0.1
0.4
ES
2.1
1.8
1.1
0.7
0.4
0.5
0.3
-0.3
-0.1
1.6
ES
0.6
0.0
0.1
0.0
0.4
0.5
-0.2
0.2
0.1
FR1.
81.
71.
10.
60.
20.
40.
1-0
.2-0
.11.
5FR
0.1
0.0
0.0
0.1
0.1
0.2
-0.1
0.1
-0.1
IT1.
41.
40.
90.
50.
00.
10.
2-0.3
0.0
1.3
IT0.
1-0
.1-0
.10.
00.
20.3
-0.1
0.1
-0.2
CY
3.1
1.9
1.2
0.7
1.2
1.2
0.1
-0.1
0.0
1.9
CY
0.1
-0.5
-0.2
-0.2
0.4
0.5
-0.2
0.2
-0.4
LV2.
53.2
1.7
1.4
-0.7
-0.5
0.1
-0.2
0.0
3.0
LV-0
.6-0
.4-0
.2-0
.2-0
.2-0
.1-0
.20.
1-0
.5LT
2.5
3.0
1.7
1.3
-0.5
-0.5
0.1
-0.2
0.1
3.0
LT-0
.4-0.3
-0.1
-0.1
-0.2
-0.1
-0.3
0.1
-0.3
LU2.
91.
71.
10.
71.
20.
90.
4-0
.20.
02.
0LU
-0.2
-0.1
0.0
-0.1
-0.1
0.2
-0.3
0.0
-0.4
HU
2.0
2.5
1.4
1.0
-0.5
-0.2
0.0
-0.2
0.0
2.3
HU
-0.1
0.0
0.1
-0.1
-0.1
0.0
-0.2
0.1
-0.1
MT
1.9
2.0
1.2
0.7
-0.1
0.1
0.1
-0.2
-0.1
1.8
MT
-0.5
0.0
0.1
-0.1
-0.6
-0.4
-0.2
0.1
-0.1
NL
1.6
1.7
1.1
0.6
-0.1
0.1
0.1
-0.2
-0.1
1.5
NL
-0.1
0.1
0.0
0.0
-0.1
-0.1
0.0
0.0
0.0
AT
1.7
1.7
1.1
0.6
0.1
0.3
0.0
-0.2
0.0
1.5
AT
0.2
0.0
0.0
0.0
0.2
0.2
-0.2
0.1
0.0
PL2.
22.
61.
51.
1-0
.4-0.3
0.1
-0.2
0.0
2.5
PL-0
.2-0
.2-0
.20.
1-0
.20.
0-0
.40.
2-0
.2PT
1.9
1.9
1.2
0.7
0.0
0.2
0.1
-0.3
0.0
1.7
PT0.
4-0
.10.
00.
00.
50.3
0.1
0.2
0.1
RO
2.5
3.2
1.8
1.4
-0.7
-0.4
-0.2
-0.2
0.1
2.9
RO
2.5
3.2
1.8
1.4
-0.7
-0.4
-0.2
-0.2
2.9
SI1.
92.
41.3
1.1
-0.5
-0.1
0.0
-0.4
0.0
2.0
SI-0
.2-0
.1-0
.1-0
.1-0
.10.
0-0
.20.
1-0
.2SK
2.6
2.9
1.8
1.1
-0.3
-0.2
0.1
-0.2
0.0
2.8
SK0.
20.
10.
10.
00.
00.
1-0.3
0.2
0.1
FI1.
91.
91.3
0.6
0.0
0.1
0.2
-0.2
0.0
1.8
FI0.
10.
0-0
.10.
10.
10.
10.
00.
10.
0SE
2.1
1.8
1.2
0.6
0.3
0.4
0.0
-0.1
0.0
1.7
SE-0
.1-0
.2-0
.20.
00.
10.
1-0
.10.
0-0
.2U
K2.
21.
81.
10.
70.
40.
50.
1-0
.1-0
.11.
7U
K0.3
-0.1
-0.1
0.0
0.4
0.3
0.0
0.1
-0.1
NO
2.1
1.7
1.2
0.5
0.5
0.6
0.0
-0.1
0.0
1.6
NO
EU
271.
81.
81.
10.
70.
00.
10.
1-0
.20.
01.
7E
U27
EA
1.7
1.7
1.1
0.6
0.0
0.2
0.2
-0.3
0.0
1.5
EA
EA
121.
71.
71.
10.
60.
00.
20.
2-0.3
0.0
1.5
EA
120.
20.
00.
00.
00.
10.
2-0
.10.
10.
0E
U15
1.8
1.7
1.1
0.6
0.1
0.2
0.1
-0.2
0.0
1.5
EU
150.
20.
00.
00.
00.
20.
2-0
.10.
10.
0E
U10
2.2
2.6
1.5
1.1
-0.4
-0.2
0.1
-0.2
0.0
2.4
EU
10-0
.1-0
.1-0
.10.
0-0
.10.
0-0.3
0.2
-0.2
EU
251.
81.
81.
10.
70.
00.
20.
1-0
.2-0
.11.
6E
U25
0.1
0.0
0.0
0.0
0.1
0.2
-0.1
0.1
0.0
Sou
rce
:Co
mm
issio
nse
rvic
es
(DG
ECFI
N),
EPC
(Aw
G).


PART I
Underlying assumptions and projectionmethodologies


29
PARt I — Underlying assumptions and projection methodologies
1.1. bAckground And generAlApproAch
eurostat’s europop2008 populationprojection used by the epc
The 2009 age-related expenditure projection isbased on the new population projection for27 EU countries prepared by Eurostat, theEUROPOP2008 population projection releasedby Eurostat in April 2008 (see Eurostat (2008)).A description of the methodologies used toproject fertility rates, life expectancy and netmigration in EUROPOP2008 can be found inEurostat (2008).7
In preparing the EUROPOP2008 populationprojection, Eurostat actively involved nationalstatistical institutes via the “PopulationProjection” Interest Group and through meetingsof its Working Group on Population Projection.Moreover, a joint meeting of the Working Groupon Population Projections and the EPC WorkingGroup on Ageing populations (AWG) was heldon 29-30 November 2007 in Luxembourg so thatthe views of the EPC-AWG could be taken intoaccount before the finalisation of the projection.
A convergence approach was adopted forthe europop2008 projection
In contrast with the EUROPOP2004 demographicprojection8 which was a ‘trend’ scenario, theapproach used by EUROSTAT in EUROPOP2008was a ‘convergence’ scenario. This means thatthe key demographic determinants are assumedto converge over the very long-term (by theyear 2150). Setting the year of convergence veryfar into the future has the advantage of takingdue account of recent trends and developmentsin the beginning of the period, while at the sametime assuming a degree of convergence over thevery long-term in terms of demographic drivers.These demographic determinants are: (i) the
7 See Eurostat (2008) and Annex 1.1 for more details.A comprehensive account of the EUROPOP2008population projection will be provided in the forthcoming:‘Methodology and main results of the Eurostat PopulationProjections 2008-based (EUROPOP2008)’, Eurostat,Methodologies and Working Papers series, Luxembourg.8 See Eurostat (2005a) for a detailed methodologicaldescription.
fertility rate; (ii) the mortality rate and (iii) thelevel of net migration. As far as fertility andmortality are concerned, it is assumed that theyconverge to that of the ‘forerunners’.
Specifically, in the convergence year 2150,fertility rates are assumed to converge to levelsachieved by Member States that are consideredto be ‘forerunners’ in the demographic transition.Forerunners concerning ferti l i ty are:DK (2006:1.83), FI (2006: 1.84), SE (2006: 1.85)as well as UK (2006: 1.84), France, Ireland andNorway above 1.9. The theoretical convergenceTotal Fertility Rate (TFR) was set to 1.85 to beachieved by 2150.
Life expectancy increases are assumed to begreater for countries at lower levels of lifeexpectancy and smaller for those at higher levels,thus following convergent trajectories. Formortality rates, the forerunners are France, Italy,Spain and Sweden, where life expectancy isassumed to continue to increase. The theoreticalconvergence life expectancy was set to 92.9 and96.3 for males and females respectively, for theconvergence year 2150.
Migration is assumed to converge to zero netmigration in the same convergence year as forfertility and mortality (in 2150).
1.2. projection of fertility rAtes
1.2.1. Past trends
fertility rates have been declining to wellbelow the natural replacement level
Fertility rates have declined sharply in the EUMember States since the post-war “baby boom”peak above 2.5 in the second half of the 1960s, tobelow the replacement level of 2.1 (see Table 1.1).This decline was relatively fast and unexpected(just as the surge in fertility rates in post-waryears was unexpected).
1. POPUlAtION

30
European Economy 7/2008the 2009 Ageing Report: Underlying assumptions and projection methodologies for the EU-27 Member states
The trend of falling fertility rates differed acrosscountries in size and timing. Fertility rates fellbelow replacement levels in the late 1960s inSweden, Denmark, Finland, Luxembourg,Germany, Hungary, Latvia and the CzechRepublic. The fall took place somewhat later inBelgium, the Netherlands, Austria, the UK,France (1972-73) and Italy (1975). Declines infertility rates occurred much later in Greece,Spain, Portugal (1981-82) and Ireland (2000)Malta (1980), Poland and Slovakia (in 1989).Several Member States had very low fertilityrates below 1.4 in 2000, namely Bulgaria, theCzech Republic, Germany, Estonia, Greece,Spain, Italy, Latvia, Lithuania, Hungary, Austria,Poland, Romania, Slovenia and Slovakia.
Recent trends since 2000 also differ acrossMember States, with fertility rates continuing to
fall in Germany, Cyprus, Lithuania, Luxembourg,Malta, Poland, Portugal, Romania and Slovakia.
By contrast, recent increases are noted in a largenumber of countries (Bulgaria, Czech Republic,Denmark, Estonia, Greece, Spain, France, Latvia,Finland, Sweden, UK), with fertility rates goingabove 1.8 in Denmark, France, Finland, Sweden,UK.
table 1.1 – Past trends in fertility rates, 1950-2006
1950 1960 1970 1980 1990 2000 2006 1960-2006 1960-2000BE 2,34 2,54 2,25 1,68 1,62 1,66 -0,9BG 2,31 2,17 2,05 1,81 1,26 1,37 -0,9 -1,1CZ 2,11 1,9 2,1 1,9 1,14 1,33 -0,8 -1,0DK 2,57 2,57 1,95 1,55 1,67 1,78 1,83 -0,7 -0,8DE 2,37 2,03 1,56 1,45 1,38 1,32 -1,1 -1,0EE 2,16 2,05 1,39 1,55IE 3,76 3,76 3,23 2,11 1,88 1,9 -1,9 -1,9EL 2,28 2,4 2,23 1,4 1,26 1,39 -0,9 -1,0ES 2,86 2,9 2,2 1,36 1,23 1,38 -1,5 -1,6FR 2,93 2,73 2,47 1,95 1,78 1,87 1,98 -0,8 -0,9IT 2,5 2,41 2,43 1,64 1,33 1,26 -1,2CY 3,51 2,54 2,42 1,64 1,47 -2,0 -1,9LV 2 1,88 2,01 1,24 1,35LT 2,6 2,4 1,99 2,03 1,39 1,31 -1,3 -1,2LU 2,28 1,97 1,49 1,61 1,76 1,65 -0,6 -0,5HU 2,02 1,98 1,91 1,87 1,32 1,34 -0,7 -0,7MT 3,62 2,02 1,99 2,05 1,72 1,41 -2,2 -1,9NL 3,1 3,12 2,57 1,6 1,62 1,72 1,7 -1,4 -1,4AT 2,69 2,29 1,65 1,46 1,36 1,4 -1,3 -1,3PL 2,98 2,2 2,28 2,04 1,35 1,27 -1,7 -1,6PT 3,15 3,01 2,25 1,56 1,55 1,35 -1,8 -1,6RO 2,44 1,84 1,39 1,31SI 2,18 2,1 2,11 1,46 1,26 1,31 -0,9 -0,9SK 3,03 2,41 2,31 2,09 1,29 1,24 -1,8 -1,7FI 3,15 2,72 1,82 1,63 1,78 1,73 1,84 -0,9 -1,0SE 2,28 2,2 1,92 1,68 2,13 1,54 1,85 -0,4 -0,7UK 2,72 2,43 1,9 1,83 1,64 1,84 -0,9 -1,1NO 2,51 2,9 2,5 1,72 1,93 1,85 1,9 -1,0 -1,1EU27 1,79 1,48EA 2,75 2,38 1,62 1,51 -1,2EA12 2,77 2,34 1,82 1,41 -1,4EU15 2,69 2,41 1,88 1,65 1,57 -1,1EU10 2,13 2,07 1,94 1,34 1,35EU25 2,32 1,79 1,49
Source: Eurostat, European Economy (2005), Central Statistical Office (Ireland) for IE in 1970 and 1980.Note: EU averages are simple averages.

31
PARt I — Underlying assumptions and projection methodologies
1.2.2. the EUROPOP2008 projection
the projected fertility rates in europop2008
The convergence scenario approach employed inthe EUROPOP2008 projection entails a processof convergence in the fertility rates acrossMember States to that of the forerunners over theprojection period over the very long-term. Forthe EU, the total fertility rate (TFR) is projectedto rise from 1.52 in 2008 to 1.57 by 2030 andfurther to 1.64 by 2060. In the euro area, a similarincrease is projected, from 1.55 in 2008 to 1.66in 2060. The fertility rate is projected to increaseover the projection period in all Member States,except Ireland and France (though remainingabove 1.85), and in Denmark, Finland, Swedenand the UK it is projected to remain stable.Hence, in all countries the fertility rates will
remain below the natural replacement rate of 2.1in the period to 2060. The largest increases infertility rates are projected to take place inSlovakia, Poland and Lithuania which have thelowest fertility rates in the EU in 2008. Theincrease is projected to occur gradually, withfertility rates in these countries approaching thecurrent EU average rates only in 2060.
table 1.2 – Projection of fertility rates in EUROPOP2008
Fertility rate
2008 2010 2020 2030 2040 2050 2060change
2008-2060BE 1,75 1,76 1,76 1,77 1,78 1,78 1,79 0,04BG 1,38 1,39 1,42 1,46 1,49 1,52 1,55 0,17CZ 1,33 1,34 1,38 1,41 1,45 1,49 1,52 0,19DK 1,85 1,85 1,85 1,85 1,85 1,85 1,85 0,00DE 1,34 1,35 1,38 1,42 1,45 1,49 1,53 0,19EE 1,55 1,55 1,57 1,60 1,62 1,64 1,66 0,11IE 1,90 1,90 1,90 1,89 1,89 1,88 1,88 -0,02EL 1,41 1,41 1,45 1,48 1,51 1,54 1,57 0,16ES 1,39 1,39 1,43 1,46 1,49 1,52 1,56 0,17FR 1,98 1,98 1,97 1,96 1,95 1,94 1,93 -0,05IT 1,38 1,39 1,42 1,46 1,49 1,52 1,55 0,17CY 1,45 1,46 1,49 1,52 1,54 1,57 1,60 0,15LV 1,36 1,36 1,40 1,43 1,47 1,50 1,54 0,18LT 1,35 1,35 1,39 1,43 1,47 1,51 1,54 0,19LU 1,65 1,65 1,67 1,68 1,70 1,71 1,72 0,07HU 1,35 1,35 1,39 1,42 1,46 1,50 1,53 0,18MT 1,38 1,39 1,42 1,46 1,49 1,52 1,55 0,17NL 1,72 1,72 1,73 1,74 1,75 1,76 1,77 0,05AT 1,41 1,42 1,45 1,48 1,51 1,54 1,57 0,16PL 1,27 1,28 1,32 1,36 1,40 1,44 1,49 0,22PT 1,36 1,37 1,40 1,44 1,47 1,51 1,54 0,18RO 1,32 1,33 1,37 1,41 1,44 1,48 1,52 0,20SI 1,32 1,33 1,37 1,40 1,44 1,48 1,52 0,20SK 1,25 1,26 1,30 1,34 1,38 1,43 1,47 0,22FI 1,84 1,84 1,84 1,84 1,84 1,84 1,84 0,00SE 1,85 1,85 1,85 1,85 1,85 1,85 1,85 0,00UK 1,84 1,84 1,84 1,84 1,84 1,84 1,84 0,00NO 1,90 1,90 1,90 1,89 1,89 1,89 1,88 -0,02EU27 1,54 1,54 1,57 1,60 1,62 1,65 1,67 0,14EA 1,53 1,54 1,56 1,59 1,61 1,64 1,66 0,13EA12 1,54 1,54 1,56 1,59 1,61 1,64 1,66 0,13EU15 1,59 1,60 1,62 1,64 1,66 1,68 1,70 0,11EU10 1,30 1,31 1,35 1,39 1,43 1,47 1,51 0,21EU25 1,55 1,55 1,58 1,61 1,63 1,65 1,68 0,13
Source: Eurostat, EUROPOP2008.

32
European Economy 7/2008the 2009 Ageing Report: Underlying assumptions and projection methodologies for the EU-27 Member states
1.3. projection of life expectAncy
1.3.1. Past trends
large and continuous increases in lifeexpectancy have been observed
Over very long time periods, life expectancy hasbeen increasing in most developed countriesworldwide.9 In the EU, there have been significantincreases in life expectancy at birth since 1960 inall Member States (see Table 1.3). Between 1960and 2000, life expectancy at birth has increasedsignificantly, especially for women. In euro areacountries, the increase is even more pronounced.
In the EU, the difference between female andmale life expectancy has diminished since 1990,due to faster improvements in life expectancy formales relative to females. In the euro area, thisprocess started in 1980, and the differencebetween males and females is also smaller thanin the EU as a whole.
The gains in life expectancy at birth have differedacross countries between 1980 and 2000. Womenhave gained 5 years or more in Germany, Italy,Luxembourg, Malta, Austria and Portugal.Smaller increases of 2.5 years or less wereobserved in Bulgaria, Denmark, Estonia, Latvia,Lithuania and the Netherlands.
Gains in the life expectancy over the same periodfor men have been five years or more in Germany,France, Italy, Luxembourg, Malta, Austria,Portugal, Finland and the UK, while increases of2.5 years or less have occurred in Bulgaria,Estonia, Greece, Latvia, Lithuania, Hungary,Romania and Slovakia.
There is no consensus among demographers ontrends over the very long term, e.g. whether thereis a natural biological limit to longevity, the
9 Since the 19th century, improvements in living conditionsand medical advances have led to increases in lifeexpectancy at birth. Several stages have been identified inthe decline in mortality, starting in northwest Europearound 1700 to 1800 with a reduction of variations inmortality rates as famine-related mortality was reduced(UN, 2004). Mortality levels began to decline in a secondstage that started in the early 19th century in England andNorthern European countries, due to vaccination and publichealth measures as well as improved personal hygiene. Thedecline in mortality rates accelerated during the third stagein the early years of the 20th century, with significantimprovements made in reduction of infant and childmortality and in survival rates of young adults.
impact of future medical breakthroughs, long-term impact of public health programmes andsocietal behaviour such as reduction of smokingrates or increased prevalence of obesity. Pastpopulation projections from official sources have,however, underestimated the gains in lifeexpectancy at birth, and some commentators haveargued that governments may be underestimatingthe potential budgetary impact of ageingpopulations because of that.
Official projections generally assume that gainsin life expectancy at birth will slow downcompared with historical trends. This is becausemortality rates at younger ages are already verylow and future gains in life expectancy wouldrequire improvements in mortality rates at olderages (which statistically have a smaller impacton life expectancy at birth). On the other hand,the wide range of life expectancies across EUMember States, and also compared with othercountries, points to considerable scope for futuregains. In 2006, life expectancy at birth forfemales ranges from 76.2 in Romania to84.4 years in Spain and France and for malesfrom 65.3 in Lithuania to over 78.8 in Cyprusand Sweden.
1.3.2. the projection used in EUROPOP2008:methodology and results
A detailed overview of the projectionmethodology is provided by Eurostat (2008).
Table 1.4 and Table 1.5 present the projectedchanges in life expectancy at birth and at age 65for males and females in the baseline scenario ofEUROPOP2008. It projects large increases inlife expectancy at birth being sustained duringthe projection period, albeit with a considerabledegree of diversity across Member States.
In the EU, life expectancy at birth for males isprojected to increase by 8.5 years over theprojection period, from 76 in 2008 to 84.5 in2060. For females, life expectancy at birth isprojected to increase by 6.9 years for females,from 82.1 in 2008 to 89 in 2060, implying aconvergence of life expectancy between malesand females.
The largest increases in life expectancy at birth,for both males and females, are projected to takeplace in the new Member States. Life expectancyfor males in 2008 is the lowest in Estonia, Latvia,Lithuania, Hungary, Slovakia, Poland, Bulgaria

33
PARt I — Underlying assumptions and projection methodologies
table 1.3 – Past trends in life expectancy at birth, 1950-2006
Males 1950 1960 1970 1980 1990 2000 2006 1960-2006 1960-2000BE 62,0 67,7 67,8 69,9 72,7 74,6 76,6 8,9 6,9BG 67,5 69,1 68,4 68,0 68,4 69,2 1,7 0,9CZ 67,8 66,1 66,9 67,6 71,7 73,5 5,7 3,9DK 70,4 70,7 71,2 72,0 74,5 76,1 5,7 4,1DE 64,6 66,5 67,5 69,6 72,0 75,1 77,2 10,7 8,6EE 64,3 65,5 64,1 64,7 65,5 67,4 3,1 1,2IE 64,5 68,1 68,8 70,1 72,1 74,0 77,3 9,2 5,9EL 63,4 67,3 71,6 73,0 74,7 75,5 77,2 9,9 8,2ES 59,8 67,4 69,2 72,3 73,4 75,8 77,7 10,3 8,4FR 62,9 66,9 68,4 70,2 72,8 75,4 77,4 10,5 8,5IT 63,7 67,2 69,0 70,6 73,9 77,0 9,8CY 72,3 74,1 78,8LV 65,2 66,0 63,6 64,3 65,0 65,4 0,2 -0,2LT 64,9 66,8 65,4 66,5 66,8 65,3 0,4 1,9LU 66,5 67,1 69,1 72,4 74,6 76,8 10,3 8,1HU 65,9 66,3 65,5 65,2 67,6 69,2 3,3 1,7MT 66,5 68,4 68,0 73,7 76,2 77 10,5 9,7NL 71,5 70,7 72,7 73,8 75,5 77,7 6,2 4,0AT 66,2 66,5 69,0 72,3 75,2 77,2 11,0 9,0PL 64,9 66,6 66,9 66,3 69,6 70,9 6,0 4,7PT 56,4 61,0 63,6 67,9 70,6 73,2 75,5 14,5 12,2RO 65,8 66,6 66,7 67,7 69,2SI 66,1 65,0 67,4 69,8 72,2 74,5 8,4 6,1SK 67,9 66,8 66,7 66,7 69,2 70,4 2,5 1,3FI 65,5 66,5 69,2 71,0 74,2 75,9 10,4 8,7SE 71,2 72,3 72,8 74,8 77,4 78,8 7,6 6,2UK 66,2 67,9 68,7 70,2 72,9 75,5 7,6NO 71,6 71,2 72,4 73,4 76,0 78,2 6,6 4,4EU27 68,9 70,6EA 70,1 72,6EA12 70,1 72,6EU15 67,4 68,6 70,5 72,8 75,2 7,7EU10 66,7 67,9 71,2EU25 69,0 70,8
Females 1950 1960 1970 1980 1990 2000 2006 1960-2006 1960-2000BE 67,3 73,5 74,2 76,7 79,5 81,0 82,3 8,8 7,5BG 71,1 73,5 73,9 74,7 75,0 76,3 5,2 3,9CZ 73,5 73,1 74,0 75,5 78,5 79,9 6,4 5,0DK 74,4 75,9 77,3 77,8 79,2 80,7 6,3 4,8DE 68,5 71,7 73,6 76,2 78,5 81,2 82,4 10,7 9,5EE 71,6 74,1 74,1 75,0 76,2 78,6 7,0 4,6IE 67,1 71,9 73,5 75,6 77,7 79,2 82,1 10,2 7,3EL 68,5 72,4 76,0 77,5 79,5 80,6 81,9 9,5 8,2ES 64,3 72,2 74,8 78,4 80,6 82,9 84,4 12,2 10,7FR 68,5 73,6 75,9 78,4 81,2 83,0 84,4 10,8 9,4IT 67,2 72,3 74,9 77,4 80,4 82,9 10,6CY 77,0 78,6 82,4LV 72,4 74,4 74,2 74,6 76,1 76,3 3,9 3,7LT 71,4 75,0 75,4 76,3 77,5 77 5,6 6,1LU 72,2 73,4 75,9 78,7 81,3 81,9 9,7 9,1HU 70,2 72,1 72,8 73,8 76,2 77,8 7,6 6,0MT 70,5 72,6 72,8 78,1 80,3 81,9 11,4 9,8NL 75,5 76,3 79,3 80,2 80,5 82 6,5 5,0AT 72,7 73,5 76,1 79,0 81,2 82,8 10,1 8,5PL 70,6 73,3 75,4 75,3 78,0 79,7 9,1 7,4PT 61,6 66,6 69,6 74,9 77,5 80,2 82,3 15,7 13,6RO 70,4 71,9 73,1 74,8 76,2SI 72,0 72,4 75,2 77,8 79,9 82 10,0 7,9SK 72,7 73,0 74,4 75,7 77,5 78,4 5,7 4,8FI 72,5 75,0 77,6 79,0 81,2 83,1 10,6 8,7SE 74,9 77,3 79,0 80,5 82,0 83,1 8,2 7,1UK 71,2 73,7 75,0 76,2 78,5 80,3 6,6NO 76,0 77,5 79,3 79,9 81,5 82,9 6,9 5,5EU27 75,8 77,7EA 76,6 79,1EA12 76,6 79,1EU15 72,7 74,6 77,1 79,2 81,1 8,4EU10 74,5 76,1 79,4EU25 76,1 78,0
Source: Eurostat.
Note: EU averages are simple averages.
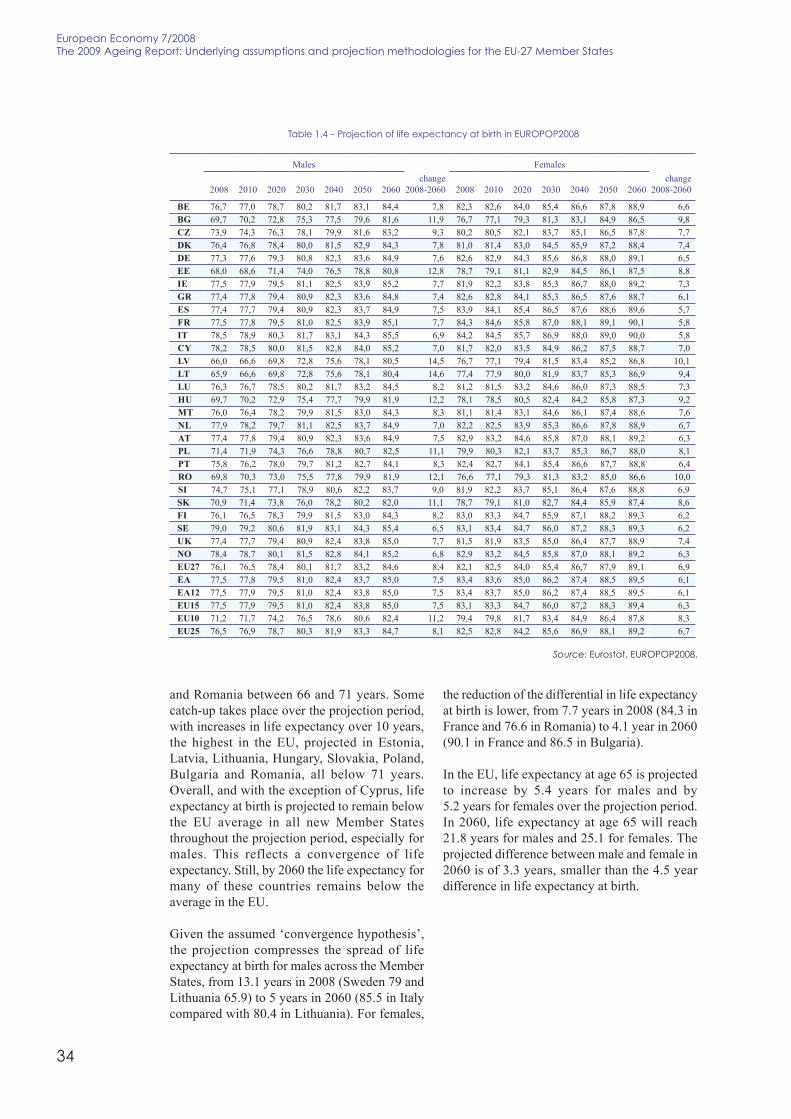
34
European Economy 7/2008the 2009 Ageing Report: Underlying assumptions and projection methodologies for the EU-27 Member states
and Romania between 66 and 71 years. Somecatch-up takes place over the projection period,with increases in life expectancy over 10 years,the highest in the EU, projected in Estonia,Latvia, Lithuania, Hungary, Slovakia, Poland,Bulgaria and Romania, all below 71 years.Overall, and with the exception of Cyprus, lifeexpectancy at birth is projected to remain belowthe EU average in all new Member Statesthroughout the projection period, especially formales. This reflects a convergence of lifeexpectancy. Still, by 2060 the life expectancy formany of these countries remains below theaverage in the EU.
Given the assumed ‘convergence hypothesis’,the projection compresses the spread of lifeexpectancy at birth for males across the MemberStates, from 13.1 years in 2008 (Sweden 79 andLithuania 65.9) to 5 years in 2060 (85.5 in Italycompared with 80.4 in Lithuania). For females,
the reduction of the differential in life expectancyat birth is lower, from 7.7 years in 2008 (84.3 inFrance and 76.6 in Romania) to 4.1 year in 2060(90.1 in France and 86.5 in Bulgaria).
In the EU, life expectancy at age 65 is projectedto increase by 5.4 years for males and by5.2 years for females over the projection period.In 2060, life expectancy at age 65 will reach21.8 years for males and 25.1 for females. Theprojected difference between male and female in2060 is of 3.3 years, smaller than the 4.5 yeardifference in life expectancy at birth.
table 1.4 – Projection of life expectancy at birth in EUROPOP2008
Males Females
2008 2010 2020 2030 2040 2050 2060change
2008-2060 2008 2010 2020 2030 2040 2050 2060change
2008-2060
BE 76,7 77,0 78,7 80,2 81,7 83,1 84,4 7,8 82,3 82,6 84,0 85,4 86,6 87,8 88,9 6,6BG 69,7 70,2 72,8 75,3 77,5 79,6 81,6 11,9 76,7 77,1 79,3 81,3 83,1 84,9 86,5 9,8CZ 73,9 74,3 76,3 78,1 79,9 81,6 83,2 9,3 80,2 80,5 82,1 83,7 85,1 86,5 87,8 7,7DK 76,4 76,8 78,4 80,0 81,5 82,9 84,3 7,8 81,0 81,4 83,0 84,5 85,9 87,2 88,4 7,4DE 77,3 77,6 79,3 80,8 82,3 83,6 84,9 7,6 82,6 82,9 84,3 85,6 86,8 88,0 89,1 6,5EE 68,0 68,6 71,4 74,0 76,5 78,8 80,8 12,8 78,7 79,1 81,1 82,9 84,5 86,1 87,5 8,8IE 77,5 77,9 79,5 81,1 82,5 83,9 85,2 7,7 81,9 82,2 83,8 85,3 86,7 88,0 89,2 7,3GR 77,4 77,8 79,4 80,9 82,3 83,6 84,8 7,4 82,6 82,8 84,1 85,3 86,5 87,6 88,7 6,1ES 77,4 77,7 79,4 80,9 82,3 83,7 84,9 7,5 83,9 84,1 85,4 86,5 87,6 88,6 89,6 5,7FR 77,5 77,8 79,5 81,0 82,5 83,9 85,1 7,7 84,3 84,6 85,8 87,0 88,1 89,1 90,1 5,8IT 78,5 78,9 80,3 81,7 83,1 84,3 85,5 6,9 84,2 84,5 85,7 86,9 88,0 89,0 90,0 5,8CY 78,2 78,5 80,0 81,5 82,8 84,0 85,2 7,0 81,7 82,0 83,5 84,9 86,2 87,5 88,7 7,0LV 66,0 66,6 69,8 72,8 75,6 78,1 80,5 14,5 76,7 77,1 79,4 81,5 83,4 85,2 86,8 10,1LT 65,9 66,6 69,8 72,8 75,6 78,1 80,4 14,6 77,4 77,9 80,0 81,9 83,7 85,3 86,9 9,4LU 76,3 76,7 78,5 80,2 81,7 83,2 84,5 8,2 81,2 81,5 83,2 84,6 86,0 87,3 88,5 7,3HU 69,7 70,2 72,9 75,4 77,7 79,9 81,9 12,2 78,1 78,5 80,5 82,4 84,2 85,8 87,3 9,2MT 76,0 76,4 78,2 79,9 81,5 83,0 84,3 8,3 81,1 81,4 83,1 84,6 86,1 87,4 88,6 7,6NL 77,9 78,2 79,7 81,1 82,5 83,7 84,9 7,0 82,2 82,5 83,9 85,3 86,6 87,8 88,9 6,7AT 77,4 77,8 79,4 80,9 82,3 83,6 84,9 7,5 82,9 83,2 84,6 85,8 87,0 88,1 89,2 6,3PL 71,4 71,9 74,3 76,6 78,8 80,7 82,5 11,1 79,9 80,3 82,1 83,7 85,3 86,7 88,0 8,1PT 75,8 76,2 78,0 79,7 81,2 82,7 84,1 8,3 82,4 82,7 84,1 85,4 86,6 87,7 88,8 6,4RO 69,8 70,3 73,0 75,5 77,8 79,9 81,9 12,1 76,6 77,1 79,3 81,3 83,2 85,0 86,6 10,0SI 74,7 75,1 77,1 78,9 80,6 82,2 83,7 9,0 81,9 82,2 83,7 85,1 86,4 87,6 88,8 6,9SK 70,9 71,4 73,8 76,0 78,2 80,2 82,0 11,1 78,7 79,1 81,0 82,7 84,4 85,9 87,4 8,6FI 76,1 76,5 78,3 79,9 81,5 83,0 84,3 8,2 83,0 83,3 84,7 85,9 87,1 88,2 89,3 6,2SE 79,0 79,2 80,6 81,9 83,1 84,3 85,4 6,5 83,1 83,4 84,7 86,0 87,2 88,3 89,3 6,2UK 77,4 77,7 79,4 80,9 82,4 83,8 85,0 7,7 81,5 81,9 83,5 85,0 86,4 87,7 88,9 7,4NO 78,4 78,7 80,1 81,5 82,8 84,1 85,2 6,8 82,9 83,2 84,5 85,8 87,0 88,1 89,2 6,3EU27 76,1 76,5 78,4 80,1 81,7 83,2 84,6 8,4 82,1 82,5 84,0 85,4 86,7 87,9 89,1 6,9EA 77,5 77,8 79,5 81,0 82,4 83,7 85,0 7,5 83,4 83,6 85,0 86,2 87,4 88,5 89,5 6,1EA12 77,5 77,9 79,5 81,0 82,4 83,8 85,0 7,5 83,4 83,7 85,0 86,2 87,4 88,5 89,5 6,1EU15 77,5 77,9 79,5 81,0 82,4 83,8 85,0 7,5 83,1 83,3 84,7 86,0 87,2 88,3 89,4 6,3EU10 71,2 71,7 74,2 76,5 78,6 80,6 82,4 11,2 79,4 79,8 81,7 83,4 84,9 86,4 87,8 8,3EU25 76,5 76,9 78,7 80,3 81,9 83,3 84,7 8,1 82,5 82,8 84,2 85,6 86,9 88,1 89,2 6,7
Source: Eurostat, EUROPOP2008.
35
PARt I — Underlying assumptions and projection methodologies
1.4. projection of net MigrAtion floWs
1.4.1. Past trends and driving forces
European countries have gradually become adestination for migrants, starting in the 1950s incountries with post-war labour recruitment needsand with colonial past. Southern countriesbecame net receiving countries during the 1990sand several countries in Central and EasternEurope are currently both source and destinationof migrants. Three distinct phases of immigrationcan be identified in the last half century:
• the guest worker phase, with programmes torecruit foreign workers to cope with increasinglabour demand during the economic boom inthe 1950s and 1960s in Austria, Denmark,Germany, Luxemburg, Belgium, France, theNetherlands and the UK. They turned to otherEuropean countries, such as Italy, Portugal
and Spain, and/or to former colonies orneighbouring countries: North Africa in thecase of France and Belgium; the Caribbeanand the Indian subcontinent for the UK; andYugoslavia and Turkey for Germany. Foreignlabour recruitment stopped in 1974, after thefirst oil price shock and subsequent rise inunemployment;10
10 Measures of macroeconomic conditions, such asunemployment rates, are typically not helpful in explaininglong-run immigration policy changes; however the timingof their introduction is strongly influenced by short-runmacroeconomic conditions (Hatton and Williamson, 2003).
table 1.5 – Projection of life expectancy at 65 in EUROPOP2008
Males Females
2008 2010 2020 2030 2040 2050 2060change
2008-2060 2008 2010 2020 2030 2040 2050 2060change
2008-2060BE 16,5 16,7 17,7 18,8 19,8 20,7 21,7 5,2 20,1 20,3 21,4 22,3 23,3 24,2 25,1 5,0BG 13,1 13,4 14,8 16,1 17,5 18,8 20,0 6,9 16,1 16,4 17,8 19,2 20,5 21,8 23,1 7,0CZ 14,7 15,0 16,2 17,4 18,6 19,7 20,8 6,1 18,1 18,3 19,5 20,7 21,9 23,0 24,0 6,0DK 16,1 16,3 17,4 18,4 19,5 20,5 21,4 5,4 19,0 19,2 20,4 21,6 22,6 23,7 24,6 5,7DE 16,8 17,0 18,1 19,1 20,1 21,1 22,0 5,2 20,1 20,3 21,4 22,4 23,3 24,3 25,1 5,0EE 13,0 13,3 14,7 16,0 17,3 18,6 19,9 6,9 18,1 18,4 19,6 20,8 22,0 23,1 24,2 6,1IE 16,8 17,0 18,1 19,2 20,3 21,3 22,2 5,5 19,7 20,0 21,2 22,3 23,4 24,4 25,4 5,6GR 17,2 17,4 18,4 19,3 20,2 21,1 22,0 4,8 19,6 19,8 20,8 21,8 22,7 23,7 24,5 4,9ES 17,1 17,3 18,3 19,3 20,3 21,2 22,1 5,0 21,0 21,2 22,1 23,0 23,9 24,7 25,5 4,5FR 17,7 17,9 18,9 19,9 20,8 21,7 22,5 4,8 22,0 22,2 23,1 23,9 24,7 25,5 26,2 4,1IT 17,5 17,7 18,7 19,7 20,6 21,5 22,4 4,9 21,4 21,6 22,5 23,4 24,3 25,1 25,9 4,5CY 17,1 17,3 18,3 19,3 20,2 21,1 22,0 4,8 19,0 19,2 20,3 21,5 22,5 23,6 24,6 5,6LV 12,7 13,0 14,5 16,0 17,4 18,8 20,1 7,5 17,1 17,4 18,8 20,1 21,4 22,6 23,8 6,6LT 13,1 13,4 14,9 16,3 17,7 19,0 20,3 7,1 17,5 17,8 19,0 20,3 21,5 22,6 23,7 6,2LU 16,8 17,0 18,0 19,1 20,1 21,0 21,9 5,1 19,7 19,9 21,0 22,0 23,0 23,9 24,8 5,0HU 13,6 13,9 15,3 16,7 18,1 19,4 20,6 7,0 17,5 17,7 19,1 20,4 21,7 22,9 24,0 6,5MT 15,9 16,1 17,2 18,3 19,4 20,4 21,4 5,5 19,1 19,4 20,5 21,7 22,8 23,8 24,8 5,7NL 16,5 16,8 17,8 18,8 19,8 20,8 21,7 5,1 19,9 20,1 21,2 22,2 23,2 24,1 25,0 5,1AT 17,1 17,3 18,3 19,3 20,2 21,2 22,0 5,0 20,3 20,5 21,5 22,5 23,4 24,3 25,2 4,9PL 14,5 14,7 16,0 17,3 18,6 19,8 20,9 6,5 18,6 18,8 20,0 21,2 22,3 23,4 24,4 5,9PT 16,3 16,6 17,6 18,7 19,7 20,7 21,6 5,2 19,9 20,1 21,1 22,1 23,0 23,9 24,8 4,9RO 13,6 13,9 15,2 16,6 17,9 19,2 20,4 6,8 16,3 16,6 18,0 19,4 20,7 22,0 23,2 6,9SI 15,7 15,9 17,1 18,2 19,3 20,4 21,4 5,7 19,6 19,8 20,9 22,0 23,0 24,0 24,9 5,3SK 13,3 13,6 15,0 16,3 17,7 19,0 20,2 6,9 17,1 17,4 18,8 20,1 21,3 22,6 23,7 6,6FI 16,6 16,9 17,9 18,9 19,9 20,9 21,8 5,2 20,7 20,9 21,8 22,8 23,7 24,5 25,4 4,7SE 17,4 17,6 18,6 19,5 20,4 21,3 22,2 4,7 20,5 20,7 21,7 22,6 23,6 24,4 25,3 4,8UK 16,9 17,1 18,2 19,2 20,3 21,2 22,1 5,3 19,5 19,8 20,9 22,1 23,1 24,1 25,1 5,6NO 17,3 17,5 18,5 19,5 20,4 21,3 22,1 4,8 20,4 20,6 21,6 22,6 23,5 24,4 25,2 4,9EU27 16,5 16,7 17,8 18,9 20,0 21,0 21,9 5,5 20,0 20,2 21,3 22,3 23,3 24,3 25,2 5,2EA 17,1 17,3 18,4 19,4 20,3 21,3 22,2 5,0 20,8 21,0 22,0 22,9 23,8 24,7 25,5 4,7EA12 17,1 17,3 18,4 19,4 20,4 21,3 22,2 5,0 20,8 21,0 22,0 22,9 23,8 24,7 25,5 4,7EU15 17,1 17,3 18,3 19,3 20,3 21,3 22,2 5,1 20,6 20,8 21,8 22,8 23,7 24,6 25,4 4,8EU10 14,2 14,5 15,8 17,2 18,4 19,6 20,8 6,6 18,2 18,4 19,7 20,9 22,1 23,2 24,2 6,1EU25 16,6 16,9 18,0 19,0 20,1 21,0 22,0 5,3 20,2 20,4 21,5 22,5 23,5 24,4 25,3 5,1
Source: Eurostat, EUROPOP2008.

36
European Economy 7/2008the 2009 Ageing Report: Underlying assumptions and projection methodologies for the EU-27 Member states
• immigration continued, mostly due to familyreunification: net migration flows during the1970s were of 240,000 people per year onaverage as immigrants who were present inthese countries decided to stay and were joinedby their families from their home countries;
• the asylum seekers phase, after a brief periodof net outflows during the early 1980srecession. Net migration flows rose again,peaking in 1991-92, as the fall of the “ironcurtain” and a number of wars and ethnicconflicts, such as in former Yugoslavia, pushedupwards the number of people seeking asylum.Net inflows dropped significantly between1992 and 1997, partly due to tighter controlsover migratory flows in the main receivingcountries, but they resumed their growth at theend of the 1990s. Overall, the average annualnet entries for the EU25 more than tripledfrom around 198,000 people per year duringthe 1980s to around 750,000 people per yearduring the 1990s. High clandestine migrationalso marks the decade of the 1990s.
Net inflows started rising at the end of the 1990suntil 2003, from over 500,000 people in 1998 toclose to 2 million in 2003. Some of this increase,however, does not only reflect new entries ofmigrants, but also large-scale regularisationprogrammes which made parts of the migrantpopulation residing illegally in the EU visible inofficial statistics. Net flows show a recenttendency to stabilise, decreasing to a level of1,800,000 in 2004.
Net migration flows11 per country arecharacterised by high variability, see Table 1.6.Traditionally, Germany, France and the UKrecord the largest number of arrivals in the EU,but there has been a recent rise of migrationflows to Italy, Spain and Ireland that haveswitched from countries of origin to destinationcountries. Spain recorded the highest net inflowsin the EU in 2006, after recording net outflowsduring the 1960s and most of the 1970s and 80s.However, net migration flows do not show thesize of inward and outward movements – due totemporary and return migration. Therefore, netmigration flows are much smaller than grossflows. Germany records a comparatively largenumber of arrivals, but the high number ofoutflows keeps net immigration, relative to totalpopulation, comparable to that of some othercountries. Sinn et al. (2001) estimate that only40% of immigrants were still living in Germany10 years after their arrival, and less than 35%after 25 years.
11 Net migration is measured as the difference between thetotal population on 31 December and 1 January for a givencalendar year, minus the difference between births anddeaths (or natural increase). The approach is different fromthat of subtracting recorded emigration flows fromimmigration flows.
Graph 1.1 – Net migration flows, 1965-2007
Source: Eurostat.
1965
-500000
0
500000
1000000
1500000
2000000
2500000
-1000000
1966
1967
1968
1969
1970
1971
1972
1973
1974
1975
1976
1977
1978
1979
1980
1981
1982
1983
1984
1985
1986
1987
1988
1989
1990
1991
1992
1993
1994
1995
1996
1997
1998
1999
2000
2001
2002
2003
2004
2005
2006
2007
EA15
EU27
37
PARt I — Underlying assumptions and projection methodologies
1.4.2. the projection used in EUROPOP2008:methodology and results
Projected net migration flows ineuropop2008
The methodology used to project net migrationin EUROPOP2008 is described in Eurostat(2008). Specifically, migration is assumed toconverge to zero net migration in 2150.Additionally, migration is assumed to increase tocover 10% of any natural decrease in the workingage population. This adjustment offsets in partthe decline in the working age population andpresents a slightly more favourable situation thanwould otherwise be the case for some countries.
Table 1.7 presents the projected net migrationflows in the baseline of EUROPOP2008. For theEU as a whole, annual net inflows are projectedto fall from about 1,680,000 people in 2008(equivalent to 0.33% of the EU population) to980,000 by 2020 and thereafter declining furtherto some 800,000 people by 2060 (0.16% of theEU population).
Box: Drivers of migration trenDs
The economic theory of migration is based on the assumption that migrants try to maximise the netgains from migration, calculated as the difference in present value of alternative earnings streams, minusmigration costs. An individual is more likely to migrate the higher is the wage in the destination countryand the lower the source country wage and the migration cost. Policies that restrict immigration can beseen as raising the migration cost. The likelihood of migration tends to decline with age because theremaining working life is shorter. Thus, for a given incentive to migrate, migration will be higher theyounger is the population of working-age in the source country.
New economic theories have expanded this framework to incorporate the idea that migration decisionsare taken in a household context rather than by an individual. The family member in a foreign labourmarket sends a stream of remittances to improve the economic situation of the family which can eitherstay in the country or follow via family reunification.
Hatton andWilliamson (2003) have identified four main economic and demographic factors generatingmigration :
- the gap in income per capita between rich, high-wage countries and poor, low-wage countries;
- emigration from poor countries may increase as economic development takes place, which does notseem consistent with the fact that migration is driven by the gap between income in the source anddestination regions. This is due to the relaxation of the poverty constraints to migrate. Indeed, for thevery poor it may be difficult to finance migration so income gains have a positive effect on migration,which may dominate the negative effect associated with a reduction of the income gap betweensending and receiving countries. A hump shaped relationship between economic development insending countries and emigration has been observed: emigration rates out of very poor countries arevery low, whilst they are much higher out of moderately poor countries (Hatton and Williamson,1998); this could be explained by catching up that relaxes the poverty constraint.
- the share of young adult population in a receiving country has a negative effect on immigration, whilsta bigger young adult share in sending countries increases emigration.
- networks (friends and relatives) drive dynamic effects of migration through the stock of previousmigrants from the sending country residing in the receiving country.
On the demand-side, the policies of receiving countries are factors of migration, notably the promotionof immigration to fill labour shortages.
1 See Hatton and Williamson (2003).

38
European Economy 7/2008the 2009 Ageing Report: Underlying assumptions and projection methodologies for the EU-27 Member states
Over the entire projection period, the cumulatednet migration to the EU is 59 millions, of whichthe bulk is concentrated in the euro area(46.2 millions). Net migration flows are projectedto be concentrated to a few destination countries:Italy (12 millions cumulated up to 2060), Spain(11.6 millions), Germany (8.2 millions), and theUK (7.8 millions). According to the assumptions,the change of Spain and Italy from origin todestination countries would be confirmed incoming decades. For countries that currentlyexperience a net outflow (EE, LT, LV, PL, BG andRO), this is projected to taper off or reverse in thecoming decades.
Table 1.6 – Past trends in net migration flows
Net migration flows
1961 1970 1980 1990 2000 2006BE -39859 -32718 -2436 19547 14349 53357BG -67 -11031 -5 -94611 0 0CZ 4911 -121345 -41216 -58893 6539 34720DK 2745 21113 570 8553 10094 10118DE 118435 -271686 304410 656166 167863 25814EE 6066 6052 -5623 224 164IE -19662 -2796 -592 -7667 31812 68857EL -16761 -46393 55777 63920 29401 39995ES -82664 72947 112659 -20007 389774 604902FR : 158266 90115IT -136302 -107276 4914 22250 49526CY -6519 -903 -664 8708 3960 8666LV 15467 6734 2445 -13085 -5504 -2451LT 3690 14025 2122 -8848 -20306 -4857LU 2415 1084 1344 3937 3431 5353HU 909 0 0 18313 16658 21309MT -1944 380 857 9763 2135NL 5924 32516 50557 48730 57033 -25903AT -2679 10406 9357 58562 17272 29379PL -61865 -293620 -24125 -12620 -409925 -36134PT -38078 -121955 41969 -39107 47000 26044RO -12190 -17804 -86781 -3729 -6483SI -4489 3713 5420 -245 2747 6267SK -5636 -35091 -11493 -2322 -22301 3854FI -11815 -36381 -2180 8604 2410 10600SE 13115 46726 9606 34814 24386 50769UK 87400 -14821 -33485 24662 143871NO 694 -758 3741 1796 9707 23623EU27 -171385 -894820 473582 627814 724614 1016590EA -232054 -501386 580915 824255 984607 945581EA12 : -502252 575779 814935 968137 928513EU15 -117786 -449234 552470 882964 1146488 989400EU10 -53532 -422365 -61079 -73758 -418145 33673EU25 -871599 491391 809206 728343 1023073
Source: Eurostat.

39
PARt I — Underlying assumptions and projection methodologies
1.5. overAll results of populAtionprojection to be used
Table 1.8 presents an overview of the baselinepopulation projection (Eurostat’s EUROPOP2008projection) used in the 2009 EC-EPC projectionexercise.
The age structure of the EU population isprojected to dramatically change in comingdecades due to the dynamics of fertility, lifeexpectancy and migration rates. The overall sizeof the population is projected to be slightly largerin 50 years time, but much older than it is now.The EU population is projected to increase (from495.4 millions in 2008) up to 2035 by almost 5%,when it will peak (at 520.1 million). Thereafter,a steady decline occurs and the population shrinks
by nearly 3%. Nonetheless, according to theprojections, the population in 2060 will beslightly higher than in 2008, at 505.7 millions.
While the EU population is projected to beslightly larger in 2060 compared to 2008, thereare wide differences in population trends until2060 across Member States. Decreases of thetotal population are projected for about half ofthe EU Member States (BG, CZ, DE, EE, EL, IT,LV, LT, HU, MT, PL, RO, SI, SK). For the otherMember States an increase is projected.
Table 1.7 – Projection of net migration flows in EUROPOP2008
Net migration (‘000) as % of total populationcumulated
(1000’s)
2008 2010 2020 2030 2040 2050 2060 2008 2060 2008-2060BE 51 47 36 31 27 25 23 0,5% 0,2% 1680BG -1 0 0 0 2 2 -1 0,0% 0,0% 43CZ 24 26 25 23 27 22 17 0,2% 0,2% 1253DK 10 10 8 9 6 6 6 0,2% 0,1% 389DE 160 147 173 187 132 136 116 0,2% 0,2% 8183EE -1 0 0 0 0 0 0 0,0% 0,0% -1IE 63 53 22 9 6 7 9 1,4% 0,1% 869EL 40 40 38 37 37 31 27 0,4% 0,2% 1875ES 623 540 263 161 150 135 130 1,4% 0,3% 11655FR 99 98 93 87 77 70 63 0,2% 0,1% 4375IT 260 256 241 249 229 193 174 0,4% 0,3% 11994CY 9 9 8 8 7 7 6 1,2% 0,4% 402LV -1 -1 0 -1 0 1 -1 0,0% 0,0% -5LT -2 -2 0 0 0 1 0 -0,1% 0,0% -4LU 4 4 4 4 3 3 3 0,9% 0,4% 188HU 20 19 22 17 22 18 15 0,2% 0,2% 1008MT 1 1 1 1 1 1 1 0,2% 0,2% 50NL 8 8 11 14 7 7 8 0,0% 0,1% 512AT 33 33 31 31 26 25 22 0,4% 0,2% 1501PL -16 -15 14 -1 17 26 8 0,0% 0,0% 538PT 52 51 48 46 45 39 34 0,5% 0,3% 2346RO -6 -5 6 -1 13 13 4 0,0% 0,0% 357SI 6 5 4 3 3 3 2 0,3% 0,1% 193SK 4 3 5 4 6 6 4 0,1% 0,1% 258FI 10 10 8 6 5 5 4 0,2% 0,1% 334SE 47 42 27 20 17 17 16 0,5% 0,1% 1212UK 188 184 166 151 138 126 114 0,3% 0,1% 7821NO 22 21 15 12 11 10 10 0,5% 0,2% 695EU27 1684 1563 1253 1093 1005 924 804 0,3% 0,2% 59031EA 1418 1302 980 873 756 687 623 0,4% 0,2% 46160EA12 1402 1287 966 861 744 676 614 0,4% 0,2% 45515EU15 1647 1523 1167 1041 906 825 750 0,4% 0,2% 54937EU10 44 45 79 54 84 85 51 0,1% 0,1% 3694EU25 1691 1568 1246 1094 990 910 801 0,4% 0,2% 58631
Source: Eurostat, EUROPOP2008.
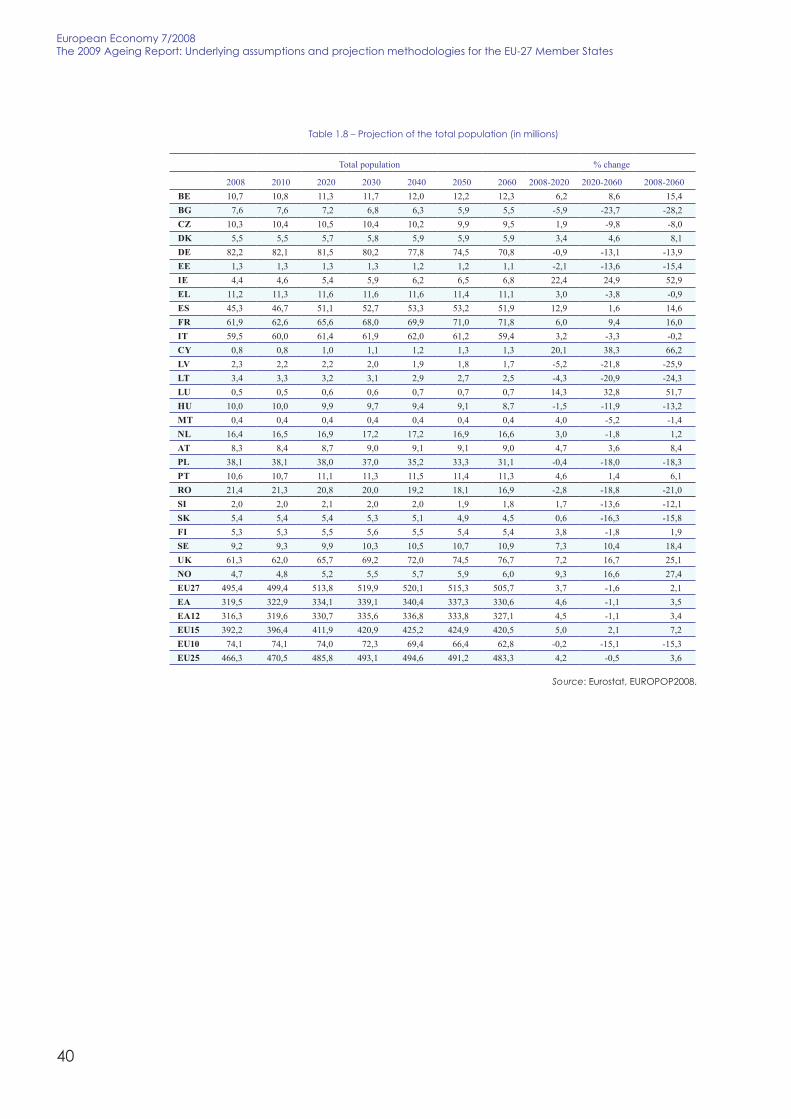
40
European Economy 7/2008the 2009 Ageing Report: Underlying assumptions and projection methodologies for the EU-27 Member states
table 1.8 – Projection of the total population (in millions)
Total population % change
2008 2010 2020 2030 2040 2050 2060 2008-2020 2020-2060 2008-2060BE 10,7 10,8 11,3 11,7 12,0 12,2 12,3 6,2 8,6 15,4BG 7,6 7,6 7,2 6,8 6,3 5,9 5,5 -5,9 -23,7 -28,2CZ 10,3 10,4 10,5 10,4 10,2 9,9 9,5 1,9 -9,8 -8,0DK 5,5 5,5 5,7 5,8 5,9 5,9 5,9 3,4 4,6 8,1DE 82,2 82,1 81,5 80,2 77,8 74,5 70,8 -0,9 -13,1 -13,9EE 1,3 1,3 1,3 1,3 1,2 1,2 1,1 -2,1 -13,6 -15,4IE 4,4 4,6 5,4 5,9 6,2 6,5 6,8 22,4 24,9 52,9EL 11,2 11,3 11,6 11,6 11,6 11,4 11,1 3,0 -3,8 -0,9ES 45,3 46,7 51,1 52,7 53,3 53,2 51,9 12,9 1,6 14,6FR 61,9 62,6 65,6 68,0 69,9 71,0 71,8 6,0 9,4 16,0IT 59,5 60,0 61,4 61,9 62,0 61,2 59,4 3,2 -3,3 -0,2CY 0,8 0,8 1,0 1,1 1,2 1,3 1,3 20,1 38,3 66,2LV 2,3 2,2 2,2 2,0 1,9 1,8 1,7 -5,2 -21,8 -25,9LT 3,4 3,3 3,2 3,1 2,9 2,7 2,5 -4,3 -20,9 -24,3LU 0,5 0,5 0,6 0,6 0,7 0,7 0,7 14,3 32,8 51,7HU 10,0 10,0 9,9 9,7 9,4 9,1 8,7 -1,5 -11,9 -13,2MT 0,4 0,4 0,4 0,4 0,4 0,4 0,4 4,0 -5,2 -1,4NL 16,4 16,5 16,9 17,2 17,2 16,9 16,6 3,0 -1,8 1,2AT 8,3 8,4 8,7 9,0 9,1 9,1 9,0 4,7 3,6 8,4PL 38,1 38,1 38,0 37,0 35,2 33,3 31,1 -0,4 -18,0 -18,3PT 10,6 10,7 11,1 11,3 11,5 11,4 11,3 4,6 1,4 6,1RO 21,4 21,3 20,8 20,0 19,2 18,1 16,9 -2,8 -18,8 -21,0SI 2,0 2,0 2,1 2,0 2,0 1,9 1,8 1,7 -13,6 -12,1SK 5,4 5,4 5,4 5,3 5,1 4,9 4,5 0,6 -16,3 -15,8FI 5,3 5,3 5,5 5,6 5,5 5,4 5,4 3,8 -1,8 1,9SE 9,2 9,3 9,9 10,3 10,5 10,7 10,9 7,3 10,4 18,4UK 61,3 62,0 65,7 69,2 72,0 74,5 76,7 7,2 16,7 25,1NO 4,7 4,8 5,2 5,5 5,7 5,9 6,0 9,3 16,6 27,4EU27 495,4 499,4 513,8 519,9 520,1 515,3 505,7 3,7 -1,6 2,1EA 319,5 322,9 334,1 339,1 340,4 337,3 330,6 4,6 -1,1 3,5EA12 316,3 319,6 330,7 335,6 336,8 333,8 327,1 4,5 -1,1 3,4EU15 392,2 396,4 411,9 420,9 425,2 424,9 420,5 5,0 2,1 7,2EU10 74,1 74,1 74,0 72,3 69,4 66,4 62,8 -0,2 -15,1 -15,3EU25 466,3 470,5 485,8 493,1 494,6 491,2 483,3 4,2 -0,5 3,6
Source: Eurostat, EUROPOP2008.

41
PARt I — Underlying assumptions and projection methodologies
Age structure
The age structure of the EU population isprojected to change dramatically, as shown in thepopulation pyramids presented in Graph 1.2.12
The most numerous cohorts in 2008 are around40 years old for men and women. The median age
12 Population pyramids show the population density by sexand by age group.
is projected to rise from 40.4 years in 2008 to47.9 years in 2060. Elderly people are projectedto account for an increasing share of thepopulation; this is due to gains in life expectancycontinuing over the projection period. At the sametime, the base of the age pyramid becomes smallerduring the projection period due to below-replacement fertility rates. As a consequence, theshape of the age-pyramids gradually changesfrom pyramids to pillars. A similar developmentis projected for the euro area.
Graph 1.2 – Population pyramids (in thousands), EU27/EA, in 2008 and 2060
Source: Eurostat, EUROPOP2008.
20000
MalesAge
groups Females
15000 10000 5000 5000
90+
85 - 89
80 - 84
75 - 79
70 - 74
65 - 69
60 - 64
55 - 59
50 - 54
45 - 49
40 - 44
35 - 39
30 - 34
25 - 29
20 - 24
15 - 19
10 - 14
5 - 9
0 - 4
0 0 10000 15000 20000
EU27 2008
EU27 2060
15000
MalesAge
groups Females
10000 5000 5000
90+
85 - 89
80 - 84
75 - 79
70 - 74
65 - 69
60 - 64
55 - 59
50 - 54
45 - 49
40 - 44
35 - 39
30 - 34
25 - 29
20 - 24
15 - 19
10 - 14
5 - 9
0 - 4
0 0 10000 15000
EA 2008
EA 2060
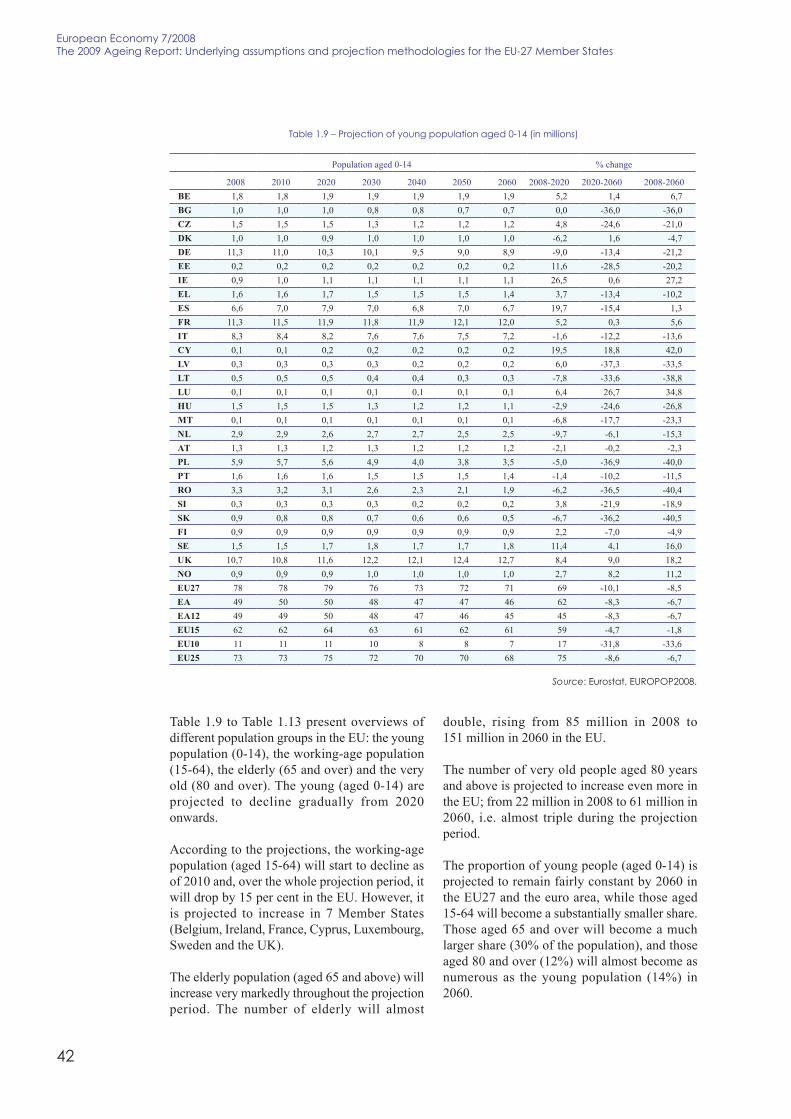
42
European Economy 7/2008the 2009 Ageing Report: Underlying assumptions and projection methodologies for the EU-27 Member states
Table 1.9 to Table 1.13 present overviews ofdifferent population groups in the EU: the youngpopulation (0-14), the working-age population(15-64), the elderly (65 and over) and the veryold (80 and over). The young (aged 0-14) areprojected to decline gradually from 2020onwards.
According to the projections, the working-agepopulation (aged 15-64) will start to decline asof 2010 and, over the whole projection period, itwill drop by 15 per cent in the EU. However, itis projected to increase in 7 Member States(Belgium, Ireland, France, Cyprus, Luxembourg,Sweden and the UK).
The elderly population (aged 65 and above) willincrease very markedly throughout the projectionperiod. The number of elderly will almost
double, rising from 85 million in 2008 to151 million in 2060 in the EU.
The number of very old people aged 80 yearsand above is projected to increase even more inthe EU; from 22 million in 2008 to 61 million in2060, i.e. almost triple during the projectionperiod.
The proportion of young people (aged 0-14) isprojected to remain fairly constant by 2060 inthe EU27 and the euro area, while those aged15-64 will become a substantially smaller share.Those aged 65 and over will become a muchlarger share (30% of the population), and thoseaged 80 and over (12%) will almost become asnumerous as the young population (14%) in2060.
table 1.9 – Projection of young population aged 0-14 (in millions)
Population aged 0-14 % change
2008 2010 2020 2030 2040 2050 2060 2008-2020 2020-2060 2008-2060BE 1,8 1,8 1,9 1,9 1,9 1,9 1,9 5,2 1,4 6,7BG 1,0 1,0 1,0 0,8 0,8 0,7 0,7 0,0 -36,0 -36,0CZ 1,5 1,5 1,5 1,3 1,2 1,2 1,2 4,8 -24,6 -21,0DK 1,0 1,0 0,9 1,0 1,0 1,0 1,0 -6,2 1,6 -4,7DE 11,3 11,0 10,3 10,1 9,5 9,0 8,9 -9,0 -13,4 -21,2EE 0,2 0,2 0,2 0,2 0,2 0,2 0,2 11,6 -28,5 -20,2IE 0,9 1,0 1,1 1,1 1,1 1,1 1,1 26,5 0,6 27,2EL 1,6 1,6 1,7 1,5 1,5 1,5 1,4 3,7 -13,4 -10,2ES 6,6 7,0 7,9 7,0 6,8 7,0 6,7 19,7 -15,4 1,3FR 11,3 11,5 11,9 11,8 11,9 12,1 12,0 5,2 0,3 5,6IT 8,3 8,4 8,2 7,6 7,6 7,5 7,2 -1,6 -12,2 -13,6CY 0,1 0,1 0,2 0,2 0,2 0,2 0,2 19,5 18,8 42,0LV 0,3 0,3 0,3 0,3 0,2 0,2 0,2 6,0 -37,3 -33,5LT 0,5 0,5 0,5 0,4 0,4 0,3 0,3 -7,8 -33,6 -38,8LU 0,1 0,1 0,1 0,1 0,1 0,1 0,1 6,4 26,7 34,8HU 1,5 1,5 1,5 1,3 1,2 1,2 1,1 -2,9 -24,6 -26,8MT 0,1 0,1 0,1 0,1 0,1 0,1 0,1 -6,8 -17,7 -23,3NL 2,9 2,9 2,6 2,7 2,7 2,5 2,5 -9,7 -6,1 -15,3AT 1,3 1,3 1,2 1,3 1,2 1,2 1,2 -2,1 -0,2 -2,3PL 5,9 5,7 5,6 4,9 4,0 3,8 3,5 -5,0 -36,9 -40,0PT 1,6 1,6 1,6 1,5 1,5 1,5 1,4 -1,4 -10,2 -11,5RO 3,3 3,2 3,1 2,6 2,3 2,1 1,9 -6,2 -36,5 -40,4SI 0,3 0,3 0,3 0,3 0,2 0,2 0,2 3,8 -21,9 -18,9SK 0,9 0,8 0,8 0,7 0,6 0,6 0,5 -6,7 -36,2 -40,5FI 0,9 0,9 0,9 0,9 0,9 0,9 0,9 2,2 -7,0 -4,9SE 1,5 1,5 1,7 1,8 1,7 1,7 1,8 11,4 4,1 16,0UK 10,7 10,8 11,6 12,2 12,1 12,4 12,7 8,4 9,0 18,2NO 0,9 0,9 0,9 1,0 1,0 1,0 1,0 2,7 8,2 11,2EU27 78 78 79 76 73 72 71 69 -10,1 -8,5EA 49 50 50 48 47 47 46 62 -8,3 -6,7EA12 49 49 50 48 47 46 45 45 -8,3 -6,7EU15 62 62 64 63 61 62 61 59 -4,7 -1,8EU10 11 11 11 10 8 8 7 17 -31,8 -33,6EU25 73 73 75 72 70 70 68 75 -8,6 -6,7
Source: Eurostat, EUROPOP2008.

43
PARt I — Underlying assumptions and projection methodologies
table 1.10 – Projection of working age population aged 15-64 (in millions)
Population aged 15-64 % change
2008 2010 2020 2030 2040 2050 2060 2008-2020 2020-2060 2008-2060BE 7,0 7,1 7,2 7,1 7,1 7,1 7,1 2,5 -1,5 1,0BG 5,3 5,2 4,7 4,3 3,9 3,3 3,0 -11,2 -37,2 -44,2CZ 7,4 7,3 6,9 6,7 6,3 5,6 5,2 -6,7 -24,6 -29,7DK 3,6 3,6 3,6 3,5 3,4 3,5 3,5 -1,1 -2,8 -3,8DE 54,4 54,2 52,6 47,9 44,2 41,9 38,9 -3,3 -26,1 -28,5EE 0,9 0,9 0,8 0,8 0,8 0,7 0,6 -7,4 -25,8 -31,2IE 3,0 3,1 3,5 3,8 3,9 3,8 3,9 17,4 10,1 29,3EL 7,5 7,6 7,5 7,3 6,8 6,3 6,2 -1,0 -17,3 -18,1ES 31,1 31,9 33,9 34,0 31,8 29,1 28,4 8,8 -16,1 -8,7FR 40,3 40,6 40,4 40,4 40,3 40,7 41,2 0,3 1,9 2,2IT 39,2 39,4 39,3 38,1 35,3 33,7 32,7 0,1 -16,6 -16,5CY 0,6 0,6 0,6 0,7 0,8 0,8 0,8 15,8 20,6 39,5LV 1,6 1,6 1,4 1,3 1,2 1,0 0,9 -9,2 -36,9 -42,7LT 2,3 2,3 2,2 2,0 1,8 1,6 1,3 -6,0 -38,1 -41,8LU 0,3 0,3 0,4 0,4 0,4 0,4 0,4 12,9 19,7 35,2HU 6,9 6,9 6,5 6,2 5,8 5,2 4,8 -6,4 -25,3 -30,1MT 0,3 0,3 0,3 0,3 0,3 0,2 0,2 -3,1 -20,0 -22,5NL 11,1 11,1 10,9 10,4 9,9 9,9 9,6 -1,4 -12,1 -13,3AT 5,6 5,7 5,8 5,6 5,4 5,3 5,2 2,8 -10,6 -8,1PL 27,1 27,2 25,4 23,6 22,1 18,9 16,3 -6,1 -35,8 -39,7PT 7,1 7,2 7,3 7,2 6,9 6,5 6,3 1,9 -12,7 -11,1RO 15,0 14,9 14,1 13,4 12,0 10,4 9,1 -5,5 -35,9 -39,4SI 1,4 1,4 1,3 1,3 1,2 1,0 1,0 -5,0 -29,0 -32,5SK 3,9 3,9 3,7 3,5 3,2 2,8 2,4 -4,0 -36,0 -38,5FI 3,5 3,5 3,4 3,2 3,2 3,1 3,0 -5,0 -9,1 -13,6SE 6,0 6,1 6,1 6,2 6,2 6,3 6,2 0,9 1,8 2,7UK 40,7 41,1 42,0 42,8 43,8 45,0 45,0 3,4 7,1 10,7NO 3,1 3,2 3,3 3,4 3,4 3,5 3,5 5,5 5,6 11,4EU27 333,2 335,0 331,9 321,9 307,8 294,4 283,3 -0,4 -14,6 -15,0EA 212,6 214,0 214,4 207,6 197,4 190,1 185,0 0,8 -13,7 -13,0EA12 210,4 211,7 212,1 205,4 195,2 188,0 183,0 0,8 -13,7 -13,0EU15 260,7 262,4 263,8 257,9 248,6 242,9 237,7 1,2 -9,9 -8,8EU10 52,3 52,4 49,2 46,3 43,3 37,8 33,6 -5,9 -31,8 -35,8EU25 313,0 314,8 313,0 304,2 292,0 280,7 271,3 0,0 -13,3 -13,3
Source: Eurostat, EUROPOP2008.
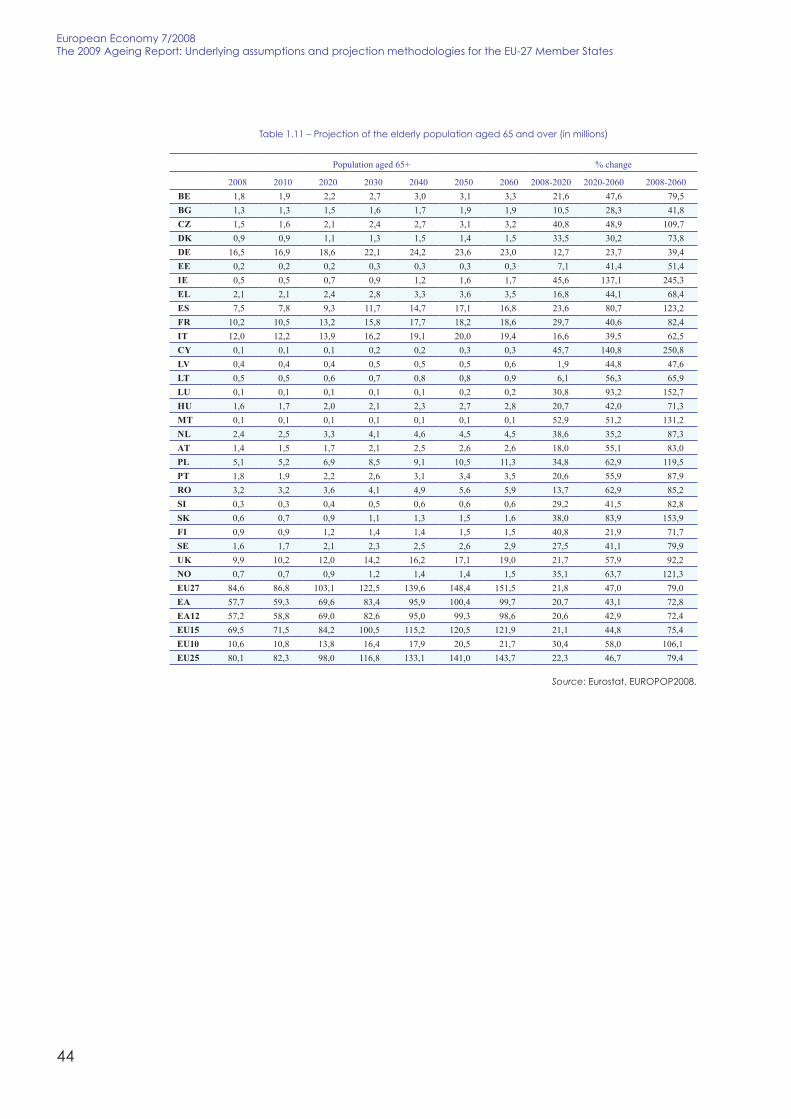
44
European Economy 7/2008the 2009 Ageing Report: Underlying assumptions and projection methodologies for the EU-27 Member states
table 1.11 – Projection of the elderly population aged 65 and over (in millions)
Population aged 65+ % change
2008 2010 2020 2030 2040 2050 2060 2008-2020 2020-2060 2008-2060BE 1,8 1,9 2,2 2,7 3,0 3,1 3,3 21,6 47,6 79,5BG 1,3 1,3 1,5 1,6 1,7 1,9 1,9 10,5 28,3 41,8CZ 1,5 1,6 2,1 2,4 2,7 3,1 3,2 40,8 48,9 109,7DK 0,9 0,9 1,1 1,3 1,5 1,4 1,5 33,5 30,2 73,8DE 16,5 16,9 18,6 22,1 24,2 23,6 23,0 12,7 23,7 39,4EE 0,2 0,2 0,2 0,3 0,3 0,3 0,3 7,1 41,4 51,4IE 0,5 0,5 0,7 0,9 1,2 1,6 1,7 45,6 137,1 245,3EL 2,1 2,1 2,4 2,8 3,3 3,6 3,5 16,8 44,1 68,4ES 7,5 7,8 9,3 11,7 14,7 17,1 16,8 23,6 80,7 123,2FR 10,2 10,5 13,2 15,8 17,7 18,2 18,6 29,7 40,6 82,4IT 12,0 12,2 13,9 16,2 19,1 20,0 19,4 16,6 39,5 62,5CY 0,1 0,1 0,1 0,2 0,2 0,3 0,3 45,7 140,8 250,8LV 0,4 0,4 0,4 0,5 0,5 0,5 0,6 1,9 44,8 47,6LT 0,5 0,5 0,6 0,7 0,8 0,8 0,9 6,1 56,3 65,9LU 0,1 0,1 0,1 0,1 0,1 0,2 0,2 30,8 93,2 152,7HU 1,6 1,7 2,0 2,1 2,3 2,7 2,8 20,7 42,0 71,3MT 0,1 0,1 0,1 0,1 0,1 0,1 0,1 52,9 51,2 131,2NL 2,4 2,5 3,3 4,1 4,6 4,5 4,5 38,6 35,2 87,3AT 1,4 1,5 1,7 2,1 2,5 2,6 2,6 18,0 55,1 83,0PL 5,1 5,2 6,9 8,5 9,1 10,5 11,3 34,8 62,9 119,5PT 1,8 1,9 2,2 2,6 3,1 3,4 3,5 20,6 55,9 87,9RO 3,2 3,2 3,6 4,1 4,9 5,6 5,9 13,7 62,9 85,2SI 0,3 0,3 0,4 0,5 0,6 0,6 0,6 29,2 41,5 82,8SK 0,6 0,7 0,9 1,1 1,3 1,5 1,6 38,0 83,9 153,9FI 0,9 0,9 1,2 1,4 1,4 1,5 1,5 40,8 21,9 71,7SE 1,6 1,7 2,1 2,3 2,5 2,6 2,9 27,5 41,1 79,9UK 9,9 10,2 12,0 14,2 16,2 17,1 19,0 21,7 57,9 92,2NO 0,7 0,7 0,9 1,2 1,4 1,4 1,5 35,1 63,7 121,3EU27 84,6 86,8 103,1 122,5 139,6 148,4 151,5 21,8 47,0 79,0EA 57,7 59,3 69,6 83,4 95,9 100,4 99,7 20,7 43,1 72,8EA12 57,2 58,8 69,0 82,6 95,0 99,3 98,6 20,6 42,9 72,4EU15 69,5 71,5 84,2 100,5 115,2 120,5 121,9 21,1 44,8 75,4EU10 10,6 10,8 13,8 16,4 17,9 20,5 21,7 30,4 58,0 106,1EU25 80,1 82,3 98,0 116,8 133,1 141,0 143,7 22,3 46,7 79,4
Source: Eurostat, EUROPOP2008.

45
PARt I — Underlying assumptions and projection methodologies
table 1.12 – Projection of the very old population aged 80 and over (in millions)
Population aged 80+ % change
2008 2010 2020 2030 2040 2050 2060 2008-2020 2020-2060 2008-2060BE 0,5 0,5 0,6 0,8 1,0 1,2 1,3 26,7 99,5 152,7BG 0,3 0,3 0,3 0,4 0,5 0,6 0,7 20,4 114,4 158,3CZ 0,3 0,4 0,4 0,7 0,9 0,9 1,3 23,8 194,9 265,1DK 0,2 0,2 0,3 0,4 0,5 0,6 0,6 18,0 123,8 164,1DE 3,9 4,2 5,8 6,4 8,0 10,4 9,3 48,5 61,6 140,0EE 0,0 0,1 0,1 0,1 0,1 0,1 0,1 40,8 77,7 150,1IE 0,1 0,1 0,2 0,3 0,4 0,5 0,6 38,4 282,4 429,5EL 0,5 0,5 0,7 0,8 1,0 1,3 1,5 63,0 99,9 225,8ES 2,1 2,2 2,8 3,4 4,4 6,0 7,5 33,0 171,4 261,1FR 3,1 3,3 4,0 5,0 6,5 7,5 7,7 27,3 95,9 149,3IT 3,3 3,5 4,5 5,3 6,2 8,0 8,9 37,3 96,9 170,4CY 0,0 0,0 0,0 0,0 0,1 0,1 0,1 47,1 250,6 415,7LV 0,1 0,1 0,1 0,1 0,2 0,2 0,2 38,9 78,1 147,4LT 0,1 0,1 0,2 0,2 0,2 0,3 0,3 43,4 93,4 177,4LU 0,0 0,0 0,0 0,0 0,0 0,1 0,1 40,6 175,2 287,0HU 0,4 0,4 0,5 0,6 0,8 0,8 1,1 26,3 134,1 195,7MT 0,0 0,0 0,0 0,0 0,0 0,0 0,0 49,6 146,4 268,6NL 0,6 0,6 0,8 1,2 1,5 1,9 1,8 29,5 126,7 193,5AT 0,4 0,4 0,5 0,6 0,8 1,0 1,0 17,9 126,4 167,0PL 1,1 1,3 1,7 2,1 3,3 3,3 4,1 45,2 146,0 257,1PT 0,4 0,5 0,6 0,8 1,0 1,2 1,4 44,1 123,7 222,5RO 0,6 0,6 0,9 1,0 1,4 1,7 2,2 47,2 152,6 271,9SI 0,1 0,1 0,1 0,1 0,2 0,2 0,2 56,4 121,3 246,1SK 0,1 0,1 0,2 0,3 0,4 0,5 0,6 25,7 241,4 329,1FI 0,2 0,2 0,3 0,5 0,6 0,6 0,6 35,5 87,8 154,5SE 0,5 0,5 0,5 0,8 0,9 1,0 1,1 8,5 105,1 122,5UK 2,8 2,9 3,3 4,3 5,2 6,7 6,9 18,0 110,7 148,5NO 0,2 0,2 0,2 0,3 0,4 0,5 0,6 4,2 164,1 175,3EU27 21,8 23,3 29,3 36,0 46,1 56,6 61,4 34,2 109,5 181,1EA 15,2 16,3 20,9 25,1 31,7 40,0 42,2 37,5 101,5 177,0EA12 15,1 16,2 20,8 24,9 31,4 39,6 41,8 37,3 101,1 176,2EU15 18,6 19,8 24,8 30,4 38,0 47,9 50,3 33,5 102,7 170,5EU10 2,3 2,6 3,2 4,2 6,1 6,5 8,1 37,8 149,8 244,3EU25 21,0 22,3 28,1 34,6 44,2 54,4 58,4 34,0 108,1 178,8
Source: Eurostat, EUROPOP2008.
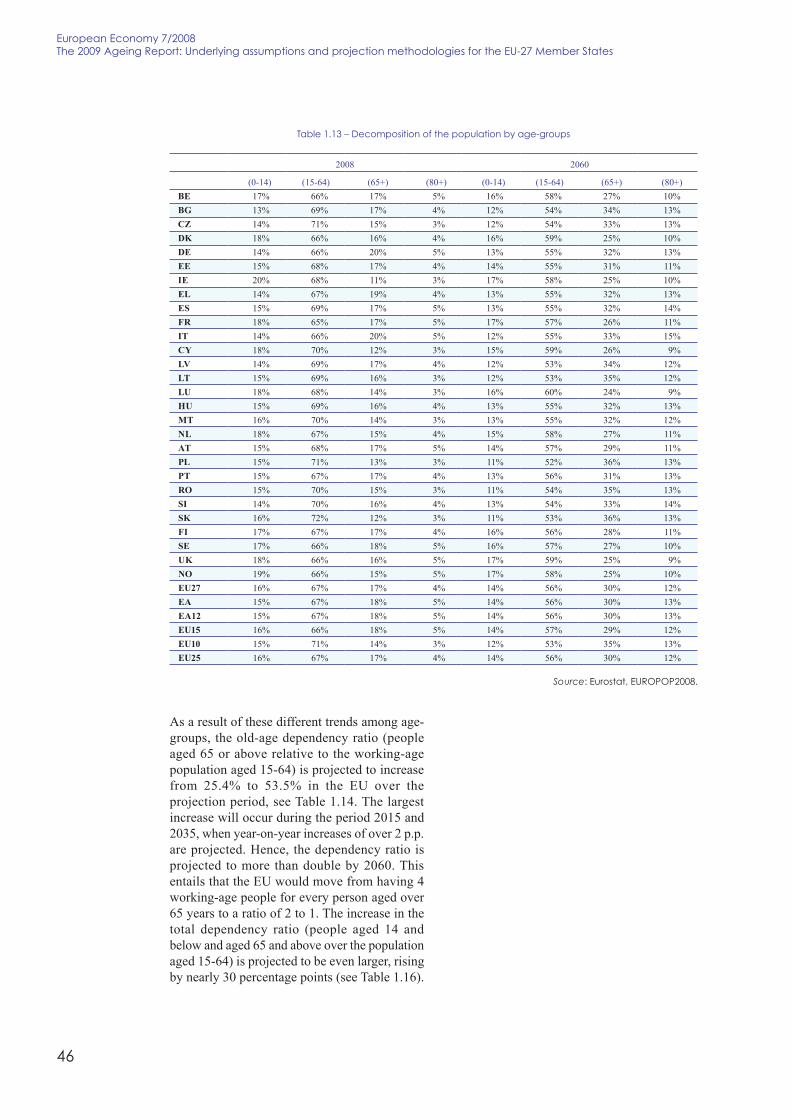
46
European Economy 7/2008the 2009 Ageing Report: Underlying assumptions and projection methodologies for the EU-27 Member states
As a result of these different trends among age-groups, the old-age dependency ratio (peopleaged 65 or above relative to the working-agepopulation aged 15-64) is projected to increasefrom 25.4% to 53.5% in the EU over theprojection period, see Table 1.14. The largestincrease will occur during the period 2015 and2035, when year-on-year increases of over 2 p.p.are projected. Hence, the dependency ratio isprojected to more than double by 2060. Thisentails that the EU would move from having 4working-age people for every person aged over65 years to a ratio of 2 to 1. The increase in thetotal dependency ratio (people aged 14 andbelow and aged 65 and above over the populationaged 15-64) is projected to be even larger, risingby nearly 30 percentage points (see Table 1.16).
table 1.13 – Decomposition of the population by age-groups
2008 2060
(0-14) (15-64) (65+) (80+) (0-14) (15-64) (65+) (80+)BE 17% 66% 17% 5% 16% 58% 27% 10%BG 13% 69% 17% 4% 12% 54% 34% 13%CZ 14% 71% 15% 3% 12% 54% 33% 13%DK 18% 66% 16% 4% 16% 59% 25% 10%DE 14% 66% 20% 5% 13% 55% 32% 13%EE 15% 68% 17% 4% 14% 55% 31% 11%IE 20% 68% 11% 3% 17% 58% 25% 10%EL 14% 67% 19% 4% 13% 55% 32% 13%ES 15% 69% 17% 5% 13% 55% 32% 14%FR 18% 65% 17% 5% 17% 57% 26% 11%IT 14% 66% 20% 5% 12% 55% 33% 15%CY 18% 70% 12% 3% 15% 59% 26% 9%LV 14% 69% 17% 4% 12% 53% 34% 12%LT 15% 69% 16% 3% 12% 53% 35% 12%LU 18% 68% 14% 3% 16% 60% 24% 9%HU 15% 69% 16% 4% 13% 55% 32% 13%MT 16% 70% 14% 3% 13% 55% 32% 12%NL 18% 67% 15% 4% 15% 58% 27% 11%AT 15% 68% 17% 5% 14% 57% 29% 11%PL 15% 71% 13% 3% 11% 52% 36% 13%PT 15% 67% 17% 4% 13% 56% 31% 13%RO 15% 70% 15% 3% 11% 54% 35% 13%SI 14% 70% 16% 4% 13% 54% 33% 14%SK 16% 72% 12% 3% 11% 53% 36% 13%FI 17% 67% 17% 4% 16% 56% 28% 11%SE 17% 66% 18% 5% 16% 57% 27% 10%UK 18% 66% 16% 5% 17% 59% 25% 9%NO 19% 66% 15% 5% 17% 58% 25% 10%EU27 16% 67% 17% 4% 14% 56% 30% 12%EA 15% 67% 18% 5% 14% 56% 30% 13%EA12 15% 67% 18% 5% 14% 56% 30% 13%EU15 16% 66% 18% 5% 14% 57% 29% 12%EU10 15% 71% 14% 3% 12% 53% 35% 13%EU25 16% 67% 17% 4% 14% 56% 30% 12%
Source: Eurostat, EUROPOP2008.

47
PARt I — Underlying assumptions and projection methodologies
table 1.14 – Old age dependency ratio (65+/(15-64))
Old-age dependency ratio % change (p.p.)
2008 2010 2020 2030 2040 2050 2060 2008-2020BE 25,8 26,1 30,6 37,6 42,3 43,9 45,8 20,0BG 25,0 25,3 31,1 36,3 43,6 55,4 63,5 38,6CZ 20,6 21,8 31,1 35,7 42,7 54,8 61,4 40,8DK 23,6 25,0 31,8 37,8 42,7 41,3 42,7 19,1DE 30,3 31,2 35,3 46,2 54,7 56,4 59,1 28,8EE 25,2 25,0 29,2 34,4 39,0 47,2 55,6 30,3IE 16,3 16,7 20,2 24,6 30,6 40,4 43,6 27,3EL 27,8 28,2 32,8 38,5 48,2 57,0 57,1 29,3ES 24,1 24,4 27,4 34,3 46,4 58,7 59,1 34,9FR 25,3 25,8 32,8 39,0 44,0 44,7 45,2 19,9IT 30,5 31,0 35,5 42,4 54,1 59,2 59,3 28,9CY 17,7 18,0 22,3 27,4 30,8 37,7 44,5 26,8LV 25,0 25,2 28,1 34,6 40,7 51,2 64,5 39,4LT 23,0 23,2 26,0 34,7 42,8 51,1 65,7 42,6LU 20,9 21,1 24,2 30,8 36,3 37,8 39,1 18,2HU 23,5 24,2 30,3 34,1 40,1 50,8 57,6 34,1MT 19,8 21,2 31,2 39,1 41,7 49,8 59,1 39,3NL 21,8 22,8 30,7 40,0 46,8 45,6 47,2 25,3AT 25,4 26,0 29,2 38,1 46,0 48,3 50,6 25,2PL 18,9 19,0 27,2 36,0 41,3 55,7 69,0 50,0PT 25,9 26,6 30,7 36,6 44,6 53,0 54,8 28,8RO 21,3 21,3 25,7 30,3 40,7 54,0 65,3 43,9SI 23,0 23,9 31,2 40,8 49,4 59,4 62,2 39,2SK 16,6 16,9 23,8 32,3 40,0 55,5 68,5 51,9FI 24,8 25,7 36,8 43,9 45,1 46,6 49,3 24,5SE 26,7 27,8 33,7 37,4 40,8 41,9 46,7 20,1UK 24,3 24,7 28,6 33,2 36,9 38,0 42,1 17,9NO 22,1 22,7 28,3 34,3 40,2 41,4 43,9 21,8EU27 25,4 25,9 31,1 38,0 45,4 50,4 53,5 28,1EA 27,1 27,7 32,5 40,2 48,6 52,8 53,9 26,7EA12 27,2 27,8 32,5 40,2 48,7 52,8 53,9 26,7EU15 26,7 27,3 31,9 39,0 46,3 49,6 51,3 24,6EU10 20,2 20,5 28,0 35,3 41,3 54,1 64,8 44,6EU25 25,6 26,1 31,3 38,4 45,6 50,2 53,0 27,4
Source: Eurostat, EUROPOP2008.

48
European Economy 7/2008the 2009 Ageing Report: Underlying assumptions and projection methodologies for the EU-27 Member states
table 1.15 – Very old age dependency ratio (80+/(15-64))
Very old-age dependency ratio % change (p.p.)
2008 2010 2020 2030 2040 2050 2060 2008-2060BE 7,1 7,4 8,8 10,6 14,2 17,0 17,7 10,6BG 5,1 5,5 7,0 9,5 13,0 17,0 23,8 18,7CZ 4,7 5,1 6,3 10,3 13,6 16,5 24,6 19,9DK 6,2 6,3 7,4 11,7 14,0 16,4 17,1 10,9DE 7,2 7,7 11,0 13,4 18,1 24,9 24,0 16,9EE 5,3 5,8 8,1 9,3 12,6 15,6 19,4 14,1IE 4,0 4,1 4,8 6,6 9,0 12,4 16,6 12,5EL 6,1 6,8 10,1 11,3 15,2 20,3 24,3 18,2ES 6,7 7,0 8,2 9,9 13,9 20,6 26,5 19,8FR 7,7 8,2 9,8 12,3 16,2 18,3 18,8 11,1IT 8,3 8,9 11,4 13,8 17,5 23,8 27,0 18,7CY 4,0 4,0 5,0 7,0 9,4 11,8 14,7 10,7LV 5,2 5,7 7,9 9,2 12,7 17,1 22,3 17,1LT 4,8 5,3 7,3 8,8 12,8 18,4 22,7 17,9LU 5,2 5,5 6,4 7,9 11,0 14,1 14,8 9,6HU 5,4 5,7 7,3 9,6 13,5 15,8 22,8 17,4MT 4,5 4,8 7,0 11,4 15,1 16,9 21,5 17,0NL 5,6 5,8 7,3 11,5 15,6 19,0 18,8 13,3AT 6,8 7,0 7,8 10,8 14,2 19,6 19,8 13,0PL 4,2 4,6 6,5 8,9 15,0 17,7 24,9 20,7PT 6,3 6,7 8,9 10,7 14,0 18,4 22,7 16,4RO 4,0 4,3 6,2 7,4 11,9 16,5 24,4 20,5SI 5,0 5,6 8,3 10,8 16,8 21,9 25,8 20,7SK 3,6 3,8 4,7 7,2 12,3 16,4 25,0 21,4FI 6,5 7,0 9,3 14,1 17,4 18,7 19,1 12,6SE 8,1 8,1 8,8 12,7 14,1 16,2 17,6 9,5UK 6,8 6,9 7,8 10,1 11,9 14,8 15,3 8,5NO 7,0 6,9 6,9 10,2 13,2 15,8 17,2 10,3EU27 6,5 6,9 8,8 11,2 15,0 19,2 21,7 15,1EA 7,2 7,6 9,8 12,1 16,1 21,0 22,8 15,6EA12 7,2 7,6 9,8 12,1 16,1 21,1 22,8 15,6EU15 7,1 7,5 9,4 11,8 15,3 19,7 21,2 14,0EU10 4,5 4,9 6,6 9,1 14,2 17,1 24,1 19,6EU25 6,7 7,1 9,0 11,4 15,1 19,4 21,5 14,8
Source: Eurostat, EUROPOP2008.

49
PARt I — Underlying assumptions and projection methodologies
1.6. populAtion Ageing in the eu in AglobAl context
This section reviews the demographic prospectsfor the EU in comparison with other parts of theworld. In particular, it looks at the 2006 UNpopulation projection13, and contrasts theprojected population developments in the EUwith other parts of the world.
The share of the population of what is the EUtoday halved from 14.7% of the world populationin 1950 to 7.9% in 2000, and it is projected todrop close to 5% in 2050, despite net migrationflows projected. The share of populations ofJapan and the US was also declining over the lastfive decades. These declining trends over theperiod 1950 to 2000, was in contrast with
13 The United Nations Population Division producesglobal population projections revised every two years. Thelatest projections are the 2006 Revision.
opposing trends in Africa, Asia or Latin America,where the share of the population was rising.
Over the period 2000 to 2050, the share of thepopulation in Asia is projected to account forclose to 60% of the world population, howeverit will grow more slowly than the worldpopulation and its share is projected to fall by3 p.p. This is particularly true for China, wherethe share of the population is projected to fall by5p.p. The population in Africa is projected toincrease much faster than during the period until2050, exceeding 20% of the world population in2050. The other regions of the world will roughlykeep their share in the (growing) worldpopulation.14
14 The UN projects an increase in the world populationfrom 6.1 billions in 2000 to 9.1 billions in 2050.
table 1.16 – total age dependency ratio (0-14 plus 65+/(15-64))
Total dependency ratio % change (p.p.)
2008 2010 2020 2030 2040 2050 2060 2008-2060BE 51,4 51,5 56,9 64,3 68,9 70,7 72,9 21,5BG 44,3 44,8 52,9 55,9 63,2 77,3 85,8 41,4CZ 40,7 41,8 53,6 55,6 62,3 77,1 84,0 43,3DK 51,6 52,6 58,4 65,8 71,9 68,8 70,4 18,8DE 51,0 51,5 54,8 67,4 76,2 78,0 81,9 30,9EE 47,0 47,2 55,5 58,3 61,1 72,1 80,8 33,8IE 46,1 47,1 52,3 53,7 58,1 70,2 72,9 26,8EL 49,1 49,7 55,0 59,1 69,9 80,7 80,5 31,4ES 45,4 46,4 50,8 55,0 67,7 82,8 82,7 37,3FR 53,4 54,2 62,3 68,2 73,6 74,4 74,3 20,8IT 51,7 52,3 56,4 62,3 75,5 81,6 81,4 29,6CY 42,7 42,3 48,1 52,9 54,0 62,1 69,9 27,2LV 44,9 45,0 51,2 55,8 60,1 73,0 87,5 42,6LT 45,3 44,5 47,8 56,8 62,5 72,2 89,1 43,8LU 47,8 47,6 49,6 57,4 63,6 64,5 65,9 18,1HU 45,3 45,8 53,0 55,1 60,7 73,2 80,5 35,2MT 43,1 43,6 53,7 61,7 62,4 71,3 82,1 39,1NL 48,4 48,9 55,0 66,0 73,9 71,2 73,1 24,7AT 48,1 48,1 50,8 60,8 69,0 71,5 74,7 26,6PL 40,7 39,9 49,2 56,5 59,5 76,1 90,6 49,9PT 48,7 49,5 52,7 57,5 66,2 75,8 77,5 28,7RO 43,1 42,9 47,3 49,7 59,7 74,6 86,7 43,6SI 42,8 43,8 52,9 61,5 69,9 82,7 86,0 43,2SK 38,4 37,9 45,0 51,8 57,8 75,3 89,6 51,2FI 50,1 50,7 64,0 72,0 71,9 73,9 77,2 27,1SE 52,2 53,1 61,9 66,2 68,1 69,5 75,6 23,4UK 50,7 50,9 56,3 61,7 64,5 65,4 70,3 19,7NO 51,0 51,3 56,5 63,3 69,4 69,8 72,8 21,8EU27 48,7 49,1 54,8 61,5 68,9 75,0 78,5 29,9EA 50,3 50,9 55,8 63,3 72,4 77,5 78,7 28,4EA12 50,3 51,0 55,9 63,4 72,5 77,5 78,7 28,3EU15 50,5 51,0 56,1 63,2 71,0 74,9 76,9 26,4EU10 41,7 41,5 50,2 56,0 60,3 75,3 87,1 45,4EU25 49,0 49,4 55,2 62,1 69,4 75,0 78,2 29,2
Source: Eurostat, EUROPOP2008.
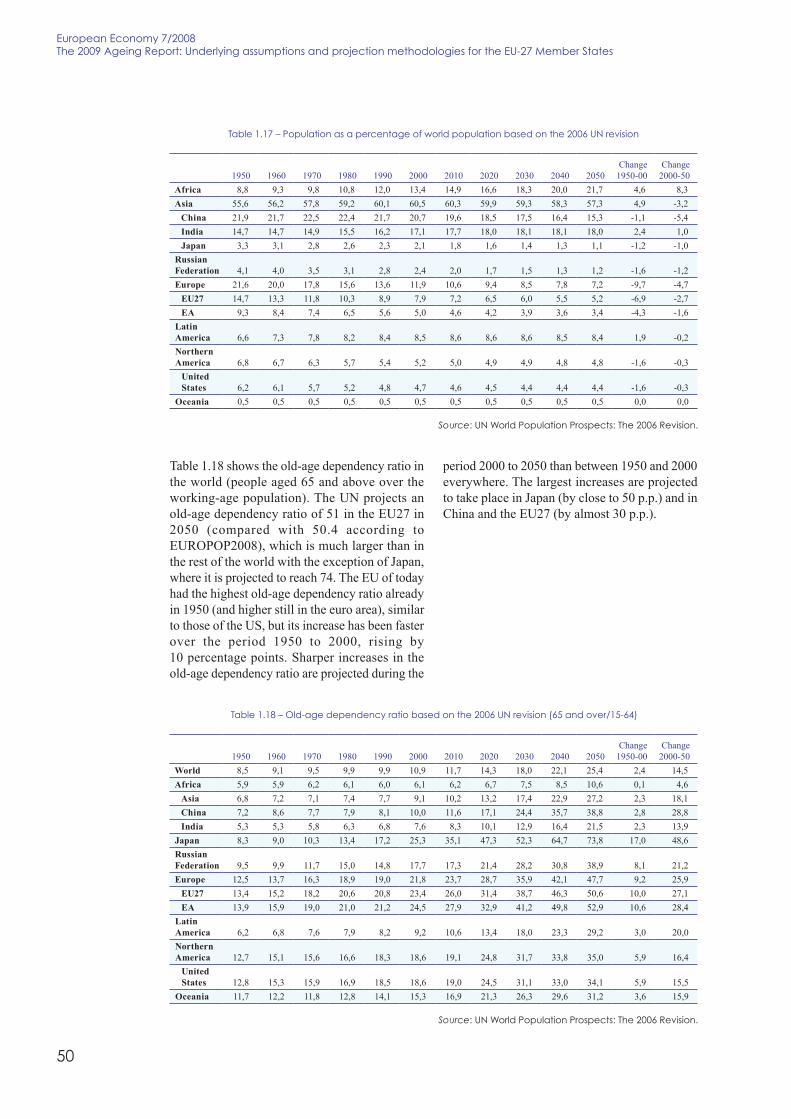
50
European Economy 7/2008the 2009 Ageing Report: Underlying assumptions and projection methodologies for the EU-27 Member states
Table 1.18 shows the old-age dependency ratio inthe world (people aged 65 and above over theworking-age population). The UN projects anold-age dependency ratio of 51 in the EU27 in2050 (compared with 50.4 according toEUROPOP2008), which is much larger than inthe rest of the world with the exception of Japan,where it is projected to reach 74. The EU of todayhad the highest old-age dependency ratio alreadyin 1950 (and higher still in the euro area), similarto those of the US, but its increase has been fasterover the period 1950 to 2000, rising by10 percentage points. Sharper increases in theold-age dependency ratio are projected during the
period 2000 to 2050 than between 1950 and 2000everywhere. The largest increases are projectedto take place in Japan (by close to 50 p.p.) and inChina and the EU27 (by almost 30 p.p.).
table 1.17 – Population as a percentage of world population based on the 2006 UN revision
1950 1960 1970 1980 1990 2000 2010 2020 2030 2040 2050Change
1950-00Change
2000-50Africa 8,8 9,3 9,8 10,8 12,0 13,4 14,9 16,6 18,3 20,0 21,7 4,6 8,3Asia 55,6 56,2 57,8 59,2 60,1 60,5 60,3 59,9 59,3 58,3 57,3 4,9 -3,2
China 21,9 21,7 22,5 22,4 21,7 20,7 19,6 18,5 17,5 16,4 15,3 -1,1 -5,4India 14,7 14,7 14,9 15,5 16,2 17,1 17,7 18,0 18,1 18,1 18,0 2,4 1,0Japan 3,3 3,1 2,8 2,6 2,3 2,1 1,8 1,6 1,4 1,3 1,1 -1,2 -1,0
RussianFederation 4,1 4,0 3,5 3,1 2,8 2,4 2,0 1,7 1,5 1,3 1,2 -1,6 -1,2Europe 21,6 20,0 17,8 15,6 13,6 11,9 10,6 9,4 8,5 7,8 7,2 -9,7 -4,7
EU27 14,7 13,3 11,8 10,3 8,9 7,9 7,2 6,5 6,0 5,5 5,2 -6,9 -2,7EA 9,3 8,4 7,4 6,5 5,6 5,0 4,6 4,2 3,9 3,6 3,4 -4,3 -1,6
LatinAmerica 6,6 7,3 7,8 8,2 8,4 8,5 8,6 8,6 8,6 8,5 8,4 1,9 -0,2NorthernAmerica 6,8 6,7 6,3 5,7 5,4 5,2 5,0 4,9 4,9 4,8 4,8 -1,6 -0,3
UnitedStates 6,2 6,1 5,7 5,2 4,8 4,7 4,6 4,5 4,4 4,4 4,4 -1,6 -0,3
Oceania 0,5 0,5 0,5 0,5 0,5 0,5 0,5 0,5 0,5 0,5 0,5 0,0 0,0
Source: UN world Population Prospects: the 2006 Revision.
table 1.18 – Old-age dependency ratio based on the 2006 UN revision (65 and over/15-64)
1950 1960 1970 1980 1990 2000 2010 2020 2030 2040 2050Change
1950-00Change
2000-50World 8,5 9,1 9,5 9,9 9,9 10,9 11,7 14,3 18,0 22,1 25,4 2,4 14,5Africa 5,9 5,9 6,2 6,1 6,0 6,1 6,2 6,7 7,5 8,5 10,6 0,1 4,6
Asia 6,8 7,2 7,1 7,4 7,7 9,1 10,2 13,2 17,4 22,9 27,2 2,3 18,1China 7,2 8,6 7,7 7,9 8,1 10,0 11,6 17,1 24,4 35,7 38,8 2,8 28,8India 5,3 5,3 5,8 6,3 6,8 7,6 8,3 10,1 12,9 16,4 21,5 2,3 13,9
Japan 8,3 9,0 10,3 13,4 17,2 25,3 35,1 47,3 52,3 64,7 73,8 17,0 48,6RussianFederation 9,5 9,9 11,7 15,0 14,8 17,7 17,3 21,4 28,2 30,8 38,9 8,1 21,2Europe 12,5 13,7 16,3 18,9 19,0 21,8 23,7 28,7 35,9 42,1 47,7 9,2 25,9
EU27 13,4 15,2 18,2 20,6 20,8 23,4 26,0 31,4 38,7 46,3 50,6 10,0 27,1EA 13,9 15,9 19,0 21,0 21,2 24,5 27,9 32,9 41,2 49,8 52,9 10,6 28,4
LatinAmerica 6,2 6,8 7,6 7,9 8,2 9,2 10,6 13,4 18,0 23,3 29,2 3,0 20,0NorthernAmerica 12,7 15,1 15,6 16,6 18,3 18,6 19,1 24,8 31,7 33,8 35,0 5,9 16,4
UnitedStates 12,8 15,3 15,9 16,9 18,5 18,6 19,0 24,5 31,1 33,0 34,1 5,9 15,5
Oceania 11,7 12,2 11,8 12,8 14,1 15,3 16,9 21,3 26,3 29,6 31,2 3,6 15,9
Source: UN world Population Prospects: the 2006 Revision.

51
PARt I — Underlying assumptions and projection methodologies
1.7. coMpArison With the deMogrAphicprojection used in the 2006 Ageingreport
This section provides a comparison of the mainfeatures of the EUROPOP2008 projection withthe projection used in the 2006 Ageing Report.15
In the EU, there is a larger population in 2008compared with the projection used in 2006 AgeingReport (see Table 1.20). By 2050, the populationis projected to be about 37 million larger. Thehigher population in 2050 is concentrated to theworking-age population (15-64), but both moreyoung persons and older persons are projected(see Table 1.21- Table 1.23).
As a result of recent observed increases in netmigration inflows to the EU, especially in someMember States (ES, IT, UK), net migration flowsin the EU are projected to be significantly higherin EUROPOP2008. Though, for some MemberStates (DE, NL, EE, LT, LV, MT, PL, and SI) netmigration flows are projected to be lowercompared to the 2006 projection. Overall, netmigration inflow into the EU is projected to beabout 785 thousand higher in 2010 compared withthe previous projection, and gradually be reducedto about 90 thousands in 2050 (see Table 1.25).Overall, EU net inward migration is projected to
15 In the 2006 Ageing Report, an ‘AWG variant’ was used,building on and expanding the EUROPOPO2004projection.
be 12.6 million higher and therefore constitutesabout a third of the higher total populationprojected in EUROPOP2008 by 2050.
As a result, the increase in old-age dependencyratio (persons aged 65 and over in relation topersons aged 15-64) is lower in theEUROPOP2008 projection compared with theprojection used in the 2006 Ageing Report in theEU25, rising less; by 24.6 percentage pointsbetween 2008 and 2050 according toEUROPOP2008 (by 25.8 percentage points inthe previous projection over the same period),see Table 1.24. Due to diverging changes ofassumptions, the projected increase in the old-age dependency ratio is significantly lower inUK, ES, PT, CY, IE, AT, EL, BE and IT andsignificantly higher in MT, LV, LT, SK, PL, NL,DE, SI, EE (in the order of the magnitude).
table 1.19 – Very old-age dependency ratio based on the 2006 UN revision (80 and over/15-64)
1950 1960 1970 1980 1990 2000 2010 2020 2030 2040 2050Change
1950-00Change
2000-50World 0,9 1,1 1,3 1,4 1,6 1,8 2,4 2,9 3,6 5,1 6,8 0,9 5,0Africa 0,5 0,5 0,6 0,6 0,6 0,7 0,8 0,9 1,0 1,3 1,7 0,2 1,0
Asia 0,6 0,7 0,8 0,8 0,9 1,3 1,8 2,4 3,1 4,8 7,0 0,7 5,7China 0,5 0,6 0,9 0,7 0,9 1,3 2,0 2,9 4,3 7,4 12,0 0,9 10,7India 0,6 0,6 0,6 0,6 0,7 1,0 1,3 1,7 2,1 3,2 4,6 0,4 3,7
Japan 0,8 1,1 1,3 2,0 3,4 5,6 9,8 15,2 21,8 25,7 30,3 4,8 24,7RussianFederation 1,5 1,6 1,8 2,0 2,7 2,7 3,9 4,9 5,0 8,2 9,4 1,2 6,8Europe 1,7 2,1 2,5 3,1 4,1 4,3 6,1 7,7 9,5 13,0 16,6 2,6 12,3
EU27 1,7 2,2 2,8 3,6 4,7 5,0 7,1 8,8 11,1 14,8 18,9 3,3 13,9EA 1,8 2,3 3,0 3,8 5,1 5,4 7,8 9,8 12,2 16,2 21,0 3,6 15,6
LatinAmerica 0,8 0,8 0,9 1,1 1,3 1,7 2,3 2,8 3,9 5,8 8,2 0,9 6,6NorthernAmerica 1,8 2,3 2,9 3,5 3,9 4,8 5,5 5,8 8,2 11,4 12,8 3,0 7,9
UnitedStates 1,8 2,4 3,0 3,6 3,9 4,9 5,5 5,7 8,0 11,1 12,3 3,1 7,5
Oceania 1,6 1,8 2,0 2,2 2,7 3,4 4,5 5,1 7,1 9,4 11,0 1,9 7,6
Source: UN world Population Prospects: the 2006 Revision.

52
European Economy 7/2008the 2009 Ageing Report: Underlying assumptions and projection methodologies for the EU-27 Member states
table 1.20 – total population compared (EUROPOP2008 – 2006 Ageing Report) (‘000)
2008 2010 2020 2030 2040 2050 Diff in 2050 as % of total population 2005 AWG variantBE 152 230 536 774 1036 1345 12,4BGCZ 192 272 642 727 838 998 11,2DK 29 46 126 207 300 402 7,3DE -766 -967 -2028 -2511 -2891 -3250 -4,2EE 11 19 63 65 58 56 4,9IE 190 291 647 813 903 1056 19,3GR 16 37 118 227 443 711 6,6ES 1076 2060 5504 7236 8575 10252 23,9FR 895 1109 2118 3043 4249 5897 9,1IT 1214 1554 3026 4371 5916 7478 13,9CY 29 37 89 151 215 276 28,3LV 4 8 36 10 -29 -69 -3,7LT -14 -8 38 -9 -83 -144 -5,0LU 13 17 30 39 48 54 8,4HU 17 42 200 167 128 146 1,6MT -5 -9 -27 -48 -71 -93 -18,4NL -138 -171 -331 -439 -542 -718 -4,1AT 123 149 286 480 718 957 11,7PL 158 262 895 433 -154 -390 -1,2PT -21 35 329 639 997 1397 13,9ROSI 14 19 41 17 -7 -23 -1,2SK 39 61 162 146 114 122 2,6FI 30 43 96 126 169 230 4,4SE 66 119 284 374 428 490 4,8UK 752 1059 2754 4856 7332 10296 16,0NOEU27EA 2822 4436 10432 14918 19756 25569 8,2EA12 2784 4388 10329 14798 19619 25409 8,2EU15 3632 5612 13492 20235 27680 36598 9,4EU10 446 702 2138 1660 1009 878 1,3EU25 4077 6314 15630 21895 28689 37475 8,3
Source: Eurostat, 2006 Ageing Report.

53
PARt I — Underlying assumptions and projection methodologies
table 1.21 – working-age (15-64) population compared (EUROPOP2008 – 2006 Ageing Report) (‘000)
2008 2010 2020 2030 2040 2050 Diff in 2050 as % of population 2005 AWG variantBE 85 136 338 572 744 858 13,7BGCZ 112 150 384 538 562 562 11,2DK 17 23 39 96 163 221 6,7DE -595 -716 -1382 -2088 -2741 -3118 -6,9EE 3 7 33 36 24 16 2,4IE 159 229 435 542 655 672 21,2GR -6 -2 39 163 316 458 7,8ES 909 1576 3792 4985 5802 6183 27,0FR 559 624 900 1687 2518 3296 8,8IT 889 1103 2008 2980 3870 4385 14,9CY 25 28 61 113 152 182 30,8LV 3 7 37 17 -30 -65 -5,9LT -2 2 30 -10 -72 -127 -7,4LU 10 12 22 29 32 30 7,6HU 12 21 143 193 142 50 1,0MT -4 -6 -16 -31 -50 -67 -21,6NL -108 -129 -267 -417 -525 -697 -6,6AT 92 112 217 357 502 623 13,3PL 29 62 493 503 25 -498 -2,6PT 4 51 315 540 796 998 18,1ROSI 6 4 13 8 -17 -37 -3,5SK 24 34 87 107 78 31 1,1FI 11 16 43 77 102 119 3,9SE 44 80 182 243 279 248 4,1UK 482 663 1606 3323 5470 7284 19,3NOEU27EA 2038 3040 6519 9518 12156 13885 7,9EA12 2011 3013 6461 9428 12071 13807 7,9EU15 2553 3779 8289 13091 17983 21560 9,7EU10 208 309 1267 1474 815 45 0,1EU25 2762 4088 9555 14565 18798 21605 8,3
Source: Eurostat, 2006 Ageing Report.

54
European Economy 7/2008the 2009 Ageing Report: Underlying assumptions and projection methodologies for the EU-27 Member states
table 1.22 – Population aged 0-14 compared (EUROPOP2008 –2006 Ageing Report) (‘000)
2008 2010 2020 2030 2040 2050 Diff in 2050 as % of population 2005 AWG variantBE 57 82 201 219 262 317 19,8BGCZ 60 93 184 82 98 130 11,6DK 5 13 61 70 88 109 12,9DE -183 -277 -724 -572 -409 -485 -5,1EE 5 7 17 9 8 5 3,0IE 21 48 196 259 223 266 30,3GR 12 24 61 75 133 193 14,8ES 109 370 1379 1657 1676 2019 40,4FR 207 328 1021 1169 1340 1756 17,0IT 187 265 641 810 1047 1364 22,1CY 4 10 33 38 48 59 45,4LV 1 0 -13 -28 -29 -49 -17,8LT -5 -6 -1 -21 -47 -59 -15,0LU 2 3 5 4 6 6 5,8HU 8 24 68 -27 -62 -58 -4,7MT -2 -4 -9 -14 -18 -22 -29,5NL -59 -83 -154 -155 -183 -231 -8,4AT 15 26 67 118 181 226 22,4PL 77 127 234 -321 -539 -533 -12,2PT -34 -35 -19 70 122 178 13,6ROSI 5 9 19 1 -1 -4 -1,6SK 12 20 43 -17 -53 -58 -9,5FI 8 13 44 50 50 59 7,4SE 13 26 81 98 73 76 4,6UK 240 384 1394 2043 2412 2916 30,9NOEU27EA 349 780 2762 3728 4477 5701 13,8EA12 342 765 2720 3704 4449 5667 13,9EU15 600 1187 4257 5914 7021 8769 16,6EU10 166 281 575 -298 -596 -589 -6,8EU25 766 1469 4831 5616 6426 8180 13,3
Source: Eurostat, 2006 Ageing Report.

55
PARt I — Underlying assumptions and projection methodologies
table 1.23 – Population aged 65 and over compared (EUROPOP2008 – 2006 Ageing Report) (‘000)
2008 2010 2020 2030 2040 2050 Diff in 2050 as % of population 2005 AWG variantBE 10 11 -3 -17 30 170 5,7BGCZ 19 29 73 107 179 307 11,2DK 7 10 26 41 48 72 5,2DE 12 25 77 149 259 353 1,5EE 3 5 13 20 26 35 12,0IE 9 14 16 12 25 118 8,3GR 11 15 17 -10 -5 60 1,7ES 57 114 333 594 1096 2049 13,6FR 129 157 196 187 391 845 4,9IT 138 187 376 581 998 1729 9,5CY 0 -1 -5 -1 15 36 14,0LV 0 1 11 21 29 45 9,3LT -7 -4 8 22 36 42 5,5LU 1 1 3 6 10 18 12,6HU -4 -4 -11 1 48 154 6,1MT 2 1 -1 -3 -3 -5 -4,0NL 29 41 90 133 166 209 4,9AT 16 12 1 4 35 108 4,4PL 52 73 167 251 360 641 6,5PT 9 19 34 29 79 222 6,9ROSI 2 6 10 9 11 18 3,1SK 4 7 32 56 90 149 10,7FI 11 14 9 -1 17 53 3,8SE 9 14 20 33 77 166 6,7UK 31 12 -247 -510 -550 96 0,6NOEU27EA 436 615 1151 1672 3122 5983 6,3EA12 432 610 1148 1667 3099 5934 6,4EU15 479 645 947 1230 2675 6268 5,5EU10 71 112 296 484 790 1422 7,5EU25 550 757 1243 1714 3465 7690 5,8
Source: Eurostat, 2006 Ageing Report.

56
European Economy 7/2008the 2009 Ageing Report: Underlying assumptions and projection methodologies for the EU-27 Member states
table 1.24 – Old-age dependency ratio (persons aged 65 and over in relations to persons aged 15-64) compared(EUROPOP2008 – 2006 Ageing Report) (percentage points)
2008 2010 2020 2030 2040 2050 2008-2050BE -0,2 -0,3 -1,6 -3,5 -4,5 -3,3 -3,1BGCZ -0,1 -0,1 -0,7 -1,4 -1,1 0,0 0,0DK 0,1 0,1 0,4 0,1 -0,7 -0,6 -0,7DE 0,3 0,5 1,0 2,2 3,7 4,7 4,3EE 0,3 0,4 0,4 1,0 2,3 4,1 3,7IE -0,6 -0,8 -2,3 -3,7 -5,4 -4,8 -4,2GR 0,2 0,2 0,1 -1,0 -2,4 -3,4 -3,6ES -0,5 -0,9 -2,3 -3,9 -6,1 -6,9 -6,4FR 0,0 0,0 -0,3 -1,2 -1,9 -1,7 -1,6IT -0,3 -0,4 -0,9 -1,9 -3,5 -3,0 -2,6CY -0,8 -1,1 -3,2 -5,4 -5,3 -5,5 -4,7LV -0,1 -0,1 0,0 1,2 3,4 7,1 7,2LT -0,3 -0,2 0,0 1,3 3,6 6,3 6,5LU -0,5 -0,5 -0,5 -0,8 -0,4 1,7 2,2HU -0,1 -0,1 -0,9 -1,1 -0,2 2,5 2,6MT 0,8 0,8 1,3 3,2 5,9 9,1 8,3NL 0,5 0,6 1,5 2,8 3,9 5,0 4,5AT -0,1 -0,3 -1,1 -2,5 -4,0 -4,1 -4,0PL 0,2 0,2 0,1 0,3 1,6 4,7 4,6PT 0,1 0,1 -0,9 -2,5 -4,5 -5,6 -5,7ROSI 0,0 0,3 0,4 0,4 1,7 3,8 3,8SK 0,0 0,0 0,3 0,6 1,9 4,8 4,8FI 0,2 0,3 -0,2 -1,1 -0,9 -0,1 -0,3SE 0,0 -0,1 -0,7 -1,0 -0,6 1,0 1,1UK -0,2 -0,4 -1,7 -4,1 -6,7 -7,1 -6,9NOEU27EAEA12EU15 -0,1 -0,1 -0,7 -1,6 -2,5 -2,0 -1,9EU10EU25 -0,1 -0,1 -0,6 -1,3 -1,9 -1,2 -1,2
Source: Eurostat, 2006 Ageing Report.
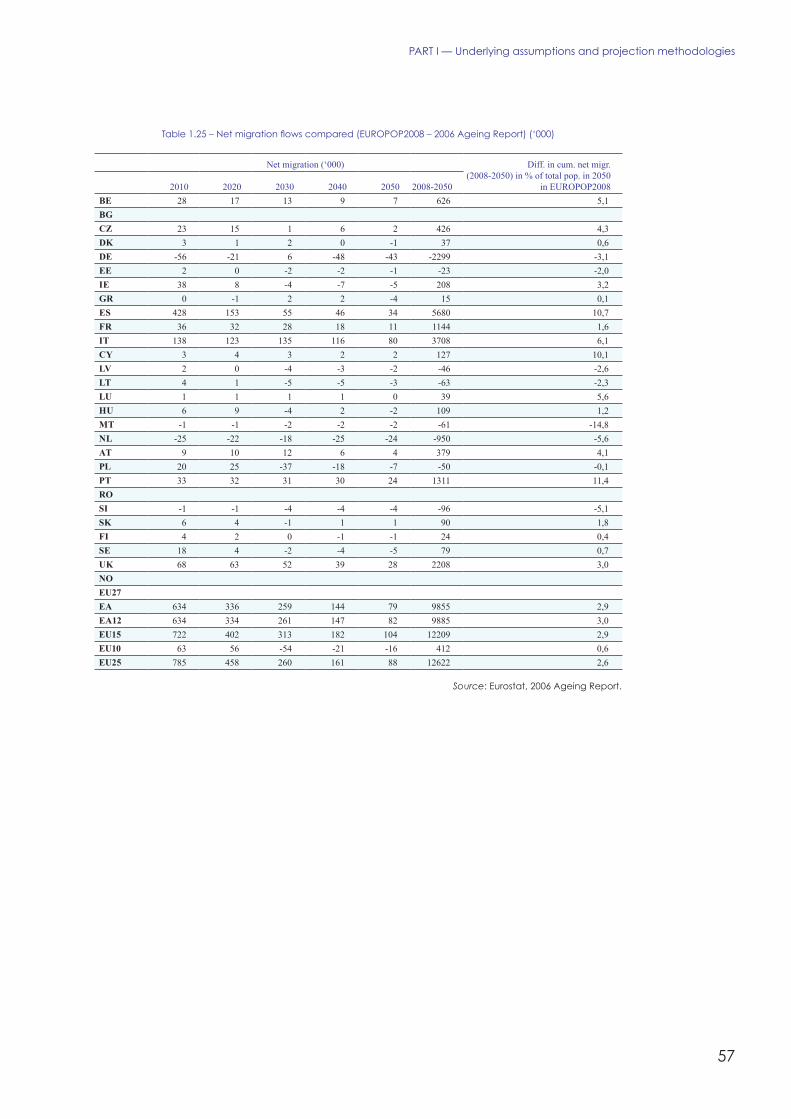
57
PARt I — Underlying assumptions and projection methodologies
Table 1.25 – Net migration flows compared (EUROPOP2008 – 2006 Ageing Report) (‘000)
Net migration (‘000) Diff. in cum. net migr.(2008-2050) in % of total pop. in 2050
in EUROPOP20082010 2020 2030 2040 2050 2008-2050BE 28 17 13 9 7 626 5,1BGCZ 23 15 1 6 2 426 4,3DK 3 1 2 0 -1 37 0,6DE -56 -21 6 -48 -43 -2299 -3,1EE 2 0 -2 -2 -1 -23 -2,0IE 38 8 -4 -7 -5 208 3,2GR 0 -1 2 2 -4 15 0,1ES 428 153 55 46 34 5680 10,7FR 36 32 28 18 11 1144 1,6IT 138 123 135 116 80 3708 6,1CY 3 4 3 2 2 127 10,1LV 2 0 -4 -3 -2 -46 -2,6LT 4 1 -5 -5 -3 -63 -2,3LU 1 1 1 1 0 39 5,6HU 6 9 -4 2 -2 109 1,2MT -1 -1 -2 -2 -2 -61 -14,8NL -25 -22 -18 -25 -24 -950 -5,6AT 9 10 12 6 4 379 4,1PL 20 25 -37 -18 -7 -50 -0,1PT 33 32 31 30 24 1311 11,4ROSI -1 -1 -4 -4 -4 -96 -5,1SK 6 4 -1 1 1 90 1,8FI 4 2 0 -1 -1 24 0,4SE 18 4 -2 -4 -5 79 0,7UK 68 63 52 39 28 2208 3,0NOEU27EA 634 336 259 144 79 9855 2,9EA12 634 334 261 147 82 9885 3,0EU15 722 402 313 182 104 12209 2,9EU10 63 56 -54 -21 -16 412 0,6EU25 785 458 260 161 88 12622 2,6
Source: Eurostat, 2006 Ageing Report.

58
European Economy 7/2008the 2009 Ageing Report: Underlying assumptions and projection methodologies for the EU-27 Member states
Annex 1.1:the europop2008 projection: keyAssuMptions
Population projections
Population projections are what-if scenarios thataim to provide information about a likely futuresize and structure of the population. A projectionis thus a conditional statement, an “if…then”declaration, whose numerical outcome is the resultof an accepted set of assumptions (scenario).
Once developed the quantitative assumptions,for the calculation of the population projectionsthe disaggregated base population is advancedeach year of the projections period by using therespective – projected – age specific fertilityrates, age specific mortality rates, immigrationand emigration by sex and single year of age(cohort-component method).
Methodological framework:the Convergence scenario
Eurostat’s Convergence scenario is one of severalpossible population change scenarios, withrelated assumptions for fertility, mortality andmigration. The EUROPOP2008 Convergencescenario starts from the population on 1 January2008 and it is based on the main assumption thatthe socio-economic and cultural differencesbetween Member States of the European Unionwould fade away in the very long run. Theconvergence year has been assumed to be 2150and agreed theoretical values have been set forthe three demographic components (fertility,mortality and migration) for that year. The valuesfor the intermediate years (2008-2060) wereobtained by interpolating the latest countryspecific observed values and those in theconvergence year for fertility, mortality andmigration respectively. Convergent trajectoriesare thus ensured among countries for anyintermediate year up to the target year 2060.
Fertility
In the convergence year 2150, fertility is assumedto converge to levels achieved by Member Statesthat are considered as forerunners in thedemographic process. The age specific fertilityrates for the convergence year for the total fertilityrate of 1.85 and the mean age at childbearing30.3 years-old have been modelled using themodel proposed by Schmertmann (2003) and thesoftware he has made available (Schmertmann,
2005). This model describes the shape of the agefertility rates using only three parameters: theyoungest age α at which fertility rises above zero,the age P at which fertility reaches its peak leveland the youngest age H above P at which fertilityfalls to half of its peak level. The age specificfertility rates for the intermediate years wereobtained by linear interpolation between the latestASFR and those for the convergence year as fromSchmertmann’s model.
life expectancy
Life expectancy increases are assumed to begreater for countries at lower levels of lifeexpectancy and smaller for those at higher levels,thus following convergent trajectories. In theconvergence year 2150 (e°(M): 92.9 years ande°(F): 96.3 years), the values for the age specificmortality rates for males and females wereobtained using the model proposed by Booth etal. (2002), which is a variant of the Lee-Cartermodel. The model was applied on the aggregateddata on deaths and exposure at risk populationfor twelve countries (BE, DK, DE, ES, FX, IT,NL, AT, PT, FI, SE and UK), for males andfemales respectively, fitted over the period 1977-2005. The age specific mortality rates for theintermediate years were obtained by exponentialinterpolation between the smoothed latestavailable country specific mortality rates andthose from the model in 2150.
Migration
Migration is assumed to converge to zero netmigration in 2150. Additionally, migration in eachcountry has been proportionally adjusted upwardsif the working age population, after taking intoaccount the converging migration, presented adeficit for the respective projection years.
The starting points for the immigration andemigration have been estimated from the availabledata of the latest years 2000-2006, without takinginto account the lowest and highest values for thespecific period. Data by single year of age havebeen obtained from available 5-year age groupsusing Sprague multipliers (Siegel and Swanson,2004) and subsequently using the Rogers-Castromodel (Rogers and Castro, 1981). The latter wasused in order to remove random fluctuations andimperfections of the data.
2.1. lAbour force projections inthe long-terM projection exercise

59
PARt I — Underlying assumptions and projection methodologies
2.1.1. the approach used in the 2006budgetary projections of the EPC
The EPC based its 2006 labour force projectionon the cohort component methodology.16 Themethodology follows a dynamic approach.17
Participation rates were projected for males andfemales by single year of age, taking into accountthe replacement of older cohorts by more recentones. The labour force projection shows theoutcome for the labour force of extrapolatingrecent trends in rates of entry and exit from thelabour market. This baseline projection reflectsthe working assumption of “no policy change”and is neither a forecast nor a prediction in thatit is not based on any assessment of more or lesslikely future changes in working patterns oreconomic conditions.
2.1.2. Past trends and main determinants oflabour market performance
The rationale for choosing a cohort-componentmethodology is to reflect the substantial changesin the labour market situation amongst differentage and gender groups over the past yearsand decades. In recent years, labour forceparticipation has undergone substantial changes,especially for the young, women and the elderly.A variety of factors underlies these changes, inparticular the following:
• social factors, such as longer schooling orchange in the role of women in households;
• demographic factors, including the decline offertility rates and modifications of the agestructure;
• institutional factors, in particular earlyretirement schemes or changes in the age ofretirement; and/or
16 The methodology was initially developed by the OECD,see Scherer (2002), Burniaux et al. (2003) and OECD(2003). The baseline scenario incorporates the projectedevolution of a number of control variables (unemployment,fertility) and the projected impact of recent pensionreforms, including measures to be phased in gradually.For another application of the same cohort method, see alsoAustralian Productivity Commission (2005).17 See Carone (2005), European Commission (2004) andEuropean Commission (2005).
• economic factors, such as the rate ofunemployment, the average householdincome, the share of part-time employmentor the share of the services sector in theeconomy.
Even if each country has its own evolution of thelabour force (see Table 2.1 to Table 2.4), somecommon stylised facts warrant attention andneed to be catered for in any projection exercise.18
They can be summarised as follows:
• the participation rates of prime-age maleworkers (aged 25 to 54 years), at around90%, remain the highest of all groups. Incontrast, the participation rates of men aged55 to 64 years have recorded a steady declinein the past decades, but there are signs ofreversal in many countries since the turn ofthe century;
• female participation rates have steadilyincreased over the past 25 years;
• the participation rates of young people (aged15 to 24 years) have declined, mostly due tolonger schooling;
• looking forward, the population of working-age is projected to decline substantially incoming decades, as large cohorts of peopleenter retirement and are replaced by smallercohorts of young workers. The increasingshare of older workers in the labour forcecould put downward pressure on the overallparticipation rate.
Given these trends, the main drivers of change inthe overall participation rate will be changes inthe labour force attachment of prime-agedfemales, older workers (especially men) and, toa lesser extent, young people.
18 The figures reported in Table 2.1 to Table 2.4 are takenfrom Eurostat’s Labour force survey database and reflectthe annual average participation rates.
2. lABOUR FORCE PROjECtIONs

60
European Economy 7/2008the 2009 Ageing Report: Underlying assumptions and projection methodologies for the EU-27 Member states
table 2.1 – Historical participation rates: workers aged 15 to 64
Total Males Females
Country 1985 1990 1995 2000 2006 1985 1990 1995 2000 2006 1985 1990 1995 2000 2006BE 59,6 58,7 62,1 65,1 66,5 74,2 71,3 72,3 73,7 73,4 45,1 46,1 51,7 56,4 59,5BG 60,7 64,5 66,2 68,8 55,6 60,2CZ 71,3 70,3 79,1 78,3 63,6 62,3DK 80,3 82,4 79,5 80,0 80,6 86,0 87,1 85,6 84,2 84,1 74,6 77,6 73,3 75,6 77,0DE 66,2 69,9 70,5 71,0 75,3 81,1 82,1 79,6 78,8 81,3 51,7 57,6 61,3 63,0 69,3EE 70,2 72,4 75,6 75,8 65,3 69,3IE 60,9 60,7 61,6 68,2 71,8 82,2 78,8 76,1 79,9 81,5 39,1 41,9 47,1 56,3 61,9GR 60,0 59,1 60,1 63,8 67,0 80,6 76,8 77,2 77,4 79,1 41,1 42,6 44,2 50,5 55,0ES 58,7 60,6 65,4 70,8 77,5 75,5 78,8 81,3 40,6 45,8 52,0 60,2FR 67,6 67,1 67,6 68,8 70,0 78,9 76,5 74,9 75,2 75,1 56,7 58,0 60,6 62,5 65,0IT 58,8 59,8 57,6 60,1 62,7 78,6 77,0 73,2 74,1 74,6 39,7 43,2 42,4 46,3 50,8CY 68,9 73,0 81,3 82,7 57,3 63,8LV 67,0 71,3 72,3 76,2 62,1 66,7LT 70,5 67,4 74,3 70,5 67,1 64,6LU 60,4 60,2 60,4 64,2 66,7 79,0 77,6 75,7 76,4 75,3 42,1 42,3 43,7 51,7 58,2HU 60,1 62,0 67,9 68,7 52,7 55,5MT 58,2 59,2 80,3 79,7 35,8 38,3NL 58,4 66,2 69,2 75,2 77,4 75,4 79,7 79,9 84,1 83,9 41,1 52,4 58,3 66,0 70,7AT 71,5 71,0 73,7 80,8 80,1 80,5 62,3 62,0 67,0PL 65,8 63,4 71,7 70,1 59,9 56,8PT 68,8 67,4 71,4 73,9 81,4 76,4 79,2 79,5 57,1 59,1 63,9 68,4RO 68,4 63,6 75,0 70,7 61,9 56,6SI 67,5 70,9 71,9 74,9 62,9 66,7SK 69,9 68,6 76,8 76,4 63,2 60,9FI 72,1 74,5 75,2 74,8 77,2 77,1 69,4 71,9 73,3SE 77,8 75,3 78,8 79,6 77,2 81,2 75,8 73,4 76,3UK 73,6 76,5 74,7 75,4 75,5 86,2 86,8 83,3 82,8 82,1 61,0 66,1 66,0 68,2 69,2NO 80,2 78,0 84,2 81,3 76,1 74,7EU27 68,5 70,3 77,1 77,6 60,1 63,0EA 65,5 67,6 70,7 76,4 77,2 78,5 54,6 58,0 62,8EA12EU15 67,2 69,0 71,7 77,7 78,2 79,2 56,8 59,9 64,3EU10 66,6 65,2 73,0 72,2 60,4 58,5EU25 68,6 70,7 77,3 78,0 60,0 63,4
Source: Commission services.

61
PARt I — Underlying assumptions and projection methodologies
table 2.2 – Historical participation rates: young workers ages 15 to 24
Total Males Females
Country 1985 1990 1995 2000 2006 1985 1990 1995 2000 2006 1985 1990 1995 2000 2006BE 42,3 35,5 33,9 35,3 34,7 43,1 37,1 36,0 38,7 37,4 41,4 34,2 31,7 31,8 31,9BG 30,7 28,9 35,9 31,3 26,3 26,4CZ 44,4 33,5 48,3 37,7 40,6 29,2DK 75,6 73,5 73,2 70,7 69,9 78,7 76,4 77,1 73,4 70,5 72,1 70,5 69,4 67,8 69,3DE 58,3 60,7 52,5 50,4 50,3 60,7 62,5 54,6 53,7 52,9 55,9 58,8 50,3 47,1 47,6EE 37,4 35,9 42,0 41,2 32,7 30,6IE 57,7 49,9 44,9 54,2 54,7 62,2 53,9 48,2 58,1 59,0 53,1 45,6 41,5 50,1 50,2GR 40,6 39,5 36,7 39,0 32,4 48,2 44,0 41,3 41,7 36,1 34,0 35,3 32,5 36,2 28,7ES 47,0 41,6 43,9 48,2 51,6 44,6 48,0 52,2 42,5 38,6 39,7 43,9FR 51,4 44,6 35,5 35,5 38,4 55,3 47,7 37,3 38,6 42,2 47,8 41,6 33,8 32,4 34,6IT 47,6 46,8 38,7 38,4 32,5 53,2 50,7 43,9 42,5 37,8 42,2 43,0 33,6 34,3 26,9CY 40,9 41,5 42,4 44,9 39,6 38,3LV 37,4 40,8 43,4 47,8 31,2 33,6LT 36,1 26,3 41,7 29,3 30,5 23,1LU 58,9 44,9 40,8 34,0 27,8 60,7 48,0 44,0 37,4 30,5 57,1 41,7 41,7 30,5 24,8HU 38,3 26,8 43,2 30,1 33,3 23,4MT 59,5 53,3 59,9 57,3 59,0 49,1NL 46,9 59,6 62,0 72,9 70,8 46,3 59,9 62,2 73,7 71,5 47,5 59,2 61,8 72,0 70,1AT 61,7 55,4 59,4 64,6 60,3 63,9 58,9 50,5 55,1PL 37,8 34,2 40,9 37,5 34,8 30,7PT 58,4 43,1 46,3 42,7 63,8 47,2 51,5 46,6 53,0 38,9 41,0 38,7RO 41,4 30,6 46,0 35,1 36,8 25,9SI 39,2 40,6 41,7 44,4 36,5 36,4SK 46,0 35,3 49,4 39,7 42,5 30,8FI 49,7 52,3 51,8 51,2 53,6 52,6 48,1 51,0 51,0SE 45,5 40,7 51,3 44,1 41,1 50,8 46,8 40,4 51,9UK 69,6 71,8 63,7 64,8 61,9 75,3 76,7 67,9 67,9 64,3 63,7 66,7 59,2 61,7 59,4NO 64,4 57,4 66,3 56,9 62,4 58,0EU27 45,3 44,1 48,8 47,4 41,8 40,6EA 44,0 44,6 44,6 46,9 48,1 48,1 41,0 41,1 40,9EA12EU15 47,2 47,5 47,9 50,4 50,8 51,1 44,0 44,1 44,6EU10 39,1 32,7 42,5 36,7 35,7 28,6EU25 45,8 45,1 49,2 48,4 42,5 41,7
Source: Commission services.

62
European Economy 7/2008the 2009 Ageing Report: Underlying assumptions and projection methodologies for the EU-27 Member states
table 2.3 – Historical participation rates: prime age workers aged 25 to 54
Total Males Females
Country 1985 1990 1995 2000 2006 1985 1990 1995 2000 2006 1985 1990 1995 2000 2006BE 75,7 76,7 80,4 82,4 84,5 94,0 92,2 92,3 91,8 91,9 57,1 60,8 68,2 72,7 77,0BG 80,6 82,3 83,3 85,1 78,0 79,4CZ 88,4 88,2 94,9 94,8 81,8 81,3DK 89,1 91,2 87,1 87,9 88,9 93,5 94,5 91,8 91,7 92,3 84,5 87,7 82,1 84,0 85,4DE 77,0 80,0 83,3 85,4 87,6 94,6 93,9 93,1 93,7 93,8 59,2 65,6 73,2 77,0 81,4EE 87,0 89,1 90,9 92,8 83,3 85,8IE 66,1 69,5 72,8 78,3 81,5 94,3 93,3 91,0 92,0 92,1 37,1 45,1 54,8 64,7 70,7GR 70,6 72,2 74,2 78,1 82,0 94,8 94,3 94,5 94,4 94,7 47,8 51,5 55,0 62,0 69,1ES 70,0 74,3 78,0 82,0 94,2 92,9 93,1 92,5 46,7 55,7 62,8 71,2FR 82,2 83,8 86,1 86,4 87,8 96,0 95,6 95,1 94,3 94,2 68,4 72,2 77,2 78,6 81,7IT 70,4 72,8 71,9 74,3 77,8 95,2 94,0 90,3 90,6 91,3 46,5 52,1 53,6 57,9 64,3CY 81,6 86,2 95,3 95,3 68,5 77,4LV 85,5 86,4 87,8 90,0 83,3 82,9LT 88,8 86,2 89,7 88,7 87,9 83,8LU 69,7 72,9 73,9 79,8 84,5 94,9 95,4 93,6 94,2 95,3 43,4 49,4 53,3 64,9 73,8HU 77,3 79,6 84,4 86,5 70,4 72,9MT 64,2 68,0 93,5 94,1 34,5 41,2NL 69,6 76,0 79,4 83,7 87,1 92,7 93,4 92,6 93,9 94,1 45,4 57,9 65,7 73,2 80,1AT 83,3 85,3 87,1 93,2 94,0 93,2 73,3 76,5 80,9PL 82,4 81,7 88,3 88,2 76,5 75,4PT 79,8 83,4 84,8 87,7 94,0 93,6 92,5 92,9 66,9 74,1 77,4 82,7RO 83,0 79,9 90,0 87,1 76,0 72,6SI 87,4 89,0 90,6 91,0 84,2 87,0SK 88,4 87,6 93,9 94,0 82,9 81,2FI 85,4 87,9 87,8 88,3 90,8 90,3 82,4 84,9 85,3SE 89,9 86,8 89,4 92,2 88,6 92,5 87,6 84,9 86,3UK 81,6 84,0 83,4 83,9 84,5 95,5 95,0 92,7 91,8 91,6 67,7 73,0 74,0 76,2 77,6NO 87,4 86,9 91,2 90,5 83,4 83,3EU27 82,7 84,2 92,0 92,0 73,4 76,5EA 80,0 82,0 84,5 92,8 92,9 93,1 67,2 71,1 75,9EA12EU15 80,7 82,4 84,7 92,8 92,7 92,8 68,6 72,2 76,5EU10 83,7 83,3 89,5 89,5 78,0 77,1EU25 82,6 84,5 92,2 92,3 73,1 76,7
Source: Commission services.

63
PARt I — Underlying assumptions and projection methodologies
2.2. overvieW of the projectionMethodology And MAin AssuMptionsin the 2009 exercise
Main features of the cohort methodology
The projection follows the cohort approach usedin the 2006 budgetary projections exercise. Itbuilds upon the OECD methodology with onemodification, which is the use of single year ofage instead of five-year age groups. Themethodology takes into account implicitly thatwomen belonging to any given cohort have theirown specific level of participation, which isusually higher at all ages than the correspondinglevel of older generations. This participation gapbetween subsequent cohorts not only reflectssocio-cultural factors, but also individualcharacteristics such as the number of children
and level of education. Thus, compared with astandard projection based on the invariance ofactivity rates, the cohort-based projectioncontains an autonomous increase of femaleparticipation – referred to as a “cohort effect” –corresponding to the gradual replacement ofcurrently older women, with relatively lowparticipation rates, by younger women who havea much stronger attachment to the labour force.In the long-run, this effect leads to a homogenousfemale population with the same individualcharacteristics as women who entered the labour
table 2.4 – Historical participation rates: older workers aged 55 to 64
Total Males Females
Country 1985 1990 1995 2000 2006 1985 1990 1995 2000 2006 1985 1990 1995 2000 2006BE 27,3 22,2 24,2 27,1 33,6 45,1 35,4 35,9 37,5 42,7 11,1 9,9 13,3 17,1 24,6BG 24,0 43,0 38,4 53,6 11,8 33,9CZ 38,2 47,7 54,5 62,7 23,7 34,0DK 53,1 57,0 53,6 58,2 63,2 65,6 69,3 68,0 66,7 69,6 42,4 45,9 40,0 49,0 56,7DE 39,5 42,4 42,8 42,9 55,2 58,8 58,3 54,5 52,5 64,0 24,3 27,5 31,3 33,4 46,6EE 51,3 61,0 63,6 61,6 42,0 60,5IE 45,7 42,8 43,0 46,5 54,4 73,7 66,4 64,8 65,0 68,7 18,4 18,5 21,1 27,9 40,0GR 46,0 41,4 41,9 40,5 43,9 67,3 59,4 61,0 57,3 61,0 26,4 24,3 24,5 25,4 28,0ES 40,1 36,6 40,9 46,8 62,3 55,0 60,2 63,5 19,6 19,6 22,7 31,0FR 35,6 32,9 31,4 31,7 40,5 44,4 39,4 36,1 35,4 43,1 27,7 26,9 27,1 28,2 38,0IT 33,8 32,5 29,0 29,0 33,4 54,4 51,7 45,2 42,7 45,0 15,1 15,0 14,1 16,1 22,5CY 51,2 55,5 69,5 74,1 33,4 37,8LV 39,8 57,1 53,9 64,4 29,2 51,6LT 45,4 52,9 57,9 59,9 35,9 47,6LU 25,6 27,3 25,6 27,6 33,7 38,9 45,5 33,3 38,5 38,8 14,3 13,6 13,6 17,0 28,7HU 22,9 34,9 34,5 43,1 13,5 28,2MT 29,5 30,8 52,8 51,6 8,2 11,7NL 30,3 30,9 29,9 39,0 49,6 49,2 45,8 41,5 51,2 60,4 13,1 16,9 18,5 26,7 38,6AT 30,2 30,5 36,8 42,7 43,6 47,3 18,8 18,0 26,9PL 31,3 30,7 40,4 42,6 23,6 20,3PT 47,6 47,4 52,4 53,5 65,9 61,8 64,4 62,7 31,5 34,5 41,8 45,1RO 50,0 42,8 56,9 52,0 43,9 34,8SI 24,0 33,4 34,6 45,8 14,1 21,4SK 24,3 36,7 41,0 55,2 10,7 20,9FI 39,5 45,9 58,5 41,5 47,3 58,8 37,6 44,5 58,2SE 67,2 68,4 72,8 71,1 72,1 76,0 63,4 64,6 69,6UK 51,4 53,1 51,5 52,9 59,1 69,2 68,3 62,5 63,3 68,4 35,0 38,7 40,9 42,8 50,2NO 65,8 68,2 72,3 74,0 59,4 62,1EU27 39,7 46,4 50,6 56,2 29,5 37,2EA 35,8 37,2 45,1 48,1 48,1 54,7 24,1 26,8 35,9EA12EU15 39,0 40,6 48,4 51,3 51,4 57,7 27,5 30,2 39,4EU10 32,3 37,9 44,0 50,2 22,5 27,2EU25 39,4 46,6 50,4 56,4 29,0 37,4
Source: Commission services.
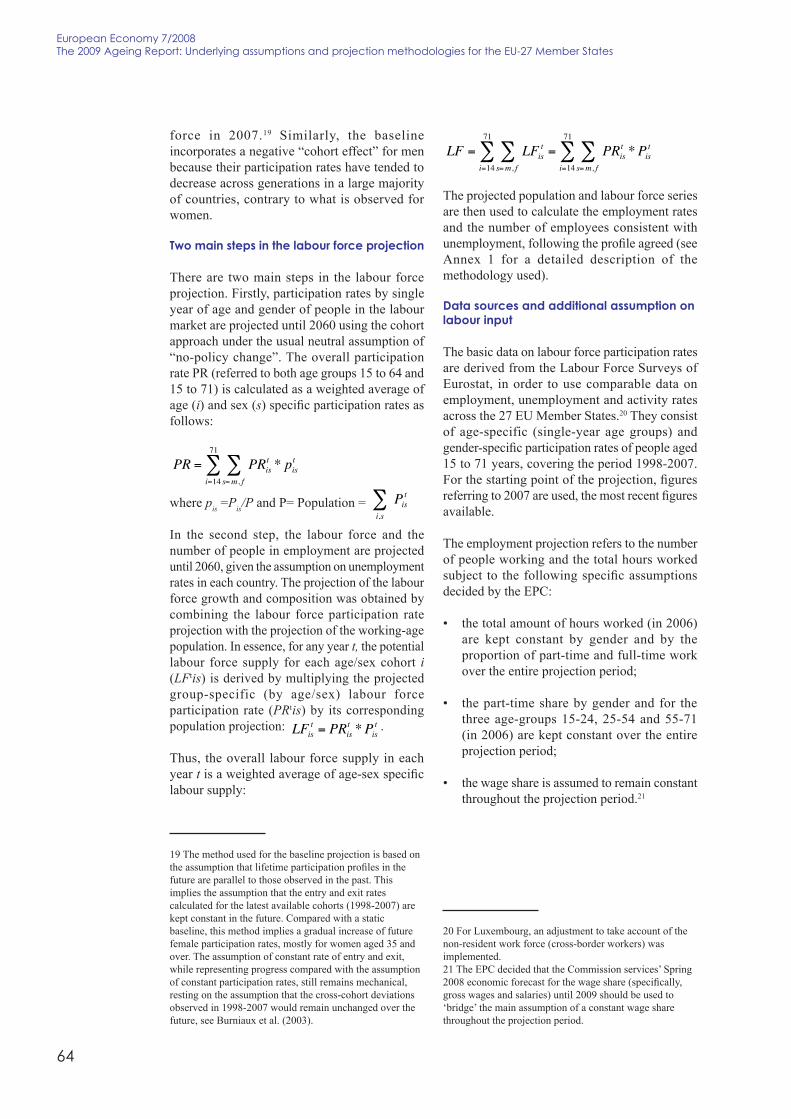
64
European Economy 7/2008the 2009 Ageing Report: Underlying assumptions and projection methodologies for the EU-27 Member states
force in 2007.19 Similarly, the baselineincorporates a negative “cohort effect” for menbecause their participation rates have tended todecrease across generations in a large majorityof countries, contrary to what is observed forwomen.
two main steps in the labour force projection
There are two main steps in the labour forceprojection. Firstly, participation rates by singleyear of age and gender of people in the labourmarket are projected until 2060 using the cohortapproach under the usual neutral assumption of“no-policy change”. The overall participationrate PR (referred to both age groups 15 to 64 and15 to 71) is calculated as a weighted average ofage (i) and sex (s) specific participation rates asfollows:
PR =s=m, f∑
i=14
71
∑ PRist * pis
t
where pis =Pis/P and P= Population =i,s∑ Pis
t
In the second step, the labour force and thenumber of people in employment are projecteduntil 2060, given the assumption on unemploymentrates in each country. The projection of the labourforce growth and composition was obtained bycombining the labour force participation rateprojection with the projection of the working-agepopulation. In essence, for any year t, the potentiallabour force supply for each age/sex cohort i(LFtis) is derived by multiplying the projectedgroup-specific (by age/sex) labour forceparticipation rate (PRtis) by its correspondingpopulation projection: LFis
t = PRist * Pis
t .
Thus, the overall labour force supply in eachyear t is a weighted average of age-sex specificlabour supply:
19 The method used for the baseline projection is based onthe assumption that lifetime participation profiles in thefuture are parallel to those observed in the past. Thisimplies the assumption that the entry and exit ratescalculated for the latest available cohorts (1998-2007) arekept constant in the future. Compared with a staticbaseline, this method implies a gradual increase of futurefemale participation rates, mostly for women aged 35 andover. The assumption of constant rate of entry and exit,while representing progress compared with the assumptionof constant participation rates, still remains mechanical,resting on the assumption that the cross-cohort deviationsobserved in 1998-2007 would remain unchanged over thefuture, see Burniaux et al. (2003).
LF =s=m, f∑
i=14
71
∑ LFist =
s=m, f∑
i=14
71
∑ PRist * Pis
t
The projected population and labour force seriesare then used to calculate the employment ratesand the number of employees consistent withunemployment, following the profile agreed (seeAnnex 1 for a detailed description of themethodology used).
data sources and additional assumption onlabour input
The basic data on labour force participation ratesare derived from the Labour Force Surveys ofEurostat, in order to use comparable data onemployment, unemployment and activity ratesacross the 27 EU Member States.20 They consistof age-specific (single-year age groups) andgender-specific participation rates of people aged15 to 71 years, covering the period 1998-2007.For the starting point of the projection, figuresreferring to 2007 are used, the most recent figuresavailable.
The employment projection refers to the numberof people working and the total hours workedsubject to the following specific assumptionsdecided by the EPC:
• the total amount of hours worked (in 2006)are kept constant by gender and by theproportion of part-time and full-time workover the entire projection period;
• the part-time share by gender and for thethree age-groups 15-24, 25-54 and 55-71(in 2006) are kept constant over the entireprojection period;
• the wage share is assumed to remain constantthroughout the projection period.21
20 For Luxembourg, an adjustment to take account of thenon-resident work force (cross-border workers) wasimplemented.21 The EPC decided that the Commission services’ Spring2008 economic forecast for the wage share (specifically,gross wages and salaries) until 2009 should be used to‘bridge’ the main assumption of a constant wage sharethroughout the projection period.

65
PARt I — Underlying assumptions and projection methodologies
2.3. Methodology used to projectpArticipAtion rAtes
2.3.1. Assumptions and adjustments forspecific Member States
The projection was made using the populationprojections provided by Eurostat, and took onboard the following elements:
• the participation rates in the labour markethave been calculated, by single age and sex,by using the entry/exit rate calculated on thebasis of the average of the participation ratesobserved over the period 1998-200722;
• the entry rates are assumed to be constantthroughout the whole forecasting period.However, some countries are undergoing aperiod of large increase in educationenrolment rates amongst young persons. Asthat may translate into higher participationrates in future years, the AWG has agreed toset a floor to the participation rates of theyounger cohorts, in the age bracket 15-24, toavoid that any increase in the enrolment rates(and then any decrease in the correspondingparticipation rates) would result in a futuredecrease in the prime age participation ratesaccording to the cohort approach method.This assumption implies that there is noprojected decline in the participation rates inthe age bracket 15-24;
• as for exit rates of older workers (aged 55-71),adjustments were made to take into account
22 This is different from the methodology used in the 2006Ageing Report, where the participation rates werecalculated by using an average of entry/exit rates over theperiod 1998-2003 (see European Commission (2005)).
recent and the lagged effects of pensionreforms in 20 countries. The descriptions ofthese reforms are provided in Box 2.1.
2.3.2. Impact of recently enacted pensionreforms
2.3.2.1. Recent pension reforms in some EUMember States
An important feature of the projections is thatthe baseline scenario takes into account thepotential effects of recently enacted pensionreforms in 20 EU Member States, includingmeasures to be phased in gradually, on theparticipation rates of older workers. Somecountries have enacted legislation to increase thestatutory retirement age for females or for bothmales and females. Others have changed someprovisions of social security programmes (andsometimes of other transfer programmes used asalternative early retirement paths) that providedstrong incentives to leave the labour force at anearly age. The findings of a recent internationalresearch project based on micro-estimationresults (based on a sample of individuals and thematching of individual retirement decisions andretirement incentives) are clear: changingpension plan provisions would have large effectson the labour force participation of olderworkers.23
The following pension reforms24 are incorporatedin the baseline scenario:
23 See Gruber and Wise (2005).24 The information was provided by the Members of theEPC and AWG.
Box 2.1: Pension reforms enacteD in the memBer states
belgium
The standard retirement age for women will increase gradually from 63 in 2003 to 64 in 2006 and 65in 2009. Retirement age remains flexible from the age of 60 for men and women, provided that a 35-yearcareer condition is satisfied. The “older unemployment scheme”, reformed in 2002, will keep havingan impact on participation rates between 50 and 58.
The law concerning the “Solidarity Pact between Generations” has come into force in 2006. It provideda series of measures to increase participation in the labour market. The statutory age for the early

66
European Economy 7/2008the 2009 Ageing Report: Underlying assumptions and projection methodologies for the EU-27 Member states
retirement (“prépension”) scheme embedded in the unemployment insurance has been raised from 58to 60 and the eligibility conditions (career length) have been made more restrictive. Conditions forentering this scheme before the statutory age (“prépensions” for labour market reasons) have alsobecome tighter. Staying at work after the age of 62 is now rewarded by a specific supplement in thepension formula (“pension bonus”). Finally, a structural mechanism for linking benefits to prosperityhas been introduced.
czech republic
Before the pension reform in 2003, men retired at the age of 60 and women at 53-57, depending on thenumber of children (one year less per child). Since January 2004 with modification of the retirementage from August 2008, the age of retirement is increased constantly over time (2 months per year formen and 4 months per year for women) to reach 65 years for men and 62-65 for women (still dependingon the number of children) born in 1968 and later. Bonus for later retirement is 1.5% of person’scalculation base for every additional completed 90 calendar days. Early retirements are subject topenalization, which is 0.9% of person’s calculation base for every period of 90 calendar days before thestatutory retirement age up to 720 days and 1.5% from the 721st day. But resulting earnings relatedcomponent must not be lower than 770 CZK (approx. 28 Euro).
denmark
Denmark introduced in 2006 a major reform package known as the “Welfare Agreement”. This reformpackage affects mainly persons younger than age 48 at the end of 2006. It reverses the 2004 decision tolower retirement age from 67 to 65. It also increases early retirement (VERB) from age 60 to age 62between 2019 and 2022 with a minimum contribution period of 30 years instead of 25 for taking aVERB. The normal retirement age is increased from age 65 to 67 between 2024 and 2027. Finally itindexes the retirement ages to the average life expectancy of 60-year-olds from 2025.
germany
Since the early nineties a series of major reforms have been passed, aiming at the financial and socialsustainability of the public pension scheme. Highlighting the most important reform steps, the reformprocess began in the mid of the nineties with the increase of the statutory retirement age to the age of65 years and the introduction of deductions on early retirement (3.6 % per year) accompanied with abonus for deferred retirement (6.0 % per year). Secondly, at the beginning of this decade, a comprehensivepromotion of second and third pillar pension schemes (Riester pension) by subsidising voluntarycontributions was introduced. The aim of those reforms was to compensate the envisaged reduction ofbenefits in the statutory pension scheme by second and third pillar pensions. Thirdly, in 2005 the pensionadjustment formula was augmented by a sustainability factor, which adjusts statutory pension paymentsto population dynamics, whereby the extent of the adjustment is determined by the change in the relationof the workforce to the number of retirees.
The most recent major reform took place in 2007. Though the transition process of increasing theretirement age to 65 years is not yet fully completed, a further increase of the statutory retirement ageto the age of 67 was legislated (the age of retirement will be put back one month each year from 2012on to 2024, then 2 months each year until the age of 67 years will be reached by 2029). The first aim ofthis reform was postponing the retirement age and thus decreasing the future financial burden. Secondly,the reform will partially compensate the expected decline of the workforce due to population ageing.Therefore, the increase of the retirement age is accompanied by the so-called “Initiative 50 plus” whichaims to increase participation rates of older workers by a large range of different measures such as theextension of vocational training and the reduction of employment barriers for older workers.
estonia
Changes in the PAYG system include raising the retirement age for females to 63 by 2016 and revisingthe benefit formula. Legislation passed in mid-September 2001 set up mandatory individual accountsin the second tier (starting operations in mid-2002), while voluntary accounts became the new thirdtier.

67
PARt I — Underlying assumptions and projection methodologies
spain
The latest reform of the pension system in 2002 (Law 35/2002) abolished mandatory retirement age (65)in the private sector. Workers remaining active after 65 will increase their pension benefit by 2% peryear, and both employers and employees’ are exempted from paying most social security contributions.For workers aged at least 60, social contributions are reduced by 50%, and this amount is increased by10% to reach 100% for those aged 65. Early retirement is possible from the age of 61, with at least30 years of paid contributions and registered as unemployed for at least 6 months, but with a highpenalty, from 6% to 8% per year (8% for those with only 30 years of contribution, 6% for those with atleast 40 years of contribution). Pensions became compatible with part-time work (but the pension benefitwas reduced according to the length of the working day).
A new law on Social Security measures was enacted in 2007. This package of reforms contains as mainmeasures: increase in the effective contribution period to be eligible for a retirement pension; partialretirement from age 61 instead of 60 for people entering the system after 1967 (and a minimum of 30years of contribution instead of 15); incentives for people working after age 65; more restrictive rulesto get an invalidity pension.
france
The standard retirement age remains 60. Since 2004, gradual alignment of public sector with privatesector by increasing the number of contribution years for entitlement to a full pension (from 37.5 to40 years between 2004 and 2008). Since 2009, the number of contribution years will increase followingthe increase in life expectancy through a rule keeping constant the ratio of the number of contributionyears and the number of years in pension to the level of 1.79 as in 2003. The number of contributionyears will be increased to 41 in 2012 and 41.50 in 2020 due to the expected gains in life expectancy(by 1.5 years each 10 years). of a bonus (3% per year) in case of postponement of retirement will beintroduced. The penalty for early-retirement (before 40 years of contributions) will be changed. Since2006, the amount of the penalty (la décote) will decrease gradually from 10% to 5% of pension per yearof anticipation in 2015 for the private sector and will increase from 0.5% to 5% for civil servants).
italy
Since 2006, the major changes to pension legislation concern the implementation of the 23rd JulyAgreement on welfare state between government and social partners (Law 127/2007 and Law 247/2007)and Law 133/2008) improving the possibility of accumulating pension and labour income.
A. Law 127/2007: increase of lower amount pensions through an additional lump sum of 420 euro peryear from 2008 (327 euro in 2007) acknowledged to pensioners of 64 and over with an income lowerthan 1.5 times the minimum pension (8,504.73 euro per year in 2007). Such an increase is reduced oraugmented by 20% for contribution careers inferior to 15 years or superior to 25, respectively (18 and 28,for the self-employed). Additional increases are also foreseen for social assistance pensions, startingfrom 2008, by way of the so-called ‘social assistance additional lump sums’ (‘maggiorazioni sociali’).
B. Law 247/2007 foresees the following:
• a slowdown of the process of elevating the minimum requirements for early retirement, keepingunchanged the phased-in values foreseen by Law 243/2004. In particular, in 2008 the age requirement,with 35 years of contribution, is 58 for the employees and 59 for the self-employed instead of 60 and 61.Starting from 2013 (it was 2014, according to Law 243/2004) the age requirement, with 35 years ofcontribution, is 62 for the employees and 63 for the self-employed. In addition, starting from July 2009,workers may access early retirement at an age lower by 1 year, provided that they possess at least36 years of contributions. The age requirement may be reduced by at most 3 years (but never belowthe age of 57) for specific categories of workers involved in hard and stressful jobs (‘lavori usuranti’),within a given amount of resources assigned to a specific fund;
• the application in 2010 of the transformation coefficients, revised on the basis of the procedure foreseenby Law 335/95. The subsequent revisions will be made every three years, instead of every ten years,through a simplified procedure falling entirely under the administrative sphere of competence;

68
European Economy 7/2008the 2009 Ageing Report: Underlying assumptions and projection methodologies for the EU-27 Member states
• an increase of the contribution rate of the atypical workers by 3 percentage points (up to 26% in 2010)in order to improve pension adequacy for this category of workers.
C. Law 133/2008 states that old age and seniority pensions may be fully cumulated with labour income.The new legislation improves upon the previous one which foresaw some restrictions in the possibilityof cumulating, especially in the case of employees.
latvia
Under the new three-pillar system with a defined contribution PAYG based on notional accounts, set upin 1996, the standard age requirement for women (59.5 years in 2003) will increase by 6 months eachyear to reach 62 by 2008. Those for men reached 62 in 2003.
lithuania
The standard minimum retirement age for women (55 years and 4 months in 1995, 58.5 years in 2003)will increase by 6 months each year to reach 60 years in 2006. The retirement age for men was graduallyincreased (2 months per year) from 60 years and 2 months (in 1995) up to 62.5 in 2003.
hungary
The standard retirement age for women will increase to 60 by 2005, 61 by 2007 and 62 by 2009 (beforethe reform it was 57).
In 2006-2007, the Hungarian Parliament adopted (by two regulations) a package of reforms whichspecifies that the early retirement is allowed only 2 years before normal retirement instead of 3 before.Thus from 2013 the early retirement is possible from age 60 both for women and men. From 2013 allearly pensions will be subject to a reduction. The rate of reduction, depending on the time remaininguntil retirement age, would be 0.3% per month for the 61-62 age-group and 0.4% per month below theage of 61. It introduces also changes in the calculation of the benefits, a minimum contribution from40-41 for early retirement and some favourable retirement conditions for those working in potentiallyhealth-damaging occupations. Finally, it includes also: a new pension benefits system that will reducethe replacement rate; the retirement benefits will be available only for the difference between earningsof the year and minimum wage for the first year of an early retirement; the pension contribution increasesfor early retirees; some measures to increase employment of persons with reduced working capacity;pensions and earnings are no more cumulated in early retirement if earnings > minimum wage; changesin contribution levels payable by the employer and by the employee.
Malta
In December 2006, the Maltese Government completed the legislative process associated with theenactment of the pensions reform bill. Among the most important elements of the reform there is astaggered rise in pension age from 60 years for females and 61 years for males to 65 years for both by2026 and the gradual lengthening of the contribution period for full entitlement to the two-thirds pensionfrom 30 years to 40 years. Meanwhile, the calculation of pensionable income will reflect the yearlyaverage income during the best 10 calendar years within the last forty years, as opposed to the previousregime which consisted of the best 3 years of the last ten years for employed persons and the averageof the best ten years for self-employed persons. In addition, prior to the reform, the maximum pensionableincome was fixed by the law though in recent years it was revised in line with the cost of livingadjustment. Following the reform, maximum pensionable income will evolve in a more dynamic fashionand will be increased annually by 70 per cent of the national average wage and 30 per cent of theinflation rate as from 1 January 2014 for persons born after 1 January 1962.
Austria
The minimum retirement age for men will increase from 61.5 years to 65 years; for women the age willrise from 56.5 to 60 years. The increase will be phased in gradually beginning in July 2004 and by 2017early retirement will be eliminated. Meanwhile, larger penalties are imposed on early retirement (4.2%of reduction per year instead of the former 3.75%, up to a maximum of 15%), within the age of 62-65.The statutory retirement age for women will be increased gradually between 2019 and 2034 to reach

69
PARt I — Underlying assumptions and projection methodologies
the retirement age for men at 65. A bonus for later retirement up to the age of 68 years (4.2% per year,up to a maximum of 10 %) is introduced. From January 2005, harmonised guaranteed pension accountsis established (Act on the harmonisation of pension system, approved in November 2004). In the newsystem of individual, transparent pension accounts (with a clear reporting of benefits accrued fromcontributions paid in and other credits acquired, such as from active child and elderly care) the key rulewill be: 45-65-80 (45 contribution years, retirement age of 65 and a gross replacement rate of 80% ofaverage life earnings). Pension benefits will be adjusted to consumer price index, starting in 2006.
poland
All insured persons born after 1948 are covered by the new defined contribution PAYG with notionalaccounts and three-pillar pension system. The standard retirement age remains 65 for male and 60 forfemale. There will be no early pension for those born after 1948 and retiring after 2006, with theexception of those who worked long enough (20 years) in special conditions.
portugal
Portugal introduced in 2007 a “Sustainability factor” linking initial benefits to average life expectancywhen the worker retires (at 65, which is the legal retirement age). Individuals have the option ofpostponing retirement beyond legal retirement age to compensate (at least partially) the financial penaltygiven by the sustainability factor. They introduced also a “national strategy for the promotion of activeageing” which is a package of measures that encourages older workers to remain in the labour force(trainings, improvement of older workers employment, higher penalty in case of early retirement andbenefits granted in case of long contributive careers).
slovenia
Under the new Pension and Disability Insurance Act entered into force on 1 January 2000 (a three-pillarmodernised defined benefit PAYG system plus compulsory and voluntary supplementary fundedschemes), the standard retirement age has been increased. It is now possible to retire between 58 and 63for men and 61 for women (the minimum retirement age was 53 for women and 58 for men before thereform). Women that worked before the age of 18 can retire earlier (but not before the age of 55). Specialregulations reduce the age of retirement to 55 in certain cases (before the reform it was possible to retireeven below 50). The minimum retirement age is raised from 53 to 58 for women (the same level formen). The accrual rate was reduced by 2% to 1.5% since 2000. Later retirement has been encouraged:a person who fulfils the requirement for pension but continues to work beyond the age 63/61 will receivean additional pension increase (3.6% the first additional year, 2.4% the second year and 1.2% in thethird, plus the normal rate of accrual, 1.5% per year).
slovakia
Under the reformed (from 2004) three-pillar pension system, the standard retirement age will increasefrom 60 to 62 for men (9 month per year) by 2007 and from the former 57 (reduced by 1 year per child,to reach age 53) to 62 for women by 2016. Aworker can still retire earlier if the combined benefit fromthe first and the newly introduced second pillar equal at least 60% of the minimum living standarddetermined by the government. In this case, the pension is reduced by 6% per year, while a bonus of 6%is introduced for those postponing their retirement. It is also possible to get pension benefit whileworking.
finland
Since 2005, flexible old-age retirement (63 to 68 years) with an increase of the accrual rate to 4.5% forthose continuing to work beyond the age of 63. The ceiling on the maximum pension is abolished. Anew early retirement scheme is introduced with a minimum age of 62 and an actuarial reduction of 0.6%per month prior to 63. Those born after 1949 are not eligible for the unemployment pension scheme,which is replaced by an extended period of unemployment benefit (the so-called “unemployment pipelineto retirement” (currently 57-65).
70
European Economy 7/2008the 2009 Ageing Report: Underlying assumptions and projection methodologies for the EU-27 Member states
2.3.2.2. Impact of pension reforms in thebaseline labour force projection
Pension reforms are modelled by considering thelikely impact of reforms on the probability ofwithdrawing from the labour market whenageing due to changes in the statutory “normal”age of retirement, or “early-retirement age” (thatis the age at which benefits are first available), orin the rules governing pension rights. This likelyimpact is incorporated in the baseline labourforce projection by means of the probabilisticmodel already used by the European Commissionfor the calculation of the average exit age fromthe labour force, using estimated cumulativeprobabilities of exit from the labour market.25
More specifically, the analysis of the distributionof the probability of retiring at different ages(from age 50 to 71, separately for males andfemales) is done for the period 1998 to 2007 forthe 20 EU Member States concerned. Then, therelationship between changes in the parametersof the pension systems and the retiring behaviourof older workers is examined. Existing empiricalevidence is also taken into account, such aseconometric estimates of the impact of changesin the implicit tax rate on continuing to work andretirement behaviour.26
As a starting point, the probability of retirementand the cumulative distribution function (thecumulated distribution of probability of retirement)observed in 2007 are analysed, along with the
25 For details on the methodology used, see Carone (2005).26 See Börsch-Supan (2003), Duval (2003), Gruber andWise (2005).
calculated average exit age, see Graph 2.1. Whilethe age profiles of the probability of retirementvary across countries, because of differences inthe pension system, a common feature is that thedistribution is clearly skewed towards the earliestpossible retirement age. The distribution of theretirement age presents evidence of spikes at boththe minimum age for an early-retirement and thenormal/average retirement age, which is either 60(especially for women) or 65.
2.3.2.3. Simulating the impact of the pensionreforms on the participation rate of olderworkers
Methodology used to assess the impact ofpension reforms on the participation rate ofolder workers
The impact of pension reforms on theparticipation rate of older workers is simulatedby calculating the impact of reforms that haveeither increased the statutory retirement age orremoved early retirement schemes on theparticipation rates. This is made as follows:
sweden
The pension reform was approved by Parliament in 1999. Under the new notional defined contributionsystem is possible to retire from age 61 onwards, with an actuarially fair compensation for those whostay on in the labour force. Every year of contributions is important for the pension benefit. A personwith an average wage will increase his yearly pension benefit by nearly 60 % if he postpones hisretirement decision till age 67 compared to leaving at age 61. Yearly “statement of account” informs theindividual of costs and benefits of retirement. The new system is phased in gradually for generationsborn between 1938 and 1953, and will affect generations born after 1953 fully.
united kingdom
Between 2010 and 2020, women’s pensionable age will gradually rise from 60 to 65, as for men. ThePension Act 2007 adds also several measures in which we have the gradual increase of the state pensionage between 2024 and 2046 to 68 for men and women (instead of 65 before).

71
PARt I — Underlying assumptions and projection methodologies
• first, by changing the probability of retiringaccording to our considered judgement aboutthe factors that affect the retirement decision.27
More specifically, the distribution of thefrequency (density function and cumulativedistribution function) observed in 2007 isshifted. For example, let us assume that in agiven country a concentration of the probabilityof retiring is observed at age 58 over the last 5to 6 years, while a reform removes earlyretirement schemes or increases the minimumyears of contribution. To calculate the impactof this reform, we shift the peak of theretirement probability away from thepreviously observed peak at 58 years andcloser to the statutory average age (usually 65for men and 60 for women).28 Within the samemethodological framework, another simulationis done, by applying a progressive shift of theprobability distribution of retiring for females.This is done for Member States that haverecently legislated a progressive increase ofthe statutory retirement age of females to thatof males (usually from 60 to 65), such asBelgium, the United Kingdom and someothers, especially among the new MemberStates;
27 As regards the impact of delay in eligibility ages, recentestimates by Gruber and Wise (2002) for France, Belgiumand the Netherlands suggest for example that in these threecountries a three-year delay in eligibility ages to old-ageand early retirement schemes could raise the labour forceparticipation of the 55-64 age group by about 20 percentagepoints. According to Duval (2003), “past experiencesuggests a more moderate outcome”. For instance, thefive-year increase in eligibility ages in New Zealandthroughout the 1990s led to a 15 percentage point increasein labour force participation”.28 Technically speaking, the shift in the distributionfunction of retirement probability can be done rathermechanically in this way. The retirement probability for ageneric cohort of people is given by a density function f(x).The cumulated probability is given by a cumulativedistribution function F(x). Any time a reform of the pensionsystem (such as changes in the statutory retirement age) hasan effect on the age of retirement, it has an effect on thedensity function. Thus, for example, if the possibility ofretirement at age 57 (x=57) is no longer possible and thenew age of statutory retirement become n=60 than f(x) = 0for x<n. To calculate the new density function d(x) one canuse a shift in the cumulative distribution function of f(x).The new density function d(x) is s*f(x), where s= 1/(1-F(n)). For a similar approach, see Baldacci-Tuzi (2003),Carone (2005).
• second, the new probabilities of retirementresulting from the simulation are convertedinto a change in exit rates (following thealgorithm presented in Annex 2.1);
• finally, the observed exit rates (the averageover the period 1998-2007) are replaced (ata different time for each country, in line withthe timing of reform implementation) withthe new estimated exit rates in the cohort-based projection model. Consequently, theparticipation rates initially estimated, withouttaking into account the impact of pensionreforms, have changed. The magnitude of theexpected impact of pension reforms can beinferred by comparing the participation ratescalculated with and without the effect ofreforms.
estimates of the impact of pension reforms
The expected postponement of retirement issummarised by the difference in the average exitage from the labour force in 2060. As a result ofrecently enacted pension reforms, the effectiveretirement age for males is expected to increaseby as much as three years or more in Italy, Maltaand Poland and by between two and three yearsin the Czech Republic, Germany, Denmark,Spain, Austria and Slovakia. The expectedpostponement of retirement for females is similar,or even higher than for males, reflecting in severalcases a progressive alignment of the retirementage of females to that of males.

72
European Economy 7/2008the 2009 Ageing Report: Underlying assumptions and projection methodologies for the EU-27 Member states
Table 2.5 shows the estimated impact of pensionreforms on participation rates. Pension reformsare projected to have a sizeable impact on thelabour market participation of older workers(aged 55 to 64) in most of the EU Member Statesin which future implementation of alreadyenacted pension reforms is planned. A strongerimpact is expected from changes in the parametersaffecting the statutory age of retirement. Forexample, the labour participation in the groupaged 55 to 64 in Italy is projected to record anadditional increase of 14 p.p. by 2030. This is theestimated impact of the recent reform postponingthe statutory age of retirement and the gradualmove towards a notional defined contributionpension system.29 In Germany, Finland, Hungary,Slovenia the impact is estimated to be more than10 p.p. by 2020. In the Czech Republic andSlovakia, the impact is estimated to be higherthan 15 p.p. by 2020. Overall, in the EU, theparticipation rate of older people (55-64) isestimated to be about 8 p.p. higher in 2020 and
29 For an empirical analysis on the retirement decision ofItalian employees see Brugiavini and Peracchi (2003).According to their prediction of retirement probabilitiesunder alternative policies that change social security wealthand derived incentive measures, the male employment rateat age 55 are projected to be 84.3 under the Dini/ Prodipension regime (1995 and 1997 reforms) as compared to65.6 under the pre-1992 reform regime, see also Brugiaviniand Peracchi (2005).
13 p.p. higher in 2060 due to the estimated impactof pension reforms. In the euro area, the impactis estimated to be slightly larger, at about 9 p.p.in 2020 and 13.5 p.p. 2060, respectively.
Given that changes in overall participation ratesare mainly driven by changes in the labour forceattachment of prime-age workers, as this groupaccounts for more than 70% of the total labourforce, even such high projected increases in theparticipation rates of older workers will onlyhave a rather limited impact on the overallparticipation rate. For example, the 18 percentagepoint increase in the participation rate of workersaged 55 to 64 years projected in Germany willlead to an increase in the overall participationrate (workers aged 15 to 64 years) of about4 percentage points by 2060.
Graph 2.1 – Impact of pension reforms on the average exit age from the labour force
Source: Commission services, EPC.
50
BE
BG
CZ
Dk
DE
EE
Es
FR
It
lt
HU
Mt
At
Pl
Pt
sI
sk
FI
sE
Uk
Country Average exit age from the labour force in 2060
Age
52 54 56 6258 60 64 66 68
MAlEs - avg exit age (no reform)
FEMAlEs - avg exit age (no reform)
MAlEs - impact of pensions reforms
FEMAlEs - impact of pensions reforms
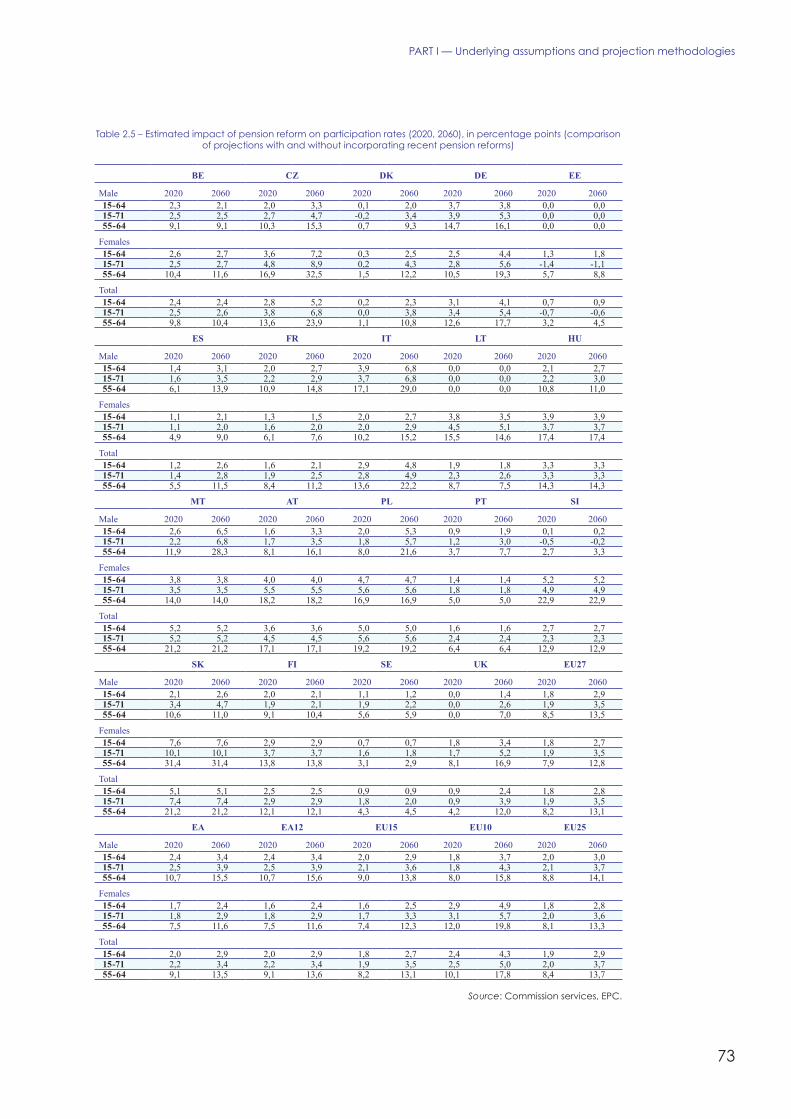
73
PARt I — Underlying assumptions and projection methodologies
table 2.5 – Estimated impact of pension reform on participation rates (2020, 2060), in percentage points (comparisonof projections with and without incorporating recent pension reforms)
BE CZ DK DE EE
Male 2020 2060 2020 2060 2020 2060 2020 2060 2020 206015-64 2,3 2,1 2,0 3,3 0,1 2,0 3,7 3,8 0,0 0,015-71 2,5 2,5 2,7 4,7 -0,2 3,4 3,9 5,3 0,0 0,055-64 9,1 9,1 10,3 15,3 0,7 9,3 14,7 16,1 0,0 0,0
Females15-64 2,6 2,7 3,6 7,2 0,3 2,5 2,5 4,4 1,3 1,815-71 2,5 2,7 4,8 8,9 0,2 4,3 2,8 5,6 -1,4 -1,155-64 10,4 11,6 16,9 32,5 1,5 12,2 10,5 19,3 5,7 8,8
Total15-64 2,4 2,4 2,8 5,2 0,2 2,3 3,1 4,1 0,7 0,915-71 2,5 2,6 3,8 6,8 0,0 3,8 3,4 5,4 -0,7 -0,655-64 9,8 10,4 13,6 23,9 1,1 10,8 12,6 17,7 3,2 4,5
ES FR IT LT HU
Male 2020 2060 2020 2060 2020 2060 2020 2060 2020 206015-64 1,4 3,1 2,0 2,7 3,9 6,8 0,0 0,0 2,1 2,715-71 1,6 3,5 2,2 2,9 3,7 6,8 0,0 0,0 2,2 3,055-64 6,1 13,9 10,9 14,8 17,1 29,0 0,0 0,0 10,8 11,0
Females15-64 1,1 2,1 1,3 1,5 2,0 2,7 3,8 3,5 3,9 3,915-71 1,1 2,0 1,6 2,0 2,0 2,9 4,5 5,1 3,7 3,755-64 4,9 9,0 6,1 7,6 10,2 15,2 15,5 14,6 17,4 17,4
Total15-64 1,2 2,6 1,6 2,1 2,9 4,8 1,9 1,8 3,3 3,315-71 1,4 2,8 1,9 2,5 2,8 4,9 2,3 2,6 3,3 3,355-64 5,5 11,5 8,4 11,2 13,6 22,2 8,7 7,5 14,3 14,3
MT AT PL PT SI
Male 2020 2060 2020 2060 2020 2060 2020 2060 2020 206015-64 2,6 6,5 1,6 3,3 2,0 5,3 0,9 1,9 0,1 0,215-71 2,2 6,8 1,7 3,5 1,8 5,7 1,2 3,0 -0,5 -0,255-64 11,9 28,3 8,1 16,1 8,0 21,6 3,7 7,7 2,7 3,3
Females15-64 3,8 3,8 4,0 4,0 4,7 4,7 1,4 1,4 5,2 5,215-71 3,5 3,5 5,5 5,5 5,6 5,6 1,8 1,8 4,9 4,955-64 14,0 14,0 18,2 18,2 16,9 16,9 5,0 5,0 22,9 22,9
Total15-64 5,2 5,2 3,6 3,6 5,0 5,0 1,6 1,6 2,7 2,715-71 5,2 5,2 4,5 4,5 5,6 5,6 2,4 2,4 2,3 2,355-64 21,2 21,2 17,1 17,1 19,2 19,2 6,4 6,4 12,9 12,9
SK FI SE UK EU27
Male 2020 2060 2020 2060 2020 2060 2020 2060 2020 206015-64 2,1 2,6 2,0 2,1 1,1 1,2 0,0 1,4 1,8 2,915-71 3,4 4,7 1,9 2,1 1,9 2,2 0,0 2,6 1,9 3,555-64 10,6 11,0 9,1 10,4 5,6 5,9 0,0 7,0 8,5 13,5
Females15-64 7,6 7,6 2,9 2,9 0,7 0,7 1,8 3,4 1,8 2,715-71 10,1 10,1 3,7 3,7 1,6 1,8 1,7 5,2 1,9 3,555-64 31,4 31,4 13,8 13,8 3,1 2,9 8,1 16,9 7,9 12,8
Total15-64 5,1 5,1 2,5 2,5 0,9 0,9 0,9 2,4 1,8 2,815-71 7,4 7,4 2,9 2,9 1,8 2,0 0,9 3,9 1,9 3,555-64 21,2 21,2 12,1 12,1 4,3 4,5 4,2 12,0 8,2 13,1
EA EA12 EU15 EU10 EU25
Male 2020 2060 2020 2060 2020 2060 2020 2060 2020 206015-64 2,4 3,4 2,4 3,4 2,0 2,9 1,8 3,7 2,0 3,015-71 2,5 3,9 2,5 3,9 2,1 3,6 1,8 4,3 2,1 3,755-64 10,7 15,5 10,7 15,6 9,0 13,8 8,0 15,8 8,8 14,1
Females15-64 1,7 2,4 1,6 2,4 1,6 2,5 2,9 4,9 1,8 2,815-71 1,8 2,9 1,8 2,9 1,7 3,3 3,1 5,7 2,0 3,655-64 7,5 11,6 7,5 11,6 7,4 12,3 12,0 19,8 8,1 13,3
Total15-64 2,0 2,9 2,0 2,9 1,8 2,7 2,4 4,3 1,9 2,915-71 2,2 3,4 2,2 3,4 1,9 3,5 2,5 5,0 2,0 3,755-64 9,1 13,5 9,1 13,6 8,2 13,1 10,1 17,8 8,4 13,7
Source: Commission services, EPC.

74
European Economy 7/2008the 2009 Ageing Report: Underlying assumptions and projection methodologies for the EU-27 Member states
2.4. MAin results of the projection oflAbour MArket pArticipAtion rAtes
2.4.1. Projection of participation rates
The methodology used leads to a projectedupward shift in the participation rates of olderage groups (mainly from the age of 45) that isparticularly strong for women while, by
assumption, the participation rate profiles of theyoung are assumed to remain generally stable, orincrease moderately over time (see Graph 2.2and Graph 2.3).
Graph 2.2 – Participation rates and employment rates by age profile and by sex in 2007 and 2060 – EU27
Source: Commission services, EPC.
Age groups
65-7160-6455-5950-5445-4940-4435-3930-3425-2920-2415-19
90% EU27
8070605040302010
0
Participation rates 15-71 - Females - 2007
Participation rates 15-71 - Females - 2060
Age groups
65-7160-6455-5950-5445-4940-4435-3930-3425-2920-2415-19
90% EU27
8070605040302010
0
Employment rates 15-71 - Females - 2007
Employment rates 15-71 - Females - 2060
Age groups
65-7160-6455-5950-5445-4940-4435-3930-3425-2920-2415-19
90100
% EU27
8070605040302010
0
Participation rates 15-71 - Males - 2007
Participation rates 15-71 - Males - 2060
Age groups
65-7160-6455-5950-5445-4940-4435-3930-3425-2920-2415-19
90100
% EU27
8070605040302010
0
Employment rates 15-71 - Males - 2007
Employment rates 15-71 - Males - 2060
Graph 2.3 – Participation rates and employment rates by age profile and by sex in 2007 and 2060 – EA
Source: Commission services, EPC.
Age groups
65-7160-6455-5950-5445-4940-4435-3930-3425-2920-2415-19
90% EA
8070605040302010
0
Participation rates 15-71 - Females - 2007
Participation rates 15-71 - Females - 2060
Age groups
65-7160-6455-5950-5445-4940-4435-3930-3425-2920-2415-19
90% EA
8070605040302010
0
Employment rates 15-71 - Females - 2007
Employment rates 15-71 - Females - 2060
Age groups
65-7160-6455-5950-5445-4940-4435-3930-3425-2920-2415-19
120% EA
100
60
80
40
20
0
Participation rates 15-71 - Males - 2007
Participation rates 15-71 - Males - 2060
Age groups
65-7160-6455-5950-5445-4940-4435-3930-3425-2920-2415-19
90100
% EA
8070605040302010
0
Employment rates 15-71 - Males - 2007
Employment rates 15-71 - Males - 2060

75
PARt I — Underlying assumptions and projection methodologies
Table 2.6 presents the projection of the overallparticipation rates. To summarise the baselinescenario projection, the overall participation rate(for the age group 15 to 64) in the EU27 isprojected to increase by 3.6 percentage pointsover the period 2007-2060 (from 70.6% in 2007to 74.1% in 2060). For the euro area, a similarincrease is projected (from 70.8% in 2007 to74.5% in 2060). For the age-group 15-71, thecurrent and projected participation rates as wellas the increase are smaller. Almost all of theincrease is projected to materialize in the periodup to 2020.
Table 2.7 provides an overview of changes indifferent age- and sex-groups. The biggestincrease in participation rates is projected forolder workers (around 20 percentage points forfemales and 10 p.p. for males) in the EU27, anda slightly higher increase in the euro area (22p.p. for males and 13 p.p. for females). As aresult of these dynamics, the gap between maleand female participation rates is projected togradually narrow down, especially in countrieswith a large gap in 2007.
table 2.6 – Projected changes in participation rates
AGE GROUP 15 to 64 AGE GROUP 15 to 71
Country Level2007
Level2060
Changes in participation ratesLevel2007
Level2060
Changes in participation rates
2007-2060 2007-2020 2020-2060 2007-2060 2007-2020 2020-2060Belgium 67,3 69,7 2,4 2,4 0,0 61,8 62,3 0,5 1,3 -0,7Bulgaria 66,8 69,3 2,4 3,5 -1,0 61,2 60,9 -0,4 2,4 -2,7CzechRepublic
70,0 73,5 3,6 4,0 -0,4 65,3 66,3 1,0 2,1 -1,2
Denmark 80,3 80,8 0,6 -0,7 1,2 74,3 74,3 0,0 -2,4 2,4Germany 76,2 79,8 3,6 2,9 0,7 68,0 71,6 3,6 3,7 -0,1Estonia 72,9 74,5 1,6 2,5 -0,9 68,0 66,1 -1,9 1,1 -3,0Ireland 72,5 76,3 3,9 3,2 0,6 68,9 70,5 1,6 2,3 -0,7Greece 67,1 68,8 1,7 2,3 -0,6 61,4 61,3 -0,1 1,7 -1,8Spain 71,6 77,3 5,7 4,1 1,7 66,3 69,0 2,7 3,1 -0,4France 70,3 71,6 1,3 0,5 0,8 65,0 64,5 -0,5 -1,5 1,0Italy 62,6 67,7 5,1 3,8 1,3 56,8 60,4 3,6 3,3 0,3Cypros 72,9 78,0 5,1 5,6 -0,5 68,9 71,2 2,3 4,6 -2,3Latvia 72,9 74,2 1,3 2,4 -1,1 67,8 63,5 -4,3 0,9 -5,2Lithuania 68,1 68,2 0,1 2,9 -2,9 63,0 59,6 -3,4 3,3 -6,8Luxembourg 66,4 66,8 0,4 0,5 -0,1 61,5 59,7 -1,8 -0,6 -1,3Hungary 61,7 65,0 3,2 4,9 -1,6 56,7 57,3 0,6 3,3 -2,8Malta 59,5 64,4 4,9 3,5 1,4 55,1 55,6 0,5 0,6 -0,1Netherlands 78,7 80,2 1,6 0,8 0,8 73,1 72,1 -1,0 -1,0 -0,1Austria 74,8 77,6 2,8 1,1 1,7 68,6 70,1 1,5 1,0 0,5Poland 63,3 66,3 3,0 2,8 0,1 59,3 58,0 -1,3 0,3 -1,6Portugal 74,1 76,3 2,2 2,1 0,2 69,6 71,4 1,9 1,9 0,0Romania 63,0 61,3 -1,7 1,8 -3,6 60,0 56,3 -3,7 1,1 -4,8Slovenia 71,4 71,9 0,6 2,0 -1,4 66,3 64,1 -2,2 -0,2 -2,1SlovakRepublic
68,8 71,2 2,4 4,1 -1,7 64,5 63,1 -1,4 3,2 -4,5
Finland 75,8 79,1 3,3 2,5 0,8 69,8 71,0 1,3 -0,1 1,3Sweden 79,2 82,5 3,3 3,0 0,3 73,3 74,6 1,3 2,1 -0,9UnitedKingdom
75,6 78,7 3,1 1,6 1,5 70,4 72,8 2,4 0,7 1,7
Norway 78,8 78,0 -0,9 -0,5 -0,3 74,5 70,7 -3,8 -2,4 -1,4EU27 70,6 74,1 3,5 2,6 0,9 65,0 66,8 1,8 1,7 0,1EA 70,8 74,5 3,6 3,0 0,7 64,8 67,0 2,3 2,2 0,1EA12 70,9 74,5 3,6 2,9 0,7 64,8 67,0 2,3 2,2 0,1EU15 71,8 75,6 3,7 2,7 1,0 65,9 68,4 2,6 2,0 0,6EU10 65,2 69,0 3,7 4,1 -0,4 60,9 61,0 0,1 1,8 -1,7EU25 70,7 74,8 4,0 3,0 1,0 65,0 67,5 2,4 2,0 0,4
Source: Commission services, EPC.

76
European Economy 7/2008the 2009 Ageing Report: Underlying assumptions and projection methodologies for the EU-27 Member states
table 2.7 – Projected changes in participation rates by age-groups, 2007-2060
2007 2060 change 2007-2060
TOTALTotal
(15-64)Young
(15-24)Prime age
(25-54)Older
(55-64)Total
(15-64)Young
(15-24)Prime age
(25-54)Older
(55-64)Total
(15-64)Young
(15-24)Prime age
(25-54)Older
(55-64)BE 67,3 34,4 85,3 36,2 69,7 35,6 86,7 49,1 2,4 1,2 1,4 13,0BG 66,8 32,0 84,0 46,6 69,3 31,7 86,1 50,2 2,4 -0,3 2,1 3,6CZ 70,0 32,0 87,7 48,9 73,5 31,9 86,9 67,5 3,6 -0,1 -0,9 18,6DK 80,3 70,8 89,0 61,3 80,8 72,5 87,3 69,3 0,6 1,7 -1,7 8,1DE 76,2 51,5 87,9 57,3 79,8 52,2 89,5 73,9 3,6 0,8 1,6 16,5EE 72,9 38,5 88,4 62,4 74,5 40,0 87,8 64,1 1,6 1,5 -0,7 1,7IE 72,5 55,4 82,0 55,1 76,3 53,9 85,7 69,1 3,9 -1,5 3,7 14,0GR 67,1 32,8 82,1 44,3 68,8 32,7 84,9 51,7 1,7 -0,1 2,8 7,5ES 71,6 48,2 82,9 47,5 77,3 46,6 87,4 74,0 5,7 -1,6 4,5 26,4FR 70,3 39,4 88,3 41,0 71,6 40,2 88,9 49,3 1,3 0,8 0,6 8,3IT 62,6 31,2 77,6 34,7 67,7 32,3 78,8 63,1 5,1 1,1 1,2 28,4CY 72,9 44,2 86,7 57,6 78,0 43,4 91,8 65,1 5,1 -0,8 5,0 7,4LV 72,9 43,4 87,1 60,4 74,2 44,1 87,3 58,1 1,3 0,7 0,2 -2,3LT 68,1 28,3 86,0 55,5 68,2 29,1 83,7 54,1 0,1 0,8 -2,3 -1,4LU 66,4 27,4 84,2 33,0 66,8 29,5 86,1 41,3 0,4 2,1 1,9 8,4HU 61,7 26,1 80,0 34,1 65,0 26,2 81,1 49,3 3,2 0,1 1,0 15,2MT 59,5 55,4 69,9 31,6 64,4 56,0 71,8 50,3 4,9 0,6 1,9 18,7NL 78,7 72,7 87,7 53,3 80,2 73,8 90,2 57,6 1,6 1,1 2,5 4,2AT 74,8 61,5 87,4 40,0 77,6 63,3 89,3 55,4 2,8 1,7 1,9 15,4PL 63,3 33,9 81,8 32,1 66,3 32,9 82,1 46,5 3,0 -1,0 0,3 14,4PT 74,1 42,3 87,8 54,5 76,3 41,6 89,0 67,8 2,2 -0,8 1,2 13,3RO 63,0 30,6 78,9 42,4 61,3 31,3 75,1 45,4 -1,7 0,6 -3,9 3,1SI 71,4 40,9 89,3 34,5 71,9 40,1 88,7 49,1 0,6 -0,8 -0,6 14,6SK 68,8 34,8 87,5 39,4 71,2 34,5 87,5 52,8 2,4 -0,4 -0,1 13,4FI 75,8 54,4 88,1 59,4 79,1 55,5 90,1 67,7 3,3 1,1 2,1 8,3SE 79,2 51,8 90,0 73,2 82,5 56,5 92,2 76,6 3,3 4,7 2,2 3,4UK 75,6 62,0 84,5 59,7 78,7 62,4 85,9 71,1 3,1 0,4 1,3 11,4NO 78,8 58,8 87,4 69,9 78,0 60,5 87,5 65,6 -0,9 1,6 0,0 -4,2EU27 70,6 44,6 84,5 47,5 74,1 46,6 86,0 62,5 3,5 2,0 1,6 15,1EA 70,8 45,3 84,5 45,4 74,5 44,9 87,1 63,1 3,6 -0,5 2,5 17,7EA12 70,9 45,4 84,5 45,5 74,5 44,9 87,1 63,2 3,6 -0,4 2,5 17,7EU15 71,8 48,7 84,6 48,6 75,6 49,1 86,9 65,0 3,7 0,4 2,3 16,4EU10 65,2 34,0 83,4 36,9 69,0 32,8 84,4 52,4 3,7 -1,2 1,0 15,5EU25 70,7 45,9 84,4 46,7 74,8 47,2 86,6 63,4 4,0 1,3 2,2 16,7
MALESBE 73,9 36,6 92,5 44,8 73,4 38,4 91,3 50,6 -0,5 1,8 -1,2 5,8BG 71,4 35,4 87,3 56,3 72,9 35,2 88,7 56,8 1,4 -0,2 1,4 0,5CZ 78,3 36,8 95,0 63,3 78,9 36,9 92,8 71,9 0,6 0,1 -2,3 8,6DK 84,0 72,2 92,5 67,5 82,5 73,7 88,9 71,4 -1,5 1,5 -3,7 3,9DE 82,1 54,0 93,8 66,0 83,0 54,7 93,2 76,1 0,9 0,7 -0,6 10,1EE 77,3 44,3 93,5 63,7 77,7 45,2 91,5 63,0 0,3 0,9 -2,1 -0,6IE 81,4 58,6 91,6 69,7 81,1 57,2 92,1 70,0 -0,3 -1,4 0,5 0,3GR 78,8 36,0 94,6 61,2 76,4 37,1 93,6 58,7 -2,4 1,1 -1,0 -2,5ES 81,5 52,6 92,6 63,3 81,6 51,2 92,6 75,3 0,2 -1,4 0,0 12,0FR 75,1 43,0 94,2 43,6 75,2 44,1 92,6 52,0 0,1 1,1 -1,6 8,5IT 74,5 36,5 91,0 46,6 77,9 37,9 89,6 75,4 3,4 1,5 -1,4 28,8CY 81,2 47,4 95,0 74,8 82,7 47,0 95,3 74,7 1,5 -0,4 0,3 0,0LV 77,8 49,9 90,9 67,6 77,9 49,4 91,0 60,3 0,1 -0,5 0,0 -7,3LT 71,2 32,8 87,9 63,4 69,4 33,2 84,9 53,2 -1,8 0,4 -3,0 -10,3LU 74,7 30,9 94,7 38,1 72,1 33,0 94,6 38,2 -2,6 2,1 -0,1 0,2HU 68,7 29,9 87,0 42,9 69,2 30,3 85,8 52,0 0,5 0,4 -1,1 9,0MT 78,5 58,1 94,3 50,4 83,0 58,2 93,5 72,7 4,5 0,1 -0,8 22,3NL 84,8 73,0 94,0 64,7 82,4 74,0 93,0 59,1 -2,4 1,0 -1,0 -5,5AT 81,7 65,7 93,7 51,3 82,0 67,1 93,5 60,5 0,3 1,4 -0,2 9,2PL 70,1 37,8 88,0 45,1 71,6 36,4 85,6 57,7 1,4 -1,3 -2,4 12,6PT 79,3 45,5 92,9 63,0 79,0 44,8 91,6 70,5 -0,3 -0,7 -1,3 7,5RO 70,1 35,9 85,9 52,1 66,3 36,7 79,2 52,6 -3,7 0,8 -6,7 0,4SI 75,8 46,3 91,3 46,5 74,3 45,1 91,1 49,6 -1,5 -1,2 -0,2 3,1SK 76,6 38,9 93,9 57,6 76,2 39,2 92,9 56,6 -0,4 0,3 -1,0 -1,0

77
PARt I — Underlying assumptions and projection methodologies
2.4.2. Projection of labour supply
The labour force over the next 50 years isprojected by combining the projections ofpopulation and of rates of participation by gender/age group. To sum up the outcome of the baselinescenario, the overall labour force (aged 15 to 71)in the EU27 is projected to increase by 3.7%from 2007 to 2020. In terms of people, this meansan increase in labour force of roughly 8.6 millions.
In the euro area, an increase of almost 5% isprojected (see Table 2.8 and Graph 2.4).
The increase in labour supply over the period2007 to 2020 is mainly due to the increase infemale labour supply, while the male labourforce is projected to remain substantiallyunchanged. However, the positive trend infemale labour supply is projected to reverseduring the period 2020-2060 and, along with the
2007 2060 change 2007-2060
TOTALTotal
(15-64)Young
(15-24)Prime age
(25-54)Older
(55-64)Total
(15-64)Young
(15-24)Prime age
(25-54)Older
(55-64)Total
(15-64)Young
(15-24)Prime age
(25-54)Older
(55-64)FI 77,5 55,2 90,4 59,5 80,1 55,8 91,9 66,5 2,6 0,7 1,5 7,0SE 81,5 51,4 92,9 76,6 84,1 55,9 93,6 81,5 2,7 4,5 0,7 4,9UK 82,1 64,8 91,6 69,4 82,8 65,0 90,9 73,4 0,6 0,3 -0,7 4,1NO 81,6 57,8 90,8 74,8 78,6 59,4 88,4 67,1 -3,0 1,7 -2,4 -7,7EU27 77,8 48,1 91,9 57,3 78,8 50,1 91,0 67,0 1,0 2,0 -0,9 9,7EA 78,4 48,8 92,7 54,8 79,3 48,6 92,4 67,4 0,9 -0,2 -0,2 12,6EA12 78,5 48,8 92,7 54,8 79,3 48,6 92,4 67,4 0,9 -0,2 -0,3 12,6EU15 79,1 51,9 92,5 57,8 80,1 52,4 92,1 68,9 1,0 0,5 -0,4 11,1EU10 72,1 38,3 89,5 48,8 73,9 36,9 88,7 59,7 1,8 -1,4 -0,8 10,9EU25 77,9 49,3 92,0 56,4 79,4 50,7 91,7 67,7 1,4 1,3 -0,3 11,3
FEMALESBE 60,7 32,1 78,1 27,7 65,9 32,7 81,9 47,6 5,2 0,6 3,9 19,9BG 62,3 28,4 80,7 38,1 65,6 28,0 83,4 43,8 3,3 -0,3 2,7 5,6CZ 61,6 26,9 80,2 35,7 68,1 26,8 80,9 63,2 6,5 -0,1 0,7 27,5DK 76,5 69,4 85,4 55,1 79,1 71,3 85,6 67,2 2,6 1,8 0,2 12,2DE 70,2 48,9 81,8 48,8 76,5 49,7 85,6 71,6 6,3 0,8 3,9 22,8EE 68,8 32,5 83,7 61,4 71,4 34,6 83,9 65,1 2,6 2,1 0,2 3,7IE 63,3 52,1 72,1 40,4 71,3 50,6 79,0 68,2 8,0 -1,6 6,9 27,8GR 55,2 29,3 69,2 28,4 61,0 28,1 75,9 44,7 5,7 -1,2 6,7 16,3ES 61,5 43,6 72,7 32,7 72,9 41,9 82,0 72,6 11,4 -1,7 9,2 40,0FR 65,6 35,6 82,5 38,5 67,9 36,0 85,1 46,6 2,3 0,4 2,6 8,1IT 50,7 25,6 64,1 23,4 56,8 26,3 67,4 50,5 6,2 0,6 3,3 27,1CY 64,7 41,0 78,7 41,5 73,2 39,8 88,2 55,3 8,4 -1,3 9,5 13,8LV 68,3 36,8 83,5 54,9 70,4 38,5 83,6 56,0 2,1 1,7 0,1 1,1LT 65,2 23,6 84,2 49,6 66,9 24,9 82,5 55,0 1,8 1,3 -1,7 5,4LU 57,9 23,7 73,5 27,7 61,4 25,8 77,4 44,4 3,5 2,1 3,9 16,7HU 55,0 22,1 73,2 26,9 60,7 21,9 76,2 46,8 5,7 -0,2 3,0 19,9MT 39,9 52,7 44,5 13,3 45,1 53,7 49,3 27,4 5,2 1,1 4,8 14,1NL 72,4 72,4 81,2 41,8 78,0 73,5 87,1 55,9 5,6 1,2 5,9 14,1AT 68,0 57,2 81,1 29,3 73,1 59,2 84,9 50,3 5,1 2,0 3,9 21,0PL 56,6 30,0 75,6 20,8 60,9 29,3 78,4 35,4 4,3 -0,7 2,8 14,7PT 68,9 39,0 82,9 46,9 73,5 38,2 86,4 65,0 4,6 -0,8 3,5 18,1RO 56,0 25,2 72,0 33,8 56,1 25,5 70,8 38,4 0,1 0,3 -1,2 4,6SI 66,7 35,1 87,3 22,8 69,5 34,9 86,2 48,6 2,8 -0,2 -1,0 25,8SK 61,2 30,6 81,1 23,8 66,1 29,6 81,9 49,1 4,9 -1,0 0,8 25,3FI 74,1 53,6 85,6 59,4 78,1 55,1 88,3 68,9 4,0 1,5 2,7 9,5SE 76,8 52,2 87,1 69,8 80,8 57,0 90,8 71,7 4,0 4,9 3,7 1,9UK 69,0 59,0 77,6 50,4 74,4 59,5 80,6 68,9 5,4 0,4 3,0 18,5NO 75,9 60,0 83,9 64,8 77,3 61,6 86,5 64,1 1,4 1,6 2,6 -0,7EU27 63,4 41,0 76,9 38,2 69,4 42,9 80,8 58,1 5,9 2,0 4,0 19,9EA 63,2 41,7 76,3 36,4 69,5 41,0 81,5 58,8 6,3 -0,7 5,2 22,4EA12 63,2 41,8 76,2 36,6 69,5 41,0 81,5 58,9 6,3 -0,7 5,2 22,4EU15 64,5 45,3 76,7 39,8 70,8 45,5 81,6 61,1 6,3 0,2 4,9 21,3EU10 58,5 29,6 77,3 26,6 64,0 28,6 80,1 45,1 5,5 -1,0 2,8 18,6EU25 63,5 42,4 76,8 37,6 70,0 43,6 81,4 59,0 6,5 1,3 4,6 21,5
Source: Commission services, EPC.

78
European Economy 7/2008the 2009 Ageing Report: Underlying assumptions and projection methodologies for the EU-27 Member states
drop in male labour supply, the overall labourforce is expected to decrease by as much as13.6%, equivalent to around 33 million of people(24.4 million if compared with the level in 2007)in the EU. In the euro area, the projected fall inlabour supply between 2020 and 2060 is 12.6%,which translates into 20.4 million people (13million if compared with the level in 2007).
In the first part of the projection (2007 to 2020),a majority of EU countries (excluding DK, NL,FI, CZ, EE, LT, LV, PL, SI, BG, RO), areprojected to record an increase in labour supply(see Graph 2.4). This trend is projected to reversein the second part of the projection period (2020to 2060), when most countries are projected torecord a decrease, except for CY (+19.8%),LU (+19.5%), IE (+11%), FR (+3.1%),SE (+2.2%) and the UK (+9.2%). As alreadymentioned, the projected negative labour forcegrowth over the period 2020-2060 in the EU isto be ascribed almost exclusively to negativedemographic developments, given that theparticipation rates over the period 2020-2060 areprojected to continue to increase, albeit at alower pace than during 2007-2020.
2.4.3. Decomposing the populationcomposition effect and the participationeffect on labour supply
Table 2.9 and Table 2.10 show a decompositionof projected changes of the aggregateparticipation rate and the overall labour forceover the period 2007 to 2060, in order to identifythe respective influences of projected changes inparticipation rates and working-age population,focusing on both age and gender dimensions.The negative effect of the population compositionon the overall participation rate (the populationeffect is negative in all EU Member States),is very clear and is caused by projecteddevelopments in the prime–age population to agreat extent. The participation effect, due tochanges in the participation rates of specificcohorts, is generally positive. The participationeffect is moderately negative for the young insome countries, notably Greece, Spain, Ireland,Italy and Portugal.
Graph 2.4 – labour force projections, 2007-2060 (percentage change of total people aged 15 to 64)
Source: Commission services, EPC.
-10.0%
0.0%
10.0%
20.0%
30.0%
40.0%
-20.0%
-30.0%
-40.0%
-50.0%
2007-2020 2020-2060
CY IE Es lU BE It
NO Uk sE
EU15 EA
EA12 Pt A
t
EU25 M
t
EU27 GR sk FR HU
DE
Nl
CZ
EU10 FI
Dk Pl sI lt
RO EE lV BG

79
PARt I — Underlying assumptions and projection methodologies
tab
le2.
8–
lab
ou
rsu
pp
lyp
roje
ctio
ns,
2007
-206
0(a
ge
gro
up
:15
to64
)
Mal
esFe
mal
esTo
tal
Num
bero
fper
sons
('000
)A
nnua
lgro
wth
rate
Num
bero
fper
sons
('000
)A
nnua
lgro
wth
rate
Num
bero
fper
sons
('000
)A
nnua
lgro
wth
rate
%change
2007
2020
2060
2007
-202
020
20-2
060
2007
2020
2060
2007
-202
020
20-2
060
2007
2020
2060
2007
-202
020
20-2
060
2007
-202
020
20-2
060
BE
2593
2693
2655
0,29%
-0,04%
2105
2343
2305
0,83%
-0,04%
4698
5036
4960
0,53%
-0,04%
7,2%
-1,5%
BG
1890
1745
1092
-0,61%
-1,17%
1667
1559
953
-0,51%
-1,22%
3557
3304
2045
-0,57%
-1,19%
-7,1%
-38,1%
CZ
2884
2811
2060
-0,20%
-0,77%
2242
2264
1743
0,08%
-0,65%
5126
5075
3803
-0,08%
-0,72%
-1,0%
-25,1%
DK
1525
1481
1462
-0,23%
-0,03%
1363
1364
1347
0,01%
-0,03%
2888
2845
2808
-0,12%
-0,03%
-1,5%
-1,3%
DE
2267
422373
16354
-0,10%
-0,78%
1891
619
257
1468
60,14%
-0,68%
4159
041630
31040
0,01%
-0,73%
0,1%
-25,4%
EE
340
326
245
-0,31%
-0,71%
326
310
221
-0,39%
-0,83%
666
636
467
-0,35%
-0,77%
-4,5%
-26,6%
IE12
1714
6716
091,45%
0,23%
927
1217
1371
2,12%
0,30%
2144
2684
2980
1,74%
0,26%
25,2%
11,0%
GR
2987
2971
2391
-0,04%
-0,54%
2050
2204
1848
0,56%
-0,44%
5036
5175
4240
0,21%
-0,50%
2,8%
-18,1%
ES
1261
814023
1176
90,82%
-0,44%
9295
1162
210
208
1,73%
-0,32%
21913
2564
521
978
1,22%
-0,39%
17,0%
-14,3%
FR14
995
1508
415773
0,05%
0,11%
13229
13532
13730
0,17%
0,04%
2822
428
615
29503
0,11%
0,08%
1,4%
3,1%
IT14
554
15133
13100
0,30%
-0,36%
9882
10943
9054
0,79%
-0,47%
24435
2607
622
154
0,50%
-0,41%
6,7%
-15,0%
CY
218
270
325
1,67%
0,46%
178
236
281
2,19%
0,44%
396
506
606
1,91%
0,45%
27,8%
19,8%
LV59
255
0351
-0,55%
-1,12%
555
521
314
-0,49%
-1,25%
1147
1071
666
-0,52%
-1,18%
-6,6%
-37,8%
LT79
977
246
2-0,26%
-1,27%
781
775
456
-0,06%
-1,32%
1580
1547
918
-0,16%
-1,30%
-2,0%
-40,7%
LU12
2135
161
0,76%
0,44%
9211
2134
1,52%
0,45%
214
246
295
1,10%
0,45%
15,2%
19,5%
HU
2341
2317
1686
-0,08%
-0,79%
1938
1991
1452
0,21%
-0,79%
4279
4308
3138
0,05%
-0,79%
0,7%
-27,1%
MT
113
115
940,14%
-0,50%
5660
490,58%
-0,50%
169
175
143
0,29%
-0,50%
3,8%
-18,3%
NL
4720
4542
4038
-0,29%
-0,29%
3958
4119
3653
0,31%
-0,30%
8678
8662
7691
-0,01%
-0,30%
-0,2%
-11,2%
AT
2291
2347
2150
0,18%
-0,22%
1901
2046
1864
0,57%
-0,23%
4192
4393
4014
0,36%
-0,23%
4,8%
-8,6%
PL94
0491
1759
26-0,24%
-1,07%
7681
7706
4902
0,02%
-1,12%
1708
516823
1082
8-0,12%
-1,10%
-1,5%
-35,6%
PT27
9828
862539
0,24%
-0,32%
2485
2652
2305
0,50%
-0,35%
5283
5538
4844
0,36%
-0,33%
4,8%
-12,5%
RO
5254
5016
3052
-0,36%
-1,23%
4224
4156
2503
-0,13%
-1,26%
9478
9172
5554
-0,25%
-1,25%
-3,2%
-39,4%
SI54
552
4358
-0,31%
-0,95%
461
464
330
0,05%
-0,85%
1006
988
688
-0,14%
-0,90%
-1,8%
-30,4%
SK14
8014
8292
40,01%
-1,17%
1193
1249
784
0,35%
-1,16%
2673
2731
1708
0,16%
-1,17%
2,2%
-37,5%
FI1374
1349
1245
-0,14%
-0,20%
1286
1279
1168
-0,04%
-0,23%
2660
2628
2412
-0,09%
-0,21%
-1,2%
-8,2%
SE24
7726
1726
660,43%
0,05%
2260
2384
2443
0,41%
0,06%
4737
5001
5109
0,42%
0,05%
5,6%
2,2%
UK
1655
117
208
1888
60,30%
0,23%
13985
1521
916523
0,65%
0,21%
30536
32427
35409
0,46%
0,22%
6,2%
9,2%
NO
1281
1346
1391
0,38%
0,08%
1154
1245
1333
0,58%
0,17%
2436
2591
2724
0,48%
0,13%
6,4%
5,1%
EU
27129354
131353
113374
0,12%
-0,37%
105034
1115
8496
628
0,47%
-0,36%
234388
242937
210003
0,28%
-0,36%
3,6%
-13,6%
EA
83819
8591
174
561
0,19%
-0,35%
6681
972
086
6298
70,59%
-0,34%
150638
1579
97137548
0,37%
-0,35%
4,9%
-12,9%
EA
1282943
8500
273784
0,19%
-0,35%
6612
571326
62327
0,58%
-0,34%
1490
67156328
136112
0,37%
-0,35%
4,9%
-12,9%
EU
15103495
106307
9679
80,21%
-0,23%
83733
90293
8264
00,58%
-0,22%
1872
2819
6601
179438
0,38%
-0,23%
5,0%
-8,7%
EU
1018
715
1828
512433
-0,18%
-0,96%
1541
015
575
10532
0,08%
-0,97%
34125
33860
2296
5-0,06%
-0,97%
-0,8%
-32,2%
EU
2512
2210
1245
92109231
0,15%
-0,33%
99143
1058
6893172
0,51%
-0,32%
221353
230460
202403
0,31%
-0,32%
4,1%
-12,2%
Sou
rce
:Co
mm
issio
nse
rvic
es,
EPC
.

80
European Economy 7/2008the 2009 Ageing Report: Underlying assumptions and projection methodologies for the EU-27 Member states
tab
le2.
9–
Co
ntr
ibu
tion
toth
eo
vera
llc
ha
ng
ein
pa
rtic
ipa
tion
rate
s,20
07-2
060
(ch
an
ge
sin
%)*
Parti
cipa
tion
rate
sin
2060
Tota
lcha
nge
inpa
rtici
patio
nrates(%)
Contributionofgroup-specificchangesinparticipationratestochangeinoverallparticipationrate
Dem
ogra
phic
effe
ct
Inte
ract
ion
effe
ctTo
tal
Youn
gPr
ime
age
Old
erM
ale
Youn
gPr
ime
age
Old
erFe
mal
eYo
ung
Prim
eag
eO
lder
Tota
lYo
ung
Prim
eag
eO
lder
Mal
eFe
mal
eB
E69
,72,
43,3
0,2
0,9
2,3
0,3
0,2
-0,4
0,5
3,1
0,1
1,2
1,8
-1,2
0,1
-2,1
0,8
0,4
-0,3
0,2
BG
69,3
2,4
1,8
0,0
1,3
0,7
0,4
0,0
0,4
0,0
1,4
0,0
0,8
0,6
0,5
-0,7
0,3
0,8
0,7
-0,7
0,1
CZ
73,5
3,6
3,1
0,0
-0,5
3,6
0,1
0,0
-0,7
0,8
3,0
0,0
0,2
2,8
0,3
-0,4
0,2
0,6
0,1
-0,1
0,2
DK
80,8
0,6
0,8
0,3
-1,1
1,6
-0,6
0,1
-1,2
0,4
1,4
0,2
0,1
1,2
-0,3
1,4
-1,7
0,0
0,5
-0,4
0,1
DE
79,8
3,6
4,0
0,1
1,0
2,9
0,7
0,1
-0,2
0,9
3,3
0,1
1,2
2,0
-1,2
-0,5
-3,7
3,0
0,0
0,0
0,8
EE
74,5
1,6
0,1
0,3
-0,4
0,3
-0,5
0,1
-0,6
0,0
0,7
0,2
0,1
0,3
1,5
-1,6
1,7
1,3
1,8
-1,6
0,0
IE76,3
3,9
4,0
-0,3
2,4
2,0
0,0
-0,2
0,2
0,0
4,0
-0,2
2,2
2,0
-0,7
-0,8
-2,0
2,1
0,2
-0,2
0,5
GR
68,8
1,7
3,0
0,0
1,8
1,3
-0,5
0,1
-0,3
-0,2
3,5
-0,1
2,2
1,4
-1,6
0,1
-3,4
1,7
0,2
-0,1
0,2
ES
77,3
5,7
6,9
-0,3
3,1
4,1
0,8
-0,1
0,0
0,9
6,1
-0,1
3,1
3,2
-2,2
0,6
-5,2
2,4
0,1
-0,1
1,0
FR71
,61,3
2,0
0,2
0,4
1,5
0,4
0,1
-0,5
0,7
1,6
0,0
0,8
0,7
-0,9
0,2
-1,6
0,5
0,9
-0,8
0,1
IT67
,75,
15,
80,
20,
85,
22,
20,
1-0
,52,
53,7
0,0
1,1
2,5
-2,2
0,3
-4,0
1,4
1,0
-0,7
1,1
CY
78,0
5,1
4,0
-0,2
3,2
1,1
0,0
0,0
0,1
0,0
3,9
-0,1
3,0
1,1
0,7
-2,0
0,2
2,4
1,0
-0,8
0,4
LV74
,21,3
-0,2
0,2
0,1
-0,4
-0,5
-0,1
0,0
-0,5
0,3
0,2
0,0
0,1
1,5
-2,4
1,8
2,1
1,5
-1,3
-0,1
LT68
,20,
1-1
,40,
2-1
,4-0
,2-1
,50,
0-0
,9-0
,70,
10,
1-0
,50,
51,
7-1
,8-0
,23,7
0,8
-0,7
-0,1
LU66
,80,
42,
90,
41,3
1,3
0,2
0,2
0,0
0,0
2,7
0,2
1,3
1,3
-2,8
0,4
-4,5
1,4
-0,1
0,1
0,3
HU
65,0
3,2
3,3
0,0
0,7
2,7
0,4
0,0
-0,4
0,7
2,9
0,0
1,0
2,0
-0,7
-0,4
-1,4
1,2
0,9
-0,7
0,5
MT
64,4
4,9
4,8
0,1
1,1
3,6
1,9
0,0
-0,3
2,1
2,9
0,1
1,4
1,4
-0,5
-2,2
0,8
0,9
0,1
-0,1
0,5
NL
80,2
1,6
2,5
0,2
1,6
0,8
-0,7
0,1
-0,3
-0,5
3,3
0,1
1,9
1,3
-1,0
0,3
-2,8
1,5
0,6
-0,5
0,0
AT
77,6
2,8
4,0
0,3
1,2
2,5
0,8
0,1
-0,1
0,7
3,2
0,2
1,3
1,8
-1,9
-0,4
-3,2
1,7
0,5
-0,4
0,6
PL66,3
3,0
2,0
-0,2
0,2
2,2
0,0
-0,2
-0,7
0,9
2,0
-0,1
0,9
1,2
-0,2
-2,2
-0,2
2,1
0,7
-0,6
1,0
PT76,3
2,2
2,8
-0,1
0,8
2,3
0,1
-0,1
-0,4
0,6
2,7
-0,1
1,2
1,6
-1,3
-0,3
-3,6
2,7
0,9
-0,8
0,6
RO
61,3
-1,7
-2,0
0,1
-2,4
0,5
-2,0
0,1
-2,1
0,0
0,0
0,0
-0,4
0,4
-0,2
-1,6
-1,6
3,0
0,6
-0,5
0,3
SI71
,90,
61,
9-0
,1-0
,42,
50,
1-0
,1-0
,10,3
1,8
0,0
-0,3
2,2
-1,9
-0,2
-3,1
1,3
-0,5
0,4
0,6
SK71
,22,
41,
8-0
,10,
02,
0-0
,40,
0-0,3
-0,1
2,2
-0,1
0,2
2,1
-0,6
-2,1
-1,5
3,0
0,6
-0,5
1,0
FI79
,13,3
3,2
0,2
1,3
1,7
1,2
0,1
0,4
0,7
1,9
0,1
0,8
1,0
0,2
0,1
0,6
-0,5
0,3
-0,3
-0,1
SE82
,53,3
2,9
0,9
1,3
0,7
1,2
0,5
0,2
0,5
1,7
0,5
1,1
0,2
0,4
-0,1
2,0
-1,5
0,3
-0,3
0,0
UK
78,7
3,1
2,9
0,1
0,8
2,0
0,2
0,0
-0,2
0,4
2,7
0,0
0,9
1,7
0,1
-0,7
0,4
0,4
0,7
-0,6
0,1
NO
78,0
-0,9
-0,4
0,3
0,0
-0,8
-1,3
0,2
-0,8
-0,7
0,9
0,2
0,8
-0,1
-0,4
0,2
-1,6
1,1
-0,1
0,1
-0,1
EU
2774
,13,5
3,9
0,4
1,0
2,6
0,7
0,2
-0,3
0,8
3,2
0,2
1,3
1,8
-0,9
-0,4
-2,2
1,6
0,6
-0,5
0,4
EA
74,5
3,6
4,6
-0,1
1,6
3,1
1,0
0,0
-0,1
1,1
3,6
-0,1
1,7
2,0
-1,5
0,1
-3,3
1,6
0,5
-0,4
0,5
EA
1274
,53,6
4,6
-0,1
1,6
3,1
1,0
0,0
-0,1
1,1
3,6
-0,1
1,7
2,0
-1,5
0,2
-3,3
1,6
0,5
-0,4
0,5
EU
1575
,63,7
4,4
0,1
1,5
2,9
0,9
0,0
-0,1
1,0
3,5
0,0
1,6
1,9
-1,1
0,1
-2,6
1,4
0,5
-0,4
0,4
EU
1069
,03,7
2,8
-0,3
0,6
2,5
0,4
-0,1
-0,3
0,8
2,4
-0,1
0,9
1,6
-0,1
-1,6
-0,3
1,9
0,7
-0,5
0,8
EU
2574
,84,
04,
50,
21,
42,
91,
00,
1-0
,11,
03,5
0,1
1,5
1,9
-1,0
-0,3
-2,2
1,5
0,6
-0,4
0,5
Sou
rce
:Co
mm
issio
nse
rvic
es,
EPC
.
*(a
ge
gro
up
:15
to64
),‘y
ou
ng
’re
fers
toth
ea
ge
gro
up
15-2
4,‘p
rime
-ag
e’
to25
-54,
‘old
er’
to55
-64.
the
inte
rac
tion
eff
ec
tis
the
resid
ua
lre
ma
inin
ga
fte
rth
ed
ec
om
po
sitio
nw
as
ma
de
(se
eC
aro
ne
(200
5)fo
rafu
rth
erd
iscu
ssio
no
fth
isd
ec
om
po
sitio
n.
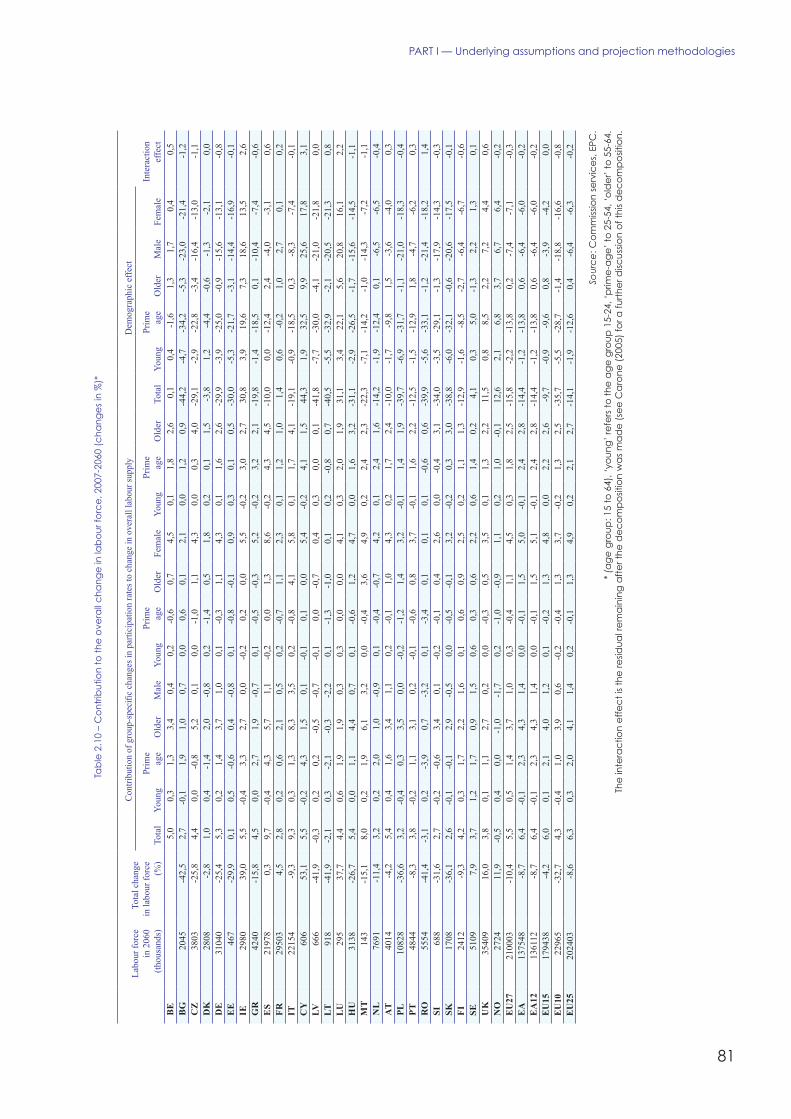
81
PARt I — Underlying assumptions and projection methodologies
tab
le2.
10–
Co
ntr
ibu
tion
toth
eo
vera
llc
ha
ng
ein
lab
ou
rfo
rce
,200
7-20
60(c
ha
ng
es
in%
)*
Labo
urfo
rce
in20
60(th
ousa
nds)
Tota
lcha
nge
inla
bour
forc
e(%)
Contributionofgroup-specificchangesinparticipationratestochangeinoveralllaboursupply
Dem
ogra
phic
effe
ct
Inte
ract
ion
effe
ctTo
tal
Youn
gPr
ime
age
Old
erM
ale
Youn
gPr
ime
age
Old
erFe
mal
eYo
ung
Prim
eag
eO
lder
Tota
lYo
ung
Prim
eag
eO
lder
Mal
eFe
mal
eB
E5,
00,3
1,3
3,4
0,4
0,2
-0,6
0,7
4,5
0,1
1,8
2,6
0,1
0,4
-1,6
1,3
1,7
0,4
0,5
BG
2045
-42,
52,
7-0
,11,
91,
00,
70,
00,
60,
12,
10,
01,
20,
9-4
4,2
-4,7
-34,2
-5,3
-23,0
-21,
4-1
,2C
Z3803
-25,
84,
40,
0-0
,85,
20,
10,
0-1
,01,
14,3
0,0
0,3
4,0
-29,
1-2
,9-2
2,8
-3,4
-16,
4-13,0
-1,1
DK
2808
-2,8
1,0
0,4
-1,4
2,0
-0,8
0,2
-1,4
0,5
1,8
0,2
0,1
1,5
-3,8
1,2
-4,4
-0,6
-1,3
-2,1
0,0
DE
31040
-25,
45,3
0,2
1,4
3,7
1,0
0,1
-0,3
1,1
4,3
0,1
1,6
2,6
-29,
9-3,9
-25,
0-0
,9-1
5,6
-13,1
-0,8
EE
467
-29,
90,
10,
5-0
,60,
4-0
,80,
1-0
,8-0
,10,
90,3
0,1
0,5
-30,0
-5,3
-21,
7-3,1
-14,
4-1
6,9
-0,1
IE29
8039,0
5,5
-0,4
3,3
2,7
0,0
-0,2
0,2
0,0
5,5
-0,2
3,0
2,7
30,8
3,9
19,6
7,3
18,6
13,5
2,6
GR
4240
-15,
84,
50,
02,
71,
9-0
,70,
1-0
,5-0,3
5,2
-0,2
3,2
2,1
-19,
8-1
,4-1
8,5
0,1
-10,
4-7
,4-0
,6E
S21
978
0,3
9,7
-0,4
4,3
5,7
1,1
-0,2
0,0
1,3
8,6
-0,2
4,3
4,5
-10,
00,
0-1
2,4
2,4
-4,0
-3,1
0,6
FR29503
4,5
2,8
0,2
0,6
2,1
0,5
0,2
-0,7
1,1
2,3
0,1
1,2
1,0
1,4
0,6
-0,2
1,0
2,7
0,1
0,2
IT22
154
-9,3
9,3
0,3
1,3
8,3
3,5
0,2
-0,8
4,1
5,8
0,1
1,7
4,1
-19,
1-0
,9-1
8,5
0,3
-8,3
-7,4
-0,1
CY
606
53,1
5,5
-0,2
4,3
1,5
0,1
-0,1
0,1
0,0
5,4
-0,2
4,1
1,5
44,3
1,9
32,5
9,9
25,6
17,8
3,1
LV66
6-4
1,9
-0,3
0,2
0,2
-0,5
-0,7
-0,1
0,0
-0,7
0,4
0,3
0,0
0,1
-41,
8-7
,7-30,0
-4,1
-21,
0-2
1,8
0,0
LT91
8-4
1,9
-2,1
0,3
-2,1
-0,3
-2,2
0,1
-1,3
-1,0
0,1
0,2
-0,8
0,7
-40,
5-5
,5-32,9
-2,1
-20,
5-21,3
0,8
LU29
537,7
4,4
0,6
1,9
1,9
0,3
0,3
0,0
0,0
4,1
0,3
2,0
1,9
31,1
3,4
22,1
5,6
20,8
16,1
2,2
HU
3138
-26,
75,
40,
01,
14,
40,
70,
1-0
,61,
24,
70,
01,
63,2
-31,1
-2,9
-26,
5-1
,7-1
5,6
-14,
5-1
,1M
T143
-15,
18,
00,
21,
96,
13,2
0,0
-0,4
3,6
4,9
0,2
2,4
2,3
-22,3
-7,1
-14,
2-1
,0-14,3
-7,2
-1,1
NL
7691
-11,
43,2
0,2
2,0
1,0
-0,9
0,1
-0,4
-0,7
4,2
0,1
2,4
1,6
-14,
2-1
,9-1
2,4
0,1
-6,5
-6,5
-0,4
AT
4014
-4,2
5,4
0,4
1,6
3,4
1,1
0,2
-0,1
1,0
4,3
0,2
1,7
2,4
-10,
0-1
,7-9
,81,
5-3,6
-4,0
0,3
PL10
828
-36,6
3,2
-0,4
0,3
3,5
0,0
-0,2
-1,2
1,4
3,2
-0,1
1,4
1,9
-39,7
-6,9
-31,7
-1,1
-21,
0-18,3
-0,4
PT48
44-8,3
3,8
-0,2
1,1
3,1
0,2
-0,1
-0,6
0,8
3,7
-0,1
1,6
2,2
-12,
5-1
,5-1
2,9
1,8
-4,7
-6,2
0,3
RO
5554
-41,
4-3,1
0,2
-3,9
0,7
-3,2
0,1
-3,4
0,1
0,1
0,1
-0,6
0,6
-39,9
-5,6
-33,1
-1,2
-21,
4-1
8,2
1,4
SI68
8-31,6
2,7
-0,2
-0,6
3,4
0,1
-0,2
-0,1
0,4
2,6
0,0
-0,4
3,1
-34,0
-3,5
-29,
1-1,3
-17,
9-14,3
-0,3
SK17
08-36,1
2,6
-0,1
-0,1
2,9
-0,5
0,0
-0,5
-0,1
3,2
-0,2
0,3
3,0
-38,8
-6,0
-32,1
-0,6
-20,
6-1
7,5
-0,1
FI24
12-9,3
4,2
0,3
1,7
2,2
1,6
0,1
0,6
0,9
2,5
0,2
1,1
1,3
-12,
9-1
,6-8
,5-2
,7-6
,4-6
,7-0
,6SE
5109
7,9
3,7
1,2
1,7
0,9
1,5
0,6
0,3
0,6
2,2
0,6
1,4
0,2
4,1
0,3
5,0
-1,3
2,2
1,3
0,1
UK
35409
16,0
3,8
0,1
1,1
2,7
0,2
0,0
-0,3
0,5
3,5
0,1
1,3
2,2
11,5
0,8
8,5
2,2
7,2
4,4
0,6
NO
2724
11,9
-0,5
0,4
0,0
-1,0
-1,7
0,2
-1,0
-0,9
1,1
0,2
1,0
-0,1
12,6
2,1
6,8
3,7
6,7
6,4
-0,2
EU
27210003
-10,
45,
50,
51,
43,7
1,0
0,3
-0,4
1,1
4,5
0,3
1,8
2,5
-15,
8-2
,2-13,8
0,2
-7,4
-7,1
-0,3
EA
137548
-8,7
6,4
-0,1
2,3
4,3
1,4
0,0
-0,1
1,5
5,0
-0,1
2,4
2,8
-14,
4-1
,2-13,8
0,6
-6,4
-6,0
-0,2
EA
12136112
-8,7
6,4
-0,1
2,3
4,3
1,4
0,0
-0,1
1,5
5,1
-0,1
2,4
2,8
-14,
4-1
,2-13,8
0,6
-6,4
-6,0
-0,2
EU
15179438
-4,2
6,0
0,1
2,1
4,0
1,2
0,1
-0,2
1,3
4,8
0,0
2,2
2,6
-9,7
-0,9
-9,6
0,8
-3,9
-4,2
0,0
EU
1022
965
-32,7
4,3
-0,4
1,0
3,9
0,6
-0,2
-0,4
1,3
3,7
-0,2
1,3
2,5
-35,7
-5,5
-28,
7-1
,4-1
8,8
-16,
6-0
,8E
U25
202403
-8,6
6,3
0,3
2,0
4,1
1,4
0,2
-0,1
1,3
4,9
0,2
2,1
2,7
-14,
1-1
,9-1
2,6
0,4
-6,4
-6,3
-0,2
Sou
rce
:Co
mm
issio
nse
rvic
es,
EPC
.
*(a
ge
gro
up
:15
to64
),‘y
ou
ng
’re
fers
toth
ea
ge
gro
up
15-2
4,‘p
rime
-ag
e’
to25
-54,
‘old
er’
to55
-64.
the
inte
rac
tion
eff
ec
tis
the
resid
ua
lre
ma
inin
ga
fte
rth
ed
ec
om
po
sitio
nw
as
ma
de
(se
eC
aro
ne
(200
5)fo
rafu
rth
erd
iscu
ssio
no
fth
isd
ec
om
po
sitio
n.
82
European Economy 7/2008the 2009 Ageing Report: Underlying assumptions and projection methodologies for the EU-27 Member states
2.5. AssuMptions on structurAluneMployMent
The calculation of the NAIRU was used as aproxy for a projection of the structuralunemployment rate under the “no policy change”scenario. As a general rule, the unemploymentrates converge to the estimated EU15 NAIRU in2009 (6.2%), based on the Spring 2008 economicforecasts by European Commission (DG ECFIN),for each country and afterwards they are keptconstant at that rate. This was considered as areasonable assumption with the advantage ofensuring consistency with other EU budgetarysurveillance procedures. Indeed, these NAIRUestimates are already used for the calculation ofthe output gap, agreed upon by the Output GapWorking Group (OGWG) of the EPC. They arealso used in the European Commission multilateralbudgetary surveillance within the context of theEU fiscal framework the Stability and GrowthPact (SGP).
To avoid extrapolating forward high levels ofNAIRU for countries still above the estimatedmedium-term EU15 average of the NAIRU(6.2%)30 (Belgium, Germany, Greece, Spain,France, Portugal, Hungary, Malta and Slovakia),the EPC agreed that these countries shouldconvergence to this unemployment rate in theperiod up to 2020.
In order to avoid that the agreed levels of theoverall structural unemployment rates UR t
change over time as a result of the interactionbetween cohort-specific structural unemploymentrates (Uri ) and the evolution of size andcomposition of different age/gender cohorts, theage-specific unemployment rates (by gender) foreach projection year (t) are calculated asfollows:
Uri,st =
NAIRUTOTt × LFTOT
t
Uri,s2007 × LFi,s
t
i∑
×Uri,s2007
This means that the age/gender specificunemployment rate structure observed in thebase year (2007) is kept unchanged and that therelative adjustment of the initially observed age/sex-specific unemployment rates are the samefor all ages and by gender.
30 Based on the Spring 2008 economic forecast by theEuropean Commission (DG ECFIN).
Table 2.11 shows the results of the projection.Overall, a reduction in the unemployment rate ofaround 1 ½ percentage points is projected (from7.2% in 2007 to 5.7% in 2020). A fall of a similarmagnitude is projected for the euro area (from7.5% in 2007 5.9% in 2020).
2.6. eMployMent projection
Given the population projection, theunemployment rate assumptions and the labourforce projection, the overall employment rates(of people age 15 to 64) in the EU are projectedto increase from 65.5% in 2007 to 69% in 2020,and to almost reach 70% in 2060, as shown inTable 2.12. In the euro area, a similardevelopment is projected and employmentreaches 70% at the end of the projection period.
The employment rate of females is projected torise from 58.4% in 2007 to 63.4% in 2020 and to65.1% in 2060. The employment rate for olderworkers will increase even more, from 44.9% in2007 to 54.5% in 2020 and further to 59.8% in2060. For the euro area, the increase in theemployment rate of older workers (55-64) ishigher than in the EU, rising by 17.7 p.p.compared with 14.9 p.p. in the EU. The olderworkers employment rate in 2060 is projected tobe 59.8% in the EU and 60.3% in the euro area,see Table 2.12.
The number of people employed (according tothe European Labour Force Survey definition) isprojected to record an annual growth rate of only0.4% over the period 2007 to 2020 (compared to1.3% over the period 1998-2007), which willreverse to a negative annual growth rate of asimilar magnitude in the subsequent period 2020to 2060 (see Table 2.13). As a result of theseopposite trends, the overall employment in theEU is projected to shrink by about 19.4 millionpeople over the period 2007 to 2060. Rises inimmigration levels in some countries andincreases in labour force participation ratesmoderate the fall in employment owed to theageing of the population and the negativepopulation growth projected for the period 2020to 2060.

83
PARt I — Underlying assumptions and projection methodologies
table 2.11 – Unemployment rate assumptions (age 15-64, in percentage)
2007 2015 2020 2025 2030 2035 2040 2045 2050 2055 2060 Change 2007-2020BE 7,5 6,8 6,2 6,2 6,2 6,2 6,2 6,2 6,2 6,2 6,2 -1,3BG 7,0 4,7 4,7 4,7 4,7 4,7 4,7 4,7 4,7 4,7 4,7 -2,3CZ 5,4 4,5 4,5 4,5 4,5 4,5 4,5 4,5 4,5 4,5 4,5 -0,9DK 3,9 3,2 3,2 3,2 3,2 3,2 3,2 3,2 3,2 3,2 3,2 -0,6DE 8,7 7,1 6,2 6,2 6,2 6,2 6,2 6,2 6,2 6,2 6,2 -2,5EE 4,8 3,5 3,5 3,5 3,5 3,5 3,5 3,5 3,5 3,5 3,5 -1,3IE 4,7 5,1 5,1 5,1 5,1 5,1 5,1 5,1 5,1 5,1 5,1 0,4GR 8,5 7,1 6,2 6,2 6,2 6,2 6,2 6,2 6,2 6,2 6,2 -2,3ES 8,3 7,5 6,2 6,2 6,2 6,2 6,2 6,2 6,2 6,2 6,2 -2,1FR 8,0 7,0 6,2 6,2 6,2 6,2 6,2 6,2 6,2 6,2 6,2 -1,8IT 6,2 5,8 5,8 5,8 5,8 5,8 5,8 5,8 5,8 5,8 5,8 -0,4CY 4,4 3,4 3,4 3,4 3,4 3,4 3,4 3,4 3,4 3,4 3,4 -0,9LV 6,1 4,8 4,8 4,8 4,8 4,8 4,8 4,8 4,8 4,8 4,8 -1,2LT 4,4 3,5 3,5 3,5 3,5 3,5 3,5 3,5 3,5 3,5 3,5 -0,9LU 4,2 4,6 4,6 4,6 4,6 4,6 4,6 4,6 4,6 4,6 4,6 0,4HU 7,4 7,0 6,2 6,2 6,2 6,2 6,2 6,2 6,2 6,2 6,2 -1,2MT 6,2 6,2 6,2 6,2 6,2 6,2 6,2 6,2 6,2 6,2 6,2 0,0NL 3,2 3,0 3,0 3,0 3,0 3,0 3,0 3,0 3,0 3,0 3,0 -0,2AT 4,5 4,3 4,3 4,3 4,3 4,3 4,3 4,3 4,3 4,3 4,3 -0,2PL 9,8 5,9 5,9 5,9 5,9 5,9 5,9 5,9 5,9 5,9 5,9 -3,9PT 8,5 6,9 6,2 6,2 6,2 6,2 6,2 6,2 6,2 6,2 6,2 -2,3RO 6,8 6,0 6,0 6,0 6,0 6,0 6,0 6,0 6,0 6,0 6,0 -0,8SI 4,9 4,7 4,7 4,7 4,7 4,7 4,7 4,7 4,7 4,7 4,7 -0,3SK 11,1 8,6 6,2 6,2 6,2 6,2 6,2 6,2 6,2 6,2 6,2 -4,9FI 7,0 5,8 5,8 5,8 5,8 5,8 5,8 5,8 5,8 5,8 5,8 -1,2SE 6,2 5,9 5,9 5,9 5,9 5,9 5,9 5,9 5,9 5,9 5,9 -0,3UK 5,4 5,4 5,4 5,4 5,4 5,4 5,4 5,4 5,4 5,4 5,4 0,0NO 2,5 4,1 4,1 4,1 4,1 4,1 4,1 4,1 4,1 4,1 4,1 1,6EU27 7,2 6,2 5,7 5,7 5,7 5,7 5,7 5,7 5,7 5,7 5,7 -1,5EA 7,5 6,5 5,9 5,9 5,9 5,8 5,8 5,8 5,8 5,8 5,8 -1,6EA12 7,5 6,5 5,9 5,9 5,9 5,9 5,9 5,9 5,9 5,9 5,9 -1,7EU15 7,1 6,3 5,8 5,8 5,8 5,8 5,7 5,7 5,7 5,7 5,7 -1,3EU10 8,3 5,8 5,5 5,5 5,5 5,5 5,5 5,5 5,5 5,5 5,4 -2,8EU25 7,3 6,2 5,7 5,7 5,7 5,7 5,7 5,7 5,7 5,7 5,7 -1,5
Source: Commission services, EPC.

84
European Economy 7/2008the 2009 Ageing Report: Underlying assumptions and projection methodologies for the EU-27 Member states
table 2.12 – Employment rate projections 2007-2060 (15-64)
Total (15-64) Females (15-64) Older workers (55-64)
2007 2015 2020 2060 2007 2015 2020 2060 2007 2015 2020 2060BE 62,3 64,7 65,4 65,4 55,5 59,6 60,8 61,4 34,6 44,2 47,1 47,4BG 62,1 66,6 67,0 66,0 57,7 62,5 63,0 62,3 43,4 45,1 45,9 47,9CZ 66,2 70,2 70,6 70,2 57,4 62,3 63,0 64,3 46,6 54,8 55,9 65,2DK 77,2 77,2 77,0 78,2 73,2 74,1 74,2 76,3 59,1 59,4 60,9 67,5DE 69,6 73,1 74,2 74,9 64,0 68,3 69,5 71,8 51,4 62,0 65,0 68,7EE 69,4 72,8 72,8 72,0 66,0 68,6 69,5 69,3 60,2 58,8 61,0 62,2IE 69,1 71,4 71,8 72,4 60,6 65,0 66,3 68,1 53,8 60,6 63,8 67,3GR 61,4 64,4 65,1 64,6 48,0 52,7 54,5 55,4 42,8 45,7 47,3 50,4ES 65,6 69,5 71,0 72,5 54,8 61,3 64,1 67,2 44,7 55,1 60,5 70,5FR 64,7 65,6 66,4 67,2 60,0 61,5 62,4 63,4 38,9 41,0 44,3 47,4IT 58,7 62,0 62,6 63,8 46,6 51,1 52,1 52,8 33,8 47,5 52,7 61,6CY 69,7 74,3 75,8 75,3 61,6 68,1 70,1 70,4 55,9 59,6 61,1 63,4LV 68,5 72,4 71,6 70,6 64,5 68,7 68,1 67,3 57,7 57,8 56,4 56,0LT 65,1 68,1 68,5 65,8 62,3 66,2 66,8 64,6 53,4 58,1 57,6 52,6LU 63,6 64,0 63,8 63,7 55,0 57,3 57,8 58,1 32,3 38,2 39,8 40,5HU 57,2 60,9 62,5 61,0 50,8 55,8 57,3 56,8 32,7 44,8 45,8 47,8MT 55,8 57,4 59,1 60,4 37,0 39,8 40,8 41,6 30,5 30,9 36,6 48,0NL 76,1 77,0 77,1 77,8 69,7 73,0 73,7 75,3 51,4 53,5 54,3 55,7AT 71,5 72,6 72,7 74,3 64,5 67,2 67,7 69,6 38,8 44,4 48,3 54,0PL 57,1 61,3 62,2 62,4 50,6 55,1 56,5 57,0 29,9 34,0 33,5 44,6PT 67,8 70,8 71,4 71,6 61,9 66,2 67,5 68,2 51,0 57,8 60,5 64,5RO 58,7 60,9 61,0 57,6 52,8 55,3 55,8 53,3 41,4 45,4 46,2 44,5SI 67,8 69,1 69,9 68,6 62,7 65,8 66,8 65,6 33,4 41,6 47,4 47,8SK 61,2 65,6 68,4 66,8 53,4 58,8 62,0 61,5 36,2 46,4 48,0 50,4FI 70,5 72,5 73,8 74,6 68,8 70,7 72,4 73,4 55,6 58,8 63,2 64,3SE 74,3 77,0 77,3 77,6 71,8 74,6 74,8 75,7 70,3 72,1 72,5 73,7UK 71,5 72,7 73,0 74,4 65,5 67,9 68,5 70,7 57,8 60,6 62,0 68,9NO 76,8 75,1 75,1 74,8 74,1 73,2 73,5 74,2 69,2 65,7 65,4 64,6EU27 65,5 68,2 69,0 69,9 58,4 62,2 63,4 65,1 44,9 51,3 54,5 60,0EA 65,5 68,6 69,5 70,1 57,8 62,0 63,4 64,9 42,6 51,2 54,8 60,3EA12 65,5 68,6 69,5 70,1 57,8 62,0 63,4 64,9 42,6 51,2 54,9 60,3EU15 66,7 69,5 70,3 71,2 59,4 63,4 64,6 66,4 45,9 53,0 56,2 62,3EU10 59,9 64,4 65,6 65,2 53,3 58,4 59,9 60,2 34,8 41,8 43,0 50,4EU25 65,6 68,7 69,5 70,5 58,4 62,6 63,8 65,7 44,1 51,2 54,3 60,7
Source: Commission services, EPC.
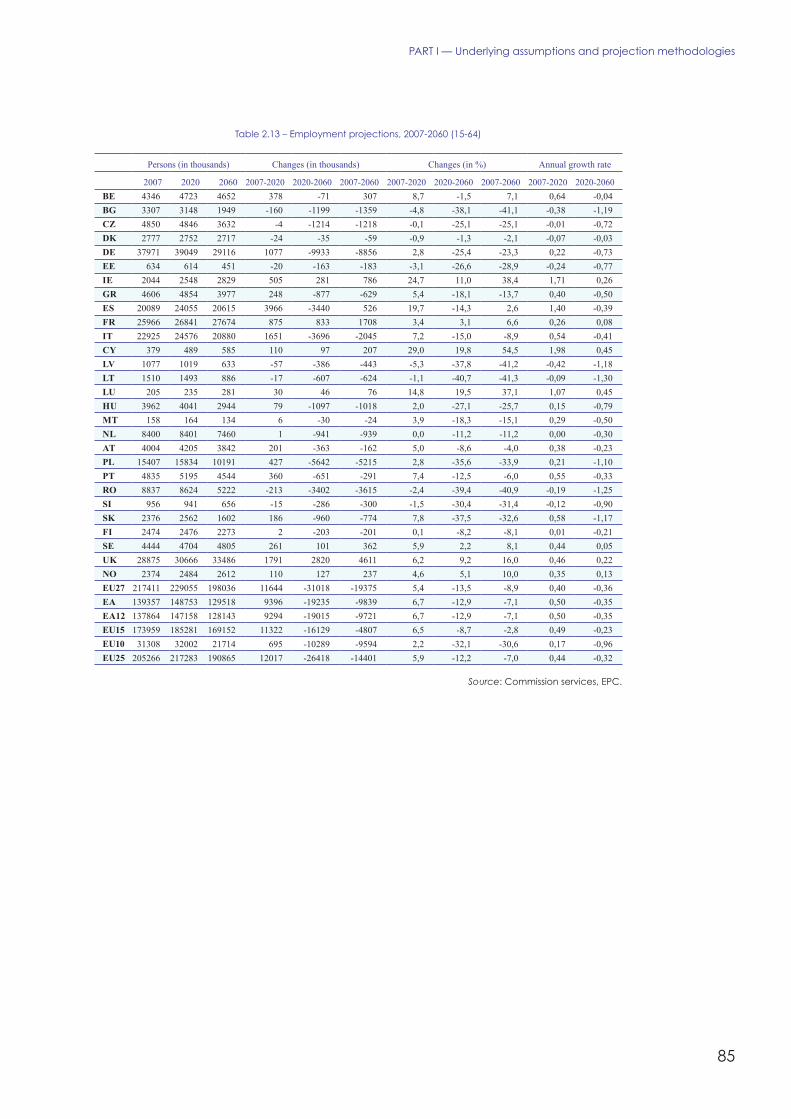
85
PARt I — Underlying assumptions and projection methodologies
table 2.13 – Employment projections, 2007-2060 (15-64)
Persons (in thousands) Changes (in thousands) Changes (in %) Annual growth rate
2007 2020 2060 2007-2020 2020-2060 2007-2060 2007-2020 2020-2060 2007-2060 2007-2020 2020-2060BE 4346 4723 4652 378 -71 307 8,7 -1,5 7,1 0,64 -0,04BG 3307 3148 1949 -160 -1199 -1359 -4,8 -38,1 -41,1 -0,38 -1,19CZ 4850 4846 3632 -4 -1214 -1218 -0,1 -25,1 -25,1 -0,01 -0,72DK 2777 2752 2717 -24 -35 -59 -0,9 -1,3 -2,1 -0,07 -0,03DE 37971 39049 29116 1077 -9933 -8856 2,8 -25,4 -23,3 0,22 -0,73EE 634 614 451 -20 -163 -183 -3,1 -26,6 -28,9 -0,24 -0,77IE 2044 2548 2829 505 281 786 24,7 11,0 38,4 1,71 0,26GR 4606 4854 3977 248 -877 -629 5,4 -18,1 -13,7 0,40 -0,50ES 20089 24055 20615 3966 -3440 526 19,7 -14,3 2,6 1,40 -0,39FR 25966 26841 27674 875 833 1708 3,4 3,1 6,6 0,26 0,08IT 22925 24576 20880 1651 -3696 -2045 7,2 -15,0 -8,9 0,54 -0,41CY 379 489 585 110 97 207 29,0 19,8 54,5 1,98 0,45LV 1077 1019 633 -57 -386 -443 -5,3 -37,8 -41,2 -0,42 -1,18LT 1510 1493 886 -17 -607 -624 -1,1 -40,7 -41,3 -0,09 -1,30LU 205 235 281 30 46 76 14,8 19,5 37,1 1,07 0,45HU 3962 4041 2944 79 -1097 -1018 2,0 -27,1 -25,7 0,15 -0,79MT 158 164 134 6 -30 -24 3,9 -18,3 -15,1 0,29 -0,50NL 8400 8401 7460 1 -941 -939 0,0 -11,2 -11,2 0,00 -0,30AT 4004 4205 3842 201 -363 -162 5,0 -8,6 -4,0 0,38 -0,23PL 15407 15834 10191 427 -5642 -5215 2,8 -35,6 -33,9 0,21 -1,10PT 4835 5195 4544 360 -651 -291 7,4 -12,5 -6,0 0,55 -0,33RO 8837 8624 5222 -213 -3402 -3615 -2,4 -39,4 -40,9 -0,19 -1,25SI 956 941 656 -15 -286 -300 -1,5 -30,4 -31,4 -0,12 -0,90SK 2376 2562 1602 186 -960 -774 7,8 -37,5 -32,6 0,58 -1,17FI 2474 2476 2273 2 -203 -201 0,1 -8,2 -8,1 0,01 -0,21SE 4444 4704 4805 261 101 362 5,9 2,2 8,1 0,44 0,05UK 28875 30666 33486 1791 2820 4611 6,2 9,2 16,0 0,46 0,22NO 2374 2484 2612 110 127 237 4,6 5,1 10,0 0,35 0,13EU27 217411 229055 198036 11644 -31018 -19375 5,4 -13,5 -8,9 0,40 -0,36EA 139357 148753 129518 9396 -19235 -9839 6,7 -12,9 -7,1 0,50 -0,35EA12 137864 147158 128143 9294 -19015 -9721 6,7 -12,9 -7,1 0,50 -0,35EU15 173959 185281 169152 11322 -16129 -4807 6,5 -8,7 -2,8 0,49 -0,23EU10 31308 32002 21714 695 -10289 -9594 2,2 -32,1 -30,6 0,17 -0,96EU25 205266 217283 190865 12017 -26418 -14401 5,9 -12,2 -7,0 0,44 -0,32
Source: Commission services, EPC.

86
European Economy 7/2008the 2009 Ageing Report: Underlying assumptions and projection methodologies for the EU-27 Member states
table 2.14 – Employment rate projections by age and sex, 2007-2060 (15-64)
2007 2060 change 2007-2060
TOTALTotal
(15-64)Young
(15-24)Prime age
(25-54)Older
(55-64)Total
(15-64)Young
(15-24)Prime age
(25-54)Older
(55-64)Total
(15-64)Young
(15-24)Prime age
(25-54)Older
(55-64)BE 62,3 27,9 79,7 34,6 65,4 30,1 81,9 47,4 3,1 2,2 2,2 12,7BG 62,1 27,3 78,8 43,4 66,0 28,5 82,5 47,9 3,9 1,2 3,6 4,5CZ 66,2 28,6 83,4 46,6 70,2 29,0 83,2 65,2 4,0 0,4 -0,2 18,5DK 77,2 65,2 86,3 59,1 78,2 67,9 85,0 67,5 1,0 2,7 -1,3 8,4DE 69,6 45,4 80,9 51,4 74,9 47,9 84,5 68,7 5,3 2,5 3,5 17,3EE 69,4 34,7 84,7 60,2 72,0 37,2 85,1 62,2 2,6 2,5 0,3 2,0IE 69,1 50,4 78,7 53,8 72,4 48,1 81,9 67,3 3,4 -2,2 3,2 13,5GR 61,4 25,3 75,7 42,8 64,6 27,0 80,0 50,4 3,1 1,6 4,3 7,6ES 65,6 39,5 76,8 44,7 72,5 40,1 82,7 70,5 6,9 0,6 5,8 25,8FR 64,7 32,1 82,2 38,9 67,2 34,4 84,1 47,4 2,5 2,3 1,9 8,5IT 58,7 24,9 73,5 33,8 63,8 25,7 74,8 61,6 5,0 0,9 1,3 27,7CY 69,7 39,5 83,8 55,9 75,3 39,4 89,1 63,4 5,6 -0,1 5,4 7,6LV 68,5 38,9 82,3 57,7 70,6 40,4 83,3 56,0 2,1 1,4 1,0 -1,7LT 65,1 26,0 82,5 53,4 65,8 27,1 80,9 52,6 0,6 1,1 -1,6 -0,8LU 63,6 23,2 81,2 32,3 63,7 24,8 82,8 40,5 0,1 1,5 1,6 8,2HU 57,2 21,4 74,6 32,7 61,0 22,0 76,2 47,8 3,8 0,6 1,6 15,1MT 55,8 48,3 66,5 30,5 60,4 48,6 68,1 48,0 4,6 0,3 1,6 17,6NL 76,1 68,4 85,5 51,4 77,8 69,8 88,0 55,7 1,7 1,4 2,6 4,3AT 71,5 56,2 84,1 38,8 74,3 57,9 85,9 54,0 2,8 1,7 1,8 15,1PL 57,1 26,7 75,0 29,9 62,4 28,3 77,7 44,6 5,3 1,6 2,7 14,7PT 67,8 35,3 81,0 51,0 71,6 36,3 83,9 64,5 3,8 1,0 2,9 13,6RO 58,7 24,5 74,5 41,4 57,6 25,3 71,0 44,5 -1,1 0,7 -3,5 3,2SI 67,8 36,8 85,3 33,4 68,6 36,0 84,8 47,8 0,7 -0,7 -0,5 14,4SK 61,2 27,8 78,6 36,2 66,8 30,3 82,2 50,4 5,6 2,5 3,6 14,2FI 70,5 45,4 83,4 55,6 74,6 47,8 86,1 64,3 4,0 2,4 2,7 8,7SE 74,3 41,9 86,1 70,3 77,6 46,5 88,3 73,7 3,3 4,7 2,2 3,4UK 71,5 53,1 81,4 57,8 74,4 53,1 82,5 68,9 2,9 0,0 1,1 11,1NO 76,8 54,5 85,8 69,2 74,8 53,4 84,7 64,6 -2,1 -1,1 -1,0 -4,6EU27 65,5 37,7 79,2 44,9 69,9 40,5 81,8 60,0 4,4 2,8 2,6 15,1EA 65,5 38,6 79,0 42,6 70,1 39,3 82,6 60,3 4,6 0,7 3,6 17,7EA12 65,5 38,5 78,9 42,6 70,1 39,3 82,5 60,3 4,6 0,7 3,6 17,7EU15 66,7 41,5 79,5 45,9 71,2 42,6 82,7 62,3 4,5 1,2 3,2 16,4EU10 59,9 27,9 77,4 34,8 65,2 28,7 80,2 50,4 5,4 0,8 2,8 15,6EU25 65,6 38,9 79,1 44,1 70,5 41,1 82,4 60,7 4,9 2,2 3,2 16,6
MALESBE 69,0 30,4 87,0 43,2 69,3 33,0 86,8 49,2 0,4 2,6 -0,2 6,0BG 66,7 30,5 82,2 52,7 69,6 31,8 85,2 54,3 2,9 1,3 2,9 1,6CZ 74,9 33,0 91,7 60,4 76,0 33,5 89,9 69,3 1,1 0,6 -1,8 8,8DK 81,0 66,1 90,2 65,4 80,0 68,8 86,9 69,7 -1,0 2,6 -3,2 4,3DE 75,0 47,2 86,5 59,6 77,9 49,9 88,0 71,0 2,9 2,7 1,6 11,4EE 73,0 39,0 89,6 59,4 74,5 41,2 88,7 59,7 1,5 2,3 -0,9 0,3IE 77,3 52,8 87,7 67,9 76,6 50,4 87,7 67,9 -0,7 -2,3 0,0 0,0GR 74,5 30,3 90,1 59,4 73,4 32,6 90,4 57,4 -1,1 2,2 0,2 -2,0ES 76,2 44,6 87,6 60,2 77,7 45,2 89,0 72,6 1,5 0,6 1,4 12,4FR 69,5 35,4 88,3 41,2 70,8 38,1 88,1 49,9 1,3 2,7 -0,2 8,7IT 70,8 29,8 87,3 45,4 74,1 31,0 86,0 73,4 3,3 1,2 -1,3 28,0CY 78,0 41,9 92,3 72,5 80,1 42,3 93,1 72,8 2,2 0,3 0,8 0,3LV 72,7 44,5 85,6 64,3 73,8 45,0 86,6 57,7 1,1 0,6 1,0 -6,6LT 68,1 30,5 84,3 60,9 67,0 31,2 82,0 51,5 -1,1 0,8 -2,3 -9,4LU 72,0 26,5 91,9 37,2 69,2 28,1 91,6 37,4 -2,8 1,5 -0,3 0,1HU 63,7 24,7 81,3 41,0 65,0 25,6 81,0 50,1 1,3 0,9 -0,4 9,1MT 74,0 49,4 90,3 48,8 78,6 49,2 89,4 70,5 4,6 -0,2 -0,9 21,6NL 82,4 68,9 92,1 62,2 80,2 70,2 91,3 57,0 -2,3 1,4 -0,9 -5,2AT 78,4 60,2 90,6 49,8 78,8 61,7 90,4 59,0 0,4 1,4 -0,2 9,1PL 63,7 30,3 81,2 41,8 67,6 31,6 81,4 55,1 3,9 1,4 0,2 13,3PT 73,8 39,4 87,2 58,6 74,9 40,2 87,4 66,9 1,1 0,8 0,2 8,3RO 64,7 28,4 80,5 50,3 61,8 29,3 74,4 51,0 -2,9 1,0 -6,1 0,7SI 72,7 42,0 88,1 45,1 71,5 41,0 88,1 48,4 -1,3 -1,0 -0,1 3,3
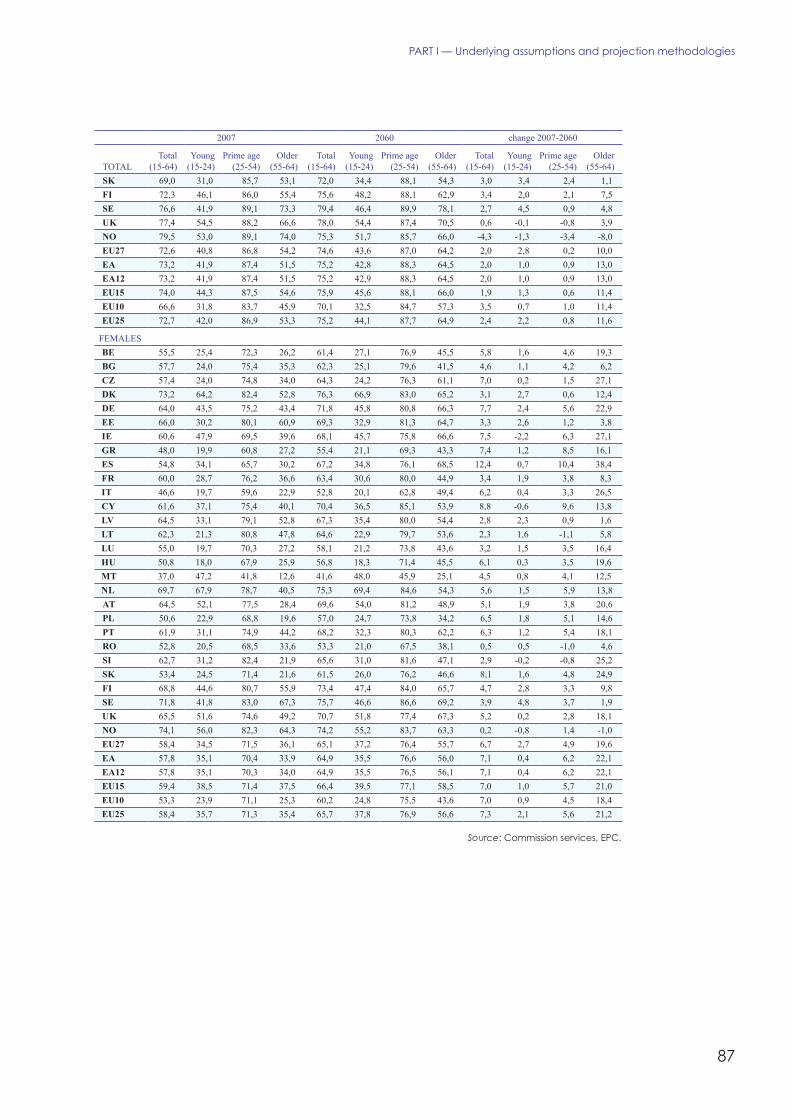
87
PARt I — Underlying assumptions and projection methodologies
2007 2060 change 2007-2060
TOTALTotal
(15-64)Young
(15-24)Prime age
(25-54)Older
(55-64)Total
(15-64)Young
(15-24)Prime age
(25-54)Older
(55-64)Total
(15-64)Young
(15-24)Prime age
(25-54)Older
(55-64)SK 69,0 31,0 85,7 53,1 72,0 34,4 88,1 54,3 3,0 3,4 2,4 1,1FI 72,3 46,1 86,0 55,4 75,6 48,2 88,1 62,9 3,4 2,0 2,1 7,5SE 76,6 41,9 89,1 73,3 79,4 46,4 89,9 78,1 2,7 4,5 0,9 4,8UK 77,4 54,5 88,2 66,6 78,0 54,4 87,4 70,5 0,6 -0,1 -0,8 3,9NO 79,5 53,0 89,1 74,0 75,3 51,7 85,7 66,0 -4,3 -1,3 -3,4 -8,0EU27 72,6 40,8 86,8 54,2 74,6 43,6 87,0 64,2 2,0 2,8 0,2 10,0EA 73,2 41,9 87,4 51,5 75,2 42,8 88,3 64,5 2,0 1,0 0,9 13,0EA12 73,2 41,9 87,4 51,5 75,2 42,9 88,3 64,5 2,0 1,0 0,9 13,0EU15 74,0 44,3 87,5 54,6 75,9 45,6 88,1 66,0 1,9 1,3 0,6 11,4EU10 66,6 31,8 83,7 45,9 70,1 32,5 84,7 57,3 3,5 0,7 1,0 11,4EU25 72,7 42,0 86,9 53,3 75,2 44,1 87,7 64,9 2,4 2,2 0,8 11,6
FEMALESBE 55,5 25,4 72,3 26,2 61,4 27,1 76,9 45,5 5,8 1,6 4,6 19,3BG 57,7 24,0 75,4 35,3 62,3 25,1 79,6 41,5 4,6 1,1 4,2 6,2CZ 57,4 24,0 74,8 34,0 64,3 24,2 76,3 61,1 7,0 0,2 1,5 27,1DK 73,2 64,2 82,4 52,8 76,3 66,9 83,0 65,2 3,1 2,7 0,6 12,4DE 64,0 43,5 75,2 43,4 71,8 45,8 80,8 66,3 7,7 2,4 5,6 22,9EE 66,0 30,2 80,1 60,9 69,3 32,9 81,3 64,7 3,3 2,6 1,2 3,8IE 60,6 47,9 69,5 39,6 68,1 45,7 75,8 66,6 7,5 -2,2 6,3 27,1GR 48,0 19,9 60,8 27,2 55,4 21,1 69,3 43,3 7,4 1,2 8,5 16,1ES 54,8 34,1 65,7 30,2 67,2 34,8 76,1 68,5 12,4 0,7 10,4 38,4FR 60,0 28,7 76,2 36,6 63,4 30,6 80,0 44,9 3,4 1,9 3,8 8,3IT 46,6 19,7 59,6 22,9 52,8 20,1 62,8 49,4 6,2 0,4 3,3 26,5CY 61,6 37,1 75,4 40,1 70,4 36,5 85,1 53,9 8,8 -0,6 9,6 13,8LV 64,5 33,1 79,1 52,8 67,3 35,4 80,0 54,4 2,8 2,3 0,9 1,6LT 62,3 21,3 80,8 47,8 64,6 22,9 79,7 53,6 2,3 1,6 -1,1 5,8LU 55,0 19,7 70,3 27,2 58,1 21,2 73,8 43,6 3,2 1,5 3,5 16,4HU 50,8 18,0 67,9 25,9 56,8 18,3 71,4 45,5 6,1 0,3 3,5 19,6MT 37,0 47,2 41,8 12,6 41,6 48,0 45,9 25,1 4,5 0,8 4,1 12,5NL 69,7 67,9 78,7 40,5 75,3 69,4 84,6 54,3 5,6 1,5 5,9 13,8AT 64,5 52,1 77,5 28,4 69,6 54,0 81,2 48,9 5,1 1,9 3,8 20,6PL 50,6 22,9 68,8 19,6 57,0 24,7 73,8 34,2 6,5 1,8 5,1 14,6PT 61,9 31,1 74,9 44,2 68,2 32,3 80,3 62,2 6,3 1,2 5,4 18,1RO 52,8 20,5 68,5 33,6 53,3 21,0 67,5 38,1 0,5 0,5 -1,0 4,6SI 62,7 31,2 82,4 21,9 65,6 31,0 81,6 47,1 2,9 -0,2 -0,8 25,2SK 53,4 24,5 71,4 21,6 61,5 26,0 76,2 46,6 8,1 1,6 4,8 24,9FI 68,8 44,6 80,7 55,9 73,4 47,4 84,0 65,7 4,7 2,8 3,3 9,8SE 71,8 41,8 83,0 67,3 75,7 46,6 86,6 69,2 3,9 4,8 3,7 1,9UK 65,5 51,6 74,6 49,2 70,7 51,8 77,4 67,3 5,2 0,2 2,8 18,1NO 74,1 56,0 82,3 64,3 74,2 55,2 83,7 63,3 0,2 -0,8 1,4 -1,0EU27 58,4 34,5 71,5 36,1 65,1 37,2 76,4 55,7 6,7 2,7 4,9 19,6EA 57,8 35,1 70,4 33,9 64,9 35,5 76,6 56,0 7,1 0,4 6,2 22,1EA12 57,8 35,1 70,3 34,0 64,9 35,5 76,5 56,1 7,1 0,4 6,2 22,1EU15 59,4 38,5 71,4 37,5 66,4 39,5 77,1 58,5 7,0 1,0 5,7 21,0EU10 53,3 23,9 71,1 25,3 60,2 24,8 75,5 43,6 7,0 0,9 4,5 18,4EU25 58,4 35,7 71,3 35,4 65,7 37,8 76,9 56,6 7,3 2,1 5,6 21,2
Source: Commission services, EPC.

88
European Economy 7/2008the 2009 Ageing Report: Underlying assumptions and projection methodologies for the EU-27 Member states
table 2.15 – Employment composition, 2007-2060
2007 2060
TOTALYoung
(15-24)Prime age
(25-54)Older
(55-64)Young
(15-24)Prime age
(25-54)Older
(55-64)BE 8% 82% 10% 9% 77% 14%BG 8% 78% 13% 7% 77% 15%CZ 8% 78% 14% 7% 74% 19%DK 15% 70% 15% 17% 66% 17%DE 11% 76% 13% 11% 69% 21%EE 11% 75% 14% 10% 74% 16%IE 16% 73% 11% 13% 70% 17%GR 7% 81% 12% 7% 76% 16%ES 10% 79% 11% 10% 70% 20%FR 10% 80% 11% 10% 76% 13%IT 7% 83% 10% 7% 72% 22%CY 13% 75% 12% 9% 74% 16%LV 13% 74% 14% 10% 75% 15%LT 9% 78% 12% 7% 76% 17%LU 6% 86% 8% 7% 80% 12%HU 7% 83% 10% 6% 77% 17%MT 18% 72% 11% 13% 69% 18%NL 16% 72% 12% 16% 68% 15%AT 14% 77% 9% 14% 71% 15%PL 11% 81% 8% 7% 77% 16%PT 9% 78% 13% 9% 72% 20%RO 9% 80% 11% 7% 76% 17%SI 10% 82% 8% 9% 76% 14%SK 10% 81% 9% 7% 76% 17%FI 12% 72% 16% 12% 71% 17%SE 11% 70% 19% 12% 71% 17%UK 15% 71% 14% 14% 69% 17%NO 13% 70% 16% 14% 69% 17%EU27 11% 77% 12% 10% 72% 18%EA 10% 78% 11% 10% 72% 18%EA12 10% 78% 11% 10% 72% 18%EU15 11% 77% 12% 11% 71% 18%EU10 10% 80% 10% 7% 76% 17%EU25 11% 77% 12% 10% 72% 18%
MALESBE 8% 81% 11% 9% 77% 14%BG 9% 77% 14% 8% 76% 16%CZ 8% 77% 15% 8% 74% 19%DK 14% 70% 16% 17% 66% 17%DE 11% 75% 13% 11% 69% 20%EE 13% 75% 12% 10% 75% 14%IE 15% 73% 12% 13% 71% 16%GR 7% 80% 13% 8% 76% 16%ES 10% 78% 12% 10% 71% 19%FR 10% 79% 10% 11% 76% 13%IT 7% 82% 11% 7% 71% 22%CY 12% 74% 14% 9% 73% 17%LV 15% 73% 13% 11% 75% 15%LT 11% 77% 12% 8% 76% 16%LU 6% 86% 8% 8% 82% 10%HU 7% 82% 11% 7% 77% 16%MT 14% 74% 12% 10% 70% 20%NL 15% 71% 14% 16% 69% 15%AT 14% 76% 10% 14% 71% 15%PL 11% 79% 10% 8% 75% 18%PT 10% 77% 13% 9% 71% 19%RO 10% 79% 11% 8% 74% 18%SI 11% 79% 10% 10% 76% 14%

89
PARt I — Underlying assumptions and projection methodologies
As a result of different trends in the agecomposition of the population, the age structureof the labour force is projected to undergo anumber of relevant changes. The share of olderworkers (aged 55 to 64) in the total labour forceis projected to rise by 50%, rising from 11.6%in 2007 to about 17.4% in 2060 in the EU (seeTable 2.16). In the euro area, it is projected torise slightly more, reaching 17.8% in 2060.The increase projected is particularly high in
Italy (from 10.1% to 20.8%), Spain (from 10.3%to 19.7%) and Slovakia (from 8.6% to 16.9%).
Most of the increase materializes in the period to2020 in the EU and in the euro area. The shareof older workers are projected to fall in the latterpart of the projection period between 2020 and2060 in some other Member States (BE, DE, FI,SE, EE, LV and SI).
2007 2060
TOTALYoung
(15-24)Prime age
(25-54)Older
(55-64)Young
(15-24)Prime age
(25-54)Older
(55-64)SK 10% 79% 11% 8% 75% 17%FI 12% 72% 15% 12% 72% 16%SE 11% 70% 19% 11% 71% 18%UK 15% 70% 15% 14% 70% 16%NO 13% 71% 17% 13% 70% 17%EU27 11% 77% 12% 11% 72% 17%EA 10% 78% 12% 10% 72% 18%EA12 10% 78% 12% 10% 72% 18%EU15 11% 76% 13% 11% 71% 17%EU10 10% 79% 11% 8% 75% 17%EU25 11% 77% 13% 11% 72% 17%
FEMALESBE 8% 83% 8% 8% 77% 15%BG 8% 80% 12% 7% 79% 14%CZ 8% 80% 12% 6% 74% 20%DK 15% 70% 15% 17% 66% 18%DE 12% 76% 12% 10% 69% 21%EE 10% 74% 16% 9% 74% 18%IE 17% 74% 9% 13% 69% 18%GR 7% 83% 10% 7% 77% 17%ES 10% 81% 9% 9% 70% 21%FR 9% 80% 11% 10% 77% 14%IT 6% 84% 9% 6% 72% 21%CY 13% 77% 10% 9% 76% 15%LV 11% 74% 15% 9% 75% 16%LT 7% 80% 13% 6% 76% 18%LU 6% 86% 8% 7% 78% 15%HU 6% 84% 10% 5% 77% 17%MT 26% 67% 7% 19% 68% 14%NL 17% 72% 11% 17% 68% 16%AT 14% 78% 7% 14% 72% 15%PL 10% 84% 6% 7% 80% 14%PT 9% 79% 13% 8% 72% 20%RO 8% 82% 10% 6% 77% 16%SI 9% 85% 6% 8% 77% 15%SK 10% 84% 7% 7% 76% 17%FI 12% 71% 17% 12% 70% 18%SE 11% 69% 19% 12% 71% 17%UK 15% 71% 14% 14% 68% 18%NO 14% 70% 16% 14% 69% 17%EU27 11% 78% 11% 10% 72% 18%EA 10% 79% 11% 10% 72% 18%EA12 10% 79% 11% 10% 72% 18%EU15 11% 77% 11% 11% 71% 18%EU10 9% 82% 9% 7% 77% 16%EU25 11% 78% 11% 10% 72% 18%
Source: Commission services, EPC.

90
European Economy 7/2008the 2009 Ageing Report: Underlying assumptions and projection methodologies for the EU-27 Member states
2.7. econoMic dependency rAtioseMerging froM the lAbour forceprojection
These trends are mirrored in the effectiveeconomic old-age dependency ratio (the numberof inactive people aged 65 and above, as apercentage of population aged 15-64 employed),see Table 2.17, and in the total economicdependency ratio, see Table 2.18. It is importantto consider the effective economic old-agedependency ratio when assessing the impact ofageing on budgetary expenditure, pension publicschemes above all. This indicator shows thebalance between the inactive elderly and theeconomically active (employed) population. Theindicator is a result of interacting projecteddemographic trends with projected developmentsin the labour force participation rates and
unemployment rates. The ratio is projected torise sharply for the EU27 from 37% in 2007 to42% in 2020 and 72% in 2060. In the euro area,a similar evolution is projected, with theeffective old-age dependency ratio rising from39% in 2007 to 45% in 2020 and 73% in 2060.Extremely high values are projected in some EUcountries. In Poland and Romania, theprojections point to a situation in which therewill be as many (or more) inactive oldpersons as employed in 2060 (106% and 99%,respectively). Also, the effective economic old-age dependency ratio will be 90% or more inBulgaria, Lithuania, Hungary, Malta andSlovakia. By contrast, it is projected to be two
table 2.16 – share of older workers (labour force aged 55 to 64 as a percentage of the labour force aged 15 to 64)
Males Females Total Change
2007 2020 2060 2007 2020 2060 2007 2020 2060 2007-2020 2020-2060 2007-2060BE 10,5 14,7 13,4 8,1 14,8 14,4 9,4 14,8 13,9 5,3 -0,9 4,4BG 14,1 14,3 15,9 12,4 13,7 14,2 13,3 14,0 15,1 0,7 1,1 1,7CZ 14,9 15,5 18,6 11,8 14,2 19,2 13,6 14,9 18,9 1,3 4,0 5,3DK 16,1 16,3 17,1 14,7 15,6 17,5 15,4 16,0 17,3 0,5 1,3 1,9DE 13,6 21,9 20,4 12,3 20,2 21,2 13,0 21,1 20,8 8,1 -0,3 7,8EE 12,0 14,5 14,5 15,9 18,9 17,3 13,9 16,6 15,8 2,7 -0,8 1,9IE 12,1 13,1 15,3 9,1 14,1 17,5 10,8 13,5 16,3 2,8 2,8 5,5GR 12,7 14,8 16,0 9,2 13,6 15,5 11,3 14,3 15,8 3,1 1,4 4,5ES 11,5 15,7 18,7 8,6 16,7 20,8 10,3 16,1 19,7 5,8 3,5 9,4FR 10,2 12,7 13,0 10,6 13,6 13,3 10,4 13,1 13,1 2,7 0,0 2,7IT 11,0 18,0 21,3 8,7 17,0 20,2 10,1 17,6 20,8 7,5 3,3 10,8CY 13,7 15,3 17,4 9,9 12,3 14,7 12,0 13,9 16,1 1,9 2,3 4,2LV 12,4 14,3 14,5 14,3 17,5 16,0 13,3 15,9 15,2 2,6 -0,6 2,0LT 12,0 15,3 16,4 12,8 19,1 18,2 12,4 17,2 17,3 4,8 0,1 4,9LU 7,9 10,8 10,1 7,3 12,9 14,4 7,6 11,7 12,1 4,1 0,3 4,4HU 10,4 12,2 15,8 9,5 14,3 16,8 10,0 13,1 16,3 3,1 3,2 6,3MT 12,1 14,5 19,4 6,7 8,4 13,7 10,3 12,4 17,4 2,1 5,0 7,1NL 14,0 15,6 15,2 10,7 14,6 15,5 12,5 15,1 15,3 2,6 0,2 2,8AT 10,1 14,5 15,2 7,3 13,5 14,6 8,9 14,1 14,9 5,2 0,9 6,1PL 9,4 12,0 17,5 6,1 8,9 13,2 7,9 10,6 15,5 2,7 5,0 7,7PT 12,9 16,3 19,4 12,1 16,9 19,6 12,6 16,6 19,5 4,1 2,9 7,0RO 10,7 13,3 17,5 9,8 12,3 15,7 10,3 12,8 16,6 2,5 3,8 6,3SI 10,0 14,0 13,9 5,9 15,2 14,3 8,1 14,6 14,1 6,5 -0,5 6,0SK 10,5 13,3 16,7 6,3 13,3 17,1 8,6 13,3 16,9 4,7 3,6 8,2FI 15,5 17,2 16,1 16,9 19,5 17,7 16,2 18,3 16,9 2,1 -1,4 0,7SE 18,9 18,1 17,6 18,7 17,0 16,4 18,8 17,6 17,0 -1,2 -0,5 -1,8UK 14,8 15,4 16,0 13,2 16,2 17,6 14,1 15,8 16,7 1,7 0,9 2,7NO 16,4 16,6 16,6 15,4 15,6 16,4 16,0 16,1 16,5 0,1 0,4 0,5EU27 12,3 16,1 17,3 10,7 15,8 17,6 11,6 16,0 17,4 4,4 1,4 5,8EA 12,0 17,1 17,6 10,4 16,7 18,0 11,3 16,9 17,8 5,6 0,9 6,5EA12 12,0 17,1 17,6 10,4 16,7 18,1 11,3 16,9 17,8 5,6 0,9 6,5EU15 12,7 16,8 17,3 11,2 16,6 17,9 12,0 16,7 17,6 4,7 0,8 5,6EU10 10,8 13,1 17,1 8,2 11,9 15,4 9,6 12,5 16,3 2,9 3,8 6,7EU25 12,4 16,3 17,3 10,7 15,9 17,6 11,6 16,1 17,4 4,5 1,3 5,8
Source: Commission services, EPC.

91
PARt I — Underlying assumptions and projection methodologies
thirds or less in DK, IE, FR, CY, LU, NL, AT,PT, FI, SE, UK and NO.
The total economic dependency ratio is the ratiobetween total inactive population and employedpeople (15-64). It gives an indication of theaverage number of people that each economicallyactive person ‘supports’, and thus is relevantwhen considering the prospects for potentialGDP per capita growth. It is projected to declinein the first period of projection (up to 2020) inthe EU (from 125% in 2007 to 122% in 2020).Thereafter, it increases to 151% by 2060. Asimilar development is projected in the euro area.These results need to be interpreted carefully.They show that overall economic dependency isprojected to decline up to 2020 mostly due to abetter labour market performance (especially the
projected increase in female employment rates),but also due to low fertility (i.e. smaller numberof young people imply a decline in the youthdependency ratio). However, these effects taper-off after 2020 and the increase in the totaleconomic dependency ratio between 2020 and2060 is evident for all Member States. There arehowever large cross-country differences. Forsome MS (Lithuania, Poland, Slovakia andRomania) it rises by 60 percentage points ormore between 2020 and 2060, while for someothers (Denmark, France, Finland, Sweden andthe UK) it is projected to rise more modestly, by20 percentage points or less.31
31 For more detailed information on the evolution of theeconomic dependency ratios per Member State, see theStatistical Annex.
table 2.17 – Effective economic old-age dependency ratio (inactive population aged 65 and above as apercentage of employed population aged 15 to 64)
Males Females Total Change
2007 2020 2060 2007 2020 2060 2007 2020 2060 2007-2020 2020-2060 2007-2060BE 30 36 57 54 56 81 41 45 68 4,2 22,8 27,0BG 29 32 74 50 56 111 39 43 91 4,3 48,1 52,3CZ 20 30 67 42 53 97 29 40 81 10,7 40,9 51,6DK 22 34 43 35 46 57 28 40 50 11,3 10,1 21,4DE 31 36 63 53 55 84 41 45 73 3,8 28,2 32,0EE 20 23 56 44 52 92 32 37 73 5,1 35,5 40,6IE 16 20 47 29 31 64 21 25 55 3,7 29,8 33,5GR 30 35 69 64 67 108 43 48 86 5,2 37,4 42,6ES 26 29 66 51 48 94 36 37 79 1,1 41,5 42,6FR 29 39 55 49 58 78 38 48 66 9,4 17,7 27,2IT 34 39 66 75 76 124 50 55 89 4,8 34,7 39,5CY 18 21 44 30 32 64 23 26 53 3,0 27,2 30,2LV 19 24 70 46 51 109 32 38 88 5,4 50,8 56,2LT 22 24 79 45 45 105 33 34 92 1,2 57,8 59,1LU 23 31 51 45 46 73 33 38 61 5,1 23,3 28,4HU 24 32 74 51 63 112 36 46 91 9,9 45,1 55,0MT 21 35 66 61 86 152 34 53 95 18,4 42,9 61,3NL 20 31 49 35 43 66 27 37 57 9,8 20,2 30,0AT 24 31 55 45 47 74 34 38 63 4,6 25,2 29,8PL 21 30 84 45 56 132 32 42 106 9,9 63,9 73,8PT 24 28 56 43 47 80 33 37 67 4,6 30,0 34,5RO 20 25 78 38 48 124 28 35 99 6,8 63,8 70,7SI 21 33 77 43 53 98 31 42 87 11,2 44,7 55,9SK 18 22 78 38 41 117 27 31 96 4,4 64,7 69,0FI 26 39 55 42 55 71 34 47 63 13,5 15,6 29,1SE 27 34 49 41 46 63 34 40 56 6,4 15,7 22,1UK 25 31 44 40 43 59 32 36 51 4,8 14,3 19,1NO 21 30 50 33 39 60 27 35 55 7,8 20,6 28,4EU27 27 33 60 49 54 86 37 42 72 5,8 29,4 35,2EA 29 35 61 53 56 88 39 45 73 5,1 28,6 33,7EA12 29 35 61 53 56 88 40 45 73 5,1 28,5 33,6EU15 28 34 57 50 54 81 38 43 68 5,2 24,7 29,9EU10 21 29 77 45 54 117 32 40 95 8,8 54,6 63,4EU25 27 33 59 49 54 85 37 43 71 5,8 28,2 34,0
Source: Commission services, EPC.
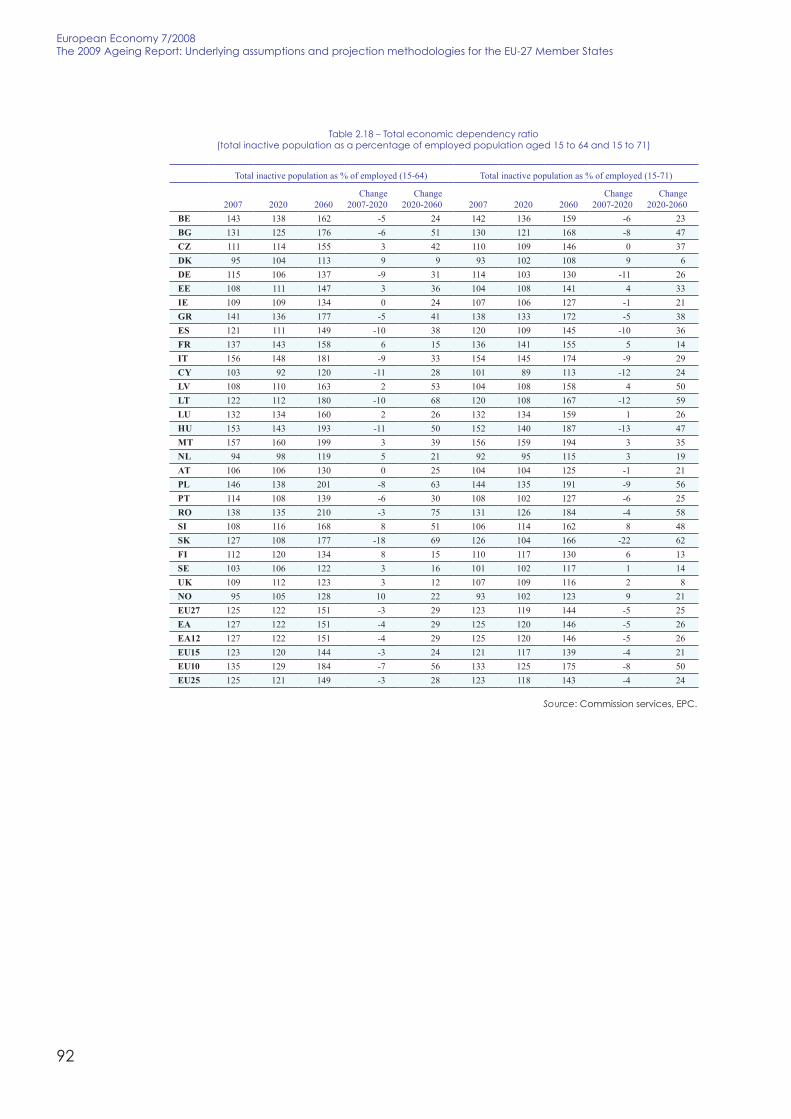
92
European Economy 7/2008the 2009 Ageing Report: Underlying assumptions and projection methodologies for the EU-27 Member states
table 2.18 – total economic dependency ratio(total inactive population as a percentage of employed population aged 15 to 64 and 15 to 71)
Total inactive population as % of employed (15-64) Total inactive population as % of employed (15-71)
2007 2020 2060Change
2007-2020Change
2020-2060 2007 2020 2060Change
2007-2020Change
2020-2060BE 143 138 162 -5 24 142 136 159 -6 23BG 131 125 176 -6 51 130 121 168 -8 47CZ 111 114 155 3 42 110 109 146 0 37DK 95 104 113 9 9 93 102 108 9 6DE 115 106 137 -9 31 114 103 130 -11 26EE 108 111 147 3 36 104 108 141 4 33IE 109 109 134 0 24 107 106 127 -1 21GR 141 136 177 -5 41 138 133 172 -5 38ES 121 111 149 -10 38 120 109 145 -10 36FR 137 143 158 6 15 136 141 155 5 14IT 156 148 181 -9 33 154 145 174 -9 29CY 103 92 120 -11 28 101 89 113 -12 24LV 108 110 163 2 53 104 108 158 4 50LT 122 112 180 -10 68 120 108 167 -12 59LU 132 134 160 2 26 132 134 159 1 26HU 153 143 193 -11 50 152 140 187 -13 47MT 157 160 199 3 39 156 159 194 3 35NL 94 98 119 5 21 92 95 115 3 19AT 106 106 130 0 25 104 104 125 -1 21PL 146 138 201 -8 63 144 135 191 -9 56PT 114 108 139 -6 30 108 102 127 -6 25RO 138 135 210 -3 75 131 126 184 -4 58SI 108 116 168 8 51 106 114 162 8 48SK 127 108 177 -18 69 126 104 166 -22 62FI 112 120 134 8 15 110 117 130 6 13SE 103 106 122 3 16 101 102 117 1 14UK 109 112 123 3 12 107 109 116 2 8NO 95 105 128 10 22 93 102 123 9 21EU27 125 122 151 -3 29 123 119 144 -5 25EA 127 122 151 -4 29 125 120 146 -5 26EA12 127 122 151 -4 29 125 120 146 -5 26EU15 123 120 144 -3 24 121 117 139 -4 21EU10 135 129 184 -7 56 133 125 175 -8 50EU25 125 121 149 -3 28 123 118 143 -4 24
Source: Commission services, EPC.

93
PARt I — Underlying assumptions and projection methodologies
2.8. projection of totAl hours Worked
Given the population projection, theunemployment rate assumptions, the labourforce projection, the projected employment rates(of people age 15 to 71) and the assumptions onchanges in hours worked per person (seesection 2.2), the total hours worked are projectedin the EU Member States. Compared with theprojections in the 2006 Ageing Report, thisdefinition of labour input has been adopted so asto ensure consistency with the commonly agreedproduction function32 used to calculate outputgaps for the purpose of, inter alia, estimatingcyclically adjusted budget balances (CABs) inthe context of the European Commission’smultilateral budgetary surveillance.
32 See Chapter 3 below for a detailed account of theproduction function used in the projections.
Total hours worked are projected to increase by5.4% in the period to 2020 in the EU. However,from 2020 onwards the situation is projected toreverse and hours worked will fall by 12.9%between 2020 and 2060. Over the entire projectionperiod, total hours worked are projected to fall by8.2% in the EU. For the euro area, the projectedfall is less marked (-5.7% between 2007 and2060). In terms of annual average growth rates,hours worked are projected to fall by 0.2% over2007-2060 in the EU and by 0.1% in the euroarea, see Table 2.19.33 These trends in hoursworked reflect the employment trends discussedabove in section 2.6 and also a composition effect,that is the increasing share over time of employed
33 The total hours worked for 2007-09 are those estimatedusing the production function framework described inChapter 3. For the remainder of the projection period, theCohort Simulation Model (CSM) described in this chapterwas used.
table 2.19 – Hours worked projections, 2007-2060 (15-71)
Hours worked Changes (in %) Annual growth rate
2007 2020 2060 2007-2020 2020-2060 2007-2060 2007-2020 2020-2060 2007-2060BE 6811725 7399271 7328685 8,6 -1,0 7,6 0,64 -0,02 0,14BG 6086043 6013689 3763873 -1,2 -37,4 -38,2 -0,09 -1,16 -0,90CZ 10065931 10265402 7561245 2,0 -26,3 -24,9 0,15 -0,75 -0,54DK 4337645 4263439 4337642 -1,7 1,7 0,0 -0,13 0,04 0,00DE 56477313 57824880 44071237 2,4 -23,8 -22,0 0,18 -0,67 -0,47EE 1251928 1223064 906329 -2,3 -25,9 -27,6 -0,17 -0,75 -0,61IE 3916593 4837319 5436890 23,5 12,4 38,8 1,64 0,31 0,62EL 9932662 10534369 8666089 6,1 -17,7 -12,8 0,45 -0,48 -0,26ES 34141734 40571919 35007024 18,8 -13,7 2,5 1,34 -0,34 0,05FR 39388759 40917784 42325893 3,9 3,4 7,5 0,29 0,09 0,14IT 45587744 48822601 42123305 7,1 -13,7 -7,6 0,53 -0,35 -0,15CY 717137 904274 1101631 26,1 21,8 53,6 1,80 0,51 0,82LV 2058438 1955897 1228970 -5,0 -37,2 -40,3 -0,39 -1,16 -0,97LT 2804346 2852439 1740942 1,7 -39,0 -37,9 0,13 -1,22 -0,89LU 537855 709267 848400 31,9 19,6 57,7 2,16 0,45 0,87HU 7759623 7929924 5822693 2,2 -26,6 -25,0 0,17 -0,75 -0,54MT 272100 282489 234971 3,8 -16,8 -13,6 0,29 -0,45 -0,28NL 11926435 11982687 10691803 0,5 -10,8 -10,4 0,04 -0,28 -0,21AT 7042953 7370820 6874922 4,7 -6,7 -2,4 0,35 -0,16 -0,05PL 29802231 30720638 20259082 3,1 -34,1 -32,0 0,24 -1,02 -0,72PT 9150381 9764107 8742888 6,7 -10,5 -4,5 0,50 -0,26 -0,09RO 18215626 18258586 11452667 0,2 -37,3 -37,1 0,02 -1,14 -0,87SI 1651397 1643158 1155942 -0,5 -29,7 -30,0 -0,04 -0,87 -0,67SK 3856145 4249614 2728630 10,2 -35,8 -29,2 0,75 -1,07 -0,65FI 4242813 4282158 3958545 0,9 -7,6 -6,7 0,07 -0,19 -0,13SE 7310995 7736562 7960944 5,8 2,9 8,9 0,44 0,07 0,16UK 48239708 50402272 56529915 4,5 12,2 17,2 0,34 0,28 0,30NO 3405200 3663082 3858101 7,6 5,3 13,3 0,57 0,13 0,24EU27 373586260 393718628 342861156 5,4 -12,9 -8,2 0,40 -0,34 -0,16EA 231797601 247847104 218568224 6,9 -11,8 -5,7 0,52 -0,30 -0,11EA12 229156968 245017182 216075681 6,9 -11,8 -5,7 0,52 -0,30 -0,11EU15 289045316 307419455 284904183 6,4 -7,3 -1,4 0,48 -0,18 -0,03EU10 60239274 62026899 42740433 3,0 -31,1 -29,0 0,23 -0,91 -0,64EU25 349284591 369446354 327644616 5,8 -11,3 -6,2 0,43 -0,29 -0,12
Source: Commission services, EPC.

94
European Economy 7/2008the 2009 Ageing Report: Underlying assumptions and projection methodologies for the EU-27 Member states
persons working part-time. As a result of thiscomposition effect, average hours worked perperson will change over time.
There are major differences between the MemberStates, mainly reflecting different demographictrends. A reduction in hours worked of 20% ormore between 2007 and 2060 is projected forBG, CZ, DE, EE, LV, LT, HU, PL, RO, SI andSK. In contrast, for some other Member States(BE, IE, ES, FR, CY, LU, SE and the UK) anincrease is projected over the same period.
2.9. coMpArison With the projection inthe 2006 Ageing report
This section provides a brief comparison of themain results in the current projection exercisewith the 2006 Ageing Report.
In the EU25, the participation rate (15-64) isnow projected to increase at virtually the samepace as in the 2006 projection up to 2050, by4 p.p. By contrast, the older workers (55-64)participation rates are projected to increase morethan in the 2006 projection. The structuralunemployment rate in 2007 (7.3%) is lower thanin the 2006 projection, but the decrease in theunemployment rate is projected to be smaller inthe current projection. Similarly, regarding theemployment rate, it is higher in 2007 in thecurrent projection exercise, but is projected toincrease less in the period to 2050. The reverseis the case for the employment rate of olderworkers (55-64), which is now projected toincrease more.
table 2.20 – labour force projections, 2009 projection, 2007-2050
Projection exercise 2009
Employment rate(15-64)
Employment rate(55-64)
Participation rate(15-64)
Participation rate(55-64)
Unemployment rate(15-64)
2007 2050p.p.
change 2007 2050p.p.
change 2007 2050p.p.
change 2007 2050p.p.
change 2007 2050p.p.
changeBE 62,3 65,4 3,1 34,6 47,6 13,0 67,3 69,7 2,3 36,2 49,4 13,2 7,5 6,2 -1,3BG 62,1 64,7 2,5 43,4 45,4 2,0 66,8 67,9 1,0 46,6 47,6 1,0 7,0 4,7 -2,3CZ 66,2 70,2 4,0 46,6 64,5 17,8 70,0 73,5 3,5 48,9 66,8 17,9 5,4 4,5 -0,9DK 77,2 78,3 1,2 59,1 68,4 9,3 80,3 81,0 0,7 61,3 70,3 9,0 3,9 3,2 -0,6DE 69,6 74,8 5,2 51,4 68,7 17,3 76,2 79,7 3,5 57,3 73,9 16,5 8,7 6,2 -2,5EE 69,4 71,2 1,8 60,2 60,1 -0,1 72,9 73,7 0,8 62,4 61,9 -0,5 4,8 3,5 -1,3IE 69,1 72,5 3,4 53,8 66,5 12,7 72,5 76,3 3,9 55,1 68,3 13,1 4,7 5,1 0,4GR 61,4 64,8 3,4 42,8 50,0 7,2 67,1 69,1 1,9 44,3 51,3 7,0 8,5 6,2 -2,3ES 65,6 72,8 7,2 44,7 69,7 24,9 71,6 77,6 6,0 47,5 73,1 25,6 8,3 6,2 -2,1FR 64,7 67,1 2,4 38,9 46,5 7,7 70,3 71,5 1,2 41,0 48,4 7,5 8,0 6,2 -1,8IT 58,7 64,0 5,3 33,8 61,3 27,5 62,6 67,9 5,3 34,7 62,8 28,2 6,2 5,8 -0,4CY 69,7 75,3 5,6 55,9 63,7 7,9 72,9 78,0 5,1 57,6 65,4 7,8 4,4 3,4 -0,9LV 68,5 68,5 0,1 57,7 52,4 -5,3 72,9 72,0 -0,9 60,4 54,4 -6,0 6,1 4,8 -1,2LT 65,1 65,2 0,1 53,4 53,2 -0,2 68,1 67,6 -0,5 55,5 54,8 -0,7 4,4 3,5 -0,9LU 63,6 64,0 0,4 32,3 41,4 9,1 66,4 67,1 0,6 33,0 42,3 9,3 4,2 4,6 0,4HU 57,2 60,9 3,7 32,7 47,8 15,1 61,7 64,9 3,2 34,1 49,4 15,2 7,4 6,2 -1,2MT 55,8 60,4 4,6 30,5 48,8 18,3 59,5 64,4 4,9 31,6 51,1 19,5 6,2 6,2 0,0NL 76,1 78,0 1,8 51,4 55,9 4,5 78,7 80,4 1,7 53,3 57,8 4,5 3,2 3,0 -0,2AT 71,5 74,2 2,7 38,8 54,6 15,7 74,8 77,5 2,7 40,0 56,0 16,0 4,5 4,3 -0,2PL 57,1 61,7 4,6 29,9 44,3 14,3 63,3 65,5 2,2 32,1 46,2 14,1 9,8 5,9 -3,9PT 67,8 71,8 4,0 51,0 64,3 13,3 74,1 76,6 2,5 54,5 67,5 13,0 8,5 6,2 -2,3RO 58,7 56,9 -1,9 41,4 43,4 2,0 63,0 60,5 -2,5 42,4 44,2 1,8 6,8 6,0 -0,8SI 67,8 68,3 0,4 33,4 47,0 13,6 71,4 71,6 0,3 34,5 48,3 13,8 4,9 4,7 -0,3SK 61,2 66,0 4,9 36,2 50,2 14,0 68,8 70,4 1,6 39,4 52,6 13,1 11,1 6,2 -4,9FI 70,5 74,5 4,0 55,6 65,1 9,4 75,8 79,1 3,3 59,4 68,5 9,1 7,0 5,8 -1,2SE 74,3 77,5 3,2 70,3 74,1 3,8 79,2 82,4 3,2 73,2 77,1 3,9 6,2 5,9 -0,3UK 71,5 74,3 2,8 57,8 69,0 11,2 75,6 78,6 3,0 59,7 71,3 11,6 5,4 5,4 0,0NO 76,8 74,8 -2,1 69,2 65,5 -3,7 78,8 78,0 -0,8 69,9 66,5 -3,4 2,5 4,1 1,6EU27 65,5 69,7 4,2 44,9 59,4 14,5 70,6 73,9 3,3 47,5 62,0 14,5 7,2 5,7 -1,5EA 65,5 70,4 4,8 42,6 60,8 18,2 70,8 74,7 3,9 45,4 63,7 18,3 7,5 5,8 -1,6EA12 65,5 70,4 4,8 42,6 60,9 18,2 70,9 74,7 3,9 45,5 63,8 18,3 7,5 5,9 -1,7EU15 66,7 71,4 4,7 45,9 62,8 16,9 71,8 75,7 3,9 48,6 65,6 17,0 7,1 5,7 -1,4EU10 59,9 65,0 5,2 34,8 50,9 16,1 65,2 68,8 3,6 36,9 52,9 16,0 8,3 5,5 -2,8EU25 65,6 70,5 5,0 44,1 60,9 16,8 70,7 74,8 4,1 46,7 63,6 16,9 7,3 5,7 -1,6
Source: Commission services, EPC.

95
PARt I — Underlying assumptions and projection methodologies
table 2.21 – labour force projections, 2009 projection – 2006 projection, 2007-2050
Projection exercise 2009 - Projection exercise 2006
Employment rate(15-64)
Employment rate(55-64)
Participation rate(15-64)
Participation rate(55-64)
Unemployment rate(15-64)
2007 2050p.p.
change 2007 2050p.p.
change 2007 2050p.p.
change 2007 2050p.p.
change 2007 2050p.p.
changeBE 1,4 -0,1 -1,5 4,3 3,3 -1,0 1,6 -0,3 -1,9 5,1 4,5 -0,6 0,1 -0,3 -0,4BGCZ 0,7 0,5 -0,2 0,9 5,6 4,6 -1,1 -1,1 0,0 1,5 6,7 5,2 -2,5 -2,0 0,5DK 0,9 0,5 -0,4 -2,6 1,6 4,2 0,6 -0,4 -1,0 -2,6 1,3 3,9 -0,4 -1,0 -0,6DE 1,6 1,3 -0,3 6,4 3,0 -3,4 1,5 0,7 -0,7 6,6 4,7 -1,9 -0,4 -0,8 -0,4EE 3,1 0,4 -2,7 6,1 -1,6 -7,7 0,7 -2,4 -3,1 5,0 -1,8 -6,7 -3,4 -3,5 -0,2IE -0,3 -2,1 -1,8 1,0 -2,4 -3,4 0,6 -0,9 -1,5 1,5 -1,3 -2,7 1,3 1,6 0,4GR 0,0 -0,3 -0,3 -1,1 -3,0 -1,9 -0,5 -0,9 -0,3 -0,8 -2,4 -1,6 -0,8 -0,8 0,0ES 1,4 1,4 0,0 1,0 7,2 6,2 0,7 0,8 0,1 1,3 9,2 7,9 -1,1 -0,8 0,3FR 0,9 -0,9 -1,8 -3,0 -6,3 -3,3 0,3 -1,6 -1,9 -2,6 -5,7 -3,1 -0,9 -0,8 0,1IT -0,2 -1,6 -1,5 1,1 6,7 5,6 -1,3 -2,3 -1,0 0,9 7,5 6,5 -1,6 -0,7 0,8CY -2,7 -2,0 0,6 -1,6 -5,3 -3,7 -2,2 -2,7 -0,5 -1,7 -5,2 -3,5 0,7 -0,8 -1,5LV 1,4 -2,8 -4,2 8,3 -6,3 -14,6 0,1 -4,7 -4,8 8,0 -6,1 -14,1 -1,7 -2,2 -0,5LT -0,1 -6,5 -6,4 3,0 -13,0 -16,0 -4,1 -9,5 -5,5 0,3 -13,6 -13,9 -5,2 -3,5 1,7LU -0,2 -1,5 -1,3 -1,5 -0,4 1,1 -0,2 -1,3 -1,1 -1,2 0,1 1,3 0,0 0,4 0,4HU -2,5 -2,4 0,1 -2,7 -1,7 1,0 -0,9 -1,5 -0,6 -1,9 -0,7 1,2 2,7 1,4 -1,2MT 0,4 -1,0 -1,4 -0,5 15,7 16,2 -1,2 -1,6 -0,4 -0,3 17,3 17,6 -2,6 -0,8 1,8NL 1,2 0,1 -1,1 4,3 0,8 -3,5 1,2 -0,1 -1,3 5,3 1,8 -3,5 0,0 -0,2 -0,2AT -0,5 -2,2 -1,6 4,2 -3,5 -7,7 0,3 -1,5 -1,8 3,9 -3,2 -7,1 1,1 0,9 -0,2PL 2,5 -4,4 -6,8 -1,5 -4,4 -2,9 -2,9 -5,5 -2,6 -1,7 -3,1 -1,4 -7,7 -1,1 6,6PT -3,1 -1,5 1,6 -3,8 -0,4 3,4 -1,0 -1,1 -0,1 -2,2 1,3 3,4 2,9 0,6 -2,3ROSI 1,6 -1,1 -2,7 -0,9 -5,6 -4,7 1,3 -1,8 -3,1 -0,3 -4,8 -4,4 -0,6 -0,9 -0,3SK 0,7 -2,7 -3,4 2,2 -1,0 -3,2 -3,4 -3,5 -0,1 2,1 0,6 -1,6 -5,2 -0,8 4,4FI 0,4 0,1 -0,2 0,9 0,2 -0,7 0,4 -0,5 -0,9 2,0 1,0 -1,0 0,0 -0,7 -0,7SE -0,2 -0,1 0,0 -0,4 -2,5 -2,1 1,4 1,3 -0,1 0,1 -2,0 -2,1 1,9 1,6 -0,3UK -0,7 -0,4 0,3 2,2 5,1 2,9 -0,1 0,2 0,3 2,6 6,0 3,4 0,8 0,8 0,0NOEU27EAEA12 0,4 -0,1 -0,5 0,9 2,1 1,2 0,0 -0,6 -0,6 1,1 3,3 2,1 -0,6 -0,6 0,0EU15 0,1 -0,1 -0,3 0,8 2,5 1,7 -0,1 -0,4 -0,3 1,1 3,6 2,5 -0,3 -0,3 0,0EU10 1,1 -2,0 -3,1 -1,7 -1,0 0,7 -2,4 -3,0 -0,6 -1,8 0,1 2,0 -4,8 -1,1 3,7EU25 0,3 -0,3 -0,6 0,4 2,1 1,6 -0,4 -0,7 -0,2 0,6 3,2 2,5 -1,0 -0,4 0,6
Source: Commission services, EPC.

96
European Economy 7/2008the 2009 Ageing Report: Underlying assumptions and projection methodologies for the EU-27 Member states
Annex 2.1:projecting labour force developments usingthe cohort simulation model
Overall approach of the cohortmethodology
The dynamic cohort method used in theprojections34 is based on a model that calculatesthe rates of entry and exit from labour market foreach of the latest available generation.35 This isthe same methodology initially developed by theOECD36, with one difference, the single-year ofage rather than the 5-year age groups are used.
The dynamic cohort approach is based on theestimates of the exit and entry rates into thelabour market of a “synthetic” generation/cohort.The cohort is “synthetic” because, due to thelack of true longitudinal data on participationbehaviour of each individual, we do not reallyobserve the same person over years but weassume that those aged x+1 at year t+1 arerepresentative of the same generation (aged x attime t) observed one year later. Due to the lackof specific information on each individual’sbehaviour, this assumption neglects inflows andoutflows from the labour market that cancel outeach other.37
The participation rate projections are produced byapplying the entry and exit rates observed overthe period 1998-2007 to each projected single-year cohort of the working age population overthe period 2008-2060. These entry and exit ratesare kept constant over the entire projection period.Thus, for example, we calculate the entry (or exit)rate of persons aged X, for X =15 to 71 (and thusof the generation born in 2008-X) and apply thisrate to persons aged X in 2008, 2009, 2010 and soon up to 2060 to get projections of futureparticipation rates. This is different from the staticprojection method, which keeps constant over the
34 See Carone (2005).35 The method is a dynamic version of the Latulippe(1996) methodology, developed by Sherer (2002).36 See Burniaux et al. (2003).37 This means for example that if in year t there are 100persons aged x in the labour force and that the years afterwhen aged x+1 these same persons leave the labour force(for whatever reason, such as being discouraged, have diedor emigrated), but they are replaced for by 100 differentpersons aged x+1, previously out of the labour force, we donot observe any change in the size of our “syntheticcohort”. As a consequence we calculate net rates of exitand entry that are equal to zero, while the actual (gross)value is 100 per cent.
period of projection the participation rate ofpersons aged X. In this way, the method takesimplicitly into account that women belonging toany given generation or cohort have their ownspecific level of participation, and this is usuallyhigher at all ages than the corresponding level ofparticipation of older cohorts. This participationgap between subsequent generations reflects notonly socio-cultural factors but also individualcharacteristics, such as number of children andthe level of education. Thus, the cohort approachused in the simulation tends to produce anautonomous increase of female participation –referred to as a “cohort effect” – corresponding tothe gradual replacement of currently older womenby younger women.
the calculation of entry rates
We calculate the rate of entry into the labourmarket for people previously inactive, asfollows.
The number of persons who enter the labourmarket, while taking into account of the upperlimit on participation (the maximum amount ofpeople in the labour force is the number ofpersons in working age for each age-group) canbe expressed as:
NLFxt+1 = (Popmaxwa− LFx
t ) − (Popmaxwa− LFx+1t+1)
where LFxt + NLFx+1
t+1 ≤ Popmaxwa
where NLF is the number of people expected tobecome active between age x and x+1, Popmaxwais the maximum population in working age thatcan potentially enter the labour market (which isusually a bit less than the overall civilianpopulation in working age, due for example toillness/inability) and LF is the number of activepersons (in labour force) aged x in year t andaged x+1 in year t+1.
By multiplying and dividing for the populationaged x at time t (which is supposed to remain thesame as the population aged x+1 at time t+1),we get:
NLFxt+1 = [ (Prmax−Prx
t ) − (Prmax−Prx+1t+1) ]* Popx
t
97
PARt I — Underlying assumptions and projection methodologies
where Prmax is the upper limit to the participationrate (we assume 0.99 for both male and female38).Thus, we can calculate the rate of entry, Ren bydividing the number of people expected tobecome active by the number of people inactiveat time t, that is:
Ren = NLFxt+1
Popmax wa− LFx
t = [ (Prmax−Prxt ) − (Prmax−Prx+1
t+1) ]* Popxt
Popmax wa− LFx
t
which, taking into account that PRxt =
Popxt
LFxt and
Prmax= =Popmaxwa x
t
Popxt can be reformulated as:
Renx+1 = [ (Prmax−Prxt ) − (Prmax−Prx+1
t+1) ]* 1(Prmax−Prx
t )
or Renx+1= [ 1− (Prmax−Prx+1
t+1)(Prmax− Prx
t ) ] ≥ 0
or Renx+1=
(Prx+1t+1−Prx
t )(1−Prx
t ) ] ≥ 0 when Prmax=1
And re-arranging we obtain the analyticalformulation used for projecting participationrates. Thus, projections of participation ratesbased on these entry rates are:
PRx+1t+1 = Re nx+1 *(PRmax− PRx
t ) +PRxt ]
Thus, projections of participation rates for eachsingle-year cohort (x+1) can be calculated byapplying the entry rates observed in a given yearor period over the period of projections (t=2008-2060). In practical terms, the entry rates for eachage has been calculated on the basis of theaverage of the participation rates observed overthe period 1998-2007.
the calculation of exit rates
In the same way, when participation rates for twoadjacent single-year age groups are falling, wecan calculate the exit rate (that is the netreduction in the labour force relative to thenumber of people who were initially in the labourforce in the same cohort the year before) asfollows.
The number of persons that leave the labourmarket at time t+1 is equivalent to:
OPxt+1 = LFx
t − LFx+1t+1
38 Burniaux et al (2003) used as maximum value forparticipation rate (PRmax) 0.99 for male and 0.95 for female.
where OP are the number of individual expectedto become inactive between age x and x+1, andLF is the number of active persons (in labourforce) aged x in year t and aged x+1 in yeart+1.
By multiplying and dividing for the populationaged x at time t, which is supposed to remain thesame as the population aged x+1 at time t+1, weget:
OPxt+1 = ( PRx
t − PRx+1t+1 )* Popx
t
where PR are the participation rates.
Thus, we can calculate the (conditional) rate ofexit, Rex by dividing the number of people thatbecome inactive at time t+1 by the number ofpeople active at time t, that is,
Rex= OPxt+1
LFxt = ( PRx
t − PRx+1t+1 )* Popx
t
LFxt , which can
also be re-arranged as:
Rex=OPx
t+1
LFxt =1− PRx+1
t+1
PRxt
Thus, we can use this Rex to project participationrates of older workers as:
PRx+1t+1 = (1−Re xx+1) * PRx
t and
PRx+nt+n = (1−Re xx+1)(1−Re xx+2)(1−Re xx+3) * ....* (1−Re xx+n−1) * PRx
t

98
European Economy 7/2008the 2009 Ageing Report: Underlying assumptions and projection methodologies for the EU-27 Member states
Annex 2.2:estimation of the average exit age from thelabour market
Average exit age from the labour force39
In order to estimate the “average exit age” (oreffective retirement age) from the labour forcethe methodology employed by the EuropeanCommission was used, which is a probabilitymodel using the single-year cohort participationrates. The “average exit age” is included in thelist of the structural indicators to monitorprogress towards Lisbon and Barcelona targets(in particular: “the progressive increase of aboutfive years in the effective average age at whichpeople stop working in the European Union by2010”) and originally applied to five-year agecohort. The methodology is based on thecomparison of labour force participation ratesover time.
The conditional probability for each person tostay in the labour force at age a in the year t,(conditional upon stay in labour force in yeart-1), can be calculated using the observed activityrates (Pr) as follows:
Probability to stay = cProba,tstay =
Prat
Pra−1t−1 where
0 ≤ c Proba,tstay ≤1
Thus, at time t, the conditional probability foreach person to exit at age a (cProbex
a, t) is simplyequal to:
Probability of exit= cProba,tex =1− Pra
t
Pra−1t−1 =1− cProba,t
stay
where 0 ≤ cProba,tex ≤1
If we assume that nobody will retire before aminimum age m (e.g. before m=60), the(unconditional) probability that any person willstill be in the labour force (that is the probabilityof not retiring before a given age a can becalculated as the product of all the conditionalprobability to stay from age m to age a-1:
Probability of not retiring before =Proba,t
notret =∏ i=ma−1 cProbi
stay
Thus, the probability of retiring at age a can becalculated as the product of the unconditional
39 See Carone (2005).
probability of not retiring from age m to a andthe (conditional) probability of exit, that is:
Probability of retiring =Proba,t
ret = Proba,tnotretcProba,t
ex
By assuming that everybody will be retired by agiven age M (e.g. M= 71), the sum of theprobability of retiring between the minimum agem and the maximum ageM is equal to 1:
a=m
M∑ Proba
ret =1 The “average exit age” oreffective age of retirement from the labourmarket is then calculated as the weighted sum ofthe retirement ages (between the minimum andthe maximum age of retirement , say 60-71),where the weights are the probability of retiringat each age a, as follows:
Average exit age = Aea =∑ a=m
M Probaret * a

99
PARt I — Underlying assumptions and projection methodologies
3.1. bAckground And generAlApproAch
the approach used in the 2006 projectionexercise
A general consensus was reached on the meritsof using a production function framework, ratherthan a purely mechanical approach as it allowsone to shed light on the main components oflabour productivity growth (namely total factorproductivity and the capital stock per worker)while being fully consistent with the methodologydeveloped by the EPCs Output Gap WorkingGroup (OGWG), and used in the work by otherCouncil committees, notably to assess structuralbudgetary developments within the framework ofthe Stability and Growth Pact (SGP).40 This“production function” approach also aims atobtaining richer medium term dynamics, takingdue account of the effect of population growth onlabour productivity in the medium run, throughthe change in capital intensity. The approachbased on a production function is also fairlystandard in mainstream macro-models and isoften used to make short-term (2-3 years) forecastof productivity by international institutions.41 Theproduction function framework requires makingsome specific statistical assumptions regardinglong-run developments in each of its component.A key assumption for the long-term projection isthat of the productivity growth rate; the EPCagreed that all countries should converge to thesame productivity growth rate (1.7%) at the endof the projection period (in 2050).
40 See European Commission (2008) for a discussion onthe Stability and Growth Pact.41 International institutions and bodies such as the OECD,the ECB and the IMF use such a framework in their model.Moreover, medium-term projections of productivity(say with a horizon of 5 or 10 years) are based on the ideathat, after some time, actual labour productivity growthequals the potential labour productivity, which is the ratioof potential output to potential employment (or hoursworked). For instance, Downes et al. (2003) develop amedium-term reference scenario on the basis of theproduction function used to build the long-run supply-sideconditions of the OECD’s INTERLINK models.
the approach agreed in the 2009projection exercise
The production function approach has been usedfor projecting output growth also in the 2009projection exercise. It was also agreed to adopttotal hours worked as labour input (as opposedto the number of persons employed used in the2006 Ageing Report), in line with theincorporation of this concept of labour input inthe production function used by the EPCs OutputGap Working Group (OGWG). In this way, theapproaches by the EPCs working groups, theOGWG and the AWG, are fully aligned.Graph 3.1 illustrates the building blocks of theproduction function used in the projection. Themethodology is described below.
3.2. Methodology used to projectpotentiAl output
3.2.1. short description of the productionfunction framework
By using a standard specification of the Cobb-Douglas production with constant returns toscale, potential GDP can be expressed formallyas total output represented by a combination offactor inputs multiplied with total factorproductivity (TFP), which embeds thetechnological level.
Y = TFP.Lβ .K1−β = TFP1β .L
⎛
⎝⎜⎜
⎞
⎠⎟⎟
β
.K1−β = E .L( )β .K1−β
where:
Y is total output (GDP);L is the supply of labour, i.e. total hours worked;K is the stock of capital;E is the labour-augmenting technical progress(i.e. Harrod-neutral technical progress).
E.L is then interpretable as total labour inefficiency units. TFP and the labour-augmentingtechnical progress are linked with a simplerelationship: TFP = (E)β
3. lABOUR PRODUCtIVItY AND GDP
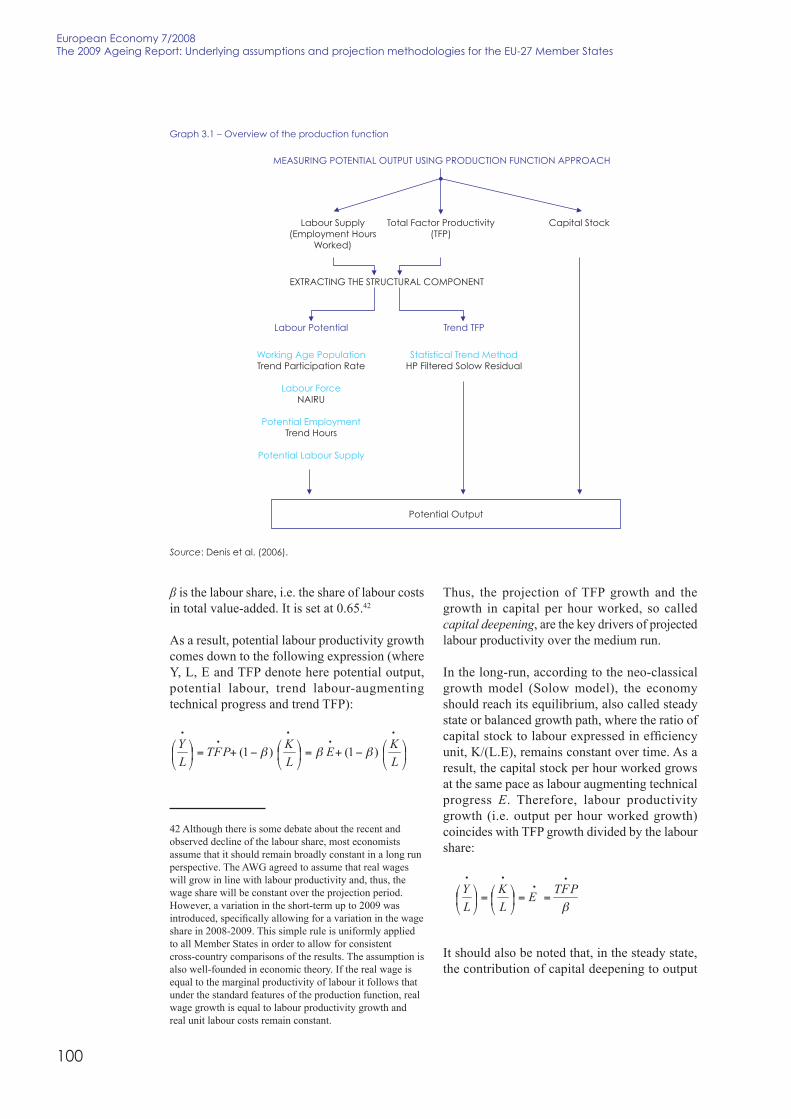
100
European Economy 7/2008the 2009 Ageing Report: Underlying assumptions and projection methodologies for the EU-27 Member states
β is the labour share, i.e. the share of labour costsin total value-added. It is set at 0.65.42
As a result, potential labour productivity growthcomes down to the following expression (whereY, L, E and TFP denote here potential output,potential labour, trend labour-augmentingtechnical progress and trend TFP):
42 Although there is some debate about the recent andobserved decline of the labour share, most economistsassume that it should remain broadly constant in a long runperspective. The AWG agreed to assume that real wageswill grow in line with labour productivity and, thus, thewage share will be constant over the projection period.However, a variation in the short-term up to 2009 wasintroduced, specifically allowing for a variation in the wageshare in 2008-2009. This simple rule is uniformly appliedto all Member States in order to allow for consistentcross-country comparisons of the results. The assumption isalso well-founded in economic theory. If the real wage isequal to the marginal productivity of labour it follows thatunder the standard features of the production function, realwage growth is equal to labour productivity growth andreal unit labour costs remain constant.
Thus, the projection of TFP growth and thegrowth in capital per hour worked, so calledcapital deepening, are the key drivers of projectedlabour productivity over the medium run.
In the long-run, according to the neo-classicalgrowth model (Solow model), the economyshould reach its equilibrium, also called steadystate or balanced growth path, where the ratio ofcapital stock to labour expressed in efficiencyunit, K/(L.E), remains constant over time. As aresult, the capital stock per hour worked growsat the same pace as labour augmenting technicalprogress E. Therefore, labour productivitygrowth (i.e. output per hour worked growth)coincides with TFP growth divided by the labourshare:
It should also be noted that, in the steady state,the contribution of capital deepening to output
Graph 3.1 – Overview of the production function
Source: Denis et al. (2006).
MEAsURING POtENtIAl OUtPUt UsING PRODUCtION FUNCtION APPROACH
EXtRACtING tHE stRUCtURAl COMPONENt
Potential Output
labour Potential
working Age Populationtrend Participation Rate
labour ForceNAIRU
Potential Employmenttrend Hours
Potential labour supply
trend tFP
statistical trend MethodHP Filtered solow Residual
labour supply(Employment Hours
worked)
total Factor Productivity(tFP)
Capital stock

101
PARt I — Underlying assumptions and projection methodologies
growth is a simple function of TFP43, whichbecomes the single driver of labourproductivity.44
As all these variables can be influenced by thebusiness cycle in the short term, it is safer toproject the potential output, i.e. the outputadjusted for cyclical movements in the economy.This requires estimating the trend componentsfor the individual production factors, except forthe capital stock, which can only adjust in thelong run.
Estimating potential output therefore amounts toremoving the cyclical component from both TFPand labour. Trend TFP is obtained using adetrending technique. Potential labour input isthe total labour obtained when the unemploymentrate equals the structural unemployment rate(NAIRU). It equals LF*(1-NAIRU)*Hours,where LF stands for total labour force and Hoursfor average hours worked per worker. Thepotential output denoted Yp can be expressed inlogarithm as the sum (in logarithm) of trendTFP45, potential labour input weighted by thelabour share in total value-added and the totalcapital stock multiplied by one minus the labourshare. More formally, we get:
Log(Yp)=Log(trendTFP)+βLog(LF*(1-Nairu)*Hours)+(1-β)logK)
43 As the labour share β is set equal to 0.65, the long-runcontribution of capital deepening to labour productivitygrowth is 0.538 times TFP growth rate. With theassumption of a long-run TFP growth rate equivalent to1.1% per annum (see section 3.2.3), this implies a long-runcontribution of capital deepening to labour productivitygrowth equal to 0.6% and hence a labour productivitygrowth rate of 1.7%.44 This in turn implies that in the long run the growth rateof the capital stock is set equal to the sum of the growthrate of labour and labour-augmenting technologicalprogress, the so-called “capital rule”.45 It is expressed in terms of labour-augmenting efficiencyfor the OECD and the IMF. In the IMF’s model,MULTIMOD, the production function for each country isspecified as a Cobb-Douglas relationship between outputand two factor input –the labour force and the real netcapital stock – with a constant and exogenous growth rateof total factor productivity.
3.2.2. Specific assumptions on thecomponents of the production function inthe short term (2008-2009)
The PF approach is applied to historical (startingin the mid-1960s) and forecast data. The serieshave been taken from ECFIN’s AMECOdatabank, and for the years 2008-2009 theCommission services spring 2008 forecasts wasused.
3.2.3. Specific assumptions onthe components of the production functionin the longer run (2010-2060)
Three principles were adhered to when carryingout the long term projections:
• First, the need to ensure consistency betweenthe medium term projection based oncountry-specific trends and the long-runprojection based on convergence rules towardthe same value of labour productivity at theend of the projection horizon. There is alsoan overriding constraint to ensurecomparability across the EU through the useof a common methodology for all MemberStates.
• Second, as the cross-country comparabilityof results entails similar assumptions ofproductivity at the end of the projection, akey issue is whether this convergence shouldbe achieved in growth rates or levels. Whileeconomic theory shows that real convergenceis conditional upon crucial parameters suchas the savings rate and demographicdevelopments, the empirical literature doesnot support the idea of absolute convergencein levels between countries. So, it wasassumed that there should be convergence ingrowth rates over the long-term projectionexercise. However, the level matters throughits influence on the convergence speed (seeTable 3.2 below).
• Third, there were large differences of opinionregarding the need for strict convergence tothe same growth rate of labour productivity inthe long-term across countries. On the onehand, it could be argued that a convergencerule is important to ensure comparability ofthe age-related pension expenditurecalculations. On the other hand, it could bereasonable to assume persistent differencesalso in the very long-term, with these
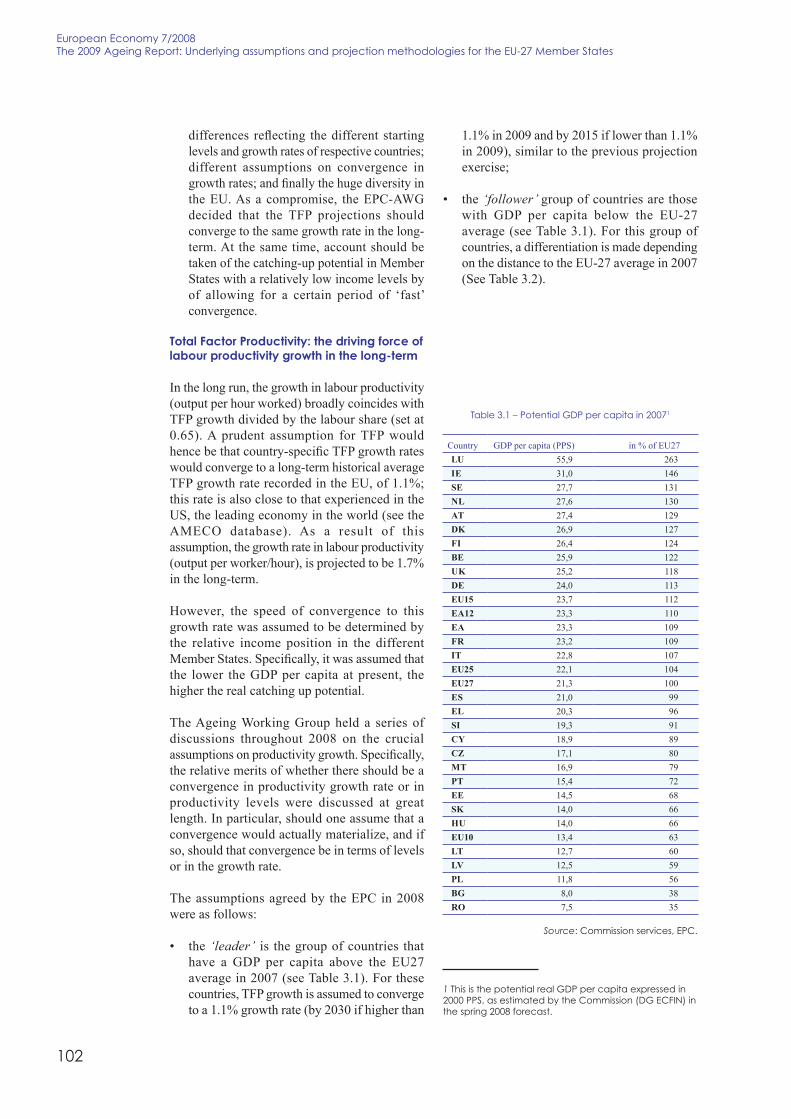
102
European Economy 7/2008the 2009 Ageing Report: Underlying assumptions and projection methodologies for the EU-27 Member states
differences reflecting the different startinglevels and growth rates of respective countries;different assumptions on convergence ingrowth rates; and finally the huge diversity inthe EU. As a compromise, the EPC-AWGdecided that the TFP projections shouldconverge to the same growth rate in the long-term. At the same time, account should betaken of the catching-up potential in MemberStates with a relatively low income levels byof allowing for a certain period of ‘fast’convergence.
total factor productivity: the driving force oflabour productivity growth in the long-term
In the long run, the growth in labour productivity(output per hour worked) broadly coincides withTFP growth divided by the labour share (set at0.65). A prudent assumption for TFP wouldhence be that country-specific TFP growth rateswould converge to a long-term historical averageTFP growth rate recorded in the EU, of 1.1%;this rate is also close to that experienced in theUS, the leading economy in the world (see theAMECO database). As a result of thisassumption, the growth rate in labour productivity(output per worker/hour), is projected to be 1.7%in the long-term.
However, the speed of convergence to thisgrowth rate was assumed to be determined bythe relative income position in the differentMember States. Specifically, it was assumed thatthe lower the GDP per capita at present, thehigher the real catching up potential.
The Ageing Working Group held a series ofdiscussions throughout 2008 on the crucialassumptions on productivity growth. Specifically,the relative merits of whether there should be aconvergence in productivity growth rate or inproductivity levels were discussed at greatlength. In particular, should one assume that aconvergence would actually materialize, and ifso, should that convergence be in terms of levelsor in the growth rate.
The assumptions agreed by the EPC in 2008were as follows:
• the ‘leader’ is the group of countries thathave a GDP per capita above the EU27average in 2007 (see Table 3.1). For thesecountries, TFP growth is assumed to convergeto a 1.1% growth rate (by 2030 if higher than
1.1% in 2009 and by 2015 if lower than 1.1%in 2009), similar to the previous projectionexercise;
• the ‘follower’ group of countries are thosewith GDP per capita below the EU-27average (see Table 3.1). For this group ofcountries, a differentiation is made dependingon the distance to the EU-27 average in 2007(See Table 3.2).
table 3.1 – Potential GDP per capita in 20071
Country GDP per capita (PPS) in % of EU27LU 55,9 263IE 31,0 146SE 27,7 131NL 27,6 130AT 27,4 129DK 26,9 127FI 26,4 124BE 25,9 122UK 25,2 118DE 24,0 113EU15 23,7 112EA12 23,3 110EA 23,3 109FR 23,2 109IT 22,8 107EU25 22,1 104EU27 21,3 100ES 21,0 99EL 20,3 96SI 19,3 91CY 18,9 89CZ 17,1 80MT 16,9 79PT 15,4 72EE 14,5 68SK 14,0 66HU 14,0 66EU10 13,4 63LT 12,7 60LV 12,5 59PL 11,8 56BG 8,0 38RO 7,5 35
Source: Commission services, EPC.
1 this is the potential real GDP per capita expressed in2000 PPs, as estimated by the Commission (DG ECFIN) inthe spring 2008 forecast.

103
PARt I — Underlying assumptions and projection methodologies
For sake of simplicity, the assumptions on TFPgrowth are not taking into account specific effectsof ageing population, as TFP is supposed to beexogenous. In particular, while rising participation,which is likely to benefit to less skilled workersor those without work experience, may depressTFP, the projected rise in educational attainmentcan be expected to enhance TFP growth. Likewise,the change in the age structure of workingpopulation may weigh down on TFP given theage profile of productivity. Nonetheless, availablestudies suggest that older workers are notsystematically less productive than younger ones,the main factor being the level of education.46
Some also argue that older workers may be lessflexible and more reluctant to innovations andtechnological changes. Given a great deal ofuncertainty attached to this, this dimension hasnot been included in productivity projections.
capital formation
Up to 2009, the “Investment Rule” is applied:capital stocks are derived from the ratio ofinvestment to GDP ratio until 2009. As the latteris extrapolated from historical values using time-series techniques, it turns out broadly constantup to 2009. This scenario may work very wellfor EU15 Member States also in the medium-and long-term, but would lead to excessivelyoptimistic investment performances in a number
46 For a survey of the literature and some estimates of theimpact of ageing on productivity, see Carone G., Denis C.,McMorrow K., Mourre G. and W. Röger (2006) andEuropean Commission (2005).
of new EU Member States, since it would implyextrapolating forward very high investment rateswhich are associated with the structural transitionprocess. Moreover, this rule is fine provided thatthe user’s cost of capital remains stable, whichshould not be the case with a declining economicgrowth rate associated with ageing.47 Lastly, thisrule may lead to fluctuating capital deepening atthe end of the projection horizon, whileneoclassical growth model predicts that thecapital stock per worker should broadly followthe labour-augmenting technical progress in thelong-run.
Therefore, it is assumed in the projections that inthe long-run, the capital stocks adjust to thesteady state path: the so-called “Capital Rule”provides that the growth rate of the capital stockis set equal to the sum of growth rate ofemployment and labour augmenting technicalprogress. As seen in section 3.2.1, this fulfils thesteady state property, as the ratio of capital stockto labour expressed in efficiency unit remainsconstant over time. Consequently, the labourproductivity growth coincides with that oflabour-augmenting technical progress.
Nonetheless, this would lead to very sharp shiftsin investment rates for a large number ofcountries in the year in which the rule isintroduced. For example, the introduction of therule in 2010 would result in pessimisticproductivity projections for a large number of
47 Indeed, movements in interest rates are supposed tobroadly follow developments in potential output in the longrun, as indicated in the ‘golden rule’ of the Solow model.
table 3.2 – Assumptions on speed of convergence and criteria for selection
"Leaders" (GDP per capita in2007 higher than EU27 average)
Countries with an estimated TFP growth rate above 1.1% in 2009are assumed to convergence to 1.1% by 2030 DK, IE, FI, SE, UK
Countries with a TFP growth rate below 1.1% in 2009 are assumedto convergence to 1.1% by 2015 BE, DE, FR, IT, LU, NL, AT, NO
"Followers" (GDP per capita in2007 lower than EU27 average)
Countries converging to a 1.75% TFP growth rate according to the distance to the EU27 average atpresent (1) by a certain year (2)
Thresholds (% ofEU-27 GDP per
capita)
Fast convergenceperiod up to: Countries
(1) (2) (3)
76-100 2020 ES, EL, SI, CY, CZ, MT
50-75 2030 EE, HU, SK, LT, LV, PL PT
0-50 2040 BG, RO
and subsequently converge to 1.1% TFP growth rate by 2050
Source: Commission services, EPC.

104
European Economy 7/2008the 2009 Ageing Report: Underlying assumptions and projection methodologies for the EU-27 Member states
the catching-up Member States whilst makinglittle difference for those countries which arealready close to their long run TFP growth rate.
Therefore, the EPC decided that a transitionbetween the investment rule and the capital ruleshould be worked out to smooth the profile ofinvestment. The following pattern for capitalformation has been used:
• the capital stock dynamics is derived from theinvestment/GDP ratio until 2009, which iskept broadly constant (“investment rule”);
• the transition to the constant capital/labour(in efficiency units) ratio assumption isintroduced gradually in the period 2010-2030in a linear manner (“transition rule”);
• the capital/labour (in efficiency units) ratio isconstant from 2030 onwards(“capital rule”).
3.3. MAin results of bAselineprojections
results for eu27 and the euro area
The outcome of the projections for potentialgrowth rates up to 2060 as well as its determinantsis given in Table 3.3 to Table 3.8.
The annual average potential GDP growth rate inthe EU is projected to decline sharply, from 2.4%in the period 2007-2020, to 1.7% in the period2021-30 and then being reduced to 1.3% in theperiod 2041-2060. Over the whole period 2007-2060, output growth rates in the euro area arevery close to those in the EU27, as the formerrepresents more than 2/3 of the EU27 total output.Notwithstanding this, the potential growth rate inthe euro area in the beginning of the projectionperiod (up to 2020s) is lower than for the EU27and the decline is therefore less sharp.
Table 3.2 and Table 3.3 show the contribution ofproductivity per hour worked and hours workedto projected potential growth rates. For theEU27, productivity growth is projected to remainfairly stable and close to 1.7% throughout theprojection period. The small increase up to the2030s is due to the assumed higher productivitygrowth in the catching up MSs up to the 2030s,which eventually is assumed to converge to the1.7% growth rate by 2050. Since the startingpoint of productivity growth in the euro area isbelow the assumed long-term EU average of
1.7% annual growth, this leads to a higherassumed increase in productivity growth up tothe 2030s.
Labour input in the EU and in the euro area isprojected to increase up to the 2020s. Thereafter,the demographic changes, with a reduction in theworking-age population, are projected to act asa drag on growth in both the EU and the euroarea.
Table 3.4 and Table 3.5 show the contribution ofthe main determinants of labour productivity(per hour worked), i.e. TFP growth and capitaldeepening. TFP growth explains most ofproductivity growth per hour worked. Thisfollows from the fact that in the long-run, thecapital deepening contribution follows TFP
table 3.3 – Projected potential growth rates (based onthe underlying assumptions used in the projection
exercise (annual average growth rates)
Country2007-2020
2021-2030
2031-2040
2041-2050
2051-2060
2007-2060
BE 2,3 1,6 1,7 1,7 1,7 1,8BG 4,4 2,0 1,5 0,7 0,6 1,9CZ 4,0 1,7 1,1 0,8 0,9 1,8DK 1,8 1,7 1,7 1,9 1,7 1,7DE 1,7 1,0 1,0 1,1 1,0 1,2EE 5,0 2,3 1,4 0,7 0,9 2,1IE 3,8 2,6 2,1 1,6 1,8 2,4EL 3,1 1,8 1,1 1,1 1,3 1,8ES 3,1 2,4 1,3 0,9 1,4 1,9FR 2,0 1,8 1,8 1,8 1,8 1,8IT 1,6 1,6 1,1 1,2 1,4 1,4CY 3,7 3,2 2,6 2,0 1,8 2,8LV 5,0 1,9 1,0 0,2 0,5 1,8LT 5,0 1,8 0,9 0,4 0,3 1,8LU 4,2 2,3 2,2 2,2 2,0 2,7HU 2,9 2,1 1,5 0,9 0,9 1,7MT 2,6 2,1 1,4 1,0 0,9 1,7NL 1,9 1,3 1,4 1,5 1,4 1,5AT 2,1 1,6 1,6 1,5 1,5 1,7PL 4,3 2,3 1,0 0,3 0,4 1,7PT 1,8 2,1 2,2 1,5 1,3 1,8RO 4,9 2,1 1,6 0,6 0,4 2,0SI 3,7 1,4 0,8 0,7 1,0 1,6SK 5,3 2,3 0,9 0,3 0,4 2,0FI 2,6 1,5 1,6 1,5 1,4 1,7SE 2,5 1,8 1,8 1,8 1,6 1,9UK 2,4 2,0 2,1 2,1 1,8 2,1NO 2,6 1,8 1,8 1,9 1,8 2,0EU27 2,4 1,7 1,4 1,3 1,3 1,7EA 2,1 1,7 1,3 1,3 1,4 1,6EA12 2,1 1,7 1,3 1,3 1,4 1,6EU15 2,2 1,7 1,5 1,5 1,5 1,7EU10 4,2 2,1 1,1 0,6 0,6 1,8EU25 2,3 1,8 1,4 1,3 1,4 1,7
Source: Commission services, EPC.
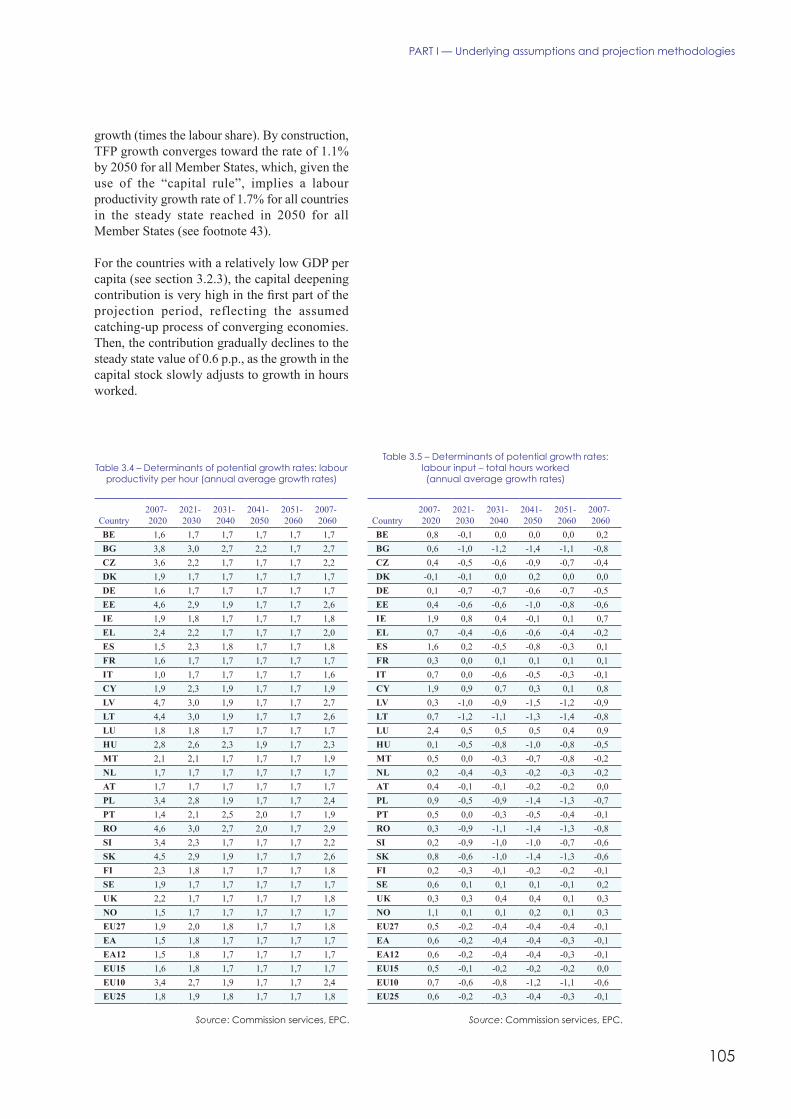
105
PARt I — Underlying assumptions and projection methodologies
growth (times the labour share). By construction,TFP growth converges toward the rate of 1.1%by 2050 for all Member States, which, given theuse of the “capital rule”, implies a labourproductivity growth rate of 1.7% for all countriesin the steady state reached in 2050 for allMember States (see footnote 43).
For the countries with a relatively low GDP percapita (see section 3.2.3), the capital deepeningcontribution is very high in the first part of theprojection period, reflecting the assumedcatching-up process of converging economies.Then, the contribution gradually declines to thesteady state value of 0.6 p.p., as the growth in thecapital stock slowly adjusts to growth in hoursworked.
table 3.4 – Determinants of potential growth rates: labourproductivity per hour (annual average growth rates)
Country2007-2020
2021-2030
2031-2040
2041-2050
2051-2060
2007-2060
BE 1,6 1,7 1,7 1,7 1,7 1,7BG 3,8 3,0 2,7 2,2 1,7 2,7CZ 3,6 2,2 1,7 1,7 1,7 2,2DK 1,9 1,7 1,7 1,7 1,7 1,7DE 1,6 1,7 1,7 1,7 1,7 1,7EE 4,6 2,9 1,9 1,7 1,7 2,6IE 1,9 1,8 1,7 1,7 1,7 1,8EL 2,4 2,2 1,7 1,7 1,7 2,0ES 1,5 2,3 1,8 1,7 1,7 1,8FR 1,6 1,7 1,7 1,7 1,7 1,7IT 1,0 1,7 1,7 1,7 1,7 1,6CY 1,9 2,3 1,9 1,7 1,7 1,9LV 4,7 3,0 1,9 1,7 1,7 2,7LT 4,4 3,0 1,9 1,7 1,7 2,6LU 1,8 1,8 1,7 1,7 1,7 1,7HU 2,8 2,6 2,3 1,9 1,7 2,3MT 2,1 2,1 1,7 1,7 1,7 1,9NL 1,7 1,7 1,7 1,7 1,7 1,7AT 1,7 1,7 1,7 1,7 1,7 1,7PL 3,4 2,8 1,9 1,7 1,7 2,4PT 1,4 2,1 2,5 2,0 1,7 1,9RO 4,6 3,0 2,7 2,0 1,7 2,9SI 3,4 2,3 1,7 1,7 1,7 2,2SK 4,5 2,9 1,9 1,7 1,7 2,6FI 2,3 1,8 1,7 1,7 1,7 1,8SE 1,9 1,7 1,7 1,7 1,7 1,7UK 2,2 1,7 1,7 1,7 1,7 1,8NO 1,5 1,7 1,7 1,7 1,7 1,7EU27 1,9 2,0 1,8 1,7 1,7 1,8EA 1,5 1,8 1,7 1,7 1,7 1,7EA12 1,5 1,8 1,7 1,7 1,7 1,7EU15 1,6 1,8 1,7 1,7 1,7 1,7EU10 3,4 2,7 1,9 1,7 1,7 2,4EU25 1,8 1,9 1,8 1,7 1,7 1,8
Source: Commission services, EPC.
table 3.5 – Determinants of potential growth rates:labour input – total hours worked(annual average growth rates)
Country2007-2020
2021-2030
2031-2040
2041-2050
2051-2060
2007-2060
BE 0,8 -0,1 0,0 0,0 0,0 0,2BG 0,6 -1,0 -1,2 -1,4 -1,1 -0,8CZ 0,4 -0,5 -0,6 -0,9 -0,7 -0,4DK -0,1 -0,1 0,0 0,2 0,0 0,0DE 0,1 -0,7 -0,7 -0,6 -0,7 -0,5EE 0,4 -0,6 -0,6 -1,0 -0,8 -0,6IE 1,9 0,8 0,4 -0,1 0,1 0,7EL 0,7 -0,4 -0,6 -0,6 -0,4 -0,2ES 1,6 0,2 -0,5 -0,8 -0,3 0,1FR 0,3 0,0 0,1 0,1 0,1 0,1IT 0,7 0,0 -0,6 -0,5 -0,3 -0,1CY 1,9 0,9 0,7 0,3 0,1 0,8LV 0,3 -1,0 -0,9 -1,5 -1,2 -0,9LT 0,7 -1,2 -1,1 -1,3 -1,4 -0,8LU 2,4 0,5 0,5 0,5 0,4 0,9HU 0,1 -0,5 -0,8 -1,0 -0,8 -0,5MT 0,5 0,0 -0,3 -0,7 -0,8 -0,2NL 0,2 -0,4 -0,3 -0,2 -0,3 -0,2AT 0,4 -0,1 -0,1 -0,2 -0,2 0,0PL 0,9 -0,5 -0,9 -1,4 -1,3 -0,7PT 0,5 0,0 -0,3 -0,5 -0,4 -0,1RO 0,3 -0,9 -1,1 -1,4 -1,3 -0,8SI 0,2 -0,9 -1,0 -1,0 -0,7 -0,6SK 0,8 -0,6 -1,0 -1,4 -1,3 -0,6FI 0,2 -0,3 -0,1 -0,2 -0,2 -0,1SE 0,6 0,1 0,1 0,1 -0,1 0,2UK 0,3 0,3 0,4 0,4 0,1 0,3NO 1,1 0,1 0,1 0,2 0,1 0,3EU27 0,5 -0,2 -0,4 -0,4 -0,4 -0,1EA 0,6 -0,2 -0,4 -0,4 -0,3 -0,1EA12 0,6 -0,2 -0,4 -0,4 -0,3 -0,1EU15 0,5 -0,1 -0,2 -0,2 -0,2 0,0EU10 0,7 -0,6 -0,8 -1,2 -1,1 -0,6EU25 0,6 -0,2 -0,3 -0,4 -0,3 -0,1
Source: Commission services, EPC.
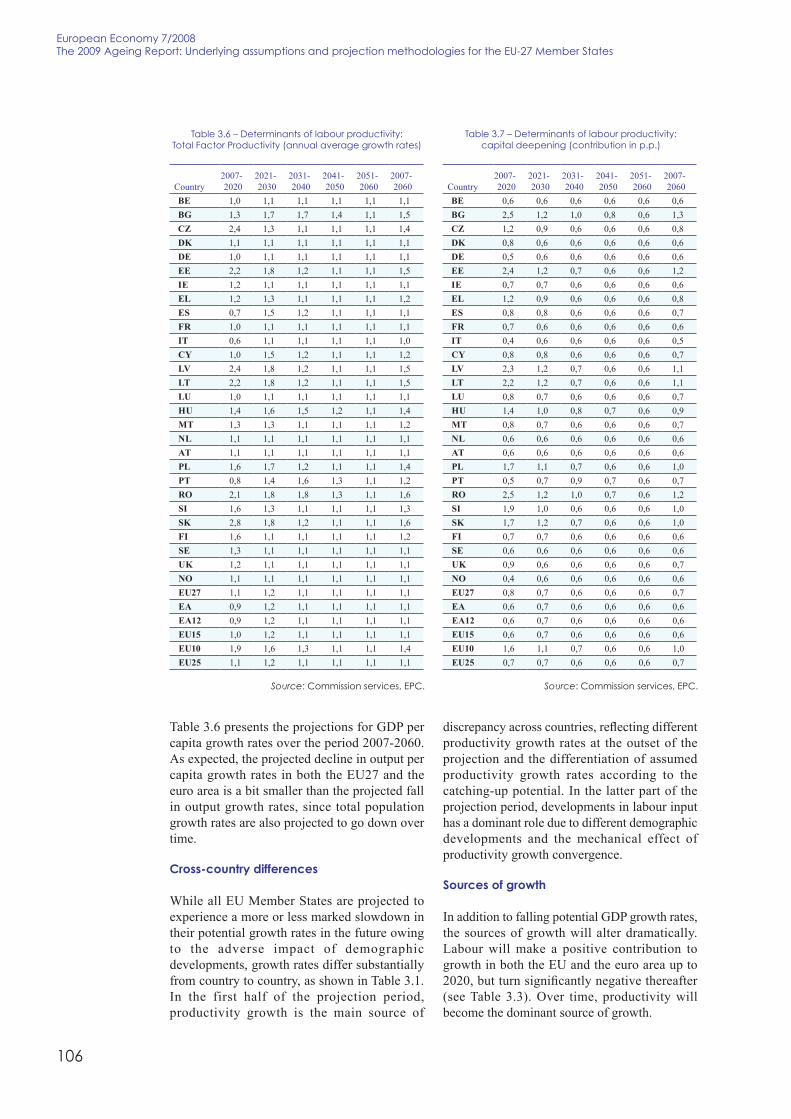
106
European Economy 7/2008the 2009 Ageing Report: Underlying assumptions and projection methodologies for the EU-27 Member states
Table 3.6 presents the projections for GDP percapita growth rates over the period 2007-2060.As expected, the projected decline in output percapita growth rates in both the EU27 and theeuro area is a bit smaller than the projected fallin output growth rates, since total populationgrowth rates are also projected to go down overtime.
cross-country differences
While all EU Member States are projected toexperience a more or less marked slowdown intheir potential growth rates in the future owingto the adverse impact of demographicdevelopments, growth rates differ substantiallyfrom country to country, as shown in Table 3.1.In the first half of the projection period,productivity growth is the main source of
discrepancy across countries, reflecting differentproductivity growth rates at the outset of theprojection and the differentiation of assumedproductivity growth rates according to thecatching-up potential. In the latter part of theprojection period, developments in labour inputhas a dominant role due to different demographicdevelopments and the mechanical effect ofproductivity growth convergence.
sources of growth
In addition to falling potential GDP growth rates,the sources of growth will alter dramatically.Labour will make a positive contribution togrowth in both the EU and the euro area up to2020, but turn significantly negative thereafter(see Table 3.3). Over time, productivity willbecome the dominant source of growth.
table 3.6 – Determinants of labour productivity:total Factor Productivity (annual average growth rates)
Country2007-2020
2021-2030
2031-2040
2041-2050
2051-2060
2007-2060
BE 1,0 1,1 1,1 1,1 1,1 1,1BG 1,3 1,7 1,7 1,4 1,1 1,5CZ 2,4 1,3 1,1 1,1 1,1 1,4DK 1,1 1,1 1,1 1,1 1,1 1,1DE 1,0 1,1 1,1 1,1 1,1 1,1EE 2,2 1,8 1,2 1,1 1,1 1,5IE 1,2 1,1 1,1 1,1 1,1 1,1EL 1,2 1,3 1,1 1,1 1,1 1,2ES 0,7 1,5 1,2 1,1 1,1 1,1FR 1,0 1,1 1,1 1,1 1,1 1,1IT 0,6 1,1 1,1 1,1 1,1 1,0CY 1,0 1,5 1,2 1,1 1,1 1,2LV 2,4 1,8 1,2 1,1 1,1 1,5LT 2,2 1,8 1,2 1,1 1,1 1,5LU 1,0 1,1 1,1 1,1 1,1 1,1HU 1,4 1,6 1,5 1,2 1,1 1,4MT 1,3 1,3 1,1 1,1 1,1 1,2NL 1,1 1,1 1,1 1,1 1,1 1,1AT 1,1 1,1 1,1 1,1 1,1 1,1PL 1,6 1,7 1,2 1,1 1,1 1,4PT 0,8 1,4 1,6 1,3 1,1 1,2RO 2,1 1,8 1,8 1,3 1,1 1,6SI 1,6 1,3 1,1 1,1 1,1 1,3SK 2,8 1,8 1,2 1,1 1,1 1,6FI 1,6 1,1 1,1 1,1 1,1 1,2SE 1,3 1,1 1,1 1,1 1,1 1,1UK 1,2 1,1 1,1 1,1 1,1 1,1NO 1,1 1,1 1,1 1,1 1,1 1,1EU27 1,1 1,2 1,1 1,1 1,1 1,1EA 0,9 1,2 1,1 1,1 1,1 1,1EA12 0,9 1,2 1,1 1,1 1,1 1,1EU15 1,0 1,2 1,1 1,1 1,1 1,1EU10 1,9 1,6 1,3 1,1 1,1 1,4EU25 1,1 1,2 1,1 1,1 1,1 1,1
Source: Commission services, EPC.
table 3.7 – Determinants of labour productivity:capital deepening (contribution in p.p.)
Country2007-2020
2021-2030
2031-2040
2041-2050
2051-2060
2007-2060
BE 0,6 0,6 0,6 0,6 0,6 0,6BG 2,5 1,2 1,0 0,8 0,6 1,3CZ 1,2 0,9 0,6 0,6 0,6 0,8DK 0,8 0,6 0,6 0,6 0,6 0,6DE 0,5 0,6 0,6 0,6 0,6 0,6EE 2,4 1,2 0,7 0,6 0,6 1,2IE 0,7 0,7 0,6 0,6 0,6 0,6EL 1,2 0,9 0,6 0,6 0,6 0,8ES 0,8 0,8 0,6 0,6 0,6 0,7FR 0,7 0,6 0,6 0,6 0,6 0,6IT 0,4 0,6 0,6 0,6 0,6 0,5CY 0,8 0,8 0,6 0,6 0,6 0,7LV 2,3 1,2 0,7 0,6 0,6 1,1LT 2,2 1,2 0,7 0,6 0,6 1,1LU 0,8 0,7 0,6 0,6 0,6 0,7HU 1,4 1,0 0,8 0,7 0,6 0,9MT 0,8 0,7 0,6 0,6 0,6 0,7NL 0,6 0,6 0,6 0,6 0,6 0,6AT 0,6 0,6 0,6 0,6 0,6 0,6PL 1,7 1,1 0,7 0,6 0,6 1,0PT 0,5 0,7 0,9 0,7 0,6 0,7RO 2,5 1,2 1,0 0,7 0,6 1,2SI 1,9 1,0 0,6 0,6 0,6 1,0SK 1,7 1,2 0,7 0,6 0,6 1,0FI 0,7 0,7 0,6 0,6 0,6 0,6SE 0,6 0,6 0,6 0,6 0,6 0,6UK 0,9 0,6 0,6 0,6 0,6 0,7NO 0,4 0,6 0,6 0,6 0,6 0,6EU27 0,8 0,7 0,6 0,6 0,6 0,7EA 0,6 0,7 0,6 0,6 0,6 0,6EA12 0,6 0,7 0,6 0,6 0,6 0,6EU15 0,6 0,7 0,6 0,6 0,6 0,6EU10 1,6 1,1 0,7 0,6 0,6 1,0EU25 0,7 0,7 0,6 0,6 0,6 0,7
Source: Commission services, EPC.

107
PARt I — Underlying assumptions and projection methodologies
In order to assess the relative contribution toGDP growth of its two main components, labourproductivity and labour utilisation, Table 3.8uses the standard growth accounting framework.For the EU and for the euro area, a slight increasein the size of the population and an increasingemployment rate (which on average contributes0.1 percentage points each to average GDPgrowth over the entire projection period) is morethan offset by a decline in the share of theworking-age population (which is a negativedrag on growth by an average of -0.3 percentagepoints). As a result, labour input contributesnegatively to output growth on average over theprojection period (by 0.1 p.p.).
summing up
Given the decline in labour supply, the annualaverage potential GDP growth rate of 2.4% forthe EU27 in the period 2007 to 2020 is projectedto decline to 1.3% in the period 2041-2060. Theprojected fall in potential growth rates is lowerin the euro area, chiefly reflecting lower growthrates in the beginning of the projection period.The new Member States are projected to exhibita larger decline in potential growth rates over theprojection period. This stems from theassumption that productivity growth rates areassumed to converge for all Member States by2050 and that the demographic projections areless favourable in the new Member Statescompared with the old Member States. It shouldbe borne in mind that these projections of GDPare based on projections of future growth inlabour productivity and employment. Inparticular, projected labour productivity growthrelies on assumptions about total factorproductivity growth and capital stockdevelopments. Although such patterns may ormay not be realised in practice, it is based on theagreed reasonable principle that cross-countrydiscrepancies in labour productivity growthshould be allowed at the start of the projectionbut should fade away towards the end of theprojection horizon.
3.4. coMpArison With the previous 2006long-terM budgetAry projectionexercise
Table 3.9 shows a comparison between thecurrent projection of output growth and itscomponents and the projection in the 2006exercise (over the period 2004-2050). Annualaverage potential GDP growth over the period2004-2050 in the EU25 and in the euro area isprojected to be 1.8%, compared with 1.7% in the2006 projection (figures for EU27 was notavailable in the 2006 exercise). The higheraverage growth rate in the EU25 can be attributedto a more favourable demographic outlook in thecurrent exercise (higher growth in the totalpopulation and a less adverse populationcomposition effect), which is partly offset by aworsened employment outlook.
table 3.8 – Projected GDP per capita growth rates(period averages)
Country2007-2020
2021-2030
2031-2040
2041-2050
2051-2060
2007-2060
BE 1,7 1,3 1,5 1,6 1,6 1,5BG 4,9 2,6 2,2 1,4 1,4 2,5CZ 3,8 1,8 1,4 1,1 1,3 1,9DK 1,5 1,4 1,5 1,9 1,7 1,6DE 1,8 1,2 1,3 1,6 1,5 1,5EE 5,2 2,7 1,7 1,1 1,3 2,4IE 1,8 1,7 1,5 1,1 1,4 1,5EL 2,8 1,8 1,1 1,2 1,6 1,8ES 1,8 2,1 1,2 0,9 1,6 1,6FR 1,4 1,4 1,5 1,6 1,7 1,5IT 1,2 1,6 1,1 1,3 1,7 1,4CY 2,1 2,0 1,7 1,3 1,2 1,7LV 5,6 2,5 1,6 0,8 1,2 2,4LT 5,5 2,3 1,5 1,1 1,0 2,3LU 2,9 1,3 1,4 1,6 1,6 1,8HU 3,0 2,3 1,8 1,3 1,3 2,0MT 2,1 2,0 1,6 1,2 1,1 1,7NL 1,6 1,1 1,4 1,7 1,6 1,5AT 1,7 1,3 1,4 1,5 1,6 1,5PL 4,4 2,6 1,5 0,9 1,0 2,1PT 1,4 1,9 2,0 1,5 1,5 1,7RO 5,3 2,5 2,1 1,1 1,2 2,5SI 3,4 1,6 1,1 1,2 1,5 1,8SK 5,2 2,5 1,3 0,8 1,0 2,3FI 2,2 1,4 1,7 1,7 1,5 1,7SE 1,9 1,4 1,6 1,6 1,4 1,6UK 1,7 1,5 1,7 1,7 1,5 1,6NO 1,8 1,2 1,3 1,6 1,5 1,5EU27 2,0 1,7 1,5 1,5 1,6 1,7EA 1,6 1,5 1,3 1,4 1,6 1,5EA12 1,6 1,5 1,3 1,4 1,6 1,5EU15 1,7 1,5 1,4 1,5 1,6 1,6EU10 4,2 2,4 1,5 1,0 1,2 2,1EU25 1,9 1,6 1,4 1,5 1,6 1,6
Source: Commission services, EPC.
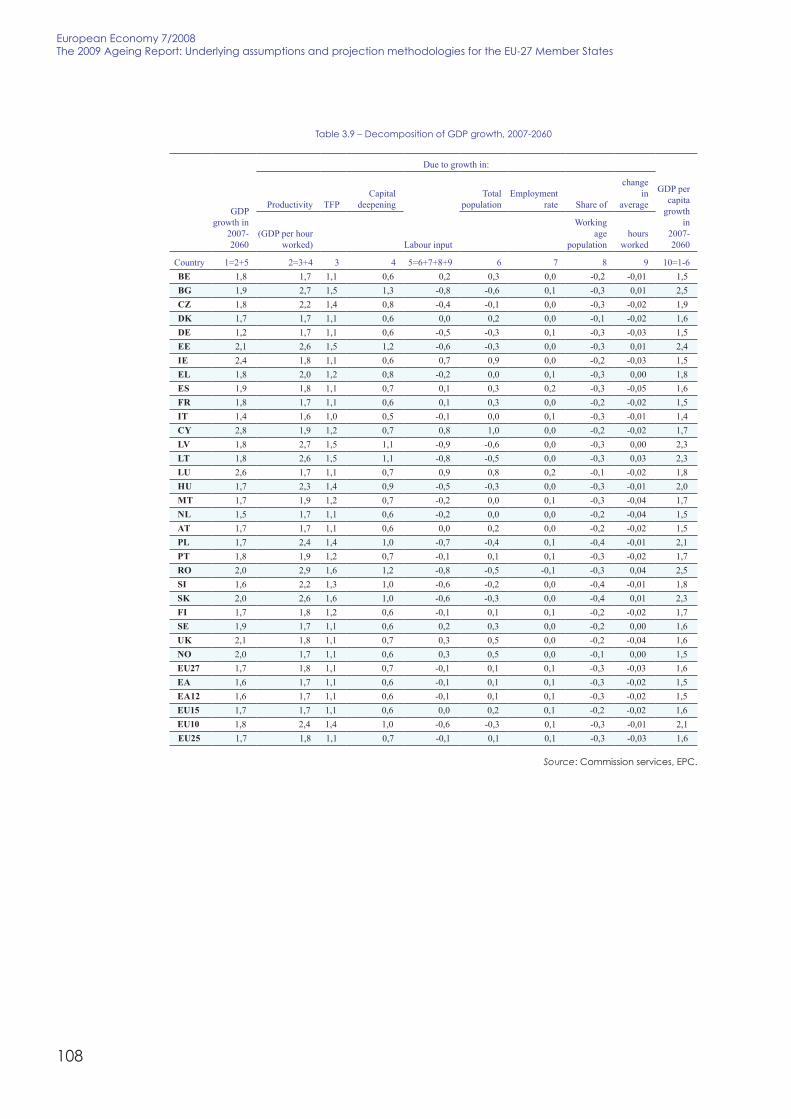
108
European Economy 7/2008the 2009 Ageing Report: Underlying assumptions and projection methodologies for the EU-27 Member states
table 3.9 – Decomposition of GDP growth, 2007-2060
GDPgrowth in
2007-2060
Due to growth in:
GDP percapita
growthin
2007-2060
Productivity TFPCapital
deepening
Labour input
Totalpopulation
Employmentrate Share of
changein
average
(GDP per hourworked)
Workingage
populationhours
worked
Country 1=2+5 2=3+4 3 4 5=6+7+8+9 6 7 8 9 10=1-6BE 1,8 1,7 1,1 0,6 0,2 0,3 0,0 -0,2 -0,01 1,5BG 1,9 2,7 1,5 1,3 -0,8 -0,6 0,1 -0,3 0,01 2,5CZ 1,8 2,2 1,4 0,8 -0,4 -0,1 0,0 -0,3 -0,02 1,9DK 1,7 1,7 1,1 0,6 0,0 0,2 0,0 -0,1 -0,02 1,6DE 1,2 1,7 1,1 0,6 -0,5 -0,3 0,1 -0,3 -0,03 1,5EE 2,1 2,6 1,5 1,2 -0,6 -0,3 0,0 -0,3 0,01 2,4IE 2,4 1,8 1,1 0,6 0,7 0,9 0,0 -0,2 -0,03 1,5EL 1,8 2,0 1,2 0,8 -0,2 0,0 0,1 -0,3 0,00 1,8ES 1,9 1,8 1,1 0,7 0,1 0,3 0,2 -0,3 -0,05 1,6FR 1,8 1,7 1,1 0,6 0,1 0,3 0,0 -0,2 -0,02 1,5IT 1,4 1,6 1,0 0,5 -0,1 0,0 0,1 -0,3 -0,01 1,4CY 2,8 1,9 1,2 0,7 0,8 1,0 0,0 -0,2 -0,02 1,7LV 1,8 2,7 1,5 1,1 -0,9 -0,6 0,0 -0,3 0,00 2,3LT 1,8 2,6 1,5 1,1 -0,8 -0,5 0,0 -0,3 0,03 2,3LU 2,6 1,7 1,1 0,7 0,9 0,8 0,2 -0,1 -0,02 1,8HU 1,7 2,3 1,4 0,9 -0,5 -0,3 0,0 -0,3 -0,01 2,0MT 1,7 1,9 1,2 0,7 -0,2 0,0 0,1 -0,3 -0,04 1,7NL 1,5 1,7 1,1 0,6 -0,2 0,0 0,0 -0,2 -0,04 1,5AT 1,7 1,7 1,1 0,6 0,0 0,2 0,0 -0,2 -0,02 1,5PL 1,7 2,4 1,4 1,0 -0,7 -0,4 0,1 -0,4 -0,01 2,1PT 1,8 1,9 1,2 0,7 -0,1 0,1 0,1 -0,3 -0,02 1,7RO 2,0 2,9 1,6 1,2 -0,8 -0,5 -0,1 -0,3 0,04 2,5SI 1,6 2,2 1,3 1,0 -0,6 -0,2 0,0 -0,4 -0,01 1,8SK 2,0 2,6 1,6 1,0 -0,6 -0,3 0,0 -0,4 0,01 2,3FI 1,7 1,8 1,2 0,6 -0,1 0,1 0,1 -0,2 -0,02 1,7SE 1,9 1,7 1,1 0,6 0,2 0,3 0,0 -0,2 0,00 1,6UK 2,1 1,8 1,1 0,7 0,3 0,5 0,0 -0,2 -0,04 1,6NO 2,0 1,7 1,1 0,6 0,3 0,5 0,0 -0,1 0,00 1,5EU27 1,7 1,8 1,1 0,7 -0,1 0,1 0,1 -0,3 -0,03 1,6EA 1,6 1,7 1,1 0,6 -0,1 0,1 0,1 -0,3 -0,02 1,5EA12 1,6 1,7 1,1 0,6 -0,1 0,1 0,1 -0,3 -0,02 1,5EU15 1,7 1,7 1,1 0,6 0,0 0,2 0,1 -0,2 -0,02 1,6EU10 1,8 2,4 1,4 1,0 -0,6 -0,3 0,1 -0,3 -0,01 2,1EU25 1,7 1,8 1,1 0,7 -0,1 0,1 0,1 -0,3 -0,03 1,6
Source: Commission services, EPC.

109
PARt I — Underlying assumptions and projection methodologies
table 3.10 – 2009 and 2006 projections compared, 2004-2050 (2009 projection minus 2006 projection), % points
GDPgrowth in
2004-2050
Due to growth in:
GDP percapita growthin 2004-2050Productivity TFP
Capitaldeepening
Labourinput
Totalpopulation
Employmentrate
Share ofworking age
population
1=2+5 2=3+4 3 4 5=6+7+8+9 6 7 8 9=1-6BE 0,2 -0,1 -0,1 0,0 0,2 0,2 -0,1 0,1 -0,1BGCZ 0,2 -0,2 0,2 -0,3 0,4 0,2 0,0 0,2 -0,1DK 0,1 -0,1 -0,1 0,0 0,1 0,2 0,0 0,0 0,0DE 0,1 0,0 0,1 -0,2 -0,1 -0,1 0,0 0,0EE 0,0 -0,1 -0,1 0,0 0,1 0,1 -0,1 0,1 -0,1IE -0,1 -0,5 -0,4 -0,1 0,3 0,4 -0,2 0,2 -0,5EL 0,5 0,3 0,3 0,0 0,0 0,1 -0,2 0,1 0,4ES 0,6 0,0 0,1 0,0 0,4 0,5 -0,2 0,2 0,1FR 0,1 0,0 0,0 0,1 0,1 0,2 -0,1 0,1 -0,1IT 0,1 -0,1 -0,1 0,0 0,2 0,3 -0,1 0,1 -0,2CY 0,1 -0,5 -0,2 -0,2 0,4 0,5 -0,2 0,2 -0,4LV -0,6 -0,4 -0,2 -0,2 -0,2 -0,1 -0,2 0,1 -0,5LT -0,4 -0,3 -0,1 -0,1 -0,2 -0,1 -0,3 0,1 -0,3LU -0,2 -0,1 0,0 -0,1 -0,1 0,2 -0,3 0,0 -0,4HU -0,1 0,0 0,1 -0,1 -0,1 0,0 -0,2 0,1 -0,1MT -0,5 0,0 0,1 -0,1 -0,6 -0,4 -0,2 0,1 -0,1NL -0,1 0,1 0,0 0,0 -0,1 -0,1 0,0 0,0 0,0AT 0,2 0,0 0,0 0,0 0,2 0,2 -0,2 0,1 0,0PL -0,2 -0,2 -0,2 0,1 -0,2 0,0 -0,4 0,2 -0,2PT 0,4 -0,1 0,0 0,0 0,5 0,3 0,1 0,2 0,1ROSI -0,2 -0,1 -0,1 -0,1 -0,1 0,0 -0,2 0,1 -0,2SK 0,2 0,1 0,1 0,0 0,0 0,1 -0,3 0,2 0,1FI 0,1 0,0 -0,1 0,1 0,1 0,1 0,0 0,1 0,0SE -0,1 -0,2 -0,2 0,0 0,1 0,1 -0,1 0,0 -0,2UK 0,3 -0,1 -0,1 0,0 0,4 0,3 0,0 0,1 -0,1NOEU27EAEA12 0,2 0,0 0,0 0,0 0,1 0,2 -0,1 0,1 0,0EU15 0,2 0,0 0,0 0,0 0,2 0,2 -0,1 0,1 0,0EU10 -0,1 -0,1 -0,1 0,0 -0,1 0,0 -0,3 0,2 -0,2EU25 0,1 0,0 0,0 0,0 0,1 0,2 -0,1 0,1 0,0
Source: Commission services, EPC.

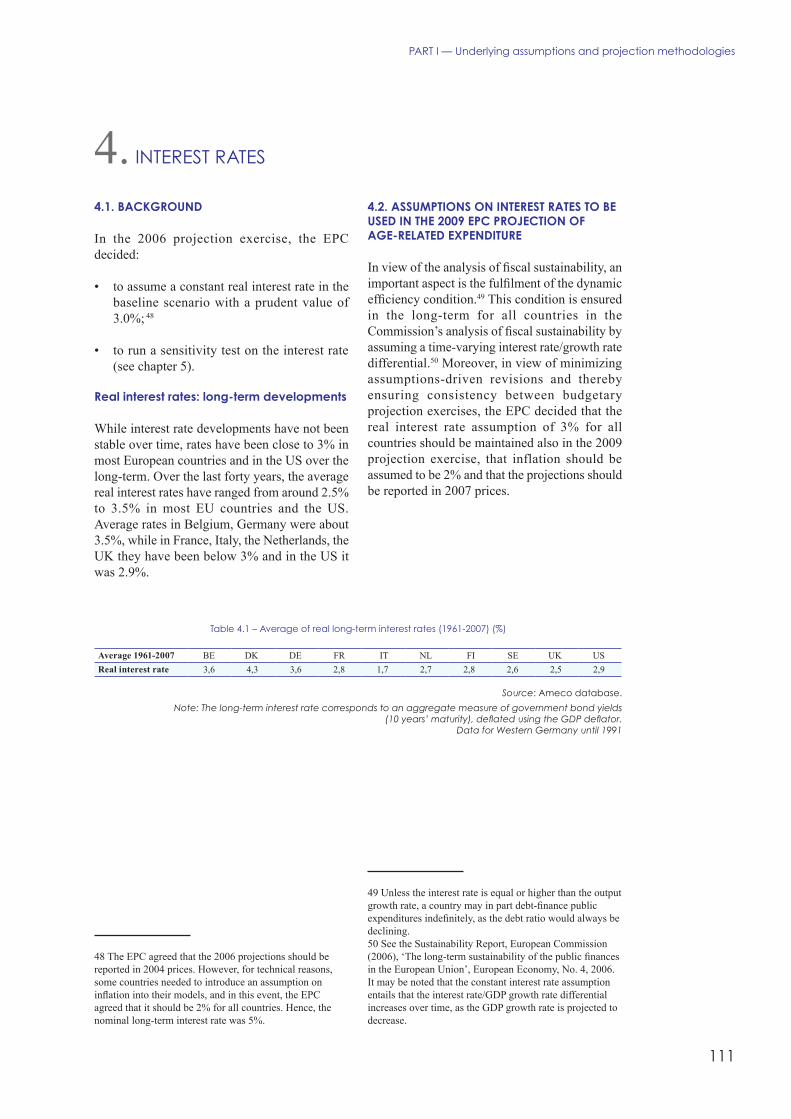
111
PARt I — Underlying assumptions and projection methodologies
4.1. bAckground
In the 2006 projection exercise, the EPCdecided:
• to assume a constant real interest rate in thebaseline scenario with a prudent value of3.0%; 48
• to run a sensitivity test on the interest rate(see chapter 5).
real interest rates: long-term developments
While interest rate developments have not beenstable over time, rates have been close to 3% inmost European countries and in the US over thelong-term. Over the last forty years, the averagereal interest rates have ranged from around 2.5%to 3.5% in most EU countries and the US.Average rates in Belgium, Germany were about3.5%, while in France, Italy, the Netherlands, theUK they have been below 3% and in the US itwas 2.9%.
48 The EPC agreed that the 2006 projections should bereported in 2004 prices. However, for technical reasons,some countries needed to introduce an assumption oninflation into their models, and in this event, the EPCagreed that it should be 2% for all countries. Hence, thenominal long-term interest rate was 5%.
4.2. AssuMptions on interest rAtes to beused in the 2009 epc projection ofAge-relAted expenditure
In view of the analysis of fiscal sustainability, animportant aspect is the fulfilment of the dynamicefficiency condition.49 This condition is ensuredin the long-term for all countries in theCommission’s analysis of fiscal sustainability byassuming a time-varying interest rate/growth ratedifferential.50 Moreover, in view of minimizingassumptions-driven revisions and therebyensuring consistency between budgetaryprojection exercises, the EPC decided that thereal interest rate assumption of 3% for allcountries should be maintained also in the 2009projection exercise, that inflation should beassumed to be 2% and that the projections shouldbe reported in 2007 prices.
49 Unless the interest rate is equal or higher than the outputgrowth rate, a country may in part debt-finance publicexpenditures indefinitely, as the debt ratio would always bedeclining.50 See the Sustainability Report, European Commission(2006), ‘The long-term sustainability of the public financesin the European Union’, European Economy, No. 4, 2006.It may be noted that the constant interest rate assumptionentails that the interest rate/GDP growth rate differentialincreases over time, as the GDP growth rate is projected todecrease.
table 4.1 – Average of real long-term interest rates (1961-2007) (%)
Average 1961-2007 BE DK DE FR IT NL FI SE UK USReal interest rate 3,6 4,3 3,6 2,8 1,7 2,7 2,8 2,6 2,5 2,9
Source: Ameco database.
Note: The long-term interest rate corresponds to an aggregate measure of government bond yields(10 years’ maturity), deflated using the GDP deflator.
Data for Western Germany until 1991
4. INtEREst RAtEs


113
PARt I — Underlying assumptions and projection methodologies
5.1. bAckground
The baseline projections cannot capture all thedirect and indirect channels through which ageingcan influence economic growth as the projectionexercise is carried out on the basis of commonlyagreed and relatively simple assumptions in orderto ensure comparability and clarity. However,given the uncertainty surrounding the assumptionsunderpinning long-run projections, it is necessaryto carry out a number of sensitivity tests so as toquantify the responsiveness of projection resultsto changes in key underlying assumptions. Inpresenting the results of the projection of age-related expenditure, and when using theprojections to assess the sustainability of publicfinances, it is important to avoid giving theimpression that the baseline scenario representsthe “best guess” as regards likely futuredevelopments in coming years. Instead, thebaseline scenario should be presented as a prudent“no policy change” scenario which is a startingpoint for making projections. Moreover, whenanalyzing the economic and budgetary impact ofageing populations, a wide range of scenarios(baseline and sensitivity tests) are useful inproviding information on the key factors drivingthe projection results and the potential sources ofrisk to future expenditure developments.
This is why in addition to running a baselineprojection based on the assumptions outlined inthe chapters 1 to 4 of this report, the EuropeanCommission and the EPC have also agreed to run
a series of sensitivity tests, an overview of whichcan be seen on Table 5.1 below. The sensitivitytests introduce a change or shock to a singleunderlying assumption/parameter in the projectionframework. For each sensitivity tests, a uniformshock is applied to all Member States.
The sensitivity tests provide useful informationon the robustness of the projections to feasiblechanges in the key underlying assumptions. Theimpact can also be read as a kind of ‘elasticity’parameter. Thus, the sensitivity tests enable anassessment of the impact of possible policychanges with an effect on key assumptionvariables.
5.2. projection results
To produce the overall set of assumptions, abottom-up approach was followed, i.e. frompopulation projections through labour input andto GDP growth projections. Therefore, eachsensitivity test may involve the recalculation ofall assumptions and to run again the labour forceand productivity function-based models, in orderto keep a consistent macroeconomic framework.The macroeconomic assumptions under thedifferent sensitivity scenarios are given inTable 5.2 through Table 5.6 below.51
51 It should be noted that the sensitivity test on a higher realinterest rate was assumed not to have an impact on the realeconomy, so it was only applied to the pension projections,where feasible and appropriate.
table 5.1 – Overview of sensitivity tests: difference in assumptions compared with the baseline scenario
Population
High life expectancy A scenario with an increase of life expectancy at birth of one year by 2060 compared with the baselineprojection.
Zero migration A scenario with zero migration compared with the baseline projection.Labour force
Higher employment rateA scenario with the employment rate being 1 p.p. higher compared with the baseline projection. The increaseis introduced linearly over the period 2010-2020 and remains 1 p.p. higher thereafter. The higheremployment rate is assumed to be achieved by lowering the rate of structural unemployment (the NAIRU).
Higher employmentrate older workers
A scenario with the employment rate of older workers (55-64) being 5 p.p. higher compared with thebaseline projection. The increase is introduced linearly over the period 2010-2020 and remains 5 p.p. higherthereafter. The higher employment rate of this group of workers is assumed to be achieved through areduction of the inactive population.
Productivity
Higher labourproductivity
A scenario with labour productivity growth being assumed to converge, to a productivity growth rate which is0.25 percentage points higher than in the baseline scenario. The increase is introduced linearly during theperiod 2010-2020, and remains 0.25 p.p. above the baseline thereafter.
Interest rateHigher interest rate A scenario with the real interest being 1 percentage point above that in the baseline scenario, i.e. 4%.
Source: Commission services, EPC.
5. sENsItIVItY tEsts

114
European Economy 7/2008the 2009 Ageing Report: Underlying assumptions and projection methodologies for the EU-27 Member states
table 5.2 – sensitivity tests: higher employment rate of older workers
GDP growthin 2007-2060
Due to growth in:
GDP percapita growthin 2007-2060
Productivity(GDP per
hour worked) Labour inputTotal
populationEmployment
rate
Share ofworking age
population
Change inaverage hours
worked
Country 1=2+3 2 3=4+5+6+7 4 5 6 7 8=1-4BE 1,9 1,7 0,2 0,3 0,1 -0,2 -0,02 1,6BG 1,9 2,7 -0,8 -0,6 0,2 -0,3 0,01 2,5CZ 1,8 2,2 -0,4 -0,1 0,1 -0,3 -0,02 1,9DK 1,8 1,7 0,0 0,2 0,0 -0,1 -0,02 1,6DE 1,2 1,7 -0,4 -0,3 0,2 -0,3 -0,03 1,5EE 2,1 2,6 -0,5 -0,3 0,1 -0,3 0,01 2,4IE 2,4 1,8 0,7 0,9 0,1 -0,2 -0,03 1,6EL 1,8 2,0 -0,2 0,0 0,1 -0,3 0,00 1,8ES 1,9 1,8 0,1 0,3 0,2 -0,3 -0,05 1,6FR 1,9 1,7 0,2 0,3 0,1 -0,2 -0,02 1,6IT 1,5 1,6 -0,1 0,0 0,2 -0,3 -0,01 1,4CY 2,8 1,9 0,9 1,0 0,1 -0,2 -0,02 1,8LV 1,8 2,7 -0,9 -0,6 0,0 -0,3 0,00 2,4LT 1,8 2,6 -0,8 -0,5 0,0 -0,3 0,03 2,3LU 2,7 1,7 0,9 0,8 0,3 -0,1 -0,02 1,9HU 1,8 2,3 -0,5 -0,3 0,1 -0,3 -0,01 2,0MT 1,7 1,9 -0,2 0,0 0,1 -0,3 -0,04 1,7NL 1,5 1,7 -0,2 0,0 0,0 -0,2 -0,04 1,5AT 1,7 1,7 0,0 0,2 0,1 -0,2 -0,02 1,5PL 1,8 2,4 -0,6 -0,4 0,1 -0,4 -0,01 2,1PT 1,8 1,9 -0,1 0,1 0,1 -0,3 -0,02 1,7RO 2,1 2,9 -0,8 -0,5 -0,1 -0,3 0,04 2,5SI 1,6 2,2 -0,6 -0,2 0,0 -0,4 -0,02 1,8SK 2,0 2,6 -0,6 -0,3 0,1 -0,4 0,01 2,3FI 1,7 1,8 -0,1 0,1 0,1 -0,2 -0,02 1,7SE 1,9 1,7 0,2 0,3 0,0 -0,2 0,00 1,6UK 2,1 1,8 0,3 0,5 0,1 -0,2 -0,04 1,7NO 2,0 1,7 0,3 0,5 0,0 -0,1 0,00 1,5EU27 1,7 1,8 -0,1 0,1 0,1 -0,3 -0,03 1,7EA 1,6 1,7 -0,1 0,1 0,1 -0,3 -0,02 1,6EA12 1,6 1,7 -0,1 0,1 0,1 -0,3 -0,02 1,6EU15 1,7 1,7 0,0 0,2 0,1 -0,2 -0,02 1,6EU10 1,8 2,4 -0,6 -0,3 0,1 -0,3 -0,01 2,1EU25 1,7 1,8 -0,1 0,1 0,1 -0,3 -0,03 1,6
Source: Commission services, EPC.

115
PARt I — Underlying assumptions and projection methodologies
table 5.3 – sensitivity tests: higher employment rate
GDP growthin 2007-2060
Due to growth in:
GDP percapita growthin 2007-2060
Productivity(GDP per
hour worked) Labour inputTotal
populationEmployment
rate
Share ofworking age
population
Change inaverage hours
worked
Country 1=2+3 2 3=4+5+6+7 4 5 6 7 8=1-4BE 1,9 1,7 0,2 0,3 0,1 -0,2 -0,01 1,6BG 1,9 2,7 -0,8 -0,6 0,2 -0,3 0,01 2,5CZ 1,8 2,2 -0,4 -0,1 0,1 -0,3 -0,02 1,9DK 1,8 1,7 0,0 0,2 0,0 -0,1 -0,02 1,6DE 1,2 1,7 -0,4 -0,3 0,2 -0,3 -0,03 1,5EE 2,1 2,6 -0,5 -0,3 0,1 -0,3 0,01 2,4IE 2,4 1,8 0,7 0,9 0,1 -0,2 -0,03 1,6EL 1,8 2,0 -0,2 0,0 0,1 -0,3 0,00 1,8ES 1,9 1,8 0,1 0,3 0,2 -0,3 -0,05 1,6FR 1,9 1,7 0,2 0,3 0,1 -0,2 -0,02 1,6IT 1,5 1,6 -0,1 0,0 0,2 -0,3 -0,01 1,4CY 2,8 1,9 0,9 1,0 0,1 -0,2 -0,02 1,8LV 1,8 2,7 -0,9 -0,6 0,0 -0,3 0,00 2,4LT 1,8 2,6 -0,8 -0,5 0,0 -0,3 0,03 2,3LU 2,7 1,7 0,9 0,8 0,3 -0,1 -0,02 1,9HU 1,8 2,3 -0,5 -0,3 0,1 -0,3 -0,01 2,0MT 1,7 1,9 -0,2 0,0 0,1 -0,3 -0,04 1,7NL 1,5 1,7 -0,2 0,0 0,0 -0,2 -0,04 1,5AT 1,7 1,7 0,0 0,2 0,1 -0,2 -0,02 1,5PL 1,8 2,4 -0,6 -0,4 0,1 -0,4 -0,01 2,1PT 1,8 1,9 -0,1 0,1 0,1 -0,3 -0,02 1,7RO 2,1 2,9 -0,8 -0,5 -0,1 -0,3 0,04 2,5SI 1,6 2,2 -0,6 -0,2 0,0 -0,4 -0,01 1,8SK 2,0 2,6 -0,6 -0,3 0,1 -0,4 0,01 2,3FI 1,7 1,8 -0,1 0,1 0,1 -0,2 -0,02 1,7SE 2,0 1,7 0,2 0,3 0,0 -0,2 0,00 1,6UK 2,1 1,8 0,3 0,5 0,1 -0,2 -0,04 1,7NO 2,0 1,7 0,3 0,5 0,0 -0,1 0,00 1,5EU27 1,7 1,8 -0,1 0,1 0,1 -0,3 -0,03 1,7EA 1,6 1,7 -0,1 0,1 0,1 -0,3 -0,02 1,6EA12 1,6 1,7 -0,1 0,1 0,1 -0,3 -0,02 1,6EU15 1,7 1,7 0,0 0,2 0,1 -0,2 -0,02 1,6EU10 1,8 2,4 -0,6 -0,3 0,1 -0,3 -0,01 2,1EU25 1,7 1,8 -0,1 0,1 0,1 -0,3 -0,03 1,6
Source: Commission services, EPC.
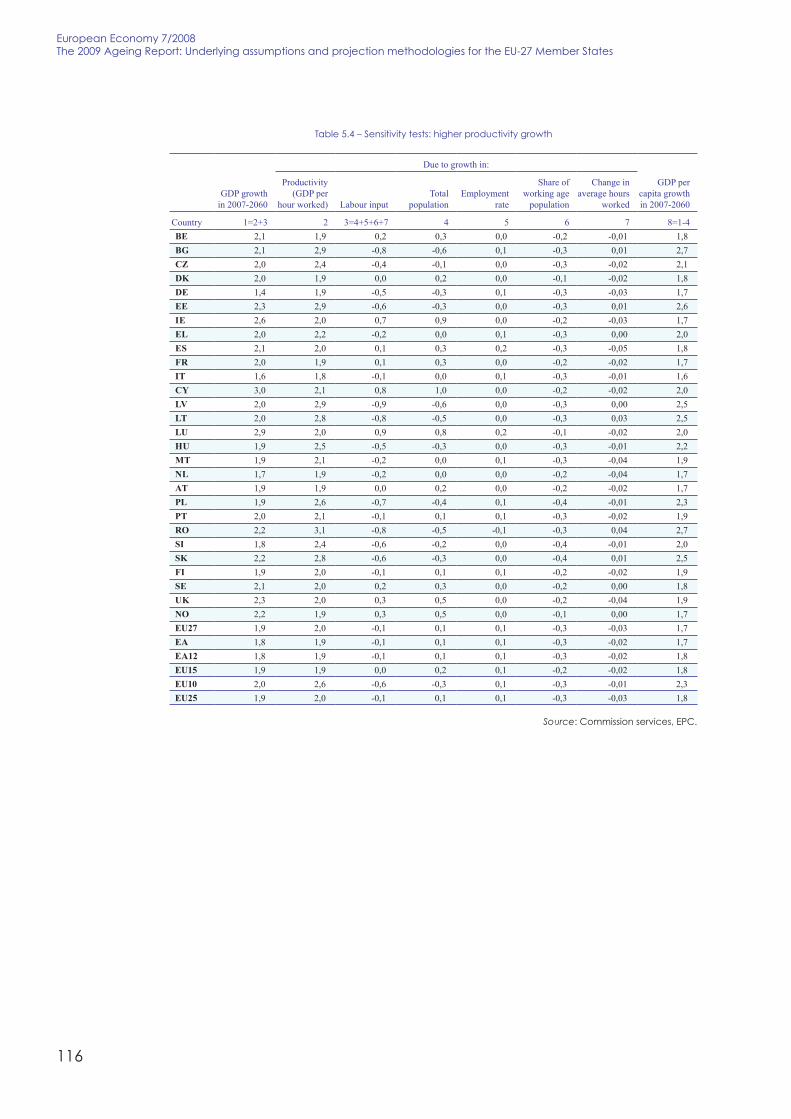
116
European Economy 7/2008the 2009 Ageing Report: Underlying assumptions and projection methodologies for the EU-27 Member states
table 5.4 – sensitivity tests: higher productivity growth
GDP growthin 2007-2060
Due to growth in:
GDP percapita growthin 2007-2060
Productivity(GDP per
hour worked) Labour inputTotal
populationEmployment
rate
Share ofworking age
population
Change inaverage hours
worked
Country 1=2+3 2 3=4+5+6+7 4 5 6 7 8=1-4BE 2,1 1,9 0,2 0,3 0,0 -0,2 -0,01 1,8BG 2,1 2,9 -0,8 -0,6 0,1 -0,3 0,01 2,7CZ 2,0 2,4 -0,4 -0,1 0,0 -0,3 -0,02 2,1DK 2,0 1,9 0,0 0,2 0,0 -0,1 -0,02 1,8DE 1,4 1,9 -0,5 -0,3 0,1 -0,3 -0,03 1,7EE 2,3 2,9 -0,6 -0,3 0,0 -0,3 0,01 2,6IE 2,6 2,0 0,7 0,9 0,0 -0,2 -0,03 1,7EL 2,0 2,2 -0,2 0,0 0,1 -0,3 0,00 2,0ES 2,1 2,0 0,1 0,3 0,2 -0,3 -0,05 1,8FR 2,0 1,9 0,1 0,3 0,0 -0,2 -0,02 1,7IT 1,6 1,8 -0,1 0,0 0,1 -0,3 -0,01 1,6CY 3,0 2,1 0,8 1,0 0,0 -0,2 -0,02 2,0LV 2,0 2,9 -0,9 -0,6 0,0 -0,3 0,00 2,5LT 2,0 2,8 -0,8 -0,5 0,0 -0,3 0,03 2,5LU 2,9 2,0 0,9 0,8 0,2 -0,1 -0,02 2,0HU 1,9 2,5 -0,5 -0,3 0,0 -0,3 -0,01 2,2MT 1,9 2,1 -0,2 0,0 0,1 -0,3 -0,04 1,9NL 1,7 1,9 -0,2 0,0 0,0 -0,2 -0,04 1,7AT 1,9 1,9 0,0 0,2 0,0 -0,2 -0,02 1,7PL 1,9 2,6 -0,7 -0,4 0,1 -0,4 -0,01 2,3PT 2,0 2,1 -0,1 0,1 0,1 -0,3 -0,02 1,9RO 2,2 3,1 -0,8 -0,5 -0,1 -0,3 0,04 2,7SI 1,8 2,4 -0,6 -0,2 0,0 -0,4 -0,01 2,0SK 2,2 2,8 -0,6 -0,3 0,0 -0,4 0,01 2,5FI 1,9 2,0 -0,1 0,1 0,1 -0,2 -0,02 1,9SE 2,1 2,0 0,2 0,3 0,0 -0,2 0,00 1,8UK 2,3 2,0 0,3 0,5 0,0 -0,2 -0,04 1,9NO 2,2 1,9 0,3 0,5 0,0 -0,1 0,00 1,7EU27 1,9 2,0 -0,1 0,1 0,1 -0,3 -0,03 1,7EA 1,8 1,9 -0,1 0,1 0,1 -0,3 -0,02 1,7EA12 1,8 1,9 -0,1 0,1 0,1 -0,3 -0,02 1,8EU15 1,9 1,9 0,0 0,2 0,1 -0,2 -0,02 1,8EU10 2,0 2,6 -0,6 -0,3 0,1 -0,3 -0,01 2,3EU25 1,9 2,0 -0,1 0,1 0,1 -0,3 -0,03 1,8
Source: Commission services, EPC.

117
PARt I — Underlying assumptions and projection methodologies
table 5.5 – sensitivity tests: Higher life expectancy
GDP growthin 2007-2060
Due to growth in:
GDP percapita growthin 2007-2060
Productivity(GDP per
hour worked) Labour inputTotal
populationEmployment
rate
Share ofworking age
population
Change inaverage hours
worked
Country 1=2+3 2 3=4+5+6+7 4 5 6 7 8=1-4BE 1,8 1,7 0,2 0,3 0,0 -0,2 -0,01 1,5BG 1,9 2,7 -0,8 -0,6 0,1 -0,4 0,01 2,5CZ 1,8 2,2 -0,4 -0,1 0,0 -0,4 -0,02 1,9DK 1,7 1,7 0,0 0,2 0,0 -0,2 -0,02 1,6DE 1,2 1,7 -0,5 -0,3 0,1 -0,3 -0,03 1,5EE 2,1 2,6 -0,6 -0,3 0,0 -0,3 0,01 2,4IE 2,4 1,8 0,7 0,9 0,0 -0,2 -0,03 1,5EL 1,8 2,0 -0,2 0,0 0,1 -0,3 0,00 1,7ES 1,9 1,8 0,1 0,3 0,2 -0,3 -0,05 1,6FR 1,8 1,7 0,1 0,3 0,0 -0,2 -0,02 1,5IT 1,4 1,6 -0,1 0,0 0,1 -0,3 -0,01 1,4CY 2,8 1,9 0,8 1,0 0,0 -0,2 -0,02 1,7LV 1,8 2,7 -0,9 -0,5 0,0 -0,3 0,00 2,3LT 1,8 2,6 -0,8 -0,5 0,0 -0,3 0,03 2,3LU 2,7 1,7 0,9 0,8 0,2 -0,2 -0,02 1,8HU 1,7 2,3 -0,5 -0,2 0,0 -0,3 -0,01 2,0MT 1,7 1,9 -0,2 0,0 0,1 -0,3 -0,04 1,7NL 1,5 1,7 -0,2 0,0 0,0 -0,2 -0,04 1,5AT 1,7 1,7 0,0 0,2 0,0 -0,2 -0,02 1,5PL 1,7 2,4 -0,7 -0,4 0,1 -0,4 -0,01 2,1PT 1,8 1,9 -0,1 0,1 0,1 -0,3 -0,02 1,7RO 2,0 2,9 -0,8 -0,4 -0,1 -0,4 0,04 2,5SI 1,6 2,2 -0,6 -0,2 0,0 -0,4 -0,01 1,8SK 2,0 2,6 -0,6 -0,3 0,0 -0,4 0,01 2,3FI 1,7 1,8 -0,1 0,1 0,1 -0,2 -0,02 1,7SE 1,9 1,7 0,2 0,4 0,0 -0,2 0,00 1,6UK 2,1 1,8 0,3 0,5 0,0 -0,2 -0,04 1,6NO 2,0 1,7 0,3 0,5 0,0 -0,2 0,00 1,5EU27 1,7 1,8 -0,1 0,1 0,1 -0,3 -0,03 1,6EA 1,6 1,7 -0,1 0,1 0,1 -0,3 -0,02 1,5EA12 1,6 1,7 -0,1 0,1 0,1 -0,3 -0,02 1,5EU15 1,7 1,7 0,0 0,2 0,1 -0,3 -0,02 1,5EU10 1,8 2,4 -0,6 -0,3 0,1 -0,4 -0,01 2,1EU25 1,7 1,8 -0,1 0,1 0,1 -0,3 -0,03 1,6
Source: Commission services, EPC.

118
European Economy 7/2008the 2009 Ageing Report: Underlying assumptions and projection methodologies for the EU-27 Member states
table 5.6 – sensitivity tests: zero migration
GDP growthin 2007-2060
Due to growth in:
GDP percapita growthin 2007-2060
Productivity(GDP per
hour worked) Labour inputTotal
populationEmployment
rate
Share ofworking age
population
Change inaverage hours
worked
Country 1=2+3 2 3=4+5+6+7 4 5 6 7 8=1-4BE 1,3 1,7 -0,3 -0,1 0,0 -0,2 -0,01 1,5BG 1,8 2,7 -0,9 -0,7 0,1 -0,4 0,01 2,5CZ 1,4 2,2 -0,9 -0,5 0,0 -0,4 -0,02 1,8DK 1,5 1,7 -0,3 -0,1 0,0 -0,2 -0,02 1,5DE 0,7 1,7 -0,9 -0,6 0,1 -0,4 -0,03 1,4EE 2,0 2,6 -0,6 -0,4 0,0 -0,3 0,01 2,4IE 1,9 1,8 0,2 0,4 0,1 -0,3 -0,03 1,5EL 1,2 2,0 -0,8 -0,5 0,1 -0,4 0,00 1,6ES 1,2 1,8 -0,6 -0,3 0,2 -0,4 -0,05 1,5FR 1,6 1,7 -0,1 0,1 0,0 -0,2 -0,02 1,5IT 0,7 1,6 -0,8 -0,5 0,1 -0,4 -0,01 1,3CY 1,6 1,9 -0,4 0,0 0,0 -0,3 -0,02 1,6LV 1,7 2,7 -0,9 -0,6 0,0 -0,3 0,00 2,3LT 1,8 2,6 -0,8 -0,5 0,0 -0,3 0,03 2,3LU 1,6 1,7 -0,2 -0,1 0,2 -0,2 -0,02 1,7HU 1,4 2,3 -0,9 -0,5 0,0 -0,3 -0,01 1,9MT 1,3 1,9 -0,7 -0,3 0,0 -0,3 -0,03 1,6NL 1,3 1,7 -0,4 -0,1 0,0 -0,2 -0,04 1,4AT 0,9 1,7 -0,8 -0,4 0,0 -0,3 -0,02 1,3PL 1,7 2,4 -0,7 -0,4 0,1 -0,4 -0,01 2,1PT 1,1 1,9 -0,8 -0,5 0,1 -0,4 -0,02 1,6RO 2,0 2,9 -0,9 -0,5 -0,1 -0,4 0,04 2,5SI 1,2 2,2 -1,0 -0,5 0,0 -0,4 -0,01 1,7SK 1,8 2,6 -0,8 -0,4 0,0 -0,4 0,01 2,3FI 1,5 1,8 -0,3 -0,1 0,1 -0,2 -0,02 1,7SE 1,5 1,7 -0,2 0,0 0,0 -0,2 0,00 1,5UK 1,6 1,8 -0,2 0,0 0,0 -0,2 -0,04 1,6NO 1,5 1,7 -0,1 0,1 -0,1 -0,2 0,00 1,4EU27 1,2 1,8 -0,6 -0,3 0,1 -0,3 -0,04 1,6EA 1,1 1,7 -0,6 -0,3 0,1 -0,3 -0,04 1,4EA12 1,1 1,7 -0,6 -0,3 0,1 -0,3 -0,04 1,4EU15 1,2 1,7 -0,5 -0,3 0,1 -0,3 -0,04 1,5EU10 1,6 2,4 -0,8 -0,5 0,0 -0,4 -0,01 2,0EU25 1,2 1,8 -0,6 -0,3 0,1 -0,3 -0,04 1,5
Source: Commission services, EPC.

PART II
Age-related expenditure items: coverage,projection methodologies and data sources


121
PARt II — Age-related expenditure items: coverage, projection methodologies and data sources
6.1 MAin feAtures of the pensionprojection
While the projections of expenditure on health-care, long-term care, education and unemploymentbenefits are carried out by common modelsdeveloped by the Commission (DG ECFIN) incooperation with the AWG (see Chapters 7through 10 for detailed descriptions), theprojection of pension expenditure are carried outby the Member States using national models onthe basis of the commonly agreed underlyingassumptions described in Part I of this report.
Using different, country-specific projectionmodels may introduce an element of non-comparability of the projection results.Nevertheless, this approach was chosen by theEPC because pension systems and arrangementsare very diverse in the EU Member States,making it extremely difficult to project pensionexpenditure on the basis of one common model,to be used for all the 27 EU Member States.
In order to ensure high quality and comparabilityof the pension projection results, a peer reviewwas carried out when preparing the projections.The projection results were discussed and revisedwhere deemed necessary by the AWG membersand the European Commission during theprojection exercise.
6.2. coverAge of the pensionprojection
The core of the projection exercise is governmentexpenditure on pensions for both the private andpublic sectors, as in the 2006 pension projectionexercise. The members of the AWG agreed toprovide pension projections for the followingitems:
• Gross pension expenditure• Number of pensions/pensioners• Number of contributors• Contributions to public pension schemes• Assets accumulated by public pension
schemes
In addition, Member States can, as in the 2006exercise, cover on a voluntary basis:
• Occupational and private (mandatory)pension expenditures
Moreover, the AWG decided that for the 2009pension projection exercise Member States canprovide projections on a voluntary basis on thefollowing items:
• Replacement rates and benefit ratios
• Taxes on pensions and net pensionexpenditures
• Pr iva te (non-mandatory) pens ionexpenditures
A complete list of the items covered by the 2009pension projection exercise is provided inAnnex 6.1.
building on and extending the 2006reporting framework
The 2006 pension projection exercise forms asolid point of departure for the current round ofprojection exercise. In order to improve furtherthe pension reporting framework, a few additionalchanges were introduced in the 2009 projectionexercise. All of the introduced amendments wereduly discussed by AWG and EPC delegates, andreflect recent developments and the expectedadvancement over the projection period asregards the features of the pension systems in theMember States. However, since many of theMember States found it difficult to providefigures concerning the recently introducedamendments, the EPC (AWG) agreed that theywould be voluntary (see Annex 6.1 for thecomplete pension questionnaire).
The amendments to the 2009 reportingframework mainly stem from the followingconsiderations:
• further information on privately managedpension schemes is necessary as the relianceon private pension provision seems to increasein the future. The reporting framework isextended to cover private pension schemes to
6. PENsIONs

122
European Economy 7/2008the 2009 Ageing Report: Underlying assumptions and projection methodologies for the EU-27 Member states
a greater degree, i.e. information on bothmandatory and non-mandatory privateschemes is proposed to be provided by MSs;
• there is a need to provide projections of taxeson both private and public pensions, since forsome countries these can become animportant source of revenue in the future;
• a large number of countries have implementedpension reforms that make the public pensionsystems less generous. In order to shed lighton potential risks to future pensiondevelopment, the evolution of pension levelsis crucial to analyse so as to better understandthe projection results. Thus, it was agreedthat Member States also, on a voluntarybasis, should calculate the evolution of thegross average replacement rate at retirement(for both public pensions and private –second and third pillars);
• when the fiscal sustainability is assessed, it isnecessary to distinguish between consolidatedand non-consolidated figures. As regardsassets in public pension schemes, a distinctionneeds to be made between nationalgovernment bonds and other assets, since theformer are netted out in the compilation ofgross debt (Maastricht debt), while the latterare not; and,
• allowing for the fact that the same person maybe a recipient of several types of pensions, thenumber of pensions and a number ofpensioners could differ in some cases. Sinceeach figure provides different type ofinformation, both the number of pensionersand the number of pensions are requested.
On this basis, the 2009 pension reportingframework was considerably expanded comparedwith the 2006 version; in particular, privatepension coverage; tax on pensions; the benefitratio; and, the gross average replacement rate.52
6.3. definitions And clArificAtions
This part aims at recalling the fundamentaldefinitions of the 2009 pension reportingframework. The definitions relate to variableslisted in the pension questionnaire. In addition,unified reporting norms are presented.
52 A full version of the questionnaire is presentedin Annex 6.1.
6.3.1. Reporting norms
Member States will run the projections for theperiod from 2007 (the base year) up to 2060.Member States should report outturn data back to2000, so that a comparison with projected figuresin the 2006 exercise can be made. The data to beprovided are annual data for each year of theprojections. Both the statistical information forthe years 2000-06 and the projections for years2007-2060 have to be presented in fixed prices of2007. The base year of the projections is 2007.
The GDP projections for each country for theperiod between 2007 and 2060 are thosegenerated by using the Commission’s productionfunction model on the basis of the agreed labourforce and productivity projections.
All countries report monetary values in millionsof Euros. For countries which are not part of theeuro, the conversion should be made on the basisof the average exchange rate for 2007, except forthe ERM II countries for which the conversionwas based on the central rates.
The level of expenditure items should beadjusted to the level of national accounts for thebase year of 2007 and the preceding years 2000-2006.
The pension projections include the impact ofthe most recent pension reforms that hadentered into legislation before September 2008(the cut-off date for the submission of the pensionprojections). That is, reforms legislated bySeptember 2008 are included in the projections.To this end, Member States provide detaileddescriptions of the projections, including recentlyintroduced reforms, their implementation andtheir impact on the projection outcome in theirupdated country fiches.53
6.3.2. Additional definitions andclarifications
Pension expenditures should cover pensionsand equivalent cash benefits granted for a long
53 The country fiches prepared by each Member Stateare envisaged to be published in a forthcomingpublication in the European Commission’s EuropeanEconomy series; see European Commission-EuropeanEconomy (2009, forthcoming), “The 2009 AgeingReport: Pension schemes and projection models inthe EU-27 Member States”.

123
PARt II — Age-related expenditure items: coverage, projection methodologies and data sources
period (over one year) for old-age, earlyretirement, disability, survivors (widows andorphans) and other specific purposes whichshould be considered as equivalents or substitutesfor above-mentioned types of pensions, i.e.pensions due to reduced capacity to work or dueto labour market reasons.
Pensions should include earnings-relatedpensions, flat-rate and means-tested pensionsthat aim at providing a social minimum pension,supplements which are a part of the pension andare granted for an indefinite period on the basisof certain criteria but which are not directlylinked to the remuneration of costs such assupplements aimed at supporting the purchase ofhome or health care services. Pensions andbenefits can be paid out from specific schemes ordirectly from government budgets. In particular,social assistance should be included if it isequivalent to minimum pension. Instead, housingsubsidies should be excluded from pensions andconsidered as other means-tested socialtransfers.
Short-term disability benefits should beconsidered as sickness benefits and prolongedunemployment benefits to older workers withinunemployment benefits.
Pensions should not include (additional) benefitsin the form of reimbursements for certain coststo beneficiaries or directly provided goods andservices for the specific needs of beneficiaries.Also, they should not include social securitycontributions paid by pension schemes on behalfof their pensioners to other social protectionschemes, notably, to health schemes.
gross pension
Pensions should be recorded as gross pensionexpenditure, i.e. without a deduction of tax andcompulsory social security contributions bybeneficiaries paid on benefits. In those countrieswhere pensions are not taxable income, the grosspensions are equal to net pensions.
net pension
Pensions should be recorded as net pensions,once deducting tax on pension and compulsorysocial security contributions paid by beneficiarieson pensions from the gross pensions. It wassuggested that it should be possible to provideconsistent and comparable projections of tax on
pension for both public and private pensions forall Member States. Especially, attention ought tobe paid to progressivity of the tax system on thissource of public revenue.
categories of pension expenditures
Social security pensions and other publicpensions are the schemes that are statutory andthat the general government sector administers.The aim is to cover those pension schemes thataffect public finances, in other words, theschemes that are considered to belong to thegeneral government sector in the nationalaccount system. Usually, there is a specific socialsecurity contribution to the scheme, which isdefined as part of total taxes in the nationalaccounting system but the scheme can also befinanced, either partially or fully, by generaltaxes and thus, ultimately, the government bearsthe financial cost and risk attached to the scheme.The pensions provided by the social securityschemes can be either earnings-related, flat-rateor means-tested. In addition, this category shouldcover pensions that are paid directly from thestate or other public sector entity budget withoutforming a specific scheme such as specialpensions to public sector and armed force’semployees. Cash benefits equivalent to pensions,notably social assistance to older persons, shouldbe included in this category.
As to the statutory funded part of the old-agepension schemes that are attached to notionaldefined contribution schemes in some countries,this should be excluded from social securityschemes and included in the private sectorschemes in accordance with the Eurostatdecision.54
Occupational pensions are pensions providedby schemes that, rather than being statutory bylaw, link the access of an individual to such ascheme to an employment relationship betweenher/him and the scheme provider and that arebased on contractual agreements betweenemployers and employees either at the companylevel or their organisations at the union level.The schemes are run by private sector pensionfunds, insurance companies or the sponsoringcompanies themselves (in balance sheets).
54 Classification of funded pension schemes in case ofgovernment responsibility and guarantee, Eurostat 30/2004,2 March 2004.

124
European Economy 7/2008the 2009 Ageing Report: Underlying assumptions and projection methodologies for the EU-27 Member states
These schemes can be quasi-mandatory in thesense that, on the basis of a nation- or industry-wide bargaining agreement, the employers areobliged to provide an occupational pensionscheme to their employees while the participationfor an individual remains voluntary. Occupationalschemes can be equivalent to statutory earnings-related pension schemes or complementary tothem. In particular, it is important to include inthe projections the schemes that play anequivalent role to social security schemes in thepension provision.
For the most part, private individual pensionschemes are non-mandatory but they can be alsomandatory.55 Consequently, the insured personshave the ownership of pension assets. This meansthat the owner enjoys the rewards and bears therisks regarding the value of the assets. Theinsurance contract specifies a schedule ofcontribution in exchange of which benefits willbe paid when the members reach a specificretirement age. The scheme provider administersthe scheme by managing the pension assetsthrough a separate account on behalf of itsmembers. The access to such a scheme does notrequire an employment relationship, even thoughin some cases the contribution may be set on thebasis of the wage.
Mandatory private pension schemes are closeto social security schemes. The transactions arebetween the individual and the insuranceprovider and they are not recorded as governmentrevenues or government expenditure and,therefore, do not have an impact on governmentsurplus or deficit. The pension expenditureprojections should cover the individual schemesthat switch a part either voluntarily or statutorily(especially to new entrants to the labour market)from the current social security scheme to privatefunds. Such schemes have an increasingrelevance in the future in a number ofcountries.
In some cases, there are government guaranteesto these pension schemes, which increase thegovernment involvement. Nevertheless, such aguarantee is a contingent liability by nature andthese liabilities are not considered as economictransactions until they materialise. Thus, theEurostat decision further specifies that a
55 See definitions of mandatory and non-mandatorypension funds below.
government guarantee is not an adequatecondition to classify such schemes as socialsecurity schemes.
Non-mandatory private pension are based onindividual insurance contracts between theindividual and the private pension schemeprovider, usually an insurance company or apension fund. The category of individual schemesincludes pension schemes for which membershipis not required by law and is independent of anyemployment link (even if members are mostlyemployed people). However, employers or thestate may in some cases contribute to the plan.Such schemes may also be adhered to throughmembership in an association.
The main difficulty in analysing individualprovision stems from the fact that it is difficult todistinguish among different types of savingsthose that are clearly for retirement purposes.Part of the savings that are not specificallylabelled as pension savings may be used forretirement purposes, whereas part of the savingscollected by retirement schemes may –dependingon national rules – in fact be used for otherpurposes than providing periodic retirementincome (one-off lump sums benefits, earlywithdrawal options). The extent to which theseschemes are used for retirement savings dependsnotably on the conditions attached to them, e.g.tax incentives linked to the condition that thebulk of such savings must be used for a regularincome (annuity) rather than for paying out alump sum or the minimum age at which a personcan access such retirement savings. In somecases pension instruments are rather used asinvestment vehicles with noticeable taxadvantages, for instance when a number of yearsare requested for the plan participation in orderto benefit from the lower tax rate.
6.3.3. Breakdown of social security pensions
Old-age and early pensions should beconsidered as a single category of pension due tothe fact that in many countries a proper distinctionbetween these two components cannot be made,either because the early retirement is built-in inthe old-age pension system, or because thestandard retirement age varies between sexes andwill increase or become more flexible with time.Early pensions should include in addition togenuine (actuarial) early retirement schemes alsoother early pensions that are granted to a specified(age) group at an age below the statutory

125
PARt II — Age-related expenditure items: coverage, projection methodologies and data sources
retirement age, primarily on the basis of reducedwork capacity or labour market reasons. Inaddition, disability and widow’s pensions paidout to persons over the standard retirement ageshall also be included in this category in order toreflect properly the expenditure related to old-age. Pensions of this category shall include bothearnings-related pensions and flat-rate or means-tested minimum pensions.
Other pensions should include disability,survivors’ and partial pensions paid to personsbelow the standard retirement age and withoutany lower age limit. These should include bothearnings-related pensions and flat-rate or means-tested minimum pensions of these types.
Within the category of old-age and early socialsecurity pensions, a separation of earnings-relatedpensions to public and private sector employeesis requested in order to follow the projectedevolution of pensions between private and publicsector employees. The flat-rate or means-testedminimum pensions that are not based onemployment, but which only guarantee a certainsocial minimum, should be excluded (while theminima of earnings-related pension schemeshould be included). If it is possible to follow thepension accrual of those persons who haveworked both in the private and public sector, thisdistinction could be made both regarding theexpenditure of pensions and the number ofpensioners. Otherwise, estimates can be made onthe basis of a full career in one of the sectors.
Earnings-related pension to public sectoremployees. As above, employees of the publicsector should include those working in thenational, regional and municipal governmentbodies as well as social security institutions. Inpractice, where there are different pensionschemes for public and private sector employees,the definitions of the schemes can be followed.
6.3.4. the level of pensions
A large number of countries have implementedpension reforms that make the public pensionsystems considerably more resilient against theimpact of ageing populations. This has generallybeen done by making the pension systems lessgenerous and sometimes by ‘privatizing’ part ofthe formerly public pension system, and at thesame time partly increasing the contributoryperiods, partly increasing the retirement age,partly reducing the uprating of pensions (rights).
In order to shed light on the future relative levelsof pensions, relevant for the policy debate on thepotential risks to the adequacy of pensions in thefuture, some extensions of the reportingframework was envisaged. The evolution of thebenefit ratio is crucial to analyse and understandthe projection results. Yet, it is sometimes quitedifficult to understand what explains itsevolution. Member States would be in the bestposition to gather additional information to thispurpose. It was agreed that, in addition to thebenefit ratio56, the evolution of the gross averagereplacement at retirement would have beencalculated as follows:
Gross Average Replacement Rate is a ratio ofthe first pension of those who retire in a givenyear over an economy-wide average wage in thesame year based on National Accounts. In caseof social security pension scheme, the GrossAverage Replacement Rate reflects only old-ageand early pensions, i.e. other types of pensionsare excluded.
The gross average replacement rates will beprovided for all type of pension schemes ifpossible.
6.3.5. Additional information on numbers ofpensioners, contributors and contributions topension schemes and assets of pension funds
The number of pensioners reflects the numberof the recipients of the specific pension. Eachtype of pension should be considered separately.The detailed lines should reflect the number ofthe recipients of the specific pension. Ideally, thenumber of all pensioners should be the numberof persons who receive pension benefits butcalculated only once in case of a receipt ofmultiple pensions. If an exact figure is notavailable, an estimate is preferred to the meresumming up.
The number of pensions reflects the number ofthe cases in which a pension was paid off to anindividual. Each type of pension should beconsidered separately.
In addition, a second break-down is suggestedfor the number of pensioners and pensions,namely, to report the number of all pensioners
56 Benefit Ratio equals the average pension divided by aneconomy-wide average wage based on National Accounts.

126
European Economy 7/2008the 2009 Ageing Report: Underlying assumptions and projection methodologies for the EU-27 Member states
and pensions by age groups. This break-down issuggested to increase transparency andconsistency between population, labour forceand pensioners’ projections.
Contributions to pension schemes paid both byemployers and employees as well as self-employed persons provide information onwhether or not there is a potential future financialgap in the pension system. If the pensioncontribution is part of a broader social securitycontribution rate, an estimate should be providedfor the share of the pension contribution, e.g. onthe basis of the most recent expenditure structure.In case that the pension is financed by general taxrevenues, no estimate should be provided here.
It would be most important to provide estimatesof pension contributions to social security andprivate mandatory schemes, notably concerningthe category of old-age and early pensions. Asregards other pensions such as disability andsurvivors’ pensions, contributions should bereported separately only if these pensions aremanaged by separate specific schemes. In thecase where they are part of the old-age pensionscheme, no separation of contributions betweendifferent types of pensions is requested but thetotal contribution should be presented in thecontext of old-age and early pensions.
As in the case of the number of pensioners, thenumber of contributors to each type of pensionsshould be considered separately, allowing for thefact that the same person may be a contributor toseveral schemes. Thus, the number ofcontributors should approach the number ofemployed persons or active-age population.
As for contributions, it would be important toprovide estimates of the numbers of contributorsto social security and private mandatory schemes,notably concerning the category of old-age andearly pensions. The number of contributors toother schemes (disability, survivors) should bepresented only in case of separate schemes forthese purposes.
The number of contributors should correspondto an estimate of the number of persons coveredby pension schemes without regard to the amountof the contribution. Thus, a contributor in a short-term contract should count as a contributor in apermanent (full-time) contract. However, inpractice, a contributor in a short-term contractmay appear as a contributor several times during
a year and it may not be possible to disentanglethe number of contributors during a year fromthe number of contribution periods. Therefore, abetter proxy for the number of persons coveredby pension schemes should be the number ofcontributors at a given point of time, e.g. at theend of the year.
The information on the total value of assets inpension schemes, including pre-financing tospecific reserves within the government sector,is requested separately for social securityschemes, occupational pension schemes andprivate pension schemes. This information is animportant complement to the contributioninformation when the financial balance of thepension schemes is assessed.
As regards the government sector, a distinctionneeds to be made between national governmentbonds and other assets, since the former arenetted out in the compilation of gross debt(Maastricht debt), while the latter are not.
It would be important for Member States toprovide information on the current situation from2000 up to the most recent year for which theinformation is available. It remains optional tomake projections of assets evolution. This shouldtake into account both the increases to thepension funds and the withdrawals for thepayment of pensions. It is important to know thefactors affecting the accumulation and thewithdrawals, in particular, if the accumulation isnot based on the surplus of pension contributionsover pension payments and if the withdrawalsare discretionary. For example, in some countries,accumulation of pension reserve funds (for socialsecurity schemes) is based on the surplus in thesocial security schemes or on deliberate decisionsto put aside a fraction of government revenues.
6.4. country-specific coverAge
Table 6.1 and Table 6.2 provide an overview ofeach Member States’ pension system, anddetailed information of their coverage in theprojection, respectively.

127
PARt II — Age-related expenditure items: coverage, projection methodologies and data sources
tab
le6.
1–
Ove
rvie
wo
fth
ep
en
sion
syst
em
sin
Me
mb
ers
tate
s
Soci
alse
curi
type
nsio
ns(p
ublic
sect
orsc
hem
es)
Occ
upat
iona
lpen
sion
sche
mes
(pri
vate
sect
orsc
hem
es)
Indi
vidu
al(p
riva
te)p
ensi
onsc
hem
es(p
riva
tese
ctor
sche
mes
)B
EMinimumguaranteepensions:
Mea
ns-te
sted
min
imum
pens
ions
thro
ugh
soci
alas
sist
ance
(GR
APA
-IG
O).
Earnings-relatedsocialsecuritypensions:
Sepa
rate
sche
mes
forp
rivat
ean
dpu
blic
sect
orem
ploy
ees,
self-
empl
oyed
;sch
emes
cove
rold
-age
and
surv
ivor
s’pe
nsio
ns,a
nddi
sabi
lity
pens
ions
inth
eca
seof
civi
lser
vant
s(w
hich
are
incl
uded
inpu
blic
(soc
ials
ecur
ity)p
ensi
onsi
nth
isre
port)
.Th
ese
sche
mes
incl
ude
min
imum
pens
ions
base
don
care
erco
nditi
ons.
The
wag
eea
rner
sche
me
incl
udes
the
min
imum
clai
mpe
rwor
king
year
.D
isab
ility
pens
ion
sche
mes
forp
rivat
ese
ctor
empl
oyee
sand
self-
empl
oyed
.Prepension(earlyretirement)throughanunemploymentbenefitandasupplementfromtheemployer.
Lega
lfra
mew
ork
hasb
een
esta
blis
hed:
the
Law
onadditionalpensionsof28April2003,centredon
sect
oral
pens
ion
sche
me,
impr
ovin
gth
eac
cess
toth
eman
dgi
ving
mor
egu
aran
tees
tow
orke
rs.
Pensions:1.1%ofGDPin2007.
Vol
unta
rypr
ivat
esc
hem
esex
isto
nly
toa
min
orex
tent
.
BG
Minimumguaranteepensions:
Soci
alpe
nsio
nfo
rold
age.
Dis
abili
type
nsio
ns.
Earnings-relatedsocialsecuritypensions:
One
DC
pens
ion
sche
me
cove
ring
alle
mpl
oyee
sand
self-
empl
oyed
.M
inim
alpe
nsio
nfo
rper
iods
ofin
sura
nce
and
old
age
(stip
ulat
edin
the
annu
alLa
won
the
PSI
Bud
get).
Soci
alin
sura
nce
cont
ribu
tions
ofci
vils
erva
nts,
mili
tary
and
polic
e–
atth
eex
pens
eof
the
stat
e.Se
lf-in
sure
dpe
rson
spay
the
who
leco
ntri
butio
nsam
ount
atth
eiro
wn
expe
nse.
Soci
alin
sura
nce
cont
ribu
tions
ofju
dges
and
mag
istr
ates–
atth
eex
pens
eof
the
Bud
geto
fthe
Judi
cial
Pow
er.
Teac
hers
Pens
ion
Fund
.Su
rviv
ors’
pens
ions
(stip
ulat
edin
the
Soci
alIn
sura
nce
Cod
e(S
IC)).
Non-contributorypensions:
Spec
ialm
erits
pens
ions
Supp
lem
enta
ryvo
lunt
ary
pens
ion
fund
sund
eroccupationalschemes(3rdpillar).Legalframework
esta
blis
hed
in20
06.F
unde
dD
Csc
hem
e.
Supp
lem
enta
rym
anda
tory
priv
ate
sche
mes–
Uni
vers
alan
dPr
ofes
sion
alPe
nsio
nFu
nds(
2nd
pilla
r).In
divi
dual
pens
ion
savi
ngsp
lans
(2.6
mill
ion
cont
ribu
tors
end
of20
07).
Stat
utor
ypr
ivat
esc
hem
estr
ansf
erre
dfr
omth
eso
cial
secu
rity
pens
ion
sche
me,
man
dato
ryfo
rper
sons
born
afte
r1.1
.196
0.Th
etransferredcontributionrateis5%.FundedDC
sche
mes
.
Supplementaryvoluntaryprivateschemes(3rdpillar).
CZ
Minimumguaranteepensions:
Nospecialscheme,itisembeddedinthepensionformula(flat-ratecomponent).
Earnings-relatedsocialsecuritypensions:
One
sche
me
cove
ring
the
who
lepo
pula
tion,
cove
ring
old-
age,
disa
bilit
yan
dsu
rviv
ors’
pens
ions
.
Do
note
xist
.
Vol
unta
rypr
ivat
epe
nsio
nsc
hem
eat
anea
rlyac
cum
ulat
ion
stag
e;lo
wre
plac
emen
trat
e(contribution2.1%ofwage;coversabouthalflabour
forc
e.
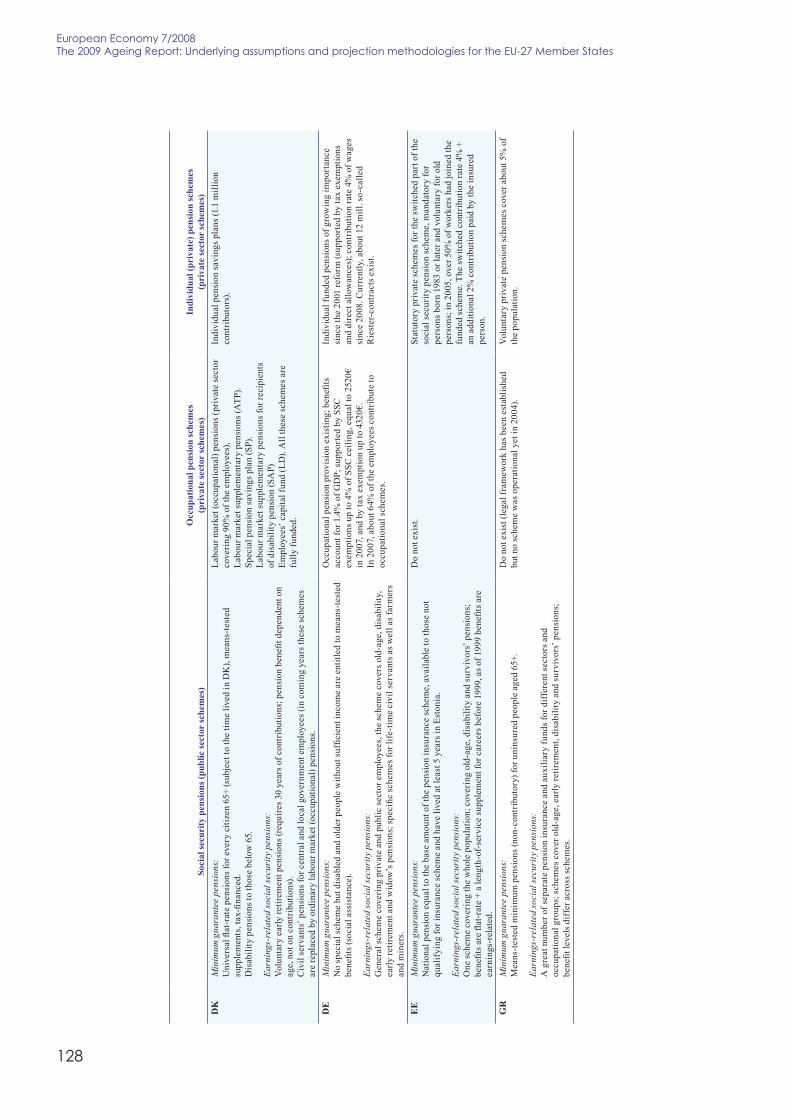
128
European Economy 7/2008the 2009 Ageing Report: Underlying assumptions and projection methodologies for the EU-27 Member states
Soci
alse
curi
type
nsio
ns(p
ublic
sect
orsc
hem
es)
Occ
upat
iona
lpen
sion
sche
mes
(pri
vate
sect
orsc
hem
es)
Indi
vidu
al(p
riva
te)p
ensi
onsc
hem
es(p
riva
tese
ctor
sche
mes
)D
KMinimumguaranteepensions:
Universalflat-ratepensionsforeverycitizen65+(subjecttothetimelivedinDK),means-tested
supplements,tax-financed.
Dis
abili
type
nsio
nsto
thos
ebe
low
65.
Earnings-relatedsocialsecuritypensions:
Voluntaryearlyretirementpensions(requires30yearsofcontributions;pensionbenefitdependenton
age,
noto
nco
ntri
butio
ns).
Civ
ilse
rvan
ts’p
ensi
onsf
orce
ntra
land
loca
lgov
ernm
ente
mpl
oyee
s(in
com
ing
year
sthe
sesc
hem
esar
ere
plac
edby
ordi
nary
labo
urm
arke
t(oc
cupa
tiona
l)pe
nsio
ns.
Labo
urm
arke
t(oc
cupa
tiona
l)pe
nsio
ns(p
rivat
ese
ctor
covering90%oftheemployees),
Labo
urm
arke
tsup
plem
enta
rype
nsio
ns(A
TP).
Spec
ialp
ensi
onsa
ving
spla
n(S
P).
Labo
urm
arke
tsup
plem
enta
rype
nsio
nsfo
rrec
ipie
nts
ofdi
sabi
lity
pens
ion
(SA
P)Em
ploy
ees’
capi
talf
und
(LD
).A
llth
ese
sche
mes
are
fully
fund
ed.
Indi
vidu
alpe
nsio
nsa
ving
spla
ns(1
.1m
illio
nco
ntri
buto
rs).
DE
Minimumguaranteepensions:
Nospecialschemebutdisabledandolderpeoplewithoutsufficientincomeareentitledtomeans-tested
benefits(socialassistance).
Earnings-relatedsocialsecuritypensions:
Gen
eral
sche
me
cove
ring
priv
ate
and
publ
icse
ctor
empl
oyee
s,th
esc
hem
eco
vers
old-
age,
disa
bilit
y,earlyretirementandwidow’spensions;specificschemesforlife-timecivilservantsaswellasfarmers
and
min
ers.
Occupationalpensionprovisionexisting;benefits
accountfor1.4%
ofGDP;supportedbySSC
exemptionsupto4%
ofSSCceiling,equalto2520€
in2007,andbytaxexemptionupto4320€.
In2007,about64%oftheemployeescontributeto
occu
patio
nals
chem
es.
Indi
vidu
alfu
nded
pens
ions
ofgr
owin
gim
port
ance
sinc
eth
e20
01re
form
(sup
port
edby
tax
exem
ptio
nsanddirectallowances);contributionrate4%
ofwages
sinc
e20
08.C
urre
ntly
,abo
ut12
mill
.so-
calle
dR
iest
er-c
ontr
acts
exis
t.
EE
Minimumguaranteepensions:
Nat
iona
lpen
sion
equa
lto
the
base
amou
ntof
the
pens
ion
insu
ranc
esc
hem
e,av
aila
ble
toth
ose
not
qual
ifyi
ngfo
rins
uran
cesc
hem
ean
dha
veliv
edat
leas
t5ye
arsi
nEs
toni
a.
Earnings-relatedsocialsecuritypensions:
One
sche
me
cove
ring
the
who
lepo
pula
tion;
cove
ring
old-
age,
disa
bilit
yan
dsu
rviv
ors’
pens
ions
;benefitsareflat-rate+alength-of-servicesupplementforcareersbefore1999,asof1999benefitsare
earn
ings
-rel
ated
.
Do
note
xist
.St
atut
ory
priv
ate
sche
mes
fort
hesw
itche
dpa
rtof
the
soci
alse
curit
ype
nsio
nsc
hem
e,m
anda
tory
for
personsborn1983orlaterandvoluntaryforold
persons;in2005,over50%
ofworkershadjoinedthe
fundedscheme.Theswitchedcontributionrate4%
+anadditional2%contributionpaidbytheinsured
pers
on.
GR
Minimumguaranteepensions:
Mea
ns-te
sted
min
imum
pens
ions
(non
-con
trib
utor
y)fo
runi
nsur
edpe
ople
aged
65+.
Earnings-relatedsocialsecuritypensions:
Agr
eatn
umbe
rofs
epar
ate
pens
ion
insu
ranc
ean
dau
xilia
ryfu
ndsf
ordi
ffer
ents
ecto
rsan
doc
cupa
tiona
lgro
ups;
sche
mes
cove
rold
-age
,ear
lyre
tirem
ent,
disa
bilit
yan
dsu
rviv
ors’
pens
ions
;benefitlevelsdifferacrossschemes.
Do
note
xist
(lega
lfra
mew
ork
hasb
een
esta
blis
hed
butn
osc
hem
ew
asop
erat
iona
lyet
in20
04).
Voluntaryprivatepensionschemescoverabout5%
ofth
epo
pula
tion.

129
PARt II — Age-related expenditure items: coverage, projection methodologies and data sources
Soci
alse
curi
type
nsio
ns(p
ublic
sect
orsc
hem
es)
Occ
upat
iona
lpen
sion
sche
mes
(pri
vate
sect
orsc
hem
es)
Indi
vidu
al(p
riva
te)p
ensi
onsc
hem
es(p
riva
tese
ctor
sche
mes
)E
SMinimumguaranteepensions:
Mea
ns-te
sted
min
imum
pens
ion
sche
me
(non
-con
trib
utor
y).1
Mea
ns-te
sted
min
imum
pens
ion
(con
trib
utor
y).
Earnings-relatedsocialsecuritypensions:
One
mai
nso
cial
insu
ranc
esc
hem
e,co
veri
ngth
epr
ivat
ese
ctor
empl
oyee
s,se
lf-em
ploy
edan
dth
ere
gion
alan
dlo
calp
ublic
adm
inis
trat
ions
,pro
vidi
ngea
rnin
gs-r
elat
edol
d-ag
e,di
sabi
lity
and
surv
ivor
s’pe
nsio
ns.
Publ
icse
ctor
empl
oyee
s’(c
ontr
ibut
ory)
pens
ion
sche
me
(CPE
)for
the
civi
lser
vant
soft
hece
ntra
lpublicadministrationandthemilitary,providingmainlyflat-rateold-age,disabilityandsurvivors’
pens
ions
,tho
ugh
5di
ffer
entl
evel
sofp
ensi
onsa
ccor
ding
toth
eca
reer
leve
l.
1 Thi
sisa
min
imum
inco
me
fort
heel
derly
and
the
disa
bled
that
have
notc
ontr
ibut
edbe
fore
.It
includesold-agepensions(65+)anddisabilitypensions(-64).Thepartofold-ageis57%oftotalnon
contributorypensions.Itamountsto0.1%ofGDPin2007.Totalnoncontributorypensionsamountto
2,119millioneuroin2007;2,137millioneuroin2008
Vol
unta
ryen
terp
rise
pens
ion
sche
mes
forp
rivat
ese
ctor
empl
oyee
s(fu
nded
DC
sche
mes
and
colle
ctiv
ein
sura
nce
DB)
.M
anda
tory
supp
lem
enta
rype
nsio
nsc
hem
efo
rpub
licse
ctor
empl
oyee
soft
hece
ntra
ladm
inis
trat
ion
(fun
ded
DC
sche
me)
.Sc
hem
esar
eof
som
eim
port
ance
.
Vol
unta
rypr
ivat
esc
hem
es(f
unde
dD
Csc
hem
es).
FRMinimumguaranteepensions:
Mea
ns-te
sted
min
imum
pens
ion
sche
me.
Earnings-relatedsocialsecuritypensions:
Agr
eatn
umbe
rofs
epar
ate
pens
ion
insu
ranc
esc
hem
esfo
rdif
fere
ntse
ctor
sand
occu
patio
nalg
roup
spr
ovid
ing
earn
ings
-rel
ated
pens
ions
,add
ition
ally
man
dato
ry‘s
econ
dtie
r’su
pple
men
tary
fund
stha
tco
mpl
emen
tthe
pens
ion
prov
isio
n;sc
hem
esco
vero
ld-a
ge,e
arly
retir
emen
tand
surv
ivor
s’pe
nsio
ns;
benefitlevelsacrossinsuranceschemeswerealignedinthe2004reform.
Disabilitypensions(benefits)coveredbythehealthinsurancescheme.
Vol
unta
ryoc
cupa
tiona
lpen
sion
sche
mes
forp
rivat
ese
ctor
empl
oyee
s(PE
RE
and
PERC
O)i
ntro
duce
dby
2003reformcovering250thousandspeopleforatotal
amountofcontributionsof769million€in2006.
Als
oan
old
occu
patio
nalp
ensi
onsc
hem
e(a
rt.8
2an
d83,andart.39ofCGI)coveringroughly2.7millionof
peop
lefo
rato
tala
mou
ntof
cont
ribu
tions
of59
billi
on€in2006.Self-employedoccupationalpension
sche
me
(Mad
elin
law
n°94
and
law
n°97
)cov
erin
g1
mill
ion
ofpe
ople
fora
tota
lam
ount
ofco
ntri
butio
nsof15billions€in2006.
Vol
unta
ryIn
divi
dual
pens
ion
sche
me
(PER
P)introducedby2003reformisnowcovering
1.8
mill
ion
ofpe
ople
fora
tota
lam
ount
ofcontributionsof2.3billion€in2006.
Vol
unta
ryin
divi
dual
pens
ion
sche
mes
forc
ivil
servants(PREFON,COREM,…)covering
816
thou
sand
sofp
eopl
efo
rato
tala
mou
ntof
contributionsof11billion€in2006.
IEMinimumguaranteepensions:
Means-testedminimum
flat-ratepensionsandage-relatedbenefits(old-age,widows,disability,carers
and
blin
dpe
rson
sand
pre-
retir
emen
tallo
wan
ces)
thro
ugh
non-
cont
ribu
tory
soci
alas
sist
ance
sche
me.
Contributorysocialinsurancepensions:
Contributorysocialinsuranceschemeprovidesflat-ratepensionsandage-relatedbenefits(old-age,
transition,andwidow(er)’spensions,carers,invalidityanddisabilitybenefits).
Publicservice(occupational)pensions:
Publ
icse
rvic
eoc
cupa
tiona
lpen
sion
sche
me.
Vol
unta
ryoc
cupa
tiona
lsch
emes
forp
rivat
ese
ctor
employees.31.6%ofcurrentpensionersreceivealso
occupationalpensions,amountingto24.2%oftotal
pens
ion
inco
me.
Pens
ion
cove
rage
forw
orke
rsag
edbe
twee
n20
and69was54%inthefirstquarterof2008.
Vol
unta
ryin
divi
dual
sche
mes
also
play
aro
lein
the
Iris
hpe
nsio
nsy
stem
.Inc
entiv
esto
enco
urag
epr
ivat
epe
nsio
npr
ovis
ion
are
inpl
ace.

130
European Economy 7/2008the 2009 Ageing Report: Underlying assumptions and projection methodologies for the EU-27 Member states
Soci
alse
curi
type
nsio
ns(p
ublic
sect
orsc
hem
es)
Occ
upat
iona
lpen
sion
sche
mes
(pri
vate
sect
orsc
hem
es)
Indi
vidu
al(p
riva
te)p
ensi
onsc
hem
es(p
riva
tese
ctor
sche
mes
)IT
Minimumguaranteeincometotheelderly:
Means-testedoldageallowance(5,143europeryear,in2008)andsocialassistanceadditionallump
sum
s:pr
ovid
edto
the
elde
rlyw
itha
pers
onal
inco
me
(incl
udin
gso
cial
secu
rity
pens
ions
)bel
owcertainlimitsanduptothem.In2008,incomelimitsare5,311europeryear,intheagebracket65-69,
and7,540intheagebracket70+.Formarriedpeople,theamountofsocialassistancebenefits,
dete
rmin
edas
abov
e,is
prov
ided
aslo
ngas
the
tota
linc
ome
ofth
eco
uple
falls
belo
w11
,071
euro
per
year,intheagebracket65-69,and12,683intheagebracket70+and,inanycase,uptotheseincome
limits
.
Socialsecuritypensionsystem:
One
mai
nso
cial
secu
rity
pens
ion
sche
me
cove
ring
the
who
lepo
pula
tion,
prov
idin
gol
d-ag
e,ea
rlyre
tirem
ent,
disa
bilit
yan
dsu
rviv
ors’
pens
ions
.Iti
scom
pose
dof
thre
esc
hem
es:D
B(e
arni
ngs-
rela
ted)
,M
ixed
and
ND
C(c
ontr
ibut
ions
-bas
ed).
DBandMixedpensionschemes
:O
ldD
Bsc
hem
efu
llyap
plie
dto
wor
kers
with
atle
ast1
8ye
arso
fcon
trib
utio
nsat
the
end
of19
95.
Tran
sitio
nsc
hem
e(m
ixed
regi
me:
part
lyD
Ban
dpa
rtly
ND
C,a
ccor
ding
toth
epr
ora
taru
le)f
orw
orke
rsw
ithle
ssth
an18
year
sofc
ontr
ibut
ion
in19
95;M
eans
-test
edto
ppin
g-up
toa
min
imum
pension(5,761europeryear,in2008)isforeseen,subjecttothefulfilmentofthegeneraleligibility
requ
irem
ents
.
NDCpensionscheme:
Fully
appl
ied
tope
rson
sent
erin
gth
ela
bour
mar
keta
sof1
996.
Mea
ns-te
sted
topp
ing-
upto
am
inim
umpe
nsio
n,fo
rese
enun
derD
Ban
dM
ixed
sche
mes
,isn
olo
nger
prov
ided
.Pen
sion
saw
arde
dto
wor
kers
with
anag
ebe
low
65m
ustb
eat
leas
t1.2
times
the
old
age
allo
wan
ce.
Occ
upat
iona
l,su
pple
men
tary
pens
ion
sche
mes
exis
t.Th
eyar
efu
nded
and
neve
rman
dato
ry.T
he20
04reform(law243/2004)andits2005-implementation
(law
decr
ee25
2/20
05)i
ncre
ased
the
prov
isio
nsfo
roc
cupa
tiona
lpen
sion
sthr
ough
the
poss
ibili
tyto
tran
sfor
mTF
R(e
nd-o
f-se
rvic
eal
low
ance
)int
oan
occu
patio
nalp
ensi
onsc
hem
e.C
ontr
ibut
orsa
ndcontributionshaveincreasedsignificantly.Current
pensionexpenditureis0.1%asashareofGDP.
Vol
unta
rypr
ivat
epe
nsio
nsc
hem
esar
eof
limite
dim
port
ance
.
CY
Minimumguaranteepensions:
Thro
ugh
Soci
al(m
eans
-test
ed)P
ensi
onsc
hem
ean
dsp
ecia
lallo
wan
cest
ope
nsio
ners
.
Earnings-relatedsocialsecuritypensions:
One
gene
rals
ocia
lins
uran
cesc
hem
eco
veri
ngal
lem
ploy
eesa
ndse
lf-em
ploy
edpe
rson
s,pr
ovid
ing
old-
age,
disa
bilit
yan
dsu
rviv
ors’
pens
ions
.G
over
nmen
tEm
ploy
eesP
ensi
onSc
hem
e(p
aid
from
the
Gov
ernm
entb
udge
t)an
dot
herp
ublic
sect
or(lo
calg
ov.)
empl
oyee
spen
sion
sche
mes
.
VoluntaryProvidentFunds(providingdefined-
contributionlump-sumbenefits),coveringabout
103.000employees.

131
PARt II — Age-related expenditure items: coverage, projection methodologies and data sources
Soci
alse
curi
type
nsio
ns(p
ublic
sect
orsc
hem
es)
Occ
upat
iona
lpen
sion
sche
mes
(pri
vate
sect
orsc
hem
es)
Indi
vidu
al(p
riva
te)p
ensi
onsc
hem
es(p
riva
tese
ctor
sche
mes
)LV
Minimumguaranteepensions:
Throughthestatesocialsecuritybenefit,iftheperson’sinsurancerecord<10years.
Earnings-relatedsocialsecuritypensions:
The
min
imum
ofth
eea
rnin
gs-r
elat
edpe
nsio
nsy
stem
ispa
idw
itha
leng
th-o
f-se
rvic
esu
pple
men
tto
theamountofthestatesocialsecuritybenefit,ifthecontributionrecordexceeds10years.
Onesocialinsuranceold-agepensionscheme,whichisadefined-benefitschemeforthose,retired
before1996andanotionaldefinedcontributionschemeforthoseretiredasof1996,providingold-age
pens
ions
.Als
osu
rviv
ors’
pens
ions
are
base
don
ND
Cco
ntri
butio
ns(e
xcep
tfor
thos
ere
tired
befo
re19
96).
Sepa
rate
prov
isio
nsfo
rdis
abili
type
nsio
ns,t
houg
hun
dert
hege
nera
lsoc
ials
ecur
itysy
stem
.Specificpublicsectorservicepensions(selectedprofessions)paidfromthestatebudget.
Do
note
xist
.St
atut
ory
priv
ate
sche
mes
fort
hesw
itche
dpa
rtof
the
soci
alse
curit
ype
nsio
nsc
hem
e(m
anda
tory
for
personsundertheageof30on1s
tJu
ly20
01,v
olun
tary
topersonsaged30-49.Thecontributionratetobe
raisedfrom2to10%ofwagesbetween2001and
2011
.V
olun
tary
priv
ate
sche
mes
.
LTMinimumguaranteepensions:
Thro
ugh
aso
cial
assi
stan
cepe
nsio
n(a
lso
toyo
ung
disa
bled
pers
onsa
ndor
phan
s).
Earnings-relatedsocialsecuritypensions:
One
soci
alin
sura
nce
pens
ion
sche
me
cove
ring
alle
mpl
oyee
sand
the
self-
empl
oyed
,pro
vidi
ngol
d-ag
e,di
sabi
lity
and
surv
ivor
s’pe
nsio
ns,a
ndea
rlyre
tirem
entp
ensi
onsa
sof2
004.
Specialstate(old-age,disabilityandsurvivors’)pensionspaidfromthestatebudgettospecific
groups:scientists,judges,officersandmilitarypersonnel.
Non-contributrypensions:
Statepensionsformeritoriouspersonsandcasualties:statepensionsofthefirstandseconddegreeof
the
Rep
ublic
ofLi
thua
nia
(Sta
tebu
dget
);st
ate
pens
ions
ofde
priv
edpe
rson
s(St
ate
budg
et).
Do
note
xist
.V
olun
tary
switc
hof
apa
rtof
the
Soci
alIn
sura
nce
pens
ion
toa
priv
ate
fund
(sta
rted
in20
04w
itha
contributionrateof2.5%
ofwages,whichwill
increaseto5.5%
by2007).
LUMinimumguaranteepensions:
Thro
ugh
mea
ns-te
sted
min
imum
inco
me
prov
isio
n(R
MG
)
Earnings-relatedsocialsecuritypensions:
Age
nera
lsoc
iali
nsur
ance
pens
ion
sche
me
forp
rivat
ese
ctor
wor
kers
,pro
vidi
ngol
d-ag
e,di
sabi
lity
and
surv
ivor
s’pe
nsio
ns.
Aspecialpensionschemeforpublicsectoremployees(10%ofpensioners).
Exis
tsfo
rsom
ese
ctor
ssuc
has
bank
ing
and
forl
arge
fore
ign
com
pani
es.
HU
Minimumguaranteepensions:
Thro
ugh
mea
ns-te
sted
soci
alas
sist
ance
.
Earnings-relatedsocialsecuritypensions:
One
soci
alse
curit
ype
nsio
nsc
hem
eco
veri
ngal
lem
ploy
eesa
ndth
ese
lf-em
ploy
ed,p
rovi
ding
old-
age,
early
retir
emen
t,di
sabi
lity
and
surv
ivor
s’pe
nsio
ns.
Do
note
xist
.St
atut
ory
priv
ate
sche
mes
fort
hesw
itche
dpa
rtof
the
soci
alse
curit
ype
nsio
nsc
hem
e(m
anda
tory
forn
ewen
tran
tsto
the
labo
urm
arke
taso
f199
8,vo
lunt
ary
tow
orke
rsal
read
yin
the
labo
urm
arke
t).Th
econtributionrateis8%
ofwages.Theschemecovers
60%ofallworkers.
Voluntaryprivatepensionschemescover30%
ofall
wor
kers
.

132
European Economy 7/2008the 2009 Ageing Report: Underlying assumptions and projection methodologies for the EU-27 Member states
Soci
alse
curi
type
nsio
ns(p
ublic
sect
orsc
hem
es)
Occ
upat
iona
lpen
sion
sche
mes
(pri
vate
sect
orsc
hem
es)
Indi
vidu
al(p
riva
te)p
ensi
onsc
hem
es(p
riva
tese
ctor
sche
mes
)M
TMinimumguaranteepensions:
Mea
ns-te
sted
min
imum
pens
ions
thro
ugh
soci
alas
sist
ance
(non
-con
trib
utor
y)sc
hem
eto
pers
onsn
otqualifiedforthecontributoryscheme.
Earnings-relatedsocialsecuritypensions:
One
soci
alse
curit
y(c
ontr
ibut
ory)
pens
ion
sche
me
cove
ring
alle
mpl
oyee
sand
the
self-
empl
oyed
,pr
ovid
ing
old-
age,
disa
bilit
yan
dsu
rviv
ors’
pens
ions
(apa
rtfr
omun
empl
oym
ent,
sick
ness
and
wor
kinjurybenefits).
Exis
tson
lyto
am
inor
exte
nt.
Exis
tson
lyto
am
inor
exte
nt.
NL
Minimumguaranteepensions:
Socialassistancetothosenotqualifying(notlivedinNLfor50years)tocontributoryflat-ratescheme.
Contributorysocialinsurancepensions:
Generalflat-rateold-agepensions(AOW)toallcitizens
Separatedisabilitybenefits(WAO)andsurvivors’pensions(ANW);flat-rateorearnings-related
benefits.
Ahi
ghnu
mbe
roff
unds
(indu
stry
-wid
e,co
mpa
ny-
specificandprofessionalgroupspecific)forthe
prov
isio
nof
occu
patio
nalo
ld-a
gepe
nsio
nsan
dea
rlyretirementschemes(VUT),coveringover90%of
empl
oyee
s.
Exis
tsto
som
ede
gree
.
AT
Minimumguaranteepensions:
Means-testedminimum
pensionsthroughsocialassistancescheme(“Ausgleichszulagen”).
Earnings-relatedsocialsecuritypensions:
Har
mon
ised
soci
alse
curit
ype
nsio
nsc
hem
esco
veri
ngal
lem
ploy
ees(
incl
.civ
ilse
rvan
ts)an
dth
ese
lf-em
ploy
ed(g
radu
ally
harm
onis
edas
of20
05),
prov
idin
gol
d-ag
e,di
sabi
lity
and
surv
ivor
s’pe
nsio
ns.
The
2002
refo
rmin
crea
sed
occu
patio
nalp
ensi
onpr
ovis
ion
thro
ugh
the
oblig
atio
nto
tran
sfor
mth
eea
rlier
seve
ranc
epa
yin
toa
supp
lem
enta
ryoc
cupa
tiona
lsch
eme
(with
aco
ntri
butio
nra
teof
1.53%ofwages).
Exis
tson
lyto
am
inor
exte
ntbu
tthe
intr
oduc
tion
ofta
x-fa
vour
edpr
ivat
esc
hem
e(Z
ukun
ftsv
orso
rge)
will
incr
ease
thei
rim
port
ance
.
PLMinimumguaranteepensions:
Means-testedminimum
pensionsfinancedfromthestatebudget,topping-upbenefitspaidoutfrom
man
dato
rype
nsio
nsc
hem
es.
Earnings-relatedsocialsecuritypensions:
One
soci
alin
sura
nce
pens
ion
sche
me
(ZU
S),c
over
ing
alle
mpl
oyee
sand
the
self-
empl
oyed
(exc
ept
farmers),whichisadefined-benefitschemetothosebornbefore1949andanotionaldefined
cont
ribu
tion
sche
me
toth
ose
born
afte
r194
8,pr
ovid
ing
old-
age
pens
ions
.Se
para
tesc
hem
esfo
rdis
abili
tyan
dsu
rviv
ors’
pens
ions
unde
rthe
soci
alse
c.sy
stem
.A
sepa
rate
sche
me
forf
arm
ers(
KRU
S),p
rovi
ding
old-
age,
disa
bilit
yan
dsu
rviv
ors’
pens
ions
.Specificpublicsectorservicepensions(armedforces,police,judgesetc.)paidfromthestatebudget.
Pre-retirementbenefitspaidoutfromthestatebudget.
Exis
tson
lyto
ave
rym
inor
exte
nt,w
itha
very
low
coverage(2%ofemployees).
Stat
utor
ypr
ivat
esc
hem
esfo
rthe
switc
hed
part
ofth
eso
cial
secu
rity
pens
ion
sche
me
asof
1999
(man
dato
ryfo
rnew
entr
ants
;vol
unta
rysw
itch
alre
ady
clos
ed).
Contributionrateis7.3%
ofwages.
PTMinimumguaranteepensions:
Mea
ns-te
sted
min
imum
pens
ions
thro
ugh
soci
alas
sist
ance
sche
me.
Itin
clud
esal
ltyp
esof
min
imum
pens
ions
;non
-con
trib
utiv
e/so
cial
pens
ions
and
cont
ribu
tive
sche
me
(the
pens
ion
amou
ntde
pend
son
the
cont
ribu
tive
care
erle
ngth
).
Earnings-relatedsocialsecuritypensions:
Age
nera
lsoc
ials
ecur
itype
nsio
nsc
hem
eco
veri
ngal
lem
ploy
eesa
ndth
ese
lf-em
ploy
edin
the
priv
ate
sect
oran
dpu
blic
sect
orem
ploy
eess
ince
Janu
ary
2006
prov
idin
gol
d-ag
e,di
sabi
lity
and
surv
ivor
s’pensions(apartfromshort-termbenefits).
Ase
para
tepe
nsio
nsc
hem
e(C
GA
)for
othe
rpub
licse
ctor
empl
oyee
s.
Exis
tsm
ainl
yfo
rban
king
,ins
uran
cean
dte
leco
mm
unic
atio
nse
ctor
sasa
subs
titut
efo
rthe
gene
rals
ocia
lsec
urity
sche
me.
Als
oex
ists
asco
mpl
emen
tary
sche
mes
foro
ther
DB
and
DC
pens
ions
.
Exis
tson
lyto
ave
rym
inor
exte
nt.

133
PARt II — Age-related expenditure items: coverage, projection methodologies and data sources
Soci
alse
curi
type
nsio
ns(p
ublic
sect
orsc
hem
es)
Occ
upat
iona
lpen
sion
sche
mes
(pri
vate
sect
orsc
hem
es)
Indi
vidu
al(p
riva
te)p
ensi
onsc
hem
es(p
riva
tese
ctor
sche
mes
)R
O
SIMinimumguaranteepensions:
Nat
iona
l,m
eans
-test
edpe
nsio
ns.
Earnings-relatedsocialsecuritypensions:
One
soci
alse
curit
ype
nsio
nsc
hem
eco
veri
ngal
lem
ploy
eesa
ndth
ese
lf-em
ploy
ed,p
rovi
ding
old-
age,
disa
bilit
yan
dsu
rviv
ors’
pens
ions
.Fl
at-r
ate
pens
ions
tofa
rmer
s,m
ilita
rype
rson
nelo
fthe
Yug
osla
var
my
and
forr
etir
eesf
rom
othe
rre
publ
icso
fthe
form
erSF
RY.
Man
dato
rysu
pple
men
tary
insu
ranc
efo
rsom
ehi
gh-r
isk
prof
essi
ons(
abou
t260
00w
orke
rs,m
inor
impo
rtan
ce),
volu
ntar
yco
llect
ive
supp
lem
enta
rype
nsio
ns(c
over
ing
half
the
empl
oyee
s).
Vol
unta
ryin
divi
dual
supp
lem
enta
rype
nsio
ns(o
fminorimportancein2003).
SKMinimumguaranteepensions:
No
spec
ialm
inim
umpe
nsio
nsc
hem
e,m
inim
umsu
bsis
tenc
efo
rold
peop
lean
dw
idow
spro
vide
dth
roug
hm
eans
-test
edso
cial
assi
stan
cepa
idou
tfro
mth
est
ate
budg
et.
Earnings-relatedsocialsecuritypensions:
One
PAY
GD
Bso
cial
secu
rity
pens
ion
sche
me
cove
ring
alle
mpl
oyee
sand
the
self-
empl
oyed
,pr
ovid
ing
old-
age,
disa
bilit
yan
dsu
rviv
ors’
pens
ions
.Fir
stpi
llaro
fthe
pens
ion
sche
me.
Do
note
xist
.St
atut
ory
priv
ate
fund
edD
Csc
hem
efo
rthe
switc
hed
part
ofth
eso
cial
secu
rity
pens
ion
sche
me
asof
2005
.A
tthe
begi
nnin
git
was
com
puls
ory
forn
ewen
tran
tsan
dvo
lunt
ary
forc
urre
ntem
ploy
ees.
Aso
f200
8,th
issc
hem
eis
volu
ntar
yfo
rnew
entr
ants
.Con
trib
utio
nrateis9%
ofwages.Secondpillarofthepension
sche
me.
Vol
unta
rype
nsio
nfu
nded
DC
sche
me
intr
oduc
edin
1996
.Thi
rdpi
llaro
fthe
pens
ion
sche
me.
FIMinimumguaranteepensions:
Nat
iona
lpen
sion
sche
me
prov
ides
mea
ns-te
sted
(aga
inst
othe
rpen
sion
s)m
inim
umpe
nsio
nsto
all
citiz
ens,
afu
llna
tiona
lpen
sion
afte
r40
year
sofl
ivin
gin
FI.A
lso
mea
ns-te
sted
hous
ing
allo
wan
ces
forp
ensi
oner
s.
Earnings-relatedsocialsecuritypensions:
Seve
ralb
utha
rmon
ised
soci
alse
curit
ype
nsio
nsc
hem
esfo
rdif
fere
ntse
ctor
sofe
mpl
oyee
sand
the
self-
empl
oyed
,cov
erin
gal
lgai
nful
lyem
ploy
ed,p
rovi
ding
old-
age,
early
retir
emen
t,di
sabi
lity
and
surv
ivor
s’pe
nsio
ns.
Supp
lem
enta
ryoc
cupa
tiona
lpen
sion
s,ac
coun
ting
for
about2%oftotalpensionbenefits.
Vol
unta
ryin
divi
dual
priv
ate
pens
ion
insu
ranc
e,accountingforabout1%oftotalpensionbenefitsbut
theinsuredpeopleaccountforabout15%
ofworking-
agepopulation.Contributionsareroughly4%oftotal
soci
alse
curit
ype
nsio
nco
ntri
butio
ns.
SEMinimumguaranteepensions:
Nat
iona
lpen
sion
sche
me
prov
ides
mea
ns-te
sted
(aga
inst
othe
rpen
sion
s)m
inim
umpe
nsio
nsto
all
citiz
ens,
afu
llna
tiona
lpen
sion
afte
r40
year
sofl
ivin
gin
SE.A
lso
mea
ns-te
sted
hous
ing
allo
wan
ces
forp
ensi
oner
s(B
TP).
Earnings-relatedsocialsecuritypensions:
The
PAY
Gge
nera
lsoc
ials
ecur
ity(N
DC
)pen
sion
sche
me
cove
ring
alle
mpl
oyee
sand
the
self-
empl
oyed
,pro
vidi
ngol
d-ag
epe
nsio
ns.T
heol
dea
rnin
gs-r
elat
edA
TPsc
hem
ew
orks
inpa
ralle
ldur
ing
the
phas
ing-
outp
erio
d.Se
para
tedi
sabi
lity
and
surv
ivor
s’pe
nsio
nsc
hem
es.T
hefo
rmer
form
ally
coun
ted
ashe
alth
insu
ranc
e.Th
ew
idow
’spe
nsio
n(p
arto
fsur
vivo
rs’p
ensi
ons)
isbe
ing
phas
edou
t.
Supp
lem
enta
ryoc
cupa
tiona
lold
-age
pens
ions
fora
llsectors,covering80-90%
ofemployees.
Stat
utor
ypr
ivat
esc
hem
es(p
rem
ium
pens
ion)
fort
hefu
nded
part
ofth
eso
cial
secu
rity
pens
ion
sche
me;
contributionrateis2.5%
ofwages.(Note:reportedas
soci
alse
curit
ype
nsio
nin
the
AWG
pens
ion
repo
rt20
06.)

134
European Economy 7/2008the 2009 Ageing Report: Underlying assumptions and projection methodologies for the EU-27 Member states
Soci
alse
curi
type
nsio
ns(p
ublic
sect
orsc
hem
es)
Occ
upat
iona
lpen
sion
sche
mes
(pri
vate
sect
orsc
hem
es)
Indi
vidu
al(p
riva
te)p
ensi
onsc
hem
es(p
riva
tese
ctor
sche
mes
)U
KMinimumguaranteedandcontributorysocialinsurancepensions:
Flat
-rat
e(c
ontr
ibut
ory)
stat
eba
sic
(old
-age
)pen
sion
sto
allc
itize
nsan
dm
eans
-test
edsu
pple
men
tsthroughpensioncreditsandCounciltaxes(financedoutoftaxes).
Earnings-relatedsocialsecurityandotherpublicpensions:
Stat
ese
cond
pens
ion
sche
me,
ofw
hich
peop
leca
nop
tout
ofoc
cupa
tiona
lpen
sion
s.Pu
blic
serv
ice
pens
ions
paid
from
the
stat
ebu
dget
.Se
para
tedi
sabi
lity
and
wid
ows’
allo
wan
cesc
hem
es.
Ahi
ghnu
mbe
roff
unds
fort
hepr
ovis
ion
ofoccupationalpensions(about60%
ofemployeesare
cont
ribu
ting
eith
erto
occu
patio
nalo
rper
sona
lpe
nsio
nsc
hem
es).
Pers
onal
pens
ion
prov
isio
nsw
ithta
xsu
bsid
iesf
orpe
rson
swith
outa
cces
sto
occu
patio
nals
chem
esw
ere
intr
oduc
edin
1998
.St
akeh
olde
rpen
sion
prov
isio
nw
ithta
xsu
bsid
ies
with
outa
cces
sto
com
pany
(occ
upat
iona
l)pe
nsio
nsc
hem
esw
asin
trod
uced
in20
01.
NO
Minimumguaranteepensions:
Min
imum
inco
me
guar
ante
e.
Earnings-relatedsocialsecuritypensions:
Earnings-basedbenefit.
Dis
abili
type
nsio
ns.
Vol
unta
ryea
rlyre
tirem
entp
ensi
ons.
Cen
tral
gove
rnm
ento
ccup
atio
nalp
ensi
onsc
hem
efinancedbyemployeecontributionsandtransfers
from
Stat
ebu
dget
.Sup
plem
entt
oso
cial
secu
rity
old
age
pens
ion.
Loca
lgov
ernm
ento
ccup
atio
nalp
ensi
onsc
hem
esar
efu
nded
syst
ems.
Supp
lem
entt
oso
cial
secu
rity
old
age
pens
ion.
Man
dato
rypr
ivat
ese
ctor
occu
patio
nals
chem
esar
efundeddefinedcontributionsystems.Supplementto
soci
alse
curit
yol
dag
epe
nsio
n.
Yes.
Sou
rce
:Co
mm
issio
nse
rvic
es,
EPC
.

135
PARt II — Age-related expenditure items: coverage, projection methodologies and data sources
Table 6.2 – Coverage and specification of pension schemes in the 2009 projections
Schemes covered in the 2009 projections(*E-r = earnings-related)
Schemes not covered
BE Social security pensions: old age and early pensionsOld age pension: w64 (65 by 2009)/m65.E-r old-age 60+ and widows, public sector.E-r old-age 60+ and widows, private sector.E-r old-age 60+ and widows, self-employed.Prepension (early retirement embedded in the unemployment scheme):60+, private sector.Prepension (heavy jobs): 58+, private sector.Prepension for labour market reasons: 52-55, private sector.Means-tested minimum benefit: guaranteed income for elderly persons(assistance scheme) 64+ (65+ by 2009).
Social security pensions: other
Disability pensions -64, private sector.Disability pensions -64, self-employed.
Prepensions include only the part paid fromunemployment benefit scheme, not thecomplement paid by the employer.
occupational pension schemes:(pensions 1.1% of GDP in 2007).
Private pensions:(non-mandatory).
BG Old Age Pensions: Old Age and Periods of Insurance Pensions(including farmers, COOP, military officials) – 63m; 59.5w for 2008.Social pension for old age – 70m; 70w.Survivors pensions according to relationship with the deceased:Widows – 58+m, 55.5+w; Child; Widows aged 50/60; Non-workingWidows – all ages; Disabled Children; Non-working Parents – 63m,55.5w; Parents; Other Survivor; Orphans up to 26.Disability Pensions: Disability (including farmers, COOP, militaryofficials); Disability due to Work Injury and Professional Disease(including farmers, COOP, military officials) – persons at working age.Supplementary mandatory insurance – universal pension schemesproviding supplementary life-long old-age pension.
Teachers Pension Fund of the social securityscheme.
Professional Pension Funds of the privatemandatory scheme.
Supplementary voluntary pension funds.
Supplementary voluntary pension funds underoccupational schemes.
CZ Social security pensions: old age and early pensionsMinimum and e-r old-age pensions, 62+ (65+ as of 2030), all sectors.Proportional old-age pensions, 65+, all sectors.Widows and disability pensions, 55+.Early pensions (with permanent reductions).
Social security pensions: otherWidows and disability pensions -54.Orphans pensions.
DK Social security pensions: old age and early pensionsPublic flat-rate old-age pensions and means-tested supplements, allcitizens 65+.Civil servants old-age pensions 65+, central and local government.Voluntary early retirement schemes, all wage earners.
Social security pensions: otherDisability and survivors’ pensions, -64.
occupational pensionsLabour market pensions:Labour market supplementary pensions (ATP),Labour market supplementary pensions (SP),Labour market supplementary pensions forrecipients of disability pension (SAP)Social security pensions: otherSurvivors’ pensions
Private pensionsIndividual pension savings plans
DE Social security pensions: old age and early pensionsE-r old-age, widows and disability schemes, all ages.General scheme and life-time civil servants.Early pensions for long-time workers.Early pensions for severely handicapped.
Social security pensions: other(covered above; not shown separately).
Social security:Minimum benefits to elderly (social assistance);0.1% of GDP.Farmers and miners pensions(0.5% of GDP).
occupational pensions:Of growing importance, pension expenditure1.4% of GDP in 2007. Currently 64% of theemployees contribute to occupational schemes.
Individual funded pensions:Schemes at a building stage, only contributionsto the schemes.
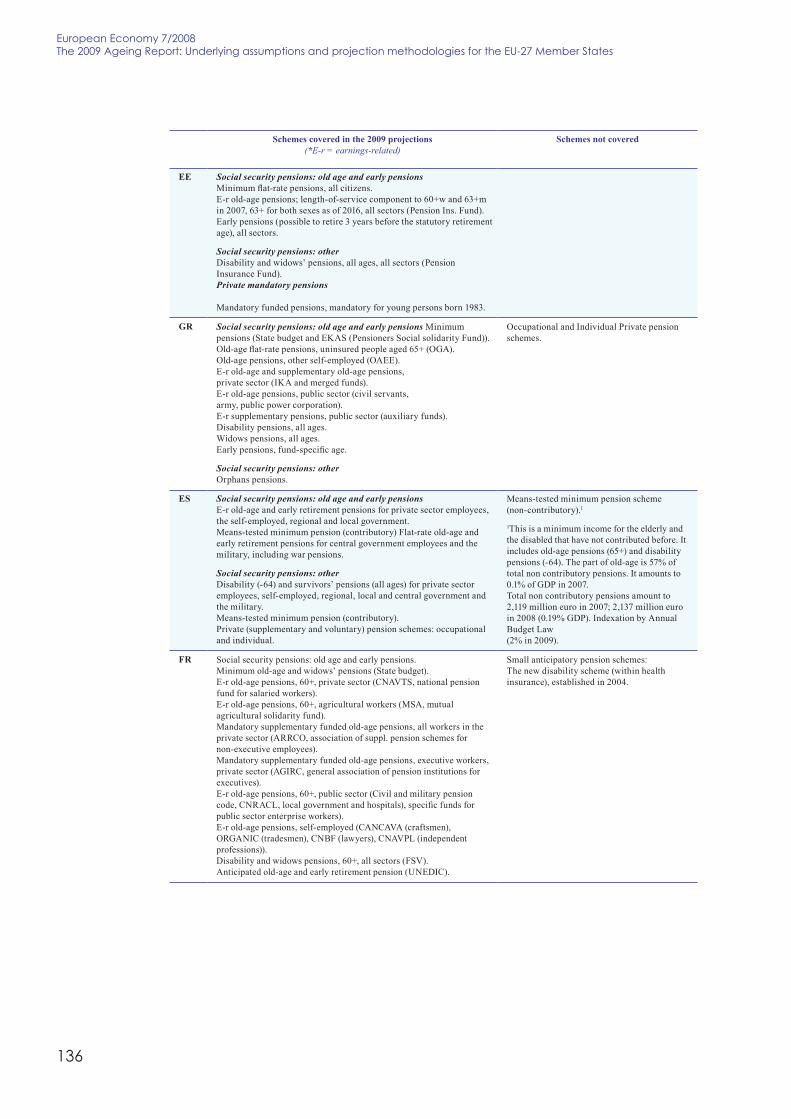
136
European Economy 7/2008the 2009 Ageing Report: Underlying assumptions and projection methodologies for the EU-27 Member states
Schemes covered in the 2009 projections(*E-r = earnings-related)
Schemes not covered
EE Social security pensions: old age and early pensionsMinimum flat-rate pensions, all citizens.E-r old-age pensions; length-of-service component to 60+w and 63+min 2007, 63+ for both sexes as of 2016, all sectors (Pension Ins. Fund).Early pensions (possible to retire 3 years before the statutory retirementage), all sectors.
Social security pensions: otherDisability and widows’ pensions, all ages, all sectors (PensionInsurance Fund).Private mandatory pensions
Mandatory funded pensions, mandatory for young persons born 1983.
GR Social security pensions: old age and early pensions Minimumpensions (State budget and EKAS (Pensioners Social solidarity Fund)).Old-age flat-rate pensions, uninsured people aged 65+ (OGA).Old-age pensions, other self-employed (OAEE).E-r old-age and supplementary old-age pensions,private sector (IKA and merged funds).E-r old-age pensions, public sector (civil servants,army, public power corporation).E-r supplementary pensions, public sector (auxiliary funds).Disability pensions, all ages.Widows pensions, all ages.Early pensions, fund-specific age.
Social security pensions: otherOrphans pensions.
Occupational and Individual Private pensionschemes.
ES Social security pensions: old age and early pensionsE-r old-age and early retirement pensions for private sector employees,the self-employed, regional and local government.Means-tested minimum pension (contributory) Flat-rate old-age andearly retirement pensions for central government employees and themilitary, including war pensions.
Social security pensions: otherDisability (-64) and survivors’ pensions (all ages) for private sectoremployees, self-employed, regional, local and central government andthe military.Means-tested minimum pension (contributory).Private (supplementary and voluntary) pension schemes: occupationaland individual.
Means-tested minimum pension scheme(non-contributory).1
1This is a minimum income for the elderly andthe disabled that have not contributed before. Itincludes old-age pensions (65+) and disabilitypensions (-64). The part of old-age is 57% oftotal non contributory pensions. It amounts to0.1% of GDP in 2007.Total non contributory pensions amount to2,119 million euro in 2007; 2,137 million euroin 2008 (0.19% GDP). Indexation by AnnualBudget Law(2% in 2009).
FR Social security pensions: old age and early pensions.Minimum old-age and widows’ pensions (State budget).E-r old-age pensions, 60+, private sector (CNAVTS, national pensionfund for salaried workers).E-r old-age pensions, 60+, agricultural workers (MSA, mutualagricultural solidarity fund).Mandatory supplementary funded old-age pensions, all workers in theprivate sector (ARRCO, association of suppl. pension schemes fornon-executive employees).Mandatory supplementary funded old-age pensions, executive workers,private sector (AGIRC, general association of pension institutions forexecutives).E-r old-age pensions, 60+, public sector (Civil and military pensioncode, CNRACL, local government and hospitals), specific funds forpublic sector enterprise workers).E-r old-age pensions, self-employed (CANCAVA (craftsmen),ORGANIC (tradesmen), CNBF (lawyers), CNAVPL (independentprofessions)).Disability and widows pensions, 60+, all sectors (FSV).Anticipated old-age and early retirement pension (UNEDIC).
Small anticipatory pension schemes:The new disability scheme (within healthinsurance), established in 2004.

137
PARt II — Age-related expenditure items: coverage, projection methodologies and data sources
Schemes covered in the 2009 projections(*E-r = earnings-related)
Schemes not covered
IE Social security pensions: old age and early pensionsMinimum flat-rate old-age non-contributory pensions, 66+1 (alsoincludes widow(er)s non-contributory pensions, blind persons, loneparents, 66+), all sectors.2
Carers non-contributory, 66+, all sectors.2
Flat-rate contributory 66+ and transition pensions, 65+(also includes invalidity) 1, private sector, self-employed and somepublic servants.3Widow(er)s contributory pensions, 66+, all sectors.Carers contributory, 65+, private sector, self-employed andsome publicservants.3
Social security pensions: othersWidow(er)s non-contributory pensions, 65-, all sectors.2
Blind persons, carers, non-contributory, 65-, all sectors.2
Pre-retirement allowance, 55-65, all sectors.2
Disability pensions, 65-, and invalidity pensions 64-,private sector, self-employed, some public servants.3Carers, contributory, 64-, private sector, self-employed,some public servants.3Widow(ers) contributory pension, 65-, all sectors.
Public service (occupational) pensionsPensions, lump sums and spouses, Civil service, defence, police,education, health and local authorities, non- commercial state bodies.
1 Includes dependent adults of all ages.2 While individuals from all sectors of the economy are eligible toapply for these pensions, some sectors may not be eligible to receivethem due to the means-tested nature of the schemes.3 Public servants hired on or after 6 April 1995 pay the standardfull-rate social insurance contribution, thereby (in general) becomingentitled on retirement to a contributory social security pension, alongwith a public service occupational pension which is “integrated”. Theyalso qualify for a range of other social welfare benefits. By contrast,most public servants hired before 6 April 1995 pay a lower “modified”social insurance contribution and as such, do not qualify for acontributory social security pension (they do normally qualify for apublic service occupational pension on retirement) but may qualify forsome other social welfare benefits.
occupational pensions:Private sector schemes and public sectorcommercial bodies
IT Social security pensions and social assistance benefits:Old-age, disability and survivors’ pensions, w60+/m65+, all sectors, allsocial security schemes (DB, Mixed, NDC).Early retirement, disability and survivors’ pensions, w-59/m-64, allsectors, all social security schemes (DB, Mixed, NDC)- Old ageallowances and social assistance additional lump sums (State budget).
occupational pensions:They are not part of the public pension systemdefinition to be utilised for the analysis of thesustainability of public finances insofar as:i) they are never mandatory;ii) they provide a supplement of pension whichcorresponds to a minor fraction of that providedby the public pension system. No risk is takenby the State on investment returns.
CY Social security pensions: old age and early pensionsGeneral Social Insurance scheme covering e-r old-age and widows’pensions.Early old-age pensions, 58-64.Invalidity and disablement pensions, -62.Government Employees Pension scheme covering old-age, widows’ anddisability pensions.
Social security pensions: old age and earlypensionsSocial (minimum) pension scheme and specialallowances to pensionersoccupational pensions:Voluntary provident Funds.
LV Social security pensions: old age and early pensionsOld-age minimum guaranteed pension, 62+.E-r old-age DB pensions, granted -1995, all sectors.E-r old-age NDC pensions, 62+, granted 1996+, all sectors.Special service pensions (early pensions), selected professions, publicsector.Disability pensions, granted -1995 and not transformed to old-agepensions, all sectors.Survivors’ pensions (for widows during the transition period).
Social security pensions: otherDisability pensions, -62, all sectors.Survivors’ pensions -24.Special service, public sector.
Private mandatory pensionsIndividual funded old-age pension, mandatory for persons born 1971+.

138
European Economy 7/2008the 2009 Ageing Report: Underlying assumptions and projection methodologies for the EU-27 Member states
Schemes covered in the 2009 projections(*E-r = earnings-related)
Schemes not covered
LT Social security pensions: old age and early pensionsSocial assistance pensions, w60+/m62.5+ ; (State budget)Old-age, disability and widows pensions, w60+/m62.5+, all sectors(Social insurance scheme)Officials and military personnel disability and widows pensions, w60+/m62.5+, public sector (State budget)Special public service (state) pensions for selected professions(scientists, judges) (State budget); state pensions of the first and seconddegree of the Republic of Lithuania (State budget); state pensions ofdeprived persons(State budget);Early retirement unemployment benefit (Unemployment fund), changedinto early retirement pension as of mid 2004 (Social insurance schemeas of mid 2004).Officials and military personnel pensions for service(State budget); length of service pensions, compensation forextraordinary working conditions (Soc. insurance scheme).
Social security pensions: otherSocial assistance pensions (disability and widows pensions),-w59/-m62.4 (State budget)Disability and widows pensions, -w59/-m62.4, all sectors(Soc. Insurance scheme)State pensions : otherOfficials and military personnel disability and widows pensions,-w59/-m62.4, public sector (State budget)
Private mandatory pensionsIndividual funded old-age pension, voluntary, all sectors
LU Social security pensions: old age and early pensionsE-r old-age, early retirement and disability pensions, 65+, privatesector & self-employed (RGAP (general pension insurance scheme).E-r old-age, early retirement and disability pensions, 65+ , public sector(RSP, special pension scheme), state budget.Social security pensions: otherDisability (-64 years) and survivors’ pensions, all sectors.
Minimum benefits (RMG, social assistance).
HU Social security pensions: old age and early pensionsSocial allowances equivalent to pensions to persons 62+.E-r old-age and anticipatory old-age pensions, all sectors.Survivor’s pensions, 62+, all sectors.Disability pensions, 62+, all sectors.
Social security pensions: otherDisability pensions, -61, all sectors.Survivor’s pensions, -61, all sectors.Pension-like regular social allowances, -61.
Private mandatory pensionsIndividual funded pensions, mandatory to persons entering the labourmarket.
MT Social security pensions: old age and early pensionsTwo-thirds pension scheme (incorporating two-thirds retirementpension, national minimum pension, increased national minimumpension, increased retirement pension, decreased national minimumpension), currently w60+/m61+, 62+ in 2012, 63+ in 2018, 64+ in 2022and 65+ in 2026.
Social security pensions: otherPensions other than those listed above, notably disability and survivors’pensions and some pensions, which will be phased out over a transitionperiod, to specific groups of pensioners.
NL Social security pensions: old age and early pensionsPublic flat-rate old-age pensions, 65+, all citizens (AOW).Widows pensions, w55+, all sectors (ANW).
Social security pensions: otherDisability benefits, all sectors (WAO).
occupational pensionsOccupational old-age pensions, 65+, all sectors.Occupational early retirement pensions, all sectors (VUT).

139
PARt II — Age-related expenditure items: coverage, projection methodologies and data sources
Schemes covered in the 2009 projections(*E-r = earnings-related)
Schemes not covered
AT Social security pensions: old age and early pensionsE-r old-age and early retirement pensions, w60+/m65+, private sector(ASVG, gen. soc. ins. Scheme, also including farmers and self-employed).E-r old-age and early retirement pensions, w60+/m65+, public sector(civil service).
Social security pensions: otherSurvivors’ pensions, all ages, all sectors.Disability pensions, all ages, all sectors.
Social security pensions: old age and earlypensions:Minimum pensions (Ausgleichszulagen),financed by general tax revenues (in 2007approximately 0.3% of GDP).
other pension related expenditures:Some pension expenditures not directly linkedto pension benefits (as for rehabilitation,administrative costs, etc.) are not included inthe projections. These other pensionexpenditures make up for approximately 0.9%of GDP.
PL Social security pensions: old age and early pensionsE-r DB old-age, w60+/m65+, disability, widows and early retirementpensions, w55-59/m55-64, to persons born -1948 and to those peoplewho earned fully their pension rights before the end of 2006, privateand public sector, self-employed (ZUS, Social ins. institute).E-r NDC old-age and anticipatory pensions, to persons born 1949-(with the exception of the transitional group), private and public sector,self-employed (ZUS, Social insurance fund).E-r DB old-age, disability and widows pensions, all ages, farmers(KRUS, Farmers social ins. scheme).Armed forces old-age pensions (State budget).
Social security pensions: otherDisability and widows pensions, -54, private and public sector,self-employed (ZUS).
Private mandatory pensionsIndividual funded old-age pensions, mandatory to persons born 1969+and voluntary to those born 1949-68 joining the scheme by the end of1999.
Social security pensions: old age and earlypensions:Minimum means-tested pensions.
occupational pensions:(of minor importance).
PT Social security pensions: old age and early pensions:Social pensions (minimum, means-tested and non- contributory),old-age, 65+, disability pensions, 65+.General Contributory (social insurance) scheme (employees andself-employed of the private sector and public employees since 2006):old-age and early pensions; disability pensions, 65+. Includessupplements to ensure minimum pensions value.RESSAA (Spec. soc. sec. scheme for agriculture workers): e-r old-age,65+, disability pensions, 65+.CGA (Pension scheme of civil servants hired until December 2005):old-age and early pensions, disability pensions, all ages. Includessupplements to ensure minimum pensions value.
Social security pensions: otherSocial pensions (means-tested non-contributory): disability pensions,-64, survivors’ pensions, all ages.General contributory scheme & RESSAA: disability pensions, -64,survivors’ pensions, all ages.CGA scheme: survivors’ pensions, all ages.
occupational pensions:1st pillar schemes for some sectors (banking and insurance for example)and complementary schemes for other DB and DC pensions.
Private pensions:Individual (non-mandatory) private pensionschemes (of minor importance).
RO
SI Social security pensions: old age and early pensionsOld age pensions.E-r old-age (w58-63+/m58-65+).Disability and widows pensions, all ages, all sectors.Special compulsory pensions to workers in high-risk occupations,private and public sector.
Private non – mandatory pensions (including mandatory pensions toworkers in high risk occupations)Collective (semi-mandatory) and individual supplementary pensions.
National (state) pensions (State budget).Flat-rate pensions for farmers.Pensions (supplements) for the militarypersonnel of the Yugoslav army and retireesfrom other republics of former SFRY.
occupational pensions :Collective supplementary pensions.

140
European Economy 7/2008the 2009 Ageing Report: Underlying assumptions and projection methodologies for the EU-27 Member states
Schemes covered in the 2009 projections(*E-r = earnings-related)
Schemes not covered
SK Social security pensions: old age and early pensionsE-r old-age, w53-57+/m60+ (w62+ 2016 and m62+ 2006), disability andwidows pensions, all sectors (Social insurance scheme).
Social security pensions: otherDisability and widows pensions, orphans pensions.
Private mandatory pensions:Individual funded old-age pension, mandatory to persons enteringlabour market 2008+ (assumed entry rate 95%).
Social assistance benefits to those with lowpensions as no minimum pension exists.Voluntary pension funded DC schemeintroduced in 1996. Third pillar of the pensionscheme.
FI Social security pensions: old age and early pensionsNational (minimum) pension (Nat. pension insurance), 65+.E-r old-age, 63+, early pensions, private sector and the self-employed:(TyEL, private sector employees), (YEL, self-employed), (MYEL,farmers), and the public sector: (VEL (central government employees),KuEL (municipal sector employees), KiEL (church empl.).Unemployment pensions, 60-62, to be phased out by 2014.
Social security pensions: otherNational (minimum) disability and survivors’ pensions, -64.E-r disability and survivors pensions, -62, all sectors (early pensionschange into old- age pensions at the age of 63 and then included in theabove category).
occupational pensions:Collective mandatory and voluntarysupplementary schemes.
SE Social security pensions: old age and early pensions:Minimum pensions and housing supplement for pensioners (State budget).E-r NDC old-age and anticipated pensions, flexible age, all sectors (Socialinsurance scheme).
Social security pensions: otherDisability pensions, 19-64, and survivors benefits, all ages.
occupational pensions:Occupational (supplementary) pensions, private and public sectoremployees (old and new schemes).Individual mandatory funded old-age pensions, premium pensions.
UK Social security (and other public) pensions: old age and early pensions:Basic state (minimum) pensions + their additions(winter fuel allowance), State Pension Age and above, all citizens(National insurance scheme).Pension credits and Council tax benefits, 60+, all citizens (State budget).State second pension (S2P)/ State earnings-related pensions (SERPS),State Pension Age, all sectors (National insurance scheme).Widow’s benefits are covered for individuals above State Pension Age.E-r old-age pensions, 60+, public sector employees(State budget)
Social security pensions: other
Public pensions:Disability benefits to people below State PensionAge. Above State Pension Age all individuals arecovered by social security pensions.
occupational pensions:Supplementary old-age pensions, private sector;important part of the pension system.
NO Social security pensions: old age and early pensionsMinimum income guarantee.Earnings-based benefit.
Social security pensions: otherDisability pensions.
Central government occupational pension schemefinanced by employee contributions and transfersfrom State budget. Supplement to social securityold age pension.Local government occupational pension schemesare funded systems. Supplement to social securityold age pension.Mandatory private sector occupational schemesare funded defined contribution systems.Supplement to social security old age pension.Labour market supplementary pensions forrecipients of anticipatory pension.Voluntary early retirement pensions.
Source: Commission services, EPC.

141
PARt II — Age-related expenditure items: coverage, projection methodologies and data sources
Annex 6.1:pension projection reporting sheet
2000 2001 2002 2003 2004 2005 2006 2007 2008 2009 2010 2060
Outturn data in 2007 pricesBaseyear Projections in 2007 prices
A. Fixed tableGDP (ECFIN projection,in 2007 prices - billions EUR)GDP (used in projections,in 2007 prices)Gross wage (used in projections,in 2007 prices - billions EUR)
Pension exPenditure
Social security pensions, gross,in millions €
Old-age and early pensionsOf which: earnings-related pensionsPrivate sector employeesPublic sector employees
Other pensions (disability, survivors)Occupational pensions, gross,in millions €Private pensions, gross, in millions €
Mandatory private schemeNon-mandatory private scheme
Total pension expenditure, gross,in millions €Social security pensions, net,in millions €
Old-age and early pensionsOf which: earnings-related pensionsPrivate sector employeesPublic sector employees
Other pensions (disability, survivors)Occupational pensions, net,in millions €Private pensions, net, in millions €
Mandatory private schemeNon-mandatory private scheme
Total pension expenditure, net,in millions €
tax on Pension
Social security pensionsOccupational pensionsPrivate mandatory pensionsPrivate non-mandatory pensions
Total tax on pension
Benefit ratio
Social security pensionsOccupational pensionsPrivate mandatory pensionsPrivate non-mandatory pensionsTotal benefit ratio
Gross averaGe rePlacement rate
Social security pensionsOccupational pensionsPrivate mandatory pensionsPrivate non-mandatory pensions
Total gross replacement rate

142
European Economy 7/2008the 2009 Ageing Report: Underlying assumptions and projection methodologies for the EU-27 Member states
2000 2001 2002 2003 2004 2005 2006 2007 2008 2009 2010 2060
Outturn data in 2007 pricesBaseyear Projections in 2007 prices
numBer of Pensions, in 1000Social security pensions
Old-age and early pensionsOf which: earnings-related pensionsPrivate sector employeesPublic sector employees
Other pensions (disability, survivors)Occupational pensionsPrivate pensions
Mandatory private schemeNon-mandatory private scheme
All pensions, in 1000Of which: aged -54aged 55-59aged 60-64aged 65+
numBer of Pensioners, in 1000Social security pensions
Old-age and early pensionsOf which: earnings-related pensionsPrivate sector employeesPublic sector employees
Other pensions (disability, survivors)Occupational pensionsPrivate pensions
Mandatory private schemeNon-mandatory private scheme
All pensioners, in 1000Of which: aged -54aged 55-59aged 60-64aged 65+
contriButions (emPloyee+emPloyer)Social security pensions, in millions €
Old-age and early pensionsOf which: earnings-related pensionsPrivate sector employeesPublic sector employees
Other pensions (disability, survivors)Occupational pensions, in millions €Private pensions, in millions €
Mandatory private schemeNon-mandatory private scheme
Total pension contributions,in millions €
numBer of contriButors (emPloyees),in 1000Social security pensions
Old-age and early pensionsOf which: earnings-related pensionsPrivate sector employeesPublic sector employees
Other pensions (disability, survivors)Occupational pensionsPrivate pensions
Mandatory private schemeNon-mandatory private scheme
All pensions, in 1000

143
PARt II — Age-related expenditure items: coverage, projection methodologies and data sources
2000 2001 2002 2003 2004 2005 2006 2007 2008 2009 2010 2060
Outturn data in 2007 pricesBaseyear Projections in 2007 prices
assets of Pension funds and reserves
Social security pensions, in millions €Liquid assets (Non-consolidated)Liquid assets (Consolidated)Other assets
Savings to the fundsPayments from the funds
Occupational pensions, in millions €Private mandatory pensions,in millions €Private non-mandatory pensions,in millions €All pensions, in millions €
B. Additional information
additional information


145
PARt II — Age-related expenditure items: coverage, projection methodologies and data sources
7.1. bAckground
This section outlines the approach that will beused to project public spending on health care inthe 27 Member States of the EU and Norway.While preparing the new round of projections,the Commission issued a number of notes andworking documents which were circulated to thedelegates of the AWG and subsequentlydiscussed at the AWG meetings. In order to agreeon the data sources to be used and to establish acommonly agreed methodology for health andlong-term care projections, based to the highestpossible degree on the available empirical dataand current state-of-the-art in the field of healtheconomics, public health and epidemiology, theCommission organised two workshops gatheringa number of experts from academia, nationaladministration and research institutes. The firstone, held on 18 April 2007, addressed the issuesof data availability and comparability.57 Thesecond one, held on 4 October 2007, concentratedmainly on various drivers of health expenditure(evolution of health status, national andindividual income, role of technology, etc.), theways to measure their impact on public spending
57 The workshop was constructed around a series ofpresentations addressing specific problematic issues thatneed to be discussed before deciding on the way to proceedwith the data collection and establishing calculationmethodology. The first part of the workshop started withthe issue of defining the concept, coverage and borderlinesof health and long-term care, which was introduced byDavid Morgan (OECD). The topic was further specified byDorota Kawiorska (Eurostat) who described the System ofHealth Accounts (SHA) and presented the main differencesbetween it and the European System of Integrated SocialProtection Statistics (ESSPROS). She clarified what itemsof expenditure are covered by the two classifications andexplained the pros and cons of using each dataset in theprojection exercise. The second part of the workshop wasdevoted to measuring disability and health status. DidierDupré (Eurostat) provided a general overview of howdisability, morbidity and health status is measured andreported in the common databases, while Gaëtan Lafortune(OECD) presented a recently completed project whichaimed at comparing the trends in disability across a numberof the OECD countries.
and consequently on possible improvements inthe projections methodology.58
The projections on health care need to be viewedin the context of the overall projection exercise,and as such the following consideration shouldbe borne in mind:
• the health care projections will be made onthe basis of the baseline assumptions onpopulation, labour force and macroeconomicvariables agreed by the EPC and outlined inthe chapters 1 to 4 of this report. Also, somesensitivity tests agreed by the EPC anddescribed in chapter 5 of this report will bereflected in the projections on health carespending;
• a separate projection exercise will be madefor spending on long-term care which isdescribed in the next chapter;
• the methodology used to project futureexpenditure on health care in a multilateralsetting of 27 Member States is constrainedby the availability and comparability of data.Although much effort has been made toassure highest possible consistency (commondatabases were used to the largest possibleextent, reducing arbitrariness and room for
58 External experts were invited to present their respectiveresearch projects and suggest possible improvements to themethodology used by the AWG. Martin Weale (NIESR,London) presented the econometric model estimating theimpact of several demographic, economic, social andinstitutional variables on health care expenditure in the EU,and suggested which ones should be incorporated in theprojection model as highly statistically significant (e.g.share of public sector in total health expenditure, femalelabour force participation). Luc Bonneux (NIDI, TheHague) presented a series of studies on the recent trends inmorbidity and mortality suggesting that according toempirical evidence a constant increase in life expectancyoccurs at the cost of increasing morbidity and disability.Therefore while it is impossible to predict future evolutionin the prevalence of various diseases, the most probablehypothesis would be some kind of morbidity expansion.Erika Schulz (DIW, Berlin) presented methodology,sources of data and results of recently completedprojections of health and long-term care expenditure inGermany. Joaquim Oliveira Martins (OECD) presented astylised method to incorporate technological progress inhealth and long-term care expenditure projections, basedon the decomposition of past trends and extrapolation ofthe residual assumed to reflect the impact of technology.
7. HEAltH CARE

146
European Economy 7/2008the 2009 Ageing Report: Underlying assumptions and projection methodologies for the EU-27 Member states
interpretation of the data providedindividually by the Member States) someinconsistency is still unavoidable.
7.2. cApturing the vAriousdeMogrAphic And non-deMogrAphicdrivers of spending: six different typesof scenArios
Health care spending is determined by a complexseries of demand and supply side factors.According to the literature, the demand for healthcare depends ultimately on the health status andfunctional ability of citizens, and not on age perse. While age is a useful indicator of the healthstatus of an elderly population (as shown by thesteep upward slope of age-related expenditureprofiles), it is not the causal factor. On the otherhand, a number of supply (economic, social andinstitutional) factors are also proven to affecthealth expenditure in the long term. Health carespending is therefore mostly driven by:
• the health status of the population;
• economic growth and development;
• new technologies and medical progress;
• the organisation and financing of the healthcare system;
• health care resource inputs, both human andcapital.
Given the difficulties in modelling many of thefactors found as drivers of public health careexpenditure and the possible interactions betweenthem, it has been found unfeasible to constructan all-encompassing projection methodology tocapture all demographic and non-demographicfactors. Instead, it was agreed to run severaldifferent projection scenarios in order to tacklethe issue from a variety of different angles andto be able to analyse the impact of eachquantifiable factor separately. The AWG andEPC envisage choosing a baseline scenario forhealth care expenditure in connection with therelease of the final Ageing Report with thebudgetary projections, as was the case in the2006 Ageing Report.
The overview of the scenarios is presented inTable 7.1 below.
7.2.1. Pure demographic scenario
The pure demographic scenario attempts to isolatethe ‘pure’ effects of an ageing population on healthcare spending. It assumes that age-related spendingper capita on health care in the base year (2007)remains constant over time. This way all gains inlife expectancy are assumed to be spent in badhealth while the number of years spent in goodhealth remains constant. As such, this scenario isinspired by the ‘expansion of morbidity’hypothesis
table 7.1 – Overview of different scenarios to project health care expenditure
Puredemographic
scenario
High lifeexpectancy
scenario
Constanthealth
scenario
Death-relatedcosts
scenario
Incomeelactity
scenario
EU12 costconvergence
scenario
Labourintensityscenario
AWGreferencescenario
Populationprojection
Europop2008
Alternativehigh life
expectancyscenario
Europop2008
Europop2008
Europop2008
Europop2008
Europop2008
Europop2008
Age-relatedexpenditureprofiles
2007age-related
expenditureprofiles held
constantover
projectionperiod
2007age-related
expenditureprofiles held
constantover
projectionperiod
2007 profilesshift in line
with changesin age-
specific lifeexpectancy
2007 profilesheld
constant butsplit intoprofiles ofdecedents
andsurvivors
2007age-related
expenditureprofiles held
constantover
projectionperiod
IndividualEU12
countryprofiles
convergingto the
averageEU15 profile
over theprojection
period
2007age-related
expenditureprofiles held
constantover
projectionperiod
2007 profilesshift by half
the changein age-
specific lifeexpectancy
Unit costdevelopment
GDP percapita
GDP percapita
GDP percapita
GDP percapita
GDP percapita
GDP percapita
GDP perworker
GDP percapita
Incomeelasticity ofdemand
1 1 1 1 1,1 in 2007converging
to 1 by 2060
1 1 1,1 in 2007converging
to 1 by 2060
Source: Commission services, EPC.

147
PARt II — Age-related expenditure items: coverage, projection methodologies and data sources
quoted in the literature59, as it de facto assumesthat the gains in life expectancy up to 2060 arespent in bad health. The constant age profile isapplied to the baseline AWG population scenariowith an assumption that the unit costs evolve inline with GDP per capita.
formal illustration
In the pure demographic scenario, all gains in lifeexpectancy are assumed to be spent in bad healthwhile the number of years spent in good healthremains constant. The extension of lifespan willnot affect an average individual’s health status atany given age, and consequently his or her age-related expenditure on health care will not changeover time. One can approximate this situation byassuming that health care cost per capita for eachyear of age remains constant in GDP per capita-adjusted terms over the whole projection period.Based on this assumption, the projection is thenmade in the following manner.
First, for the time horizon of the projectionexercise (2007-60), the age-related expenditureprofiles (showing the average health carespending per capita for each year of age (from 0to 100 or less, according to data availability) areassumed to grow in line with the macroeconomiccost driver, i.e. GDP per capita. Therefore:
c'g,a,n = cg,aΔYpc n [1]
where:
c’g, a, n is cost per capita of a person of a givengender g and age a in a given year n of theprojection period adjusted to the GDP per capitagrowth;
59 The expansion of morbidity hypothesis posits that as lifeexpectancy increases, older people become morevulnerable to chronic diseases and spend more time inill-health. In other words, a higher proportion of peoplewith health problems survive to an advanced age. Thisrelationship works mainly through three mechanisms:(1) thanks to medical interventions, the prolonged survivalof chronically ill people increases their lifespan but it doesnot improve their health state. Consequently, extra years oflife expectancy are, at least partially, spent in bad health;(2) increased survival means that a larger part of populationis elderly and more vulnerable to chronic diseases:moreover, the causes of disability are shifting from fatal tonon-fatal diseases which are more prevalent in older agecohorts; (3) chronic disease can act as a risk factor for otherillnesses. For example, a disease earlier in lifetime canhave negative consequences later on: a non-fatal diseasemay not translate directly into higher mortality but intohigher morbidity and disability.
cg, a is constant cost per capita of a person of agiven gender g and age a;
ΔYpcn is GDP per capita rate growth in year n,
ΔYpc n =Yn
pg,a,n∑−
Yn−1pg,a,n−1∑
⎛
⎝⎜⎜
⎞
⎠⎟⎟ / Yn−1
pg,a,n−1∑
⎛
⎝⎜⎜
⎞
⎠⎟⎟ [2]
Yn is GDP in year n;
pg, a, n is the projected population of a givengender g and age a in a given year n.
Second, this unit cost for each year is multipliedby the projected population of each year of age(using the baseline population projection)
Sg,a,n = c'g,a,n pg,a,n [3]
where:
Sg, a, n is spending on health care realised bypeople of a given gender g and age a in a givenyear n.
Next, the resulting total health care spending isdivided by the GDP projected using the rates ofchange agreed by the Ageing Working Group inorder to obtain share of health care expenditurein GDP:
Tn =Sg,a,n∑Yn
[4]
where:
Tn is the share of total health care spending inGDP in a given year n.
7.2.2. High life expectancy scenario
High life expectancy scenario presents thebudgetary effects of an alternative demographicscenario which assumes life expectancy to behigher for all ages than in the baseline scenario(for details see section 5). In terms ofmethodology, the scenario does not differ fromthe pure demographic scenario, apart from thefact that the baseline demographic projections(structure of the population evolving over theprojection period and the consequent evolutionin the macroeconomic assumptions) used asinput data are replaced with the alternative, highlife expectancy, variant.

148
European Economy 7/2008the 2009 Ageing Report: Underlying assumptions and projection methodologies for the EU-27 Member states
7.2.3. Constant health scenario consideringimprovements in the health status of elderlycitizens
As pointed out above, the pure demographicscenario may be pessimistic in that it implicitlyassumes that all gains in life expectancy up to2060 would be spent in bad health. The constanthealth scenario is inspired by the so-called‘dynamic equilibrium’ hypothesis60 and capturesthe potential impact of possible improvements inthe health care status of elderly citizens. Itassumes that the number of years spent in badhealth during a life time remains constant overthe projection period, i.e. all future gains in lifeexpectancy are spent in good health. Thisassumption is modelled by progressively shiftingthe age-related expenditure profile of the baseyear outwards in direct proportion to theprojected gains in age and gender specific lifeexpectancy, embedded in the baseline populationprojection. Given the lack of quantifiablemeasures of health status (morbidity), thisapproach is feasible only with an assumptionthat age-related expenditure profile is a proxy formorbidity profile, i.e. higher per capita spendingat the higher ages is proportional to the increasedfrailty and worse health status at the end of aperson’s lifespan.
formal illustration
To capture possible changes in the health carestatus (morbidity) of populations over time, anadditional assumption is required to run theconstant health. This is achieved by ‘linking’changes in life expectancy to changes inmorbidity (proxied by the age-related expenditureprofile). In other words, for each year and foreach age/gender, the age-related expenditureprofile is shifted outwards – i.e. providingmodified values of cost per capita, which arethen applied in the same manner as the puredemographic scenario described above to theprojected population. The outward shift in theage-related expenditure profile is directlyproportional to the increase in life expectancyfor each cohort.
60 The dynamic equilibrium hypothesis posits that thepostponement of death to higher ages due to fallingmortality is accompanied by a parallel postponement ofmorbidity and/or disability. Consequently, healthy lifeexpectancy grows at the same rate as total life expectancyand the number of years spent in bad health remains thesame. The term ‘dynamic equilibrium’ is meant to capturethe overall changes in life expectancy and severe disability.
First, the change in life expectancy in relation tothe base year is found for each year of theprojections (for example, total life expectancyfor a 50-year-old man in Austria is expected toincrease from 29.15 years in 2004 to 33.07 yearsin 2030, thus by 3.92 years)61:
Δeg,a,n = eg,a,n − eg,a,2007 [5]
where:
eg, a, n is life expectancy of an average person of agiven gender g and age a in year n.
Second, for each year of projection, the respectivereference age on the original age profile curve isobtained by subtracting the change in lifeexpectancy from the concerned age cohort.62 Thisis done only for those sections of the age-profilewhere the cost per capita is growing63 (forexample for the age cohort of 50 years-old, thevalue of cost per capita for that age in 2030 willbe the same as the value of cost per capita for theage cohort of 50-3.92 = 46.08 ≈ 46.1 years in2007).
61 In the constant health scenario the total number of yearsspent in bad health during a person’s life time is assumed toremain the same while life expectancy increases, so themorbidity rate must evolve in line with mortality rate foreach age cohort. Thus, if between time t and t+1, total lifeexpectancy increases by n years for a cohort of age x,healthy life expectancy for that very same age cohort mustalso increase by n years in order for the dynamicequilibrium hypothesis to be valid. If healthy lifeexpectancy increases by n years, then the health status (andconsequently health care spending) of this cohort of age xat time t+1 will be the same as the health status (and healthcare spending) of cohort of age x-n at time t.62 Changes in life expectancy and therefore shifts in theage profile from one year to another are sometimes verysmall (in a range of a tenth part of a year). However, thedata gathered by the Member States does not providedetailed information on costs per capita by single year ofage (the most detailed item available is a 5-year average),so an additional calculation needs to be performed. Tosolve this problem, the intermediate values can be obtainedby simple extrapolation/trend-smoothening method fromthe existing average figures. This way it is possible toassign a concrete value of cost per capita to each tenth partof a year of age.63 For the young and the oldest old the reference ageremains the same over the whole projection period.

149
PARt II — Age-related expenditure items: coverage, projection methodologies and data sources
Third, the precise value of cost per capitaassigned to that reference age is picked up:
cg,a,n = cg,a−Δ eg, a, n ,2007 [6]
where:
cg, a, n is cost per capita assigned to a person of agiven gender g and age a in a given year n of theprojection period;
cg, a-Δeg,a,n, 2007 is cost per capita assigned to a personof a given gender and age a-Δeg,a,n (specified witha precision to a decimal part of a year) in thebase year (2007).
Fourth, the resulting value of cost per capita isused as an input value to the basic calculationspresented earlier in equations [1] – [4].
7.2.4. Death-related costs scenario
Death-related costs scenario links health carespending to years of remaining life. There isstrong empirical evidence that a large share oftotal spending on health care during a person’slife is concentrated in the final year(s) of life.64
Based on figures provided by the nationalauthorities and complemented with someadditional scientific data, a profile of ‘death-related’ costs by age is constructed, with unitcosts differentiated between decedents (thosewho die within a calendar year) and survivors.Then two separate profiles are applied to twogroups of population calculated using mortalityrates.
formal illustration
The methodology to calculate spending on healthcare taking into account the number of remainingyears of life is a further improvement of themethodology used in the pure demographicscenario. The difference lies in the way the unitcost of health care is calculated.
In the death-related costs scenario, the populationof each gender and year of age is divided intosubgroups according to the number of remainingyears of life using mortality rate as a weightingfactor (e.g. number of people aged n expected todie within two years from year t is calculated aspopulation aged n in year t multiplied by the
64 For an overview of empirical studies, see Raitano(2006).
probability of dying within two years which isexpressed as: probability of surviving year t bypersons aged n times probability of survivingyear t+1 by persons aged n+1 times probabilityof dying in year t+2 by persons aged n+2).
Each subgroup is assigned a different unit cost,being an adjustment of the ‘normal’ unit costwith the ratio of health care expenditure borneby a person of a given age and gender who is inher terminal phase of life to health careexpenditure borne by a survivor. The number ofpeople in each subgroup is thus multiplied by itsrespective cost per capita which gives totalspending of each subgroup and the sum of totalspending borne by the subgroups is totalspending on health care in a given year.
In a formalised way, the methodology can bepresented as follows.
First, the total population of each gender andage is divided into subgroups, according to thenumber of remaining years of life. Consequently,there are z subgroups of decedents (those whoare going to die within 0, or 1, or 2, …, orz years) and one group of survivors (those whoare going to survive the zth year). In order toobtain the size of each subgroup, the probabilityof dying in each gender, age and year ofprojection period are calculated.
The probability that a person of gender g and agea will die in the xth year after a given year n canbe expressed by the following equation:
dg,a,n,x = (1− Mg,a+ i,n+ i) ⋅ Mg,a+x,n+xi= 0
x−1
∏ [7]
where:
Mg,a+ i,n+ i is the mortality rate of people ofgender g aged a+i in the ith year after given yearn and: x ∈ (0,1,2...z)
where z is the highest number of years consideredas time ‘close to death’ and for which data oncosts is available.
The probability that a person of gender g and agea in a given year n will survive zth year can beexpressed in a following way:
sg,a,n = (1− Mg,a+ i,n+ i)i= 0
z
∏ [8]

150
European Economy 7/2008the 2009 Ageing Report: Underlying assumptions and projection methodologies for the EU-27 Member states
So, number of persons of a given gender g andage a who are going to die in xth year from agiven year n can be expressed in the followingway:
Ndg,a,n,x = dg,a,n,x ⋅ pg,a,n [9]
where:
pg,a,n is projected population of a given genderg and age a in a given year n
The number of those who are going to survive xth
year is:
Nsg,a,n = sg,a,n ⋅ pg,a,n [10]
Second, the unit health care cost of each personin a population is calculated. Contrary to theusual approach, per capita cost is not the samefor all the individuals, but varies depending onwhether a person is in her terminal phase of life.One must find the cost per capita of a person ofa given gender g and age a, who is going to diewithin x years’ time from a given year n, as wellas the cost per capita of a person of the samegender g and age a surviving the xth year.
The ratio between the two costs is taken as theinput data from the country-specific informationand background studies and may be expressedas:
fg,a,x =cdg,a,x
csg,a[11]
where:
cdg,a,x is health care cost per capita of a personof a given gender g and age a dying in the xth
year from the current year;
csg,a is health care cost per capita of a person ofthe same gender g and age a surviving the periodconsidered as time ‘close to death’ from thecurrent year.
To obtain the two costs, one must use the averagecost per capita of a person of a given gender gand age a as given in the ‘age-related expenditureprofiles’provided to theAWG byMember States.It may be defined as an average of the per capitacosts borne by all the subgroups of decedentsand survivors, weighted by the size of eachsubgroup:
cg,a =
cdg,a,x ⋅ Ndg,a,x,2007 + csg,a ⋅ Nsg,a,2007x= 0
z
∑pg,a,2007
[12]
It must be borne in mind that the unit costs ofdecedents and survivors are calculated for thebase year 2007 (thus index 2007 used in theequations) and are kept constant over the wholeprojection period.
Substituting for cdg,a,x using [11], one gets:
cg,a =
fg,a,x ⋅ csg,a ⋅ Ndg,a,x,2007 + csg,a ⋅ Nsg,a,2007x= 0
z
∑pg,a,2007
[13]
or:
cg,a =
csg,a fg,a,x ⋅ Ndg,a,x,2007 + Nsg,a,2007x= 0
z
∑⎛
⎝⎜
⎞
⎠⎟
pg,a,2007[13a]
This way, both csg,a and – coming back toequation [12] – cdg,a,x can be calculated:
csg,a =cg,a ⋅ pg,a,2007
fg,a,x ⋅ Ndg,a,x,2007 + Nsg,a,2007x= 0
z
∑[14]
cdg,a,x = fg,a,x ⋅cg,a ⋅ pg,a,2007
fg,a,x ⋅ Ndg,a,x,2007 + Nsg,a,2007x= 0
z
∑[15]
As in pure demographic scenario and scenarioson health status, for the time horizon of theprojection exercise (2007-60) the age-relatedexpenditure profiles (showing the average healthcare spending per capita for each year of age(from 0 to 100 or less, according to dataavailability) are assumed to grow in line with thesame cost assumption, i.e. GDP per capita).Therefore:
cd'g,a,x,n = cdg,a,x,n ⋅ ΔYpc n [16]
where:
cd’g, a, x, n is cost per capita of a person of a givengender g and age a who is going to die within xyears, in a given year n of the projection periodadjusted to the GDP per capita growth;
ΔYpcn is GDP per capita rate growth in year n, asin [2]
The same procedure applies to construct cs’g, a, non the basis of csg, a ,n, i.e. to adjust the per capitacost of the subgroup of survivors.

151
PARt II — Age-related expenditure items: coverage, projection methodologies and data sources
Third, by multiplying the size of each subgroupby its respective cost per capita, the total costcan be calculated. Total expenditure on healthcare borne by those of a given gender g and agea, who are going to die within x years’ time froma given year n can be expressed in the followingway:
edg,a,x,n = Ndg,a,x,n ⋅ cdg,a,x,n [17]
and total expenditure of those of gender g andage a who are going to survive zth year:
esg,a,n = Nsg,a,n ⋅ csg,a,n [18]
Adding total expenditures of all the subgroups(those dying within 0,1,2,…, z years time plusthose surviving zth year) gives total expenditureon health care borne by entire population ofgender g and age a in a given year n:
Eg,a,n = edg,a,n,xx=1
z
∑ + esg,a,n [19]
Finally, total expenditure on health care borneby entire population in a given year n expressedas a share of the country’s GDP is calculated asfollows:
Tn =
Eg,a,na∑
g∑
Yn[20]
7.2.5. Income elasticity scenario
The effect of national and individual income ondemand for health care goods and services is anessential factor driving total spending on healthcare. It can be proxied by applying differentlevels of income elasticities to the basic GDP percapita evolution path. Broadly speaking, incomeelasticity exceeding 1 is an indicator that healthcare is considered by the society as a ‘luxurygood’. However, economic growth and processof real convergence between countries over longterm drive elasticity down towards commonunity level. Based on those theoreticalconsiderations, the income elasticity scenario isidentical to the pure demographic scenarioexcept that the income elasticity of demand isequal to 1.1 in the base year and converges in alinear manner to 1 by the end of projectionhorizon in 2060. The elasticity coefficient at thebeginning of the period has been chosenarbitrarily, although taking account of empiricalevidence on developments in this value overrecent decades.
formal illustration
The projections of health care spending followsimilar methodology as the pure demographicscenario with a change in the way cost per capitais evolving over the projection period. Incomeelasticity is taken into account by replacingequation [1] by the following one:
c'g,a,n = cg,aΔYpc nεn [21]
where:
c’g, a, n is cost per capita of a person of a givengender g and age a in a given year n of theprojection period adjusted to the GDP per capitagrowth;
cg, a is constant cost per capita of a person of agiven gender g and age a;
ΔYpcn is GDP per capita rate growth in year n;
εn is income elasticity of demand, convergingfrom ε2007 in the base year to ε2060 in 2060.Therefore:
εn = ε2007 − (n − 2007) ⋅ ε2007 −ε20602060 − 2007 [22]
In the specific case where income elasticity ofdemand converges from 1.2 in 2004 to 1 in 2060,the value will be the following
εn =1.1− (n − 2007) ⋅ 1.1−12060 − 2007 [22a]
After unit cost has been calculated, the followingequations [3]-[4] do not change.
7.2.6. labour intensity scenario
This scenario is identical to the pure demographicscenario except that costs are assumed to evolvein line with the evolution of GDP per worker.This assumption reflects the argument that healthcare is still a highly labour-intensive sector,where supply side (and more precisely wages)predominates over demand side (illustrated bynational income par capita being the driver ofcosts) in driving expenditure. As wages areprojected to grow faster than GDP per capita,this scenario provides an insight into the effectsof unit costs in the health care sector increasingby more than in the economy as a whole. Tobe fully neutral, the scenario needs extraassumptions to be done: wages in the health care

152
European Economy 7/2008the 2009 Ageing Report: Underlying assumptions and projection methodologies for the EU-27 Member states
sector (on which there is no reliable dataavailable) must evolve in line with wages in theeconomy as a whole which, in turn, must followstrictly the evolution of labour productivity(GDP per worker).
formal illustration
The only difference between this scenario andpure demographic scenario is the change in thedevelopment pattern of unit costs. GDP percapita is replaced by GDP per worker, thusequation [1] takes the following form:
c'g,a,n = cg,aΔYpw n [23]
where:
ΔYpwn is GDP per worker rate growth in year n,
ΔYpw n =Yn
wg,a,n∑−
Yn−1wg,a,n−1∑
⎛
⎝⎜⎜
⎞
⎠⎟⎟ / Yn−1
wg,a,n−1∑
⎛
⎝⎜⎜
⎞
⎠⎟⎟ [24]
wg, a, n is the projected number of people employedof a given gender g and age a in a given year n.
The following equations [3]-[4] do not change.
7.2.7. EU12 cost convergence scenario
This scenario presents a different way to modelthe real convergence process expected to takeplace in the EU over medium-to-longer term. Itassumes that the unit costs of health careprovision in the individual EU12 Member Statesevolve over time to reach the average EU15 coststructure, in addition to the usual yearly evolutiondriven by growth in the national income percapita.
formal illustration
The projections of health care spending followsimilar methodology as the pure demographicscenario with a change in the way cost per capitais evolving over the projection period. Realconvergence between EU15 and RAMS12countries is assumed by replacing equation [1]by the following one:
c'g,a,n = cg,aΔYpc n fn [25]
where:
c’g, a, n is cost per capita of a person of a givengender g and age a in a given year n of the
projection period adjusted to the GDP per capitagrowth;
cg, a is constant cost per capita of a person of agiven gender g and age a;
ΔYpcn is GDP per capita rate growth in year n;
fn is a hypothetical rate of growth of unweightedaverage EU12 unit cost (calculated in the baseyear) in a given year n with respect to the baseyear if it was to converge to unweighted averageEU15 level by 2060 (calculated in the base year).Therefore:
fn = (n − 2007) ⋅ cg,a,EU15 − cg,a,RAMS12
2060 − 2007[26]
where:
cg,a,EU15 is unweighted EU15 average cost percapita of a given gender g and age a calculatedin the base year;
cg,a,RAMS12 is unweighted RAMS12 averagecost per capita of a given gender g and age acalculated in the base year.
After unit cost has been calculated the followingequations [3]-[4] apply unchanged.
7.3. dAtA sources
An important quality improvement in comparisonwith the previous rounds of projections is relatedto the enhanced comparability of the input datawhich comes mainly from the commonly agreeddatabases of the international organisations, suchas Eurostat, OECD and WHO. This way, the useof common classifications and definitions isassured and individual interpretations of the datareduced to a necessary minimum.
The data required to successfully run theprojection exercise in the field of health careinclude:
• public expenditure on health care;
• per capita public spending on health care(so-called ‘age profiles of expenditure’)decomposed by gender and age cohorts;
• per capita public spending on health caredecomposed by the number of remaining

153
PARt II — Age-related expenditure items: coverage, projection methodologies and data sources
years of life (required to run the death-relatedcosts scenarios).
The data-collection procedure has included twosteps. First, the Commission prepared a list ofdata required to perform the exercise, made anoverview of existing common internationaldatabases managed by international organisations(mainly Eurostat, OECD and WHO) and gatheredthe figures which are available there. Then aquestionnaire with all required data was preparedand pre-filled with figures coming from thosedatabases. The questionnaire was then circulatedto the Member States which were asked toendorse the pre-filled figures and complementthe data missing from the common databases.Such completed questionnaires were used as astarting point for calculations.
Public expenditure on (acute) health care isdefined according to the System of HealthAccounts classification as expenditure financedby general government (HF1) devoted to thefollowing health care functions:
• services of curative care (HC.1);
• services of rehabilitative care (HC.2);
• ancillary services to health care (HC.4);
• medical goods dispensed to outpatients(HC.5);
• prevention and public health services(HC.6);
• health administration and health insurance(HC.7); plus,
• investment in medical facilities (HC.R.1),
the latter is classified as a health-relatedfunction.
Such definition includes current expenditure onhealth care (HC.1-HC.7), except for the servicesof long-term nursing care (HC.3), and investmentin medical facilities (HC.R.1). Given thatEurostat database does not include capitalinvestment, the questionnaire splits total healthcare expenditure into two separate items to becompleted by the countries for which the data oninvestment are missing. In order to avoid double-counting, while reporting the investment figures,Member States should verify if they have not
been included in the items of current expenditurefollowing a depreciation principle.
The figures on public expenditure on health careare available in two separate databases, whichpartly differ but are compatible to each othergiven common collection methodology (data isclassified according to the System of HealthAccounts, established jointly by the OECD, WHOand Eurostat): 1) Eurostat database available atNewCronos Website, containing information onthe health expenditure collected following theJoint Questionnaire65, and 2) parallel OECDdatabase ‘OECD Health Data’66.
The data in both datasets are compatible to eachother given the same methodological principles,but differ in geographical coverage, precision ofclassification and specific items being available.Therefore, in order to obtain the figures neededto run the projection exercise, the AWG agreedthat a combination of the two databases will bethe (second) best solution.
The Eurostat database currently includes data for16 EU Member States only (BG, BE, CZ, DK,DE, EE, ES, FR, CY, LT, LU, NL, PL, PT, RO,SI), due to the validation process not beingcompleted in the other countries. The datacurrently available in the Eurostat databasecovers three years of observations: 2003, 2004and 2005.
On the other hand, the OECD Health Dataincludes only OECD members, while eight EUMember States not being at the same time OECDmembers (BG, EE, LV, LT, HU, MT, RO, and SI)are not covered. Among the OECD memberstates, four countries (GR, IE, IT, UK) haveprovided only aggregate expenditure on health,without specifying spending on (acute) healthcare and long-term care. To estimate the sharesof the two components for those four countries,ESSPROS data served as a proxy. Data from SEwas collected following a slightly different non-SHA methodology, but the OECD has put effortsto assure the largest possible comparability
65 Available on-line at: http://epp.eurostat.ec.europa.eu/pls/portal/url/page/PGP_QUEEN/PGE_QUEEN_TREE?screen=welcomeref&open=/&product=EU_MASTER_health&depth=2 (go to ‘Public Health’, and ‘Health CareExpenditure’)66 The most recent version CD-ROM “OECD Health Data2008”, or available on-line at: http://www.ecosante.org/index2.php?base=OCDE&langh=ENG&langs=ENG&sessionid

154
European Economy 7/2008the 2009 Ageing Report: Underlying assumptions and projection methodologies for the EU-27 Member states
between the two classifications. OECD databasecovers, in most cases, years up to 2007.
Further data, in particular per capita publicspending on health care (so-called ‘age profilesof expenditure’) decomposed by gender and agecohorts, and per capita public spending on healthcare decomposed by the number of remainingyears of life (required to run the ‘death-relatedcosts’ scenarios), not being available in anycommon databases, were provided exclusivelyby AWG delegates.

155
PARt II — Age-related expenditure items: coverage, projection methodologies and data sources
8.1. short overvieW of the projectionMethodology
The long-term care projection methodology isbased on a simple macro simulation model. Theapproach aims to maximise the number of factorsaffecting future long-term care expenditure thatcan be examined, while making sure that theprojections can be carried out using mostly macro-level data so as to ensure that a large number ofMember States can be included in the projections.Specifically, the methodology aims at analysingthe impact of changes in the assumptions about:
• the future numbers of elderly people (throughchanges in the population projections used);
• the future numbers of dependent elderlypeople (by making changes to the prevalencerates of dependency);
• the balance between formal and informalcare provision (due to a given shift in demandor to exogenous changes in the availability ofinformal carers resulting from socio-demographic processes);
• the balance between home (domiciliary) careand institutional care within the formal caresystem;
• the cost of a unit of care.
Graph 8.1 below provides an overview of themodel structure.
step 1
Taking the baseline population projection (by ageand gender), a projection is made of the dependentpopulation, who are assumed to need some formof long-term care service, and the non-dependentpopulation who are assumed not to be in need oflong-term care services. This is made by applyingage and gender-specific dependency ratios in thebase year (estimated using existing indicators ofdisability from comparable sources: SHAREsurvey, Survey of Income and Living Conditions)to the baseline population projection. It is worthstressing at this point the difference between theterms “dependency” and “disability”. The term“disability” refers to some functional impairmentof an individual. The term “dependent” refers to
the share of the population having some disabilitywhich requires the provision of a care service.There are many people with some form ofdisability who can lead completely independentlives without the need for care services. Morespecifically, the projections make use of theconcept of ADL-dependency which refers todifficulties in performing at least one Activity ofDaily Living (ADL).67
step 2
This step relates to splitting, by age and gender,the dependent elderly population into three groupsdepending on the type of care they receive,namely (i) informal care (provided by familymembers, friends, neighbours, etc. or purchasedwith a person’s own financial resources), which isassumed to have no impact on public spending,(ii) formal care at home and (iii) formal care ininstitutions (both of which impact on publicspending but their unit costs may differ). Themodel implicitly assumes that all those receivinghome care or institutional care have difficultieswith one or more ADLs, and that all personsdeemed ADL-dependent either receive informalcare, home care or institutional care. The split bytype of care received is made by calculating the“probability of receiving different types of long-term care by age and gender”. This is calculatedfor a base year using data on the numbers ofpeople with dependency (projected in step 1), andthe numbers of people receiving formal care athome and in institutions (provided by MemberStates). Given lack of information on actualprovision of informal care it is considered as adefault category by assuming that the differencebetween the total number of dependent peopleand the total number of people receiving formalcare (at home or in institutions) is the number ofpeople who rely exclusively on informal care.
67 Activities of Daily Living (ADL) are the things peoplenormally do in daily living including any daily activity theyperform for self-care (such as feeding ourselves, bathing,dressing, grooming), work, homemaking and leisure (see:Webster’s New World Medical Dictionary, WileyPublishing, 2008). If a person has difficulty in performingat least one of them, he is considered as ADL-dependent.
8. lONG tERM CARE
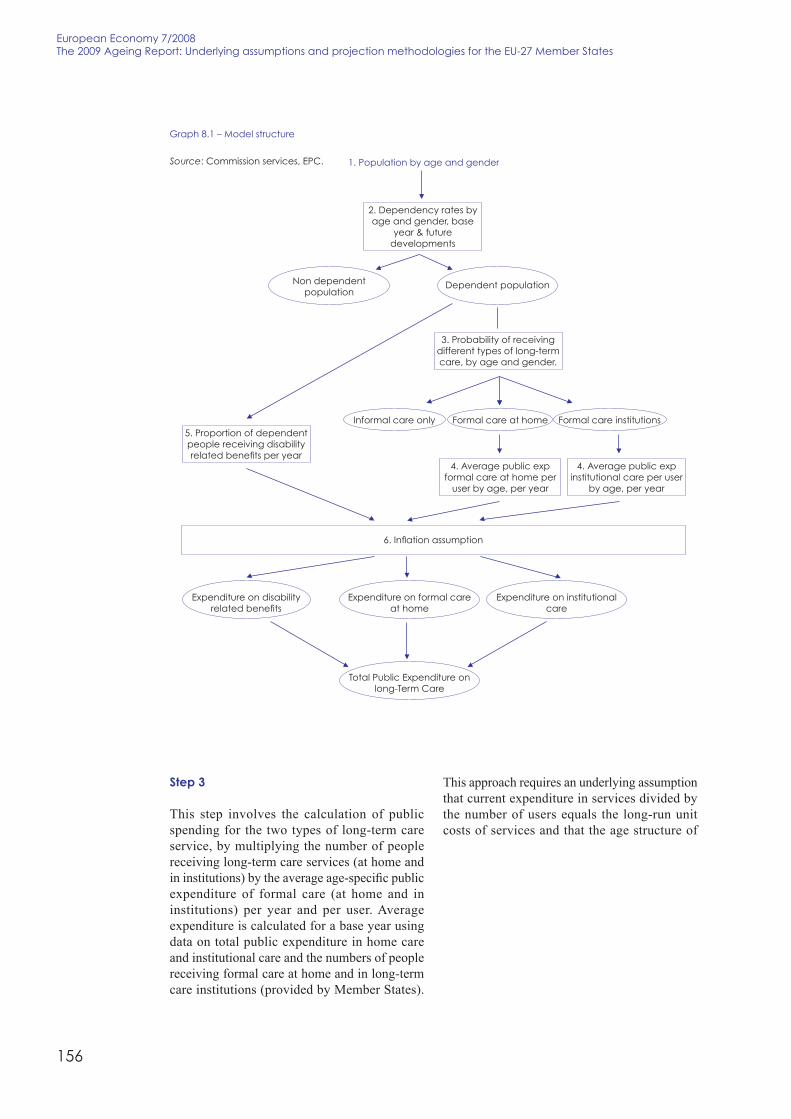
156
European Economy 7/2008the 2009 Ageing Report: Underlying assumptions and projection methodologies for the EU-27 Member states
step 3
This step involves the calculation of publicspending for the two types of long-term careservice, by multiplying the number of peoplereceiving long-term care services (at home andin institutions) by the average age-specific publicexpenditure of formal care (at home and ininstitutions) per year and per user. Averageexpenditure is calculated for a base year usingdata on total public expenditure in home careand institutional care and the numbers of peoplereceiving formal care at home and in long-termcare institutions (provided by Member States).
This approach requires an underlying assumptionthat current expenditure in services divided bythe number of users equals the long-run unitcosts of services and that the age structure of
Graph 8.1 – Model structure
Source: Commission services, EPC. 1. Population by age and gender
Non dependentpopulation
Informal care only
6. Inflation assumption
Formal care at home
4. Average public expformal care at home per
user by age, per year
4. Average public expinstitutional care per user
by age, per year
Formal care institutions
Dependent population
3. Probability of receivingdifferent types of long-termcare, by age and gender.
2. Dependency rates byage and gender, base
year & futuredevelopments
5. Proportion of dependentpeople receiving disabilityrelated benefits per year
Expenditure on disabilityrelated benefits
Expenditure on formal careat home
total Public Expenditure onlong-term Care
Expenditure on institutionalcare

157
PARt II — Age-related expenditure items: coverage, projection methodologies and data sources
long-term care expenditure is the same for bothtypes of care.68
step 4
By adding up the expenditure on formal care athome and in institutions, total public expenditureon long-term care services is obtained. Publicexpenditure on cash benefits for people withADL-dependency is then added to theexpenditure on services, in order to obtain totalpublic expenditure on long-term care. Note thatcash benefits are assumed to grow in line withthe numbers of people with dependency.
Overall, given the availability of a numericalmeasure of disability, the projection methodologydescribed above is more precise than that used inhealth care projections where there is no directindicator of health status and the age-relatedexpenditure profile is used as a proxy. However,an important caveat to stress is that whiledependency rates are an indicator of the need forcare, those needs may not necessarily translateinto actual public expenditure, as most long-termcare is provided by unpaid informal carers.Expenditure profiles contain information about
68 In practice, average expenditure (aged 65 and above), foreach type of service, is decomposed into averageexpenditure by age groups, by assuming the same rate ofincrease in spending by age as in the age-related expenditureprofile. It is important to note that the age-relatedexpenditure profile provides information on spending informal care by age, without distinction between careprovided at home and in institutions. The model usesaverage public expenditure in formal care and in institutionalcare to project future expenditure in both types of services.
the propensity to receive (paid) formal care,which depends on a number of factors other thandependency that affect demand for paid care suchas household type, availability of informal carers,income or housing situation. Most of thesefactors, in turn, are also correlated with age.
8.2. scenArios cArried out in theprojection exercise
The advantage of the methodology describedabove is that it allows one to examine differentscenarios regarding the evolution of dependencyrates, unit costs and policy settings.
Consequently, similarly to the health careprojection exercise, a series of scenariosanalysing separate impact of several factors andpossible policy changes will be performed. TheAWG and EPC envisage choosing a baselinescenario for long-term care expenditure inconnection with the release of the final AgeingReport with the budgetary projections, as wasthe case in the 2006 Ageing Report. The overviewof the scenarios is presented in Table 8.1 below.
8.2.1. Pure demographic scenario
table 8.1 – Overview different scenarios to project long-term care expenditure
Puredemographic
scenario
High lifeexpectancy
scenario
Constantdisabilityscenario
Demand drivenspendingscenario
Shift frominformal toformal care
Labour market/family structure
scenario
Convergencescenario
Populationprojection
Europop 2008 Alternativehigh life
expectancyscenario
Europop 2008 Europop 2008 Europop 2008 Europop 2008 Europop 2008
Age-relatedexpenditureprofiles
Base yearprofiles held
constant overprojection
period
Base yearprofiles held
constant overprojection
period
Base year ageprofile shifting
according tochanges inage-specific
life expectancy
Base yearprofiles held
constant overprojection
period
Base yearprofiles held
constant overprojection
period
Base yearprofiles held
constant overprojection
period
Base yearprofiles held
constant overprojection
period
Policy setting- probabilityof receivingformal/informal care
Probability ofreceiving careheld constant
at base yearlevel
Probability ofreceiving careheld constant
at base yearlevel
Probability ofreceiving careheld constant
at base yearlevel
Probability ofreceiving careheld constant
at base yearlevel
Gradualdecrease innumber of
personsreceiving
informal careover the first
ten years of theprojection
period;respectiveincrease innumber of
personsreceiving
formal care athome and/or in
institutions
Probability ofreceiving
informal careevolving
according tothe availabilityof spouses and
children;respective
change in theprovision offormal care
Probability ofreceiving
formal careand/or cashbenefits
convergingfrom base year
level to fullcoverage
Unit costs GDP perworker
GDP perworker
GDP perworker
GDP per capita GDP perworker
GDP perworker
GDP perworker
Source: Commission services, EPC.

158
European Economy 7/2008the 2009 Ageing Report: Underlying assumptions and projection methodologies for the EU-27 Member states
The pure demographic scenario assumes that theshares of the older disabled population whoreceive either informal care, formal care at homeor institutional care are kept constant over theprojection period and applies those constantshares to the projected changes in the dependentpopulation. The latter evolves precisely in linewith total elderly population, as also theprevalence of ADL-dependency is keptunchanged over the projection horizon, i.e. therates used in future years are the same as thosein the base year. This implies that in practice allgains in life expectancy are spent in bad health/with disability. Arguably, it is a pessimisticscenario with respect to disability status, since itassumes that average lifetime consumption oflong-term care services will increase over time.It is a “no policy change scenario” as theprobability of receiving care (either at home orin an institution) is assumed to remain constantat the 2007 level. While in the above-mentionedelements the scenario is similar to the analogousscenario for health care expenditure, it featuresa significant difference as far as the main driverof costs is concerned. Given currentlypredominating deficit of formal care provisionand its highly labour-intensive character, publicexpenditure seems supply- rather than demand-driven. For that reason, GDP per worker (whichis assumed to reflect changes in the labourproductivity and, at the same time, wageevolution in the care sector), rather than GDP percapita has been chosen as the main driver of unitcosts.
8.2.2. High life expectancy scenario
High life expectancy scenario presents thebudgetary effects of an alternative demographicscenario which assumes life expectancy to behigher for all ages than in the baseline scenario(for details see section 5). In terms ofmethodology, the scenario does not differ frompure demographic scenario, apart the fact thatthe baseline demographic projections (structureof the population evolving over the projectionperiod as well as the consequent evolution in themacroeconomic assumptions) used as input dataare replaced with the alternative, high lifeexpectancy, variant.
8.2.3. Constant disability scenario
This scenario reflects an alternative assumptionabout trends in age-specific ADL-dependencyrates. Being inspired by the dynamic equilibrium
hypothesis, it is analogous to the constant healthscenario performed in the framework of healthcare expenditure projections. The profile of age-specific disability rates shifts in line with changesin life expectancy (disability rate in the future isequal to that of a younger – by the same numberof years as the change in age-specific lifeexpectancy – age cohort today), resulting in agradual decrease over time in disabilityprevalence for each age cohort.
8.2.4. Demand-driven spending scenario
This scenario is identical to the pure demographicscenario, except that costs are assumed to evolvein line with GDP per capita instead of GDP perworker. It illustrates a hypothesis according towhich changes in the long-term care provisionare mainly demand-driven, and the governmentflexibly responds to the higher social expectationsto provide more publicly financed care in linewith general increase in the national income.
8.2.5. scenario assessing the effect of a shiftfrom informal to formal care
This policy-change scenario is run to assess theimpact of a given increase in the (public)provision of formal care replacing care providedin informal setting. In particular, this sensitivitytest examines the budgetary impact of aprogressive shift into the formal sector of care of1% of disabled elderly who have so far receivedonly informal care per year. This extra shift takesplace during ten first years of the projectionperiod only, thus it sums up to about 10.5% shiftfrom informal to formal care. Three alternativeoptions are envisaged: (a) all ‘new’ beneficiariesmove into institutional care and nobody intohome care; (b) everybody moves into home careand nobody into institutional care; (c) half moveto home and half to institutional care.
8.2.6. labour market / family structurescenario
This scenario is based on the assumption thatcurrent demographic, social and educationalchanges in the structure of society will result ina reduction in the amount of informal careavailable to elderly dependent people. It usesempirical information on the share of informalcare provided by spouses, children and otherpeople; expected changes in the family structuredue to demographic developments (narrowinggap between elderly women’s and men’s life

159
PARt II — Age-related expenditure items: coverage, projection methodologies and data sources
expectancy); and projected labour marketdevelopments (growing activity rates of womenbeing currently the main informal care providers,shift from full-time to part-time working pattern).Assuming that the resulting deficit of informalcarers will be fully compensated by the increasedpublic provision of formal care, the scenarioexamines the effect of those changes on publicspending.
8.2.7. scenario assessing the budgetaryeffect of a convergence in formal carecoverage
This scenario assumes that the real convergenceacross Member States, the exchange of bestpractices and growing expectations of thepopulations will drive an expansion of publiclyfinanced formal care provision into the groups ofpopulation that have not been covered by thepublic programmes so far. Given that it isdifficult in practical terms to define an optimallevel of LTC coverage for a Member State, anumber of options can be considered to serve as‘best practice’ or a ‘target level’ of long-termcare provision to be reached over the long termin all Member States. Similarly to the scenariosassessing the effect of a shift from informal toformal care, this scenario should be alsoconsidered as a policy-change scenario, as itassumes a considerable shift in the current LTCprovision policy.
8.3. dAtA sources
As in the case of health care, in order to assurebest possible comparability of data used in theprojections, it has been agreed to use as much aspossible the definitions agreed at the internationallevel and the figures available in the databasesconstructed on the basis of those definitions andclassifications. Therefore, most input data comesfrom the databases established in the frameworkof the international organisations, such asEurostat, OECD and WHO.
The data required to successfully perform theprojection exercise in the field of long-term careinclude:
• public expenditure on long-term care;
• split of public long-term care expenditureinto spending on LTC services in kind andcash benefits;
• split of public expenditure on LTC servicesin kind into institutional and home care;
• per capita public spending on long-term care(so-called ‘age profiles of expenditure’)decomposed by gender and age cohorts;
• number of beneficiaries of long-term careservices provided at home and in institutions,as well as recipients of LTC-related cashbenefits;
• disability/dependency rates.
The data collecting procedure covers the samesteps as for health care (see section 7.3 above),with the same questionnaire being used to reportthe data required for both health and long-termcare expenditure projections.
The following sections describe shortly the dataavailable in the common databases (publicexpenditure on long-term care, split betweenservices in kind and cash benefits, split betweeninstitutional and home care, disability rates),which were used to pre-fill the questionnairescirculated to the Member States. The remainingitems (age profiles of long-term care, number ofLTC beneficiaries and cash benefits recipients)were provided directly and exclusively by theMember States, as they do not exist in anycommonly agreed databases.
8.3.1. Public expenditure on long-term care
Public expenditure on long-term care is defined,according to the System of Health Accountsclassification, as the sum of publicly financed(HF1) items:
• services of long-term nursing care (HC.3)(which is also called ‘the medical componentof long-term care’ or ‘long-term health care’),and
• social services of long-term care (HC.R.6.1),which is the part of ‘administration andprovision of social services in kind to assistliving with disease and impairment’ (HC.R.6)that covers ‘a range of services of careassistance aimed predominantly at providinghelp with instrumental activities of daily living(IADL) restrictions to persons with limitedability to perform these tasks on their own’.

160
European Economy 7/2008the 2009 Ageing Report: Underlying assumptions and projection methodologies for the EU-27 Member states
Medical component of long-term care (HC.3) isa range of services required by persons with areduced degree of functional capacity, physicalor cognitive, and who are consequently dependenton help with basic activities of daily living(ADL), such as bathing, dressing, eating, gettingin and out of bed or chair, moving around andusing the bathroom. The underlying physical ormental disability can be the consequence ofchronic illness, frailty in old age, mentalretardation or other limitations of mentalfunctioning and/or cognitive capacity. In addition,help with monitoring status of patients in order toavoid further worsening of ADL status.
This main personal care component is frequentlyprovided in combination with help with basicmedical services such as help with wound dressing,pain management, medication, health monitoring,prevention, rehabilitation or services of palliativecare. Depending on the setting in which long-termcare is provided and/or national programmedesign, long-term care services can include lower-level care of home help or help with instrumentalactivities of daily living (IADL) more generally,such as help with activities of housework, meals,shopping, transport and social activities.
The notion of long-term health care servicesusually refers to services delivered over asustained period of time, sometimes defined aslasting at least six months.69
Social services of long term care (HC.R.6.1)comprise services of home help and residentialcare services: care assistance which arepredominantly aimed at providing help withIADL restrictions to persons with functionallimitations and a limited ability to perform thesetasks on their own without substantial assistance,including supporting residential services (inassisted living facilities and the like).
As in the case of health care, the figures onpublic expenditure on long-term care areavailable in two separate databases: EUROSTATdatabase available at NewCronos Website and aparallel OECD database ‘OECD Health Data’(for details see section 7.3 above).
69 For more details, see: OECD (2006), Costs of Care forElderly Populations. Guidelines for estimating long-termcare expenditure, DELSA/HEA/DIS(2006)4, 14 February2006, pp.9-11.
8.3.2. spending on home vs. institutionalcare
Long-term care is provided in a variety ofsettings. It can be provided at home and in thecommunity, or in various types of institutions,including nursing homes and long-stay hospitals.Mixed forms of residential care and (internallyor externally provided) care services exist in theform of assisted living facilities, shelteredhousing, etc., for which a wide range of nationalarrangements and national labels exist.
Services at home include services provided byexternal home care providers, both public andprivate, in a person’s private home on a long-lasting basis. This includes living arrangements inspecially designed or adapted flats for personswho require help on a regular basis, but where thisliving arrangement still guarantees a high degreeof autonomy and self-control over other aspects ofa person’s private life. Also included are servicesreceived on a day-case basis or in the form ofshort-term stays in institutions, for example in theform of respite care. During these stays, personsare not considered as ‘institutionalised’, but ratherreceiving temporarily services, which supporttheir continued stay at home.70
Services in institutions include services providedto people with moderate to severe functionalrestrictions who live permanently or for anextended period of time (usually for six monthsor longer) in specially designed institutions, orin a hospital-like setting where the predominantservice component is long-term care, althoughthis may frequently be combined with otherservices (basic medical services, help withgetting meals, social activities, etc.). In thesecases, eligibility is often explicitly assessed anddefined by level (severity) of dependency andlevel of care needs.
To estimate the share of expenditure devoted tohome and institutional care, the SHA
70 OECD (2007), Data collection on long-term care(focussing on recipients). Meeting of OECD Health DataNational Correspondents, DELSA/HEA/HD(2007)7, 28September 2007, p.12.

161
PARt II — Age-related expenditure items: coverage, projection methodologies and data sources
classification of health care providers (HP)71 wasused. Following this classification, institutionalcare was computed as the sum of HP.1 (hospitals)and HP.2 (nursing and residential care facilities),while home care would consist of the sum ofHP.3 to HP.9.72
In case the classification of providers (HP) didnot provide satisfactory data, a second optionwas the analysis of the second level classificationof functions of health care (HC), where the‘medical’ component of long-term care (HC.3)is disaggregated into three sub-items: ‘in-patientlong-term nursing care’ (HC.3.1), ‘day cases oflong-term nursing care’ (HC.3.2), and ‘long-term nursing care: home care’ (HC.3.3).
The precise definitions suggest that HC.3.1 andHC.3.2 are types of care that are provided in theinstitutions or in the community facilities (in anycase not at beneficiary’s home), while HC.3.3 isprovided at home. Therefore, if the second-leveldisaggregation of HC.3 is available, those figurescan be used as proxies for institutional and homecare.
Less clear is the issue of the ‘social’ componentof long-term care, as such kind of services canbe provided either at home or in specialinstitutions (nursing homes, rehabilitationcentres, etc.). In case detailed data were missingon that issue, the same split was applied to both‘medical’ and ‘social’ component of LTC.
8.3.3. Public spending on cash benefits
71 This classification distinguishes the following types oflong-term care providers: hospitals (HP.1); nursing andresidential care facilities (HP.2); providers of ambulatoryhealth care (HP.3); retail sale and other providers ofmedical goods (HP.4); provision and administration ofpublic health programmes (HP.5); general healthadministration and insurance (HP.6); other industries(HP.7); rest of the world (HP.9).72 It has therefore been implicitly assumed that ambulatoryhealth care (HP.3) has the characteristics of home care,which may not be the case in some particular cases HP.3includes the following establishments: offices of physicians(HP.3.1); offices of dentists (HP.3.2); offices of other healthpractitioners (HP.3.3); out-patient care centres (HP.3.4);medical and diagnostic laboratories (HP.3.5); providers ofhome health care services (HP.3.6); other providers ofambulatory health care (HP.3.9). Since the specificclassification of long-term care provided in ambulatorysetting depends on particular institutional structure of eachLTC system, the Member States were asked to verify thisassumption together with the whole set of figures.
Public spending on cash benefits is projectedseparately from expenditure on long-term careservices provided ‘in kind’ at home or in theinstitutions. The cash benefits include socialprogrammes offering care allowances introducedin a number of countries in order to allowhouseholds more choice over care decisions, andto support care provided at home. They areaddressed to persons with long-term care needswho live in their own homes. However, thedesign of these programmes varies widely acrosscountries, which reduces the comparabilitybetween them.
At least three types of cash-benefit programmesand/or consumer-choice programmes can bedistinguished:
• personal budgets and consumer-directedemployment of care assistants;
• payments to the person needing care who canspend it as she/he likes, but has to acquiresufficient care;
• payments to informal caregivers as incomesupport.
Given that the System of Health Accountsclassification does not provide information onthe way the general government finances thesocial protection expenditure (thus no divisionbetween services in kind and cash benefits isavailable, although the latter component isincluded in the overall spending), the data fromESSPROS database of general government socialprotection expenditure have been used instead asa best proxy for cash benefits. Given thatESSPROS and SHA classifications are notcompatible, it has been decided not to usedirectly the ESSPROS estimate of LTC cashbenefits, but to calculate the ratio of the twocomponents (services of long-term care supplieddirectly to the patients as in kind benefits andLTC-related cash benefits) on the basis of theESSPROS data and apply it to the aggregatepublic long-term care expenditure as definedaccording to SHA classification.
The proposed split of ESSPROS items classifiedwithin sickness/health care, disability and old-age functions into the SHA items is presented inTable 8.2.

162
European Economy 7/2008the 2009 Ageing Report: Underlying assumptions and projection methodologies for the EU-27 Member states
table 8.2 – suggested correspondence between EssPROs and sHA items
ESSPROS Title of headings ICHA-HC Title of headings HC/LTC*Si
ckne
ss/h
ealth
care
func
tion
Cash benefits: Paid sick leave HC.R.7 Administration and provision ofhealth-related cash benefits
-
Other cash benefits HC.R.7 Administration and provision ofhealth-related cash benefits
-
Benefits in kind: In-patient health care HC.1.1 In-patient curative care HCHC.1.2 Day cases of curative care HCHC.2.1 Inpatient rehabilitative care HCHC.2.2 Day cases of rehabilitative care HCHC.3.1 In-Patient LTC LTC (h)HC.3.2 Day cases of LTC LTC (h)
Out-patient healthcare (including
provision ofpharmaceutical
products)
HC.1.3 Out-patient curative care HCHC.1.4 Services of curative home care HCHC.2.3 Out-patient rehabilitative care HCHC.2.4 Services of rehabilitative home
careHC
HC.3.3 LTC home care LTC (h)HC.4 Ancillary services to health care HCHC.5 Medical goods dispensed to
out-patientsHC
HC.6 Prevention and public healthservices
HC
Other benefits in kind HC.R.6.1 Social services of LTC(LTC other than HC.3)
LTC (s)
Dis
abili
tyfu
nctio
n
Cash benefits: Care allowance HC.R.7 Administration and provision ofhealth-related cash benefits
LTC (cb)
Benefits in kind: Accommodation HC.R.6.1 Social services of LTC(LTC other than HC.3)
LTC (s)
Home help (assistancein carrying out daily
tasks)
HC.R.6.1 or HC.3.3 Social services of LTC(LTC other than HC.3)
Long-term nursing care: homecare
LTC (s)or
LTC (h)
Rehabilitation HC.R.6.9 All other services classified underHC.R.6
LTC (s)
Other benefits in kind HC.R.6.9 All other services classified underHC.R.6
LTC (s)
Old
age
Cash benefits: Care allowance HC.R.7 Administration and provision ofhealth-related cash benefits
LTC (cb)
Benefits in kind: Accommodation HC.R.6.1 Social services of LTC(LTC other than HC.3)
LTC (s)
Home help (assistancein carrying out daily
tasks)
HC.R.6.1 or HC.3.3 Social services of LTC(LTC other than HC.3)
Long-term nursing care: homecare
LTC (s)or
LTC (h
Other benefits in kind HC.R.6.9 All other services classified underHC.R.6
LTC (s)
Fam
ily
Cash benefits: Other cash benefits HC.R.7 Administration and provision ofhealth-related cash benefits
-
Benefits in kind: Other benefits in kind HC.6.1 Maternal and child health; familyplanning and counselling
HC
Soci
alex
clus
ion Benefits in kind: Rehabilitation of
alcohol and drugabusers
HC.R.6.1 or HC.2 Social services of LTC(LTC other than HC.3)
Services of rehabilitative care
LTC (s) or HC
Source: Commission services, based on Eurostat (2007), ltC in sHA Framework. work progress on delimitation of ltC.Definitions and boundaries. Presentation provided by D. Kawiorska at the AWG meeting on 18 April 2007.
* the last column reports the correspondence of a given item to health care or long-term care aggregateaccording to the proposed split between the two types of care. HC – health care; ltC (h) – ‘health’ component of
long-term care; LTC (s) – ‘social’ component of long-term care; LTC (cb) – long-term care-related cash benefits

163
PARt II — Age-related expenditure items: coverage, projection methodologies and data sources
Drawing from this correspondence, the ‘social’part of long-term care missing in the OECDHealth Data was calculated as the sum of thefollowing items of ESSPROS classification:‘other benefits in kind’ from sickness/health carefunction plus ‘accommodation’, ‘home help’,‘rehabilitation’ and ‘other benefits in kind’(which make up the entire category of ‘benefitsin kind’) from disability function, plus‘accommodation’, ‘home help’ and ‘otherbenefits in kind’ (which make up the entirecategory of ‘benefits in kind’) from old agefunction73.
At the same time the cash benefits related tolong-term care is the sum of the followingESSPROS items: ‘periodic care allowance’,‘periodic economic integration of thehandicapped’, ‘lump sum care allowance’, ‘lumpsum economic integration of the handicapped’(all being part of ‘cash benefits’) from disabilityfunction and ‘periodic care allowance’ (beingpart of ‘cash benefits’) from old-age function.
8.3.4. Disability rate
The data on the disability rates came from theSHARE survey conducted by a consortium ofuniversities and research institutes in 12 countriesof the EU (AT, DE, SE, NL, ES, IT, FR, DK, GR,BE, CZ, PL), and from the Survey on Incomeand Living Conditions (SILC) conducted by thenational statistical offices and gathered byEurostat.
SHARE database includes information on thepercentage of people with ‘the prevalence of 1+limitations with activities of daily living amongmen and women over 50 years of age’. The datafrom SILC survey provides for the percentage ofpeople in a given age group who ‘are severelyrestricted in activities they usually do because ofhealth problems for at least the last 6 months’.74
In case of the UK, the English LongitudinalStudy of Ageing (ELSA) produces figures thatare fully comparable with the SHAREmethodology. RO and BG not having provided
73 As the item ‘rehabilitation of alcohol and drug abusers’accounts for a minor part of total social spending and is notprovided by many countries, it can be omitted whilecalculating the aggregate.74 More detailed information to be found on SHAREhttp://www.share-roject.org/new_sites/Documentation/variables.pdf and Eurostat http://europa.eu.int/estatref/info/sdds/en/hlth/hlth_index.htm websites.
figures to the SILC questionnaire have beenassigned different measures of disability. In thecase of RO, the data, taken from Health InterviewSurvey (year 2004), indicates the percentage ofpeople in a given age group who have sufferedfrom severe activity restriction in the past6 months. In the case of BG the figures, alsotaken from the Health Interview Survey (year2004), indicate percentage of people who havehad a long-standing illness or health problem.

165
PARt II — Age-related expenditure items: coverage, projection methodologies and data sources
9.1. projecting educAtion expenditure
Among budgetary items to be projected, educationplays a key role. The total level of public educationexpenditure represents between 3.3% and 8.4% ofGDP (5% on average) among EU 27 countries andmay become even more important given itscontribution to the Lisbon strategy objectives. Theoverall assessment of budgetary challenges posedby ageing population warrants a deeper look at thedevelopment of those items of public expendituresin which – as in case of education – there is apotential room for some savings due to thedemographic developments. Indeed, the numberof the youngest will be diminishing due to anumber of social factors (falling fertility rates,postponement of childbearing, changes in thefamily structure, etc.) and in about 20 years timeit will be lower than that of the eldest population,which will probably lead to a decrease in aggregatedemand for and public expenditure on education.
Projecting education expenditure is not an easy taskand there are only few examples available of long-term projections of this budgetary item.75 In makingthe projection, several issues warrant attention andneed preliminary clarification. First, there is no cleardelimitation of what education means and whatactivities should be covered by the projectionexercise. It can encompass only schooling, orinclude pre-primary, tertiary and even adulteducation. Second, being a student or pupil is not anexclusive status, in particular for those above thelegal compulsory education threshold who can optfor different patterns of time management combiningin various proportions education, work and leisure.A final choice from a range of different statusesdepends not only on legislative arrangements butalso on individual decisions and developments inthe labour markets. Third, education expenditurestake different forms. Generally, the public sectorfunds education either by bearing directly the currentand capital expenses of educational institutions(direct expenditure for educational institutions) orby supporting students and their families withscholarships and public loans as well as bytransferring public subsidies for educationalactivities to private firms or non-profit organisations(transfers to private households and firms).
75 A brief overview is included in A. Montanino,B. Przywara and D. Young (2004).
The methodology presented in this chapter buildson the previous projection exercise methodology,extended by some minor changes, and takingadvantage of a considerable improvement in theavailability and quality of the data gathered byEurostat.
9.2. deliMitAtion of the projections
The projections will cover public educationexpenditure for schooling and tertiary education.In particular:
a. Projections will be run for primary (ISCED1), lower secondary (ISCED 2), uppersecondary and post-secondary non-tertiary(ISCED 3 and 4), and tertiary education(ISCED 5 and 6).76 This classification can beused for a specification of compulsoryschooling (ISCED 1 and 2), non-compulsoryschooling (ISCED 3 and 4) and tertiaryeducation (ISCED 5 and 6).77 It should beconsidered that ISCED levels 4 and 6 play amarginal role and often they are assimilatedrespectively to levels 3 and 5. In practice,they will be treated as part of these levels(see Table 9. 1 for the theoretical starting andending age for each education level).
76 The formal definitions of the levels of education coveredby the exercise are: Level 1 is the start of compulsoryeducation (the first stage of basic education), with a legalage of entry usually not lower than five years old andhigher than seven years old. This level covers in principlesix years of full-time schooling. Level 2 is lower secondaryschool (or second stage of basic education). The end of thisstage is usually after nine years of schooling after thebeginning of primary education and often coincides withthe end of the compulsory education. It includes generaleducation as well as pre-vocational or pre-technicaleducation and vocational and technical education. Level 3is upper secondary school and the entry age is typically15 or 16 years old. It also includes vocational and technicaleducation. Level 4 is post-secondary non-tertiary educationand these programmes are typically designed to preparestudents to the following level (university). Level 5 coversat least two years of education and the minimal accessrequirement is the completion of level 3 or 4. Level 6 is acycle of at least 3 full-time years of education leading tothe award of an advanced research qualification. However aMaster course that implies up to 6 years of tertiaryeducation is included in level 5.77 The borders between compulsory and non-compulsoryeducation are not in all cases as clear-cut as the simple ruleof thumb above suggests. For an overview of the legallimits of compulsory education and their overlap with theISCED levels in all EU Member States, see Annex 9.1.
9. EDUCAtION

166
European Economy 7/2008the 2009 Ageing Report: Underlying assumptions and projection methodologies for the EU-27 Member states
b. Projections will include expenditures oneducational institutions from public sources(direct public expenditures) and transfers toprivate households. The former may take twodifferent forms:
• purchases by the government agency itself ofeducational resources to be used byeducational institutions (e.g. direct paymentsof teachers’ salaries by a central or regionaleducation ministry);
• payments by the government agency toeducational insti tutions that haveresponsibility for purchasing educationalresources themselves (e.g. a governmentappropriation or block grant to a university,which the university then uses to compensatestaff and to buy other resources).
The pre-primary education is excluded from theexercise. This component represents on averageless than 0.5% of GDP. The reason to exclude
pre-primary education is that there are seriousdata problems that make it difficult to run reliableprojections. Comparability across countries isalso difficult since the institutional settings ofpre-primary systems are very different andinclude a large share of private institutions.
9.3. projection Methodology
The methodology builds on the previous roundof projections, and benefits from the extensiveEurostat education database which providesdetailed information on all 27 EU Member Stateson enrolment and expenditures in differenteducation levels. The methodology is built to fitwith the kind of available data and a simple two-steps approach can be developed. The first stepis to decompose the key variables for publiceducation expenditure projections – educationper student and number of students – for the baseyear. The decomposition would take into accountthe different underlying variables that affect thetotal number of students in each education leveland the expenditure per student (as wages,
table 9.1 – theoretical starting and ending age for level education
ISCED-97 Levels of education
Level 1 Level 2 Level 3 Level 5 Level 6BE 6-11 12-13 14-18 19-21 22-23+BG 7-10 11-14 15-181 19-23 24-26CZ 6-10 11-14 15-18 19-23 24-26DK 7-12 13-16 17-19 20-24 28-29DE 6-10 11-16 17-19 20-25 26-28EE 7-12 13-15 16-18 19-23 24-26GR 6-11 12-15 16-17 18-24 24-26ES 6-11 12-15 16-17 18-23 24-28FR 6-10 11-14 15-18 19-22 23-26IE 4-12 13-15 16-18 19-23 24-27IT 6-10 11-13 14-18 19-23 24-31CY 6-11 12-14 15-18 19-23 23-28LV 7-10 11-15 16-18 19-24 25-28LT 7-10 11-15 16-18 19-24 25-28LU 6-11 12-15 16-18 19-23 n.a.HU 6-9 10-13 14-17 18-23 24-30MT 5-10 11-15 16-18 19-24 25-32NL 6-11 12-15 16-19 20-22 23-25AT 6-9 10-13 14-17 18-22 23-24PL 7-12 13-14 15-18 19-25 26-34PT 6-11 12-14 15-17 18-22 23-28SI 7-10 11-14 15-18 19-23 24-27SK 6-9 10-14 15-18 19-23 24-26FI 7-12 13-15 16-18 19-24 25-28SE 7-12 13-15 16-19 20-23 23-26UK w5-10 11-13 14-17 18-20 21-23
Source: Eurostat, Commission services
Note: the breakdown is based on the theoretical age andon the current distribution of border ages among the different education levels.
(1) schooling is mandatory in BG till the age of 16.

167
PARt II — Age-related expenditure items: coverage, projection methodologies and data sources
number of teaching and non-teaching staff andthe existence of other current and capitalexpenditures). The base year is the calendaryear 2006 (for financial data) or school/academicyear 2005/2006 (for enrolment and personneldata).
The second step requires assumptions on futuredevelopments of the underlying variables thataffect the number of students and the expenditureper student. Regarding the latter, Eurostatdatabase considers only direct educationexpenditure, i.e. expenditures directly carried outby the government (either national or local) torun public institutions. Transfers to privatehouseholds and firms will be projected using amore mechanistic approach (see below).
In setting the base year and in producing the longterm projections, the different education levelswill be treated separately, to capture the existingdifferences within the education system. Inparticular, differences in the cost structure and inthe interrelations with the labour market.
9.3.1. the base year
number of students and enrolment rates
The number of students (S) in education level xis obtained as:
Sx = Sxy
y=1
100
∑ [1]
i.e. is the sum of the number of students enrolledby age (y) in the specific education level x. Inpractice there is no maximum age-limit to beenrolled in education, in particular for whatconcern higher education. Hence, all ages shouldbe added in each education level to see whethersomeone is enrolled, despite the fact that isbeyond the maximum theoretical age. Althoughthe bulk of students enrolled in a given level ofeducation are within the theoretical age for thislevel, in certain cases there is a substantialnumber of students enrolled with an age that tendto exceed even the theoretical exit age from thespecific education level. In order to take intoaccount these specificities, the enrolment rate iscalculated for two dimensions: per age andeducation level together.
The net enrolment rate by education level x andage y is obtained as:
exy =
Sxy
POP y [2]
where POPy is population of age y.
Conversely, the enrolment rate by age is the sumof the number of students of the specific age (y)in the different education levels as a share oftotal population in age y, i.e.:
e y =
Sxy
x=1
6
∑⎛
⎝⎜
⎞
⎠⎟
POP y [3]
The enrolment rate by age together with theenrolment rates by age and education level areneeded to project future enrolment and thedistribution across education levels of the futurecohorts.
There is a basic difference in the value ofenrolment rate and its drivers betweencompulsory and non-compulsory levels ofeducation which – in most cases – coincide withlevels 1-2 and 3-6 of ISCED classificationrespectively. Given the legally compulsoryeducation concerning all citizens in theEU Member States until a certain age (15-16 years of age) or during a given number ofyears (9-10 years), enrolment rate is supposed toapproximate 100% in the age cohorts statutorilycorresponding to the compulsory educationlevels (in most cases primary and lowersecondary). The deviations from that principleare minor and due mainly to the frictionalmovements from school to school and existenceof a small number of children not enrolled to anyschool. However, after that age (thus generallyfrom upper-secondary education onwards)schooling becomes voluntary and as such analternative to professional work. The uniquestatus of compulsory enrolment is thus replacedby a wider choice of options. In particular, thoseabove 15-16 years old may (i) study full time,(ii) work and study part time, (iii) work full timeor (iv) neither work nor study. Unlike in theprevious round of projections, data available inEurostat database, combining the outcomes ofthe UOE Data Collection78 and the Labour ForceSurvey allow to divide total number of populationin a given age into those four groups. Inparticular, institutional data provided by theUOE data collection includes the number ofstudents in each age and gender (thus alsoenrolment rates), while LFS provides for
78 UNESCO-UIS/OECD/EUROSTAT Data Collection onEducation Statistics. Manual: concepts, definitions andclassifications (2005).

168
European Economy 7/2008the 2009 Ageing Report: Underlying assumptions and projection methodologies for the EU-27 Member states
participation rates as well as the number ofpeople who split their time between working andstudying (part-time students). Based on thatinformation, the number of those who neitherstudy nor work can be calculated as a simplecomplement of the three previous groups:
ey + py − t y + d y =1 [4]
Where:
ey is enrolment rate in a given age cohort (numberof students (both full and part-time) of the age yenrolled in education as a share of the totalpopulation of that age cohort);
py is participation rate in a given age cohort y(size of labour force (including part-time studentswho are also working) as a share of the totalpopulation of that age cohort);
ty is ‘working students’ rate’ of a given age cohorty (number of part-time students who are alsoworking as a share of the total population of thatage cohort);
dy is ‘leisure rate’ in a given age cohort y (numberof those who are neither studying nor working asa share of the total population of that agecohort).
Or, by decomposing ty :
ey + py − c y *ey + d y =1 [5]
cy is the working students ratio in a given agecohort y (ratio of the number of working studentsto the total number of enrolled students of thatage cohort in a given education level);
It is possible to combine the data available acrossage cohorts (enrolment, participation, inactivity)with those available across levels of education asthe calculations are performed in two dimensions:separately for each level of education and thenfor the age cohorts inside each of them.
expenditure per student
Yearly expenditure per student differs widelyacross education levels and across countries. In2004, it ranged from just above €500 (in PPPs)for secondary education in Romania to over€17000 (in PPPs) for tertiary education in
Denmark79. Such a considerable gap reflectsdifferent levels of wages for teaching and non-teaching staff, different student-to-staff ratios, aswell as different levels of investments and othercosts associated with education. In order to giveaccount of these differences and of the role thatthe underlying variables play in setting the unit(per student) cost of education, educationexpenditure per student can be written as:
ESx =TxSx
*Wx +KxSx
[6]
where all variables refer to education level x andwhere:
• T is the total number of teachers and nonteachers staff;
• W are the gross wages and social contributionspaid for school staff;
• K are other costs, current and capital.
• S is the number of students enrolled ineducation level x, obtained through equation1.
The schematic presentation of the implicitdecomposition of expenditure per student ispresented in Graph 9.2.
This decomposition of the expenditure perstudent provides helpful information on thefactors behind the observed level of expenses. Itshould be considered that this decomposition isclearly a simplification of the complexity of thevariables that determine the expenditure perstudent. A key variable seems to be the class size.Costs present discontinuity so that main changesappear when an additional class is created/destroyed. Given the difficulties in having properinformation on this variable, a goodapproximation may be the student-to-staff ratio.It gives an idea of how many resources (teachingand non teaching staff) are provided to thesystem given a certain number of individualsenrolled in education.
Also, wages differ on the basis of the ratiobetween teacher and non-teacher staff, so thatthe higher is the number of teachers relatively tonon-teacher staff, the higher may be the averagesalary. Average wages depend also on the
79 Own calculations based on Eurostat data.

169
PARt II — Age-related expenditure items: coverage, projection methodologies and data sources
seniority of the staff. Other things being equal,the older is the labour force involved in theeducation system, the higher is the currentaverage wage but, at the same time, the trendsmay become more favourable once the older goto pension. Finally, other costs apart from wagesmay vary according to past levels of investment.A high current level may depend on low levelsin the past and may imply low level of spendingalso in the future.
The proposed decomposition would allowapplying different assumptions on the futuretrends of the single underlying variables and thusaddressing the role of the wage setting as well asother institutional factors, such as the capacity ofthe education system to adapt to demographicchanges.
9.3.2. Methodology used in educationprojections
The main purpose of the projections is theassessment of the impact of demographicdevelopments on public expenditure on educationand subsequently on the overall budgetary stancein the EU Member States up to 2060. Apart fromthe pure demographic effect, projections shouldalso take into consideration the projected trendsin the labour market in order to includebehavioural aspects and the developments of theeconomy. It is envisaged to include a baselinescenario and a number of alternative scenarios.The latter will consider the uncertainty behindthe development of several variables: enrolmentrate, unit cost development, staff-to-student ratio,etc. In order to undertake those scenarios,students and expenditures per student will beprojected for each education level. Theaggregation of the results will provide the totalexpenditure in public education.
The schematic model of the projectionmethodology is presented in Graph 9.3.
number of students
Future developments of the number of studentsenrolled in each level of education depend onindividual behaviour, and in particular whethereducation is an alternative to work. Forsimplification purposes, education is consideredcompulsory in levels 1 and 2 of ISCEDclassification. The baseline projection assumesthat net enrolment rates for students in thoselevels of education remain constant at the base
year level. This implies that no behaviouralchanges are projected for those people. In orderto obtain the projected number of studentsenrolled in those levels of education, a two stepapproach is used. First, the total number ofstudents in each age is estimated on the basis ofdemographic developments and the net enrolmentrate in the base year (equation 3). Secondly,students in age x are distributed into the separateeducation levels according to the distribution inthe base year. The alternative scenario considersthat education for all is a key objective in EUpolicies, in particular for compulsory education.Net enrolment rates in compulsory schooling arethen assumed to converge gradually to 100% andthen remain constant.
The projection of the number of students forthose in non-compulsory levels of educationtakes into account labour market developments,and net enrolment rates are not constant. Anincrease in the participation rate in the labourmarket implies, other things being equal, adecrease of the net enrolment rate. Followingthis logic, the net enrolment rate per single age yis projected separately for each level of education(keeping constant the initial distribution ofstudents in each age cohort between differentlevels of education) according to the followingformula:
ey =1− py − d y
1− c y [7]
expenditure per student
As shown by equation [6], expenditure perstudent in each education level depends on threemain variables: (i) the staff to student ratio, (ii)the average wage and (iii) the “other-costs” tostudent ratio. In the baseline scenario, theassumptions for each variable will be thefollowing:
a) the staff-to-student ratio will remain constantover the projection period so that it isexplicitly assumed that the number ofteaching and non teaching staff adjustsimmediately to demographic changes;
b) the average wage is assumed to developaccording to the GDP per worker (labourproductivity) for the whole economy;
c) the “other-costs” to student ratio remains aconstant share of the expenditure per student,so that an increase in the wage component

170
European Economy 7/2008the 2009 Ageing Report: Underlying assumptions and projection methodologies for the EU-27 Member states
would determine additional increase in othercurrent and capital expenditures.
Alternative scenarios have been discussed by theAgeingWorking Group, but no final decision hasbeen taken as to whether these should be carriedout within the projection exercise. Subject toagreement by the Ageing Working Group and theEPC, the following scenarios could beconsidered: (i) a different pattern in the staff tostudent ratio can be assumed, so that the staffdoes not immediately adjust to demographicchanges and thus the staff-to-student ratioincreases linearly for some time (e.g. by 10% inthe next 15 years) and then remain constant,reaching a steady state level that is higher thanthe current one; (ii) a different assumption fromthe baseline may regard the average compensationcost, where a stronger increase (e.g. 10% higherthan the GDP per worker) can be considered toevaluate possible risks of wage setting in aunionised sector as public education. The “othercosts” to student ratio develops as in the baseline;and, (iii) the cost implications of reachingspecific benchmarks on educational attainment,if agreed at the EU level within the context of theupdated Strategic Framework for EuropeanCooperation in Education and Training.80
transfers to households
Public expenditure in education is carried outmainly directly by governmental institutions.However, part of the expenses comes fromtransfers to private households. The methodologyused to include transfers in the educationexpenditures is the following: the current shareof transfers over total public educationexpenditure (available from OECD)81 is appliedto the projected direct expenditure, taking theshare as constant over time. The sum betweendirect expenditure and transfers to privatehouseholds gives the total expenditure in publiceducation.
9.4. dAtA sources
The projections will be based mainly on availabledata provided by Eurostat. This has the advantageof avoiding heavy data requests processing and
80 Directorate General for Education and Culture (DGEAC) of the European Commission is in the process ofcoming to an agreement with the Member States whethersuch targets should be established.81 See OECD, Education at a glance.
it guarantees the comparability of the informationand subsequently of the results of the budgetaryprojections. Eurostat provides a comprehensivedataset which includes all the variables neededfor defining the number of students and theexpenditure per student in the base yearaccording to the methodology discussed in theprevious section. Hence, no data will be requiredto be provided by the Member States, unlessthere are lacks in the Eurostat database that callsfor additional information directly from theMember State concerned. The time coverage ofthe data differs according to the type ofinformation. Enrolment and personnel data isavailable up to the school year 2005/2006, whilethe financial data up to the year 2005. The baseyear will be 2006 or, alternatively, school/academic year 2005/2006. As the financialinformation is lacking for the most recent year,the values will be extrapolated from the data ofthe previous years using the same indexationrule as for the projection itself. For countrieswhere data are not available or incomplete,Members of the AWG have provided the relevantinformation to the Commission.
Macroeconomic variables to be used in theprojection exercise, namely: GDP, labour forceand GDP per worker will come from the commonassumptions of AWG. The list of the variablesneeded for each of the four different educationlevel in the base year is the following:
• Total expenditure in public wages;
• Number of students per age and educationlevel in public education;
• Number of working students per age andeducation level as a share of total number ofstudents;
• Numbers of teaching and non teaching staffper education level;
• Tota l expendi ture for personnelcompensation;
• Total expenditure in other current and capitalexpenditures (except wages);
• Transfers to households as a share of totalexpenditures in public education;
• Share of publicly funded education.

171
PARt II — Age-related expenditure items: coverage, projection methodologies and data sources
The education expenditure projections will usethe following additional information (whichareavailable from the AWG macroeconomicassumptions described in Part I of this report) foreach projected year:
• Labour force per single age;
• GDP per worker;
• GDP.

172
European Economy 7/2008the 2009 Ageing Report: Underlying assumptions and projection methodologies for the EU-27 Member states
Annex 9.1:organisational structure of secondaryeducation
the End of lower secondary EducationOften Coincides with the End of Full-timeCompulsory Education82
In this context, three different organisationalmodels can be distinguished, depending onwhether countries have a single structure,compulsory integrated secondary educationcorresponding to a ‘common core’ or distincttypes of education. In some new Member States(the Czech Republic, Latvia, Lithuania, Hungaryand Slovakia), several combinations of the threemodels exist alongside each other.
In all countries where the single structure is theonly form of structure (Denmark, Estonia,Portugal, Slovenia, Finland, Sweden, Iceland,Norway and Bulgaria), the end of (single-structure) education coincides with the end ofcompulsory education except in Bulgaria wherecompulsory education ends one year later.
In almost half of all European countries, allpupils follow the same general curriculum(common core) during lower secondaryeducation. In seven of these countries, the end oflower secondary education coincides with theend of full-time compulsory education.
In Belgium, France, Ireland, Italy, Hungary,Austria, Slovakia, the United Kingdom (England,Wales and Northern Ireland) and Bulgaria, theend of full-time compulsory education does notcorrespond to the end of lower secondaryeducation. Instead, the one or more final years ofcompulsory education are part of uppersecondary education. Thus, pupils in thesecountries – with the exception of Ireland and theUnited Kingdom (England, Wales and NorthernIreland) – have to choose between general,technical or vocational education one or twoyears (or four in Hungary) before the end of full-time compulsory education.
In the French and German-speaking Communitiesof Belgium, Germany, Latvia, Lithuania,Luxembourg, the Netherlands, Austria andLiechtenstein, pupils may select or be streamedinto different types of provision or school from
82 Source: Key data on education in Europe 2005,European Commission, Eurydice, Eurostat, 2005.
the beginning or before the end of lowersecondary education. Even though pupils inGermany attend different schools, they followentirely compatible curricula for the first twoyears so that selection of an appropriate studybranch can be deferred. In the Netherlands,pupils follow a common core curriculum usuallyfor the first two years at VMBO and three yearsat HAVO and VWO. While its level variesdepending on the type of school concerned, itspecifies minimum skills that should be acquiredby all pupils. The three types of lower secondaryschool in Liechtenstein offer the same basiccommon curriculum, which is supplemented bycertain kinds of provision in the Realschule orGymnasium.

173
PARt II — Age-related expenditure items: coverage, projection methodologies and data sources
Graph 9.1 – Age of pupils at the end of full-time compulsory education, and the structure of lower secondaryeducation, 2002/2003
Source: Commission services.
Additional notes:
belgium: the end of full-time compulsory education is extended to the age of 16 for pupils who have not completedthe first stage of lower secondary education. In the French and German-speaking Communities, admission to thislevel of education can take place at a differentiated stage (1re Band 2e année professionnelle).
czech republic, hungary and slovakia: In parallel with the single-structure system that ends at the age of 14 or15 depending on the country, pupils may be admitted to lower secondary school at the age of 10 or 11.
germany: Full-time compulsory education lasts between 9 and 10 years, depending on the länder concerned.
estonia: Compulsory education continues until pupils have completed basic education (at the age of 16) or reachedthe age of 17.
latvia: Pupils without a certificate of basic education by the age of 15 may take the appropriate courses up to theage of 18 within the curriculum for basic vocational education.
lithuania: Pupils wishing to gain a vocational qualification may attend a vocational school from the age of 14.
netherlands: Depending on the school attended, lower secondary education ends at the age of 15 (VwO, HAVO) or16 (MAVO, VBO and VMBO). Compulsory education ends at the end of the school year when pupils turn the age of16 and have completed 12 years of compulsory education.
slovenia: the diagram shows the ‘post-reform’ situation that has applied since 1999/2000.
romania: with effect from 2003/04, pupils complete both compulsory and lower secondary education at the age of 16.
Explanatory note:
In countries where secondary education is provided within a single continuous structure, only the number of yearscorresponding to IsCED 2 are coloured in the Graph above.
12
13
14
15
16
17
18
Years
11
10
9
8BE
single structureCommon-core curriculum/common general education
Differentiated branches or types of education
End of compulsory full-time educationAdditional year possible
CZ Dk DE EE El Es FI IE It lt lV It lU HU Mt Nl At Pl Pt sI sl FI sE EMssCtMlsMR lC
Is lI MO BG RO

174
European Economy 7/2008the 2009 Ageing Report: Underlying assumptions and projection methodologies for the EU-27 Member states
Graph 9.2 – Implicit decomposition of expenditure per student
Source: Commission services, EPC.
total expenditure onteachers’ remuneration
Other costs
'leisure' and workingstudents’ rates in relevant
age group
Population in relevantage group
Enrolment rate in relevantgroup
Participation rate inrelevant group
total staff in the publiceducation
Average labour cost
total expenditureon public education
share of publicly fundededucation
Number of students inrelevant age group
Expenditure per studentin public education
Number of students inpublic education
Graph 9.3 – schematic presentation of the underlying methodology
Source: Commission services, EPC.
* see Graph 9.2.
Number of students inpublic education
Expenditure per student inpublic education*
Overall participation rate
Enrolment rate in relevantage group
Participation rate inrelevant age group
labour force in relevantage group
‘leisure’ and workingstudents’ rates in relevant
age group
Population in relevantage group
total labour force
total population
share of publicly fundededucation
Number of students in bothpublic and private
education
total expenditureon public education
Productivity total employment
Expenditure per studentin public education
GDP

175
PARt II — Age-related expenditure items: coverage, projection methodologies and data sources
10.1. building on the Methodologyused in the 2006 projection
In order to get a comprehensive assessment ofthe total impact of ageing on public finances, andto guarantee consistency with the macroeconomicscenario, the AWG has decided to makeprojections on unemployment benefit spendingin the context of the common long-termprojection exercise. These projectionscomplement long-term projections on age-relatedexpenditures (pensions, health care, long-termcare, education).
In order to assess whether and by how muchunemployment benefit (henceforth UB)expenditure would be affected by projectedchanges in the unemployment situation inMember States, as implied by the macroeconomicand labour market assumptions agreed upon inthe AWG, a simple methodology is proposed tobe used, as was the case in the previous 2003 and2006 exercises.
10.2. projection Methodology foruneMployMent benefits
Projections can be made using the average per-capita unemployment insurance spending in abase year. In order to avoid that the choice of thebase year of calculation is overly conditioned bythe cyclicality of labour market conditions and/or possible statistical errors, the figures for thebase year are equivalent to the average ofspending over a number of years, e.g. the lastfive years. This per capita spending will becombined with the AWG baseline projections onunemployed persons in the future. Thiscalculation assumes, under a no-policy changehypothesis, constant replacement rates, durationof benefit, entitlement conditions, eligibilitycriteria, take-up rates, and tax structure. Finally,as for the pension projections, it also assumes aconstant share of wages in the income distributionover time (that is, the wage per worker grows atthe same rate as labour productivity, i.e. GDP perworker).
This set of assumptions can be illustrated bydecomposing the total unemployment benefitspending UB, as follows:
(1) UB =GRR × pcw ×UBrU ×U
where GRR is the gross replacement rate, pcw isper capita wage, UBr is the number of recipients(unemployed persons receiving unemployment
benefits), and thus the ratio UBrU is the take-up
ratio. Given that per capita wages can also bewritten as:
pcw =WY ×
YL , (where L is employment, Y is
GDP and W is total wages)
then UB can be re-written as:
(2) UB =GRR ×WY ×
YL ×
UBrU ×U
where W/Y is the share of wages in the incomedistribution and Y/L is labour productivity.
PercapitaUBis: UBpc = UBU =GRR ×W
Y ×YL ×
UBrU
and this can be expressed in terms of GDP perworker (or Ypc=Y/L) as follows:
(3) UBpcYpc =
UB /UY /L =GRR ×W
Y ×YL ×
UBrU ×
LY
Thus, the total expenditure as percentage of GDPcan be expressed as:
(4)
UBY =GRR ×W
Y ×UBrU ×
UL
Given that L = LF (1-u), where LF = labour forceand u = unemployment rate, the ratio (Ut/Lt) canalso be re-written as ut/(1-ut) and:
(5) UBY =GRR ×W
Y ×UBrU ×
u(1− u) .
In this formulation under the assumption of nochange in both the GRR and the take-up ratio(UBr/U), and a constant share of wages inincome distribution (W/Y), as a result of theassumption that wages grow at the same rate aslabour productivity, only changes in theunemployment rate (or the ratio ofunemployed to employed persons, U/L) willdrive the change over time of unemploymentbenefit spending.
10. UNEMPlOYMENt BENEFIts

176
European Economy 7/2008the 2009 Ageing Report: Underlying assumptions and projection methodologies for the EU-27 Member states
With this methodology, projections of UBexpenditure, expressed as a share of GDP, can bemade, where average expenditure per head growsat the same rate as GDP per worker in eachprojection year.
Thus, the basic approach applied to runprojections for UB expenditure (as percentage ofGDP) is the following (a formal illustration ofthe methodology is presented in the Annex):
• Estimate the average amount of UB receivedby each unemployed person (and aspercentage of GDP per worker) in the baseyear (Ubpcb/Ypcb). This is done by dividingthe average amount of UB expenditures(as % of GDP) over the certain period by theaverage of the ratio unemployed/employedpersons over the same period. In the absenceof any alternative and reasonable assumptionon the future number of UB beneficiaries(which is the result of entitlement andeligibility rules that affect coverage, take uprates, and so on) and the average duration ofunemployment spells, the calculationassumes that all these elements remainunchanged. This approximation is neutraland does not lead to a systematic bias in theprojections of benefit spending. In order toguarantee the comparability of projectionsacross countries, standardised figuresprovided by EUROSTAT –Social protectionExpenditure (instead of country-specificfigures coming from national databases) areproposed to be used.
• For each projection year, the ratiounemployment benefit /GDP per head in thebase year (from step 1) is multiplied by thecorresponding projected ratio of the futurenumber of unemployed persons and employedpersons (U/L) for each country and each ofthe year of projection. The projections ofemployed and unemployed persons are thosein the baseline scenario (no-policy change).This generates projections of UB spending,expressed as a share of GDP.83
83 The projection does not take into account thatunemployment benefits may be subject to income tax, sothat after tax UB spending as % of GDP may be lower. Thiseffect is however likely to be relatively constant over timeand quite small.

177
PARt II — Age-related expenditure items: coverage, projection methodologies and data sources
Annex 10.1:Methodology for projecting unemploymentbenefits
step 1 – estimation of current per capitaexpenditure
In order to obtain current per capita spending,total UB expenditure (UB) in the base year canbe decomposed according to the followingidentity:
ubpcb =
UBb
UP b
Where UBb = total expenditure on UB in baseyear in national currency;
UPb = numbers of unemployed personsin base year;
ubpcb = average UB expenditures for each
unemployed persons in base yearexpressed in national currency;
b = base year.
step 2 – expressing per capita expenditurein terms of productivity level (gdp peremployed person)
Base year UB expenditure for unemployedperson (ubpc
b) can be deflated by base-year GDPper worker, such that:
yubpcb =
ubpcb
GDP b E b( )where: yubpc
b= average UB expenditure for each
unemployed person in the base year b,expressed as a share of base year GDPper worker;
Eb = total employment in base year; and
GDP b = national GDP in base year.
Step 3 – Matching the base-year profiles tothe future labour market structure
The “deflated” per capita expenditure for thebase year yubpc
b is then matched to theunemployment vector UPt for each of theprojection year’s t (from 2008 to 2060) asfollows:
yubpcb * UP t ubpc
b
GDP b E b( )×UP t= =
UB t
GDP t E t( )where UB t = projected total UB expenditure inprojection year t (the bar above the variabledenotes that it is projection);
This step generates the projected total UBexpenditure expressed as a share of GDP perworker, under the implicit assumption that UBexpenditure per head grows at the same rate asGDP per worker. This, in turn, implies (seeequation 3 in the main test) unchangedunemployment benefit schemes (mainly grossreplacement rates, coverage, take-up ratio) and aconstant wage share in income distribution, thatis, average wage per capita grows at the samerate as labour productivity (GDP per worker).
step 4 – expressing the results as a share ofprojected national gdp for each projectionyear
The results can then be expressed in terms ofprojected national GDP for each of the projectionyears by dividing by projected employmentlevels as follows:
UB t
GDP t =yubpc
b ∗UP t
E t
Thus, projections of UB expenditure as a shareof GDP can be generated using UB expenditure(per unemployed person) and GDP level (perworker) in the base year, and existing projectionsfor the unemployed and employed persons.


STATISTICAL ANNEX
Main demographic andmacroeconomic assumptions bycountry (2007-2060)

180
European Economy 7/2008the 2009 Ageing Report: Underlying assumptions and projection methodologies for the EU-27 Member states
Belgium main DemograPhic anD macroeconomic assumPtions
(Baseline scenario)Budgetary Projection AWG – Population EUROPOP2008
Demographic assumptions 2008 2015 2020 2025 2030 2035 2040 2045 2050 2055 2060Fertility rate 1.75 1.76 1.76 1.77 1.77 1.77 1.78 1.78 1.78 1.79 1.79Life expectancy at birth
males 76.7 77.9 78.7 79.5 80.2 81.0 81.7 82.4 83.1 83.8 84.4females 82.3 83.3 84.0 84.7 85.4 86.0 86.6 87.2 87.8 88.4 88.9
Life expectancy at 65males 16.5 17.2 17.7 18.3 18.8 19.3 19.8 20.3 20.7 21.2 21.7females 20.1 20.8 21.4 21.9 22.3 22.8 23.3 23.8 24.2 24.7 25.1
Net migration (thousand) 50.7 41.0 36.2 33.6 31.4 28.8 27.1 26.3 25.2 25.0 23.3Net migration as % of population 0.5 0.4 0.3 0.3 0.3 0.2 0.2 0.2 0.2 0.2 0.2Population (million) 10.7 11.1 11.3 11.5 11.7 11.9 12.0 12.1 12.2 12.2 12.3Young population (0-14) as % of total 16.9 16.7 16.7 16.5 16.3 16.0 15.8 15.7 15.7 15.7 15.6Prime age population (25-54) as % of total 42.0 40.4 39.1 37.9 37.0 36.8 36.4 36.1 35.8 35.7 35.6Working age population (15-64)as % of total 66.1 65.0 63.8 62.4 60.9 59.8 59.2 59.0 58.6 58.2 57.8Elderly population (65 and over)as % of total 17.0 18.3 19.5 21.1 22.9 24.2 25.0 25.4 25.7 26.0 26.5Very elderly population (80 and over)as % of total 4.7 5.4 5.6 5.6 6.5 7.4 8.4 9.4 10.0 10.2 10.2Elderly population (55 and over)as % of working age pop.15-64 43.8 47.9 51.7 55.1 58.2 60.3 61.9 63.1 64.3 64.9 65.5
macroeconomic assumptions* 2007 2015 2020 2025 2030 2035 2040 2045 2050 2055 2060Potential GDP (growth rate) 2.5 2.3 1.9 1.6 1.6 1.7 1.8 1.7 1.7 1.7 1.7Employment (growth rate) 1.3 0.6 0.2 -0.1 -0.1 0.0 0.1 0.0 0.0 0.0 0.0Labour input : hours worked (growth rate) 1.2 0.6 0.1 -0.1 -0.1 0.0 0.1 0.0 0.0 0.0 0.0Labour productivity per hour (growth rate) 1.3 1.7 1.8 1.8 1.7 1.7 1.7 1.7 1.7 1.7 1.7TFP (growth rate) 0.8 1.1 1.1 1.1 1.1 1.1 1.1 1.1 1.1 1.1 1.1Capital deepening (contribution to labourproductivity growth) 0.5 0.6 0.7 0.7 0.6 0.6 0.6 0.6 0.6 0.6 0.6GDP per capita (growth rate) 1.8 1.8 1.5 1.2 1.3 1.4 1.6 1.6 1.6 1.6 1.6GDP in 2007 prices (in millions euros) 330.8 400.0 443.1 481.5 521.6 566.7 617.6 672.9 731.4 793.7 863.4
Labour force assumptions 2007 2015 2020 2025 2030 2035 2040 2045 2050 2055 2060Population growth (working age:15-64) 1.0 0.1 0.0 -0.1 -0.2 0.0 0.1 0.0 0.0 -0.1 0.0Population growth (working age:15-71) 0.7 0.5 0.1 0.1 0.0 -0.1 0.0 0.0 0.1 0.0 0.0Labour force (thousands) 4717 5049 5103 5081 5055 5048 5059 5069 5066 5053 5053Participation rate (15-64) 67.3 69.5 69.8 69.4 69.4 69.6 69.7 69.7 69.7 69.6 69.7Participation rate (15-71) 61.8 63.2 63.1 62.3 61.9 62.1 62.6 62.8 62.6 62.4 62.3
young (15-24) 34.4 36.7 35.9 35.2 35.7 35.5 35.7 35.9 35.8 35.6 35.6prime-age (25-54) 85.3 86.5 86.6 86.7 86.6 86.6 86.7 86.7 86.7 86.8 86.7older (55-64) 36.2 46.0 48.9 48.9 48.8 48.8 49.5 49.4 49.4 48.7 49.1oldest (65-71) 2.9 6.4 7.8 8.9 9.3 9.3 9.3 9.3 9.3 9.4 9.3
Employment rate (15-64) 62.3 64.7 65.4 65.1 65.1 65.3 65.4 65.4 65.4 65.3 65.4Employment rate (15-71) 57.2 58.9 59.2 58.5 58.1 58.3 58.7 59.0 58.8 58.6 58.5Unemployment rate (15-64) 7.5 6.8 6.2 6.2 6.2 6.2 6.2 6.2 6.2 6.2 6.2Employment (15-64) (in millions) 4.3 4.7 4.7 4.7 4.7 4.6 4.7 4.7 4.7 4.7 4.7
share of young (15-24) 8% 9% 8% 8% 9% 9% 9% 9% 9% 9% 9%share of prime-age (25-54) 82% 78% 77% 76% 76% 77% 77% 77% 77% 77% 77%share of older (55-64) 10% 13% 15% 15% 15% 14% 14% 15% 15% 15% 14%
DepenDency ratios 2008 2015 2020 2025 2030 2035 2040 2045 2050 2055 2060Share of older population (55-64) (1) 18.0 19.7 21.1 21.3 20.6 19.8 19.7 20.1 20.5 20.2 19.7Old-age dependency ratio (2) 26 28 31 34 38 40 42 43 44 45 46Total dependency ratio (3) 51 54 57 60 64 67 69 70 71 72 73Total economic dependency ratio (4) 143 137 138 145 150 154 156 158 159 161 162Economic old-agedependency ratio (15-64) (5) 41 42 45 50 56 60 63 64 65 67 68Economic old-agedependency ratio (15-71) (6) 41 42 45 49 55 59 62 63 64 65 67
LEGENDA
* the potential GDP and its components is used to estimate the rate of potential output growth, net off normal cyclical variations(1) share of older population = Population aged 55 to 64 as % of population aged 15-64
(2) Old-age dependency ratio = Population aged 65 and over as a percentage of the population aged 15-64(3) total dependency ratio = Population under 15 and over 64 as a percentage of the population aged 15-64
(4) total economic dependency ratio = total population less employed as % of employed population 15-64(5) Economic old-age dependency ratio (15-64) = Inactive population aged 65+ as % of employed population 15-64(6) Economic old-age dependency ratio (15-71) = Inactive population aged 65+ as % of employed population 15-71
source : Eurostat (EUROPOP2008), Commission services (DG ECFIN), EPC (AwG)

181
stAtIstICAl ANNEX — Main demographic and macroeconomic assumptions by country (2007-2060)
Bulgaria main DemograPhic anD macroeconomic assumPtions
(Baseline scenario)Budgetary Projection AWG – Population EUROPOP2008
Demographic assumptions 2008 2015 2020 2025 2030 2035 2040 2045 2050 2055 2060Fertility rate 1.38 1.41 1.42 1.44 1.46 1.47 1.49 1.51 1.52 1.54 1.55Life expectancy at birth
males 69.7 71.6 72.8 74.1 75.3 76.4 77.5 78.6 79.6 80.6 81.6females 76.7 78.2 79.3 80.3 81.3 82.2 83.1 84.0 84.9 85.7 86.5
Life expectancy at 65males 13.1 14.1 14.8 15.4 16.1 16.8 17.5 18.1 18.8 19.4 20.0females 16.1 17.1 17.8 18.5 19.2 19.9 20.5 21.2 21.8 22.5 23.1
Net migration (thousand) -1.4 1.7 0.2 -0.4 -0.5 1.4 2.5 2.0 1.6 1.1 -1.2Net migration as % of population 0.0 0.0 0.0 0.0 0.0 0.0 0.0 0.0 0.0 0.0 0.0Population (million) 7.6 7.4 7.2 7.0 6.8 6.5 6.3 6.1 5.9 5.7 5.5Young population (0-14) as % of total 13.4 14.2 14.3 13.5 12.6 12.0 12.0 12.3 12.3 12.2 12.0Prime age population (25-54) as % of total 42.8 43.3 42.8 41.2 39.3 37.5 35.9 34.1 33.2 33.5 33.4Working age population (15-64)as % of total 69.3 67.0 65.4 64.7 64.2 63.2 61.3 58.6 56.4 54.4 53.8Elderly population (65 and over)as % of total 17.3 18.9 20.3 21.8 23.3 24.7 26.7 29.1 31.3 33.4 34.2Very elderly population (80 and over)as % of total 3.6 4.4 4.6 4.9 6.1 7.1 8.0 8.7 9.6 11.0 12.8Elderly population (55 and over)as % of working age pop.15-64 44.4 48.4 51.5 54.5 58.5 63.7 69.4 76.3 81.0 83.3 84.3
Macroeconomic assumptions* 2007 2015 2020 2025 2030 2035 2040 2045 2050 2055 2060Potential GDP (growth rate) 6.4 3.0 2.4 2.0 1.7 1.5 1.4 0.7 0.3 0.7 0.8Employment (growth rate) 2.3 -0.5 -0.9 -1.0 -1.0 -1.2 -1.3 -1.4 -1.4 -1.0 -0.9Labour input : hours worked (growth rate) 2.4 -0.5 -0.9 -1.0 -1.0 -1.2 -1.3 -1.4 -1.4 -1.0 -0.9Labour productivity per hour (growth rate) 4.0 3.6 3.3 3.0 2.7 2.7 2.7 2.2 1.7 1.7 1.7TFP (growth rate) 1.2 1.5 1.7 1.7 1.7 1.7 1.7 1.4 1.1 1.1 1.1Capital deepening (contribution to labourproductivity growth) 2.7 2.1 1.6 1.3 1.0 1.0 1.0 0.8 0.6 0.6 0.6GDP per capita (growth rate) 7.0 3.5 2.9 2.7 2.4 2.2 2.0 1.4 1.0 1.4 1.6GDP in 2007 prices (in millions euros) 28.9 40.1 45.6 50.6 55.5 60.1 64.5 67.6 69.3 71.1 73.9
Labour force assumptions 2007 2015 2020 2025 2030 2035 2040 2045 2050 2055 2060Population growth (working age:15-64) -0.4 -1.1 -0.9 -0.8 -0.8 -1.2 -1.5 -1.5 -1.4 -1.4 -0.8Population growth (working age:15-71) -0.6 -0.7 -0.8 -0.7 -0.8 -0.9 -0.9 -1.1 -1.4 -1.3 -1.3Labour force (thousands) 3589 3536 3391 3227 3074 2911 2731 2543 2361 2223 2122Participation rate (15-64) 66.8 69.9 70.3 69.6 69.0 68.4 68.0 68.0 67.9 68.6 69.3Participation rate (15-71) 61.2 63.7 63.6 63.1 62.5 61.7 60.5 59.7 59.3 59.7 60.9
young (15-24) 32.0 34.9 30.6 30.3 31.7 32.7 33.0 32.5 31.6 31.4 31.7prime-age (25-54) 84.0 85.1 85.7 86.1 86.0 85.8 85.7 85.9 86.2 86.2 86.1older (55-64) 46.6 47.4 48.2 48.8 49.8 49.7 49.0 49.4 47.6 47.2 50.2oldest (65-71) 6.0 13.1 13.9 14.2 14.5 14.7 14.7 14.7 14.8 14.8 14.5
Employment rate (15-64) 62.1 66.6 67.0 66.3 65.7 65.1 64.8 64.8 64.7 65.3 66.0Employment rate (15-71) 57.0 60.7 60.6 60.1 59.6 58.9 57.7 57.0 56.6 56.9 58.0Unemployment rate (15-64) 7.0 4.7 4.7 4.7 4.7 4.7 4.7 4.7 4.7 4.7 4.7Employment (15-64) (in millions) 3.3 3.3 3.1 3.0 2.8 2.7 2.5 2.3 2.2 2.0 1.9
share of young (15-24) 8% 7% 6% 6% 7% 7% 7% 7% 7% 7% 7%share of prime-age (25-54) 78% 79% 80% 79% 77% 75% 74% 74% 75% 78% 77%share of older (55-64) 13% 14% 14% 15% 16% 18% 19% 19% 18% 15% 15%
DepenDency ratios 2008 2015 2020 2025 2030 2035 2040 2045 2050 2055 2060Share of older population (55-64) (1) 19.4 20.3 20.4 20.7 22.2 24.6 25.9 26.6 25.6 21.9 20.8Old-age dependency ratio (2) 25 28 31 34 36 39 44 50 55 61 64Total dependency ratio (3) 44 49 53 55 56 58 63 71 77 84 86Total economic dependency ratio (4) 128 122 125 130 134 139 147 158 169 176 176Economic old-agedependency ratio (15-64) (5) 38 40 43 47 52 56 63 72 80 88 91Economic old-agedependency ratio (15-71) (6) 38 39 42 46 50 54 61 69 77 85 88
LEGENDA
* the potential GDP and its components is used to estimate the rate of potential output growth, net off normal cyclical variations(1) share of older population = Population aged 55 to 64 as % of population aged 15-64
(2) Old-age dependency ratio = Population aged 65 and over as a percentage of the population aged 15-64(3) total dependency ratio = Population under 15 and over 64 as a percentage of the population aged 15-64
(4) total economic dependency ratio = total population less employed as % of employed population 15-64(5) Economic old-age dependency ratio (15-64) = Inactive population aged 65+ as % of employed population 15-64(6) Economic old-age dependency ratio (15-71) = Inactive population aged 65+ as % of employed population 15-71
source : Eurostat (EUROPOP2008), Commission services (DG ECFIN), EPC (AwG)

182
European Economy 7/2008the 2009 Ageing Report: Underlying assumptions and projection methodologies for the EU-27 Member states
czech rePuBlic main DemograPhic anD macroeconomic assumPtions
(Baseline scenario)Budgetary Projection AWG – Population EUROPOP2008
Demographic assumptions 2008 2015 2020 2025 2030 2035 2040 2045 2050 2055 2060Fertility rate 1.33 1.36 1.38 1.40 1.41 1.43 1.45 1.47 1.49 1.51 1.52Life expectancy at birth
males 73.9 75.3 76.3 77.2 78.1 79.0 79.9 80.8 81.6 82.4 83.2females 80.2 81.3 82.1 82.9 83.7 84.4 85.1 85.9 86.5 87.2 87.8
Life expectancy at 65males 14.7 15.6 16.2 16.8 17.4 18.0 18.6 19.1 19.7 20.3 20.8females 18.1 18.9 19.5 20.1 20.7 21.3 21.9 22.4 23.0 23.5 24.0
Net migration (thousand) 24.0 27.7 24.7 21.3 22.9 23.3 27.3 24.1 21.9 20.4 16.7Net migration as % of population 0.2 0.3 0.2 0.2 0.2 0.2 0.3 0.2 0.2 0.2 0.2Population (million) 10.3 10.5 10.5 10.5 10.4 10.3 10.2 10.0 9.9 9.7 9.5Young population (0-14) as % of total 14.3 14.6 14.7 13.8 12.8 12.2 12.1 12.4 12.6 12.5 12.3Prime age population (25-54) as % of total 44.1 43.6 43.6 42.1 39.7 37.2 36.1 35.0 33.9 34.0 33.9Working age population (15-64)as % of total 71.1 67.5 65.1 64.5 64.3 63.8 61.6 58.4 56.5 55.1 54.4Elderly population (65 and over)as % of total 14.6 17.9 20.2 21.8 22.9 24.1 26.3 29.3 30.9 32.4 33.4Very elderly population (80 and over)as % of total 3.4 3.9 4.1 5.0 6.6 7.9 8.4 8.7 9.3 11.1 13.4Elderly population (55 and over)as % of working age pop.15-64 40.4 46.3 50.0 52.9 57.5 63.4 68.6 74.8 79.3 80.9 81.9
macroeconomic assumptions* 2007 2015 2020 2025 2030 2035 2040 2045 2050 2055 2060Potential GDP (growth rate) 5.2 3.0 2.5 1.6 1.4 1.1 0.9 0.9 0.7 0.9 1.1Employment (growth rate) 1.1 0.0 -0.4 -0.5 -0.3 -0.6 -0.8 -0.8 -1.0 -0.8 -0.5Labour input : hours worked (growth rate) 1.0 0.0 -0.4 -0.5 -0.3 -0.6 -0.8 -0.8 -1.0 -0.8 -0.5Labour productivity per hour (growth rate) 4.1 3.0 2.9 2.2 1.8 1.7 1.7 1.7 1.7 1.7 1.7TFP (growth rate) 3.1 1.8 1.8 1.3 1.2 1.1 1.1 1.1 1.1 1.1 1.1Capital deepening (contribution to labourproductivity growth) 1.0 1.2 1.2 0.9 0.6 0.6 0.6 0.6 0.6 0.6 0.6GDP per capita (growth rate) 4.8 2.9 2.5 1.8 1.7 1.4 1.1 1.1 1.1 1.3 1.6GDP in 2007 prices (in millions euros) 128.1 174.5 199.5 219.2 236.2 252.3 264.2 276.3 286.9 299.1 315.3
Labour force assumptions 2007 2015 2020 2025 2030 2035 2040 2045 2050 2055 2060Population growth (working age:15-64) 0.4 -0.7 -0.5 -0.1 -0.5 -0.5 -1.3 -1.3 -0.9 -0.8 -0.5Population growth (working age:15-71) 0.6 -0.2 -0.6 -0.4 -0.3 -0.3 -0.4 -0.9 -1.2 -0.8 -0.7Labour force (thousands) 5177 5331 5262 5117 5016 4923 4734 4549 4340 4155 4023Participation rate (15-64) 70.0 73.5 73.9 72.9 72.5 72.6 72.3 73.3 73.5 73.2 73.5Participation rate (15-71) 65.3 66.8 67.5 66.9 66.9 66.3 65.3 64.8 65.7 66.0 66.3
young (15-24) 32.0 35.8 31.6 30.1 32.5 33.0 33.3 33.3 32.3 31.6 31.9prime-age (25-54) 87.7 87.6 87.4 87.4 87.3 86.8 86.5 86.5 86.7 86.9 86.9older (55-64) 48.9 56.8 58.1 58.5 60.8 64.9 63.4 66.0 66.8 65.6 67.5oldest (65-71) 8.5 14.1 20.0 20.0 20.0 18.5 21.1 22.0 23.1 24.6 24.4
Employment rate (15-64) 66.2 70.2 70.6 69.6 69.2 69.4 69.0 70.0 70.2 70.0 70.2Employment rate (15-71) 61.8 63.9 64.5 64.0 63.9 63.4 62.4 62.0 62.9 63.1 63.4Unemployment rate (15-64) 5.4 4.5 4.5 4.5 4.5 4.5 4.5 4.5 4.5 4.5 4.5Employment (15-64) (in millions) 4.9 5.0 4.8 4.7 4.6 4.5 4.3 4.1 3.9 3.7 3.6
share of young (15-24) 8% 7% 6% 6% 7% 7% 7% 7% 6% 7% 7%share of prime-age (25-54) 78% 77% 79% 78% 75% 70% 70% 71% 71% 73% 74%share of older (55-64) 14% 16% 15% 15% 18% 23% 23% 22% 23% 20% 19%
DepenDency ratios 2008 2015 2020 2025 2030 2035 2040 2045 2050 2055 2060Share of older population (55-64) (1) 19.8 19.8 19.0 19.1 21.8 25.6 25.9 24.7 24.5 22.1 20.5Old-age dependency ratio (2) 21 26 31 34 36 38 43 50 55 59 61Total dependency ratio (3) 41 48 54 55 56 57 62 71 77 82 84Total economic dependency ratio (4) 110 109 114 119 121 122 130 138 146 153 155Economic old-agedependency ratio (15-64) (5) 30 35 40 45 48 51 57 65 72 77 81Economic old-agedependency ratio (15-71) (6) 29 34 39 43 46 49 54 61 68 73 76
LEGENDA
* the potential GDP and its components is used to estimate the rate of potential output growth, net off normal cyclical variations(1) share of older population = Population aged 55 to 64 as % of population aged 15-64
(2) Old-age dependency ratio = Population aged 65 and over as a percentage of the population aged 15-64(3) total dependency ratio = Population under 15 and over 64 as a percentage of the population aged 15-64
(4) total economic dependency ratio = total population less employed as % of employed population 15-64(5) Economic old-age dependency ratio (15-64) = Inactive population aged 65+ as % of employed population 15-64(6) Economic old-age dependency ratio (15-71) = Inactive population aged 65+ as % of employed population 15-71
source : Eurostat (EUROPOP2008), Commission services (DG ECFIN), EPC (AwG)

183
stAtIstICAl ANNEX — Main demographic and macroeconomic assumptions by country (2007-2060)
Denmark main DemograPhic anD macroeconomic assumPtions
(Baseline scenario)Budgetary Projection AWG – Population EUROPOP2008
Demographic assumptions 2008 2015 2020 2025 2030 2035 2040 2045 2050 2055 2060Fertility rate 1.85 1.85 1.85 1.85 1.85 1.85 1.85 1.85 1.85 1.85 1.85Life expectancy at birth
males 76.4 77.6 78.4 79.2 80.0 80.8 81.5 82.2 82.9 83.6 84.3females 81.0 82.2 83.0 83.7 84.5 85.2 85.9 86.6 87.2 87.8 88.4
Life expectancy at 65males 16.1 16.8 17.4 17.9 18.4 19.0 19.5 20.0 20.5 21.0 21.4females 19.0 19.8 20.4 21.0 21.6 22.1 22.6 23.2 23.7 24.2 24.6
Net migration (thousand) 9.7 8.5 8.1 8.1 8.7 7.0 6.5 6.0 5.7 5.9 6.2Net migration as % of population 0.2 0.2 0.1 0.1 0.2 0.1 0.1 0.1 0.1 0.1 0.1Population (million) 5.5 5.6 5.7 5.7 5.8 5.9 5.9 5.9 5.9 5.9 5.9Young population (0-14) as % of total 18.4 17.3 16.7 16.6 16.9 17.1 17.0 16.6 16.3 16.2 16.3Prime age population (25-54) as % of total 41.0 39.0 38.1 36.9 36.1 36.0 36.4 36.3 35.9 35.7 35.6Working age population (15-64)as % of total 66.0 64.1 63.1 62.0 60.3 58.7 58.2 58.4 59.2 59.4 58.7Elderly population (65 and over)as % of total 15.6 18.6 20.1 21.4 22.8 24.1 24.8 24.9 24.5 24.4 25.0Very elderly population (80 and over)as % of total 4.1 4.2 4.7 5.7 7.1 7.7 8.1 8.9 9.7 10.1 10.0Elderly population (55 and over)as % of working age pop.15-64 43.8 48.4 52.1 55.9 59.1 61.0 60.7 60.5 60.8 61.6 62.8
macroeconomic assumptions* 2007 2015 2020 2025 2030 2035 2040 2045 2050 2055 2060Potential GDP (growth rate) 2.3 1.7 1.6 1.8 1.5 1.6 1.7 1.9 1.9 1.7 1.6Employment (growth rate) 0.5 -0.1 -0.2 0.1 -0.2 -0.1 0.0 0.2 0.2 0.0 -0.1Labour input : hours worked (growth rate) 0.3 -0.2 -0.1 0.1 -0.2 -0.1 0.0 0.2 0.2 0.1 -0.1Labour productivity per hour (growth rate) 2.0 1.8 1.8 1.7 1.7 1.7 1.7 1.7 1.7 1.7 1.7TFP (growth rate) 1.0 1.1 1.1 1.1 1.1 1.1 1.1 1.1 1.1 1.1 1.1Capital deepening (contribution to labourproductivity growth) 0.9 0.7 0.7 0.6 0.6 0.6 0.6 0.6 0.6 0.6 0.6GDP per capita (growth rate) 1.9 1.4 1.4 1.5 1.2 1.5 1.6 1.9 1.9 1.7 1.5GDP in 2007 prices (in millions euros) 227.7 262.1 283.9 309.8 334.4 363.8 394.7 433.7 476.5 521.2 565.7
Labour force assumptions 2007 2015 2020 2025 2030 2035 2040 2045 2050 2055 2060Population growth (working age:15-64) 0.3 0.0 0.0 -0.1 -0.4 -0.1 0.0 0.2 0.3 -0.1 -0.3Population growth (working age:15-71) 0.5 0.1 -0.2 -0.1 -0.1 -0.2 -0.2 -0.1 0.1 0.2 0.1Labour force (thousands) 2927 2912 2888 2894 2869 2867 2862 2896 2928 2942 2933Participation rate (15-64) 80.3 79.8 79.6 79.6 79.6 80.4 80.6 81.1 81.0 80.8 80.8Participation rate (15-71) 74.3 71.7 71.9 72.3 72.1 72.6 73.5 74.6 75.3 75.0 74.3
young (15-24) 70.8 72.5 72.6 72.5 72.7 72.3 72.1 72.2 72.4 72.5 72.5prime-age (25-54) 89.0 88.1 87.5 87.3 87.2 87.3 87.3 87.2 87.2 87.2 87.3older (55-64) 61.3 61.1 62.6 64.4 64.0 66.8 66.6 69.7 70.3 69.6 69.3oldest (65-71) 11.5 11.2 9.7 13.8 17.4 19.9 22.3 23.8 25.2 26.7 26.5
Employment rate (15-64) 77.2 77.2 77.0 77.0 77.0 77.8 78.0 78.5 78.3 78.1 78.2Employment rate (15-71) 71.5 69.4 69.6 69.9 69.8 70.3 71.2 72.2 72.9 72.6 72.0Unemployment rate (15-64) 3.9 3.2 3.2 3.2 3.2 3.2 3.2 3.2 3.2 3.2 3.2Employment (15-64) (in millions) 2.8 2.8 2.8 2.7 2.7 2.7 2.7 2.7 2.7 2.7 2.7
share of young (15-24) 15% 17% 17% 17% 17% 16% 17% 17% 17% 17% 17%share of prime-age (25-54) 70% 68% 67% 66% 66% 67% 68% 67% 66% 65% 66%share of older (55-64) 15% 15% 16% 17% 17% 17% 15% 15% 17% 18% 17%
DepenDency ratios 2008 2015 2020 2025 2030 2035 2040 2045 2050 2055 2060Share of older population (55-64) (1) 20.2 19.3 20.3 21.4 21.3 19.9 18.0 17.8 19.5 20.5 20.2Old-age dependency ratio (2) 24 29 32 34 38 41 43 43 41 41 43Total dependency ratio (3) 52 56 58 61 66 70 72 71 69 68 70Total economic dependency ratio (4) 94 100 104 107 112 115 117 114 112 111 113Economic old-agedependency ratio (15-64) (5) 29 35 40 42 46 49 51 50 49 49 50Economic old-agedependency ratio (15-71) (6) 28 35 39 42 45 47 49 49 47 47 48
LEGENDA
* the potential GDP and its components is used to estimate the rate of potential output growth, net off normal cyclical variations(1) share of older population = Population aged 55 to 64 as % of population aged 15-64
(2) Old-age dependency ratio = Population aged 65 and over as a percentage of the population aged 15-64(3) total dependency ratio = Population under 15 and over 64 as a percentage of the population aged 15-64
(4) total economic dependency ratio = total population less employed as % of employed population 15-64(5) Economic old-age dependency ratio (15-64) = Inactive population aged 65+ as % of employed population 15-64(6) Economic old-age dependency ratio (15-71) = Inactive population aged 65+ as % of employed population 15-71
source : Eurostat (EUROPOP2008), Commission services (DG ECFIN), EPC (AwG)

184
European Economy 7/2008the 2009 Ageing Report: Underlying assumptions and projection methodologies for the EU-27 Member states
germany main DemograPhic anD macroeconomic assumPtions
(Baseline scenario)Budgetary Projection AWG – Population EUROPOP2008
Demographic assumptions 2008 2015 2020 2025 2030 2035 2040 2045 2050 2055 2060Fertility rate 1.34 1.36 1.38 1.40 1.42 1.44 1.45 1.47 1.49 1.51 1.53Life expectancy at birth
males 77.3 78.5 79.3 80.1 80.8 81.6 82.3 83.0 83.6 84.3 84.9females 82.6 83.6 84.3 84.9 85.6 86.2 86.8 87.4 88.0 88.6 89.1
Life expectancy at 65males 16.8 17.6 18.1 18.6 19.1 19.7 20.1 20.6 21.1 21.6 22.0females 20.1 20.8 21.4 21.9 22.4 22.9 23.3 23.8 24.3 24.7 25.1
Net migration (thousand) 159.8 166.3 173.1 186.6 187.0 159.6 131.6 140.5 135.7 137.9 115.9Net migration as % of population 0.2 0.2 0.2 0.2 0.2 0.2 0.2 0.2 0.2 0.2 0.2Population (million) 82.2 81.9 81.5 80.9 80.2 79.1 77.8 76.2 74.5 72.6 70.8Young population (0-14) as % of total 13.7 12.8 12.6 12.7 12.7 12.5 12.2 12.1 12.1 12.3 12.6Prime age population (25-54) as % of total 43.1 41.8 39.4 36.9 36.2 35.9 35.1 34.1 33.7 33.5 33.5Working age population (15-64)as % of total 66.2 65.9 64.6 62.6 59.7 57.3 56.7 56.7 56.2 55.4 55.0Elderly population (65 and over)as % of total 20.1 21.2 22.8 24.7 27.6 30.2 31.1 31.3 31.7 32.3 32.5Very elderly population (80 and over)as % of total 4.7 5.7 7.1 7.9 8.0 8.9 10.3 12.4 14.0 13.8 13.2Elderly population (55 and over)as % of working age pop.15-64 47.8 53.0 59.1 65.7 70.4 74.1 76.4 78.5 80.1 81.3 81.5
macroeconomic assumptions* 2007 2015 2020 2025 2030 2035 2040 2045 2050 2055 2060Potential GDP (growth rate) 1.4 1.9 1.5 0.9 1.3 1.1 1.1 1.2 1.0 1.0 1.0Employment (growth rate) 0.2 0.3 -0.2 -0.9 -0.4 -0.6 -0.6 -0.5 -0.7 -0.7 -0.7Labour input : hours worked (growth rate) -0.1 0.2 -0.2 -0.9 -0.4 -0.6 -0.6 -0.5 -0.7 -0.7 -0.7Labour productivity per hour (growth rate) 1.5 1.6 1.7 1.8 1.7 1.7 1.7 1.7 1.7 1.7 1.7TFP (growth rate) 1.0 1.1 1.1 1.1 1.1 1.1 1.1 1.1 1.1 1.1 1.1Capital deepening (contribution to labourproductivity growth) 0.6 0.5 0.6 0.7 0.6 0.6 0.6 0.6 0.6 0.6 0.6GDP per capita (growth rate) 1.6 1.9 1.6 1.0 1.5 1.4 1.5 1.6 1.5 1.5 1.5GDP in 2007 prices (in millions euros) 2423.8 2808.1 3047.6 3209.7 3369.8 3539.4 3720.8 3940.8 4161.6 4374.7 4596.7
Labour force assumptions 2007 2015 2020 2025 2030 2035 2040 2045 2050 2055 2060Population growth (working age:15-64) -0.6 -0.4 -0.6 -0.9 -1.2 -0.9 -0.3 -0.5 -0.6 -0.8 -0.5Population growth (working age:15-71) -0.3 -0.2 -0.2 -0.5 -0.6 -1.0 -1.0 -0.5 -0.4 -0.6 -0.8Labour force (thousands) 42065 43063 42614 41107 39597 38231 36964 35994 34924 33718 32546Participation rate (15-64) 76.2 78.7 79.1 78.8 79.3 80.1 80.2 79.9 79.7 79.7 79.8Participation rate (15-71) 68.0 72.0 71.7 70.8 70.2 70.7 72.1 73.0 72.2 71.7 71.6
young (15-24) 51.5 52.7 52.9 52.8 52.1 51.9 52.2 52.5 52.5 52.5 52.2prime-age (25-54) 87.9 88.9 89.2 89.4 89.6 89.6 89.6 89.5 89.4 89.4 89.5older (55-64) 57.3 67.6 69.9 69.6 70.5 73.3 74.7 74.4 73.9 73.7 73.9oldest (65-71) 6.5 10.1 14.5 16.0 19.1 21.8 21.9 24.0 23.8 24.0 22.9
Employment rate (15-64) 69.6 73.1 74.2 73.9 74.4 75.1 75.2 74.9 74.8 74.8 74.9Employment rate (15-71) 62.1 67.0 67.3 66.5 66.0 66.5 67.8 68.6 67.9 67.4 67.3Unemployment rate (15-64) 8.7 7.1 6.2 6.2 6.2 6.2 6.2 6.2 6.2 6.2 6.2Employment (15-64) (in millions) 38.0 39.5 39.0 37.4 35.6 34.1 33.2 32.4 31.3 30.1 29.1
share of young (15-24) 11% 10% 10% 10% 10% 10% 10% 11% 11% 11% 11%share of prime-age (25-54) 76% 72% 69% 67% 69% 71% 70% 68% 68% 68% 69%share of older (55-64) 13% 18% 21% 23% 21% 19% 20% 22% 22% 21% 21%
DepenDency ratios 2008 2015 2020 2025 2030 2035 2040 2045 2050 2055 2060Share of older population (55-64) (1) 17.5 20.7 23.9 26.2 24.1 21.3 21.7 23.3 23.6 23.0 22.5Old-age dependency ratio (2) 30 32 35 40 46 53 55 55 56 58 59Total dependency ratio (3) 51 52 55 60 67 75 76 76 78 80 82Total economic dependency ratio (4) 113 106 106 113 120 126 129 130 132 135 137Economic old-agedependency ratio (15-64) (5) 42 42 45 50 57 64 67 68 70 72 73Economic old-agedependency ratio (15-71) (6) 41 42 44 48 54 61 64 65 67 68 69
LEGENDA
* the potential GDP and its components is used to estimate the rate of potential output growth, net off normal cyclical variations(1) share of older population = Population aged 55 to 64 as % of population aged 15-64
(2) Old-age dependency ratio = Population aged 65 and over as a percentage of the population aged 15-64(3) total dependency ratio = Population under 15 and over 64 as a percentage of the population aged 15-64
(4) total economic dependency ratio = total population less employed as % of employed population 15-64(5) Economic old-age dependency ratio (15-64) = Inactive population aged 65+ as % of employed population 15-64(6) Economic old-age dependency ratio (15-71) = Inactive population aged 65+ as % of employed population 15-71
source : Eurostat (EUROPOP2008), Commission services (DG ECFIN), EPC (AwG)
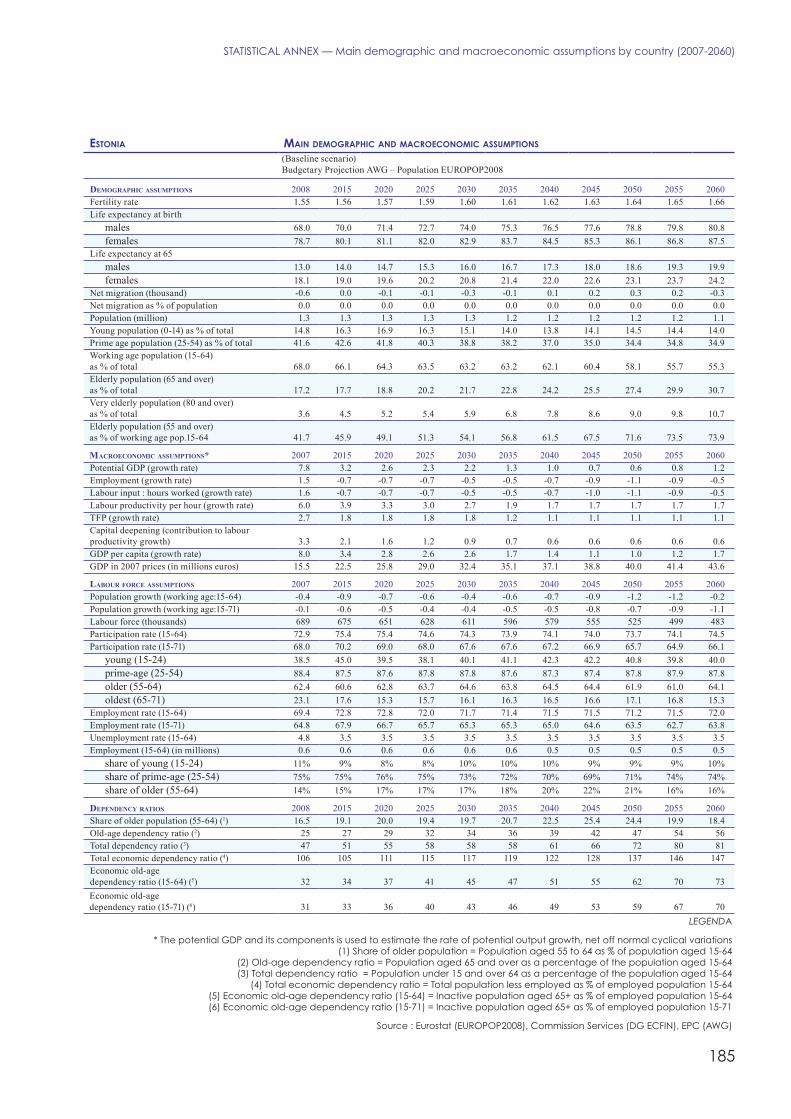
185
stAtIstICAl ANNEX — Main demographic and macroeconomic assumptions by country (2007-2060)
estonia main DemograPhic anD macroeconomic assumPtions
(Baseline scenario)Budgetary Projection AWG – Population EUROPOP2008
Demographic assumptions 2008 2015 2020 2025 2030 2035 2040 2045 2050 2055 2060Fertility rate 1.55 1.56 1.57 1.59 1.60 1.61 1.62 1.63 1.64 1.65 1.66Life expectancy at birth
males 68.0 70.0 71.4 72.7 74.0 75.3 76.5 77.6 78.8 79.8 80.8females 78.7 80.1 81.1 82.0 82.9 83.7 84.5 85.3 86.1 86.8 87.5
Life expectancy at 65males 13.0 14.0 14.7 15.3 16.0 16.7 17.3 18.0 18.6 19.3 19.9females 18.1 19.0 19.6 20.2 20.8 21.4 22.0 22.6 23.1 23.7 24.2
Net migration (thousand) -0.6 0.0 -0.1 -0.1 -0.3 -0.1 0.1 0.2 0.3 0.2 -0.3Net migration as % of population 0.0 0.0 0.0 0.0 0.0 0.0 0.0 0.0 0.0 0.0 0.0Population (million) 1.3 1.3 1.3 1.3 1.3 1.2 1.2 1.2 1.2 1.2 1.1Young population (0-14) as % of total 14.8 16.3 16.9 16.3 15.1 14.0 13.8 14.1 14.5 14.4 14.0Prime age population (25-54) as % of total 41.6 42.6 41.8 40.3 38.8 38.2 37.0 35.0 34.4 34.8 34.9Working age population (15-64)as % of total 68.0 66.1 64.3 63.5 63.2 63.2 62.1 60.4 58.1 55.7 55.3Elderly population (65 and over)as % of total 17.2 17.7 18.8 20.2 21.7 22.8 24.2 25.5 27.4 29.9 30.7Very elderly population (80 and over)as % of total 3.6 4.5 5.2 5.4 5.9 6.8 7.8 8.6 9.0 9.8 10.7Elderly population (55 and over)as % of working age pop.15-64 41.7 45.9 49.1 51.3 54.1 56.8 61.5 67.5 71.6 73.5 73.9
macroeconomic assumptions* 2007 2015 2020 2025 2030 2035 2040 2045 2050 2055 2060Potential GDP (growth rate) 7.8 3.2 2.6 2.3 2.2 1.3 1.0 0.7 0.6 0.8 1.2Employment (growth rate) 1.5 -0.7 -0.7 -0.7 -0.5 -0.5 -0.7 -0.9 -1.1 -0.9 -0.5Labour input : hours worked (growth rate) 1.6 -0.7 -0.7 -0.7 -0.5 -0.5 -0.7 -1.0 -1.1 -0.9 -0.5Labour productivity per hour (growth rate) 6.0 3.9 3.3 3.0 2.7 1.9 1.7 1.7 1.7 1.7 1.7TFP (growth rate) 2.7 1.8 1.8 1.8 1.8 1.2 1.1 1.1 1.1 1.1 1.1Capital deepening (contribution to labourproductivity growth) 3.3 2.1 1.6 1.2 0.9 0.7 0.6 0.6 0.6 0.6 0.6GDP per capita (growth rate) 8.0 3.4 2.8 2.6 2.6 1.7 1.4 1.1 1.0 1.2 1.7GDP in 2007 prices (in millions euros) 15.5 22.5 25.8 29.0 32.4 35.1 37.1 38.8 40.0 41.4 43.6
Labour force assumptions 2007 2015 2020 2025 2030 2035 2040 2045 2050 2055 2060Population growth (working age:15-64) -0.4 -0.9 -0.7 -0.6 -0.4 -0.6 -0.7 -0.9 -1.2 -1.2 -0.2Population growth (working age:15-71) -0.1 -0.6 -0.5 -0.4 -0.4 -0.5 -0.5 -0.8 -0.7 -0.9 -1.1Labour force (thousands) 689 675 651 628 611 596 579 555 525 499 483Participation rate (15-64) 72.9 75.4 75.4 74.6 74.3 73.9 74.1 74.0 73.7 74.1 74.5Participation rate (15-71) 68.0 70.2 69.0 68.0 67.6 67.6 67.2 66.9 65.7 64.9 66.1
young (15-24) 38.5 45.0 39.5 38.1 40.1 41.1 42.3 42.2 40.8 39.8 40.0prime-age (25-54) 88.4 87.5 87.6 87.8 87.8 87.6 87.3 87.4 87.8 87.9 87.8older (55-64) 62.4 60.6 62.8 63.7 64.6 63.8 64.5 64.4 61.9 61.0 64.1oldest (65-71) 23.1 17.6 15.3 15.7 16.1 16.3 16.5 16.6 17.1 16.8 15.3
Employment rate (15-64) 69.4 72.8 72.8 72.0 71.7 71.4 71.5 71.5 71.2 71.5 72.0Employment rate (15-71) 64.8 67.9 66.7 65.7 65.3 65.3 65.0 64.6 63.5 62.7 63.8Unemployment rate (15-64) 4.8 3.5 3.5 3.5 3.5 3.5 3.5 3.5 3.5 3.5 3.5Employment (15-64) (in millions) 0.6 0.6 0.6 0.6 0.6 0.6 0.5 0.5 0.5 0.5 0.5
share of young (15-24) 11% 9% 8% 8% 10% 10% 10% 9% 9% 9% 10%share of prime-age (25-54) 75% 75% 76% 75% 73% 72% 70% 69% 71% 74% 74%share of older (55-64) 14% 15% 17% 17% 17% 18% 20% 22% 21% 16% 16%
DepenDency ratios 2008 2015 2020 2025 2030 2035 2040 2045 2050 2055 2060Share of older population (55-64) (1) 16.5 19.1 20.0 19.4 19.7 20.7 22.5 25.4 24.4 19.9 18.4Old-age dependency ratio (2) 25 27 29 32 34 36 39 42 47 54 56Total dependency ratio (3) 47 51 55 58 58 58 61 66 72 80 81Total economic dependency ratio (4) 106 105 111 115 117 119 122 128 137 146 147Economic old-agedependency ratio (15-64) (5) 32 34 37 41 45 47 51 55 62 70 73Economic old-agedependency ratio (15-71) (6) 31 33 36 40 43 46 49 53 59 67 70
LEGENDA
* the potential GDP and its components is used to estimate the rate of potential output growth, net off normal cyclical variations(1) share of older population = Population aged 55 to 64 as % of population aged 15-64
(2) Old-age dependency ratio = Population aged 65 and over as a percentage of the population aged 15-64(3) total dependency ratio = Population under 15 and over 64 as a percentage of the population aged 15-64
(4) total economic dependency ratio = total population less employed as % of employed population 15-64(5) Economic old-age dependency ratio (15-64) = Inactive population aged 65+ as % of employed population 15-64(6) Economic old-age dependency ratio (15-71) = Inactive population aged 65+ as % of employed population 15-71
source : Eurostat (EUROPOP2008), Commission services (DG ECFIN), EPC (AwG)

186
European Economy 7/2008the 2009 Ageing Report: Underlying assumptions and projection methodologies for the EU-27 Member states
irelanD main DemograPhic anD macroeconomic assumPtions
(Baseline scenario)Budgetary Projection AWG – Population EUROPOP2008
Demographic assumptions 2008 2015 2020 2025 2030 2035 2040 2045 2050 2055 2060Fertility rate 1.90 1.90 1.90 1.89 1.89 1.89 1.89 1.89 1.88 1.88 1.88Life expectancy at birth
males 77.5 78.7 79.5 80.3 81.1 81.8 82.5 83.2 83.9 84.6 85.2females 81.9 83.0 83.8 84.6 85.3 86.0 86.7 87.4 88.0 88.6 89.2
Life expectancy at 65males 16.8 17.5 18.1 18.7 19.2 19.7 20.3 20.8 21.3 21.7 22.2females 19.7 20.6 21.2 21.7 22.3 22.8 23.4 23.9 24.4 24.9 25.4
Net migration (thousand) 63.1 34.5 21.7 13.5 8.7 6.5 6.0 8.0 7.4 7.9 8.6Net migration as % of population 1.4 0.7 0.4 0.2 0.1 0.1 0.1 0.1 0.1 0.1 0.1Population (million) 4.4 5.1 5.4 5.7 5.9 6.1 6.2 6.4 6.5 6.7 6.8Young population (0-14) as % of total 20.4 21.1 21.1 20.2 18.9 17.8 17.4 17.4 17.5 17.3 17.0Prime age population (25-54) as % of total 44.3 44.1 42.8 41.5 40.2 38.6 37.1 36.5 36.3 36.0 35.8Working age population (15-64)as % of total 68.4 66.6 65.6 65.2 65.1 64.6 63.3 61.1 58.8 57.8 57.8Elderly population (65 and over)as % of total 11.2 12.2 13.3 14.5 16.0 17.6 19.4 21.5 23.7 24.8 25.2Very elderly population (80 and over)as % of total 2.8 2.9 3.1 3.5 4.3 5.0 5.7 6.5 7.3 8.3 9.6Elderly population (55 and over)as % of working age pop.15-64 30.6 33.3 35.9 38.7 42.1 46.6 51.9 56.1 59.4 60.9 61.6
macroeconomic assumptions* 2007 2015 2020 2025 2030 2035 2040 2045 2050 2055 2060Potential GDP (growth rate) 5.2 3.4 2.9 2.6 2.3 2.1 1.8 1.5 1.6 1.8 2.0Employment (growth rate) 3.3 1.5 1.1 0.8 0.7 0.4 0.1 -0.2 -0.1 0.1 0.3Labour input : hours worked (growth rate) 2.9 1.5 1.0 0.8 0.7 0.4 0.1 -0.1 -0.1 0.1 0.3Labour productivity per hour (growth rate) 2.2 1.8 1.8 1.8 1.7 1.7 1.7 1.7 1.7 1.7 1.7TFP (growth rate) 1.4 1.1 1.1 1.1 1.1 1.1 1.1 1.1 1.1 1.1 1.1Capital deepening (contribution to labourproductivity growth) 0.8 0.7 0.7 0.7 0.6 0.6 0.6 0.6 0.6 0.6 0.6GDP per capita (growth rate) 2.6 1.7 1.7 1.7 1.7 1.5 1.3 1.0 1.1 1.4 1.7GDP in 2007 prices (in millions euros) 185.6 249.0 289.6 331.0 373.5 416.6 458.0 496.7 536.4 582.5 640.0
Labour force assumptions 2007 2015 2020 2025 2030 2035 2040 2045 2050 2055 2060Population growth (working age:15-64) 2.8 1.2 1.0 0.8 0.6 0.3 0.0 -0.4 -0.2 0.2 0.4Population growth (working age:15-71) 2.7 1.4 1.0 0.9 0.7 0.5 0.2 0.1 -0.1 -0.2 0.2Labour force (thousands) 2176 2582 2745 2874 2981 3061 3095 3084 3060 3056 3089Participation rate (15-64) 72.5 75.2 75.7 75.7 75.7 75.9 76.0 76.0 76.3 76.3 76.3Participation rate (15-71) 68.9 70.9 71.2 71.2 71.0 70.8 70.5 69.8 69.3 70.0 70.5
young (15-24) 55.4 54.5 53.4 53.1 53.5 54.5 55.3 55.0 54.3 53.9 53.9prime-age (25-54) 82.0 84.0 84.6 85.1 85.3 85.5 85.7 85.7 85.7 85.7 85.7older (55-64) 55.1 62.3 65.6 66.6 68.1 69.0 68.6 67.7 68.3 68.6 69.1oldest (65-71) 16.3 18.8 19.9 21.7 22.4 22.7 23.2 23.6 22.9 22.9 23.0
Employment rate (15-64) 69.1 71.4 71.8 71.9 71.9 72.0 72.1 72.2 72.5 72.5 72.4Employment rate (15-71) 65.8 67.4 67.7 67.7 67.5 67.3 67.0 66.4 65.9 66.5 67.1Unemployment rate (15-64) 4.7 5.1 5.1 5.1 5.1 5.1 5.1 5.1 5.1 5.1 5.1Employment (15-64) (in millions) 2.0 2.4 2.5 2.7 2.8 2.8 2.8 2.8 2.8 2.8 2.8
share of young (15-24) 16% 13% 13% 13% 14% 14% 14% 13% 13% 13% 13%share of prime-age (25-54) 73% 74% 73% 72% 70% 68% 67% 68% 70% 70% 70%share of older (55-64) 11% 13% 14% 15% 16% 18% 20% 19% 17% 17% 17%
DepenDency ratios 2008 2015 2020 2025 2030 2035 2040 2045 2050 2055 2060Share of older population (55-64) (1) 14.3 14.9 15.6 16.4 17.5 19.4 21.3 20.9 19.0 18.0 18.0Old-age dependency ratio (2) 16 18 20 22 25 27 31 35 40 43 44Total dependency ratio (3) 46 50 52 53 54 55 58 64 70 73 73Total economic dependency ratio (4) 108 108 109 110 110 111 115 121 129 133 134Economic old-agedependency ratio (15-64) (5) 21 23 25 28 30 34 38 43 50 53 55Economic old-agedependency ratio (15-71) (6) 21 23 25 27 30 33 36 42 47 51 53
LEGENDA
* the potential GDP and its components is used to estimate the rate of potential output growth, net off normal cyclical variations(1) share of older population = Population aged 55 to 64 as % of population aged 15-64
(2) Old-age dependency ratio = Population aged 65 and over as a percentage of the population aged 15-64(3) total dependency ratio = Population under 15 and over 64 as a percentage of the population aged 15-64
(4) total economic dependency ratio = total population less employed as % of employed population 15-64(5) Economic old-age dependency ratio (15-64) = Inactive population aged 65+ as % of employed population 15-64(6) Economic old-age dependency ratio (15-71) = Inactive population aged 65+ as % of employed population 15-71
source : Eurostat (EUROPOP2008), Commission services (DG ECFIN), EPC (AwG)
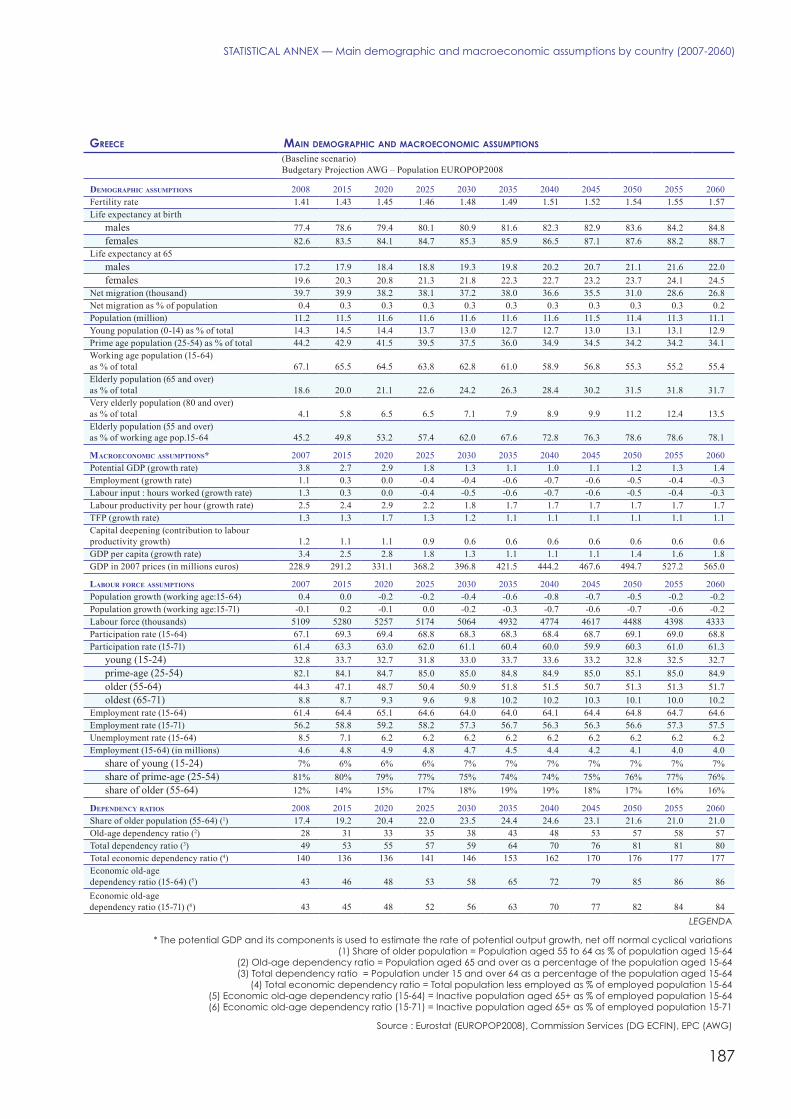
187
stAtIstICAl ANNEX — Main demographic and macroeconomic assumptions by country (2007-2060)
greece main DemograPhic anD macroeconomic assumPtions
(Baseline scenario)Budgetary Projection AWG – Population EUROPOP2008
Demographic assumptions 2008 2015 2020 2025 2030 2035 2040 2045 2050 2055 2060Fertility rate 1.41 1.43 1.45 1.46 1.48 1.49 1.51 1.52 1.54 1.55 1.57Life expectancy at birth
males 77.4 78.6 79.4 80.1 80.9 81.6 82.3 82.9 83.6 84.2 84.8females 82.6 83.5 84.1 84.7 85.3 85.9 86.5 87.1 87.6 88.2 88.7
Life expectancy at 65males 17.2 17.9 18.4 18.8 19.3 19.8 20.2 20.7 21.1 21.6 22.0females 19.6 20.3 20.8 21.3 21.8 22.3 22.7 23.2 23.7 24.1 24.5
Net migration (thousand) 39.7 39.9 38.2 38.1 37.2 38.0 36.6 35.5 31.0 28.6 26.8Net migration as % of population 0.4 0.3 0.3 0.3 0.3 0.3 0.3 0.3 0.3 0.3 0.2Population (million) 11.2 11.5 11.6 11.6 11.6 11.6 11.6 11.5 11.4 11.3 11.1Young population (0-14) as % of total 14.3 14.5 14.4 13.7 13.0 12.7 12.7 13.0 13.1 13.1 12.9Prime age population (25-54) as % of total 44.2 42.9 41.5 39.5 37.5 36.0 34.9 34.5 34.2 34.2 34.1Working age population (15-64)as % of total 67.1 65.5 64.5 63.8 62.8 61.0 58.9 56.8 55.3 55.2 55.4Elderly population (65 and over)as % of total 18.6 20.0 21.1 22.6 24.2 26.3 28.4 30.2 31.5 31.8 31.7Very elderly population (80 and over)as % of total 4.1 5.8 6.5 6.5 7.1 7.9 8.9 9.9 11.2 12.4 13.5Elderly population (55 and over)as % of working age pop.15-64 45.2 49.8 53.2 57.4 62.0 67.6 72.8 76.3 78.6 78.6 78.1
macroeconomic assumptions* 2007 2015 2020 2025 2030 2035 2040 2045 2050 2055 2060Potential GDP (growth rate) 3.8 2.7 2.9 1.8 1.3 1.1 1.0 1.1 1.2 1.3 1.4Employment (growth rate) 1.1 0.3 0.0 -0.4 -0.4 -0.6 -0.7 -0.6 -0.5 -0.4 -0.3Labour input : hours worked (growth rate) 1.3 0.3 0.0 -0.4 -0.5 -0.6 -0.7 -0.6 -0.5 -0.4 -0.3Labour productivity per hour (growth rate) 2.5 2.4 2.9 2.2 1.8 1.7 1.7 1.7 1.7 1.7 1.7TFP (growth rate) 1.3 1.3 1.7 1.3 1.2 1.1 1.1 1.1 1.1 1.1 1.1Capital deepening (contribution to labourproductivity growth) 1.2 1.1 1.1 0.9 0.6 0.6 0.6 0.6 0.6 0.6 0.6GDP per capita (growth rate) 3.4 2.5 2.8 1.8 1.3 1.1 1.1 1.1 1.4 1.6 1.8GDP in 2007 prices (in millions euros) 228.9 291.2 331.1 368.2 396.8 421.5 444.2 467.6 494.7 527.2 565.0
Labour force assumptions 2007 2015 2020 2025 2030 2035 2040 2045 2050 2055 2060Population growth (working age:15-64) 0.4 0.0 -0.2 -0.2 -0.4 -0.6 -0.8 -0.7 -0.5 -0.2 -0.2Population growth (working age:15-71) -0.1 0.2 -0.1 0.0 -0.2 -0.3 -0.7 -0.6 -0.7 -0.6 -0.2Labour force (thousands) 5109 5280 5257 5174 5064 4932 4774 4617 4488 4398 4333Participation rate (15-64) 67.1 69.3 69.4 68.8 68.3 68.3 68.4 68.7 69.1 69.0 68.8Participation rate (15-71) 61.4 63.3 63.0 62.0 61.1 60.4 60.0 59.9 60.3 61.0 61.3
young (15-24) 32.8 33.7 32.7 31.8 33.0 33.7 33.6 33.2 32.8 32.5 32.7prime-age (25-54) 82.1 84.1 84.7 85.0 85.0 84.8 84.9 85.0 85.1 85.0 84.9older (55-64) 44.3 47.1 48.7 50.4 50.9 51.8 51.5 50.7 51.3 51.3 51.7oldest (65-71) 8.8 8.7 9.3 9.6 9.8 10.2 10.2 10.3 10.1 10.0 10.2
Employment rate (15-64) 61.4 64.4 65.1 64.6 64.0 64.0 64.1 64.4 64.8 64.7 64.6Employment rate (15-71) 56.2 58.8 59.2 58.2 57.3 56.7 56.3 56.3 56.6 57.3 57.5Unemployment rate (15-64) 8.5 7.1 6.2 6.2 6.2 6.2 6.2 6.2 6.2 6.2 6.2Employment (15-64) (in millions) 4.6 4.8 4.9 4.8 4.7 4.5 4.4 4.2 4.1 4.0 4.0
share of young (15-24) 7% 6% 6% 6% 7% 7% 7% 7% 7% 7% 7%share of prime-age (25-54) 81% 80% 79% 77% 75% 74% 74% 75% 76% 77% 76%share of older (55-64) 12% 14% 15% 17% 18% 19% 19% 18% 17% 16% 16%
DepenDency ratios 2008 2015 2020 2025 2030 2035 2040 2045 2050 2055 2060Share of older population (55-64) (1) 17.4 19.2 20.4 22.0 23.5 24.4 24.6 23.1 21.6 21.0 21.0Old-age dependency ratio (2) 28 31 33 35 38 43 48 53 57 58 57Total dependency ratio (3) 49 53 55 57 59 64 70 76 81 81 80Total economic dependency ratio (4) 140 136 136 141 146 153 162 170 176 177 177Economic old-agedependency ratio (15-64) (5) 43 46 48 53 58 65 72 79 85 86 86Economic old-agedependency ratio (15-71) (6) 43 45 48 52 56 63 70 77 82 84 84
LEGENDA
* the potential GDP and its components is used to estimate the rate of potential output growth, net off normal cyclical variations(1) share of older population = Population aged 55 to 64 as % of population aged 15-64
(2) Old-age dependency ratio = Population aged 65 and over as a percentage of the population aged 15-64(3) total dependency ratio = Population under 15 and over 64 as a percentage of the population aged 15-64
(4) total economic dependency ratio = total population less employed as % of employed population 15-64(5) Economic old-age dependency ratio (15-64) = Inactive population aged 65+ as % of employed population 15-64(6) Economic old-age dependency ratio (15-71) = Inactive population aged 65+ as % of employed population 15-71
source : Eurostat (EUROPOP2008), Commission services (DG ECFIN), EPC (AwG)

188
European Economy 7/2008the 2009 Ageing Report: Underlying assumptions and projection methodologies for the EU-27 Member states
sPain main DemograPhic anD macroeconomic assumPtions
(Baseline scenario)Budgetary Projection AWG – Population EUROPOP2008
Demographic assumptions 2008 2015 2020 2025 2030 2035 2040 2045 2050 2055 2060Fertility rate 1.39 1.41 1.43 1.44 1.46 1.47 1.49 1.51 1.52 1.54 1.56Life expectancy at birth
males 77.4 78.6 79.4 80.1 80.9 81.6 82.3 83.0 83.7 84.3 84.9females 83.9 84.7 85.4 85.9 86.5 87.1 87.6 88.1 88.6 89.1 89.6
Life expectancy at 65males 17.1 17.8 18.3 18.8 19.3 19.8 20.3 20.8 21.2 21.7 22.1females 21.0 21.6 22.1 22.5 23.0 23.4 23.9 24.3 24.7 25.1 25.5
Net migration (thousand) 623.4 375.8 263.1 190.4 160.8 149.3 150.5 146.1 135.2 131.8 129.9Net migration as % of population 1.4 0.8 0.5 0.4 0.3 0.3 0.3 0.3 0.3 0.3 0.3Population (million) 45.3 49.4 51.1 52.1 52.7 53.0 53.3 53.4 53.2 52.7 51.9Young population (0-14) as % of total 14.6 15.7 15.5 14.5 13.4 12.8 12.7 13.0 13.2 13.1 12.9Prime age population (25-54) as % of total 46.9 45.5 43.4 40.9 38.4 36.1 34.8 34.2 33.9 33.9 33.7Working age population (15-64)as % of total 68.8 67.0 66.3 65.7 64.5 62.4 59.6 56.6 54.7 54.3 54.7Elderly population (65 and over)as % of total 16.6 17.3 18.2 19.8 22.1 24.8 27.7 30.5 32.1 32.6 32.3Very elderly population (80 and over)as % of total 4.6 5.3 5.4 5.7 6.4 7.2 8.3 9.7 11.3 12.9 14.5Elderly population (55 and over)as % of working age pop.15-64 39.7 42.9 46.6 51.3 57.4 64.8 71.5 77.0 80.1 80.3 79.6
macroeconomic assumptions* 2007 2015 2020 2025 2030 2035 2040 2045 2050 2055 2060Potential GDP (growth rate) 3.7 3.1 3.4 2.5 1.8 1.3 0.9 0.8 1.1 1.4 1.6Employment (growth rate) 3.3 1.2 0.8 0.1 -0.1 -0.4 -0.8 -0.9 -0.6 -0.3 -0.1Labour input : hours worked (growth rate) 2.7 1.2 0.8 0.1 -0.1 -0.4 -0.8 -0.9 -0.6 -0.3 -0.1Labour productivity per hour (growth rate) 1.0 1.9 2.7 2.4 1.9 1.8 1.7 1.7 1.7 1.7 1.7TFP (growth rate) 0.3 1.1 1.7 1.5 1.3 1.2 1.1 1.1 1.1 1.1 1.1Capital deepening (contribution to labourproductivity growth) 0.8 0.7 0.9 0.9 0.7 0.6 0.6 0.6 0.6 0.6 0.6GDP per capita (growth rate) 2.1 2.1 2.9 2.2 1.7 1.2 0.8 0.8 1.2 1.6 1.9GDP in 2007 prices (in millions euros) 1049.8 1323.8 1546.8 1774.3 1969.4 2126.3 2242.3 2337.3 2453.6 2610.5 2810.3
Labour force assumptions 2007 2015 2020 2025 2030 2035 2040 2045 2050 2055 2060Population growth (working age:15-64) 1.7 0.6 0.4 0.1 -0.3 -0.6 -0.9 -1.0 -0.5 -0.2 -0.1Population growth (working age:15-71) 1.4 0.7 0.5 0.4 0.0 -0.3 -0.6 -0.8 -0.9 -0.6 -0.3Labour force (thousands) 22032 25099 25941 26303 26395 26024 25139 24040 23179 22671 22443Participation rate (15-64) 71.6 75.2 75.7 75.8 76.4 77.0 77.2 77.4 77.6 77.4 77.3Participation rate (15-71) 66.3 69.2 69.4 68.9 68.6 68.3 67.7 67.0 67.5 68.4 69.0
young (15-24) 48.2 47.6 45.7 45.6 46.9 48.0 48.0 47.4 46.8 46.4 46.6prime-age (25-54) 82.9 85.5 86.2 86.9 87.1 87.2 87.4 87.4 87.5 87.4 87.4older (55-64) 47.5 58.4 63.5 66.8 70.9 73.1 72.7 72.5 73.1 73.3 74.0oldest (65-71) 4.5 7.6 8.5 9.5 10.2 10.8 11.5 11.5 11.1 11.2 11.3
Employment rate (15-64) 65.6 69.5 71.0 71.1 71.6 72.2 72.4 72.6 72.8 72.6 72.5Employment rate (15-71) 60.8 64.0 65.2 64.7 64.4 64.2 63.6 62.9 63.4 64.3 64.8Unemployment rate (15-64) 8.3 7.5 6.2 6.2 6.2 6.2 6.2 6.2 6.2 6.2 6.2Employment (15-64) (in millions) 20.1 23.0 24.1 24.3 24.3 23.9 23.0 21.9 21.2 20.8 20.6
share of young (15-24) 10% 9% 8% 9% 10% 10% 9% 9% 9% 10% 10%share of prime-age (25-54) 79% 78% 75% 72% 68% 66% 67% 69% 70% 71% 70%share of older (55-64) 11% 14% 16% 19% 22% 24% 24% 22% 20% 20% 20%
DepenDency ratios 2008 2015 2020 2025 2030 2035 2040 2045 2050 2055 2060Share of older population (55-64) (1) 15.5 17.1 19.2 21.2 23.1 25.1 25.1 23.2 21.4 20.3 20.5Old-age dependency ratio (2) 24 26 27 30 34 40 46 54 59 60 59Total dependency ratio (3) 45 49 51 52 55 60 68 77 83 84 83Total economic dependency ratio (4) 120 114 111 112 114 119 129 140 148 151 149Economic old-agedependency ratio (15-64) (5) 36 36 37 41 46 52 61 71 77 80 79Economic old-agedependency ratio (15-71) (6) 36 36 37 40 45 51 59 69 75 78 77
LEGENDA
* the potential GDP and its components is used to estimate the rate of potential output growth, net off normal cyclical variations(1) share of older population = Population aged 55 to 64 as % of population aged 15-64
(2) Old-age dependency ratio = Population aged 65 and over as a percentage of the population aged 15-64(3) total dependency ratio = Population under 15 and over 64 as a percentage of the population aged 15-64
(4) total economic dependency ratio = total population less employed as % of employed population 15-64(5) Economic old-age dependency ratio (15-64) = Inactive population aged 65+ as % of employed population 15-64(6) Economic old-age dependency ratio (15-71) = Inactive population aged 65+ as % of employed population 15-71
source : Eurostat (EUROPOP2008), Commission services (DG ECFIN), EPC (AwG)

189
stAtIstICAl ANNEX — Main demographic and macroeconomic assumptions by country (2007-2060)
france main DemograPhic anD macroeconomic assumPtions
(Baseline scenario)Budgetary Projection AWG – Population EUROPOP2008
Demographic assumptions 2008 2015 2020 2025 2030 2035 2040 2045 2050 2055 2060Fertility rate 1.98 1.98 1.97 1.97 1.96 1.96 1.95 1.95 1.94 1.94 1.93Life expectancy at birth
males 77.5 78.7 79.5 80.3 81.0 81.8 82.5 83.2 83.9 84.5 85.1females 84.3 85.2 85.8 86.4 87.0 87.6 88.1 88.6 89.1 89.6 90.1
Life expectancy at 65males 17.7 18.4 18.9 19.4 19.9 20.3 20.8 21.2 21.7 22.1 22.5females 22.0 22.7 23.1 23.5 23.9 24.3 24.7 25.1 25.5 25.8 26.2
Net migration (thousand) 99.3 97.4 92.5 88.9 86.5 82.6 76.9 73.9 69.9 66.4 62.9Net migration as % of population 0.2 0.2 0.1 0.1 0.1 0.1 0.1 0.1 0.1 0.1 0.1Population (million) 61.9 64.2 65.6 66.8 68.0 69.0 69.9 70.6 71.0 71.4 71.8Young population (0-14) as % of total 18.3 18.4 18.2 17.8 17.4 17.1 17.0 17.1 17.0 16.9 16.7Prime age population (25-54) as % of total 40.6 38.8 37.4 36.2 35.3 35.3 35.2 35.0 35.0 35.0 34.9Working age population (15-64)as % of total 65.2 63.1 61.6 60.5 59.4 58.5 57.6 57.5 57.3 57.3 57.4Elderly population (65 and over)as % of total 16.5 18.5 20.2 21.7 23.2 24.4 25.3 25.4 25.6 25.9 25.9Very elderly population (80 and over)as % of total 5.0 5.9 6.0 6.1 7.3 8.5 9.3 10.0 10.5 10.9 10.8Elderly population (55 and over)as % of working age pop.15-64 43.7 49.1 52.9 56.2 59.4 61.1 62.9 63.6 63.9 64.0 64.3
macroeconomic assumptions* 2007 2015 2020 2025 2030 2035 2040 2045 2050 2055 2060Potential GDP (growth rate) 2.1 2.0 1.9 1.8 1.7 1.8 1.8 1.8 1.8 1.8 1.8Employment (growth rate) 1.0 0.3 0.1 0.1 0.0 0.1 0.1 0.1 0.1 0.2 0.1Labour input : hours worked (growth rate) 0.6 0.3 0.1 0.1 0.0 0.1 0.1 0.1 0.1 0.2 0.1Labour productivity per hour (growth rate) 1.5 1.7 1.7 1.7 1.7 1.7 1.7 1.7 1.7 1.7 1.7TFP (growth rate) 0.9 1.1 1.1 1.1 1.1 1.1 1.1 1.1 1.1 1.1 1.1Capital deepening (contribution to labourproductivity growth) 0.7 0.6 0.6 0.6 0.6 0.6 0.6 0.6 0.6 0.6 0.6GDP per capita (growth rate) 1.5 1.5 1.5 1.4 1.4 1.5 1.6 1.6 1.7 1.7 1.7GDP in 2007 prices (in millions euros) 1892.2 2212.8 2437.9 2663.0 2900.1 3165.0 3463.3 3781.2 4129.6 4516.2 4944.9
Labour force assumptions 2007 2015 2020 2025 2030 2035 2040 2045 2050 2055 2060Population growth (working age:15-64) 0.7 -0.1 0.0 0.0 -0.1 0.0 0.0 0.1 0.1 0.1 0.2Population growth (working age:15-71) 0.4 0.5 0.0 0.0 0.0 0.0 0.0 -0.1 0.2 0.1 0.1Labour force (thousands) 28335 28926 29011 29077 29098 29188 29368 29481 29601 29767 29975Participation rate (15-64) 70.3 70.6 70.8 70.7 70.9 71.1 71.7 71.5 71.5 71.6 71.6Participation rate (15-71) 65.0 64.1 63.5 63.6 63.5 63.6 64.2 64.6 64.5 64.5 64.5
young (15-24) 39.4 40.5 39.7 39.9 40.2 40.4 40.4 40.3 40.1 40.0 40.2prime-age (25-54) 88.3 88.6 88.8 88.9 88.9 88.9 88.9 88.9 89.0 88.9 88.9older (55-64) 41.0 42.9 46.1 47.7 48.8 47.6 49.4 48.9 48.4 48.7 49.3oldest (65-71) 3.2 7.5 7.5 8.6 8.3 8.9 9.1 8.9 9.1 9.1 9.0
Employment rate (15-64) 64.7 65.6 66.4 66.4 66.5 66.7 67.3 67.1 67.1 67.2 67.2Employment rate (15-71) 59.8 59.6 59.6 59.7 59.6 59.7 60.3 60.6 60.5 60.5 60.6Unemployment rate (15-64) 8.0 7.0 6.2 6.2 6.2 6.2 6.2 6.2 6.2 6.2 6.2Employment (15-64) (in millions) 26.0 26.6 26.8 26.8 26.9 26.9 27.1 27.2 27.3 27.5 27.7
share of young (15-24) 10% 10% 10% 10% 10% 11% 10% 10% 10% 10% 10%share of prime-age (25-54) 80% 78% 77% 76% 75% 76% 76% 76% 77% 77% 76%share of older (55-64) 11% 12% 13% 14% 14% 13% 13% 14% 13% 13% 13%
DepenDency ratios 2008 2015 2020 2025 2030 2035 2040 2045 2050 2055 2060Share of older population (55-64) (1) 18.4 19.8 20.1 20.4 20.4 19.4 18.9 19.4 19.2 18.8 19.1Old-age dependency ratio (2) 25 29 33 36 39 42 44 44 45 45 45Total dependency ratio (3) 53 59 62 65 68 71 74 74 74 75 74Total economic dependency ratio (4) 137 140 143 147 151 155 156 157 158 158 158Economic old-agedependency ratio (15-64) (5) 39 43 48 52 57 61 64 64 65 66 66Economic old-agedependency ratio (15-71) (6) 39 43 47 51 56 60 62 63 64 64 65
LEGENDA
* the potential GDP and its components is used to estimate the rate of potential output growth, net off normal cyclical variations(1) share of older population = Population aged 55 to 64 as % of population aged 15-64
(2) Old-age dependency ratio = Population aged 65 and over as a percentage of the population aged 15-64(3) total dependency ratio = Population under 15 and over 64 as a percentage of the population aged 15-64
(4) total economic dependency ratio = total population less employed as % of employed population 15-64(5) Economic old-age dependency ratio (15-64) = Inactive population aged 65+ as % of employed population 15-64(6) Economic old-age dependency ratio (15-71) = Inactive population aged 65+ as % of employed population 15-71
source : Eurostat (EUROPOP2008), Commission services (DG ECFIN), EPC (AwG)

190
European Economy 7/2008the 2009 Ageing Report: Underlying assumptions and projection methodologies for the EU-27 Member states
italy main DemograPhic anD macroeconomic assumPtions
(Baseline scenario)Budgetary Projection AWG – Population EUROPOP2008
Demographic assumptions 2008 2015 2020 2025 2030 2035 2040 2045 2050 2055 2060Fertility rate 1.38 1.41 1.42 1.44 1.46 1.47 1.49 1.51 1.52 1.54 1.55Life expectancy at birth
males 78.5 79.6 80.3 81.0 81.7 82.4 83.1 83.7 84.3 84.9 85.5females 84.2 85.1 85.7 86.3 86.9 87.5 88.0 88.5 89.0 89.5 90.0
Life expectancy at 65males 17.5 18.2 18.7 19.2 19.7 20.2 20.6 21.1 21.5 22.0 22.4females 21.4 22.1 22.5 23.0 23.4 23.9 24.3 24.7 25.1 25.5 25.9
Net migration (thousand) 259.5 248.6 240.8 240.8 248.7 239.9 229.5 206.9 193.4 185.8 174.3Net migration as % of population 0.4 0.4 0.4 0.4 0.4 0.4 0.4 0.3 0.3 0.3 0.3Population (million) 59.5 60.9 61.4 61.7 61.9 62.0 62.0 61.8 61.2 60.4 59.4Young population (0-14) as % of total 14.0 13.9 13.4 12.7 12.2 12.1 12.2 12.3 12.3 12.2 12.1Prime age population (25-54) as % of total 43.7 42.3 40.5 38.2 36.3 35.3 34.9 34.6 34.1 34.0 33.7Working age population (15-64)as % of total 65.9 64.5 63.9 63.3 61.6 59.3 57.0 55.5 55.1 55.1 55.1Elderly population (65 and over)as % of total 20.1 21.7 22.7 24.0 26.2 28.6 30.8 32.2 32.6 32.7 32.7Very elderly population (80 and over)as % of total 5.5 6.6 7.3 7.7 8.5 9.1 10.0 11.5 13.1 14.4 14.9Elderly population (55 and over)as % of working age pop.15-64 48.8 52.9 57.1 62.0 67.8 73.2 77.3 80.0 81.4 81.6 81.7
macroeconomic assumptions* 2007 2015 2020 2025 2030 2035 2040 2045 2050 2055 2060Potential GDP (growth rate) 1.5 2.1 1.9 1.7 1.4 1.1 1.0 1.2 1.3 1.4 1.4Employment (growth rate) 1.3 0.5 0.2 0.0 -0.3 -0.7 -0.7 -0.5 -0.4 -0.3 -0.3Labour input : hours worked (growth rate) 1.2 0.5 0.2 0.0 -0.3 -0.6 -0.6 -0.5 -0.4 -0.3 -0.3Labour productivity per hour (growth rate) 0.3 1.5 1.6 1.7 1.7 1.7 1.7 1.7 1.7 1.7 1.7TFP (growth rate) 0.1 1.1 1.1 1.1 1.1 1.1 1.1 1.1 1.1 1.1 1.1Capital deepening (contribution to labourproductivity growth) 0.2 0.4 0.5 0.6 0.6 0.6 0.6 0.6 0.6 0.6 0.6GDP per capita (growth rate) 0.9 1.8 1.7 1.6 1.3 1.0 1.1 1.3 1.5 1.7 1.8GDP in 2007 prices (in millions euros) 1535.5 1751.6 1925.5 2102.5 2264.6 2399.5 2525.0 2671.7 2846.9 3042.9 3258.6
Labour force assumptions 2007 2015 2020 2025 2030 2035 2040 2045 2050 2055 2060Population growth (working age:15-64) 0.4 -0.1 0.0 -0.2 -0.7 -0.8 -0.8 -0.4 -0.3 -0.3 -0.3Population growth (working age:15-71) 0.4 0.2 -0.1 0.1 -0.2 -0.5 -0.7 -0.7 -0.5 -0.3 -0.3Labour force (thousands) 24729 26162 26560 26688 26403 25688 24825 24135 23636 23218 22853Participation rate (15-64) 62.6 65.7 66.4 66.9 67.4 67.6 67.7 68.0 67.9 67.7 67.7Participation rate (15-71) 56.8 59.5 60.1 60.4 60.0 59.5 59.4 59.8 60.5 60.6 60.4
young (15-24) 31.2 32.7 31.9 31.9 32.7 33.0 32.7 32.3 32.1 32.1 32.3prime-age (25-54) 77.6 78.4 78.8 79.1 78.9 78.7 78.8 78.9 78.9 78.9 78.8older (55-64) 34.7 48.7 54.0 58.8 62.3 62.6 61.9 62.4 62.8 62.6 63.1oldest (65-71) 6.5 7.2 9.9 11.2 12.2 13.2 13.8 13.6 13.6 13.8 13.7
Employment rate (15-64) 58.7 62.0 62.6 63.1 63.5 63.7 63.8 64.0 64.0 63.8 63.8Employment rate (15-71) 53.3 56.1 56.7 57.0 56.7 56.1 56.1 56.5 57.1 57.2 57.0Unemployment rate (15-64) 6.2 5.8 5.8 5.8 5.8 5.8 5.8 5.8 5.8 5.8 5.8Employment (15-64) (in millions) 22.9 24.3 24.6 24.6 24.2 23.4 22.6 22.0 21.6 21.2 20.9
share of young (15-24) 7% 6% 6% 6% 6% 6% 6% 6% 6% 6% 7%share of prime-age (25-54) 83% 79% 76% 72% 69% 70% 72% 73% 72% 72% 72%share of older (55-64) 10% 15% 18% 22% 24% 24% 22% 21% 21% 21% 22%
DepenDency ratios 2008 2015 2020 2025 2030 2035 2040 2045 2050 2055 2060Share of older population (55-64) (1) 18.3 19.3 21.6 24.1 25.3 24.9 23.3 22.2 22.1 22.1 22.4Old-age dependency ratio (2) 30 34 35 38 42 48 54 58 59 59 59Total dependency ratio (3) 52 55 56 58 62 69 75 80 82 82 81Total economic dependency ratio (4) 156 149 148 148 152 161 171 177 180 181 181Economic old-agedependency ratio (15-64) (5) 50 53 55 58 64 72 80 86 89 89 89Economic old-agedependency ratio (15-71) (6) 50 52 54 56 62 69 77 83 86 87 86
LEGENDA
* the potential GDP and its components is used to estimate the rate of potential output growth, net off normal cyclical variations(1) share of older population = Population aged 55 to 64 as % of population aged 15-64
(2) Old-age dependency ratio = Population aged 65 and over as a percentage of the population aged 15-64(3) total dependency ratio = Population under 15 and over 64 as a percentage of the population aged 15-64
(4) total economic dependency ratio = total population less employed as % of employed population 15-64(5) Economic old-age dependency ratio (15-64) = Inactive population aged 65+ as % of employed population 15-64(6) Economic old-age dependency ratio (15-71) = Inactive population aged 65+ as % of employed population 15-71
source : Eurostat (EUROPOP2008), Commission services (DG ECFIN), EPC (AwG)

191
stAtIstICAl ANNEX — Main demographic and macroeconomic assumptions by country (2007-2060)
cyPrus main DemograPhic anD macroeconomic assumPtions
(Baseline scenario)Budgetary Projection AWG – Population EUROPOP2008
Demographic assumptions 2008 2015 2020 2025 2030 2035 2040 2045 2050 2055 2060Fertility rate 1.45 1.47 1.49 1.50 1.52 1.53 1.54 1.56 1.57 1.59 1.60Life expectancy at birth
males 78.2 79.3 80.0 80.8 81.5 82.1 82.8 83.4 84.0 84.6 85.2females 81.7 82.8 83.5 84.2 84.9 85.6 86.2 86.9 87.5 88.1 88.7
Life expectancy at 65males 17.1 17.8 18.3 18.8 19.3 19.7 20.2 20.6 21.1 21.5 22.0females 19.0 19.8 20.3 20.9 21.5 22.0 22.5 23.1 23.6 24.1 24.6
Net migration (thousand) 9.3 8.8 8.5 8.2 7.8 7.5 7.2 6.9 6.6 6.2 5.9Net migration as % of population 1.2 1.0 0.9 0.8 0.7 0.7 0.6 0.6 0.5 0.5 0.4Population (million) 0.8 0.9 1.0 1.0 1.1 1.1 1.2 1.2 1.3 1.3 1.3Young population (0-14) as % of total 17.5 16.9 17.4 17.4 16.6 15.7 15.1 14.9 15.1 15.1 15.0Prime age population (25-54) as % of total 43.9 44.7 44.3 43.7 42.6 41.5 40.0 38.9 37.8 37.2 37.0Working age population (15-64)as % of total 70.1 69.3 67.5 66.1 65.4 65.3 64.9 63.8 61.7 60.0 58.8Elderly population (65 and over)as % of total 12.4 13.8 15.0 16.5 17.9 19.0 20.0 21.3 23.2 24.8 26.2Very elderly population (80 and over)as % of total 2.8 3.0 3.4 3.9 4.6 5.3 6.1 6.8 7.3 7.8 8.6Elderly population (55 and over)as % of working age pop.15-64 32.9 36.3 39.6 42.2 44.5 47.1 51.1 54.9 59.1 62.0 63.8
macroeconomic assumptions* 2007 2015 2020 2025 2030 2035 2040 2045 2050 2055 2060Potential GDP (growth rate) 3.6 3.8 3.9 3.2 2.9 2.6 2.3 2.0 1.8 1.8 1.8Employment (growth rate) 2.1 1.7 1.2 0.9 0.9 0.8 0.6 0.3 0.1 0.1 0.2Labour input : hours worked (growth rate) 1.9 1.7 1.1 0.9 0.8 0.8 0.6 0.3 0.1 0.1 0.2Labour productivity per hour (growth rate) 1.7 2.1 2.7 2.3 2.0 1.9 1.8 1.7 1.7 1.7 1.7TFP (growth rate) 0.7 1.3 1.7 1.5 1.3 1.2 1.2 1.1 1.1 1.1 1.1Capital deepening (contribution to labourproductivity growth) 1.0 0.8 1.0 0.9 0.7 0.6 0.6 0.6 0.6 0.6 0.6GDP per capita (growth rate) 2.0 2.2 2.4 2.0 1.8 1.7 1.6 1.3 1.2 1.2 1.4GDP in 2007 prices (in millions euros) 15.6 20.9 25.2 29.9 34.6 39.5 44.6 49.7 54.5 59.5 65.0
Labour force assumptions 2007 2015 2020 2025 2030 2035 2040 2045 2050 2055 2060Population growth (working age:15-64) 1.9 1.0 0.9 0.8 0.9 0.9 0.6 0.2 -0.1 0.1 0.1Population growth (working age:15-71) 2.0 1.3 1.0 1.0 0.9 0.8 0.7 0.5 0.3 0.1 0.1Labour force (thousands) 403 485 520 544 567 591 611 623 628 630 633Participation rate (15-64) 72.9 76.9 78.5 78.6 78.4 78.2 78.0 77.8 78.0 78.0 78.0Participation rate (15-71) 68.9 72.5 73.5 73.4 72.9 72.9 72.7 72.0 71.3 71.1 71.2
young (15-24) 44.2 46.3 46.0 43.0 42.7 43.7 44.4 44.8 44.6 43.8 43.4prime-age (25-54) 86.7 90.1 91.1 91.6 91.7 91.7 91.7 91.7 91.7 91.8 91.8older (55-64) 57.6 61.1 62.7 63.1 64.6 65.9 66.6 65.4 65.4 65.0 65.1oldest (65-71) 17.5 21.4 21.9 22.9 23.1 23.2 23.8 24.1 24.2 23.9 24.1
Employment rate (15-64) 69.7 74.3 75.8 75.9 75.7 75.5 75.3 75.1 75.3 75.3 75.3Employment rate (15-71) 65.9 70.1 71.1 70.9 70.4 70.5 70.3 69.6 68.9 68.7 68.9Unemployment rate (15-64) 4.4 3.4 3.4 3.4 3.4 3.4 3.4 3.4 3.4 3.4 3.4Employment (15-64) (in millions) 0.4 0.5 0.5 0.5 0.5 0.6 0.6 0.6 0.6 0.6 0.6
share of young (15-24) 13% 11% 9% 9% 9% 10% 10% 10% 9% 9% 9%share of prime-age (25-54) 75% 76% 77% 77% 77% 75% 73% 72% 73% 73% 74%share of older (55-64) 12% 13% 14% 14% 14% 15% 17% 18% 18% 17% 16%
DepenDency ratios 2008 2015 2020 2025 2030 2035 2040 2045 2050 2055 2060Share of older population (55-64) (1) 15.2 16.4 17.4 17.2 17.1 18.1 20.3 21.6 21.5 20.7 19.4Old-age dependency ratio (2) 18 20 22 25 27 29 31 33 38 41 44Total dependency ratio (3) 43 44 48 51 53 53 54 57 62 67 70Total economic dependency ratio (4) 99 91 92 95 98 99 100 104 110 115 120Economic old-agedependency ratio (15-64) (5) 23 24 26 29 32 34 37 40 44 49 53Economic old-agedependency ratio (15-71) (6) 22 23 25 28 31 33 35 38 43 47 51
LEGENDA
* the potential GDP and its components is used to estimate the rate of potential output growth, net off normal cyclical variations(1) share of older population = Population aged 55 to 64 as % of population aged 15-64
(2) Old-age dependency ratio = Population aged 65 and over as a percentage of the population aged 15-64(3) total dependency ratio = Population under 15 and over 64 as a percentage of the population aged 15-64
(4) total economic dependency ratio = total population less employed as % of employed population 15-64(5) Economic old-age dependency ratio (15-64) = Inactive population aged 65+ as % of employed population 15-64(6) Economic old-age dependency ratio (15-71) = Inactive population aged 65+ as % of employed population 15-71
source : Eurostat (EUROPOP2008), Commission services (DG ECFIN), EPC (AwG)

192
European Economy 7/2008the 2009 Ageing Report: Underlying assumptions and projection methodologies for the EU-27 Member states
latvia main DemograPhic anD macroeconomic assumPtions
(Baseline scenario)Budgetary Projection AWG – Population EUROPOP2008
Demographic assumptions 2008 2015 2020 2025 2030 2035 2040 2045 2050 2055 2060Fertility rate 1.36 1.38 1.40 1.41 1.43 1.45 1.47 1.48 1.50 1.52 1.54Life expectancy at birth
males 66.0 68.2 69.8 71.3 72.8 74.2 75.6 76.9 78.1 79.3 80.5females 76.7 78.3 79.4 80.5 81.5 82.5 83.4 84.3 85.2 86.0 86.8
Life expectancy at 65males 12.7 13.7 14.5 15.2 16.0 16.7 17.4 18.1 18.8 19.5 20.1females 17.1 18.1 18.8 19.5 20.1 20.8 21.4 22.0 22.6 23.2 23.8
Net migration (thousand) -1.0 -0.3 -0.3 -0.2 -0.6 -0.2 0.1 0.3 0.7 0.5 -0.6Net migration as % of population 0.0 0.0 0.0 0.0 0.0 0.0 0.0 0.0 0.0 0.0 0.0Population (million) 2.3 2.2 2.2 2.1 2.0 2.0 1.9 1.9 1.8 1.7 1.7Young population (0-14) as % of total 13.7 14.7 15.3 14.8 13.6 12.6 12.1 12.3 12.6 12.6 12.3Prime age population (25-54) as % of total 42.4 44.1 43.5 41.7 40.0 39.1 37.3 34.7 33.3 33.8 33.8Working age population (15-64)as % of total 69.0 67.6 66.1 65.0 64.2 63.8 62.4 60.6 57.8 54.6 53.3Elderly population (65 and over)as % of total 17.3 17.7 18.6 20.2 22.2 23.7 25.4 27.1 29.6 32.8 34.4Very elderly population (80 and over)as % of total 3.6 4.5 5.2 5.6 5.9 6.7 7.9 9.2 9.9 10.9 11.9Elderly population (55 and over)as % of working age pop.15-64 41.0 44.9 48.5 51.4 55.0 58.5 64.4 72.1 78.5 82.0 83.9
macroeconomic assumptions* 2007 2015 2020 2025 2030 2035 2040 2045 2050 2055 2060Potential GDP (growth rate) 8.6 3.0 2.1 2.0 1.8 1.0 0.7 0.2 -0.1 0.4 1.1Employment (growth rate) 2.1 -1.0 -1.2 -1.0 -0.9 -0.9 -1.0 -1.5 -1.9 -1.3 -0.6Labour input : hours worked (growth rate) 2.0 -1.0 -1.2 -1.0 -0.9 -0.9 -1.0 -1.5 -1.9 -1.3 -0.6Labour productivity per hour (growth rate) 6.4 3.9 3.3 3.0 2.7 1.9 1.7 1.7 1.7 1.7 1.7TFP (growth rate) 3.1 1.9 1.8 1.8 1.8 1.2 1.1 1.1 1.1 1.1 1.1Capital deepening (contribution to labourproductivity growth) 3.3 2.0 1.6 1.2 1.0 0.7 0.6 0.6 0.6 0.6 0.6GDP per capita (growth rate) 9.2 3.4 2.6 2.5 2.5 1.6 1.3 0.8 0.5 1.1 1.9GDP in 2007 prices (in millions euros) 19.9 28.8 32.5 35.8 39.3 41.8 43.6 44.5 44.3 44.6 46.7
Labour force assumptions 2007 2015 2020 2025 2030 2035 2040 2045 2050 2055 2060Population growth (working age:15-64) -0.5 -1.0 -0.9 -0.9 -0.7 -0.8 -1.1 -1.2 -1.7 -1.7 -0.7Population growth (working age:15-71) -0.2 -0.9 -0.7 -0.6 -0.7 -0.9 -0.9 -1.1 -1.0 -1.3 -1.7Labour force (thousands) 1184 1150 1085 1024 980 937 895 841 768 708 681Participation rate (15-64) 72.9 76.1 75.3 74.0 73.9 73.4 73.7 73.3 72.0 72.3 74.2Participation rate (15-71) 67.8 70.6 68.7 66.8 66.1 65.9 65.7 64.9 62.5 61.1 63.5
young (15-24) 43.4 50.9 43.4 42.4 43.9 45.2 46.5 46.5 45.2 44.0 44.1prime-age (25-54) 87.1 86.9 87.1 87.3 87.1 87.0 87.1 87.3 87.5 87.4 87.3older (55-64) 60.4 60.0 58.5 56.2 58.6 57.1 58.8 59.1 54.4 50.6 58.1oldest (65-71) 21.8 13.1 9.0 9.4 9.2 9.1 9.2 9.1 9.2 9.1 8.9
Employment rate (15-64) 68.5 72.4 71.6 70.4 70.3 69.8 70.1 69.8 68.5 68.8 70.6Employment rate (15-71) 63.8 67.2 65.4 63.6 62.9 62.7 62.5 61.8 59.5 58.2 60.5Unemployment rate (15-64) 6.1 4.8 4.8 4.8 4.8 4.8 4.8 4.8 4.8 4.8 4.8Employment (15-64) (in millions) 1.1 1.1 1.0 1.0 0.9 0.9 0.8 0.8 0.7 0.7 0.6
share of young (15-24) 13% 10% 8% 9% 10% 10% 10% 9% 9% 9% 10%share of prime-age (25-54) 74% 75% 76% 76% 74% 73% 71% 68% 70% 75% 75%share of older (55-64) 14% 15% 16% 16% 16% 17% 19% 22% 21% 16% 15%
DepenDency ratios 2008 2015 2020 2025 2030 2035 2040 2045 2050 2055 2060Share of older population (55-64) (1) 16.0 18.6 20.4 20.3 20.5 21.4 23.7 27.4 27.3 22.0 19.4Old-age dependency ratio (2) 25 26 28 31 35 37 41 45 51 60 64Total dependency ratio (3) 45 48 51 54 56 57 60 65 73 83 87Total economic dependency ratio (4) 106 102 110 117 120 123 126 134 150 163 163Economic old-agedependency ratio (15-64) (5) 32 34 38 42 47 51 56 62 72 84 88Economic old-agedependency ratio (15-71) (6) 31 33 37 42 46 50 55 61 70 82 86
LEGENDA
* the potential GDP and its components is used to estimate the rate of potential output growth, net off normal cyclical variations(1) share of older population = Population aged 55 to 64 as % of population aged 15-64
(2) Old-age dependency ratio = Population aged 65 and over as a percentage of the population aged 15-64(3) total dependency ratio = Population under 15 and over 64 as a percentage of the population aged 15-64
(4) total economic dependency ratio = total population less employed as % of employed population 15-64(5) Economic old-age dependency ratio (15-64) = Inactive population aged 65+ as % of employed population 15-64(6) Economic old-age dependency ratio (15-71) = Inactive population aged 65+ as % of employed population 15-71
source : Eurostat (EUROPOP2008), Commission services (DG ECFIN), EPC (AwG)

193
stAtIstICAl ANNEX — Main demographic and macroeconomic assumptions by country (2007-2060)
lithuania main DemograPhic anD macroeconomic assumPtions
(Baseline scenario)Budgetary Projection AWG – Population EUROPOP2008
Demographic assumptions 2008 2015 2020 2025 2030 2035 2040 2045 2050 2055 2060Fertility rate 1.35 1.37 1.39 1.41 1.43 1.45 1.47 1.49 1.51 1.52 1.54Life expectancy at birth
males 65.9 68.2 69.8 71.3 72.8 74.2 75.6 76.9 78.1 79.3 80.4females 77.4 78.9 80.0 80.9 81.9 82.8 83.7 84.5 85.3 86.1 86.9
Life expectancy at 65males 13.1 14.1 14.9 15.6 16.3 17.0 17.7 18.3 19.0 19.6 20.3females 17.5 18.4 19.0 19.7 20.3 20.9 21.5 22.1 22.6 23.2 23.7
Net migration (thousand) -2.2 -0.7 -0.2 0.2 -0.3 -0.1 -0.2 0.3 1.2 1.0 -0.1Net migration as % of population -0.1 0.0 0.0 0.0 0.0 0.0 0.0 0.0 0.0 0.0 0.0Population (million) 3.4 3.3 3.2 3.2 3.1 3.0 2.9 2.8 2.7 2.6 2.5Young population (0-14) as % of total 15.3 14.3 14.8 14.8 14.1 13.0 12.1 12.0 12.2 12.5 12.4Prime age population (25-54) as % of total 42.5 44.0 43.5 42.1 40.1 38.9 37.4 35.0 33.1 32.5 32.6Working age population (15-64)as % of total 68.8 69.1 67.6 65.7 63.8 62.7 61.5 60.3 58.1 55.0 52.9Elderly population (65 and over)as % of total 15.8 16.6 17.6 19.5 22.1 24.3 26.3 27.7 29.7 32.5 34.7Very elderly population (80 and over)as % of total 3.3 4.4 4.9 5.3 5.6 6.4 7.8 9.6 10.7 11.5 12.0Elderly population (55 and over)as % of working age pop.15-64 38.1 41.7 46.5 51.2 56.0 59.8 65.2 72.0 79.1 84.5 87.4
macroeconomic assumptions* 2007 2015 2020 2025 2030 2035 2040 2045 2050 2055 2060Potential GDP (growth rate) 8.0 3.6 2.5 1.8 1.5 0.8 0.8 0.5 0.2 0.2 0.4Employment (growth rate) 1.8 -0.1 -0.9 -1.2 -1.2 -1.1 -0.9 -1.2 -1.5 -1.5 -1.3Labour input : hours worked (growth rate) 2.4 -0.1 -0.9 -1.2 -1.2 -1.1 -0.9 -1.2 -1.5 -1.5 -1.3Labour productivity per hour (growth rate) 5.4 3.7 3.3 3.0 2.7 1.9 1.7 1.7 1.7 1.7 1.7TFP (growth rate) 2.8 1.8 1.8 1.8 1.8 1.2 1.1 1.1 1.1 1.1 1.1Capital deepening (contribution to labourproductivity growth) 2.6 1.9 1.6 1.3 1.0 0.7 0.6 0.6 0.6 0.6 0.6GDP per capita (growth rate) 8.6 3.9 2.8 2.2 2.0 1.4 1.4 1.1 0.9 0.9 1.2GDP in 2007 prices (in millions euros) 28.0 41.0 47.4 52.4 56.7 59.5 61.9 63.8 64.7 65.3 66.4
Labour force assumptions 2007 2015 2020 2025 2030 2035 2040 2045 2050 2055 2060Population growth (working age:15-64) -0.1 -0.6 -0.8 -1.1 -1.0 -0.9 -0.9 -1.1 -1.6 -1.7 -1.1Population growth (working age:15-71) 0.0 -0.6 -0.5 -0.6 -0.7 -1.0 -1.0 -1.1 -1.0 -1.2 -1.6Labour force (thousands) 1604 1635 1592 1506 1417 1337 1275 1207 1125 1042 971Participation rate (15-64) 68.1 70.6 71.0 70.1 69.1 68.3 68.3 68.1 67.6 67.6 68.2Participation rate (15-71) 63.0 66.4 66.3 64.8 62.9 62.1 62.0 62.0 60.7 59.3 59.6
young (15-24) 28.3 33.4 31.8 29.0 28.2 29.0 30.3 31.2 30.8 29.6 29.1prime-age (25-54) 86.0 84.4 84.0 84.0 83.8 83.4 83.1 83.3 83.7 83.8 83.7older (55-64) 55.5 59.9 59.4 56.3 56.0 55.3 56.9 56.9 54.8 53.1 54.1oldest (65-71) 10.7 18.7 20.0 20.9 20.2 19.5 19.4 19.2 19.2 19.0 18.8
Employment rate (15-64) 65.1 68.1 68.5 67.6 66.7 65.9 65.9 65.7 65.2 65.2 65.8Employment rate (15-71) 60.3 64.1 64.1 62.6 60.7 60.0 59.9 59.9 58.6 57.3 57.6Unemployment rate (15-64) 4.4 3.5 3.5 3.5 3.5 3.5 3.5 3.5 3.5 3.5 3.5Employment (15-64) (in millions) 1.5 1.5 1.5 1.4 1.3 1.2 1.2 1.1 1.0 0.9 0.9
share of young (15-24) 9% 9% 7% 6% 6% 7% 7% 7% 7% 7% 7%share of prime-age (25-54) 78% 76% 76% 77% 76% 76% 74% 71% 71% 73% 76%share of older (55-64) 12% 15% 17% 17% 17% 17% 19% 22% 23% 20% 17%
DepenDency ratios 2008 2015 2020 2025 2030 2035 2040 2045 2050 2055 2060Share of older population (55-64) (1) 15.1 17.7 20.5 21.5 21.3 21.0 22.3 26.1 27.9 25.5 21.8Old-age dependency ratio (2) 23 24 26 30 35 39 43 46 51 59 66Total dependency ratio (3) 45 45 48 52 57 59 63 66 72 82 89Total economic dependency ratio (4) 120 110 112 121 130 137 141 147 158 171 180Economic old-agedependency ratio (15-64) (5) 33 32 34 39 47 53 60 65 72 83 92Economic old-agedependency ratio (15-71) (6) 33 32 33 38 45 51 57 62 69 78 87
LEGENDA
* the potential GDP and its components is used to estimate the rate of potential output growth, net off normal cyclical variations(1) share of older population = Population aged 55 to 64 as % of population aged 15-64
(2) Old-age dependency ratio = Population aged 65 and over as a percentage of the population aged 15-64(3) total dependency ratio = Population under 15 and over 64 as a percentage of the population aged 15-64
(4) total economic dependency ratio = total population less employed as % of employed population 15-64(5) Economic old-age dependency ratio (15-64) = Inactive population aged 65+ as % of employed population 15-64(6) Economic old-age dependency ratio (15-71) = Inactive population aged 65+ as % of employed population 15-71
source : Eurostat (EUROPOP2008), Commission services (DG ECFIN), EPC (AwG)

194
European Economy 7/2008the 2009 Ageing Report: Underlying assumptions and projection methodologies for the EU-27 Member states
luxemBourg main DemograPhic anD macroeconomic assumPtions
(Baseline scenario)Budgetary Projection AWG – Population EUROPOP2008
Demographic assumptions 2008 2015 2020 2025 2030 2035 2040 2045 2050 2055 2060Fertility rate 1.65 1.66 1.67 1.67 1.68 1.69 1.70 1.70 1.71 1.72 1.72Life expectancy at birth
males 76.3 77.6 78.5 79.4 80.2 81.0 81.7 82.5 83.2 83.8 84.5females 81.2 82.4 83.2 83.9 84.6 85.3 86.0 86.7 87.3 87.9 88.5
Life expectancy at 65males 16.8 17.5 18.0 18.6 19.1 19.6 20.1 20.5 21.0 21.5 21.9females 19.7 20.5 21.0 21.5 22.0 22.5 23.0 23.4 23.9 24.3 24.8
Net migration (thousand) 4.4 4.1 4.0 3.8 3.7 3.5 3.4 3.2 3.1 2.9 2.8Net migration as % of population 0.9 0.8 0.7 0.7 0.6 0.6 0.5 0.5 0.4 0.4 0.4Population (million) 0.5 0.5 0.6 0.6 0.6 0.6 0.7 0.7 0.7 0.7 0.7Young population (0-14) as % of total 18.2 17.3 16.9 16.9 16.9 16.9 16.7 16.4 16.2 16.1 16.2Prime age population (25-54) as % of total 45.3 43.2 41.6 40.2 39.5 38.9 38.5 38.2 37.9 37.5 37.3Working age population (15-64)as % of total 67.7 67.6 66.9 65.4 63.5 61.9 61.1 60.9 60.8 60.7 60.3Elderly population (65 and over)as % of total 14.2 15.1 16.2 17.7 19.6 21.3 22.2 22.7 23.0 23.1 23.6Very elderly population (80 and over)as % of total 3.5 4.1 4.3 4.4 5.0 5.8 6.7 7.8 8.6 8.9 8.9Elderly population (55 and over)as % of working age pop.15-64 36.6 40.0 43.6 47.5 50.6 53.1 54.7 55.5 56.5 57.5 58.6
macroeconomic assumptions* 2007 2015 2020 2025 2030 2035 2040 2045 2050 2055 2060Potential GDP (growth rate) 4.5 4.0 2.7 2.3 2.1 2.2 2.2 2.2 2.2 2.0 2.0Employment (growth rate) 3.1 2.1 0.7 0.4 0.4 0.5 0.5 0.5 0.5 0.4 0.3Labour input : hours worked (growth rate) 2.7 2.1 0.7 0.4 0.4 0.5 0.5 0.5 0.5 0.4 0.3Labour productivity per hour (growth rate) 1.7 1.9 2.0 1.9 1.7 1.7 1.7 1.7 1.7 1.7 1.7TFP (growth rate) 0.8 1.1 1.1 1.1 1.1 1.1 1.1 1.1 1.1 1.1 1.1Capital deepening (contribution to labourproductivity growth) 0.9 0.8 0.9 0.8 0.6 0.6 0.6 0.6 0.6 0.6 0.6GDP per capita (growth rate) 2.9 2.9 1.6 1.3 1.2 1.3 1.5 1.6 1.6 1.6 1.5GDP in 2007 prices (in millions euros) 36.1 51.4 60.0 67.7 75.3 83.7 93.2 104.0 115.8 128.5 141.9
Labour force assumptions 2007 2015 2020 2025 2030 2035 2040 2045 2050 2055 2060Population growth (working age:15-64) 1.7 1.0 0.7 0.5 0.2 0.4 0.6 0.6 0.5 0.4 0.3Population growth (working age:15-71) 1.6 1.2 0.9 0.7 0.5 0.4 0.3 0.5 0.5 0.4 0.4Labour force (thousands) 214 238 247 254 259 265 271 278 285 291 296Participation rate (15-64) 66.4 67.1 66.9 66.8 66.9 67.3 67.3 67.1 67.1 66.8 66.8Participation rate (15-71) 61.5 61.7 60.9 60.2 59.6 59.6 60.1 60.3 60.3 60.1 59.7
young (15-24) 27.4 29.0 29.6 29.8 29.3 29.3 29.2 29.2 29.4 29.5 29.5prime-age (25-54) 84.2 85.9 86.1 86.2 86.2 86.0 86.1 86.0 86.0 86.0 86.1older (55-64) 33.0 39.0 40.6 40.9 40.4 41.7 41.9 41.6 42.3 41.8 41.3oldest (65-71) 0.7 1.6 1.8 1.9 2.0 2.0 1.9 2.0 2.0 2.0 2.0
Employment rate (15-64) 63.6 64.0 63.8 63.7 63.8 64.2 64.2 64.0 64.0 63.7 63.7Employment rate (15-71) 58.9 58.9 58.1 57.4 56.9 56.9 57.3 57.6 57.5 57.3 56.9Unemployment rate (15-64) 4.2 4.6 4.6 4.6 4.6 4.6 4.6 4.6 4.6 4.6 4.6Employment (15-64) (in millions) 0.2 0.2 0.2 0.2 0.2 0.3 0.3 0.3 0.3 0.3 0.3
share of young (15-24) 6% 7% 7% 7% 7% 7% 7% 7% 7% 7% 7%share of prime-age (25-54) 86% 82% 81% 80% 81% 81% 81% 81% 81% 80% 80%share of older (55-64) 8% 11% 12% 13% 12% 12% 12% 12% 12% 12% 12%
DepenDency ratios 2008 2015 2020 2025 2030 2035 2040 2045 2050 2055 2060Share of older population (55-64) (1) 15.7 17.7 19.3 20.4 19.8 18.7 18.4 18.3 18.7 19.4 19.5Old-age dependency ratio (2) 21 22 24 27 31 34 36 37 38 38 39Total dependency ratio (3) 48 48 50 53 57 62 64 64 64 65 66Total economic dependency ratio (4) 132 131 134 140 146 151 154 156 157 158 160Economic old-agedependency ratio (15-64) (5) 33 35 38 42 48 53 56 58 59 59 61Economic old-agedependency ratio (15-71) (6) 33 35 38 42 48 53 56 58 59 59 61
LEGENDA
* the potential GDP and its components is used to estimate the rate of potential output growth, net off normal cyclical variations(1) share of older population = Population aged 55 to 64 as % of population aged 15-64
(2) Old-age dependency ratio = Population aged 65 and over as a percentage of the population aged 15-64(3) total dependency ratio = Population under 15 and over 64 as a percentage of the population aged 15-64
(4) total economic dependency ratio = total population less employed as % of employed population 15-64(5) Economic old-age dependency ratio (15-64) = Inactive population aged 65+ as % of employed population 15-64(6) Economic old-age dependency ratio (15-71) = Inactive population aged 65+ as % of employed population 15-71
source : Eurostat (EUROPOP2008), Commission services (DG ECFIN), EPC (AwG)

195
stAtIstICAl ANNEX — Main demographic and macroeconomic assumptions by country (2007-2060)
hungary main DemograPhic anD macroeconomic assumPtions
(Baseline scenario)Budgetary Projection AWG – Population EUROPOP2008
Demographic assumptions 2008 2015 2020 2025 2030 2035 2040 2045 2050 2055 2060Fertility rate 1.35 1.37 1.39 1.41 1.42 1.44 1.46 1.48 1.50 1.51 1.53Life expectancy at birth
males 69.7 71.6 72.9 74.2 75.4 76.6 77.7 78.8 79.9 80.9 81.9females 78.1 79.5 80.5 81.5 82.4 83.3 84.2 85.0 85.8 86.6 87.3
Life expectancy at 65males 13.6 14.6 15.3 16.0 16.7 17.4 18.1 18.7 19.4 20.0 20.6females 17.5 18.4 19.1 19.8 20.4 21.1 21.7 22.3 22.9 23.5 24.0
Net migration (thousand) 19.6 22.1 22.4 18.0 17.3 19.3 22.3 19.6 17.9 16.6 14.9Net migration as % of population 0.2 0.2 0.2 0.2 0.2 0.2 0.2 0.2 0.2 0.2 0.2Population (million) 10.0 10.0 9.9 9.8 9.7 9.5 9.4 9.2 9.1 8.9 8.7Young population (0-14) as % of total 15.0 14.8 14.8 14.3 13.6 13.0 12.8 12.8 12.9 12.9 12.7Prime age population (25-54) as % of total 43.6 42.4 43.0 42.2 40.4 38.0 36.9 35.9 34.9 34.5 34.1Working age population (15-64)as % of total 68.8 67.4 65.4 64.3 64.5 63.8 62.2 59.4 57.7 56.4 55.4Elderly population (65 and over)as % of total 16.2 17.7 19.8 21.4 22.0 23.1 25.0 27.7 29.3 30.7 31.9Very elderly population (80 and over)as % of total 3.7 4.4 4.8 5.4 6.2 7.6 8.4 8.5 9.1 10.5 12.6Elderly population (55 and over)as % of working age pop.15-64 41.8 46.6 48.8 51.6 54.8 60.3 64.8 70.2 74.5 77.1 79.1
macroeconomic assumptions* 2007 2015 2020 2025 2030 2035 2040 2045 2050 2055 2060Potential GDP (growth rate) 2.9 2.8 2.4 2.1 2.1 1.5 1.1 1.0 0.8 0.9 1.0Employment (growth rate) -0.1 0.3 -0.2 -0.5 -0.6 -0.8 -1.0 -1.0 -0.9 -0.8 -0.7Labour input : hours worked (growth rate) -0.3 0.3 -0.2 -0.5 -0.6 -0.8 -1.0 -0.9 -0.9 -0.8 -0.7Labour productivity per hour (growth rate) 3.2 2.6 2.6 2.6 2.7 2.3 2.1 1.9 1.7 1.7 1.7TFP (growth rate) 1.5 1.4 1.5 1.6 1.7 1.5 1.3 1.2 1.1 1.1 1.1Capital deepening (contribution to labourproductivity growth) 1.8 1.1 1.1 1.0 0.9 0.8 0.7 0.7 0.6 0.6 0.6GDP per capita (growth rate) 4.0 2.9 2.6 2.4 2.4 1.8 1.4 1.3 1.1 1.3 1.5GDP in 2007 prices (in millions euros) 101.1 127.8 145.0 161.2 178.4 194.5 206.6 217.1 226.7 236.5 248.4
Labour force assumptions 2007 2015 2020 2025 2030 2035 2040 2045 2050 2055 2060Population growth (working age:15-64) 0.0 -0.7 -1.0 -0.3 -0.3 -0.7 -1.2 -1.1 -0.8 -0.8 -0.7Population growth (working age:15-71) 0.0 -0.4 -0.4 -0.5 -0.4 -0.2 -0.5 -0.7 -1.1 -0.8 -0.7Labour force (thousands) 4305 4445 4395 4292 4175 4032 3845 3663 3493 3346 3228Participation rate (15-64) 61.7 65.4 66.6 66.8 65.9 65.0 64.3 64.8 64.9 64.8 65.0Participation rate (15-71) 56.7 59.7 60.1 60.1 60.3 59.2 57.5 56.7 57.1 57.3 57.3
young (15-24) 26.1 28.3 27.0 25.7 26.2 26.9 27.0 27.0 26.7 26.2 26.2prime-age (25-54) 80.0 81.5 81.5 81.5 81.3 81.0 80.9 80.9 81.1 81.1 81.1older (55-64) 34.1 46.4 47.2 50.4 50.8 51.5 48.8 49.3 49.4 48.5 49.3oldest (65-71) 3.9 6.9 10.3 10.1 10.9 11.8 11.7 11.6 11.0 11.3 11.2
Employment rate (15-64) 57.2 60.9 62.5 62.7 61.8 61.0 60.3 60.8 60.9 60.8 61.0Employment rate (15-71) 52.5 55.6 56.4 56.4 56.7 55.6 54.1 53.3 53.6 53.8 53.8Unemployment rate (15-64) 7.4 7.0 6.2 6.2 6.2 6.2 6.2 6.2 6.2 6.2 6.2Employment (15-64) (in millions) 4.0 4.1 4.0 3.9 3.8 3.7 3.5 3.3 3.2 3.1 2.9
share of young (15-24) 7% 6% 6% 6% 6% 6% 6% 6% 6% 6% 6%share of prime-age (25-54) 83% 79% 81% 80% 78% 74% 75% 76% 76% 77% 77%share of older (55-64) 10% 15% 14% 14% 17% 20% 19% 18% 19% 17% 17%
DepenDency ratios 2008 2015 2020 2025 2030 2035 2040 2045 2050 2055 2060Share of older population (55-64) (1) 18.3 20.3 18.5 18.3 20.7 24.1 24.6 23.5 23.7 22.6 21.5Old-age dependency ratio (2) 24 26 30 33 34 36 40 47 51 54 58Total dependency ratio (3) 45 48 53 55 55 57 61 68 73 77 81Total economic dependency ratio (4) 152 142 143 146 149 154 163 173 181 188 193Economic old-agedependency ratio (15-64) (5) 40 42 46 51 53 57 64 73 80 86 91Economic old-agedependency ratio (15-71) (6) 40 41 45 50 52 56 62 71 78 84 89
LEGENDA
* the potential GDP and its components is used to estimate the rate of potential output growth, net off normal cyclical variations(1) share of older population = Population aged 55 to 64 as % of population aged 15-64
(2) Old-age dependency ratio = Population aged 65 and over as a percentage of the population aged 15-64(3) total dependency ratio = Population under 15 and over 64 as a percentage of the population aged 15-64
(4) total economic dependency ratio = total population less employed as % of employed population 15-64(5) Economic old-age dependency ratio (15-64) = Inactive population aged 65+ as % of employed population 15-64(6) Economic old-age dependency ratio (15-71) = Inactive population aged 65+ as % of employed population 15-71
source : Eurostat (EUROPOP2008), Commission services (DG ECFIN), EPC (AwG)
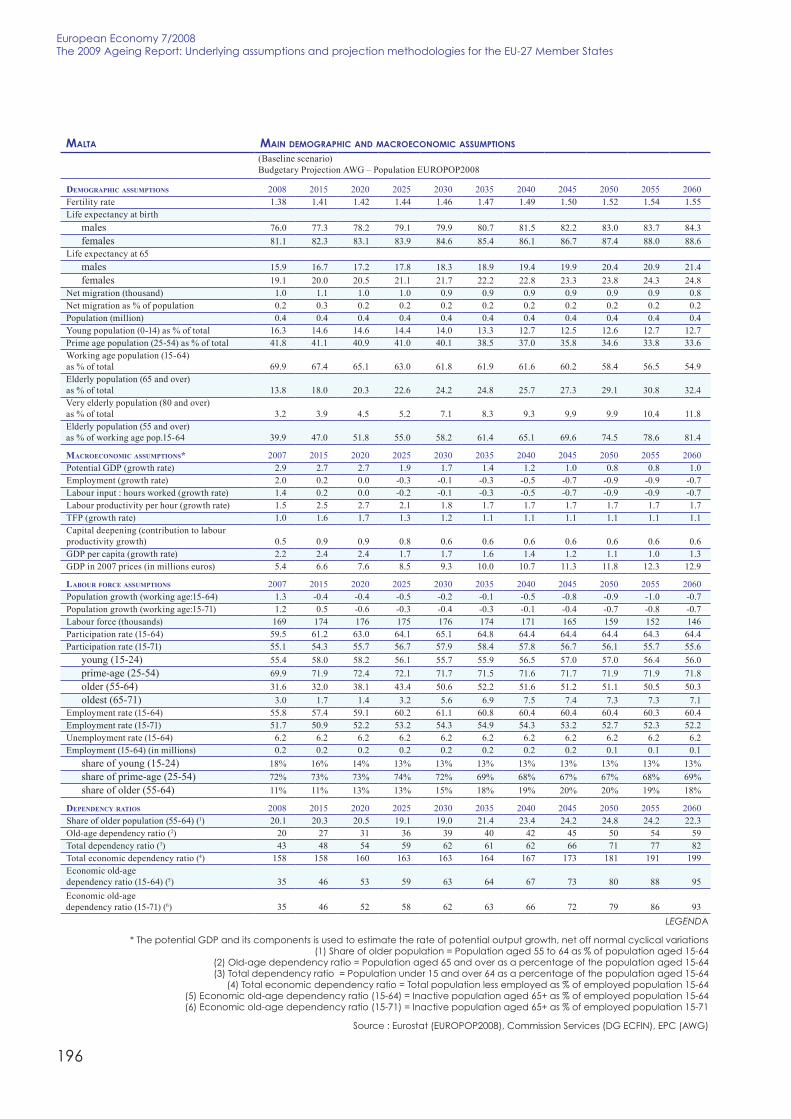
196
European Economy 7/2008the 2009 Ageing Report: Underlying assumptions and projection methodologies for the EU-27 Member states
malta main DemograPhic anD macroeconomic assumPtions
(Baseline scenario)Budgetary Projection AWG – Population EUROPOP2008
Demographic assumptions 2008 2015 2020 2025 2030 2035 2040 2045 2050 2055 2060Fertility rate 1.38 1.41 1.42 1.44 1.46 1.47 1.49 1.50 1.52 1.54 1.55Life expectancy at birth
males 76.0 77.3 78.2 79.1 79.9 80.7 81.5 82.2 83.0 83.7 84.3females 81.1 82.3 83.1 83.9 84.6 85.4 86.1 86.7 87.4 88.0 88.6
Life expectancy at 65males 15.9 16.7 17.2 17.8 18.3 18.9 19.4 19.9 20.4 20.9 21.4females 19.1 20.0 20.5 21.1 21.7 22.2 22.8 23.3 23.8 24.3 24.8
Net migration (thousand) 1.0 1.1 1.0 1.0 0.9 0.9 0.9 0.9 0.9 0.9 0.8Net migration as % of population 0.2 0.3 0.2 0.2 0.2 0.2 0.2 0.2 0.2 0.2 0.2Population (million) 0.4 0.4 0.4 0.4 0.4 0.4 0.4 0.4 0.4 0.4 0.4Young population (0-14) as % of total 16.3 14.6 14.6 14.4 14.0 13.3 12.7 12.5 12.6 12.7 12.7Prime age population (25-54) as % of total 41.8 41.1 40.9 41.0 40.1 38.5 37.0 35.8 34.6 33.8 33.6Working age population (15-64)as % of total 69.9 67.4 65.1 63.0 61.8 61.9 61.6 60.2 58.4 56.5 54.9Elderly population (65 and over)as % of total 13.8 18.0 20.3 22.6 24.2 24.8 25.7 27.3 29.1 30.8 32.4Very elderly population (80 and over)as % of total 3.2 3.9 4.5 5.2 7.1 8.3 9.3 9.9 9.9 10.4 11.8Elderly population (55 and over)as % of working age pop.15-64 39.9 47.0 51.8 55.0 58.2 61.4 65.1 69.6 74.5 78.6 81.4
macroeconomic assumptions* 2007 2015 2020 2025 2030 2035 2040 2045 2050 2055 2060Potential GDP (growth rate) 2.9 2.7 2.7 1.9 1.7 1.4 1.2 1.0 0.8 0.8 1.0Employment (growth rate) 2.0 0.2 0.0 -0.3 -0.1 -0.3 -0.5 -0.7 -0.9 -0.9 -0.7Labour input : hours worked (growth rate) 1.4 0.2 0.0 -0.2 -0.1 -0.3 -0.5 -0.7 -0.9 -0.9 -0.7Labour productivity per hour (growth rate) 1.5 2.5 2.7 2.1 1.8 1.7 1.7 1.7 1.7 1.7 1.7TFP (growth rate) 1.0 1.6 1.7 1.3 1.2 1.1 1.1 1.1 1.1 1.1 1.1Capital deepening (contribution to labourproductivity growth) 0.5 0.9 0.9 0.8 0.6 0.6 0.6 0.6 0.6 0.6 0.6GDP per capita (growth rate) 2.2 2.4 2.4 1.7 1.7 1.6 1.4 1.2 1.1 1.0 1.3GDP in 2007 prices (in millions euros) 5.4 6.6 7.6 8.5 9.3 10.0 10.7 11.3 11.8 12.3 12.9
Labour force assumptions 2007 2015 2020 2025 2030 2035 2040 2045 2050 2055 2060Population growth (working age:15-64) 1.3 -0.4 -0.4 -0.5 -0.2 -0.1 -0.5 -0.8 -0.9 -1.0 -0.7Population growth (working age:15-71) 1.2 0.5 -0.6 -0.3 -0.4 -0.3 -0.1 -0.4 -0.7 -0.8 -0.7Labour force (thousands) 169 174 176 175 176 174 171 165 159 152 146Participation rate (15-64) 59.5 61.2 63.0 64.1 65.1 64.8 64.4 64.4 64.4 64.3 64.4Participation rate (15-71) 55.1 54.3 55.7 56.7 57.9 58.4 57.8 56.7 56.1 55.7 55.6
young (15-24) 55.4 58.0 58.2 56.1 55.7 55.9 56.5 57.0 57.0 56.4 56.0prime-age (25-54) 69.9 71.9 72.4 72.1 71.7 71.5 71.6 71.7 71.9 71.9 71.8older (55-64) 31.6 32.0 38.1 43.4 50.6 52.2 51.6 51.2 51.1 50.5 50.3oldest (65-71) 3.0 1.7 1.4 3.2 5.6 6.9 7.5 7.4 7.3 7.3 7.1
Employment rate (15-64) 55.8 57.4 59.1 60.2 61.1 60.8 60.4 60.4 60.4 60.3 60.4Employment rate (15-71) 51.7 50.9 52.2 53.2 54.3 54.9 54.3 53.2 52.7 52.3 52.2Unemployment rate (15-64) 6.2 6.2 6.2 6.2 6.2 6.2 6.2 6.2 6.2 6.2 6.2Employment (15-64) (in millions) 0.2 0.2 0.2 0.2 0.2 0.2 0.2 0.2 0.1 0.1 0.1
share of young (15-24) 18% 16% 14% 13% 13% 13% 13% 13% 13% 13% 13%share of prime-age (25-54) 72% 73% 73% 74% 72% 69% 68% 67% 67% 68% 69%share of older (55-64) 11% 11% 13% 13% 15% 18% 19% 20% 20% 19% 18%
DepenDency ratios 2008 2015 2020 2025 2030 2035 2040 2045 2050 2055 2060Share of older population (55-64) (1) 20.1 20.3 20.5 19.1 19.0 21.4 23.4 24.2 24.8 24.2 22.3Old-age dependency ratio (2) 20 27 31 36 39 40 42 45 50 54 59Total dependency ratio (3) 43 48 54 59 62 61 62 66 71 77 82Total economic dependency ratio (4) 158 158 160 163 163 164 167 173 181 191 199Economic old-agedependency ratio (15-64) (5) 35 46 53 59 63 64 67 73 80 88 95Economic old-agedependency ratio (15-71) (6) 35 46 52 58 62 63 66 72 79 86 93
LEGENDA
* the potential GDP and its components is used to estimate the rate of potential output growth, net off normal cyclical variations(1) share of older population = Population aged 55 to 64 as % of population aged 15-64
(2) Old-age dependency ratio = Population aged 65 and over as a percentage of the population aged 15-64(3) total dependency ratio = Population under 15 and over 64 as a percentage of the population aged 15-64
(4) total economic dependency ratio = total population less employed as % of employed population 15-64(5) Economic old-age dependency ratio (15-64) = Inactive population aged 65+ as % of employed population 15-64(6) Economic old-age dependency ratio (15-71) = Inactive population aged 65+ as % of employed population 15-71
source : Eurostat (EUROPOP2008), Commission services (DG ECFIN), EPC (AwG)

197
stAtIstICAl ANNEX — Main demographic and macroeconomic assumptions by country (2007-2060)
netherlanDs main DemograPhic anD macroeconomic assumPtions
(Baseline scenario)Budgetary Projection AWG – Population EUROPOP2008
Demographic assumptions 2008 2015 2020 2025 2030 2035 2040 2045 2050 2055 2060Fertility rate 1.72 1.73 1.73 1.74 1.74 1.75 1.75 1.75 1.76 1.76 1.77Life expectancy at birth
males 77.9 79.0 79.7 80.4 81.1 81.8 82.5 83.1 83.7 84.3 84.9females 82.2 83.2 83.9 84.6 85.3 85.9 86.6 87.2 87.8 88.3 88.9
Life expectancy at 65males 16.5 17.3 17.8 18.3 18.8 19.3 19.8 20.3 20.8 21.2 21.7females 19.9 20.7 21.2 21.7 22.2 22.7 23.2 23.7 24.1 24.6 25.0
Net migration (thousand) 7.8 8.2 10.6 13.1 13.7 12.6 6.5 6.7 7.2 9.3 8.4Net migration as % of population 0.0 0.0 0.1 0.1 0.1 0.1 0.0 0.0 0.0 0.1 0.1Population (million) 16.4 16.7 16.9 17.1 17.2 17.3 17.2 17.1 16.9 16.7 16.6Young population (0-14) as % of total 17.9 16.6 15.7 15.5 15.7 15.7 15.6 15.3 14.9 14.8 15.0Prime age population (25-54) as % of total 42.6 40.4 38.8 37.1 36.4 36.4 36.2 35.8 35.5 35.3 34.9Working age population (15-64)as % of total 67.4 65.6 64.5 62.6 60.2 58.3 57.5 58.0 58.4 58.3 57.8Elderly population (65 and over)as % of total 14.7 17.8 19.8 21.9 24.1 25.9 26.9 26.8 26.6 26.8 27.3Very elderly population (80 and over)as % of total 3.8 4.3 4.7 5.4 6.9 8.0 9.0 10.1 11.1 11.4 10.9Elderly population (55 and over)as % of working age pop.15-64 40.7 47.0 52.1 57.5 62.1 64.4 65.5 65.7 66.2 67.0 68.5
macroeconomic assumptions* 2007 2015 2020 2025 2030 2035 2040 2045 2050 2055 2060Potential GDP (growth rate) 2.1 1.7 1.5 1.3 1.2 1.4 1.5 1.6 1.5 1.4 1.3Employment (growth rate) 0.8 0.1 -0.2 -0.4 -0.5 -0.3 -0.2 -0.1 -0.2 -0.3 -0.4Labour input : hours worked (growth rate) 0.5 0.0 -0.3 -0.4 -0.5 -0.3 -0.2 -0.1 -0.2 -0.3 -0.4Labour productivity per hour (growth rate) 1.6 1.7 1.8 1.7 1.7 1.7 1.7 1.7 1.7 1.7 1.7TFP (growth rate) 1.1 1.1 1.1 1.1 1.1 1.1 1.1 1.1 1.1 1.1 1.1Capital deepening (contribution to labourproductivity growth) 0.6 0.6 0.7 0.6 0.6 0.6 0.6 0.6 0.6 0.6 0.6GDP per capita (growth rate) 2.0 1.5 1.3 1.1 1.1 1.4 1.6 1.8 1.7 1.6 1.5GDP in 2007 prices (in millions euros) 559.5 649.2 702.9 752.3 800.9 854.8 920.8 994.0 1072.9 1153.3 1235.2
Labour force assumptions 2007 2015 2020 2025 2030 2035 2040 2045 2050 2055 2060Population growth (working age:15-64) 0.1 -0.1 -0.2 -0.5 -0.7 -0.6 -0.1 0.0 -0.1 -0.3 -0.4Population growth (working age:15-71) 0.2 0.3 -0.3 -0.3 -0.4 -0.5 -0.4 -0.3 0.0 -0.1 -0.3Labour force (thousands) 8766 8907 8863 8705 8498 8326 8246 8192 8134 8035 7906Participation rate (15-64) 78.7 79.4 79.5 79.5 79.7 80.3 81.0 80.8 80.4 80.2 80.2Participation rate (15-71) 73.1 72.4 72.2 71.8 71.3 71.4 72.4 73.5 73.2 72.6 72.1
young (15-24) 72.7 73.6 73.5 74.1 73.8 73.5 73.3 73.5 73.6 73.8 73.8prime-age (25-54) 87.7 89.0 89.6 90.0 90.1 90.1 90.2 90.2 90.1 90.1 90.2older (55-64) 53.3 55.3 56.1 56.2 55.8 55.4 57.5 58.0 57.8 57.2 57.6oldest (65-71) 9.3 14.4 14.6 15.0 15.1 15.2 15.2 15.4 15.5 15.6 15.6
Employment rate (15-64) 76.1 77.0 77.1 77.1 77.3 77.9 78.5 78.3 78.0 77.8 77.8Employment rate (15-71) 70.8 70.3 70.0 69.7 69.2 69.3 70.3 71.3 71.0 70.4 70.0Unemployment rate (15-64) 3.2 3.0 3.0 3.0 3.0 3.0 3.0 3.0 3.0 3.0 3.0Employment (15-64) (in millions) 8.4 8.5 8.4 8.2 8.0 7.8 7.8 7.8 7.7 7.6 7.5
share of young (15-24) 16% 17% 17% 17% 16% 16% 16% 17% 17% 17% 16%share of prime-age (25-54) 72% 69% 68% 68% 69% 71% 71% 69% 69% 68% 68%share of older (55-64) 12% 14% 15% 16% 15% 14% 13% 14% 15% 15% 15%
DepenDency ratios 2008 2015 2020 2025 2030 2035 2040 2045 2050 2055 2060Share of older population (55-64) (1) 18.9 19.9 21.4 22.6 22.1 19.9 18.7 19.5 20.6 21.0 21.3Old-age dependency ratio (2) 22 27 31 35 40 45 47 46 46 46 47Total dependency ratio (3) 48 52 55 60 66 72 74 72 71 71 73Total economic dependency ratio (4) 93 95 98 104 111 116 118 117 116 117 119Economic old-agedependency ratio (15-64) (5) 27 33 37 42 48 53 56 55 55 56 57Economic old-agedependency ratio (15-71) (6) 27 32 36 41 47 52 54 54 54 54 55
LEGENDA
* the potential GDP and its components is used to estimate the rate of potential output growth, net off normal cyclical variations(1) share of older population = Population aged 55 to 64 as % of population aged 15-64
(2) Old-age dependency ratio = Population aged 65 and over as a percentage of the population aged 15-64(3) total dependency ratio = Population under 15 and over 64 as a percentage of the population aged 15-64
(4) total economic dependency ratio = total population less employed as % of employed population 15-64(5) Economic old-age dependency ratio (15-64) = Inactive population aged 65+ as % of employed population 15-64(6) Economic old-age dependency ratio (15-71) = Inactive population aged 65+ as % of employed population 15-71
source : Eurostat (EUROPOP2008), Commission services (DG ECFIN), EPC (AwG)

198
European Economy 7/2008the 2009 Ageing Report: Underlying assumptions and projection methodologies for the EU-27 Member states
austria main DemograPhic anD macroeconomic assumPtions
(Baseline scenario)Budgetary Projection AWG – Population EUROPOP2008
Demographic assumptions 2008 2015 2020 2025 2030 2035 2040 2045 2050 2055 2060Fertility rate 1.41 1.43 1.45 1.46 1.48 1.49 1.51 1.53 1.54 1.56 1.57Life expectancy at birth
males 77.4 78.6 79.4 80.1 80.9 81.6 82.3 83.0 83.6 84.3 84.9females 82.9 83.9 84.6 85.2 85.8 86.4 87.0 87.6 88.1 88.7 89.2
Life expectancy at 65males 17.1 17.8 18.3 18.8 19.3 19.8 20.2 20.7 21.2 21.6 22.0females 20.3 21.0 21.5 22.0 22.5 23.0 23.4 23.9 24.3 24.8 25.2
Net migration (thousand) 33.1 31.4 30.5 31.5 31.2 28.7 26.0 25.6 24.7 23.9 22.3Net migration as % of population 0.4 0.4 0.3 0.4 0.3 0.3 0.3 0.3 0.3 0.3 0.2Population (million) 8.3 8.6 8.7 8.9 9.0 9.1 9.1 9.1 9.1 9.1 9.0Young population (0-14) as % of total 15.3 14.4 14.3 14.3 14.1 13.9 13.6 13.5 13.5 13.7 13.8Prime age population (25-54) as % of total 44.1 43.0 41.2 39.0 37.8 37.5 36.7 36.1 35.5 35.3 35.2Working age population (15-64)as % of total 67.5 67.2 66.3 64.6 62.2 60.1 59.2 58.9 58.3 57.8 57.2Elderly population (65 and over)as % of total 17.2 18.4 19.4 21.1 23.7 26.1 27.2 27.6 28.2 28.5 29.0Very elderly population (80 and over)as % of total 4.6 4.9 5.2 6.2 6.7 7.2 8.4 10.1 11.5 11.7 11.4Elderly population (55 and over)as % of working age pop.15-64 42.0 45.8 50.7 56.2 60.6 63.8 66.4 68.0 70.1 71.0 71.5
macroeconomic assumptions* 2007 2015 2020 2025 2030 2035 2040 2045 2050 2055 2060Potential GDP (growth rate) 2.2 1.9 1.9 1.6 1.5 1.6 1.5 1.5 1.5 1.4 1.5Employment (growth rate) 0.7 0.2 0.2 -0.1 -0.2 -0.1 -0.2 -0.2 -0.2 -0.3 -0.2Labour input : hours worked (growth rate) 0.6 0.2 0.2 -0.1 -0.2 -0.1 -0.2 -0.2 -0.2 -0.3 -0.2Labour productivity per hour (growth rate) 1.6 1.7 1.7 1.7 1.7 1.7 1.7 1.7 1.7 1.7 1.7TFP (growth rate) 1.0 1.1 1.1 1.1 1.1 1.1 1.1 1.1 1.1 1.1 1.1Capital deepening (contribution to labourproductivity growth) 0.6 0.6 0.6 0.6 0.6 0.6 0.6 0.6 0.6 0.6 0.6GDP per capita (growth rate) 1.8 1.6 1.6 1.3 1.2 1.4 1.5 1.5 1.5 1.5 1.6GDP in 2007 prices (in millions euros) 272.7 322.7 354.9 386.1 415.5 449.1 485.6 523.1 563.4 605.1 650.9
Labour force assumptions 2007 2015 2020 2025 2030 2035 2040 2045 2050 2055 2060Population growth (working age:15-64) 0.2 0.1 0.1 -0.3 -0.6 -0.5 -0.1 -0.1 -0.2 -0.3 -0.3Population growth (working age:15-71) 0.7 0.2 0.0 0.1 -0.1 -0.4 -0.5 -0.2 0.0 -0.3 -0.2Labour force (thousands) 4235 4420 4471 4463 4413 4387 4363 4320 4278 4223 4175Participation rate (15-64) 74.8 75.8 75.9 75.7 76.4 77.5 77.9 77.6 77.5 77.4 77.6Participation rate (15-71) 68.6 69.6 69.6 69.2 68.5 69.1 70.3 70.9 70.5 70.1 70.1
young (15-24) 61.5 64.1 63.7 63.4 63.2 63.2 63.3 63.4 63.5 63.4 63.3prime-age (25-54) 87.4 87.7 88.2 88.6 89.0 89.2 89.2 89.2 89.2 89.3 89.3older (55-64) 40.0 45.7 49.6 51.1 52.1 53.7 56.1 55.6 56.0 55.2 55.4oldest (65-71) 7.5 9.4 12.2 17.3 16.7 18.2 19.6 20.1 20.5 20.5 20.5
Employment rate (15-64) 71.5 72.6 72.7 72.5 73.1 74.2 74.6 74.2 74.2 74.1 74.3Employment rate (15-71) 65.6 66.6 66.7 66.3 65.6 66.2 67.4 67.9 67.6 67.2 67.2Unemployment rate (15-64) 4.5 4.3 4.3 4.3 4.3 4.3 4.3 4.3 4.3 4.3 4.3Employment (15-64) (in millions) 4.0 4.2 4.2 4.2 4.1 4.0 4.0 4.0 3.9 3.9 3.8
share of young (15-24) 14% 14% 13% 13% 13% 13% 14% 14% 14% 14% 14%share of prime-age (25-54) 77% 75% 73% 71% 71% 72% 71% 71% 70% 71% 71%share of older (55-64) 9% 11% 14% 16% 16% 14% 15% 16% 16% 16% 15%
DepenDency ratios 2008 2015 2020 2025 2030 2035 2040 2045 2050 2055 2060Share of older population (55-64) (1) 16.6 18.4 21.5 23.5 22.6 20.4 20.4 21.3 21.8 21.7 20.9Old-age dependency ratio (2) 25 27 29 33 38 43 46 47 48 49 51Total dependency ratio (3) 48 49 51 55 61 66 69 70 72 73 75Total economic dependency ratio (4) 105 104 106 110 116 120 122 124 127 129 130Economic old-agedependency ratio (15-64) (5) 34 36 38 42 48 54 57 59 61 62 63Economic old-agedependency ratio (15-71) (6) 34 36 38 41 47 52 55 57 58 60 61
LEGENDA
* the potential GDP and its components is used to estimate the rate of potential output growth, net off normal cyclical variations(1) share of older population = Population aged 55 to 64 as % of population aged 15-64
(2) Old-age dependency ratio = Population aged 65 and over as a percentage of the population aged 15-64(3) total dependency ratio = Population under 15 and over 64 as a percentage of the population aged 15-64
(4) total economic dependency ratio = total population less employed as % of employed population 15-64(5) Economic old-age dependency ratio (15-64) = Inactive population aged 65+ as % of employed population 15-64(6) Economic old-age dependency ratio (15-71) = Inactive population aged 65+ as % of employed population 15-71
source : Eurostat (EUROPOP2008), Commission services (DG ECFIN), EPC (AwG)

199
stAtIstICAl ANNEX — Main demographic and macroeconomic assumptions by country (2007-2060)
PolanD main DemograPhic anD macroeconomic assumPtions
(Baseline scenario)Budgetary Projection AWG – Population EUROPOP2008
Demographic assumptions 2008 2015 2020 2025 2030 2035 2040 2045 2050 2055 2060Fertility rate 1.27 1.30 1.32 1.34 1.36 1.38 1.40 1.42 1.44 1.47 1.49Life expectancy at birth
males 71.4 73.1 74.3 75.5 76.6 77.7 78.8 79.8 80.7 81.6 82.5females 79.9 81.2 82.1 82.9 83.7 84.5 85.3 86.0 86.7 87.4 88.0
Life expectancy at 65males 14.5 15.4 16.0 16.7 17.3 18.0 18.6 19.2 19.8 20.4 20.9females 18.6 19.4 20.0 20.6 21.2 21.8 22.3 22.9 23.4 23.9 24.4
Net migration (thousand) -15.5 8.5 14.0 4.9 -1.3 4.4 17.1 24.4 26.4 17.2 8.2Net migration as % of population 0.0 0.0 0.0 0.0 0.0 0.0 0.0 0.1 0.1 0.1 0.0Population (million) 38.1 38.1 38.0 37.6 37.0 36.1 35.2 34.3 33.3 32.2 31.1Young population (0-14) as % of total 15.5 14.6 14.8 14.2 13.1 12.0 11.4 11.4 11.6 11.6 11.4Prime age population (25-54) as % of total 43.9 43.5 43.5 43.0 41.4 39.2 36.6 34.6 33.2 32.6 32.4Working age population (15-64)as % of total 71.1 70.0 67.0 64.6 63.9 63.8 62.7 60.2 56.8 54.1 52.5Elderly population (65 and over)as % of total 13.5 15.3 18.2 21.2 23.0 24.2 25.9 28.4 31.6 34.3 36.2Very elderly population (80 and over)as % of total 3.0 4.0 4.4 4.5 5.7 7.7 9.4 10.0 10.1 11.0 13.1Elderly population (55 and over)as % of working age pop.15-64 35.3 42.6 47.2 51.1 55.1 60.2 67.3 74.8 82.5 87.9 91.1
macroeconomic assumptions* 2007 2015 2020 2025 2030 2035 2040 2045 2050 2055 2060Potential GDP (growth rate) 5.9 3.1 2.5 2.5 2.0 1.0 0.5 0.3 0.3 0.3 0.5Employment (growth rate) 2.8 -0.3 -0.6 -0.3 -0.6 -0.8 -1.1 -1.4 -1.5 -1.5 -1.2Labour input : hours worked (growth rate) 2.8 -0.3 -0.6 -0.4 -0.7 -0.9 -1.2 -1.4 -1.4 -1.4 -1.2Labour productivity per hour (growth rate) 3.0 3.4 3.1 2.8 2.7 1.9 1.7 1.7 1.7 1.7 1.7TFP (growth rate) 1.7 1.6 1.7 1.7 1.7 1.2 1.1 1.1 1.1 1.1 1.1Capital deepening (contribution to labourproductivity growth) 1.3 1.8 1.4 1.1 0.9 0.7 0.6 0.6 0.6 0.6 0.6GDP per capita (growth rate) 6.0 3.1 2.6 2.7 2.4 1.5 1.1 0.9 0.9 0.9 1.3GDP in 2007 prices (in millions euros) 307.3 427.0 488.0 551.9 613.9 655.5 678.7 693.1 702.6 712.1 727.6
Labour force assumptions 2007 2015 2020 2025 2030 2035 2040 2045 2050 2055 2060Population growth (working age:15-64) 0.4 -0.7 -1.0 -0.8 -0.5 -0.6 -1.1 -1.5 -1.9 -1.5 -1.1Population growth (working age:15-71) 0.2 0.0 -0.6 -0.7 -0.8 -0.6 -0.6 -0.9 -1.3 -1.6 -1.4Labour force (thousands) 17257 17577 17124 16761 16303 15709 14928 13997 13013 12093 11335Participation rate (15-64) 63.3 65.1 66.1 67.6 67.6 66.3 65.4 65.1 65.5 66.0 66.3Participation rate (15-71) 59.3 60.4 59.6 60.3 61.1 60.9 59.5 58.0 57.2 57.1 58.0
young (15-24) 33.9 36.0 34.9 32.3 32.5 33.6 34.6 34.9 34.2 33.2 32.9prime-age (25-54) 81.8 83.0 83.0 82.7 82.0 81.4 81.4 81.7 82.2 82.4 82.1older (55-64) 32.1 35.5 34.9 41.8 48.1 48.4 47.9 46.6 46.2 45.9 46.5oldest (65-71) 8.2 9.0 9.1 10.0 11.2 15.4 16.5 16.4 16.3 15.7 15.8
Employment rate (15-64) 57.1 61.3 62.2 63.6 63.6 62.4 61.5 61.2 61.7 62.1 62.4Employment rate (15-71) 53.6 56.9 56.1 56.8 57.5 57.4 56.1 54.7 53.9 53.9 54.7Unemployment rate (15-64) 9.8 5.9 5.9 5.9 5.9 5.9 5.9 5.9 5.9 5.9 5.9Employment (15-64) (in millions) 15.4 16.3 15.8 15.4 15.0 14.4 13.6 12.6 11.7 10.8 10.2
share of young (15-24) 11% 9% 7% 7% 7% 8% 8% 7% 7% 7% 7%share of prime-age (25-54) 81% 80% 82% 82% 79% 76% 73% 73% 74% 76% 77%share of older (55-64) 8% 11% 11% 11% 14% 17% 19% 20% 19% 17% 16%
DepenDency ratios 2008 2015 2020 2025 2030 2035 2040 2045 2050 2055 2060Share of older population (55-64) (1) 16.4 20.7 20.0 18.2 19.1 22.3 26.0 27.6 26.8 24.5 22.2Old-age dependency ratio (2) 19 22 27 33 36 38 41 47 56 63 69Total dependency ratio (3) 41 43 49 55 57 57 59 66 76 85 91Total economic dependency ratio (4) 141 132 138 141 144 148 156 167 180 192 201Economic old-agedependency ratio (15-64) (5) 31 34 42 49 54 58 64 73 85 97 106Economic old-agedependency ratio (15-71) (6) 31 34 41 48 53 56 61 69 81 92 101
LEGENDA
* the potential GDP and its components is used to estimate the rate of potential output growth, net off normal cyclical variations(1) share of older population = Population aged 55 to 64 as % of population aged 15-64
(2) Old-age dependency ratio = Population aged 65 and over as a percentage of the population aged 15-64(3) total dependency ratio = Population under 15 and over 64 as a percentage of the population aged 15-64
(4) total economic dependency ratio = total population less employed as % of employed population 15-64(5) Economic old-age dependency ratio (15-64) = Inactive population aged 65+ as % of employed population 15-64(6) Economic old-age dependency ratio (15-71) = Inactive population aged 65+ as % of employed population 15-71
source : Eurostat (EUROPOP2008), Commission services (DG ECFIN), EPC (AwG)

200
European Economy 7/2008the 2009 Ageing Report: Underlying assumptions and projection methodologies for the EU-27 Member states
Portugal main DemograPhic anD macroeconomic assumPtions
(Baseline scenario)Budgetary Projection AWG – Population EUROPOP2008
Demographic assumptions 2008 2015 2020 2025 2030 2035 2040 2045 2050 2055 2060Fertility rate 1.36 1.39 1.40 1.42 1.44 1.45 1.47 1.49 1.51 1.52 1.54Life expectancy at birth
males 75.8 77.1 78.0 78.8 79.7 80.5 81.2 82.0 82.7 83.4 84.1females 82.4 83.4 84.1 84.7 85.4 86.0 86.6 87.1 87.7 88.3 88.8
Life expectancy at 65males 16.3 17.1 17.6 18.1 18.7 19.2 19.7 20.2 20.7 21.1 21.6females 19.9 20.6 21.1 21.6 22.1 22.5 23.0 23.5 23.9 24.4 24.8
Net migration (thousand) 51.8 49.2 47.6 46.9 46.1 45.2 45.3 42.5 38.8 36.6 34.5Net migration as % of population 0.5 0.4 0.4 0.4 0.4 0.4 0.4 0.4 0.3 0.3 0.3Population (million) 10.6 10.9 11.1 11.2 11.3 11.4 11.5 11.5 11.4 11.4 11.3Young population (0-14) as % of total 15.3 15.1 14.5 13.8 13.3 13.0 13.0 13.0 13.0 12.9 12.8Prime age population (25-54) as % of total 43.9 43.1 41.7 40.5 39.1 37.4 36.2 35.7 35.2 34.9 34.4Working age population (15-64)as % of total 67.2 66.1 65.5 64.7 63.5 62.1 60.2 58.2 56.9 56.5 56.3Elderly population (65 and over)as % of total 17.4 18.9 20.1 21.5 23.3 24.9 26.8 28.8 30.1 30.6 30.9Very elderly population (80 and over)as % of total 4.2 5.2 5.8 6.1 6.8 7.6 8.4 9.5 10.5 11.6 12.8Elderly population (55 and over)as % of working age pop.15-64 43.3 47.2 50.6 54.1 58.6 63.7 68.5 72.1 74.5 75.7 76.7
macroeconomic assumptions* 2007 2015 2020 2025 2030 2035 2040 2045 2050 2055 2060Potential GDP (growth rate) 1.3 2.1 2.1 2.1 2.5 2.2 1.8 1.5 1.2 1.3 1.4Employment (growth rate) 0.3 0.6 0.3 0.1 -0.1 -0.3 -0.4 -0.5 -0.5 -0.4 -0.3Labour input : hours worked (growth rate) 0.2 0.6 0.3 0.1 -0.1 -0.3 -0.4 -0.5 -0.5 -0.4 -0.3Labour productivity per hour (growth rate) 1.1 1.5 1.8 2.0 2.7 2.5 2.2 2.0 1.7 1.7 1.7TFP (growth rate) 0.5 1.0 1.2 1.3 1.7 1.6 1.4 1.3 1.1 1.1 1.1Capital deepening (contribution to labourproductivity growth) 0.6 0.5 0.6 0.7 0.9 0.9 0.8 0.7 0.6 0.6 0.6GDP per capita (growth rate) 1.0 1.7 1.8 1.9 2.4 2.1 1.7 1.5 1.3 1.5 1.6GDP in 2007 prices (in millions euros) 162.8 189.1 209.3 231.6 258.3 290.4 319.7 346.8 370.8 395.1 423.0
Labour force assumptions 2007 2015 2020 2025 2030 2035 2040 2045 2050 2055 2060Population growth (working age:15-64) 0.2 0.2 0.1 -0.1 -0.3 -0.4 -0.6 -0.6 -0.4 -0.3 -0.2Population growth (working age:15-71) 0.1 0.4 0.2 0.1 -0.1 -0.3 -0.3 -0.5 -0.6 -0.5 -0.3Labour force (thousands) 5465 5729 5803 5843 5841 5786 5680 5547 5403 5291 5208Participation rate (15-64) 74.1 76.1 76.1 76.3 76.4 76.5 76.4 76.5 76.6 76.4 76.3Participation rate (15-71) 69.6 71.4 71.4 71.6 71.5 71.5 71.3 71.0 71.2 71.4 71.4
young (15-24) 42.3 41.7 40.8 41.7 41.7 42.2 42.1 41.7 41.4 41.4 41.6prime-age (25-54) 87.8 88.9 89.1 89.2 89.0 89.0 89.1 89.1 89.1 89.0 89.0older (55-64) 54.5 61.1 63.5 65.0 67.0 68.0 67.4 67.2 67.5 67.6 67.8oldest (65-71) 25.2 28.7 31.1 33.8 36.1 37.4 38.8 38.9 38.6 38.6 38.7
Employment rate (15-64) 67.8 70.8 71.4 71.5 71.6 71.7 71.7 71.8 71.8 71.7 71.6Employment rate (15-71) 63.8 66.7 67.2 67.4 67.4 67.4 67.2 67.0 67.1 67.3 67.3Unemployment rate (15-64) 8.5 6.9 6.2 6.2 6.2 6.2 6.2 6.2 6.2 6.2 6.2Employment (15-64) (in millions) 4.8 5.1 5.2 5.2 5.1 5.1 4.9 4.8 4.7 4.6 4.5
share of young (15-24) 9% 8% 8% 8% 8% 8% 8% 8% 8% 8% 9%share of prime-age (25-54) 78% 77% 75% 74% 72% 70% 70% 72% 72% 72% 72%share of older (55-64) 13% 15% 17% 18% 20% 21% 21% 20% 19% 19% 20%
DepenDency ratios 2008 2015 2020 2025 2030 2035 2040 2045 2050 2055 2060Share of older population (55-64) (1) 17.4 18.7 19.9 20.9 22.0 23.6 23.9 22.6 21.6 21.4 22.0Old-age dependency ratio (2) 26 29 31 33 37 40 45 49 53 54 55Total dependency ratio (3) 49 51 53 55 58 61 66 72 76 77 77Total economic dependency ratio (4) 112 109 108 109 112 116 122 129 134 137 139Economic old-agedependency ratio (15-64) (5) 33 35 37 40 43 47 53 58 63 66 67Economic old-agedependency ratio (15-71) (6) 32 34 35 38 40 44 48 53 58 61 62
LEGENDA
* the potential GDP and its components is used to estimate the rate of potential output growth, net off normal cyclical variations(1) share of older population = Population aged 55 to 64 as % of population aged 15-64
(2) Old-age dependency ratio = Population aged 65 and over as a percentage of the population aged 15-64(3) total dependency ratio = Population under 15 and over 64 as a percentage of the population aged 15-64
(4) total economic dependency ratio = total population less employed as % of employed population 15-64(5) Economic old-age dependency ratio (15-64) = Inactive population aged 65+ as % of employed population 15-64(6) Economic old-age dependency ratio (15-71) = Inactive population aged 65+ as % of employed population 15-71
source : Eurostat (EUROPOP2008), Commission services (DG ECFIN), EPC (AwG)

201
stAtIstICAl ANNEX — Main demographic and macroeconomic assumptions by country (2007-2060)
romania main DemograPhic anD macroeconomic assumPtions
(Baseline scenario)Budgetary Projection AWG – Population EUROPOP2008
Demographic assumptions 2008 2015 2020 2025 2030 2035 2040 2045 2050 2055 2060Fertility rate 1.32 1.35 1.37 1.39 1.41 1.42 1.44 1.46 1.48 1.50 1.52Life expectancy at birth
males 69.8 71.7 73.0 74.3 75.5 76.7 77.8 78.9 79.9 80.9 81.9females 76.6 78.2 79.3 80.3 81.3 82.3 83.2 84.1 85.0 85.8 86.6
Life expectancy at 65males 13.6 14.5 15.2 15.9 16.6 17.2 17.9 18.5 19.2 19.8 20.4females 16.3 17.3 18.0 18.7 19.4 20.0 20.7 21.4 22.0 22.6 23.2
Net migration (thousand) -5.6 4.0 6.3 1.8 -0.8 11.4 12.9 14.1 12.7 9.4 3.9Net migration as % of population 0.0 0.0 0.0 0.0 0.0 0.1 0.1 0.1 0.1 0.1 0.0Population (million) 21.4 21.1 20.8 20.5 20.0 19.6 19.2 18.7 18.1 17.6 16.9Young population (0-14) as % of total 15.2 14.9 14.7 13.9 13.0 12.2 11.8 11.8 11.8 11.7 11.5Prime age population (25-54) as % of total 44.2 45.1 45.6 43.5 41.4 39.0 37.2 34.5 33.6 33.2 32.8Working age population (15-64)as % of total 69.9 69.4 67.9 66.7 66.8 64.9 62.6 59.7 57.3 54.3 53.6Elderly population (65 and over)as % of total 14.9 15.6 17.4 19.4 20.3 22.9 25.5 28.5 30.9 34.0 35.0Very elderly population (80 and over)as % of total 2.8 3.6 4.2 4.3 4.9 6.2 7.4 7.7 9.4 11.1 13.1Elderly population (55 and over)as % of working age pop.15-64 37.2 41.4 43.3 48.3 52.6 59.5 66.0 75.0 80.3 85.7 87.7
macroeconomic assumptions* 2007 2015 2020 2025 2030 2035 2040 2045 2050 2055 2060Potential GDP (growth rate) 6.4 3.9 2.9 2.2 1.6 1.8 1.1 0.6 0.3 0.6 0.3Employment (growth rate) 0.2 -0.1 -0.5 -0.9 -1.1 -0.9 -1.6 -1.3 -1.4 -1.1 -1.4Labour input : hours worked (growth rate) 1.0 -0.1 -0.5 -0.9 -1.1 -0.9 -1.6 -1.3 -1.4 -1.1 -1.4Labour productivity per hour (growth rate) 5.4 4.0 3.4 3.0 2.7 2.7 2.7 2.0 1.7 1.7 1.7TFP (growth rate) 2.5 1.9 1.8 1.8 1.8 1.8 1.8 1.3 1.1 1.1 1.1Capital deepening (contribution to labourproductivity growth) 2.9 2.1 1.6 1.3 1.0 1.0 1.0 0.7 0.6 0.6 0.6GDP per capita (growth rate) 7.5 4.1 3.2 2.5 2.1 2.2 1.6 1.2 0.9 1.3 1.2GDP in 2007 prices (in millions euros) 121.3 178.6 209.5 235.9 257.5 280.4 303.2 315.1 321.2 328.6 335.8
Labour force assumptions 2007 2015 2020 2025 2030 2035 2040 2045 2050 2055 2060Population growth (working age:15-64) -0.1 -0.7 -0.8 -0.5 -0.3 -1.3 -1.4 -1.5 -1.4 -1.7 -0.9Population growth (working age:15-71) -0.2 -0.1 -0.3 -0.6 -0.7 -0.4 -1.5 -1.1 -1.4 -1.2 -1.6Labour force (thousands) 9875 9833 9650 9288 8811 8386 7918 7375 6868 6446 6051Participation rate (15-64) 63.0 64.7 64.8 64.2 62.4 61.4 60.8 60.7 60.5 61.3 61.3Participation rate (15-71) 60.0 61.5 61.1 60.4 59.3 57.9 56.5 56.1 55.7 55.8 56.3
young (15-24) 30.6 32.4 31.3 30.9 31.2 31.8 32.1 32.0 31.5 31.2 31.3prime-age (25-54) 78.9 78.1 77.1 76.0 75.3 74.9 74.7 75.0 75.2 75.2 75.1older (55-64) 42.4 46.3 47.1 50.9 48.2 47.1 45.6 45.8 44.2 45.0 45.4oldest (65-71) 27.8 26.2 28.9 30.4 31.6 32.5 30.8 30.6 29.8 29.9 29.4
Employment rate (15-64) 58.7 60.9 61.0 60.4 58.6 57.8 57.2 57.0 56.9 57.6 57.6Employment rate (15-71) 56.1 58.0 57.6 57.0 56.0 54.7 53.4 53.0 52.6 52.8 53.2Unemployment rate (15-64) 6.8 6.0 6.0 6.0 6.0 6.0 6.0 6.0 6.0 6.0 6.0Employment (15-64) (in millions) 8.8 8.9 8.6 8.2 7.9 7.4 6.9 6.4 5.9 5.5 5.2
share of young (15-24) 9% 7% 6% 6% 7% 7% 7% 7% 7% 7% 7%share of prime-age (25-54) 80% 79% 80% 78% 75% 74% 73% 72% 73% 75% 76%share of older (55-64) 11% 14% 13% 16% 18% 19% 20% 21% 20% 18% 17%
DepenDency ratios 2008 2015 2020 2025 2030 2035 2040 2045 2050 2055 2060Share of older population (55-64) (1) 15.9 18.9 17.7 19.2 22.3 24.1 25.3 27.2 26.3 23.0 22.5Old-age dependency ratio (2) 21 23 26 29 30 35 41 48 54 63 65Total dependency ratio (3) 43 44 47 50 50 54 60 68 75 84 87Total economic dependency ratio (4) 135 131 135 140 147 157 167 180 193 205 210Economic old-agedependency ratio (15-64) (5) 30 32 35 40 43 51 59 70 81 94 99Economic old-agedependency ratio (15-71) (6) 29 31 33 37 41 47 54 64 74 84 91
LEGENDA
* the potential GDP and its components is used to estimate the rate of potential output growth, net off normal cyclical variations(1) share of older population = Population aged 55 to 64 as % of population aged 15-64
(2) Old-age dependency ratio = Population aged 65 and over as a percentage of the population aged 15-64(3) total dependency ratio = Population under 15 and over 64 as a percentage of the population aged 15-64
(4) total economic dependency ratio = total population less employed as % of employed population 15-64(5) Economic old-age dependency ratio (15-64) = Inactive population aged 65+ as % of employed population 15-64(6) Economic old-age dependency ratio (15-71) = Inactive population aged 65+ as % of employed population 15-71
source : Eurostat (EUROPOP2008), Commission services (DG ECFIN), EPC (AwG)

202
European Economy 7/2008the 2009 Ageing Report: Underlying assumptions and projection methodologies for the EU-27 Member states
slovenia main DemograPhic anD macroeconomic assumPtions
(Baseline scenario)Budgetary Projection AWG – Population EUROPOP2008
Demographic assumptions 2008 2015 2020 2025 2030 2035 2040 2045 2050 2055 2060Fertility rate 1.32 1.35 1.37 1.39 1.40 1.42 1.44 1.46 1.48 1.50 1.52Life expectancy at birth
males 74.7 76.1 77.1 78.0 78.9 79.8 80.6 81.4 82.2 83.0 83.7females 81.9 83.0 83.7 84.4 85.1 85.8 86.4 87.0 87.6 88.2 88.8
Life expectancy at 65males 15.7 16.5 17.1 17.7 18.2 18.8 19.3 19.9 20.4 20.9 21.4females 19.6 20.4 20.9 21.5 22.0 22.5 23.0 23.5 24.0 24.5 24.9
Net migration (thousand) 5.9 5.0 4.4 3.6 3.4 3.1 3.3 3.4 3.0 2.6 2.3Net migration as % of population 0.3 0.2 0.2 0.2 0.2 0.2 0.2 0.2 0.2 0.1 0.1Population (million) 2.0 2.1 2.1 2.0 2.0 2.0 2.0 1.9 1.9 1.8 1.8Young population (0-14) as % of total 13.9 14.0 14.2 13.6 12.8 12.2 12.1 12.4 12.8 12.9 12.8Prime age population (25-54) as % of total 45.7 43.7 41.7 39.5 37.7 35.8 34.3 33.3 33.0 33.1 33.2Working age population (15-64)as % of total 70.0 68.1 65.4 63.5 61.9 60.4 58.9 56.7 54.7 53.7 53.8Elderly population (65 and over)as % of total 16.1 17.9 20.4 22.9 25.3 27.4 29.1 31.0 32.5 33.4 33.4Very elderly population (80 and over)as % of total 3.5 4.8 5.4 6.0 6.7 8.4 9.9 11.0 12.0 12.7 13.9Elderly population (55 and over)as % of working age pop.15-64 40.0 47.3 53.1 58.6 63.5 69.3 74.8 79.8 82.9 83.8 82.8
macroeconomic assumptions* 2007 2015 2020 2025 2030 2035 2040 2045 2050 2055 2060Potential GDP (growth rate) 4.9 3.2 2.6 1.4 0.8 0.7 0.7 0.7 0.8 1.0 1.1Employment (growth rate) 1.2 0.0 -0.5 -0.9 -0.9 -0.9 -1.0 -1.0 -0.9 -0.7 -0.6Labour input : hours worked (growth rate) 1.2 0.0 -0.5 -0.9 -0.9 -1.0 -1.0 -1.0 -0.9 -0.7 -0.6Labour productivity per hour (growth rate) 3.6 3.2 3.1 2.3 1.8 1.7 1.7 1.7 1.7 1.7 1.7TFP (growth rate) 1.5 1.6 1.7 1.3 1.2 1.1 1.1 1.1 1.1 1.1 1.1Capital deepening (contribution to labourproductivity growth) 2.1 1.5 1.4 1.0 0.6 0.6 0.6 0.6 0.6 0.6 0.6GDP per capita (growth rate) 4.5 3.0 2.6 1.6 1.1 1.1 1.1 1.1 1.3 1.5 1.7GDP in 2007 prices (in millions euros) 33.5 44.5 51.0 55.8 58.8 61.2 63.4 65.7 68.3 71.3 75.1
Labour force assumptions 2007 2015 2020 2025 2030 2035 2040 2045 2050 2055 2060Population growth (working age:15-64) 0.2 -0.5 -0.8 -0.7 -0.7 -0.7 -0.9 -1.2 -1.0 -0.7 -0.4Population growth (working age:15-71) 0.2 -0.3 -0.4 -0.6 -0.7 -0.8 -0.9 -0.9 -1.0 -1.0 -0.8Labour force (thousands) 1022 1024 1008 972 929 887 845 805 766 735 712Participation rate (15-64) 71.4 72.5 73.4 72.6 71.7 71.2 70.8 71.0 71.6 72.0 71.9Participation rate (15-71) 66.3 66.5 66.1 65.2 64.4 63.7 63.3 62.8 62.8 63.4 64.1
young (15-24) 40.9 41.9 40.8 39.2 40.1 41.0 41.4 41.3 40.6 40.0 40.1prime-age (25-54) 89.3 89.2 89.1 89.1 88.5 88.2 88.4 88.7 89.0 89.0 88.7older (55-64) 34.5 42.9 48.8 49.5 49.5 50.2 49.3 48.7 48.3 48.6 49.1oldest (65-71) 12.4 7.3 11.6 15.2 16.2 16.0 16.3 16.3 15.8 15.7 15.3
Employment rate (15-64) 67.8 69.1 69.9 69.2 68.3 67.9 67.5 67.7 68.3 68.6 68.6Employment rate (15-71) 63.1 63.4 63.1 62.2 61.5 60.8 60.5 60.0 60.0 60.6 61.2Unemployment rate (15-64) 4.9 4.7 4.7 4.7 4.7 4.7 4.7 4.7 4.7 4.7 4.7Employment (15-64) (in millions) 1.0 1.0 0.9 0.9 0.9 0.8 0.8 0.7 0.7 0.7 0.7
share of young (15-24) 10% 8% 8% 8% 9% 9% 9% 9% 9% 9% 9%share of prime-age (25-54) 82% 79% 78% 77% 75% 74% 73% 74% 75% 76% 76%share of older (55-64) 8% 13% 15% 16% 16% 17% 18% 18% 16% 15% 14%
DepenDency ratios 2008 2015 2020 2025 2030 2035 2040 2045 2050 2055 2060Share of older population (55-64) (1) 17.1 21.0 21.9 22.4 22.7 23.9 25.4 25.2 23.5 21.5 20.6Old-age dependency ratio (2) 23 26 31 36 41 45 49 55 59 62 62Total dependency ratio (3) 43 47 53 58 61 66 70 77 83 86 86Total economic dependency ratio (4) 107 111 116 125 133 140 148 156 163 167 168Economic old-agedependency ratio (15-64) (5) 32 37 42 49 56 63 69 76 83 87 87Economic old-agedependency ratio (15-71) (6) 31 37 42 47 54 61 67 73 79 83 84
LEGENDA
* the potential GDP and its components is used to estimate the rate of potential output growth, net off normal cyclical variations(1) share of older population = Population aged 55 to 64 as % of population aged 15-64
(2) Old-age dependency ratio = Population aged 65 and over as a percentage of the population aged 15-64(3) total dependency ratio = Population under 15 and over 64 as a percentage of the population aged 15-64
(4) total economic dependency ratio = total population less employed as % of employed population 15-64(5) Economic old-age dependency ratio (15-64) = Inactive population aged 65+ as % of employed population 15-64(6) Economic old-age dependency ratio (15-71) = Inactive population aged 65+ as % of employed population 15-71
source : Eurostat (EUROPOP2008), Commission services (DG ECFIN), EPC (AwG)

203
stAtIstICAl ANNEX — Main demographic and macroeconomic assumptions by country (2007-2060)
slovak rePuBlic main DemograPhic anD macroeconomic assumPtions
(Baseline scenario)Budgetary Projection AWG – Population EUROPOP2008
Demographic assumptions 2008 2015 2020 2025 2030 2035 2040 2045 2050 2055 2060Fertility rate 1.25 1.28 1.30 1.32 1.34 1.36 1.38 1.40 1.43 1.45 1.47Life expectancy at birth
males 70.9 72.6 73.8 74.9 76.0 77.1 78.2 79.2 80.2 81.1 82.0females 78.7 80.0 81.0 81.8 82.7 83.5 84.4 85.2 85.9 86.7 87.4
Life expectancy at 65males 13.3 14.3 15.0 15.6 16.3 17.0 17.7 18.3 19.0 19.6 20.2females 17.1 18.1 18.8 19.4 20.1 20.7 21.3 22.0 22.6 23.2 23.7
Net migration (thousand) 3.6 5.0 5.0 4.0 3.9 4.1 6.1 6.4 6.1 5.2 3.7Net migration as % of population 0.1 0.1 0.1 0.1 0.1 0.1 0.1 0.1 0.1 0.1 0.1Population (million) 5.4 5.4 5.4 5.4 5.3 5.2 5.1 5.0 4.9 4.7 4.5Young population (0-14) as % of total 15.8 14.7 14.6 13.9 12.9 11.9 11.3 11.2 11.3 11.3 11.1Prime age population (25-54) as % of total 45.6 45.7 45.4 44.4 42.3 39.4 37.0 34.9 33.3 32.7 32.4Working age population (15-64)as % of total 72.3 71.5 69.0 67.0 65.9 65.2 63.4 60.2 57.0 54.4 52.7Elderly population (65 and over)as % of total 12.0 13.8 16.4 19.1 21.3 23.0 25.3 28.6 31.6 34.3 36.1Very elderly population (80 and over)as % of total 2.6 3.0 3.2 3.7 4.7 6.4 7.8 8.7 9.3 10.8 13.2Elderly population (55 and over)as % of working age pop.15-64 32.3 38.3 43.1 47.4 52.6 59.3 66.5 74.9 82.6 87.9 91.3
macroeconomic assumptions* 2007 2015 2020 2025 2030 2035 2040 2045 2050 2055 2060Potential GDP (growth rate) 6.5 4.2 3.4 2.3 2.0 0.8 0.5 0.3 0.2 0.3 0.5Employment (growth rate) 0.8 0.7 0.3 -0.7 -0.6 -1.1 -1.2 -1.4 -1.5 -1.4 -1.2Labour input : hours worked (growth rate) 1.0 0.7 0.3 -0.7 -0.7 -1.1 -1.2 -1.4 -1.5 -1.4 -1.2Labour productivity per hour (growth rate) 5.3 3.5 3.1 2.9 2.7 1.9 1.7 1.7 1.7 1.7 1.7TFP (growth rate) 3.5 2.0 1.8 1.8 1.8 1.2 1.1 1.1 1.1 1.1 1.1Capital deepening (contribution to labourproductivity growth) 1.8 1.5 1.3 1.2 0.9 0.7 0.6 0.6 0.6 0.6 0.6GDP per capita (growth rate) 6.5 4.1 3.4 2.4 2.3 1.2 1.0 0.8 0.8 1.0 1.3GDP in 2007 prices (in millions euros) 54.8 83.2 99.8 112.7 125.1 132.8 136.7 139.5 140.9 142.7 146.1
Labour force assumptions 2007 2015 2020 2025 2030 2035 2040 2045 2050 2055 2060Population growth (working age:15-64) 0.5 -0.4 -0.7 -0.6 -0.7 -0.7 -1.3 -1.6 -1.6 -1.4 -1.1Population growth (working age:15-71) 0.6 0.0 -0.3 -0.6 -0.6 -0.6 -0.6 -1.0 -1.4 -1.5 -1.4Labour force (thousands) 2679 2831 2830 2750 2659 2543 2399 2246 2082 1935 1818Participation rate (15-64) 68.8 71.8 72.9 73.4 72.8 71.6 70.5 70.4 70.4 70.7 71.2Participation rate (15-71) 64.5 67.0 67.7 67.4 67.2 66.2 64.6 63.1 62.5 62.5 63.1
young (15-24) 34.8 37.7 35.9 33.8 34.3 35.2 35.9 36.1 35.4 34.6 34.5prime-age (25-54) 87.5 87.6 87.9 87.9 87.8 87.4 87.1 87.1 87.3 87.5 87.5older (55-64) 39.4 49.6 50.3 53.4 55.1 55.4 53.8 53.1 52.6 51.8 52.8oldest (65-71) 2.2 12.6 22.7 20.4 22.7 23.6 24.1 23.8 23.3 23.1 22.9
Employment rate (15-64) 61.2 65.6 68.4 68.8 68.3 67.2 66.2 66.0 66.0 66.3 66.8Employment rate (15-71) 57.3 61.3 63.6 63.3 63.1 62.2 60.8 59.3 58.8 58.8 59.4Unemployment rate (15-64) 11.1 8.6 6.2 6.2 6.2 6.2 6.2 6.2 6.2 6.2 6.2Employment (15-64) (in millions) 2.4 2.5 2.6 2.5 2.4 2.3 2.1 2.0 1.8 1.7 1.6
share of young (15-24) 10% 8% 7% 6% 7% 7% 7% 7% 7% 7% 7%share of prime-age (25-54) 81% 78% 80% 80% 78% 74% 72% 72% 73% 75% 76%share of older (55-64) 9% 13% 14% 14% 16% 19% 21% 21% 21% 19% 17%
DepenDency ratios 2008 2015 2020 2025 2030 2035 2040 2045 2050 2055 2060Share of older population (55-64) (1) 15.7 19.1 19.3 18.9 20.3 24.0 26.5 27.3 27.1 25.0 22.8Old-age dependency ratio (2) 17 19 24 28 32 35 40 48 55 63 68Total dependency ratio (3) 38 40 45 49 52 53 58 66 75 84 90Total economic dependency ratio (4) 126 111 108 113 118 124 133 145 158 170 177Economic old-agedependency ratio (15-64) (5) 27 28 31 38 43 48 55 65 77 88 96Economic old-agedependency ratio (15-71) (6) 27 27 30 36 41 46 52 61 72 82 90
LEGENDA
* the potential GDP and its components is used to estimate the rate of potential output growth, net off normal cyclical variations(1) share of older population = Population aged 55 to 64 as % of population aged 15-64
(2) Old-age dependency ratio = Population aged 65 and over as a percentage of the population aged 15-64(3) total dependency ratio = Population under 15 and over 64 as a percentage of the population aged 15-64
(4) total economic dependency ratio = total population less employed as % of employed population 15-64(5) Economic old-age dependency ratio (15-64) = Inactive population aged 65+ as % of employed population 15-64(6) Economic old-age dependency ratio (15-71) = Inactive population aged 65+ as % of employed population 15-71
source : Eurostat (EUROPOP2008), Commission services (DG ECFIN), EPC (AwG)

204
European Economy 7/2008the 2009 Ageing Report: Underlying assumptions and projection methodologies for the EU-27 Member states
finlanD main DemograPhic anD macroeconomic assumPtions
(Baseline scenario)Budgetary Projection AWG – Population EUROPOP2008
Demographic assumptions 2008 2015 2020 2025 2030 2035 2040 2045 2050 2055 2060Fertility rate 1.84 1.84 1.84 1.84 1.84 1.84 1.84 1.84 1.84 1.84 1.84Life expectancy at birth
males 76.1 77.4 78.3 79.1 79.9 80.7 81.5 82.2 83.0 83.7 84.3females 83.0 84.0 84.7 85.3 85.9 86.5 87.1 87.7 88.2 88.8 89.3
Life expectancy at 65males 16.6 17.4 17.9 18.4 18.9 19.4 19.9 20.4 20.9 21.4 21.8females 20.7 21.3 21.8 22.3 22.8 23.2 23.7 24.1 24.5 25.0 25.4
Net migration (thousand) 9.7 9.5 7.8 6.6 5.8 4.6 4.8 4.9 4.9 5.0 4.5Net migration as % of population 0.2 0.2 0.1 0.1 0.1 0.1 0.1 0.1 0.1 0.1 0.1Population (million) 5.3 5.4 5.5 5.5 5.6 5.6 5.5 5.5 5.4 5.4 5.4Young population (0-14) as % of total 16.9 16.4 16.6 16.6 16.3 15.9 15.6 15.6 15.7 15.8 15.7Prime age population (25-54) as % of total 40.0 37.9 36.9 35.9 35.6 35.3 34.9 34.9 34.6 34.6 34.6Working age population (15-64)as % of total 66.6 63.4 61.0 59.3 58.2 57.7 58.2 58.0 57.5 57.1 56.4Elderly population (65 and over)as % of total 16.5 20.1 22.4 24.1 25.5 26.4 26.2 26.4 26.8 27.1 27.8Very elderly population (80 and over)as % of total 4.3 5.1 5.6 6.2 8.2 9.4 10.1 10.6 10.8 10.5 10.8Elderly population (55 and over)as % of working age pop.15-64 46.1 53.3 58.3 61.9 63.5 65.1 65.6 66.2 67.7 68.3 69.0
macroeconomic assumptions* 2007 2015 2020 2025 2030 2035 2040 2045 2050 2055 2060Potential GDP (growth rate) 3.4 1.9 1.7 1.5 1.5 1.6 1.6 1.6 1.5 1.4 1.5Employment (growth rate) 1.2 -0.1 -0.1 -0.3 -0.2 -0.1 -0.1 -0.1 -0.2 -0.3 -0.2Labour input : hours worked (growth rate) 0.8 -0.1 -0.1 -0.3 -0.2 -0.1 -0.1 -0.1 -0.2 -0.3 -0.2Labour productivity per hour (growth rate) 2.5 2.0 1.8 1.8 1.7 1.7 1.7 1.7 1.7 1.7 1.7TFP (growth rate) 2.0 1.2 1.1 1.1 1.1 1.1 1.1 1.1 1.1 1.1 1.1Capital deepening (contribution to labourproductivity growth) 0.5 0.8 0.7 0.7 0.6 0.6 0.6 0.6 0.6 0.6 0.6GDP per capita (growth rate) 3.0 1.6 1.5 1.3 1.4 1.7 1.7 1.7 1.6 1.5 1.6GDP in 2007 prices (in millions euros) 178.8 217.5 238.1 256.9 276.0 298.1 322.8 349.2 375.8 403.4 433.8
Labour force assumptions 2007 2015 2020 2025 2030 2035 2040 2045 2050 2055 2060Population growth (working age:15-64) 0.0 -0.6 -0.5 -0.3 -0.3 -0.1 -0.1 -0.2 -0.3 -0.3 -0.3Population growth (working age:15-71) 0.5 0.3 -0.6 -0.4 -0.3 -0.3 -0.2 0.0 -0.2 -0.3 -0.1Labour force (thousands) 2690 2697 2691 2658 2621 2605 2595 2580 2552 2516 2487Participation rate (15-64) 75.8 77.0 78.4 78.5 78.6 78.9 78.8 78.9 79.1 79.0 79.1Participation rate (15-71) 69.8 68.7 69.7 70.5 70.7 71.1 71.8 71.6 71.3 71.2 71.0
young (15-24) 54.4 56.8 56.0 55.1 55.3 55.5 55.7 56.0 56.0 55.7 55.5prime-age (25-54) 88.1 88.8 89.2 89.5 89.8 89.9 90.1 90.0 90.1 90.1 90.1older (55-64) 59.4 61.9 66.5 67.0 66.1 67.9 67.8 67.8 68.5 67.5 67.7oldest (65-71) 8.6 9.5 12.6 15.6 16.4 15.9 15.9 16.6 16.5 16.3 16.5
Employment rate (15-64) 70.5 72.5 73.8 73.9 74.0 74.4 74.2 74.3 74.5 74.4 74.6Employment rate (15-71) 65.0 64.8 65.8 66.5 66.7 67.1 67.7 67.6 67.3 67.1 67.1Unemployment rate (15-64) 7.0 5.8 5.8 5.8 5.8 5.8 5.8 5.8 5.8 5.8 5.8Employment (15-64) (in millions) 2.5 2.5 2.5 2.4 2.4 2.4 2.4 2.4 2.3 2.3 2.3
share of young (15-24) 12% 13% 12% 12% 12% 13% 13% 12% 12% 12% 12%share of prime-age (25-54) 72% 70% 70% 70% 71% 71% 70% 70% 69% 70% 71%share of older (55-64) 16% 18% 18% 18% 17% 17% 18% 18% 18% 18% 17%
DepenDency ratios 2008 2015 2020 2025 2030 2035 2040 2045 2050 2055 2060Share of older population (55-64) (1) 21.3 21.6 21.5 21.3 19.7 19.4 20.6 20.7 21.1 20.8 19.7Old-age dependency ratio (2) 25 32 37 41 44 46 45 46 47 48 49Total dependency ratio (3) 50 58 64 69 72 73 72 72 74 75 77Total economic dependency ratio (4) 110 115 120 125 129 130 129 129 130 132 134Economic old-agedependency ratio (15-64) (5) 34 42 47 52 56 58 58 58 59 61 63Economic old-agedependency ratio (15-71) (6) 33 41 46 50 54 57 56 57 58 59 61
LEGENDA
* the potential GDP and its components is used to estimate the rate of potential output growth, net off normal cyclical variations(1) share of older population = Population aged 55 to 64 as % of population aged 15-64
(2) Old-age dependency ratio = Population aged 65 and over as a percentage of the population aged 15-64(3) total dependency ratio = Population under 15 and over 64 as a percentage of the population aged 15-64
(4) total economic dependency ratio = total population less employed as % of employed population 15-64(5) Economic old-age dependency ratio (15-64) = Inactive population aged 65+ as % of employed population 15-64(6) Economic old-age dependency ratio (15-71) = Inactive population aged 65+ as % of employed population 15-71
source : Eurostat (EUROPOP2008), Commission services (DG ECFIN), EPC (AwG)
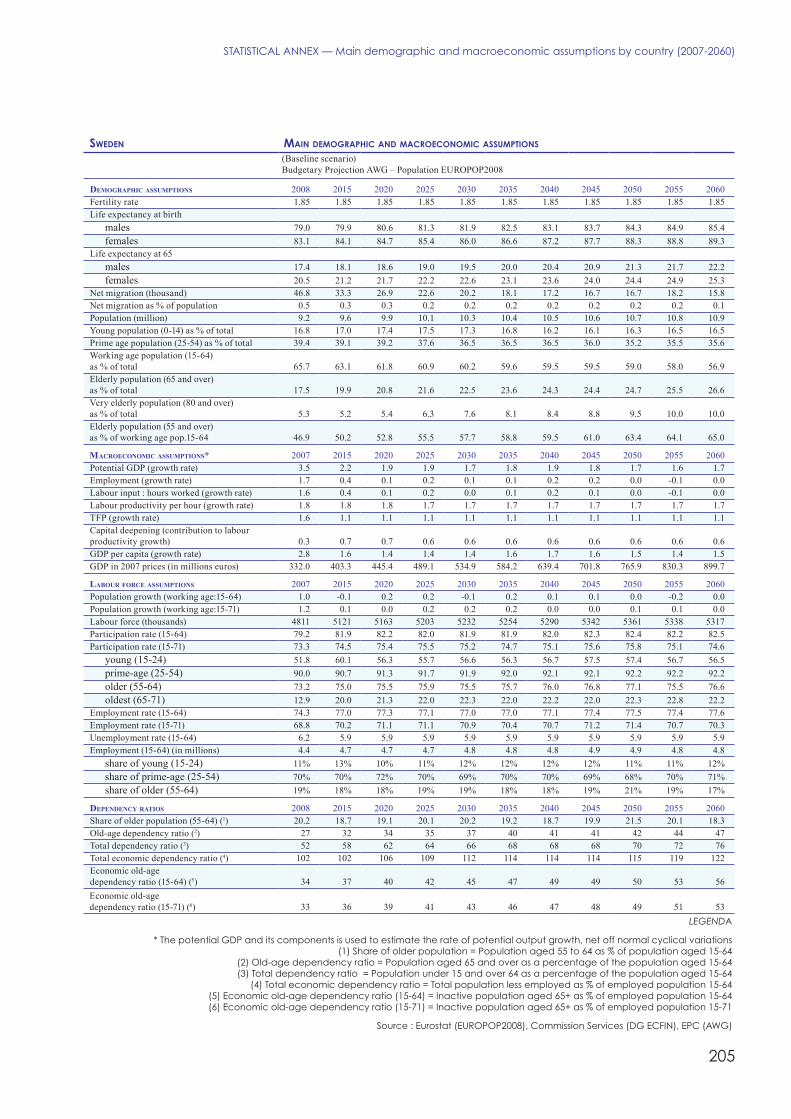
205
stAtIstICAl ANNEX — Main demographic and macroeconomic assumptions by country (2007-2060)
sweDen main DemograPhic anD macroeconomic assumPtions
(Baseline scenario)Budgetary Projection AWG – Population EUROPOP2008
Demographic assumptions 2008 2015 2020 2025 2030 2035 2040 2045 2050 2055 2060Fertility rate 1.85 1.85 1.85 1.85 1.85 1.85 1.85 1.85 1.85 1.85 1.85Life expectancy at birth
males 79.0 79.9 80.6 81.3 81.9 82.5 83.1 83.7 84.3 84.9 85.4females 83.1 84.1 84.7 85.4 86.0 86.6 87.2 87.7 88.3 88.8 89.3
Life expectancy at 65males 17.4 18.1 18.6 19.0 19.5 20.0 20.4 20.9 21.3 21.7 22.2females 20.5 21.2 21.7 22.2 22.6 23.1 23.6 24.0 24.4 24.9 25.3
Net migration (thousand) 46.8 33.3 26.9 22.6 20.2 18.1 17.2 16.7 16.7 18.2 15.8Net migration as % of population 0.5 0.3 0.3 0.2 0.2 0.2 0.2 0.2 0.2 0.2 0.1Population (million) 9.2 9.6 9.9 10.1 10.3 10.4 10.5 10.6 10.7 10.8 10.9Young population (0-14) as % of total 16.8 17.0 17.4 17.5 17.3 16.8 16.2 16.1 16.3 16.5 16.5Prime age population (25-54) as % of total 39.4 39.1 39.2 37.6 36.5 36.5 36.5 36.0 35.2 35.5 35.6Working age population (15-64)as % of total 65.7 63.1 61.8 60.9 60.2 59.6 59.5 59.5 59.0 58.0 56.9Elderly population (65 and over)as % of total 17.5 19.9 20.8 21.6 22.5 23.6 24.3 24.4 24.7 25.5 26.6Very elderly population (80 and over)as % of total 5.3 5.2 5.4 6.3 7.6 8.1 8.4 8.8 9.5 10.0 10.0Elderly population (55 and over)as % of working age pop.15-64 46.9 50.2 52.8 55.5 57.7 58.8 59.5 61.0 63.4 64.1 65.0
macroeconomic assumptions* 2007 2015 2020 2025 2030 2035 2040 2045 2050 2055 2060Potential GDP (growth rate) 3.5 2.2 1.9 1.9 1.7 1.8 1.9 1.8 1.7 1.6 1.7Employment (growth rate) 1.7 0.4 0.1 0.2 0.1 0.1 0.2 0.2 0.0 -0.1 0.0Labour input : hours worked (growth rate) 1.6 0.4 0.1 0.2 0.0 0.1 0.2 0.1 0.0 -0.1 0.0Labour productivity per hour (growth rate) 1.8 1.8 1.8 1.7 1.7 1.7 1.7 1.7 1.7 1.7 1.7TFP (growth rate) 1.6 1.1 1.1 1.1 1.1 1.1 1.1 1.1 1.1 1.1 1.1Capital deepening (contribution to labourproductivity growth) 0.3 0.7 0.7 0.6 0.6 0.6 0.6 0.6 0.6 0.6 0.6GDP per capita (growth rate) 2.8 1.6 1.4 1.4 1.4 1.6 1.7 1.6 1.5 1.4 1.5GDP in 2007 prices (in millions euros) 332.0 403.3 445.4 489.1 534.9 584.2 639.4 701.8 765.9 830.3 899.7
Labour force assumptions 2007 2015 2020 2025 2030 2035 2040 2045 2050 2055 2060Population growth (working age:15-64) 1.0 -0.1 0.2 0.2 -0.1 0.2 0.1 0.1 0.0 -0.2 0.0Population growth (working age:15-71) 1.2 0.1 0.0 0.2 0.2 0.2 0.0 0.0 0.1 0.1 0.0Labour force (thousands) 4811 5121 5163 5203 5232 5254 5290 5342 5361 5338 5317Participation rate (15-64) 79.2 81.9 82.2 82.0 81.9 81.9 82.0 82.3 82.4 82.2 82.5Participation rate (15-71) 73.3 74.5 75.4 75.5 75.2 74.7 75.1 75.6 75.8 75.1 74.6
young (15-24) 51.8 60.1 56.3 55.7 56.6 56.3 56.7 57.5 57.4 56.7 56.5prime-age (25-54) 90.0 90.7 91.3 91.7 91.9 92.0 92.1 92.1 92.2 92.2 92.2older (55-64) 73.2 75.0 75.5 75.9 75.5 75.7 76.0 76.8 77.1 75.5 76.6oldest (65-71) 12.9 20.0 21.3 22.0 22.3 22.0 22.2 22.0 22.3 22.8 22.2
Employment rate (15-64) 74.3 77.0 77.3 77.1 77.0 77.0 77.1 77.4 77.5 77.4 77.6Employment rate (15-71) 68.8 70.2 71.1 71.1 70.9 70.4 70.7 71.2 71.4 70.7 70.3Unemployment rate (15-64) 6.2 5.9 5.9 5.9 5.9 5.9 5.9 5.9 5.9 5.9 5.9Employment (15-64) (in millions) 4.4 4.7 4.7 4.7 4.8 4.8 4.8 4.9 4.9 4.8 4.8
share of young (15-24) 11% 13% 10% 11% 12% 12% 12% 12% 11% 11% 12%share of prime-age (25-54) 70% 70% 72% 70% 69% 70% 70% 69% 68% 70% 71%share of older (55-64) 19% 18% 18% 19% 19% 18% 18% 19% 21% 19% 17%
DepenDency ratios 2008 2015 2020 2025 2030 2035 2040 2045 2050 2055 2060Share of older population (55-64) (1) 20.2 18.7 19.1 20.1 20.2 19.2 18.7 19.9 21.5 20.1 18.3Old-age dependency ratio (2) 27 32 34 35 37 40 41 41 42 44 47Total dependency ratio (3) 52 58 62 64 66 68 68 68 70 72 76Total economic dependency ratio (4) 102 102 106 109 112 114 114 114 115 119 122Economic old-agedependency ratio (15-64) (5) 34 37 40 42 45 47 49 49 50 53 56Economic old-agedependency ratio (15-71) (6) 33 36 39 41 43 46 47 48 49 51 53
LEGENDA
* the potential GDP and its components is used to estimate the rate of potential output growth, net off normal cyclical variations(1) share of older population = Population aged 55 to 64 as % of population aged 15-64
(2) Old-age dependency ratio = Population aged 65 and over as a percentage of the population aged 15-64(3) total dependency ratio = Population under 15 and over 64 as a percentage of the population aged 15-64
(4) total economic dependency ratio = total population less employed as % of employed population 15-64(5) Economic old-age dependency ratio (15-64) = Inactive population aged 65+ as % of employed population 15-64(6) Economic old-age dependency ratio (15-71) = Inactive population aged 65+ as % of employed population 15-71
source : Eurostat (EUROPOP2008), Commission services (DG ECFIN), EPC (AwG)

206
European Economy 7/2008the 2009 Ageing Report: Underlying assumptions and projection methodologies for the EU-27 Member states
uniteD-kingDom main DemograPhic anD macroeconomic assumPtions
(Baseline scenario)Budgetary Projection AWG – Population EUROPOP2008
Demographic assumptions 2008 2015 2020 2025 2030 2035 2040 2045 2050 2055 2060Fertility rate 1.84 1.84 1.84 1.84 1.84 1.84 1.84 1.84 1.84 1.84 1.84Life expectancy at birth
males 77.4 78.6 79.4 80.2 80.9 81.7 82.4 83.1 83.8 84.4 85.0females 81.5 82.7 83.5 84.2 85.0 85.7 86.4 87.0 87.7 88.3 88.9
Life expectancy at 65males 16.9 17.6 18.2 18.7 19.2 19.7 20.3 20.7 21.2 21.7 22.1females 19.5 20.3 20.9 21.5 22.1 22.6 23.1 23.6 24.1 24.6 25.1
Net migration (thousand) 188.2 174.3 165.7 158.0 150.9 144.3 138.0 131.8 126.3 122.2 113.6Net migration as % of population 0.3 0.3 0.3 0.2 0.2 0.2 0.2 0.2 0.2 0.2 0.1Population (million) 61.3 63.8 65.7 67.5 69.2 70.7 72.0 73.3 74.5 75.6 76.7Young population (0-14) as % of total 17.5 17.3 17.7 17.8 17.6 17.2 16.8 16.6 16.6 16.6 16.6Prime age population (25-54) as % of total 41.1 41.2 40.4 39.1 38.2 38.5 38.1 37.4 36.8 36.7 36.7Working age population (15-64)as % of total 66.4 65.1 64.0 63.1 61.8 60.9 60.8 61.0 60.5 59.5 58.7Elderly population (65 and over)as % of total 16.1 17.6 18.3 19.2 20.5 21.9 22.4 22.4 23.0 23.9 24.7Very elderly population (80 and over)as % of total 4.5 4.8 5.0 5.3 6.3 6.7 7.3 8.1 8.9 9.1 9.0Elderly population (55 and over)as % of working age pop.15-64 42.1 44.6 47.6 50.4 52.5 53.4 54.6 56.2 58.2 59.8 60.6
macroeconomic assumptions* 2007 2015 2020 2025 2030 2035 2040 2045 2050 2055 2060Potential GDP (growth rate) 2.7 2.4 2.0 2.0 2.1 2.1 2.1 2.1 1.9 1.8 1.8Employment (growth rate) 0.7 0.5 0.2 0.3 0.4 0.4 0.5 0.4 0.2 0.1 0.1Labour input : hours worked (growth rate) 0.2 0.5 0.2 0.3 0.4 0.4 0.5 0.4 0.2 0.1 0.1Labour productivity per hour (growth rate) 2.5 1.9 1.8 1.8 1.7 1.7 1.7 1.7 1.7 1.7 1.7TFP (growth rate) 1.4 1.1 1.1 1.1 1.1 1.1 1.1 1.1 1.1 1.1 1.1Capital deepening (contribution to labourproductivity growth) 1.1 0.8 0.7 0.7 0.6 0.6 0.6 0.6 0.6 0.6 0.6GDP per capita (growth rate) 1.2 1.8 1.4 1.5 1.6 1.7 1.8 1.8 1.6 1.5 1.5GDP in 2007 prices (in millions euros) 2018.8 2461.5 2738.2 3030.0 3351.7 3710.6 4121.4 4584.2 5056.1 5526.5 6028.1
Labour force assumptions 2007 2015 2020 2025 2030 2035 2040 2045 2050 2055 2060Population growth (working age:15-64) 1.1 0.2 0.3 0.2 0.0 0.2 0.4 0.3 0.0 0.0 0.1Population growth (working age:15-71) 1.0 0.4 0.0 0.4 0.3 0.2 0.1 0.2 0.4 0.2 0.0Labour force (thousands) 31044 32639 33138 33641 34241 34841 35614 36472 36993 37153 37235Participation rate (15-64) 75.6 76.9 77.2 77.0 77.5 78.0 78.5 78.6 78.6 78.6 78.7Participation rate (15-71) 70.4 70.7 71.1 71.1 71.1 71.5 72.6 73.7 73.4 72.9 72.8
young (15-24) 62.0 63.8 63.1 62.1 62.4 62.3 62.6 62.9 62.8 62.5 62.4prime-age (25-54) 84.5 84.9 85.1 85.4 85.7 85.8 85.8 85.8 85.8 85.9 85.9older (55-64) 59.7 62.6 64.1 64.7 65.8 67.6 70.3 71.3 71.3 71.0 71.1oldest (65-71) 13.8 15.1 15.5 17.3 20.2 21.7 23.7 28.0 30.1 30.4 29.9
Employment rate (15-64) 71.5 72.7 73.0 72.9 73.2 73.8 74.2 74.3 74.3 74.3 74.4Employment rate (15-71) 66.6 66.9 67.3 67.3 67.3 67.7 68.8 69.8 69.5 69.1 69.0Unemployment rate (15-64) 5.4 5.4 5.4 5.4 5.4 5.4 5.4 5.4 5.4 5.4 5.4Employment (15-64) (in millions) 28.9 30.2 30.7 31.0 31.4 31.8 32.5 33.2 33.5 33.4 33.5
share of young (15-24) 15% 14% 13% 13% 14% 14% 14% 14% 14% 13% 14%share of prime-age (25-54) 71% 71% 71% 70% 69% 70% 70% 68% 68% 68% 69%share of older (55-64) 14% 15% 16% 17% 17% 16% 16% 18% 19% 18% 17%
DepenDency ratios 2008 2015 2020 2025 2030 2035 2040 2045 2050 2055 2060Share of older population (55-64) (1) 17.9 17.5 19.0 20.1 19.3 17.5 17.7 19.5 20.2 19.6 18.5Old-age dependency ratio (2) 24 27 29 30 33 36 37 37 38 40 42Total dependency ratio (3) 51 54 56 59 62 64 64 64 65 68 70Total economic dependency ratio (4) 108 109 112 115 117 118 118 116 118 121 123Economic old-agedependency ratio (15-64) (5) 32 35 36 39 42 45 46 45 46 48 51Economic old-agedependency ratio (15-71) (6) 31 34 36 38 40 43 44 43 44 46 48
LEGENDA
* the potential GDP and its components is used to estimate the rate of potential output growth, net off normal cyclical variations(1) share of older population = Population aged 55 to 64 as % of population aged 15-64
(2) Old-age dependency ratio = Population aged 65 and over as a percentage of the population aged 15-64(3) total dependency ratio = Population under 15 and over 64 as a percentage of the population aged 15-64
(4) total economic dependency ratio = total population less employed as % of employed population 15-64(5) Economic old-age dependency ratio (15-64) = Inactive population aged 65+ as % of employed population 15-64(6) Economic old-age dependency ratio (15-71) = Inactive population aged 65+ as % of employed population 15-71
source : Eurostat (EUROPOP2008), Commission services (DG ECFIN), EPC (AwG)

207
stAtIstICAl ANNEX — Main demographic and macroeconomic assumptions by country (2007-2060)
norway main DemograPhic anD macroeconomic assumPtions
(Baseline scenario)Budgetary Projection AWG – Population EUROPOP2008
Demographic assumptions 2008 2015 2020 2025 2030 2035 2040 2045 2050 2055 2060Fertility rate 1.90 1.90 1.90 1.90 1.89 1.89 1.89 1.89 1.89 1.89 1.88Life expectancy at birth
males 78.4 79.4 80.1 80.8 81.5 82.2 82.8 83.5 84.1 84.7 85.2females 82.9 83.8 84.5 85.2 85.8 86.4 87.0 87.6 88.1 88.7 89.2
Life expectancy at 65males 17.3 18.0 18.5 19.0 19.5 19.9 20.4 20.8 21.3 21.7 22.1females 20.4 21.1 21.6 22.1 22.6 23.0 23.5 23.9 24.4 24.8 25.2
Net migration (thousand) 22.4 17.5 15.2 13.5 12.4 11.6 11.0 10.6 10.3 10.1 9.6Net migration as % of population 0.5 0.4 0.3 0.3 0.2 0.2 0.2 0.2 0.2 0.2 0.2Population (million) 4.7 5.0 5.2 5.4 5.5 5.6 5.7 5.8 5.9 6.0 6.0Young population (0-14) as % of total 19.2 18.2 18.0 17.9 17.8 17.5 17.2 16.9 16.7 16.7 16.7Prime age population (25-54) as % of total 41.5 40.2 39.6 38.3 37.0 36.6 36.4 36.1 35.7 35.4 35.4Working age population (15-64)as % of total 66.2 65.1 63.9 62.5 61.2 59.9 59.0 59.0 58.9 58.5 57.9Elderly population (65 and over)as % of total 14.6 16.7 18.1 19.6 21.0 22.6 23.8 24.1 24.4 24.8 25.4Very elderly population (80 and over)as % of total 4.6 4.4 4.4 5.0 6.3 7.1 7.8 8.4 9.3 9.9 10.0Elderly population (55 and over)as % of working age pop.15-64 40.3 44.0 47.3 51.4 55.0 57.4 58.9 59.9 61.3 62.6 63.5
macroeconomic assumptions* 2007 2015 2020 2025 2030 2035 2040 2045 2050 2055 2060Potential GDP (growth rate) 6.0 2.1 2.0 1.9 1.7 1.7 1.9 1.9 1.9 1.8 1.8Employment (growth rate) 3.8 0.4 0.3 0.2 0.1 0.1 0.2 0.2 0.2 0.1 0.1Labour input : hours worked (growth rate) 3.9 0.4 0.3 0.2 0.0 0.0 0.2 0.2 0.2 0.1 0.1Labour productivity per hour (growth rate) 1.6 1.6 1.7 1.7 1.7 1.7 1.7 1.7 1.7 1.7 1.7TFP (growth rate) 2.1 1.1 1.1 1.1 1.1 1.1 1.1 1.1 1.1 1.1 1.1Capital deepening (contribution to labourproductivity growth) -0.5 0.5 0.6 0.6 0.6 0.6 0.6 0.6 0.6 0.6 0.6GDP per capita (growth rate) 5.1 1.3 1.3 1.2 1.2 1.3 1.5 1.6 1.6 1.5 1.5GDP in 2007 prices (in millions euros) 214.1 253.9 280.4 308.0 336.4 366.4 400.6 440.1 483.8 529.4 577.5
Labour force assumptions 2007 2015 2020 2025 2030 2035 2040 2045 2050 2055 2060Population growth (working age:15-64) 1.3 0.4 0.3 0.2 0.1 0.0 0.1 0.3 0.2 0.0 0.0Population growth (working age:15-71) 1.3 0.7 0.2 0.3 0.2 0.2 0.1 0.1 0.3 0.2 0.1Labour force (thousands) 2481 2616 2658 2685 2699 2704 2720 2751 2782 2798 2806Participation rate (15-64) 78.8 78.3 78.3 78.2 77.9 77.8 78.0 78.0 78.0 77.9 78.0Participation rate (15-71) 74.5 72.2 72.1 71.7 71.2 70.6 70.6 71.2 71.4 71.1 70.7
young (15-24) 58.8 60.8 61.0 60.3 60.5 60.2 60.2 60.5 60.7 60.6 60.5prime-age (25-54) 87.4 87.4 87.3 87.2 87.3 87.4 87.4 87.4 87.4 87.4 87.5older (55-64) 69.9 66.7 66.4 67.2 66.3 65.0 65.6 66.2 66.5 65.8 65.6oldest (65-71) 18.9 18.3 17.6 17.4 17.5 17.7 17.0 16.9 17.1 17.5 17.1
Employment rate (15-64) 76.8 75.1 75.1 74.9 74.7 74.6 74.8 74.8 74.8 74.7 74.8Employment rate (15-71) 72.6 69.2 69.1 68.8 68.3 67.8 67.8 68.3 68.5 68.2 67.8Unemployment rate (15-64) 2.5 4.1 4.1 4.1 4.1 4.1 4.1 4.1 4.1 4.1 4.1Employment (15-64) (in millions) 2.4 2.4 2.5 2.5 2.5 2.5 2.5 2.6 2.6 2.6 2.6
share of young (15-24) 13% 14% 14% 13% 13% 14% 14% 14% 14% 14% 14%share of prime-age (25-54) 70% 70% 70% 69% 68% 69% 70% 69% 69% 69% 69%share of older (55-64) 16% 16% 17% 18% 18% 17% 16% 17% 17% 18% 17%
DepenDency ratios 2008 2015 2020 2025 2030 2035 2040 2045 2050 2055 2060Share of older population (55-64) (1) 18.2 18.4 19.0 20.0 20.7 19.6 18.7 19.0 19.9 20.2 19.6Old-age dependency ratio (2) 22 26 28 31 34 38 40 41 41 42 44Total dependency ratio (3) 51 54 56 60 63 67 69 70 70 71 73Total economic dependency ratio (4) 98 102 105 110 115 120 123 123 124 126 128Economic old-agedependency ratio (15-64) (5) 27 31 35 39 43 47 50 51 52 53 55Economic old-agedependency ratio (15-71) (6) 26 30 34 38 41 45 49 50 51 52 53
LEGENDA
* the potential GDP and its components is used to estimate the rate of potential output growth, net off normal cyclical variations(1) share of older population = Population aged 55 to 64 as % of population aged 15-64
(2) Old-age dependency ratio = Population aged 65 and over as a percentage of the population aged 15-64(3) total dependency ratio = Population under 15 and over 64 as a percentage of the population aged 15-64
(4) total economic dependency ratio = total population less employed as % of employed population 15-64(5) Economic old-age dependency ratio (15-64) = Inactive population aged 65+ as % of employed population 15-64(6) Economic old-age dependency ratio (15-71) = Inactive population aged 65+ as % of employed population 15-71
source : Eurostat (EUROPOP2008), Commission services (DG ECFIN), EPC (AwG)
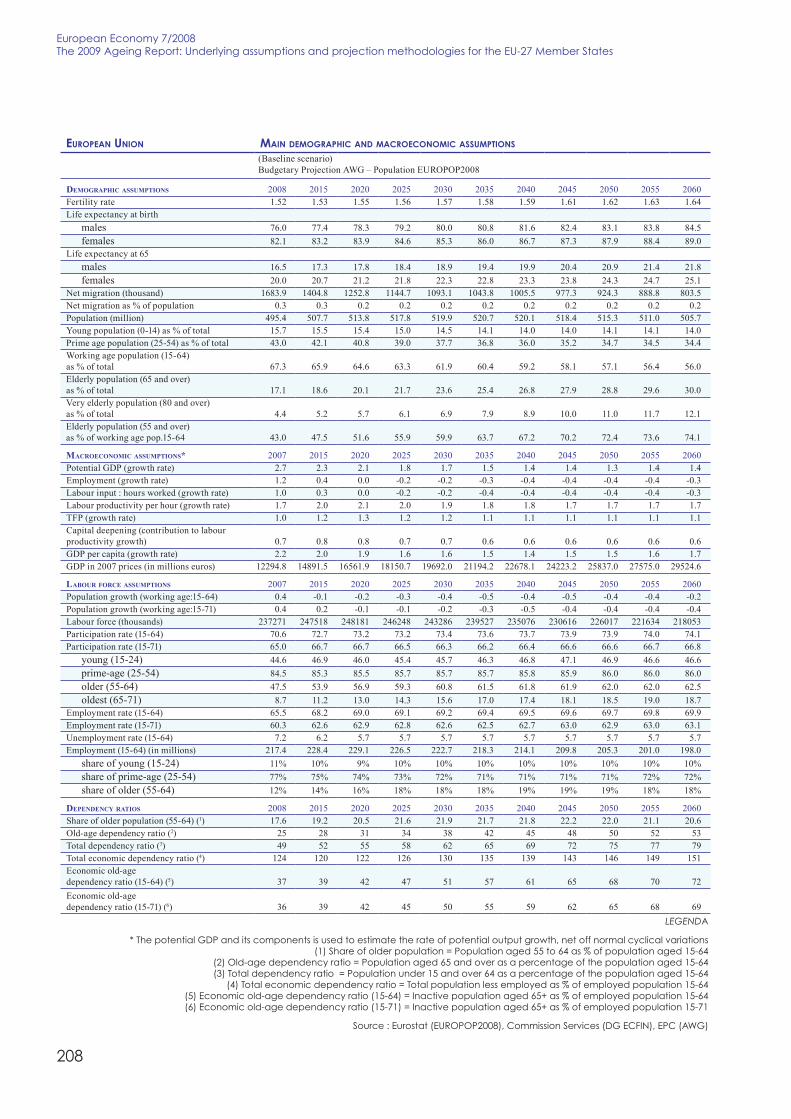
208
European Economy 7/2008the 2009 Ageing Report: Underlying assumptions and projection methodologies for the EU-27 Member states
euroPean union main DemograPhic anD macroeconomic assumPtions
(Baseline scenario)Budgetary Projection AWG – Population EUROPOP2008
Demographic assumptions 2008 2015 2020 2025 2030 2035 2040 2045 2050 2055 2060Fertility rate 1.52 1.53 1.55 1.56 1.57 1.58 1.59 1.61 1.62 1.63 1.64Life expectancy at birth
males 76.0 77.4 78.3 79.2 80.0 80.8 81.6 82.4 83.1 83.8 84.5females 82.1 83.2 83.9 84.6 85.3 86.0 86.7 87.3 87.9 88.4 89.0
Life expectancy at 65males 16.5 17.3 17.8 18.4 18.9 19.4 19.9 20.4 20.9 21.4 21.8females 20.0 20.7 21.2 21.8 22.3 22.8 23.3 23.8 24.3 24.7 25.1
Net migration (thousand) 1683.9 1404.8 1252.8 1144.7 1093.1 1043.8 1005.5 977.3 924.3 888.8 803.5Net migration as % of population 0.3 0.3 0.2 0.2 0.2 0.2 0.2 0.2 0.2 0.2 0.2Population (million) 495.4 507.7 513.8 517.8 519.9 520.7 520.1 518.4 515.3 511.0 505.7Young population (0-14) as % of total 15.7 15.5 15.4 15.0 14.5 14.1 14.0 14.0 14.1 14.1 14.0Prime age population (25-54) as % of total 43.0 42.1 40.8 39.0 37.7 36.8 36.0 35.2 34.7 34.5 34.4Working age population (15-64)as % of total 67.3 65.9 64.6 63.3 61.9 60.4 59.2 58.1 57.1 56.4 56.0Elderly population (65 and over)as % of total 17.1 18.6 20.1 21.7 23.6 25.4 26.8 27.9 28.8 29.6 30.0Very elderly population (80 and over)as % of total 4.4 5.2 5.7 6.1 6.9 7.9 8.9 10.0 11.0 11.7 12.1Elderly population (55 and over)as % of working age pop.15-64 43.0 47.5 51.6 55.9 59.9 63.7 67.2 70.2 72.4 73.6 74.1
macroeconomic assumptions* 2007 2015 2020 2025 2030 2035 2040 2045 2050 2055 2060Potential GDP (growth rate) 2.7 2.3 2.1 1.8 1.7 1.5 1.4 1.4 1.3 1.4 1.4Employment (growth rate) 1.2 0.4 0.0 -0.2 -0.2 -0.3 -0.4 -0.4 -0.4 -0.4 -0.3Labour input : hours worked (growth rate) 1.0 0.3 0.0 -0.2 -0.2 -0.4 -0.4 -0.4 -0.4 -0.4 -0.3Labour productivity per hour (growth rate) 1.7 2.0 2.1 2.0 1.9 1.8 1.8 1.7 1.7 1.7 1.7TFP (growth rate) 1.0 1.2 1.3 1.2 1.2 1.1 1.1 1.1 1.1 1.1 1.1Capital deepening (contribution to labourproductivity growth) 0.7 0.8 0.8 0.7 0.7 0.6 0.6 0.6 0.6 0.6 0.6GDP per capita (growth rate) 2.2 2.0 1.9 1.6 1.6 1.5 1.4 1.5 1.5 1.6 1.7GDP in 2007 prices (in millions euros) 12294.8 14891.5 16561.9 18150.7 19692.0 21194.2 22678.1 24223.2 25837.0 27575.0 29524.6
Labour force assumptions 2007 2015 2020 2025 2030 2035 2040 2045 2050 2055 2060Population growth (working age:15-64) 0.4 -0.1 -0.2 -0.3 -0.4 -0.5 -0.4 -0.5 -0.4 -0.4 -0.2Population growth (working age:15-71) 0.4 0.2 -0.1 -0.1 -0.2 -0.3 -0.5 -0.4 -0.4 -0.4 -0.4Labour force (thousands) 237271 247518 248181 246248 243286 239527 235076 230616 226017 221634 218053Participation rate (15-64) 70.6 72.7 73.2 73.2 73.4 73.6 73.7 73.9 73.9 74.0 74.1Participation rate (15-71) 65.0 66.7 66.7 66.5 66.3 66.2 66.4 66.6 66.6 66.7 66.8
young (15-24) 44.6 46.9 46.0 45.4 45.7 46.3 46.8 47.1 46.9 46.6 46.6prime-age (25-54) 84.5 85.3 85.5 85.7 85.7 85.7 85.8 85.9 86.0 86.0 86.0older (55-64) 47.5 53.9 56.9 59.3 60.8 61.5 61.8 61.9 62.0 62.0 62.5oldest (65-71) 8.7 11.2 13.0 14.3 15.6 17.0 17.4 18.1 18.5 19.0 18.7
Employment rate (15-64) 65.5 68.2 69.0 69.1 69.2 69.4 69.5 69.6 69.7 69.8 69.9Employment rate (15-71) 60.3 62.6 62.9 62.8 62.6 62.5 62.7 63.0 62.9 63.0 63.1Unemployment rate (15-64) 7.2 6.2 5.7 5.7 5.7 5.7 5.7 5.7 5.7 5.7 5.7Employment (15-64) (in millions) 217.4 228.4 229.1 226.5 222.7 218.3 214.1 209.8 205.3 201.0 198.0
share of young (15-24) 11% 10% 9% 10% 10% 10% 10% 10% 10% 10% 10%share of prime-age (25-54) 77% 75% 74% 73% 72% 71% 71% 71% 71% 72% 72%share of older (55-64) 12% 14% 16% 18% 18% 18% 19% 19% 19% 18% 18%
DepenDency ratios 2008 2015 2020 2025 2030 2035 2040 2045 2050 2055 2060Share of older population (55-64) (1) 17.6 19.2 20.5 21.6 21.9 21.7 21.8 22.2 22.0 21.1 20.6Old-age dependency ratio (2) 25 28 31 34 38 42 45 48 50 52 53Total dependency ratio (3) 49 52 55 58 62 65 69 72 75 77 79Total economic dependency ratio (4) 124 120 122 126 130 135 139 143 146 149 151Economic old-agedependency ratio (15-64) (5) 37 39 42 47 51 57 61 65 68 70 72Economic old-agedependency ratio (15-71) (6) 36 39 42 45 50 55 59 62 65 68 69
LEGENDA
* the potential GDP and its components is used to estimate the rate of potential output growth, net off normal cyclical variations(1) share of older population = Population aged 55 to 64 as % of population aged 15-64
(2) Old-age dependency ratio = Population aged 65 and over as a percentage of the population aged 15-64(3) total dependency ratio = Population under 15 and over 64 as a percentage of the population aged 15-64
(4) total economic dependency ratio = total population less employed as % of employed population 15-64(5) Economic old-age dependency ratio (15-64) = Inactive population aged 65+ as % of employed population 15-64(6) Economic old-age dependency ratio (15-71) = Inactive population aged 65+ as % of employed population 15-71
source : Eurostat (EUROPOP2008), Commission services (DG ECFIN), EPC (AwG)

209
stAtIstICAl ANNEX — Main demographic and macroeconomic assumptions by country (2007-2060)
euro area main DemograPhic anD macroeconomic assumPtions
(Baseline scenario)Budgetary Projection AWG – Population EUROPOP2008
Demographic assumptions 2008 2015 2020 2025 2030 2035 2040 2045 2050 2055 2060Fertility rate 1.55 1.57 1.58 1.59 1.60 1.61 1.62 1.63 1.64 1.65 1.66Life expectancy at birth
males 77.0 78.2 79.0 79.8 80.6 81.3 82.1 82.8 83.4 84.1 84.7females 82.5 83.6 84.3 84.9 85.6 86.2 86.8 87.4 88.0 88.6 89.1
Life expectancy at 65males 16.8 17.5 18.0 18.6 19.1 19.6 20.1 20.5 21.0 21.5 21.9females 20.1 20.9 21.4 21.9 22.4 22.9 23.3 23.8 24.3 24.7 25.1
Net migration (thousand) 1418.3 1120.9 980.1 906.6 873.0 810.9 755.7 731.4 686.9 670.9 623.0Net migration as % of population 0.4 0.3 0.3 0.3 0.3 0.2 0.2 0.2 0.2 0.2 0.2Population (million) 319.5 329.5 334.1 337.1 339.1 340.2 340.4 339.4 337.3 334.2 330.6Young population (0-14) as % of total 15.4 15.3 15.0 14.6 14.2 13.9 13.8 13.9 13.9 13.9 13.9Prime age population (25-54) as % of total 43.3 41.8 40.0 38.0 36.7 35.9 35.3 34.8 34.4 34.4 34.2Working age population (15-64)as % of total 66.5 65.2 64.2 63.0 61.2 59.4 58.0 57.0 56.3 56.0 56.0Elderly population (65 and over)as % of total 18.1 19.5 20.8 22.5 24.6 26.7 28.2 29.1 29.7 30.1 30.1Very elderly population (80 and over)as % of total 4.8 5.7 6.3 6.7 7.4 8.3 9.3 10.7 11.9 12.5 12.8Elderly population (55 and over)as % of working age pop.15-64 44.7 49.3 53.7 58.5 63.0 67.1 70.5 72.8 74.2 74.7 74.8
macroeconomic assumptions* 2007 2015 2020 2025 2030 2035 2040 2045 2050 2055 2060Potential GDP (growth rate) 2.2 2.2 2.0 1.6 1.5 1.4 1.3 1.3 1.4 1.4 1.5Employment (growth rate) 1.2 0.5 0.2 -0.2 -0.2 -0.4 -0.4 -0.4 -0.4 -0.3 -0.2Labour input : hours worked (growth rate) 0.9 0.5 0.2 -0.2 -0.2 -0.4 -0.4 -0.4 -0.4 -0.3 -0.2Labour productivity per hour (growth rate) 1.3 1.7 1.9 1.9 1.8 1.7 1.7 1.7 1.7 1.7 1.7TFP (growth rate) 0.7 1.1 1.2 1.2 1.1 1.1 1.1 1.1 1.1 1.1 1.1Capital deepening (contribution to labourproductivity growth) 0.6 0.6 0.7 0.7 0.6 0.6 0.6 0.6 0.6 0.6 0.6GDP per capita (growth rate) 1.6 1.8 1.8 1.5 1.4 1.3 1.3 1.4 1.5 1.6 1.7GDP in 2007 prices (in millions euros) 8911.2 10554.4 11710.1 12784.4 13803.7 14796.1 15783.1 16832.3 17980.2 19248.5 20673.1
Labour force assumptions 2007 2015 2020 2025 2030 2035 2040 2045 2050 2055 2060Population growth (working age:15-64) 0.4 0.0 -0.1 -0.3 -0.5 -0.5 -0.4 -0.4 -0.3 -0.3 -0.2Population growth (working age:15-71) 0.4 0.3 0.0 0.0 -0.2 -0.4 -0.5 -0.4 -0.3 -0.3 -0.3Labour force (thousands) 152129 159834 161011 159916 157896 155191 152006 148930 146160 143753 141853Participation rate (15-64) 70.8 73.3 73.8 73.9 74.3 74.7 74.9 74.9 74.7 74.6 74.5Participation rate (15-71) 64.8 66.8 66.9 66.6 66.3 66.5 66.9 67.1 67.0 67.0 67.0
young (15-24) 45.3 46.2 45.0 44.8 45.0 45.6 45.7 45.6 45.2 44.9 44.9prime-age (25-54) 84.5 86.2 87.1 87.2 87.1 87.1 87.0 87.2 87.0 87.1 87.1older (55-64) 45.4 54.1 57.6 60.3 62.9 63.6 64.1 63.7 63.7 63.3 63.1oldest (65-71) 6.7 9.2 11.4 12.7 13.9 15.4 15.6 15.7 15.9 16.1 15.9
Employment rate (15-64) 65.5 68.6 69.5 69.6 70.0 70.3 70.5 70.5 70.4 70.3 70.1Employment rate (15-71) 59.9 62.5 63.1 62.8 62.5 62.7 63.1 63.3 63.2 63.2 63.2Unemployment rate (15-64) 7.5 6.5 5.9 5.9 5.9 5.8 5.8 5.8 5.8 5.8 5.8Employment (15-64) (in millions) 139.4 147.3 148.8 147.2 144.5 141.4 138.6 135.9 133.3 131.1 129.5
share of young (15-24) 10% 10% 9% 9% 10% 10% 10% 10% 10% 10% 10%share of prime-age (25-54) 78% 76% 74% 72% 71% 71% 71% 71% 72% 72% 72%share of older (55-64) 11% 15% 17% 19% 19% 19% 19% 19% 18% 18% 18%
DepenDency ratios 2008 2015 2020 2025 2030 2035 2040 2045 2050 2055 2060Share of older population (55-64) (1) 17.6 19.4 21.3 22.8 22.8 22.1 21.9 21.8 21.4 21.0 20.9Old-age dependency ratio (2) 27 30 32 36 40 45 49 51 53 54 54Total dependency ratio (3) 50 53 56 59 63 68 72 75 77 79 79Total economic dependency ratio (4) 126 122 122 126 131 137 142 146 149 151 151Economic old-agedependency ratio (15-64) (5) 40 42 45 49 54 60 65 69 71 73 73Economic old-agedependency ratio (15-71) (6) 39 41 44 48 53 58 63 67 69 70 71
LEGENDA
* the potential GDP and its components is used to estimate the rate of potential output growth, net off normal cyclical variations(1) share of older population = Population aged 55 to 64 as % of population aged 15-64
(2) Old-age dependency ratio = Population aged 65 and over as a percentage of the population aged 15-64(3) total dependency ratio = Population under 15 and over 64 as a percentage of the population aged 15-64
(4) total economic dependency ratio = total population less employed as % of employed population 15-64(5) Economic old-age dependency ratio (15-64) = Inactive population aged 65+ as % of employed population 15-64(6) Economic old-age dependency ratio (15-71) = Inactive population aged 65+ as % of employed population 15-71
source : Eurostat (EUROPOP2008), Commission services (DG ECFIN), EPC (AwG)

211
stAtIstICAl ANNEX — Main demographic and macroeconomic assumptions by country (2007-2060)
REFERENCEs
Australian Productivity Commission (2005),‘Economic Implications of an Ageing Australia’,Research Report, Canberra, Australia.
Baldacci E. and D. Tuzi, (2003), ‘Demographictrends and pension system in Italy: an assessmentof 1990s reforms’, in Labour, No. 17, vol.17,special issue.
Barro, R.J. and X. Sala-i-Martin (1995),‘Economic Growth’.McGraw-Hill, USA.
Booth H., Maindonald J. and Smith L. (2002),‘Applying Lee-Carter under conditions ofvariable mortality decline’, Population Studies,56:325-336.
Brugiavini A. and F. Peracchi (2005), ‘Fiscalimplications of pension reforms in Italy’, inGruber J; and D; A. Wise (editors)(2005), ‘SocialSecurity Programs and Retirement around theWorld: Fiscal Implications’, NBER Website. 26July 2005.
Brugiavini A. and F. Peracchi (2003), ‘Wealthand Retirement decisions’, Labour, Volume 17,Special Issue, Blackwell Publishing.
Burniaux J., M., R. Duval and F. Jaumotte(2003), ‘Coping with ageing: a dynamicapproach to quantify the impact of alternativepolicy options on future labour supply in OECDcountries’, OECD Economic Department WP. N.371.
Börsch-Supan A. (2003), ‘Labor market effectsof population aging’, Labour, Volume 17, SpecialIssue, Blackwell Publishing.
Carone G. (2005): ‘Long-term labour forceprojections for the EU25 Member States: a set ofdata for assessing the impact of ageing’, DGECFIN, European Economy, Economic PapersNo. 235.
Carone G., D. Costello, N. Diez Guardia, G.Mourre, B. Przywara, A. Salomaki (2005), ‘Theeconomic impact of ageing populations in theEU25 Member States’, DG ECFIN, EuropeanEconomy, Economic Papers No. 236.
Carone G., Denis C., McMorrow K., Mourre G.and W. Röger (2006), ‘Long-term labourproductivity and GDP projections for the EU25Member States: a production functionframework’, DG ECFIN, European Economy,Economic Papers, No. 253.
Denis C., D. Grenouilleau, K. Mc Morrow andW. Röger (2006): ‘Calculating potential growthrates and output gaps – A revised productionfunction approach’, DG ECFIN, EuropeanEconomy, Economic Papers No. 247.
Downes, J., A. Drew and P. Ollivaud (2003),‘The OECD medium-term reference scenario:economic outlook’ , OECD EconomicsDepartment Working Papers, No. 372, Paris.
Duval R. (2003), ‘The retirement effects of old-age pension and early retirement schemes inOECD countries’, OECD Economic DepartmentWP. N. 370.
Economic Policy Committee (2001), ‘Budgetarychallenges posed by ageing populations’, EPC/ECFIN/655/01-EN of 24 October 2001.
Economic Policy Committee (2003a), ‘Theimpact of ageing populations on public finances:overview of analysis carried out at EU level andproposals for a future work programme’, EPC/ECFIN/407/04-rev.3-EN of 22 October 2003.
Economic Policy Committee (2003b), ‘Budgetarychallenges posed by ageing population: theimpact on public spending on education’, EPC/ECFIN/435 or 22 October 2003.
Economic Policy Committee (2008), ‘The 2009budgetary projection exercise of the AgeingWorking Group: Second progress report to theEPC’, ECFIN/CEFCPE(2008)REP/ 52951 rev,Brussels, 23/06/2008.
Economic Policy Committee and EuropeanCommission (2005), ‘The 2005 EPC projectionsof age-related expenditure (2004-2050) for theEU25 Member States: underlying assumptionsand projection methodologies’ in EuropeanEconomy Reports and Studies, No. 4.
212
European Economy 7/2008the 2009 Ageing Report: Underlying assumptions and projection methodologies for the EU-27 Member states
Economic Policy Committee and EuropeanCommission (2006), ‘The impact of ageing onpublic expenditure: projections for the EU25Member States on pensions, health care, long-term care, education and unemployment transfers(2004-2050)’, European Economy, Specialreport, No. 1/2006.
Economic Policy Committee and EuropeanCommission (2007) ‘Pensions Schemes andProjection Models in EU-25 Member States’,European Economy, Occasional papers No. 35,November 2007.
European Commission (2006), ‘The long-termsustainability of public finances in the EuropeanUnion’, European Economy, No. 4/2006.
European Commission (2008a), ‘Economicforecast – Spring 2008’, European Economy,No.1/2008.
European Commission (2008b), ‘Public financesin EMU in 2008’, European Economy, No.4/2008.
Eurostat (2004), ‘Classification of fundedpension schemes in case of governmentresponsibility or guarantee’, News release30/2004, 2 March.
Eurostat (2005a) ‘EU25 population rises until2025, then falls’, Eurostat press release 448/2005of 8 April 2005.
Eurostat (2005b), ‘AWG ad hoc scenario’,presentation to the AWG meeting of 16 June2006.
Eurostat (2008a), ‘Ageing characterises thedemographic perspectives of the Europeansocieties’, Statistics in Focus, No. 72/2008.
Eurostat (2008b), ‘Population projections 2008-2060. From 2015, deaths projected to outnumberbirths in the EU27’, News release No. 119/2008,26/8/2008. EUROPOP2008 convergencescenario is available at: http://epp.eurostat.e c . e u r o p a . e u / p o r t a l / p a g e ? _pageid=1996,45323734&_dad=portal&_schema=PORTAL&screen=welcomeref&open=/data/popul/populat/proj/proj_08c&language=en&product=EU_MAIN_TREE&root=EU_MAIN_TREE&scrollto=263
Eurostat (2009), “Methodology and main resultsof the Eurostat Population Projections 2008-based (EUROPOP2008)” , Euros ta t ,Methodologies and Working Papers series,Luxembourg, forthcoming.
Gruber J. and D.A. Wise (2002), ‘Social SecurityPrograms and Retirement Around the World:Micro Estimation’, NBER Working Paper No.W9407.
Gruber J. and D.A. Wise (2005a), ‘Socialsecurity programs and retirement around theworld: fiscal implications-Introduction andsummary’, NBER Working Paper No. 11290.
Gruber J and D.A. Wise (editors) (2005b),‘Social Security Programs and Retirementaround the World: Fiscal Implications’, NBERWebsite. 26 July 2005. http://www.nber.com/books/intlSS-p3/index.html.
Hatton, T. J. and J. G.Williamson (2003), “Whatfundamentals drive world migration?”Discussion Paper No. 2003/23, United NationsUniversity/World Institute for DevelopmentEconomics Research, March.
Latulippe D. (1996) “Effective retirement ageand duration of retirement in the industrialcountries between 1950 and 1990”, ILO, Issuesin Social Protection DP No. 2.
Montanino A., B. Przywara and D. Young (2004),“Investment in Education: the Implications forEconomic Growth and Public Finances”,European Economy, Economic Papers, No.217.
OECD (2003), ‘Labour force participation ofgroups at the margin of the labour market: pastand future trends and policy challenges’,Working Party N° 1 on Macroeconomic andStructural Policy Analysis, ECO/CPE/WP1(2003)8.
OECD (2006), Costs of Care for ElderlyPopulations.Guidelines for estimating long-termcare expenditure, DELSA/HEA/DIS(2006)4, 14February 2006.
OECD (2007), Data collection on long-term care(focussing on recipients), Meeting of OECDHealth Data National Correspondents, DELSA/HEA/HD(2007)7, 28 September 2007.

213
stAtIstICAl ANNEX — Main demographic and macroeconomic assumptions by country (2007-2060)
Raitano M. (2006), “The Impact of Death-Related Costs on Health-Care Expenditure: ASurvey”, ENEPRI Research Report No. 17.
Rogers A. and Castro L.J. (1981), “ModelMigration Schedules”, IIASA Research ReportRR-81-03, Laxenburg (AT).
Scherer P. (2002), ‘Age of withdrawal from thelabour force in the OECD countries’, LabourMarket and Social policy Occasional Papers,No.49-DELSA.
Schmertmann C. (2003), “A system of modelfertility schedules with graphically intuitiveparameters”, Demographic Research, 9:81-110.
Schmertmann C. (2005): “Quadratic spline fitsby nonlinear least squares”, DemographicResearch, 12:105-106.
Siegel J.S. and Swanson D.A. eds. (2004), “TheMethods and Materials of Demography”, 2nded. Elsevier Academic Press, San Diego(USA).
Solow, R. M. (1956), “A Contribution to theTheory of Economic Growth”, Quarterly Journalof Economics, No.70, pp. 65-94.
United Nations (2004), “World PopulationProspects – The 2002 Revision”, volume III:Analytical Report.
United Nations (2008), “World PopulationProspects: The 2006 Revision”, PopulationDivision of the Department of Economic andSocial Affairs of the United Nations Secretariat.


How to obtain EU publicationsPublications for sale:
● via EU Bookshop (http://bookshop.europa.eu);● from your bookseller by quoting the title, the publisher and/or ISBN number;● by contacting one of our sales agents directly.
You can obtain their contact details by linking http://bookshop.europa.eu,or by sending a fax to (352) 29 29-42758
Free publications:
● via EU Bookshop (http://bookshop.europa.eu);● at the European Commission’s representations or delegations.
You can obtain their contact details by linking http://ec.europa.eu/
or by sending a fax to (352) 29 29-42758

KC-A
R-08-007-EN-C
Price (excluding VAT) in Luxembourg: EUR 50European Economy (6 issues minimum per year): EUR 160The annual subscription runs from 1 January to 31 December of each year.Payments to be made only to sales agents on the list (see inside backcover for details).These are surface mail rates. For air subscription rates, please apply to the sales offices.www.ec.europa.eu/economy_finance
This report provides a description of underlying macroeconomic assumptions and projectionmethodologies of the age-related expenditure projections for all Member States over theperiod 2009-2060. On the basis of these underlying assumptions and methodologies, age-relatedexpenditures covering pensions, health care, long-term care, education and unemployment transfersare envisaged to be presented to the ECOFIN Council in May 2009.
The long-term projections provide an indication of the timing and scale of changes in economicdevelopments that could result from an ageing population in a ‘no-policy change’ scenario.The projections show where (in which countries), when, and to what extent ageing pressureswill accelerate as the baby-boom generation retires and average life span in the EU continues toincrease. Hence, the projections are helpful in highlighting the immediate and future policychallenges for governments posed by demographic trends. It should be recalled that the long-termprojections are not forecasts, they are subject to increasing uncertainty over time, and the resultsare strongly influenced by the underlying assumptions. Moreover, given the current juncturecharacterized by the financial and economic crisis, there is also considerable additional uncertaintyconcerning the medium-term economic developments.
This report responds to the mandate the ECOFIN Council gave to the Economic Policy Committee(EPC) to update and further deepen its common exercise of age-related expenditure projections bythe autumn of 2009 on the basis of a new population projection to be provided by Eurostat (theEUROPOP2008 demographic projection was released in April 2008)