seawater ageing of flax/poly(lactic acid)...
TRANSCRIPT
Ple
ase
note
that
this
is a
n au
thor
-pro
duce
d P
DF
of a
n ar
ticle
acc
ept
ed fo
r pu
blic
atio
n fo
llow
ing
peer
rev
iew
. The
def
initi
ve p
ub
lish
er-a
uthe
ntic
ated
ve
rsio
n is
ava
ilab
le o
n th
e pu
blis
her
Web
site
1
Polymer Degradation and Stability July 2009, Volume 94, Issue 7, Pages 1151-1162 http://dx.doi.org/10.1016/j.polymdegradstab.2009.03.025 © 2009 Elsevier Ltd All rights reserved.
Archimer Archive Institutionnelle de l’Ifremer
http://www.ifremer.fr/docelec/
Seawater ageing of flax/poly(lactic acid) biocomposites
A. Le Duigoua, P. Daviesb, *, and C. Baleya a LIMATB Laboratoire d'Ingénierie des matériaux de Bretagne, Equipe Polymères et Composites, Rue de Saint Maudé BP 92116, 56321 Lorient Cedex, France b IFREMER Materials and Structures group, Brest Centre, BP70, 29280 Plouzané, France *: Corresponding author : Peter Davies, Tel.: +33 2 98 22 4777; fax: +33 2 98 22 4535, email address : [email protected]
Abstract: Natural fibre reinforced biopolymer composites, or biocomposites, are an alternative to the glass fibre reinforced thermoset composites widely used today in marine applications. Biocomposites offer good mechanical properties and total biodegradability, but if they are to be adopted for marine structures their durability in a seawater environment must be demonstrated. In the present study unreinforced PLLA (Poly(l-Lactic acid)), injected and film stacked flax composites with the same PLLA matrix have been examined. All the samples were aged in natural seawater at different temperatures in order to accelerate hygrothermal ageing. Changes to physico-chemical and mechanical behaviour have been followed by weight measurements, thermal and gel permeation chromatography (GPC) analyses, and tensile testing, completed by acoustic emission recording and scanning electron microscopy (SEM) examination. The matrix tensile stiffness is hardly affected by seawater at temperatures to 40 °C but the composite loses stiffness and strength. Fibre/matrix interface weakening is the main damage mechanism induced by wet ageing, but both matrix and fibre cracks also appear at longer periods. Keywords: Composites; Natural fibre; Biopolymer; Hygrothermal ageing; Mechanical properties

1. Introduction
Composites based on thermosetting resins such as polyester are widely used in boat construction. These are low cost materials and their lifetimes are 30 years or more, so until recently there has been little concern about material selection nor what to do with them at the end of their useful life. However, as petroleum-based polymers become rarer and environmental awareness increases, it is important to optimise both these aspects. The possibility to recycle is encouraging research on thermoplastic matrix polymers, while end of life composting is preferred to alternatives such as incineration for environmental reasons. The combination of biopolymers made out of derivatives from cellulose, starch or polylactic acid and natural fibres such as flax, jute, hemp, sisal or ramie provides materials known as biocomposites, which are both biodegradable and recyclable [1, 2]. Their properties are comparable to those of traditional glass/polyester composites [3] so they could provide an environmentally friendly alternative. Very little work has been performed to study the behaviour of biocomposites in a marine environment. There have been some examples of aging in distilled water, for example [4] showed that a PLA/Bamboo (30 wt.%) biocomposite absorbed water over the first 20 hours of immersion before stabilizing at a weight gain of 7% compared to 1% for the unreinforced PLA. The highly hydrophilic nature of natural fibres results from their hydroxyl groups, and this will clearly be a concern for the use of such materials in marine applications. Fickian models have been widely used to model water uptake in both resins and their fibre reinforced composites at room temperature [5]. At higher temperatures these models may still be useful but the development of damage due to physical mechanisms such as swelling or chemical processes such as hydrolysis (molecular chain breakage) can result in more complex weight changes [5-7]. The manufacturing route may be important, for example Sreekumar et al [8] showed that for sisal/polyester the weight gain for composites produced by RTM (Resin Transfer Molding), was lower than for those produced by compression moulding. RTM resulted in less porosity and lower internal stresses. The nature of the polymer and the aging conditions play a role in the aging behaviour of biocomposites. Hydrolysis can be catalysed by carboxyl groups produced by raising the temperature or changing the water composition [9, 10]. However, even though PLA may be easy to hydrolyse the products of the reaction are not toxic [11]. Hydrolysis changes the molecular weight but this may also result in other structural changes such as recrystallization [12, 13]. Concerning mechanical properties, both the matrix polymers and their biocomposites are affected by hygrothermal aging. For example, for the rice starch(20%)/PLA biocomposites studied in [14] aged in water for 30 days at 30°C the tensile modulus dropped from 3.8 to 2.1 GPa, the stress at break from 44 to 30 MPa and strain at failure from 2.5 to 2.2%. The changes in PLA properties contribute to these changes, under the same conditions PLA modulus dropped from 3.3 to 2.9 GPa, failure stress from 58 to 54 MPa and failure strain from 3.8 to 3.2 %. Drying enabled stiffness to be recovered but not strength, indicating that both reversible (physical) and irreversible (chemical) changes are involved in the wet aging of PLA and its composites. When natural fibres are used to reinforce polymers the losses in properties are often quite large [15], as these fibres are generally sensitive to water. Several authors have indicated this sensitivity, which is much greater than that of glass fibres exposed to similar wet environments [16-18]. According to their composition the latter may undergo stress corrosion cracking but this requires a particular combination of load and environment [19]. The fibre-matrix interface can also be affected by wet ageing [14]. Indeed in composites the fibre-matrix interface is a critical area and moisture ingress in this region will cause differential swelling due to the difference in absorption of the fibres and matrix [20]. Fibre swelling can also cause damage at the interface and then in the neighbouring matrix [21]. Cracks can result in debonding and lead to the development of delaminations [22]. Many different methods have been used to characterize damage development in traditional composite materials, and acoustic emission has been applied for many years [23, 24]. This technique has been applied to study flax fibres and their biocomposites with a thermoplastic starch-based matrix polymer [25-26]. This method has been
2

used to examine how water affects damage mechanisms (for example [27]) but it has not previously been applied to study damage in biocomposites after wet ageing. The aim of the present study is to understand the mechanisms which govern the long term durability of flax/PLLA composites in the marine environment. Several techniques have been used to examine how the composite behaviour changes with aging : Weighing to quantify changes due to water ingress, GPC (Gel Permeation Chromatography) and DSC (Dynamic Scanning Calorimetry) to measure molecular weight and characteristic transitions, and tensile tests to determine mechanical properties. Tests both in the wet state and after drying have allowed the reversibility of changes to be established. Acoustic emission has been used in some tests to characterize damage onset, and scanning electron microscopy (SEM) was employed to visualize this damage. 2. Materials and methods
The biopolymer studied is a PLLA Poly(L-Lactic acid), the L9000 grade from Biomer®. Flax fibres, of the Hermès type, grown in Normandy were dew-retted before being stripped and combed. Two techniques were used to manufacture composite specimens, injection moulding and film stacking.
2.1. Injection moulding
Fibres 4mm long were mixed with PLLA at a weight fraction of 30%. The PLLA was dried at 60°C for 48h under vacuum. Compounding was performed in a single screw extruder at 20 rpm with the following temperature profile : 175/180/185/185°C from the hopper to the die. Granules were then prepared from the extrudate mechanically. These were injected using a Billion PROXIMA press. The hopper temperature was 85°C and the profile was the following: 165/170/175/180/180°C. The injection pressure was 190 bars. The mould was kept at 30°C.
2.2. Film stacking
The first step of the film stacking process was to produce films of PLLA, in a hot press with a pressure of 40 bars applied for 7 minutes. The fibre mats were prepared by a paper-making technique in which the fibres are dispersed in a water based solution. Then a stack of polymer films and flax fibre mats of 100 g/m² with fibres of 9 ± 1 mm lengths was prepared as shown in figure 1. The fibre fraction is approximately 30% by weight. Specimens were then machined from the panels.
2.3. Experimental methods
2.3.1. Water uptake
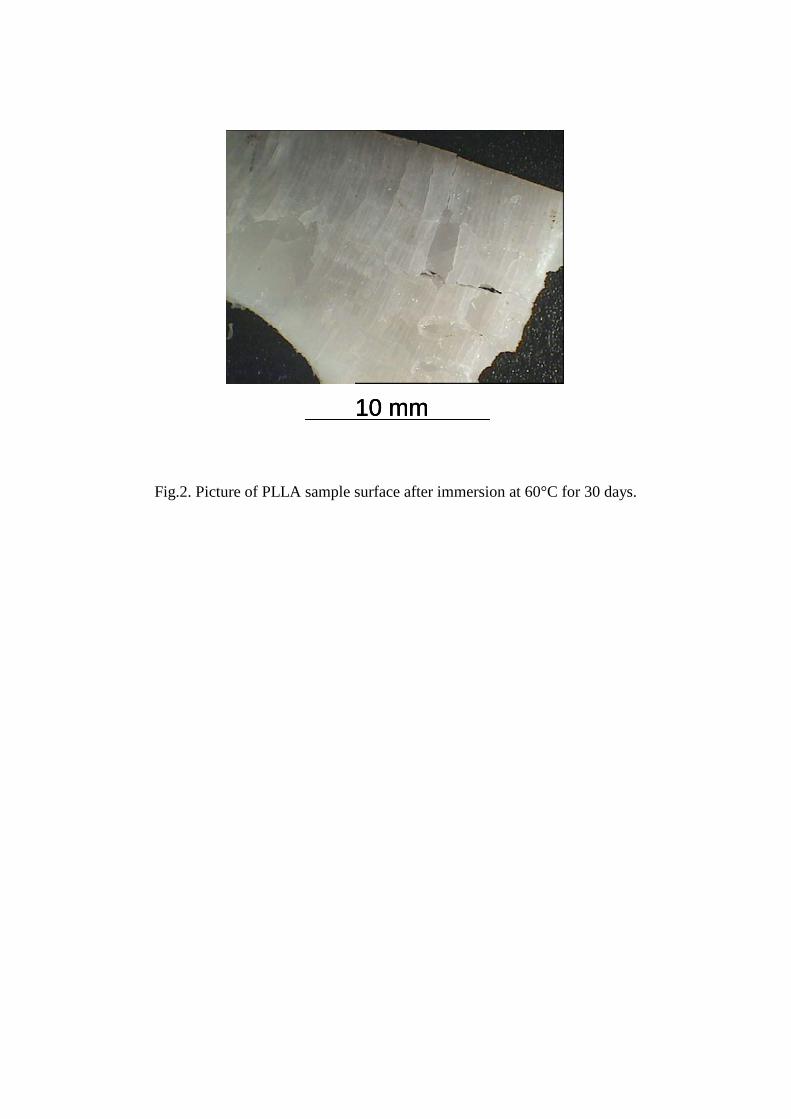
Ageing tests were performed in 60 litre capacity temperature controlled water baths. These were filled with natural sea water, pumped from the Brest Estuary and continuously renewed. Different bath temperatures (4, 20, 40, 60 and 80°C) were available. 4°C is the temperature used to characterize materials used in underwater structures, temperatures above 20°C are used to accelerate the ageing mechanisms. However, results from a preliminary series of tests at 60°C, close to the Tg of the PLLA, indicated that degradation at this temperature is very rapid as it corresponds to the temperature used in composting (58°C) [28, 29]. The material whitens in the first 20 hours as cracks appear very quickly, and within 30 days the tensile specimens are decomposed into many pieces. (Fig 2-3). Figure 4 shows the weight gain results from these preliminary tests on injected PLLA and flax/PLLA biocomposite samples and indicates initial gains then weight losses for both. The temperatures of 20 and 40°C were therefore used in this study.
3

Tensile samples were immersed, removed periodically, the surfaces dried, weighed and replaced in the water baths. Eight samples were removed for testing after different periods. A total of 48 injected samples of PLLA, 48 injected biocomposite samples and 48 film stacked samples were aged. Weight gains were determined as a percentage of initial weight using the expression (1) :
100*(%)0
0
W
WWW t (1)
The Fickian diffusion coefficient D is determined from equation (2) in the range where the values of W(%) are less than 60% of the equilibrium value ∆W(∞) :
2
)(4
W
dD
(2 where θ is the slope of the linear part of the plot of weight gain versus square root of immersion time divided by sample thickness. However, a correction factor is needed to account for the finite width w and length h of the sample compared to its thickness, equation (3) : 2
1
w
d
h
dDDc (3
where Dc is the corrected diffusion coefficient. The use of a Fickian diffusion model to describe diffusion in a heterophasic medium such as a biocomposite with very substantial differences in D for the two phases is questionable, and the water profiles within the composite are clearly very complex. This approach is used here, as it has been in previous studies on cellulose fibre reinforced polymers [8,16], simply to provide a global indicator of the rate of sample weight gain. Diffusion coefficients will be described as “apparent” to underline this. For each aging temperature and duration 3 samples were dried for 24 hours under vacuum at room temperature (to avoid recrystallization). This provides an indication of the reversibility of changes noted after aging.
2.3.2. Thermal Analysis (DSC)
Thermograms were obtained using a Perkin Elmer Pyris 1 DSC. Calibration was performed with indium and tin in the temperature range (+15 to +350°C). Samples of approximately 10 mg for each condition were analysed in aluminium pans. All samples were first heated to 190°C for 3 minutes to remove thermal history, in order to examine the irreversible degradation resulting from multiple injections. All the peak temperatures measured (Tc, Tm) have an accuracy of ± 0.5°C. Non-isothermal crystallization and melting temperatures, Tc and Tm, respectively, were determined from the crystallization peak extrema in experiments at heating/cooling rates of ± 20°C/min. Subsequent melting temperatures were obtained from the melting peaks maxima measured at a heating rate of 20°C/min. Melting enthalpies were determined using constant integration limits. The degree of crystallinity (χc) was estimated using eq. (4) :
%100H
Hmc
(4)
with ΔH100% crystalline = 93.7 J/g presented by [30]. Melting enthalpy was corrected for fibre content.
4

2.3.3. Molecular weight measurement
In order to measure molecular weights, a Shimatzu LC 10AD system was used in combination with a Shimadzu D10A differential refractometer and a Shimatzu SP 10Avp UV dual wave length detector (λ1= 254 nm and λ2= 280 nm). The column set consisted of five 30 cm gel columns with a granulometry of 10µm (from Polymer Laboratories). The solvent was analytical grade THF (dried on calcium hydride) at a flow rate of 1mL/min. The SEC analyses were performed at room temperature. The average number of random chain scissions per unit mass, nt, is given by equation (5) [31].
0
11
nnt MM
n (5)
2.3.4. Mechanical analysis
The tensile specimen is a dog-bone geometry of 200 mm length and central dimensions of 10 by 4 mm² for injected samples and 100 length with central dimensions of 7 by 2 mm² for film stacking (according to ISO 527). Quasi-static tensile tests were performed at a temperature of 23°C and 48% relative humidity. Samples were loaded at 1mm/min. An extensometer with 50mm gauge length was used to measure strain.
2.3.5. Scanning election microscopy (SEM)
Fracture surfaces of samples aged for different periods were examined in a Jeol JSM 6460LV Scanning Electron Microscope. The samples were sputter-coated with a thin layer of gold in an Edwards Sputter Coater.
2.3.6. Acoustic emission
During mechanical testing progressive mechanical damage results in liberation of energy in the form of elastic waves. Acoustic emission (AE) recording equipment is widely employed to detect these waves using piezo-electric transducers fixed to the sample and amplifying equipment [24]. This technique was employed during tensile tests here, with Mistras 2001 equipment from Physical Acoustic Corporation, with a 40 dB pre-amplifier. After preliminary tests the detection threshold was fixed at 33dB. Two transducers (microphones) were fixed to each specimen, a silicone grease coupling agent was used to improve contact with the specimen. Before each test a calibration procedure is applied, by breaking a pencil lead in order to check the acoustic emission parameters [32]. All data are recorded but only the data for hits localized between the two transducers are used here. 3. Results and discussion
3.1. Mechanical properties
The PLLA polymer has a Young’s modulus of 3655 ± 87 MPa and a failure stress of 60.5 ± 0.9 MPa. A standard orthophthalic polyester of the type currently used in boat construction has a tensile modulus around 3100 MPa and strength around 50 MPa [33]. Table 1 shows a comparison
5

of the PLLA/flax biocomposite properties wiith those of glass/polyester with the same amount of mat reinforcement. It is interesting to compare specific properties, i.e. properties normalized by the material density, and the low density of biocomposites due to low fibre density compared to glass (1.53 compared to 2.54 [34]) is then a significant advantage. To determine the values in Table 1 a biocomposite density of 1.33 and a glass/polyester density of 1.57 were used.
Material (30%wt) Process route Young’s modulus (MPa)
Tensile strength (MPa)
Specific modulus
Specific strength
PLLA/flax Injection moulding
7982 ± 314 46.4 ± 4 6285 ±
247 36.5 ± 2
PLLA/flax Film stacking 9527 ± 122 89 ± 2 7263 ± 92 67 ± 2
Polyester/glass Compression 12174 ± 100 149 ± 7 7762 ±
638 95 ± 4
Table 1 Mean tensile properties for composites reinforced with 30% fibres by mass
The results in Table 1 show how the fabrication route affects the properties of these biocomposites. The injection process (preceded by extrusion) leads to a global degradation of the material (matrix and fibres), due to a reduction in fibre length and a drop in molecular weight of the polymer. More details have been presented elsewhere [2]. In the plant the reinforcement is organized in bundles of fibres. Even if some bundles are divided during injection (arrow on Figure 5), this organisation remains in the composite. As the fracture surface shows (Figure 5), there is a very limited dispersion of the fibres in the matrix. When film stacking is used however, there is only one transformation process which is much less aggressive. The fibres are then less degraded, and fibre aspect ratio remains high. The paper-making route also yields a more homogeneous reinforcement distribution, as shown in Figure 6. These biocomposites possess interesting properties compared to glass/polyester, particularly those produced by film stacking. Indeed mean longitudinal properties of flax fibres are given by [35] : EL = 65.8 ± 38 GPa , σL = 1455 ± 835 MPa, εL = 2.3 ± 0.6 %. Glass fibre properties are given by [36] : EL = 72 GPa, σL = 2200 MPa, εL = 3%. If we take flax fibre density equal to 1.56 and 2.54 [34]. The specific properties of flax are thus superior to those of glass. However, the interfaces in glass reinforced composites have been optimized by many years of development of surface treatments and sizings, whereas very little work has been performed on biocomposite interfaces to date. It should also be noted that the fibre length in the glass mats is 50 to 70mm, much longer than that in the flax mats studied here.
3.2. Water uptake
Figures 7 and 8 show the weight gain of unreinforced PLLA and biocomposites reinforced with 30% by weight of flax fibres, both injected and film stacked. Saturation weight gains and apparent diffusion coefficients are shown in Table 2. The water absorption of PLLA appears to be Fickian, with a linear initial part and an equilibrium plateau. The weight gains in sea water at 20 et 40°C are quite low. At 20°C the value stabilizes around 0.32%, at 40°C it is around 0.65% after 900 hours as shown in Figure 7. These PLLA diffusion coefficients are similar to published values for 30 day immersion at 30°C [14].
6

The temperature has a strong influence on water uptake, when temperature is increased the weight gain plateau level increases as well as corrected diffusion coefficient. The increase in saturation weight gain at 40°C compared to 20°C may indicate damage. However, PLLA absorbs little water at both temperatures, and considerably less than a standard orthophthalic polyester with 42% styrene by weight aged under the same conditions (∆W(∞) = 1.1 %) [33]. The weight gains for the flax/PLLA biocomposites are very different, as shown in Figure 8. First, the weight gain curves show the influence of the cellulose fibres, which are highly hydrophilic [37]. The saturated weight gain of the film stacked specimens is around 5.6%, adding flax fibres has resulted in a 17-fold increase in weight gain at 20°C (Table 2) compared to unreinforced PLLA. The apparent diffusion coefficient is also significantly higher. This is in agreement with results for other biocomposites [4, 6, 14, 22, 38]. The strong influence of temperature on saturation weight gain has also been noted previously [16,22], the non-Fickian behaviour at temperatures above room temperature has been attributed to the development of surface microcracks, resulting in capillary diffusion. There is not a strong influence of the manufacturing route on water diffusion kinetics, though the injected samples do not show a clear saturation plateau, so a diffusion coefficient has not been estimated for these. The film stacked samples, with similar overall fibre content to the injected samples, pick up weight and stabilize more quickly than the injected samples, but this may simply reflect the fact that their edges were machined, so there are exposed fibres along the sides of the specimen. Water ingress is then possible by capillarity. The injected samples are completely covered by a thin layer of PLLA which acts as a barrier to water and protects the fibres.
∆W(∞) (%) D*10-9 (cm²/s) Dc *10-9 (cm²/s) Material
20°C 40°C 20°C 40°C 20°C 40°C
PLLA 0.32 0.65 2.05 23.6 1.02 11.7
Film stacked biocomposite 5.62 8.92 13.4 30.4 7.95 18.10
Table 2 Equilibrium water uptake, apparent diffusion coefficients and corrected coefficients
3.3. Molecular weight analysis
Measurement of molecular weight enables permanent changes due to chemical aging to be detected. Table 3 shows how molar mass of unreinforced injected PLLA samples and the matrix of injected and film stacked PLLA/flax biocomposites evolve with aging time. According to the material supplier the molecular weight (MW) of the granules is 220 000 g/mol.
7

Material T (°C) Molecular weight Mw
(g/mol) at t=0
Molecular weight Mw (g/mol) after 3
months Evolution (%)
20°C 170000 - 14 PLLA
40°C 195000
102000 -48
20°C 58000 -44 Injected biocomposite 40°C
101000 53000 -48
20°C 87000 -56 Film stacked biocomposite 40°C
196000 82000 -58
Table 3. Evolution of molecular weight of injected PLLA and biocomposites versus immersion time and temperature.
The first point to note is that the molecular weight of the injected composite matrix is significantly lower than that of the unreinforced PLLA specimens. This is the result of the additional compounding extrusion step required to manufacture the composites. The presence of fibres, which increase the viscosity, will also result in more shear during injection and cause molecular chain breakage. The molecular weights of film stacked samples are less affected by manufacturing, this technique enables higher molecular weights to be retained than for injection. During hydrothermal aging of PLLA the molecular weight reduction is greater when the temperature and water uptake increase. Although the loss in molecular weight of film stacked samples is greater than that of injected samples, due to higher water uptake, its Mw remains significantly higher after 3 months’ immersion. The molar mass reductions measured here are caused by an irreversible chemical degradation mechanism. Hydrolysis could result from two different mechanisms : Statistical chain breakage at the ester links in the PLLA, which occurs preferentially in the amorphous regions of this semi-crystalline polymer, and a depolymerisation process [13]. Hydrolytic degradation can be quantified using equation (5). Figure 9 shows the average number of random chain breaks per unit mass versus weight gain for PLLA. For the biocomposites however, it is not possible to plot similar curves; as shown in Table 2, the molecular weights of the injected samples are very similar after 3 months’ immersion at 20 and 40°C whereas their weight gains are very different (Figure 9). For the film stacked specimens the 3 characterization times (15, 30 and 90 days) are all in the saturation plateau so again it is not possible to plot this curve.
PLLA shows a particular behaviour in water, with a sudden increase in the number of chains broken. This is due to an auto-catalysis mechanism and has been noted previously for PLA [39] and recycled PET [12]. Figure 10 shows chain breaks versus immersion time for PLLA an the two biocomposites in water at 20°C. As for PLLA the increase in nt values for the film stacked composites tends to slow after one month. For the injected composite samples these values increase throughout the ageing period.
There are thus similarities between these chain scission plots and the weight gains presented in section 3.2. Knowledge of the microscopic changes during aging is essential, as these changes are responsible for the degradation of macroscopic properties as will be shown below.
3.4. Thermal properties
The use of DSC provides additional information on changes occurring during aging. The enthalpies measured during the second heating passage indicate permanent modifications, and can be linked with molecular weight evolution. Figure 11 shows that the glass transition temperature, Tg, of PLLA
8

is hardly affected by immersion but the melting enthalpy tends to increase, from 27.6 to 32.4 J/g and from 27.6 to 37.9 J/g at 20 and 40°C. This increase may be due to a recrystallization phenomenon but this may also indicate degradation due to aging. When chain scission occurs (drop in Mw) the chains become more mobile, and the structure of the crystalline phase may be modified. As shown in Figure 11 this phenomenon depends on the temperature but also the plasticizing effect of water [40]. It has been suggested that this may result in slower diffusion [13]. Figure 12 shows the same parameters for the two biocomposite series. The Tg’s of the injected samples are lower (by 3°C at 20°C) than those of the film stacked materials whereas their melting enthalpy is higher (+ 18 J/g à 20°C). This suggests higher degradation for injected samples. For the injected samples the influence of aging is very significant, as shown by the molecular weight results. Aging causes a drop in Tg which is greater at higher water temperature. The melting enthalpy shows an initial increase up to 30 days at 20°C or 15 days at 40°C. Then for longer immersion times there is a large drop. Similar behaviour has been noted elsewhere for glass/PET composites [13]. It has been proposed that the initial increase corresponds to the response of the amorphous phase of the polymer, less compact and more permeable, through hydrolysis of ester links. Then the drop in enthalpy is related to degradation of the crystalline phase, reduction in crystallite thickness and possibly extraction of oligomers [13]. The film stacked specimens show a different response. Little variation in Tg and a small increase in enthalpy are noted. As for the unreinforced PLLA a slight tendency to recrystallize is noted. Hydrolysis occurs but is less pronounced than for the injected specimens. The changes in PLLA structure depend not only on the water uptake but also on the manufacturing route and hence on the initial state of the materials.
3.5. Mechanical properties
3.5.1. Evolution of mechanical properties of PLLA during aging
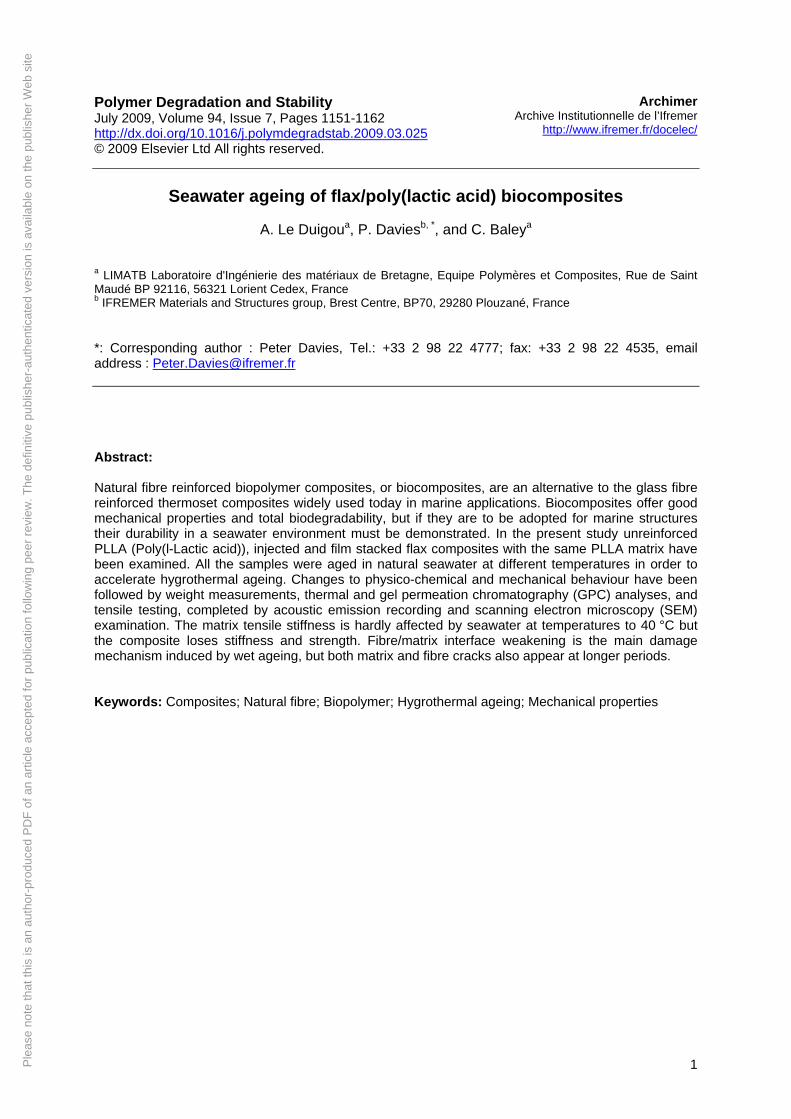
The results in Table 4 and figures 13 and 14 show both reversible and irreversible contributions to the mechanical properties after immersion. Results from mechanical tests on wet unreinforced PLLA are shown in Table 4. These indicate that the elastic modulus is not affected by aging but the tensile strength decreases significantly. The failure strain increases with aging at 20°C but decreases at 40°C. Reported results from tests on PLLA films indicated less degradation after 10 weeks in seawater at 25°C [41], but the initial Mw values were rather higher for those materials.
9
T Material Young’s
modulus (MPa) at t=0
Youngs modulus (MPa) at t =3 months
Evolution of properties (%)
20°C 3682 ± 113 + 1 40°C
3655 ± 87 3316 ± 216 - 9
Stress max
(MPa) at t= 0
Stress max (MPa) at t= 3
months
Evolution of properties (%)
20°C 46.6 ± 0.1 - 23 40°C
60.5 ± 0.9 41.9 ± 3.7 - 31
Strain at break
(%) at t= 0
Strain at break (%) at t= 3
months
Evolution of properties (%)
20°C 10.8 ± 1.2 + 335 40°C
PLLA
2.5 ± 0.4 1.3 ± 0.4 - 48
Table 4. Mechanical properties of PLLA before and after aging The low sensitivity of the modulus to aging may be due to reduction in molecular weight being compensated by structural reorganization (recrystallization). The failure stress of PLLA drops significantly as a function of temperature and ageing period. The failure strain increases at 20°C but drops at 40°C. The ageing mechanisms are complex, and plasticization by water (reversible) and chain breakage (irreversible) can occur simultaneously as water enters the material. The GPC results show that at 40°C molecular weight is significantly lower, so that at that temperature hydrolysis dominates. The reversible mechanisms will be discussed further below.
3.5.2. Evolution of mechanical properties of wet PLLA/flax biocomposites during aging
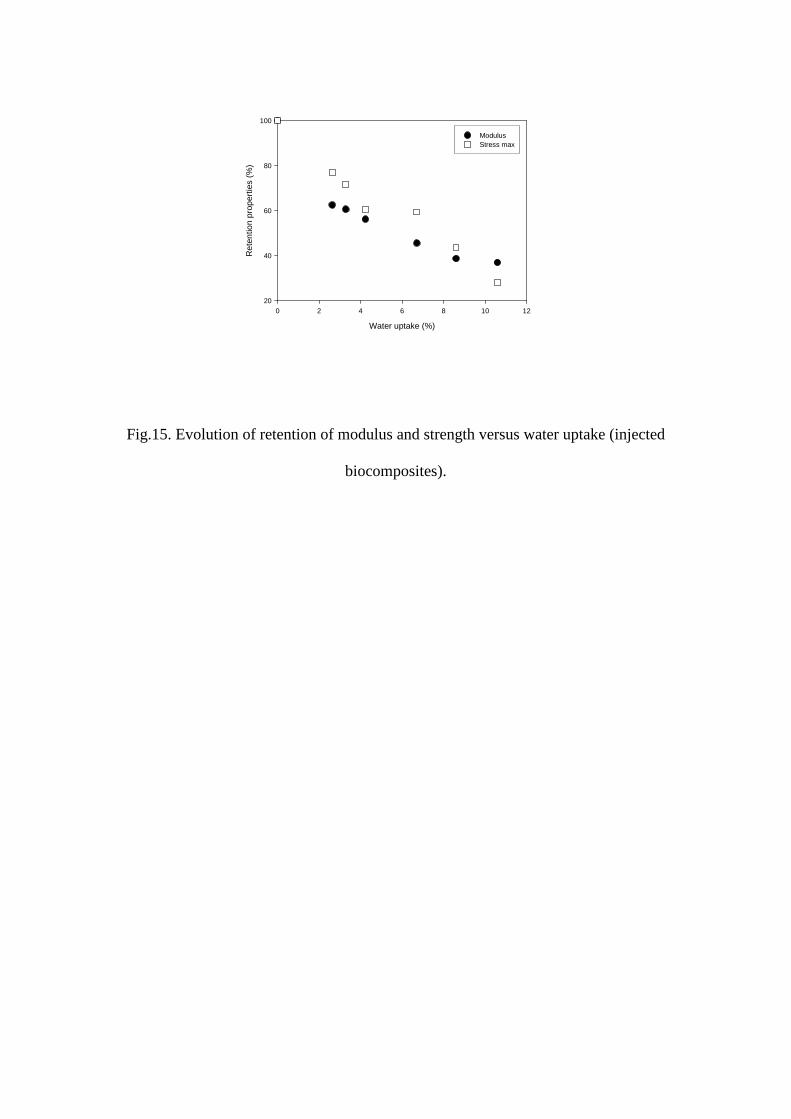
Figures 13 and 14 show the tensile properties of wet samples. Figure 13 shows a similar trend for modulus of the two materials, with a large drop in modulus after short times (<30 days), particularly marked for the film stacked samples. For longer times the modulus stabilizes for both biocomposites at 20°C. Increasing the temperature increases the modulus drop at short times. Figure 14 shows how maximum stress of the two biocomposites evolves with immersion time and temperature. In a similar way to modulus there is a large drop at short times followed by a stabilisation. The strength of the film stacked specimens remains superior to that of the injected specimens in all cases, due to the longer reinforcement length and higher molecular weight. Changes in properties can be related to water uptake, but for the film stacked samples the changes occur too fast here and cannot be plotted. Figure 15 indicates the relationship between modulus and maximum stress retention and water uptake for injected biocomposites. For high weight gains the modulus stabilizes at a value around 3 GPa, similar to the value for the unreinforced matrix. This indicates that flax fibre stiffness is very sensitive to water [18]. The relationship between the strength loss and weight gain is almost linear for injected specimens, dropping to values below that of the unreinforced polymer. Matrix degradation, fibre damage [42] and interfacial phenomena can all occur, the latter will be discussed further in section 3.5.4 below.
3.5.3. Influence of drying
By testing dried specimens it is possible to distinguish reversible effects from permanent changes. Figure 16 shows the results for the unreinforced PLLA in tension. The curves have been offset by 4% for clarity
10

Wet ageing at 20°C modifies the response of PLLA. Initially brittle (with a low failure strain), the PLLA becomes increasingly ductile with ageing, while the maximum and failure stresses decrease. For the first 15 days of ageing this behaviour is completely reversible after drying This indicates that plasticization is the dominant mechanism during this period. At longer ageing periods part of the initial properties are recovered after drying, but the failure strain and maximum stress are not fully regained. This trend is amplified at higher temperature (Table 5). For specimens dried after 90 days at 40°C, the properties of dried specimens are below the initial values. Both plasticization and hydrolysis are occurring simultaneously, as indicated by GPC above. Figures 17 and 18 show tensile test results for the biocomposites before and after drying. Note that the scale is not the same for the two plots, and that the curves are again offset for clarity. As for the unreinforced PLLA water plasticizes the biocomposites. There is an influence of the manufacturing route, the injected specimens tend to retain their linear elastic behaviour while the film stacked specimens show a more significant increase in strain during ageing. For drying after short ageing periods at 20°C (< 15 days), both types of biocomposite recover a large part but not all of their initial tensile properties. Reversible plasticization and some hydrolysis coexist. For the injected specimens this is consistent with the results from GPC and DSC. For the film stacked specimens the chain breaks were more limited however, so a more complete reversibility might have been expected (Table 5). This suggests that other damage mechanisms are acting, and this will be examined in more detail below. For longer ageing periods less and less of the initial properties are recovered after drying for both types of composite. In a similar way at 40°C (Table 5) after drying only the film stacked specimens regain some stiffness. It is important to note that the biocomposites, contrary to unreinforced PLLA, never recover completely their initial properties after drying, even after short immersion periods. This indicates that fibre or fibre/matrix interface damage is present.
90 days immersion unaged
20°C Wet 20°C Dry 40°C Wet 40°C Dry PLLA
E (MPa) 3655 ± 87 3682 ± 113 3865 ±193 3316 ± 226 2927 ± 269 σmax (MPa) 60.5 ±0.9 46.6 ± 0.1 55.4 ± 1 41.9 ± 3.7 28.9 ± 3
ε (%) 2.5 ± 0.1 10.8 ± 1.2 5.3 ± 0.6 1.3 ± 0.1 1.2 ± 0.2 Injected biocomposite
E (MPa) 7982 ± 314 4485 ± 276 5312 ± 172 3097 ± 91 3092 ± 234 σmax (MPa) 46.4 ± 4 31.3 ± 1.6 28.05 ± 6.8 13.1 ± 1.2 15.9 ± 2
ε (%) 0.9 ± 0.2 2.3 ± 0.4 1 ± 0.3 1 ± 0.1 0.8 ± 0.1 Film stacked biocomposite
E (MPa) 9527 ± 122 3697 ± 132 6772 ± 561 1694 ± 161 3633 ± 448 σmax (MPa) 89 ± 2 59.6 ± 3.9 66.5 ± 3.2 39.4 ± 3 36.3 ± 3.1
ε (%) 1.52 ± 0.04 3.1 ± 0.2 2 ± 0.4 6.5 ± 0.8 2.6 ± 0.2
Table 5. Summary of the influence of drying on tensile properties of PLLA and biocomposites after 90 days immersion at 20°C and 40°C.
3.5.4. Evaluation of biocomposite damage during aging
Within aged composites the fibre/matrix interface is a critical region where water can diffuse by capillarity [13]. In vegetable fibres the water absorbed creates hydrogen bonds reducing interactions between fibres and matrix [43, 44]. As shown previously in composites with multi-directional reinforcements, changes to interfacial regions affect first damage at interfaces aligned in the transverse direction to loading, and hence reduce the extent of linearity of the stress-strain plot more strongly than the failure stress [45]. The
11

first observation is that non-linearity appears earlier for aged samples than for unaged (Figure 18). This change in non-linearity is less marked for injected specimens (Figure 17). In order to examine this change in slope in more detail damage thresholds have been detected using acoustic emission and correlated with the end of linearity on the stress-strain plots. Only the film stacked specimens have been examined here, as this material is of more interest for structural marine applications. Figure 19 shows an example of results for film stacked samples before and after ageing for 3 months at 20°C. Stress-strain plots and cumulated hits are shown. Values of damage thresholds corresponding to non-linearity and first acoustic emission (defined as the first emission recorded by the two sensors for which the propagation time is less than the wave propagation time between the two microphones) are given in Table 6. These indicate that the loss of linearity during tensile tests on this material does indeed correspond to the first mechanical damage.
During tensile tests the first damage appears earlier in aged specimens, Figure 19, and the damage development (increase in number of hits) is more rapid. Comparison of threshold values indicates that stress and strain at first damage drop by 75% after ageing (Table 6). Ageing temperature affects the damage threshold and extent.
Unaged 3 months’ immersion
change (%)
Strain threshold (%)
0.45 ± 0.03
0.1 ± 0.07 -80
Stress threshold (MPa)
39.8 ± 4.5
10.1 ± 3 -75 20°C
Number of cumulated hits 364 ± 30 1114 ± 250 + 306
Strain threshold (%)
0.45 ± 0.03
0.11 ± 0.09 -75
Stress threshold (MPa)
39.8 ± 4.5
5.1 ± 1.3 -81 40°C
Number of cumulated hits 364 ± 30 3827 ± 500 +1051
Table 6 Evolution of damage threshold with aging and temperature Irreversible damage occurs after ageing, probably located in areas where fibres are oriented in a direction transverse to the tensile direction, but this damage may be at the fibre/matrix interface or within the fibres themselves. In theory it may be possible to use analysis of the acoustic signals to discriminate between different types of damage but this is not a simple operation. In published work on flax/starch biocomposites amplitude analysis was used to separate different mechanisms [25]. Other authors have used multivariable analyses and neural networks to distinguish the signals from different damage mechanisms [27]. The aim here is not to present a detailed signal analysis but rather to show qualitatively how wet ageing affects damage development. Figure 20 shows a simple amplitude analysis of percentage number of hits versus amplitude for specimens unaged and aged for 3 months at 20 and 40°C. Fig 20. Comparison of distribution of amplitudes of EA signal during tensile tests unaged and after aging at 20 and 40°C for 90 days. The response of the unaged specimens is concentrated around the amplitudes of 40-45 dB. After ageing for 3 months at 20°C, the distribution is much more uniform. For the specimens aged at 40°C there is a clear trend towards higher amplitudes, nearly 50% of the recorded signals show amplitudes above 55 dB. Ageing clearly affects the type of damage but to establish what is
12

changing additional tests are needed. Tests on unreinforced matrix specimens result in low noise levels and the majority of signals recorded have amplitudes below 40dB. In a previous study tensile damage in flax/starch biocomposites [25] was classified according to increasing amplitude as : fibre/matrix debonding and damage to pectine links holding fibre bundles together < fibre pull-out and formation of microcracks within fibres < fibre breakage. This would suggest that ageing induces more fibre pull-out and crack formation within fibres. SEM examination of fracture surfaces from tensile tests allows this to be investigated. Figure 21 shows the initial state. Fig. 21 SEM Micrographs of (a) unaged injected sample and (b) unaged film stacked sample. Arrows indicate interface. The interfaces appear to be intact with few signs of debonding. After ageing fibre-matrix debonding is visible in both injected and film stacked specimens (Figure 22). Fig. 22. SEM Micrographs of (a) injected and (b) film stacked samples after 3 months at 40°C. Holes are left where fibres have been pulled out during tensile testing. This type of damage appears more widespread in film stacked specimens, but the heterogeneous nature of the materials at this scale makes quantitative evaluation difficult. Figure 23a shows matrix cracks, which may be mechanical damage or induced by differential swelling due to the difference in absorption of fibres and matrix and the anisotropic nature of the fibres. Similar damage has been noted previously by other authors [6, 22, 42]. In addition to the matrix cracks certain fibres in film stacked specimens aged at 40°C for 3 months also show longitudinal microcracks, Figure 23b. Fig 23 SEM Micrograph of Film stacked sample after (a) 1 month and (b) 3 months at 40°C. The results from tests on unreinforced PLLA, the acoustic emission results and SEM observations suggest that the main effect of ageing is to increase the ease of fibre debonding and pull-out. However, some matrix and fibre cracking also occur, the variability of dimensions and properties of these natural fibres inevitably results in the presence of defects which complicate the identification of damage mechanisms and development. 4. Conclusion
This paper presents results from a study of the ageing of biodegradable recyclable composites in seawater. Biocomposites based on PLLA reinforced with 30% by weight of flax fibres, manufactured by injection and film stacking, have been studied. Before aging, the properties of these materials are comparable to those of the glass/polyester composites currently widely employed for pleasure boat construction. In order to evaluate the potential of biocomposites for marine applications it is essential to understand how they degrade. The results shown here indicate that flax/PLLA composites undergo permanent changes after immersion in sea water. The absorption of water results in several degradation mechanisms: - hydrolysis of the matrix, revealed by reduction in molecular weight, - structural changes revealed by thermal analysis - degradation of the fibre/matrix interface (debonding, pull-out) - differential swelling at the fibre-matrix interface. - degradation of fibres. These mechanisms result in a reduction in mechanical properties. The stiffness of unreinforced PLLA is hardly affected by water, but the biocomposites lose tensile stiffness and strength progressively as water enters the material. This loss has been directly related to water uptake; acoustic emission and SEM observations suggest that fibre/matrix interface weakening is the main
13

damage mechanism induced by wet ageing. However, both matrix and fibre cracks also appear at longer periods. This paper has established a baseline for the influence of marine ageing on a biocomposite. The intrinsic nature of biocomposites and their attractive biodegradability mean that special care will be required to integrate them in marine structures. However, the environmental importance of using recyclable materials from natural resources are such that work is now continuing in this area, to optimise composite lifetime, limit interface degradation and develop strategies to limit long term property losses in service. Acknowledgements
The authors thank the Bretagne region who financed this work within the NAVECOMAT project. This project, involving Plasmor, Finot, Ifremer, University of South Brittany and Catherine Chabaud, is developing biocomposites for marine applications. References
1. Baley C, Grohens Y and Pillin I. Etat de l'art sur les matériaux composites biodégradables. Revue des composites et des matériaux composites avancés 2004;14:135-166. 2. Le Duigou A, Pillin I, Bourmaud A, Davies P and Baley C. Effect of recycling on mechanical behaviour of biocompostable flax/poly(l-lactide) composites. Composites Part A: Applied Science and Manufacturing 2008;39(9):1471-1478. 3. Bodros E, Pillin I, Montrelay N and Baley C. Could biopolymers reinforced by randomly scattered flax fibre be used in structural applications? Composites Science and Technology 2007;67(3-4):462-470. 4. Lee S-H and Wang S. Biodegradable polymers/bamboo fiber biocomposite with bio-based coupling agent. Composites Part A: Applied Science and Manufacturing 2006;37(1):80-91. 5. Bonniau P, Bunsell AR, A comparative study of water absorption theories applied to glass/epoxy composites, Journal of Composite Materials, Vol. 15, No. 3, (1981) 272-293. 6. Chow CPL, Xing XS and Li RKY. Moisture absorption studies of sisal fibre reinforced polypropylene composites. Composites Science and Technology, Modelling and Characterization of Composites 2007;67(2):306-313. 7. Zhou J and Lucas JP. The effects of a water environment on anomalous absorption behavior in graphite/epoxy composites. Composites Science and Technology 1995;53(1):57-64. 8. Sreekumar PA, Joseph K, Unnikrishnan G and Thomas S. A comparative study on mechanical properties of sisal-leaf fibre-reinforced polyester composites prepared by resin transfer and compression moulding techniques. Composites Science and Technology 2007;67(3-4):453-461. 9. Wiggins JS, Hassan MK, Mauritz KA and Storey RF. Hydrolytic degradation of poly(d,l-lactide) as a function of end group: Carboxylic acid vs. hydroxyl. Polymer 2006;47(6):1960-1969. 10. Hu Y, Rogunova M, Topolkaraev V, Hiltner A and Baer E. Aging of poly(lactide)/poly(ethylene glycol) blends. Part 1. Poly(lactide) with low stereoregularity. Polymer 2003;44(19):5701-5710. 11. Garlotta D, Doane W, Shogren R, Lawton J and Willett J. Mechanical and thermal properties of starch-filled poly(DL-lactic acid)/poly(hydroxy ester ether) biodegradable blends. Journal of Applied Polymer Science 2003;88(7):1775-1786. 12. Pegoretti A and Penati A. Effects of hygrothermal aging on the molar mass and thermal properties of recycled poly(ethylene terephthalate) and its short glass fibre composites. Polymer Degradation and Stability 2004;86(2):233-243. 13. Foulc MP, Bergeret A, Ferry L, Ienny P and Crespy A. Study of hygrothermal ageing of glass fibre reinforced PET composites. Polymer Degradation and Stability 2005;89(3):461-470.
14
14. Yew GH, Mohd Yusof AM, Mohd Ishak ZA and Ishiaku US. Water absorption and enzymatic degradation of poly(lactic acid)/rice starch composites. Polymer Degradation and Stability 2005;90(3):488-500. 15. Alvarez V, Fraga A and Vázquez A. Effects of the moisture and fiber content on the mechanical properties of biodegradable polymer-sisal fiber biocomposites. Journal of Applied Polymer Science 2004;91(6):4007-4016. 16. Retegi A, Arbelaiz A, Alvarez P, Llano-Ponte R, Labidi J and Mondragon I. Effects of hygrothermal ageing on mechanical properties of flax pulps and their polypropylene matrix composites. Journal of Applied Polymer Science 2006;102(4):3438-3445. 17. Illic J and Muell M. Variation of the dynamique elastic modulus and wave velocity in the fiber direction with other properties during the drying of "Eucalyptus regans". Wood Science and Technology 2002;36:55-74. 18. Sreekala MS and Thomas S. Effect of fibre surface modification on water-sorption characteristics of oil palm fibres. Composites Science and Technology 2003;63(6):861-869. 19. Baley C, Davies P, Grohens Y and Dolto G. Application of Interlaminar Tests to Marine Composites. A Literature Review. Applied composite materials 2004;11(2):99-126. 20. Bessadok A, Marais S, Gouanvé F, Colasse L, Zimmerlin I, Roudesli S and Métayer M. Effect of chemical treatments of Alfa (Stipa tenacissima) fibres on water-sorption properties. Composites Science and Technology 2007;67(3-4):685-697. 21. Gautier L, Mortaigne B, Bellenger V and Verdu J. Osmotic cracking nucleation in hydrothermal-aged polyester matrix. Polymer 2000;41(7):2481-2490. 22. Dhakal HN, Zhang ZY and Richardson MOW. Effect of water absorption on the mechanical properties of hemp fibre reinforced unsaturated polyester composites. Composites Science and Technology 2007;67(7-8):1674-1683. 23. Hamstad M. A review: Acoustic emission, a tool for composite-materials studies. Experimental mechanics 1986;26(1):7-13. 24. Huguet S. Application de classifieurs aux données d'émission acoustique : identification de la signature acoustique des mécanismes d'endommagement dans les composites à matrice polymère. 2002, PhD thesis Insa-Lyon: Lyon. 25. Romhány G, Karger-Kocsis J and Czigány T. Tensile Fracture and Failure Behavior of Thermoplastic Starch with Unidirectional and Cross-Ply Flax Fiber Reinforcements. Macromolecular Materials and Engineering 2003;288(9):699-707. 26. Romhány G, Karger-Kocsis J and Czigány T. Tensile fracture and failure behavior of technical flax fibers. Journal of Applied Polymer Science 2003;90(13):3638-3645. 27. Godin N, Huguet S and Gaertner R. Influence of hydrolytic ageing on the acoustic emission signatures of damage mechanisms occurring during tensile tests on a polyester composite: Application of a Kohonen's map. Composite Structures 2006;72(1):79-85. 28. International Standard ISO/CEN 14855. Plastics. Evaluation of ultime aerobic biodegradability and disintegration of plastic materials under controlled composting conditions. Method by analysis of released carbon dioxide. 1998. 29. Gattin R, Copinet A, Bertrand C and Couturier Y. Biodegradation study of a starch and poly(lactic acid) co-extruded material in liquid, composting and inert mineral media. International Biodeterioration & Biodegradation 2002;50(1):25-31. 30. Ray S, Yamada K, Okamoto M and Ueda K. Crystallization behaviour and morphology of biodegradable polylactide/layered silicate nanocomposite. Polymer 2003;44:857-866. 31. Bellenger V, Ganem M, Mortaigne B and Verdu J. Lifetime prediction in the hydrolytic ageing of polyesters. Polymer Degradation and Stability 1995;49(1):91-97. 32. Nielsen A. Acoustic emission source based on pencil lead breaking. The Danish welding institute publication 1980;15:80. 33. Perrot Y. Influence des propriétés de la matrice sur le comportement mécanique de matériaux composites verre/polyester utilisés en construction navales de plaisance. 2006, PhD thesis Université de Bretagne Sud: Lorient. 34. Baley C. Fibres naturelles de renfort pour matériaux composites. Technique de l'ingénieur 2004;AM5 130.
15

16
35. Charlet K, Baley C, Morvan C, Jernot JP, Gomina M and Bréard J. Characteristics of Hermès flax fibres as a function of their location in the stem and properties of the derived unidirectional composites. Composites Part A: Applied Science and Manufacturing 2007;38(8):1912-1921. 36. Guillon D. Fibre de verre de renforcement. Technique ed l'ingénieur 1995;A2 110. 37. Gouanvé F, Marais S, Bessadok A, Langevin D and Métayer M. Kinetics of water sorption in flax and PET fibers. European Polymer Journal 2007;43(2):586-598. 38. Dhakal HN, Zhang ZY, Richardson MOW and Errajhi OAZ. The low velocity impact response of non-woven hemp fibre reinforced unsaturated polyester composites. Composite Structures 2007;81(4):559-567. 39. Shah S, Zhu K and Pitt C. Poly-DL-lactic acid : polyethylene glycol block copolymers. The influence of polyethylene glycol on the degradation of poly-DL-lactic acid. J.Biomater Sci. Polym ed 1994;5(5):421-431. 40. Pegoretti A and Penati A. Recycled poly(ethylene terephthalate) and its short glass fibres composites: effects of hygrothermal aging on the thermo-mechanical behaviour. Polymer 2004;45(23):7995-8004. 41. Tsuji H, Suzuyoshi K, Environmental degradation of biodegradable polyesters 1, Polymer Degradation and Stability 2002; 75, 347-355. 42. Thwe MM and Liao K. Durability of bamboo-glass fiber reinforced polymer matrix hybrid composites. Composites Science and Technology 2003;63(3-4):375-387. 43. Stamboulis A, Baillie CA, Garkhail SK, van Melick HGH and Peijs T. Environmental Durability of Flax Fibres and their Composites based on Polypropylene Matrix. Applied Composite Materials 2000;7(5):273-294. 44. Joseph PV, Rabello MS, Mattoso LHC, Joseph K and Thomas S. Environmental effects on the degradation behaviour of sisal fibre reinforced polypropylene composites. Composites Science and Technology 2002;62(10-11):1357-1372. 45. Bergeret A and Krawczak P. Liaison renfort matrice ; Définition et caractérisation. Technique de l'ingénieur;AM5 305.

Figure Headings
Fig.1. Film stacking procedure.
Fig.2. Picture of PLLA sample surface after immersion at 60°C for 30 days.
Fig.3. Picture of biocomposite injected sample surface after immersion for 90 days at 60°C.
Fig. 4. Evolution of water uptake as a function of immersion time at 60°C for PLLA and
injected biocomposite.
Fig. 5. SEM micrograph of injected biocomposite tensile fracture surface
Fig. 6. SEM Micrograph of tensile fracture surface of biocomposite produced by the film
stacking method.
Fig. 7. Absorption behaviour of PLLA at 20 and 40°C.
Fig.8. Absorption behaviour of injected and film stacked samples at 20 and 40°C.
Fig.9. Average number of random chain scissions per unit mass for PLLA as a function of
water uptake.
Fig 10. Average number of random chain scissions per unit mass for PLLA, injected and film
stacked sample as a function of immersion time at 20°C.
Fig. 11. Evolution of thermal properties of PLLA versus immersion time and temperature
Fig. 12. Evolution of thermal properties of biocomposites, injection and film stacking versus
immersion time and temperature.
Fig. 13. Evolution of biocomposite modulus versus immersion time.
Fig. 14. Evolution of biocomposite stress at break versus immersion time.
Fig.15. Evolution of retention of modulus and strength versus water uptake (injected
biocomposites).

Fig.16 Evolution of PLLA behaviour before and after drying as a function of immersion time
at 20°C.
Fig. 17 Evolution of tensile behaviour of injected biocomposites.
Fig. 18. Evolution of tensile behaviour of film stacked biocomposites.
Fig. 19 Stress-strain response under tension loading for film stacked biocomposite samples
unaged and after 3 months aging at 20°C.
Fig 20. Comparison of distributions of amplitudes of AE signals during tensile tests on
unaged samples and after aging at 20 and 40°C for 90 days.
Fig. 21 SEM Micrographs of (a) unaged injected sample and (b) unaged film stacked sample.
Arrows indicate interface.
Fig. 22. SEM Micrographs of (a) injected and (b) film stacked samples after 3 months at
40°C.
Fig 23 SEM Micrographs of film stacked samples after (a) 1 month and (b) 3 months at 40°C.

Fig. 1. Film stacking procedure
020406080
100120140160180200
0 10 20 30
Temps (min)
Tem
per
atur
e (°C
)
0
5
10
15
20
25
30
35
40
45
Pressure (b
ars)
temperature (°C) pressure (bars)
10 mm10 mm10 mm
Fig.2. Picture of PLLA sample surface after immersion at 60°C for 30 days.

5 mm5 mm5 mm
Fig.3. Picture of biocomposite injected sample surface after immersion for 90 days at 60°C.

Time (H1/2)
0 10 20 30 40
Wat
er u
ptak
e (%
)
-1
0
1
2
3
4
5
6
7
PLLAInjected biocomposite
Fig. 4. Evolution of water uptake as a function of immersion time at 60°C for PLLA and
injected biocomposite.

Fig. 5. SEM micrograph of injected biocomposite tensile fracture surface

Fig. 6. SEM Micrograph of tensile fracture surface of biocomposite produced by the film
stacking method.

Time (H1/2)
0 10 20 30 40 50
Wat
er u
ptak
e (%
)
0,0
0,2
0,4
0,6
0,8
1,0
PLLA 20°CPLLA 40°C
Fig. 7. Absorption behaviour of PLLA at 20 and 40°C.

Root time (h0.5) / Thickness (mm)
0 5 10 15 20 25
Wat
er u
ptak
e (%
)
0
2
4
6
8
10
12
Injection 20°CInjection 40°CFilm stacking 20°CFilm stacking 40°C
Fig.8. Absorption behaviour of injected and film stacked samples at 20 and 40°C.

Water uptake (%)
0,0 0,1 0,2 0,3 0,4 0,5 0,6 0,7
n t (m
ol/g
)
0
2e-6
4e-6
6e-6
8e-6
1e-5
PLLA
Fig.9. Average number of random chain scissions per unit mass for PLLA as a function of
water uptake.

Time (Days)
0 20 40 60 80 100
n t (m
ol/g
)
0
2e-6
4e-6
6e-6
8e-6
1e-5
PLLAInjectionFilm stacking
Fig 10. Average number of random chain scissions per unit mass for PLLA, injected and film
stacked sample as a function of immersion time at 20°C.

Time (Days)
0 20 40 60 80 100
Mel
ting
Ent
halp
y (J
/g)
20
30
40
50
60
Gla
ss tr
ansi
tion
tem
pera
ture
(°C
)
45
50
55
60
65
70
75
Melting enthalpy 20°CMelting enthalpy 40°CTg 20°CTg 40°C
Figure 11. Evolution of thermal properties of PLLA versus immersion time and temperature

Time (Days)
0 20 40 60 80 100
Mel
ting
enth
alpy
(J/
g)
20
40
60
80
100
Gla
ss tr
ansi
tion
tem
pera
ture
(°C
)
45
50
55
60
65
70
75Injection 20°CInjection 40°CFilm stacking 20°CFilm stacking 40°C
Fig. 12. Evolution of thermal properties of biocomposites, injection and film stacking versus
immersion time and temperature.

Time (Days)
0 20 40 60 80 100
You
ng m
odul
us (
MP
a)
0
2000
4000
6000
8000
10000
Injection 20°CInjection 40°CFilm stacking 20°CFilm stacking 40°C
Fig. 13. Evolution of biocomposite modulus versus immersion time.

Time (Days)
0 20 40 60 80 100
Str
ess
at b
reak
(M
Pa)
0
20
40
60
80
100
Injection 20°CInjection 40°C film stacking 20°C film stacking 40°C
Fig. 14. Evolution of biocomposite stress at break versus immersion time.
Water uptake (%)
0 2 4 6 8 10 12
Ret
entio
n pr
oper
ties
(%)
20
40
60
80
100
ModulusStress max
Fig.15. Evolution of retention of modulus and strength versus water uptake (injected
biocomposites).

0
10
20
30
40
50
60
70
0 5 10 15 20 25
Strain (%)
Stre
ss (
Mpa
)
Unaged
15 Days
15 Days dry
30 Days
30 Days dry
90 Days
90 Days dry
Dry
Wet
Fig.16 Evolution of PLLA behaviour before and after drying as a function of immersion time
at 20°C.

0
5
10
15
20
25
30
35
40
45
50
0 1 2 3 4 5 6
strain (%)
Stre
ss (
MP
a)
unaged
15 Days
15 Days dry
30 Days
30 Days dry
90 Days
90 Days dry
Wet
Dry
Fig. 17 Evolution of tensile behaviour of injected biocomposites.

0
10
20
30
40
50
60
70
80
90
100
0 1 2 3 4 5 6 7 8
Strain (%)
Stre
ss (
MP
a)
Unaged
15 Days
15 Days dry
30 Days
30 Days dry
90 Days
90 Days dry
Wet
Dry
Fig. 18. Evolution of tensile behaviour of film stacked biocomposites.

0
10
20
30
40
50
60
70
80
90
100
0 0,5 1 1,5 2 2,5 3 3,5
Strain (%)
Str
ess
(MP
a)
0
200
400
600
800
1000
1200
1400
1600
Cum
ulat
ive
num
ber
of h
its
Unaged
3 months aging
Unaged cumulative hitnumber3 months aged cumulative hit number
Fig. 19. Stress-strain response under tensile loading for film stacked biocomposite samples
unaged and after 3 months aging at 20°C.

0
5
10
15
20
25
30
<35 35-40 40-45 45-50 50-55 55-60 60-65 65-70 70-75 75-80 > 80
Amplitude range
Freq
uenc
y (%
)
Unaged
90 days at20°C
90 days at40°C
Fig 20. Comparison of distributions of amplitudes of AE signals during tensile tests on
samples unaged and after aging at 20 and 40°C for 90 days.

a baa b
Fig. 21 SEM Micrographs of (a) unaged injected sample and (b) unaged film stacked sample.
Arrows indicate interface.

a ba b
Fig. 22. SEM Micrographs of (a) injected and (b) film stacked samples after 3 months at
40°C.

a ba b
Fig 23 SEM Micrographs of film stacked samples after (a) 1 month and (b) 3 months at 40°C.