the 13 march 1993 severe squall line over western cubaco´rdoba and alfonso (1992) have pointed out...
TRANSCRIPT
/ams v5077 0207 Mp 89 Friday Feb 23 07:52 PM AMS: Forecasting (March 96) 0207
89MARCH 1996 A L F O N S O A N D N A R A N J O
q 1996 American Meteorological Society
The 13 March 1993 Severe Squall Line over Western Cuba
ARNALDO P. ALFONSO AND LINO R. NARANJO
Centro Meteorologico Provincial, Matanzas, Cuba
(Manuscript received 24 January 1994, in final form 14 November 1995)
ABSTRACT
On 13 March 1993 a powerful prefontal squall line hit western and central Cuba. At 0000 UTC, a fast-developing extratropical cyclone with a well-defined cold front was located in the northeast Gulf of Mexico.Over the eastern Gulf of Mexico there was a 300-hPa jet streak interacting with a low-level jet. A hodographtypically associated with supercells or severe squall lines was observed at Key West, Florida. The air mass overthe eastern Gulf of Mexico, Florida, and Cuba was conditionally unstable. Instability was enhanced by moist airat the surface interacting with a dry intrusion in the midtroposphere from the Mexican Plateau. Lifting inducedby a strong short-wave trough favored the formation a compact squall line with embedded bow-echoes and line-echo wave patterns. Damaging winds were widespread with the squall line. Thus, the event fits the definition ofa serial derecho. One of the two bow echoes that affected Cuba included a small but strong mesocyclone in itsforward flank, as detected by radar and surface observations. The mesocyclone caused great damage in a 20-km-wide strip over the Havana and Havana City provinces, producing a family of downbursts in its southernportion. Estimated damage up to F2 on the Fujita scale was experienced in the effected area. Another bow echostruck the central region of Cuba producing similar damage. The squall line event described in this study is themost damaging one ever recorded in Cuba.
1. Introduction
Alfonso (1988) has shown that severe local storms(SLS)1 can occur in every month of the year in Cubabut that a period with more frequent SLS extends fromMarch to September. The SLS events observed duringthe early part of the active season (March to May) aregenerated by extratropical systems (e.g., cold frontsand short-wave troughs) . Tropical synoptic systems(e.g., upper cold lows, tropical waves, and tropical cy-clones) and mesoscale forcing (as described by Gar-inger and Knupp 1993) produce the majority of SLSevents from July to September. Since both types of sys-tems can occur in June, it is the month with maximumfrequency of occurrence of SLS. However, the mostdamaging SLS events observed in Cuba have occurredin the cool season, from late December to March. Theseevents are produced by prefrontal squall lines. For ex-ample, on 26 December 1940, an SLS squall line,
1 For purposes of the Institute of Meteorology of Cuba, the defi-nition of an SLS is a storm that produces one or more of the followingphenomena:
• tornado• hail, any size• damaging winds, or measured winds § 25 m s01
• waterspout
Corresponding author address: Dr. Lino Naranjo Diaz, c/o Dr.Oswaldo Garcia, Department of Geosciences, San Francisco StateUniversity, 1600 Holloway Ave., San Francisco, CA 94132.
which included a severe tornadic storm, devastated thetown of Bejucal, near Havana City (Ortiz and Ortiz Jr.1940). Twenty people died and approximately 200were injured in that event. More recently, on 16 Feb-ruary 1983, a severe squall line with strong mesocy-clones affected broad areas in the Havana province(Alfonso and Cordoba 1987). These examples illus-trate the importance placed on the study of prefrontalsquall lines in Cuba (e.g., Alfonso 1986).
Cordoba and Alfonso (1992) have pointed out thatthe SLS-producing prefrontal squall lines studied todate in Cuba were linked to slow-moving extratropicallows associated with short-wave troughs in the south-ern branch of a split polar jet (SBPJ). The conditionswere similar to central U.S. squall environments (Hane1986) except that the Cuban events occurred withweak, cold fronts of Pacific maritime, rather than con-tinental, origins.
On 13 March 1993 a very strong extratropical stormhit a broad area of the United States and Cuba, causingconsiderable damage and casualties. In Cuba, total fa-talities were relatively low (10), but economic lossesamounted to more than U.S. $1 billion. A significantportion of these losses were caused by a prefrontal SLSsquall line with severe weather that swept the wholecountry, bringing straight-line winds over 55 m s01 andhail to the western provinces. Rains over 100 mm in24 h fell over eastern provinces. Although the observedsevere phenomena were not the most intense ever re-corded in Cuba, the extent of the area affected by sig-nificant SLS phenomena was greater than that of anyother severe prefrontal squall lines previously studied.
/ams v5077 0207 Mp 90 Friday Feb 23 07:52 PM AMS: Forecasting (March 96) 0207
90 VOLUME 11W E A T H E R A N D F O R E C A S T I N G
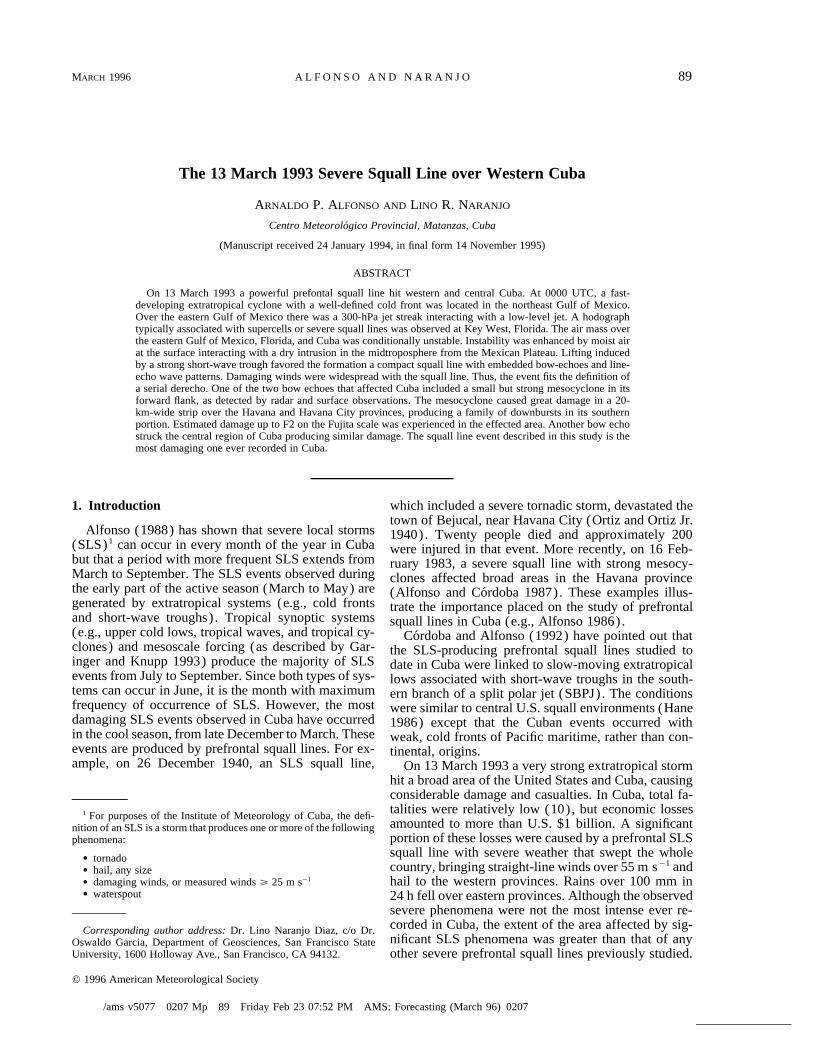
FIG. 1. Key locations over Cuba and adjacent areas.
The 13 March 1993 squall line formed in a synopticenvironment quite different from formerly reportedcases in Cuba (Cordoba and Alfonso 1992). It wasdistinguished by an exceptionally strong polar outbreakover the central United States and the Gulf of Mexico,with a pronounced cold front along the forward bound-ary of this air mass. These features were associated witha deep, long-wave trough in the midtroposphere thatextended from polar latitudes down to the Tropics. Theobject of this paper is to report on a detailed analysisof this case in order to contribute to the current knowl-edge of the behavior of severe weather–producingsquall line systems in low latitudes, and especially inthe vicinity of Cuba (Fig. 1) .
2. Synoptic analysis
a. General description2
A strong polar outbreak over the central UnitedStates brought on sustained surface pressure rises inthat area on 11 and 12 March. At the same time, anextratropical low pressure center began to develop overMexico. At 0000 UTC 12 March, the low started tomove east along a quasi-stationary front that had re-mained over the northern part of the Gulf of Mexicoduring the preceding 48 h. An increase in contrast be-tween cold continental air and maritime air from theAtlantic Ocean covering the Gulf of Mexico south ofthe quasi-stationary front was clearly observable. By
2 The synoptic analyses used in this study are based on surface andupper-air charts and atmospheric soundings, subjectively analyzedby the staff of the Weather Forecast Department, MeteorologicalCenter, Matanzas, Cuba (FDMCM).
2300 UTC 12 March the continental high pressure cen-ter had reached a value of 103.1 kPa over Kansas.Meanwhile, the low pressure center had moved into theGulf and was located near 257N, 937W and had a sur-face pressure of 100.4 kPa at its center.
Above the surface, these events were initially asso-ciated with a period of quasi-zonal flow over the centraland eastern United States, the Gulf of Mexico, and eventhe Caribbean Sea. By 1200 UTC 12 March, a strongshort-wave trough in the SBPJ began supporting rapidcyclogenesis in the Gulf of Mexico. A powerful coldoutbreak in the midlevels spread to the south over theGreat Plains, and a short-wave trough in the northernbranch of the polar jet (NBPJ) came quickly into phasewith the southern current, resulting in the deep, long-wave trough shown in Fig. 2.
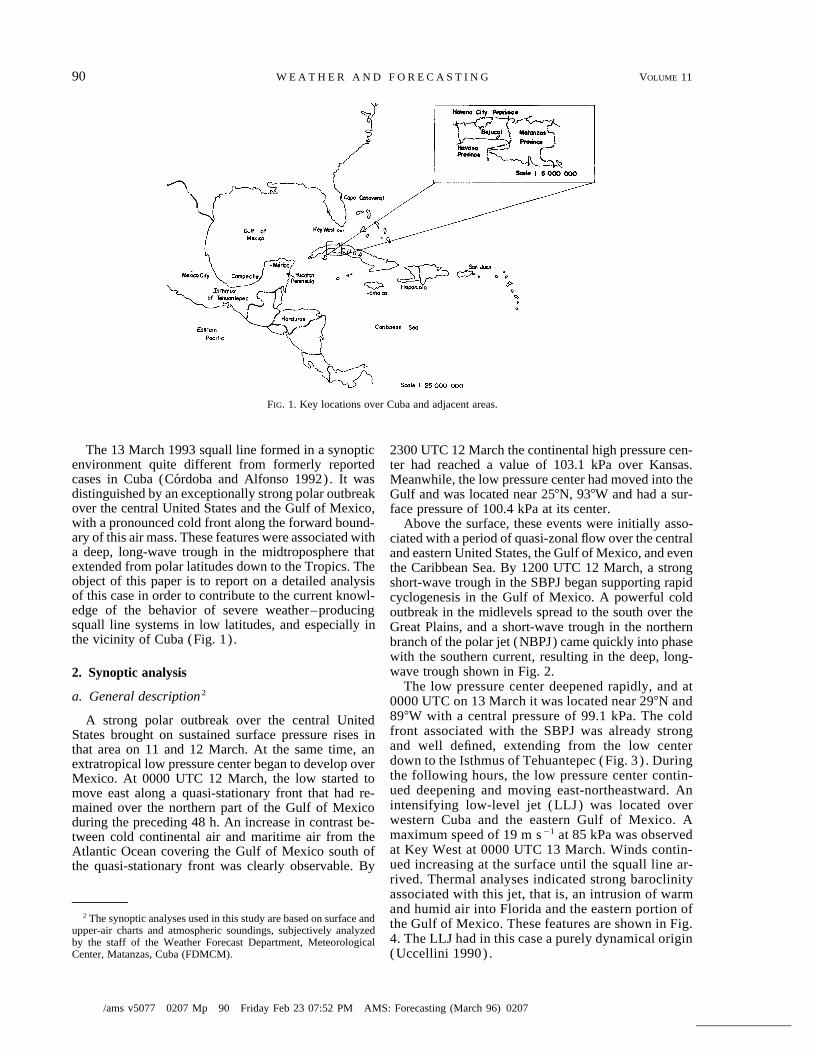
The low pressure center deepened rapidly, and at0000 UTC on 13 March it was located near 297N and897W with a central pressure of 99.1 kPa. The coldfront associated with the SBPJ was already strongand well defined, extending from the low centerdown to the Isthmus of Tehuantepec (Fig. 3 ) . Duringthe following hours, the low pressure center contin-ued deepening and moving east-northeastward. Anintensifying low-level jet (LLJ) was located overwestern Cuba and the eastern Gulf of Mexico. Amaximum speed of 19 m s01 at 85 kPa was observedat Key West at 0000 UTC 13 March. Winds contin-ued increasing at the surface until the squall line ar-rived. Thermal analyses indicated strong baroclinityassociated with this jet, that is, an intrusion of warmand humid air into Florida and the eastern portion ofthe Gulf of Mexico. These features are shown in Fig.4. The LLJ had in this case a purely dynamical origin(Uccellini 1990) .

/ams v5077 0207 Mp 91 Friday Feb 23 07:52 PM AMS: Forecasting (March 96) 0207
91MARCH 1996 A L F O N S O A N D N A R A N J O
FIG. 2. FDMCM subjective 50-kPa analysis for 0000 UTC 13 March 1993. Geopotential heights(solid) every 6 dam and temperatures (dashed) every 57C. Station model temperatures (top) anddewpoint depressions (bottom) in Celsius. Each full-wind barb equals 10 kt, and each flag equals50 kt.
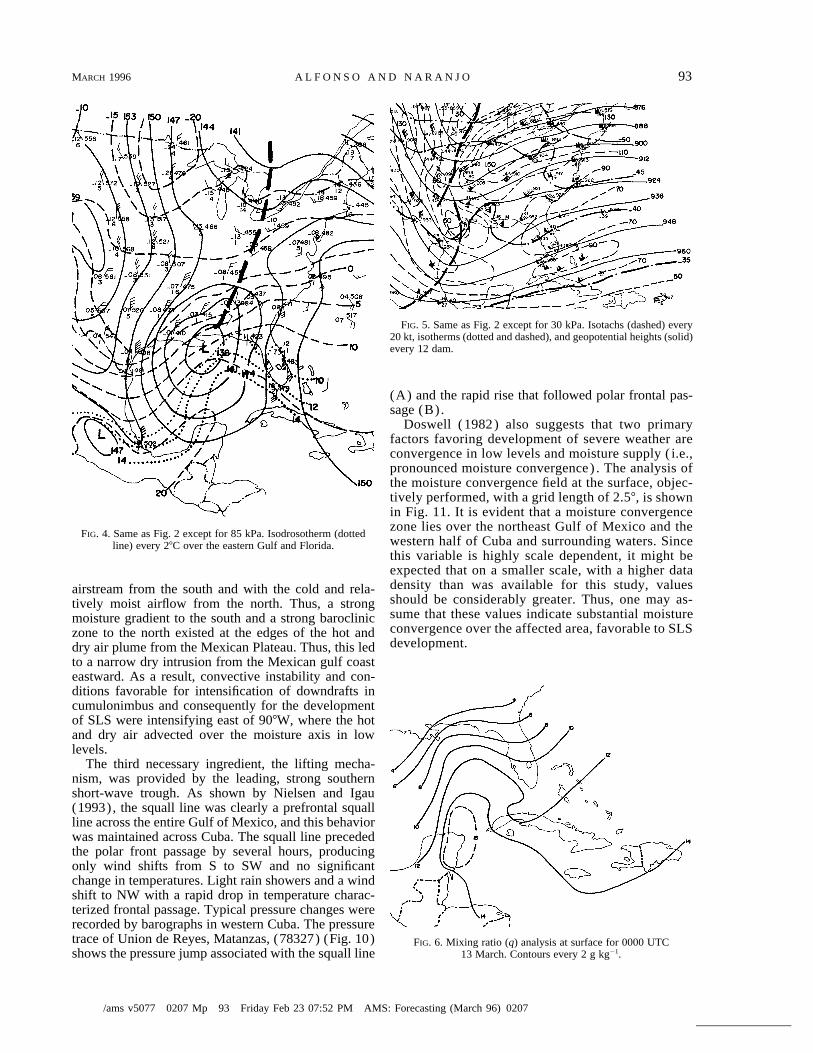
In the upper troposphere (i.e., the 30-kPa levelshown in Fig. 5) it is evident that the intense cyclo-genesis in the Gulf of Mexico was associated with apronounced zone of difluence. Strong ageostrophicflow components were indicated over the U.S. gulfcoastal region, with the flow becoming perpendicularto the height contours over Louisiana and the nearbygulf. This development was a consequence of the rapidintensification of the low pressure center that was beingbuilt up from the lower atmospheric layers and was alsorelated to deep convection over the Gulf of Mexico andthe southeast United States (Keyser and Carlson1984). This situation was coincident with the SBPJ exitregion over the central gulf. Figure 5 also illustrates theintense split in the polar jet.
No data were received from radiosonde stations inCentral America and the Caribbean Sea (except SanJuan, Puerto Rico) at 0000 UTC 13 March, but satelliteimagery at 0201 UTC indicated that the subtropical jet
stream (STJ) was far to the south, emerging from theeastern Pacific across eastern Honduras and continuingeast-northeastward across Jamaica and Hispaniola.
b. Factors related to deep convection and associatedsevere weather
Doswell (1987) has stated that many severe weatherphenomena, as defined in section 1, are related to deepconvection and that there are three necessary elementsfor their occurrence. The first of these elements is thepresence of a deep moist layer in the lowest levels. Inthe 13 March case an abundant supply of moisture atthe surface is apparent, with mixing ratio (q) valuesreaching up to 16 g kg01 over eastern Yucatan and ad-jacent waters and high values extending to the northover the eastern Gulf of Mexico (Fig. 6) . This is morethan twice the 7 g kg01 average value found byMcNulty (1978) to be associated with cases of severe

/ams v5077 0207 Mp 92 Friday Feb 23 07:52 PM AMS: Forecasting (March 96) 0207
92 VOLUME 11W E A T H E R A N D F O R E C A S T I N G
FIG. 3. FDMCM sea level pressure analysis for 0000 UTC 13 March 1993. Isobars every 4 hPa.Temperature (top) and dewpoint (bottom) in Celsius. Each full-wind barb equals 10 kt.
weather outbreaks occurring during March in theUnited States.
A strong q gradient existed over Yucatan betweenvery humid air to the east and relatively dry air to thewest over the Yucatan Plateau and the western Gulf ofMexico. Further, at 0000 UTC 13 March the temper-ature in both Merida and Campeche on the west Yu-catan coast was 327–337C in contrast to 287C on theeastern coast of the peninsula. The moisture and tem-perature distribution over the Yucatan Peninsula re-sembles the pattern that Miller (1972) described asvery favorable to SLS development, that is, the low-level heat axis located west (upstream) of the moistureaxis. Observational evidence obtained from SLS squallline forecasting in Cuba suggests that most of the time,when squall lines develop in the Gulf of Mexico, theyextend south only to about 257N latitude as they tra-verse the northwest and central gulf. As they reach theeastern gulf, squall lines typically expand rapidlysouthward over the southeast gulf and western Cuba.Since the q distribution over Yucatan in this case istypical of most spring afternoons, it is possible that thisregional aspect of the heat and moisture distributionsis responsible for the behavior of squall lines in thisarea. The satellite picture sequence included in the pa-per by Nielsen and Igau (1993) showed very rapidbuilding to the south of the squall line over the easternYucatan Peninsula. Figure 4 shows this developmentcoincident with the moisture axis at 85 kPa. Soundings
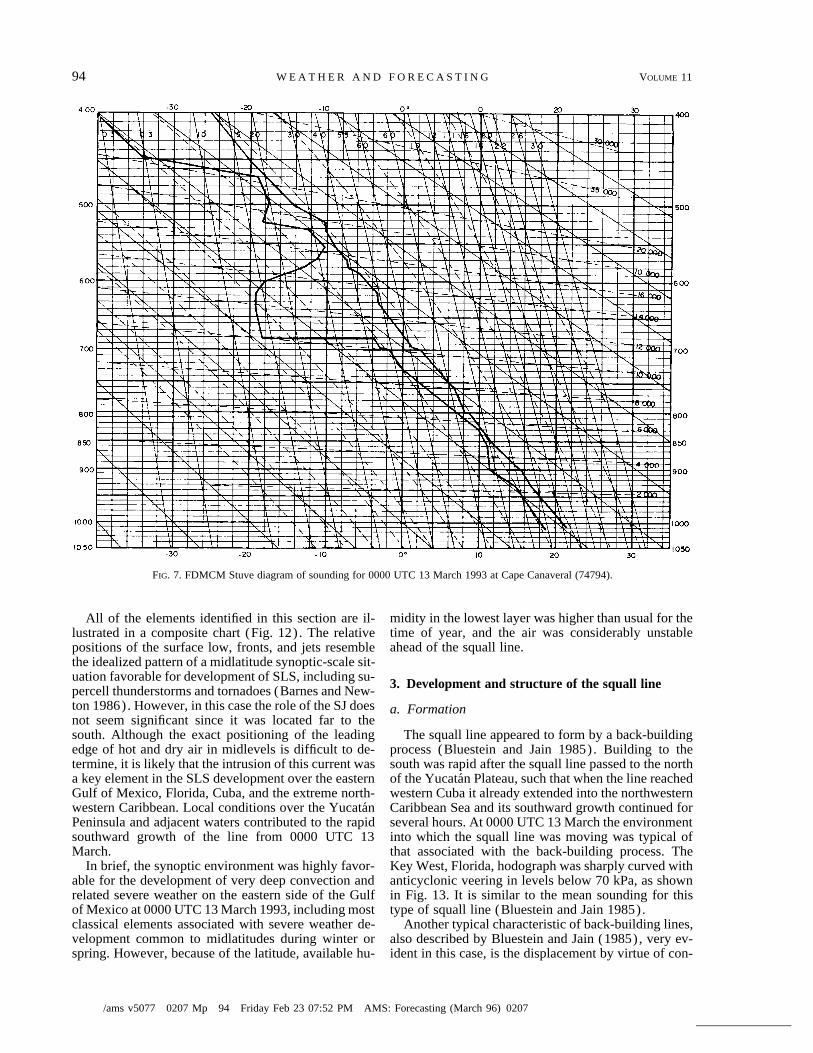
over Florida, as shown by the Cape Canaveral, Florida,sounding, for example (Fig. 7) , indicated that the moistlayer extended to about 70 kPa at 0000 UTC 13 March.
The second necessary element for the developmentof deep convection is a sufficiently steep lapse rateabove the moist layer. In this case, conditionally unsta-ble air covered Florida and western Cuba, as shown inFig. 7. Lifted index values (Galway 1956) between03and 05 and total totals indices (Miller 1972) between48 and 50 were observed in soundings of Florida at0000 UTC 13 March. However, these very moistsounding do not appear typical of soundings usuallyassociated with very strong and spatially extensivedownbursts.
The 50- (Fig. 2) and the 70-kPa (Fig. 8) analysesshow the existence of very strong winds blowing fromthe Mexican Plateau to the eastern Gulf of Mexico. Hot,dry, and high-lapse-rate air forming over Mexico (asshown by Mexico City sounding at 0000 UTC 13March, Fig. 9) was advecting eastward over the Gulfof Mexico (indicated by the analysis in Fig. 8) . Con-sequently, a very strong capping inversion also ex-tended eastward over the moist gulf air at low levels.The process of lid formation in this case was somewhatdifferent from the classical process in the central UnitedStates, as described by Lannicci and Warner (1991).The hot, dry, and high-lapse-rate air from the MexicanPlateau was advecting from the rear of the short-wavetrough and merging both with the warm and humid
/ams v5077 0207 Mp 93 Friday Feb 23 07:52 PM AMS: Forecasting (March 96) 0207
93MARCH 1996 A L F O N S O A N D N A R A N J O
FIG. 4. Same as Fig. 2 except for 85 kPa. Isodrosotherm (dottedline) every 27C over the eastern Gulf and Florida.
FIG. 5. Same as Fig. 2 except for 30 kPa. Isotachs (dashed) every20 kt, isotherms (dotted and dashed), and geopotential heights (solid)every 12 dam.
FIG. 6. Mixing ratio (q) analysis at surface for 0000 UTC13 March. Contours every 2 g kg01.
airstream from the south and with the cold and rela-tively moist airflow from the north. Thus, a strongmoisture gradient to the south and a strong barocliniczone to the north existed at the edges of the hot anddry air plume from the Mexican Plateau. Thus, this ledto a narrow dry intrusion from the Mexican gulf coasteastward. As a result, convective instability and con-ditions favorable for intensification of downdrafts incumulonimbus and consequently for the developmentof SLS were intensifying east of 907W, where the hotand dry air advected over the moisture axis in lowlevels.
The third necessary ingredient, the lifting mecha-nism, was provided by the leading, strong southernshort-wave trough. As shown by Nielsen and Igau(1993), the squall line was clearly a prefrontal squallline across the entire Gulf of Mexico, and this behaviorwas maintained across Cuba. The squall line precededthe polar front passage by several hours, producingonly wind shifts from S to SW and no significantchange in temperatures. Light rain showers and a windshift to NW with a rapid drop in temperature charac-terized frontal passage. Typical pressure changes wererecorded by barographs in western Cuba. The pressuretrace of Union de Reyes, Matanzas, (78327) (Fig. 10)shows the pressure jump associated with the squall line
(A) and the rapid rise that followed polar frontal pas-sage (B).
Doswell (1982) also suggests that two primaryfactors favoring development of severe weather areconvergence in low levels and moisture supply ( i.e.,pronounced moisture convergence) . The analysis ofthe moisture convergence field at the surface, objec-tively performed, with a grid length of 2.57, is shownin Fig. 11. It is evident that a moisture convergencezone lies over the northeast Gulf of Mexico and thewestern half of Cuba and surrounding waters. Sincethis variable is highly scale dependent, it might beexpected that on a smaller scale, with a higher datadensity than was available for this study, valuesshould be considerably greater. Thus, one may as-sume that these values indicate substantial moistureconvergence over the affected area, favorable to SLSdevelopment.
/ams v5077 0207 Mp 94 Friday Feb 23 07:52 PM AMS: Forecasting (March 96) 0207
94 VOLUME 11W E A T H E R A N D F O R E C A S T I N G
FIG. 7. FDMCM Stuve diagram of sounding for 0000 UTC 13 March 1993 at Cape Canaveral (74794).
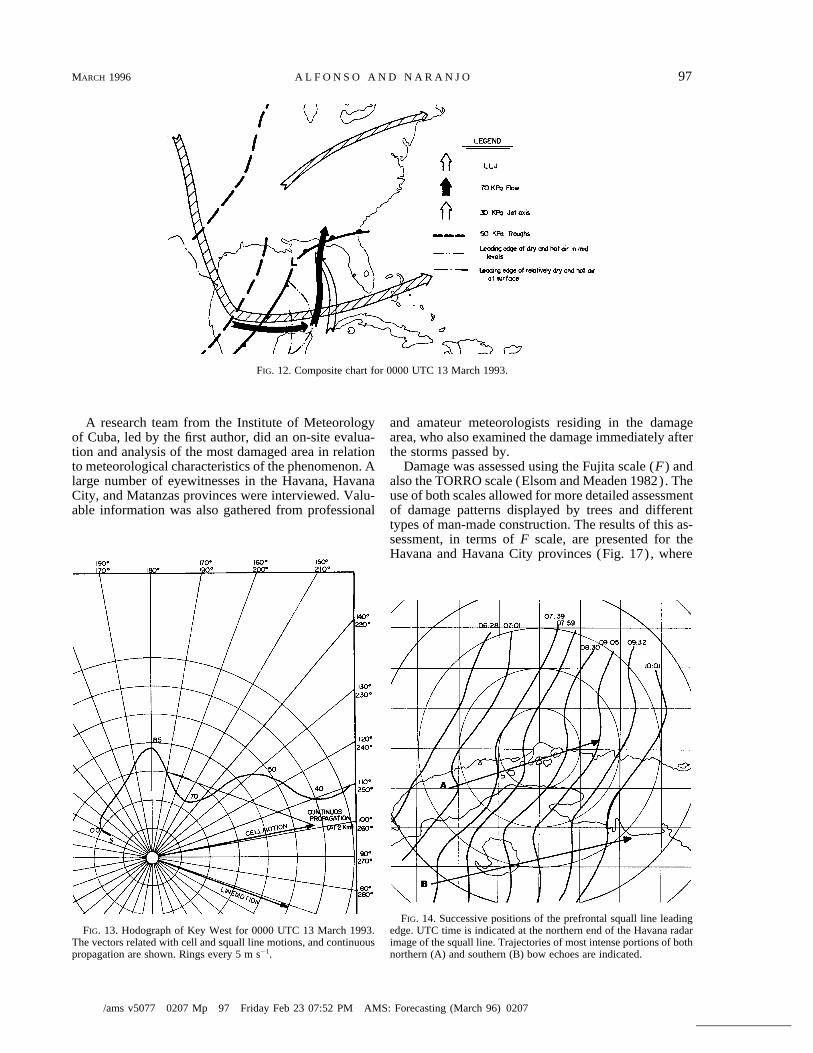
All of the elements identified in this section are il-lustrated in a composite chart (Fig. 12). The relativepositions of the surface low, fronts, and jets resemblethe idealized pattern of a midlatitude synoptic-scale sit-uation favorable for development of SLS, including su-percell thunderstorms and tornadoes (Barnes and New-ton 1986). However, in this case the role of the SJ doesnot seem significant since it was located far to thesouth. Although the exact positioning of the leadingedge of hot and dry air in midlevels is difficult to de-termine, it is likely that the intrusion of this current wasa key element in the SLS development over the easternGulf of Mexico, Florida, Cuba, and the extreme north-western Caribbean. Local conditions over the YucatanPeninsula and adjacent waters contributed to the rapidsouthward growth of the line from 0000 UTC 13March.
In brief, the synoptic environment was highly favor-able for the development of very deep convection andrelated severe weather on the eastern side of the Gulfof Mexico at 0000 UTC 13 March 1993, including mostclassical elements associated with severe weather de-velopment common to midlatitudes during winter orspring. However, because of the latitude, available hu-
midity in the lowest layer was higher than usual for thetime of year, and the air was considerably unstableahead of the squall line.
3. Development and structure of the squall line
a. Formation
The squall line appeared to form by a back-buildingprocess (Bluestein and Jain 1985). Building to thesouth was rapid after the squall line passed to the northof the Yucatan Plateau, such that when the line reachedwestern Cuba it already extended into the northwesternCaribbean Sea and its southward growth continued forseveral hours. At 0000 UTC 13 March the environmentinto which the squall line was moving was typical ofthat associated with the back-building process. TheKey West, Florida, hodograph was sharply curved withanticyclonic veering in levels below 70 kPa, as shownin Fig. 13. It is similar to the mean sounding for thistype of squall line (Bluestein and Jain 1985).
Another typical characteristic of back-building lines,also described by Bluestein and Jain (1985), very ev-ident in this case, is the displacement by virtue of con-

/ams v5077 0207 Mp 95 Friday Feb 23 07:52 PM AMS: Forecasting (March 96) 0207
95MARCH 1996 A L F O N S O A N D N A R A N J O
FIG. 8. Same as Fig. 2 except for 70 kPa. Isodrosotherm(dotted and dashed) every 57C over the Gulf of Mexico and ad-jacent areas.
FIG. 9. Same as Fig. 6 except at Mexico City (76679).
tinuous cell propagation, as also suggested by Fig. 13.The discrete propagation vector had an almost nullvalue. Conversely, the continuous propagation vectorat the height of 2 km reached 27 m s01 in the oppositedirection to the surface wind. The individual cells weremoving from 2577 at 28 m s01 , while the flow in thecloud layer was from 2427 at 34 m s01 .
b. Structure
The Havana radar (MRL, 10 cm) plan position in-dicator sequence from 0500 to 1000 UTC 13 Marchindicated that the squall line consisted of a line-echowave pattern (Nolen 1959) with a series of bow echoes(Fujita and Caracena 1977). A similar structure wasobserved by radars over Florida (STORM DATA1993). These echoes were very persistent and intense.The two bow echoes that affected western Cuba andthe Isle of Youth–central Cuba retained their commashape and identity during the entire 5 h they were ob-served by Havana radar (Fig. 14). The echoes reachedheights up to 16.3 km and intensities as high as 70 dBZduring the period of maximum intensity over the west-ernmost provinces of Cuba.

/ams v5077 0207 Mp 96 Friday Feb 23 07:52 PM AMS: Forecasting (March 96) 0207
96 VOLUME 11W E A T H E R A N D F O R E C A S T I N G
FIG. 11. Surface moisture convergence in g kg01 h01
times 10 for 0000 UTC 13 March 1993.
FIG. 10. Barograph trace for 12–14 March 1993 at Union de Reyes, Matanzas.Pressure jump line passage, A. Polar front passage, B.
The Key West hodograph (Fig. 13) might also beconsidered typical for supercells. In fact, in the lowestlayer (specifically at the surface) a wind with an east-erly component is present resembling soundings asso-ciated with supercells, and the cell motion is clearly tothe right of all winds shown, also characteristic of su-percells. As stated by Johns and Doswell (1992), su-percell circulations ‘‘can occur within a broad range ofstorm structures.’’ Several tornadoes were observed inFlorida north of 277N. One of the tornadoes attainedF3 intensity, and the other traversed a 30-mile-longpath. This second event was within the range of theMelbourne, Florida, Doppler radar and exhibited a me-socyclone circulation. The tornadoes were apparentlyrelated with supercell thunderstorms embedded in alarge bow echo that rapidly moved over Florida(STORM DATA 1993). Farther to the south, oversouth Florida and Cuba, no tornadoes occurred but verystrong damaging winds were recorded.
Storm-relative helicity (H ) (Davies-Jones et al.1990) is considered a crucial parameter for supercellthunderstorm occurrence. At 0000 UTC 13 March highH values were indicated by Florida soundings in rela-tionship with later observed storm motions. In partic-ular, H computed from the Key West sounding for thebow-echo movement over Cuba reached 402 m2 s02 .Therefore, the squall line structure resembles those cor-responding to the ‘‘dynamic pattern’’ described byJohns (1993) with the parameters that promote meso-cyclone development sufficiently strong to produce iso-lated supercell circulations associated with a portion ofthe bow-echo structure.
4. Storm-scale analysisFigure 15 shows the geography, topography, and key
locations of the area of western and central Cuba af-
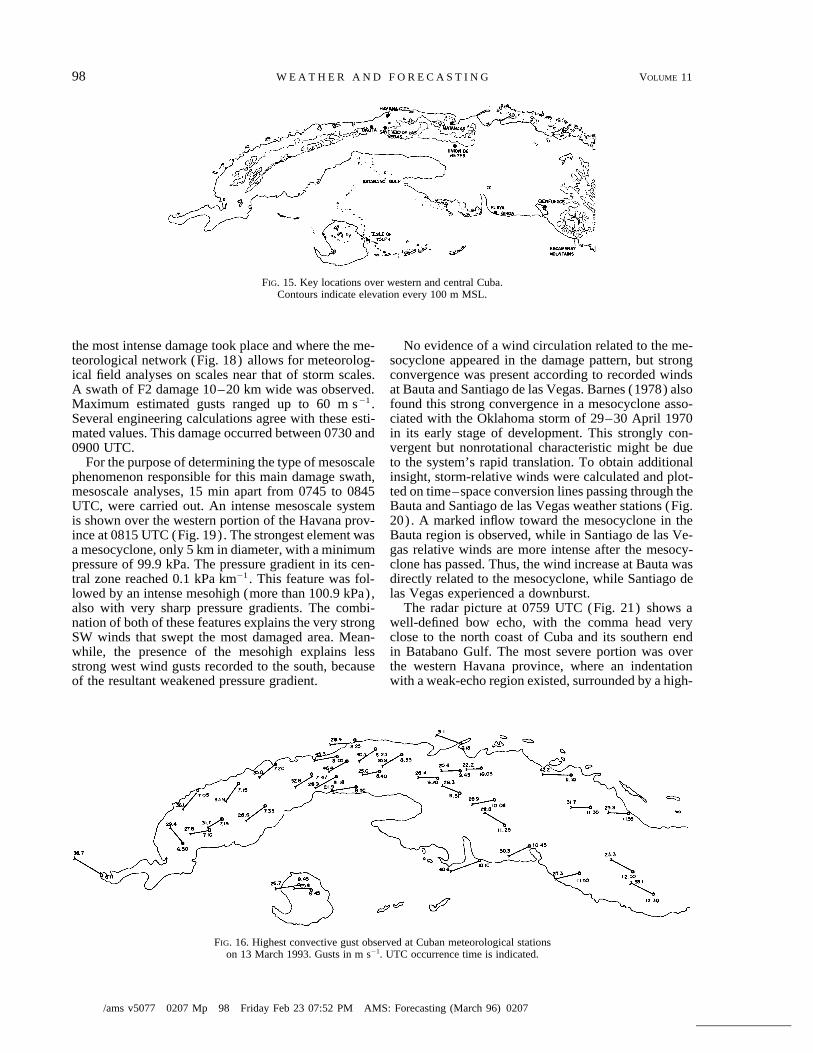
fected by squall line. The direction, speed, and time ofthe highest gusts recorded during squall line passageare shown in Fig. 16. Except for the stations of Bautaand Santiago de las Vegas (discussed later in this sec-tion), there were no indications that wind gusts wereassociated with mesoscale cyclones at the surface butrather with a typical pressure jump line, clearly re-flected by 0.2–0.5-kPa pressure rises in 15-min periodson the barograph traces (as shown in Fig. 10). The 25m s01 threshold value for an SLS was greatly exceededat most of the meteorological stations. Thus, most ofthe individual local storms in the line fit the SLS cat-egory. Stations with gusts under 25 m s01 were locatednear the southern end of the northern bow echo.
/ams v5077 0207 Mp 97 Friday Feb 23 07:52 PM AMS: Forecasting (March 96) 0207
97MARCH 1996 A L F O N S O A N D N A R A N J O
FIG. 12. Composite chart for 0000 UTC 13 March 1993.
FIG. 14. Successive positions of the prefrontal squall line leadingedge. UTC time is indicated at the northern end of the Havana radarimage of the squall line. Trajectories of most intense portions of bothnorthern (A) and southern (B) bow echoes are indicated.
FIG. 13. Hodograph of Key West for 0000 UTC 13 March 1993.The vectors related with cell and squall line motions, and continuouspropagation are shown. Rings every 5 m s01.
A research team from the Institute of Meteorologyof Cuba, led by the first author, did an on-site evalua-tion and analysis of the most damaged area in relationto meteorological characteristics of the phenomenon. Alarge number of eyewitnesses in the Havana, HavanaCity, and Matanzas provinces were interviewed. Valu-able information was also gathered from professional
and amateur meteorologists residing in the damagearea, who also examined the damage immediately afterthe storms passed by.
Damage was assessed using the Fujita scale (F) andalso the TORRO scale (Elsom and Meaden 1982). Theuse of both scales allowed for more detailed assessmentof damage patterns displayed by trees and differenttypes of man-made construction. The results of this as-sessment, in terms of F scale, are presented for theHavana and Havana City provinces (Fig. 17), where
/ams v5077 0207 Mp 98 Friday Feb 23 07:52 PM AMS: Forecasting (March 96) 0207
98 VOLUME 11W E A T H E R A N D F O R E C A S T I N G
FIG. 15. Key locations over western and central Cuba.Contours indicate elevation every 100 m MSL.
FIG. 16. Highest convective gust observed at Cuban meteorological stationson 13 March 1993. Gusts in m s01. UTC occurrence time is indicated.
the most intense damage took place and where the me-teorological network (Fig. 18) allows for meteorolog-ical field analyses on scales near that of storm scales.A swath of F2 damage 10–20 km wide was observed.Maximum estimated gusts ranged up to 60 m s01 .Several engineering calculations agree with these esti-mated values. This damage occurred between 0730 and0900 UTC.
For the purpose of determining the type of mesoscalephenomenon responsible for this main damage swath,mesoscale analyses, 15 min apart from 0745 to 0845UTC, were carried out. An intense mesoscale systemis shown over the western portion of the Havana prov-ince at 0815 UTC (Fig. 19). The strongest element wasa mesocyclone, only 5 km in diameter, with a minimumpressure of 99.9 kPa. The pressure gradient in its cen-tral zone reached 0.1 kPa km01 . This feature was fol-lowed by an intense mesohigh (more than 100.9 kPa),also with very sharp pressure gradients. The combi-nation of both of these features explains the very strongSW winds that swept the most damaged area. Mean-while, the presence of the mesohigh explains lessstrong west wind gusts recorded to the south, becauseof the resultant weakened pressure gradient.
No evidence of a wind circulation related to the me-socyclone appeared in the damage pattern, but strongconvergence was present according to recorded windsat Bauta and Santiago de las Vegas. Barnes (1978) alsofound this strong convergence in a mesocyclone asso-ciated with the Oklahoma storm of 29–30 April 1970in its early stage of development. This strongly con-vergent but nonrotational characteristic might be dueto the system’s rapid translation. To obtain additionalinsight, storm-relative winds were calculated and plot-ted on time–space conversion lines passing through theBauta and Santiago de las Vegas weather stations (Fig.20). A marked inflow toward the mesocyclone in theBauta region is observed, while in Santiago de las Ve-gas relative winds are more intense after the mesocy-clone has passed. Thus, the wind increase at Bauta wasdirectly related to the mesocyclone, while Santiago delas Vegas experienced a downburst.
The radar picture at 0759 UTC (Fig. 21) shows awell-defined bow echo, with the comma head veryclose to the north coast of Cuba and its southern endin Batabano Gulf. The most severe portion was overthe western Havana province, where an indentationwith a weak-echo region existed, surrounded by a high-

/ams v5077 0207 Mp 99 Friday Feb 23 07:52 PM AMS: Forecasting (March 96) 0207
99MARCH 1996 A L F O N S O A N D N A R A N J O
FIG. 17. The F-scale assessments for damage experiencedover the Havana and Havana City provinces.
FIG. 18. Locations of the meteorological stations of the Havanaand Havana City networks. Block 78 numbers are indicated.
reflectivity area, suggesting the presence of extreme in-flow and a mesocyclone at the leading edge of the bowecho. Stumpf and Burgess (1993) reported the pres-ence of mesocyclones related with bow echoes in asimilar location. The position of indentation corre-sponds very well with the estimated location of surfacemesocyclone at 0800 UTC, west-southwest of Bauta.Strong winds affected Bauta before any rain was re-corded. Thus, the major damage was attributable to themesocyclone of a supercell embedded in the bow-echostructure. There also appears to be a rear-inflow notch
(or weak echo region) to the south of the inflow notch(Fig. 21), and it was likely associated with the mostintense downburst winds (Przybylinski and Decaire1985), as observed in Santiago de las Vegas, wherestrong winds followed a hail and rain episode.
Another area of very significant damage was relatedto the bow echo that affected the Isle of Youth andafterward reached Playa Giron and Cienfuegos City,where damaging gusts corresponding to F2 scale (inexcess of 50 m s01) were reported. In Cienfuegos Citydamage was very similar to that found in the destruc-

/ams v5077 0207 Mp 100 Friday Feb 23 07:52 PM AMS: Forecasting (March 96) 0207
100 VOLUME 11W E A T H E R A N D F O R E C A S T I N G
FIG. 19. Mesoscale pressure analysis every 0.1 kPa for 0815 UTC13 March 1993 over the Havana and Havana City provinces.
FIG. 20. Storm-relative winds at 0800 UTC 13 March 1993. The upper section corresponds tothe Bauta meteorological station, and the lower section to the Santiago de las Vegas meteorologicalstation. Winds with one flag, full-barb, and half-barb denote 25, 5, and 2.5 m s01, respectively.
tion swath in the Havana province. There are no indi-cations of mesocyclone development in the records ofwind and pressure of meteorological stations in thisarea. The strongest damage in the Isle of Youth waslocated in the extreme northeast portion of the island.Apparently, the strongest portion of the second bowecho produced a family of very strong downbursts.
The extent of the area covered by 26 m s01 gustsappears to include all of central and southern Floridaand all of the western and the northern coast of Cuba.The southernmost intense damage swath in Cuba (Isle
of Youth to Cienfuegos City) appears to be connectedto the aforementioned 26 m s01 area. Therefore, thelarge-scale event could be considered a ‘‘serial der-echo’’ (Johns and Hirt 1987).
5. Conclusions
An intense, prefrontal squall line formed over theGulf of Mexico on the afternoon of 13 March 1993 ina very favorable synoptic environment related to awell-defined polar outbreak and strong cyclogenesis.

/ams v5077 0207 Mp 101 Friday Feb 23 07:52 PM AMS: Forecasting (March 96) 0207
101MARCH 1996 A L F O N S O A N D N A R A N J O
FIG. 21. Digitized Havana radar reflectivity depiction for 0759UTC 13 March 1993. The arrow denotes possible mesocyclone, in-flow region shown as an indentation at the leading edge of the de-veloping bow echo.
The event exhibited similar characteristics with theclassic Great Plains tornado outbreak (Barnes andNewton 1986). Nevertheless, the structure of squalllines resembles rather than corresponds to the dynamicpattern described by Johns (1993). Apparently, thiscase corresponds to a blend of the two types of synopticpatterns. Further, the differences of both patterns ap-pear to be rather subtle. Such events may affect thesouthern Great Plains and gulf coastal states but rarelyhit Cuba.
Significant differences from the most common pat-terns and behavior reported in other severe weather out-breaks in Cuba in the cool season (Cordoba and Al-fonso 1992) were found:
• The cold front was strong and well defined, relatedto a deep long-wave trough. Short-wave troughs in theNBPJ and SBPJ came into phase.
• There was a nonoccluded low center that devel-oped and moved rapidly.
• The role of STJ in the process was unclear, sincethe line formed far north of the STJ axis.
Necessary conditions for deep convection were pres-ent, and moisture convergence showed its effectivenessto indicate the areas where SLS development shouldbe expected. Due to the geographical location, moistureavailability was high for the time of year.
The squall line was a back-building type and formedin a very favorable environment for such events. A pos-sible explanation for the rapid expansion of the pre-frontal squall lines, frequently observed in the south-eastern Gulf of Mexico, can be given. The YucatanPlateau is a source of very warm and dry air, extendinginto the Gulf of Mexico when the steering flow is fromsouth to southwest. This situation seems to have somecorrelation with the arrival in Texas of dry air formedover the northern Mexico Plateau. Thus, it might beanalogous to the development of the dryline frequentlyobserved over the southern plains of the United States.
Additionally, in this case, dry, hot, and high-lapse-rate air from the Mexico Plateau was advected eastwardby strong winds in the layer 70–50 kPa from its sourceacross the Gulf of Mexico. The movement of this aircurrent at midlevels over the eastern gulf was consid-ered a key element for the development of the LS thataffected Florida and western and central Cuba.
The most intense phenomena were associated withbow echoes, with their central portion characterized byquasi-linear, very intense winds from the southwest.Further, the most significant damage in the Havanaprovince was along the track of a mesolow circulationembedded in the northern part of the bow echo. A veryintense pressure gradient was associated with the me-socyclone circulation and with its interaction with apowerful mesohigh. The intensity of the mesocyclonemay be considered strong, and the helicity value of KeyWest (402 m2 s02) appears to support this assessment.
Based on the National Meteorological Center’sNested Grid Model forecasts for 24 and 48 h, and onthe previous knowledge acquired in Cuba regardingprefrontal squall line formation and displacement overthe Gulf of Mexico, meteorologists at the Forecast Cen-ter of Matanzas issued a special warning on the possibleoccurrence of the squall line at 2000 UTC 12 March.This warning had a lead time of up to 13 h, since thesquall line reached Matanzas at 0900 UTC of the fol-lowing day.
The reported damage was the largest ever attributedto a squall line in Cuba, and the extent of the damagearea was greater than ever before. However, the localsevere weather phenomena were not as intense as thoseobserved in other cases.
Acknowledgments. This work is part of the researchprogram ‘‘Very Short-Range Forecast of DangerousPhenomena Related with Convective Clouds’’ of theInstitute of Meteorology, Ministry of Science, Tech-

/ams v5077 0207 Mp 102 Friday Feb 23 07:52 PM AMS: Forecasting (March 96) 0207
102 VOLUME 11W E A T H E R A N D F O R E C A S T I N G
nology and Environment, Cuba. We are very gratefulto Dr. Robert Maddox, Dr. Robert Johns, and Dr. Os-waldo Garcıa for their interest, comments, and sugges-tions and for providing us with valuable materials. Dr.Maddox also assisted by making the drafting facilitiesof NSSL available to us. We would also like to expressour thanks to Dr. John P. Monteverdi for his encour-agement and support during the reviewing process ofthe manuscript. Jorge Rodriguez gave drafting assis-tance.
REFERENCES
Alfonso, A. P., 1986: Severe weather outbreak in Cuba on 8 February1978. Part 1: Outbreak description and synoptic setting. Cienc.Tierra Espacio, 10, 101–114., 1988: Severe local storms in Cuba. Climatology and funda-mentals for forecasting. Ph.D. dissertation, Academia de Cien-cias de Cuba, 112 pp., and L. Cordoba, 1987: The 16 February 1983 mesocyclonesin the Havana provinces. Reporte Investigacion, 16, Instituto deMeteorologıa, Academia de Ciencias de Cuba, 26 pp.
Barnes, S. L., 1978: Oklahoma thunderstorms on 29–30 April 1970.Part II: Radar-observed merger of hook echoes. Mon. Wea. Rev.,106, 685–696., and C. W. Newton, 1986: Thunderstorms in the synoptic set-ting. Thunderstorm Morphology and Dynamics, 2d ed., E. Kes-leer, Ed., University of Oklahoma Press, 75–112.
Bluestein, H. B., and M. H. Jain, 1985: Formation of mesoscale linesof precipitation: Severe squall lines in Oklahoma during thespring. J. Atmos. Sci., 42, 1711–1732.
Cordoba, L., and A. P. Alfonso, 1992: Prefrontal systems in westernCuba. Rev. Cubana Meteor., 5, 67–82.
Davies-Jones, R. P., D. Burgess, and M. Foster, 1990: Test of helicityas a tornado forecast parameter. Preprints, 16th Conf. on SevereLocal Storms, Kananaskis Park, AB, Canada, Amer. Meteor.Soc., 588–592.
Doswell, C. A., III, 1982: The operational meteorology of convectiveweather. Volume I: Operational mesoanalysis. NOAA Tech.Memo. NWS NSSFC-5, 159 pp., 1987: The distinction between large-scale and mesoscale con-tribution to severe convection: A case study example. Wea.Forecasting, 2, 3–16.
Elsom, D. M., and G. T. Meaden, 1982: Suppression and dissipationof weak tornadoes in metropolitan areas: A case study of GreaterLondon. Mon. Wea. Rev., 110, 745–756.
Fujita, T. T., and F. Caracena, 1977: An analysis of three weather-relatedaircraft accidents. Bull. Amer. Meteor. Soc., 58, 1164–1181.
Galway, J. G., 1956: The lifted index as a predictor of latent insta-bility. Bull. Amer. Meteor. Soc., 37, 528–529.
Garinger, L. P., and K. R. Knupp, 1993: Seasonal tornado climatol-ogy for the southeastern United States. The Tornado: Its Struc-ture, Dynamics, Prediction, and Hazards, Geophys. Monogr.,No. 79, American Geophysical Union, 445–450.
Hane, C. E., 1986: Extratropical squall lines and rainbands. Meso-scale Meteorology and Forecasting, P. Ray, Ed., Amer. Meteor.Soc., 359–389.
Johns, R. H., 1993: Meteorological conditions associated with bowecho development in convective storm. Wea. Forecasting, 8,294–299., and W. D. Hirt, 1987: Derechos: Widespread convectively in-duced windstorms. Wea. Forecasting, 2, 32–49., and C. A. Doswell III, 1992: Severe local storm forecasting.Wea. Forecasting, 7, 588–612.
Keyser, D., and T. N. Carlson, 1984: Transverse ageostrophic cir-culations associated with elevated mixed layers. Mon. Wea.Rev., 112, 2456–2478.
Lannici, J. M., and T. T. Warner, 1991: A synopticclimatology of theelevated mixed-layer inversion over the southern Great Plainsin spring. Part I: Structure, dynamics, and seasonal evolution.Wea. Forecasting, 6, 181–197.
McNulty, R. P., 1978: On upper tropospheric kinematics and severeweather occurrence. Mon. Wea. Rev., 106, 662–672.
Miller, R. C., 1972: Notes on analysis and severe-storm forecastingprocedures of the Air Force Global Weather Central. AirWeather Service Tech. Rep. 200 (Rev.) , Air Weather Service,Scott Air Force Base, IL, 190 pp.
Nielsen, J. W., and R. C. Igau, 1993: A synoptic overview of theintensification of the blizzard of ’93. Cooperative Institute forApplied Meteorological Studies, Texas A&M University, 18 pp.
Nolen, R. H., 1959: A radar pattern associated with tornadoes. Bull.Amer. Meteor. Soc., 40, 277–279.
Ortiz, R., and R. Ortiz, Jr., 1940: The Bejucal Disaster. Diario de laMarina, Diciembre 31, pp. 1.
Przybylinski, R. W., and D. M. deCaire, 1985: Radar signatures as-sociated with the derecho, a type of mesoscale convective sys-tem. Preprints, 14th Conf. on Severe Local Storms, Indianapolis,IN, Amer. Meteor. Soc., 228–231.
Stumpf, G. L., and D. W. Burgess, 1993: Observations of lower-troposphere misocyclones along the leading edge of a bow echothunderstorm. Preprints, 26th Int. Conf. on Radar Meteorology,Norman, OK, Amer. Meteor. Soc., 215–217.
Uccellini, L. W., 1990: The relationship between jet streaks and se-vere convective storm systems. Preprints, 16th Conf. on SevereLocal Storms, Kananaskis Park, AB, Canada, Amer. Meteor.Soc., 121–129.