thailand results review - rhb securities - osk188.co.th results review ... state street bank and...
TRANSCRIPT
Thailand Results Review 4Q15: missed target
See important disclosures at the end of this report 1
Powered by the EFA Platform
23 February 2016 Communications | Media
Major Cineplex Buy (Maintained)
Target Price: THB32.70 Price: THB24.30
Super Heroes Are Coming Market Cap: USD607m Bloomberg Ticker: MAJOR TB
We maintain BUY with a higher THB32.70 TP on Major Cineplex, which should be driven by more potential box office hits, decent growth in high-margin businesses and improved margins over the next two years. Expansion into the untapped fast-growing CLMV countries and an increase in the proportion of high-margin revenue should fuel its long-term growth.
Share Data Avg Daily Turnover (THB/USD) 62.1m/1.73m 52-wk Price low/high (THB) 24.3 - 36.0 Free Float (%) 49 Shares outstanding (m) 893 Estimated Return 35% Shareholders (%) Vicha Poonwaralak 34.1 Thai NVDR 10.1 State Street Bank and Trust 6.3 Share Performance (%) YTD 1m 3m 6m 12m Absolute (31.1) (19.0) (22.9) (23.5) (18.3) Relative (33.6) (23.3) (18.2) (19.2) (0.8) Source: Bloomberg
Source: Bloomberg
Source: Bloomberg
Three growth areas for this year: i) decent cinema income from strong movie lines mostly the Super Heroes series (Deadpool, Captain America 3, Batman vs Superman, X-men) and an increase in new cinemas, ii) healthy high-margin advertising (ad) income and concession, and iii) improved margins. Also, we estimate modest gains from sales of the remaining 4% investment in PVR Cinema (PVRL IN, NR) at THB150m pa in 2016-2018. We forecast bottomline to grow 8% pa for 2016-2017.
Going to cinemas has become part of Thai people’s lifestyle, in addition to shopping, eating and socialising. Despite the fast-growing digital media, we believe the cinema business can maintain its strength as it offers newly-released movies and new experience watching movies in 3D, 4D, Imax, etc, which cannot be found elsewhere. Digital technology constraints with slow development of 4G networks and a low penetration rate of smartphone nationwide are likely to limit the access of online movies at least in the medium term. Major Cineplex’s long-term growth should be driven by its expansion into the untapped fast-growing countries like Cambodia, Laos, Myanmar and Vietnam (CLMV), an increase in the proportion of high-margin revenue from ad income, value-added hi-tech cinemas and content production.
4Q15 earnings: missed target (THBm) 4Q15 3Q15 QoQ 4Q14 YoY Comments
Revenue 1,976 2,189 -9.8% 2,124 -7.0% Below expected box office income
Gross profit 671 739 -9.2% 730 -8.1% GPM (%) 34.0% 33.8% 34.4 % EBITDA 476 543 -12.3% 480 -0.8% EBITDA (%) 24.1% 24.8% 22.6% Core earnings 138 209 -34.0% 179 -22.9% No extra gains
Source: Company data, RHB
Maintain BUY with a new THB32.70 TP. Our revised SOP-based 2016 TP of THB32.70 (from THB38.00) comprises: i) THB31.00 from its core business using DCF (2% TG, 9% WACC), and ii) THB1.70 reflecting potential gains on its investment portfolio. Going forward, we expect modest earning growth, healthy ROEs and sustainable handsome yields. Key risks include: i) a slower-than-expected recovery in domestic consumption, ii) an online movie trend, and iii) soft upcountry economy affecting entertainment spending.
Source: Company data, RHB
Forecasts and Valuations Dec-13 Dec-14 Dec-15 Dec-16F Dec-17FTotal turnover (THBm) 7,713 8,623 8,580 9,248 10,063Reported net profit (THBm) 1,052 1,086 1,171 1,263 1,361Recurring net profit (THBm) 830 978 934 1,113 1,211Recurring net profit growth (%) 21.7 17.8 (4.5) 19.1 8.8Recurring EPS (THB) 0.94 1.10 1.05 1.25 1.36DPS (THB) 1.00 1.05 1.15 1.20 1.22Recurring P/E (x) 26.0 22.1 23.2 19.5 17.9P/B (x) 3.53 3.42 3.30 3.19 3.07P/CF (x) 9.7 9.8 11.0 10.2 9.1Dividend Yield (%) 4.1 4.3 4.7 4.9 5.0EV/EBITDA (x) 7.13 5.96 6.36 6.19 5.50Return on average equity (%) 17.6 17.5 18.1 18.9 19.6Net debt to equity (%) 70.5 62.4 65.6 73.6 64.2Our vs consensus EPS (adjusted) (%) (10.9) (13.0)
90
108
126
23
28
33
Major Cineplex (MAJOR TB)Price Close Relative to Stock Exchange of Thailand Index (RHS)
2
4
6
8
10
12
Feb-
15
Apr
-15
Jun-
15
Aug
-15
Oct
-15
Dec
-15
Vol m
15
20
25
30
35
Jan-12 Jan-13 Jan-14 Jan-15 Jan-16
Core rolling P/E (x)
Analysts Naruedom Mujjalinkool 66 2862 9229 [email protected] Wanida Geisler +66 2862 9748 [email protected]

Major Cineplex Thailand Results Review
23 February 2016 Communications | Media
See important disclosures at the end of this report 2
Financial Exhibits
Source: Company data, RHB
Source: Company data, RHB
Source: Company data, RHB
Source: Company data, RHB
Profit & Loss (THBm) Dec-13 Dec-14 Dec-15 Dec-16F Dec-17FTotal turnover 7,713 8,623 8,580 9,248 10,063 Cost of sales (5,011) (5,475) (5,553) (5,928) (6,409) Gross profit 2,702 3,148 3,028 3,320 3,655 Other operating costs (1,781) (2,064) (2,013) (2,127) (2,340) Operating profit 921 1,084 1,015 1,193 1,315 EBITDA 1,986 2,330 2,241 2,363 2,559 Depreciation of fixed assets (1,065) (1,245) (1,226) (1,170) (1,244) Operating profit 921 1,084 1,015 1,193 1,315 Net income from investments 189 199 237 240 240 Other recurring income 118 123 148 158 169 Interest expense (149) (173) (155) (156) (158) Other non-recurring income 221 108 237 150 150 Pre-tax profit 1,301 1,342 1,482 1,585 1,716 Taxation (276) (271) (300) (309) (339) Minority interests 27 15 (11) (13) (15) Reported net profit 1,052 1,086 1,171 1,263 1,361 Recurring net profit 830 978 934 1,113 1,211
Key Ratios Dec-13 Dec-14 Dec-15 Dec-16F Dec-17FRevenue growth (%) 10.8 11.8 (0.5) 7.8 8.8Operating profit growth (%) 57.9 17.8 (6.4) 17.5 10.2Recurring net profit growth (%) 21.7 17.8 (4.5) 19.1 8.8Recurrent EPS growth (%) 21.3 17.7 (4.7) 18.9 8.8Gross margin (%) 35.0 36.5 35.3 35.9 36.3Operating EBITDA margin (%) 25.7 27.0 26.1 25.6 25.4Operating margin (%) 11.9 12.6 11.8 12.9 13.1Recurring net profit margin (%) 10.8 11.3 10.9 12.0 12.0Return on average assets (%) 8.4 7.9 8.3 8.6 9.1Return on average equity (%) 17.6 17.5 18.1 18.9 19.6Net debt to equity (%) 70.5 62.4 65.6 73.6 64.2Interest cover (x) 6.18 6.27 6.55 7.65 8.30Capex/Free cash flow (%) 84.0 32.9 63.8 65.3 25.3BVPS (THB) 6.88 7.11 7.37 7.61 7.93DPS (THB) 1.00 1.05 1.15 1.20 1.22Dividend payout ratio (%) 82.7 84.0 83.8 83.8 83.8Free cash flow per share (THB) 0.40 1.66 0.80 0.83 1.98
Cash flow (THBm) Dec-13 Dec-14 Dec-15 Dec-16F Dec-17FOperating profit 921 1,084 1,015 1,193 1,315 Depreciation & amortisation 1,065 1,245 1,226 1,170 1,244 Change in working capital (580) 155 22 (72) 5 Other operating cash flow 1,241 163 165 295 304 Operating cash flow 2,647 2,647 2,428 2,586 2,868 Interest paid (149) (173) (155) (156) (158) Tax paid (276) (271) (300) (309) (339) Cash flow from operations 2,222 2,204 1,973 2,120 2,370 Capex (1,866) (725) (1,259) (1,384) (600) Other new investments (1,360) (133) (150) (180) (189) Other investing cash flow (153) (159) (48) (183) (82) Cash flow from investing activities (3,379) (1,018) (1,457) (1,747) (870) Dividends paid (870) (912) (982) (1,050) (1,081) Proceeds from issue of shares (1) 51 50 - - Increase in debt 1,942 (231) 113 524 (400) Other financing cash flow 101 (11) 37 42 44 Cash flow from financing activities 1,172 (1,105) (782) (485) (1,437) Cash at beginning of period 481 496 577 312 201 Total cash generated 15 81 (265) (111) 63 Implied cash at end of period 496 577 312 201 264
Balance Sheet (THBm) Dec-13 Dec-14 Dec-15 Dec-16F Dec-17FTotal cash and equivalents 496 577 312 201 264 Inventories 175 154 183 201 211 Accounts receivable 1,159 1,307 1,181 1,204 1,228 Other current assets 307 343 355 372 391 Total current assets 2,137 2,382 2,030 1,979 2,094 Total investments 3,310 3,443 3,593 3,773 3,962 Tangible fixed assets 6,696 6,730 7,358 7,910 7,637 Total other assets 1,487 1,377 1,265 1,350 1,300 Total non-current assets 11,493 11,551 12,216 13,033 12,899 Total assets 13,629 13,932 14,246 15,011 14,993 Short-term debt 2,443 2,376 3,389 3,000 2,600 Accounts payable 1,736 1,899 1,908 1,956 2,004 Other current liabilities 172 267 183 192 202 Total current liabilities 4,352 4,542 5,480 5,148 4,806 Total long-term debt 2,352 2,188 1,287 2,200 2,200 Other liabilities 827 816 831 872 916 Total non-current liabilities 3,179 3,003 2,118 3,072 3,116 Total liabilities 7,530 7,546 7,598 8,220 7,922 Share capital 888 890 893 893 893 Retained earnings reserve 913 1,111 1,295 1,508 1,788 Other reserves 4,302 4,329 4,393 4,393 4,393 Shareholders' equity 6,103 6,331 6,581 6,793 7,073 Minority interests (4) 56 67 (2) (3) Other equity (0) 0 0 0 0 Total equity 6,099 6,387 6,648 6,792 7,071 Total liabilities & equity 13,629 13,932 14,246 15,011 14,993
Source: Company data, RHB Source: Company data, RHB
-10%
-5%
0%
5%
10%
15%
20%
25%
Dec-13 Dec-14 Dec-15 Dec-16F Dec-17F
Revenue growth vs Recurring net profit growth
Revenue growth Recurring net profit growth
12.0%
14.0%
16.0%
18.0%
20.0%
22.0%
24.0%
26.0%
28.0%
Dec-13 Dec-14 Dec-15 Dec-16F Dec-17F
EBITDA margin vs Net profit margin
Operating EBITDA margin Net profit margin

Major Cineplex Thailand Results Review
23 February 2016 Communications | Media
See important disclosures at the end of this report 3
Valuation And Recommendation Maintain BUY with a new THB32.70 TP. Our SOP-based 2016 TP of THB32.70 (from THB38.00) comprises: i) THB31.00 from its core business using DCF (2% TG, 9% WACC), and ii) THB1.70 reflecting potential gains on its investment portfolio.
Low multiples vs its peers’. Compared to its peers in Asia, Major Cineplex is trading lower in all categories average (P/E, P/BV and EV/EBITDA), while its ROEs and dividend yields are higher than its peers’ average (Figure 3).
Figure 1: Major Cineplex’s investment portfolio THBm 4Q15
Available for sale investment Book value 749
Investment in associates Book value 2,438
Major Cineplex investment: Holding % Market cap
Siam Future (NR) 24.55 2,617 Major Cineplex lifestyle leasehold property fund (NR) 33 1,459
PVRL 3.95 632
Total
4,708
Potential gains
1,522
Per share (THB)
1.70
Source: Company data
Figure 2: Major Cineplex’s DCF valuation FYE Dec (THBm) 2016F 2017F 2018F 2019F 2020F 2021F 2022F 2023F 2024F 2025F
EBIT (1-T) 1,042 1,145 1,235 1,328 1,436 1,529 1,626 1,771 1,889 2,018 +Depreciation & Amortisation 1,170 1,244 1,307 1,372 1,399 1,427 1,454 1,508 1,563 1,691
-Capex 1,420 1,020 1,020 920 920 920 920 920 920 830
-Chg. In NWC (15) (16) (16) (16) (17) (17) (17) (17) (18) (18)
FCF
807
1,385
1,538
1,796
1,932
2,053
2,177
2,376
2,549
2,897
LT growth 2.0% WACC 9.0% Terminal value 42,216
Present value of net FCFF 12,673
NPV of terminal 19,437 Enterprise value 32,111 -Interest baring debt (4,676)
-Non controlling interest (67) +Cash 312
Equity value 27,679 DCF fair value 31.0
Source: Company data, RHB
Figure 3: Peer comparison Media Market
Cap Tickers P/E P/BV EV/EBITDA Div yield (%) ROE (%) Company USDm 16F 17F 16F 17F 16F 17F 16F 17F 16F 17F
Major Cineplex Group 634 MAJOR TB 20.5 19.0 3.3 3.2 6.7 5.9 4.7 4.7 18.6 19.2
PVR Ltd 496 PVRL IN 28.0 23.2 4.0 3.5 11.2 9.0 2.7 3.2 19.4 17.8
CJ CGV Co Ltd 562 079160 KS 32.2 24.3 4.6 3.8 13.6 11.3 3.5 3.8 15.2 17.1
Inox Leisure Ltd 282 INOL IN 18.1 13.4 2.2 1.9 7.7 6.2 n.a. n.a. 12.5 14.8
Average (Ex-Major Cineplex) 26.1 20.3 3.6 3.1 10.8 8.8 3.1 3.5 15.7 16.6
Source: Bloomberg, RHB

Major Cineplex Thailand Results Review
23 February 2016 Communications | Media
See important disclosures at the end of this report 4
Company Update Three keys growth driver for 2016 1) Strong movie lines. We expect cinema revenue grow 10.8% YoY in 2016 on the back of: i) many potential box office hits in 2016 that could generate more than THB100m movie revenue to the company (eg Captain America 3, Batman vs Superman, X-men, and Star Wars 8), ii) the full-year effect of the expansion of cinemas in prime areas (EmQuartier, Westgate and East Ville) in 2015, iii) the company’s continued cinema expansion target to 715 screens in 2016 from 601 screens in 2015 (Figure 5), and iv) more high-margin Thai movies. Last year, GTH (the country’s top movie production house) faced internal problems and subsequently split into two firms (GDH and T Moment) in early 2016. With the start-up of two new strong movie production houses, we expect more successful Thai movies this year.
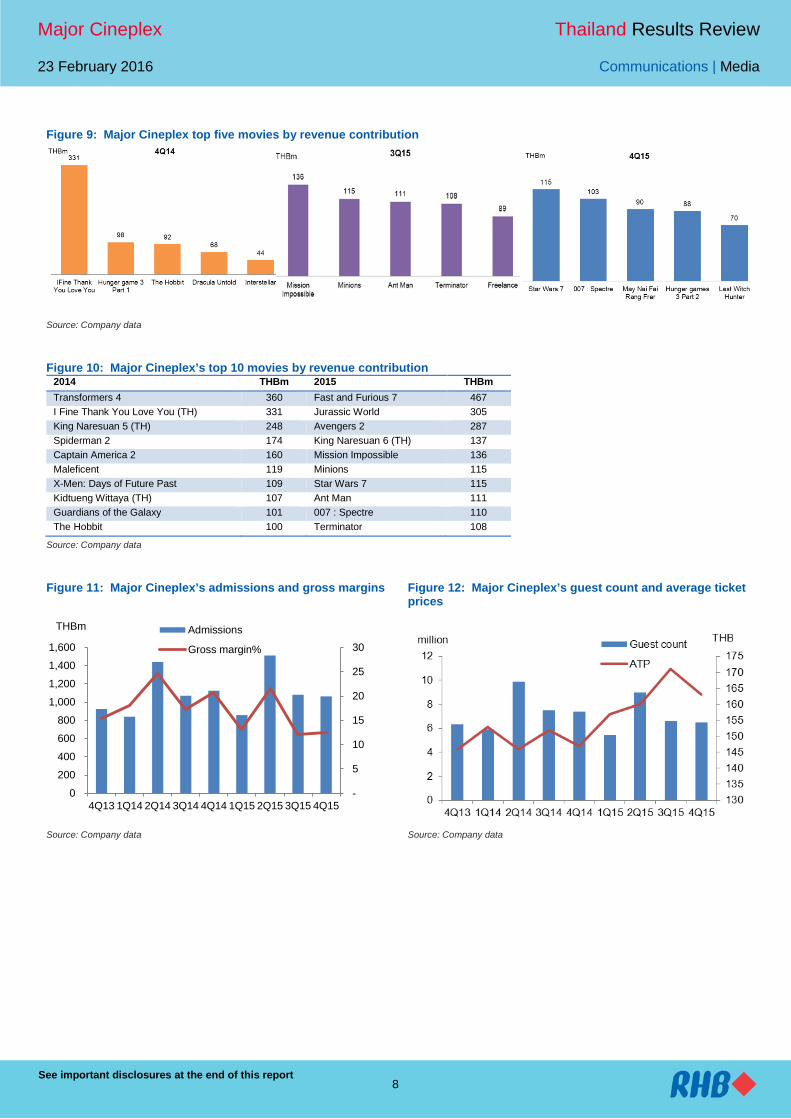
In view of more positive factors, cinemas’ guest count should improve and Major Cineplex should be able to maintain its average ticket price (ATP) at high levels (Figure 12). We note that Thailand’s average ATP is equivalent to ATP in other ASEAN countries like Laos, Cambodia, the Philippines, Indonesia and Vietnam, but significantly lower than Singapore’s.
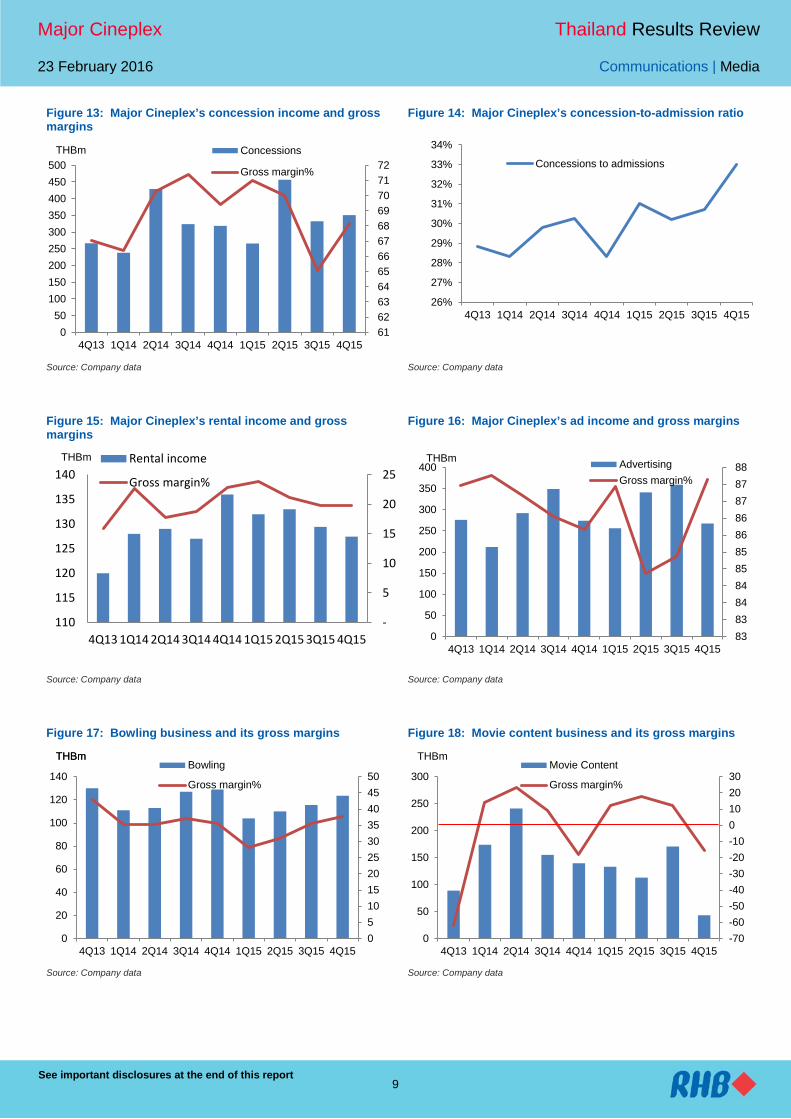
2) High-margin concession (food and beverage “F&B”)-to-admission income surge above 30%. In 4Q15, the company’s concession (F&B) income-to-admission income ratio surged to its peak of 33%. This year, we estimate the ratio at above 30%. Gross margin of this business has been very healthy at 70% on average (Figure 13).
3) Expect double-digit growth in high-margin cinema ad income. Despite sluggish overall ad expenditure (ex-TV segment) in 2015 (-2.5% YoY), Major Cineplex’s ad business still grew 8.6% YoY from the expansion of new branches. We believe this year could be another good year for cinema ad business given: i) its continued expansion of new screens to 715 from 601 in 2015, and ii) the addition of a new advertising platform, ie 524 e-ticketing machines.
Figure 4: Major Cineplex’s movie blockbusters
Source: Company data
Major Cineplex Thailand Results Review
23 February 2016 Communications | Media
See important disclosures at the end of this report 5
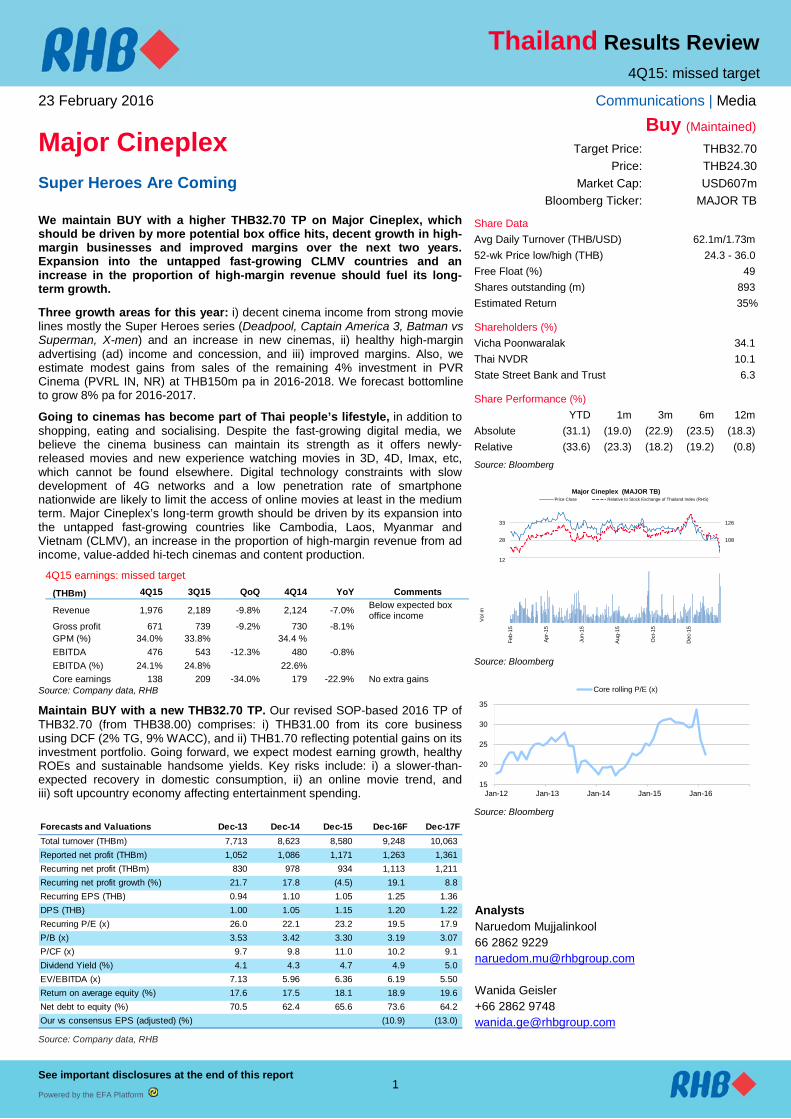
Figure 5: Major Cineplex’s screen expansion plan for 2016
Source: Company data
Rising margins and potential divestment gains should support earnings growth. We assume around 8-9% revenue growth pa over the next two year, mainly driven by its cinema, concession and ad businesses with a slight gross margin improvement to around 36% from 35%. As Major Cineplex has done well in controlling selling, general and administrative (SG&A) expense at THB2bn for the past two years, we assume SG&A expense-to-sales ratio of 23% for the next two years. The company’s cost-saving programmes include promoting e-ticketing and online booking as well as using a more computerised system in operations.
Moreover, the company expects to gradually dispose of its 3.95% holding in PVR Cinema, the largest multiplex chain in India, for a total gain of THB600m. Management expects to sell about 1% share per year for the next three years, generating gains of around THB150m per year. As a result, we anticipate Major Cineplex’s 2016 net profit to grow approximately 8% YoY to THB1.26bn.
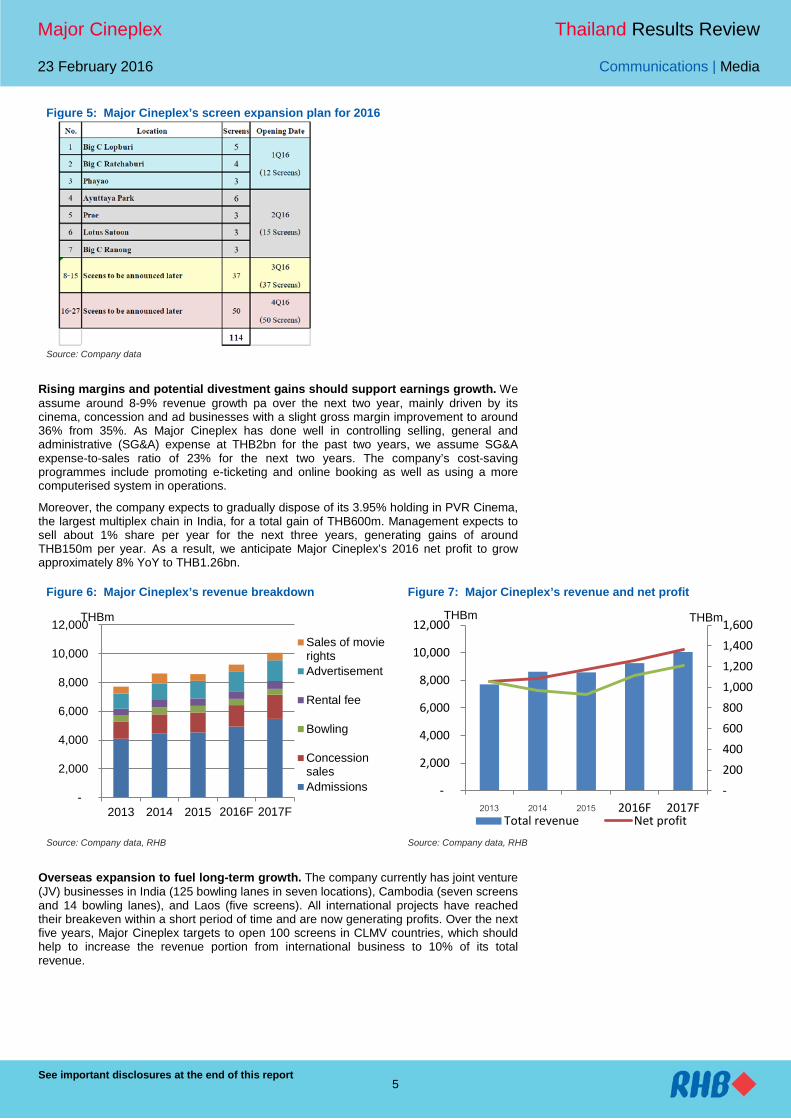
Figure 6: Major Cineplex’s revenue breakdown Figure 7: Major Cineplex’s revenue and net profit
Source: Company data, RHB Source: Company data, RHB
Overseas expansion to fuel long-term growth. The company currently has joint venture (JV) businesses in India (125 bowling lanes in seven locations), Cambodia (seven screens and 14 bowling lanes), and Laos (five screens). All international projects have reached their breakeven within a short period of time and are now generating profits. Over the next five years, Major Cineplex targets to open 100 screens in CLMV countries, which should help to increase the revenue portion from international business to 10% of its total revenue.
-
2,000
4,000
6,000
8,000
10,000
12,000
2013 2014 2015 2016F 2017F
Sales of movierightsAdvertisement
Rental fee
Bowling
ConcessionsalesAdmissions
THBm
- 200 400 600 800 1,000 1,200 1,400 1,600
-
2,000
4,000
6,000
8,000
10,000
12,000
2013 2014 2015 2016F 2017FTotal revenue Net profit
THBm THBm

Major Cineplex Thailand Results Review
23 February 2016 Communications | Media
See important disclosures at the end of this report 6
Key Risks Economic conditions. Major Cineplex’s business is highly dependent on private spending, consumer confidence and GDP growth. Management is still worried about domestic consumption, which may recover slower than expected. While it hopes that Thailand’s economy would start recovering in 1Q16, there are currently no signs of recovery in domestic consumption as yet.
Movie line-up is crucial. Since its main business is in cinemas, movie line-ups are crucial. Although the line-up this year appears to be strong, a recovery in domestic consumption is needed for Major Cineplex to achieve our 8% pa revenue growth target for 2016-2017.
Online movie trend. Online movies may be a fast-growing new trend in developed countries but not in Thailand. 4G technology nationwide will unlikely be ready until end-2016 and its speed is also not enough to accommodate smooth online movie viewing. Moreover, Thailand’s smartphone penetration is around 55%, of which only 20% is 4G-enabled smartphones capable of watching online movies. Going to cinemas has become part of Thai lifestyle apart from shopping, eating and socialising.
Upcountry exposure. At end-2015, Major Cineplex had 336 screens in Bangkok vs 253 in upcountry. The screen ratio is 57% Bangkok vs 43% upcountry, while revenue contribution ratio is 60% Bangkok vs 40% upcountry. Soft upcountry economy amid weak farm income and high household debt may have some impact on the company even though its target group is the mid- to high-end segment.
Major Cineplex Thailand Results Review
23 February 2016 Communications | Media
See important disclosures at the end of this report 7
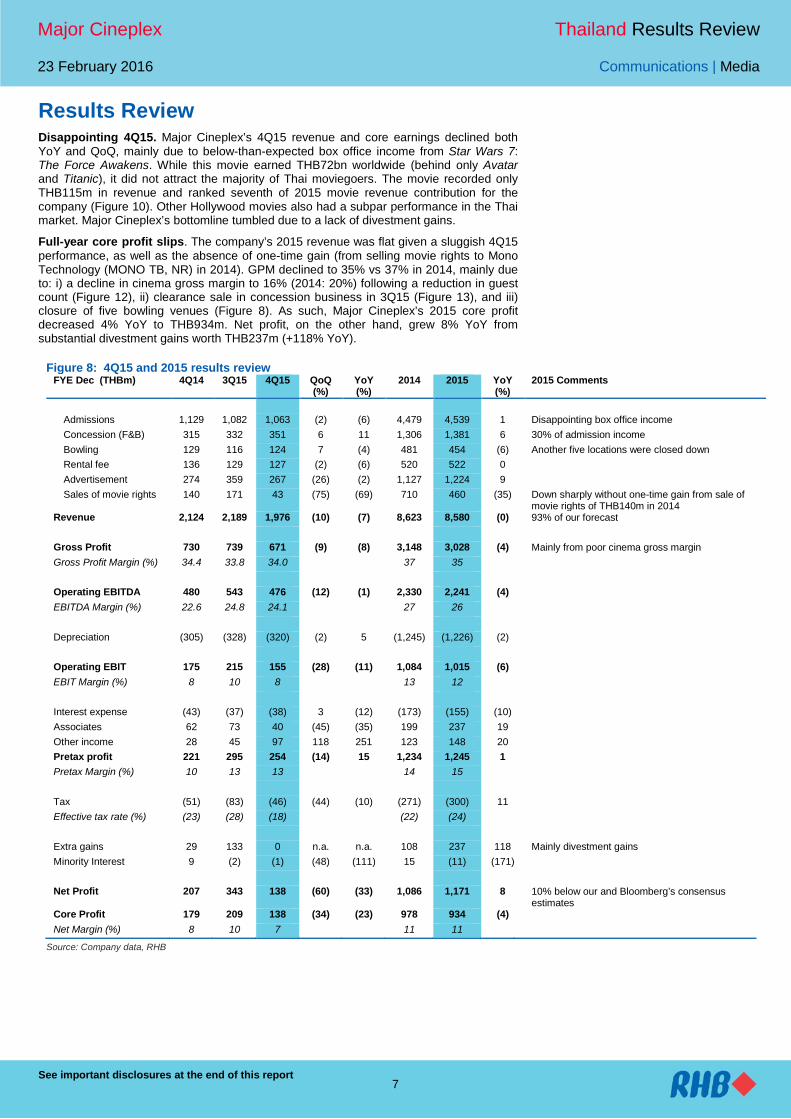
Results Review Disappointing 4Q15. Major Cineplex’s 4Q15 revenue and core earnings declined both YoY and QoQ, mainly due to below-than-expected box office income from Star Wars 7: The Force Awakens. While this movie earned THB72bn worldwide (behind only Avatar and Titanic), it did not attract the majority of Thai moviegoers. The movie recorded only THB115m in revenue and ranked seventh of 2015 movie revenue contribution for the company (Figure 10). Other Hollywood movies also had a subpar performance in the Thai market. Major Cineplex’s bottomline tumbled due to a lack of divestment gains.
Full-year core profit slips. The company’s 2015 revenue was flat given a sluggish 4Q15 performance, as well as the absence of one-time gain (from selling movie rights to Mono Technology (MONO TB, NR) in 2014). GPM declined to 35% vs 37% in 2014, mainly due to: i) a decline in cinema gross margin to 16% (2014: 20%) following a reduction in guest count (Figure 12), ii) clearance sale in concession business in 3Q15 (Figure 13), and iii) closure of five bowling venues (Figure 8). As such, Major Cineplex’s 2015 core profit decreased 4% YoY to THB934m. Net profit, on the other hand, grew 8% YoY from substantial divestment gains worth THB237m (+118% YoY).
Figure 8: 4Q15 and 2015 results review FYE Dec (THBm) 4Q14 3Q15 4Q15 QoQ
(%) YoY (%)
2014 2015 YoY (%)
2015 Comments
Admissions 1,129 1,082 1,063 (2) (6) 4,479 4,539 1 Disappointing box office income Concession (F&B) 315 332 351 6 11 1,306 1,381 6 30% of admission income Bowling 129 116 124 7 (4) 481 454 (6) Another five locations were closed down Rental fee 136 129 127 (2) (6) 520 522 0 Advertisement 274 359 267 (26) (2) 1,127 1,224 9 Sales of movie rights 140 171 43 (75) (69) 710 460 (35) Down sharply without one-time gain from sale of
movie rights of THB140m in 2014 Revenue 2,124 2,189 1,976 (10) (7) 8,623 8,580 (0) 93% of our forecast Gross Profit 730 739 671 (9) (8) 3,148 3,028 (4) Mainly from poor cinema gross margin Gross Profit Margin (%) 34.4 33.8 34.0 37 35 Operating EBITDA 480 543 476 (12) (1) 2,330 2,241 (4) EBITDA Margin (%) 22.6 24.8 24.1 27 26 Depreciation (305) (328) (320) (2) 5 (1,245) (1,226) (2) Operating EBIT 175 215 155 (28) (11) 1,084 1,015 (6) EBIT Margin (%) 8 10 8 13 12 Interest expense (43) (37) (38) 3 (12) (173) (155) (10) Associates 62 73 40 (45) (35) 199 237 19
Other income 28 45 97 118 251 123 148 20 Pretax profit 221 295 254 (14) 15 1,234 1,245 1
Pretax Margin (%) 10 13 13 14 15 Tax (51) (83) (46) (44) (10) (271) (300) 11 Effective tax rate (%) (23) (28) (18) (22) (24) Extra gains 29 133 0 n.a. n.a. 108 237 118 Mainly divestment gains Minority Interest 9 (2) (1) (48) (111) 15 (11) (171) Net Profit 207 343 138 (60) (33) 1,086 1,171 8 10% below our and Bloomberg’s consensus
estimates Core Profit 179 209 138 (34) (23) 978 934 (4) Net Margin (%) 8 10 7 11 11
Source: Company data, RHB
Major Cineplex Thailand Results Review
23 February 2016 Communications | Media
See important disclosures at the end of this report 8
Figure 9: Major Cineplex top five movies by revenue contribution
Source: Company data
Figure 10: Major Cineplex’s top 10 movies by revenue contribution 2014 THBm 2015 THBm Transformers 4 360 Fast and Furious 7 467 I Fine Thank You Love You (TH) 331 Jurassic World 305 King Naresuan 5 (TH) 248 Avengers 2 287 Spiderman 2 174 King Naresuan 6 (TH) 137 Captain America 2 160 Mission Impossible 136 Maleficent 119 Minions 115 X-Men: Days of Future Past 109 Star Wars 7 115 Kidtueng Wittaya (TH) 107 Ant Man 111 Guardians of the Galaxy 101 007 : Spectre 110 The Hobbit 100 Terminator 108
Source: Company data
Figure 11: Major Cineplex’s admissions and gross margins Figure 12: Major Cineplex’s guest count and average ticket prices
Source: Company data Source: Company data
-
5
10
15
20
25
30
0
200
400
600
800
1,000
1,200
1,400
1,600
4Q13 1Q14 2Q14 3Q14 4Q14 1Q15 2Q15 3Q15 4Q15
Admissions
Gross margin%
THBm
Major Cineplex Thailand Results Review
23 February 2016 Communications | Media
See important disclosures at the end of this report 9
Figure 13: Major Cineplex’s concession income and gross margins
Figure 14: Major Cineplex’s concession-to-admission ratio
Source: Company data Source: Company data
Figure 15: Major Cineplex’s rental income and gross margins
Figure 16: Major Cineplex’s ad income and gross margins
Source: Company data Source: Company data
Figure 17: Bowling business and its gross margins Figure 18: Movie content business and its gross margins
Source: Company data Source: Company data
61 62 63 64 65 66 67 68 69 70 71 72
050
100150200250300350400450500
4Q13 1Q14 2Q14 3Q14 4Q14 1Q15 2Q15 3Q15 4Q15
Concessions
Gross margin%
THBm
26%
27%
28%
29%
30%
31%
32%
33%
34%
4Q13 1Q14 2Q14 3Q14 4Q14 1Q15 2Q15 3Q15 4Q15
Concessions to admissions
-
5
10
15
20
25
110
115
120
125
130
135
140
4Q13 1Q14 2Q14 3Q14 4Q14 1Q15 2Q15 3Q15 4Q15
Rental income
Gross margin%
THBm
83 83 84 84 85 85 86 86 87 87 88
0
50
100
150
200
250
300
350
400
4Q13 1Q14 2Q14 3Q14 4Q14 1Q15 2Q15 3Q15 4Q15
AdvertisingGross margin%
THBm
05101520253035404550
0
20
40
60
80
100
120
140
4Q13 1Q14 2Q14 3Q14 4Q14 1Q15 2Q15 3Q15 4Q15
Bowling
Gross margin%
THBm THBm
-70-60-50-40-30-20-100102030
0
50
100
150
200
250
300
4Q13 1Q14 2Q14 3Q14 4Q14 1Q15 2Q15 3Q15 4Q15
Movie Content
Gross margin%
THBm
Major Cineplex Thailand Results Review
23 February 2016 Communications | Media
See important disclosures at the end of this report 10
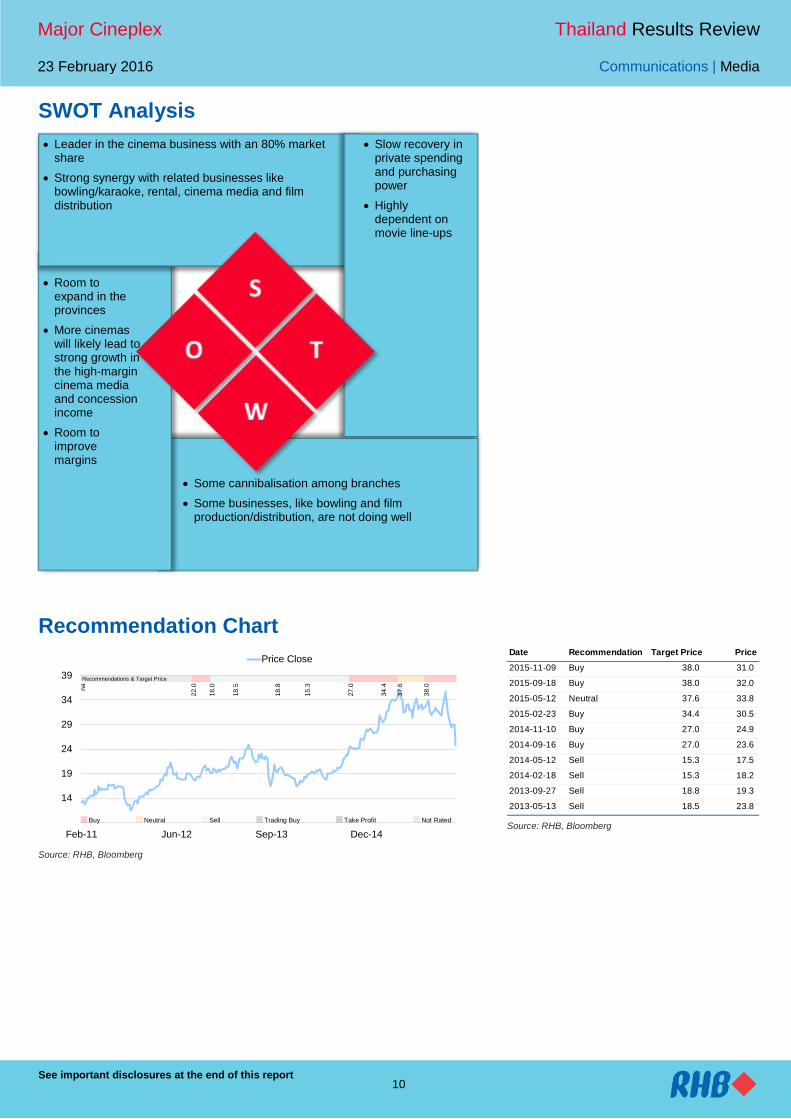
SWOT Analysis
• Leader in the cinema business with an 80% market share
• Strong synergy with related businesses like bowling/karaoke, rental, cinema media and film distribution
• Slow recovery in private spending and purchasing power
• Highly dependent on movie line-ups
• Room to expand in the provinces
• More cinemas will likely lead to strong growth in the high-margin cinema media and concession income
• Room to improve margins
• Some cannibalisation among branches
• Some businesses, like bowling and film production/distribution, are not doing well
Recommendation Chart
Source: RHB, Bloomberg
Source: RHB, Bloomberg
9
14
19
24
29
34
39
Feb-11 Jun-12 Sep-13 Dec-14
Price Close
na
22.0
16.0
18.5
18.8
15.3
27.0
34.4
37.6
38.0
Recommendations & Target Price
Buy Neutral Sell Trading Buy Take Profit Not Rated
Date Recommendation Target Price Price
2015-11-09 Buy 38.0 31.0
2015-09-18 Buy 38.0 32.0
2015-05-12 Neutral 37.6 33.8
2015-02-23 Buy 34.4 30.5
2014-11-10 Buy 27.0 24.9
2014-09-16 Buy 27.0 23.6
2014-05-12 Sell 15.3 17.5
2014-02-18 Sell 15.3 18.2
2013-09-27 Sell 18.8 19.3
2013-05-13 Sell 18.5 23.8
Major Cineplex Thailand Results Review
23 February 2016 Communications | Media
11
RHB Guide to Investment Ratings Buy: Share price may exceed 10% over the next 12 months Trading Buy: Share price may exceed 15% over the next 3 months, however longer-term outlook remains uncertain Neutral: Share price may fall within the range of +/- 10% over the next 12 months Take Profit: Target price has been attained. Look to accumulate at lower levels Sell: Share price may fall by more than 10% over the next 12 months Not Rated: Stock is not within regular research coverage Investment Research Disclaimers RHB has issued this report for information purposes only. This report is intended for circulation amongst RHB and its affiliates’ clients generally or such persons as may be deemed eligible by RHB to receive this report and does not have regard to the specific investment objectives, financial situation and the particular needs of any specific person who may receive this report. This report is not intended, and should not under any circumstances be construed as, an offer or a solicitation of an offer to buy or sell the securities referred to herein or any related financial instruments. This report may further consist of, whether in whole or in part, summaries, research, compilations, extracts or analysis that has been prepared by RHB’s strategic, joint venture and/or business partners. No representation or warranty (express or implied) is given as to the accuracy or completeness of such information and accordingly investors should make their own informed decisions before relying on the same. This report is not directed to, or intended for distribution to or use by, any person or entity who is a citizen or resident of or located in any locality, state, country or other jurisdiction where such distribution, publication, availability or use would be contrary to the applicable laws or regulations. By accepting this report, the recipient hereof (i) represents and warrants that it is lawfully able to receive this document under the laws and regulations of the jurisdiction in which it is located or other applicable laws and (ii) acknowledges and agrees to be bound by the limitations contained herein. Any failure to comply with these limitations may constitute a violation of applicable laws. All the information contained herein is based upon publicly available information and has been obtained from sources that RHB believes to be reliable and correct at the time of issue of this report. However, such sources have not been independently verified by RHB and/or its affiliates and this report does not purport to contain all information that a prospective investor may require. The opinions expressed herein are RHB’s present opinions only and are subject to change without prior notice. RHB is not under any obligation to update or keep current the information and opinions expressed herein or to provide the recipient with access to any additional information. Consequently, RHB does not guarantee, represent or warrant, expressly or impliedly, as to the adequacy, accuracy, reliability, fairness or completeness of the information and opinion contained in this report. Neither RHB (including its officers, directors, associates, connected parties, and/or employees) nor does any of its agents accept any liability for any direct, indirect or consequential losses, loss of profits and/or damages that may arise from the use or reliance of this research report and/or further communications given in relation to this report. Any such responsibility or liability is hereby expressly disclaimed. Whilst every effort is made to ensure that statement of facts made in this report are accurate, all estimates, projections, forecasts, expressions of opinion and other subjective judgments contained in this report are based on assumptions considered to be reasonable and must not be construed as a representation that the matters referred to therein will occur. Different assumptions by RHB or any other source may yield substantially different results and recommendations contained on one type of research product may differ from recommendations contained in other types of research. The performance of currencies may affect the value of, or income from, the securities or any other financial instruments referenced in this report. Holders of depositary receipts backed by the securities discussed in this report assume currency risk. Past performance is not a guide to future performance. Income from investments may fluctuate. The price or value of the investments to which this report relates, either directly or indirectly, may fall or rise against the interest of investors. This report does not purport to be comprehensive or to contain all the information that a prospective investor may need in order to make an investment decision. The recipient of this report is making its own independent assessment and decisions regarding any securities or financial instruments referenced herein. Any investment discussed or recommended in this report may be unsuitable for an investor depending on the investor’s specific investment objectives and financial position. The material in this report is general information intended for recipients who understand the risks of investing in financial instruments. This report does not take into account whether an investment or course of action and any associated risks are suitable for the recipient. Any recommendations contained in this report must therefore not be relied upon as investment advice based on the recipient's personal circumstances. Investors should make their own independent evaluation of the information contained herein, consider their own investment objective, financial situation and particular needs and seek their own financial, business, legal, tax and other advice regarding the appropriateness of investing in any securities or the investment strategies discussed or recommended in this report. This report may contain forward-looking statements which are often but not always identified by the use of words such as “believe”, “estimate”, “intend” and “expect” and statements that an event or result “may”, “will” or “might” occur or be achieved and other similar expressions. Such forward-looking statements are based on assumptions made and information currently available to RHB and are subject to known and unknown risks, uncertainties and other factors which may cause the actual results, performance or achievement to be materially different from any future results, performance or achievement, expressed or implied by such forward-looking statements. Caution should be taken with respect to such statements and recipients of this
Major Cineplex Thailand Results Review
23 February 2016 Communications | Media
12
report should not place undue reliance on any such forward-looking statements. RHB expressly disclaims any obligation to update or revise any forward-looking statements, whether as a result of new information, future events or circumstances after the date of this publication or to reflect the occurrence of unanticipated events. The use of any website to access this report electronically is done at the recipient’s own risk, and it is the recipient’s sole responsibility to take precautions to ensure that it is free from viruses or other items of a destructive nature. This report may also provide the addresses of, or contain hyperlinks to, websites. RHB takes no responsibility for the content contained therein. Such addresses or hyperlinks (including addresses or hyperlinks to RHB own website material) are provided solely for the recipient’s convenience. The information and the content of the linked site do not in any way form part of this report. Accessing such website or following such link through the report or RHB website shall be at the recipient’s own risk. This report may contain information obtained from third parties. Third party content providers do not guarantee the accuracy, completeness, timeliness or availability of any information and are not responsible for any errors or omissions (negligent or otherwise), regardless of the cause, or for the results obtained from the use of such content. Third party content providers give no express or implied warranties, including, but not limited to, any warranties of merchantability or fitness for a particular purpose or use. Third party content providers shall not be liable for any direct, indirect, incidental, exemplary, compensatory, punitive, special or consequential damages, costs, expenses, legal fees, or losses (including lost income or profits and opportunity costs) in connection with any use of their content. The research analysts responsible for the production of this report hereby certifies that the views expressed herein accurately and exclusively reflect his or her personal views and opinions about any and all of the issuers or securities analysed in this report and were prepared independently and autonomously. The research analysts that authored this report are precluded by RHB in all circumstances from trading in the securities or other financial instruments referenced in the report, or from having an interest in the company(ies) that they cover. RHB and/or its affiliates and/or their directors, officers, associates, connected parties and/or employees, may have, or have had, interests in the securities or qualified holdings, in subject company(ies) mentioned in this report or any securities related thereto and may from time to time add to or dispose of, or may be materially interested in, any such securities. Further, RHB and/or its affiliates may have, or have had, business relationships with the subject company(ies) mentioned in this report and may from time to time seek to provide investment banking or other services to the subject company(ies) referred to in this research report. As a result, investors should be aware that a conflict of interest may exist. The contents of this report is strictly confidential and may not be copied, reproduced, published, distributed, transmitted or passed, in whole or in part, to any other person without the prior express written consent of RHB and/or its affiliates. This report has been delivered to RHB and its affiliates’ clients for information purposes only and upon the express understanding that such parties will use it only for the purposes set forth above. By electing to view or accepting a copy of this report, the recipients have agreed that they will not print, copy, videotape, record, hyperlink, download, or otherwise attempt to reproduce or re-transmit (in any form including hard copy or electronic distribution format) the contents of this report. RHB and/or its affiliates accepts no liability whatsoever for the actions of third parties in this respect. The contents of this report are subject to copyright. Please refer to Restrictions on Distribution below for information regarding the distributors of this report. Recipients must not reproduce or disseminate any content or findings of this report without the express permission of RHB and the distributors. The securities mentioned in this publication may not be eligible for sale in some states or countries or certain categories of investors. The recipient of this report should have regard to the laws of the recipient’s place of domicile when contemplating transactions in the securities or other financial instruments referred to herein. The securities discussed in this report may not have been registered in such jurisdiction. Without prejudice to the foregoing, the recipient is to note that additional disclaimers, warnings or qualifications may apply based on geographical location of the person or entity receiving this report. RESTRICTIONS ON DISTRIBUTION Malaysia This report is issued and distributed in Malaysia by RHB Research Institute Sdn Bhd. The views and opinions in this report are our own as of the date hereof and is subject to change. If the Financial Services and Markets Act of the United Kingdom or the rules of the Financial Conduct Authority apply to a recipient, our obligations owed to such recipient therein are unaffected. RHB Research Institute Sdn Bhd has no obligation to update its opinion or the information in this report. Thailand This report is issued and distributed in the Kingdom of Thailand by RHB Securities (Thailand) PCL, a licensed securities company that is authorised by the Ministry of Finance, regulated by the Securities and Exchange Commission of Thailand and is a member of the Stock Exchange of Thailand. The Thai Institute of Directors Association has disclosed the Corporate Governance Report of Thai Listed Companies made pursuant to the policy of the Securities and Exchange Commission of Thailand. RHB Securities (Thailand) PCL does not endorse, confirm nor certify the result of the Corporate Governance Report of Thai Listed Companies.
Major Cineplex Thailand Results Review
23 February 2016 Communications | Media
13
Indonesia This report is issued and distributed in Indonesia by PT RHB Securities Indonesia. This research does not constitute an offering document and it should not be construed as an offer of securities in Indonesia. Any securities offered or sold, directly or indirectly, in Indonesia or to any Indonesian citizen or corporation (wherever located) or to any Indonesian resident in a manner which constitutes a public offering under Indonesian laws and regulations must comply with the prevailing Indonesian laws and regulations. Singapore This report is issued and distributed in Singapore by RHB Research Institute Singapore Pte Ltd and it may only be distributed in Singapore to accredited investors, expert investors and institutional investors as defined in the Financial Advisers Regulations and the Securities and Futures Act (Chapter 289), as amended from time to time. By virtue of distribution to these categories of investors, RHB Research Institute Singapore Pte Ltd and its representatives are not required to comply with Section 36 of the Financial Advisers Act (Chapter 110) (Section 36 relates to disclosure of RHB Research Institute Singapore Pte Ltd ’s interest and/or its representative's interest in securities). Recipients of this report in Singapore may contact RHB Research Institute Singapore Pte Ltd in respect of any matter arising from or in connection with the report. Hong Kong This report is issued and distributed in Hong Kong by RHB Securities Hong Kong Limited (興業僑豐證券有限公司) (CE No.: ADU220) (“RHBSHK”) which is licensed in Hong Kong by the Securities and Futures Commission for Type 1 (dealing in securities) and Type 4 (advising on securities) regulated activities. Any investors wishing to purchase or otherwise deal in the securities covered in this report should contact RHB Securities Hong Kong Limited. United States This report was prepared by RHB and is being distributed solely and directly to “major” U.S. institutional investors as defined under, and pursuant to, the requirements of Rule 15a-6 under the U.S. Securities and Exchange Act of 1934, as amended (the “Exchange Act”). RHB is not registered as a broker-dealer in the United States and does not offer brokerage services to U.S. persons. Any order for the purchase or sale of the securities discussed herein that are listed on Bursa Malaysia Securities Berhad must be placed with and through Auerbach Grayson (“AG”). Any order for the purchase or sale of all other securities discussed herein must be placed with and through such other registered U.S. broker-dealer as appointed by RHB from time to time as required by the Exchange Act Rule 15a-6. This report is confidential and not intended for distribution to, or use by, persons other than the recipient and its employees, agents and advisors, as applicable. Additionally, where research is distributed via Electronic Service Provider, the analysts whose names appear in this report are not registered or qualified as research analysts in the United States and are not associated persons of Auerbach Grayson AG or such other registered U.S. broker-dealer as appointed by RHB from time to time and therefore may not be subject to any applicable restrictions under Financial Industry Regulatory Authority (“FINRA”) rules on communications with a subject company, public appearances and personal trading. Investing in any non-U.S. securities or related financial instruments discussed in this research report may present certain risks. The securities of non-U.S. issuers may not be registered with, or be subject to the regulations of, the U.S. Securities and Exchange Commission. Information on non-U.S. securities or related financial instruments may be limited. Foreign companies may not be subject to audit and reporting standards and regulatory requirements comparable to those in the United States. The financial instruments discussed in this report may not be suitable for all investors. Transactions in foreign markets may be subject to regulations that differ from or offer less protection than those in the United States. OWNERSHIP AND MATERIAL CONFLICTS OF INTEREST Malaysia RHB does not have qualified shareholding (1% or more) in the subject company (ies) covered in this report except for: a) - RHB and/or its subsidiaries are not liquidity providers or market makers for the subject company (ies) covered in this report except for: a) - RHB and/or its subsidiaries have not participated as a syndicate member in share offerings and/or bond issues in securities covered in this report in the last 12 months except for: a) - RHB has not provided investment banking services to the company/companies covered in this report in the last 12 months except for: a) -
Major Cineplex Thailand Results Review
23 February 2016 Communications | Media
14
Thailand RHB Securities (Thailand) PCL and/or its directors, officers, associates, connected parties and/or employees, may have, or have had, interests and/or commitments in the securities in subject company(ies) mentioned in this report or any securities related thereto. Further, RHB Securities (Thailand) PCL may have, or have had, business relationships with the subject company(ies) mentioned in this report. As a result, investors should exercise their own judgment carefully before making any investment decisions. Indonesia PT RHB Securities Indonesia is not affiliated with the subject company(ies) covered in this report both directly or indirectly as per the definitions of affiliation above. Pursuant to the Capital Market Law (Law Number 8 Year 1995) and the supporting regulations thereof, what constitutes as affiliated parties are as follows: 1. Familial relationship due to marriage or blood up to the second degree, both horizontally or vertically;
2. Affiliation between parties to the employees, Directors or Commissioners of the parties concerned;
3. Affiliation between 2 companies whereby one or more member of the Board of Directors or the Commissioners are the same;
4. Affiliation between the Company and the parties, both directly or indirectly, controlling or being controlled by the Company;
5. Affiliation between 2 companies which are controlled, directly or indirectly, by the same party; or
6. Affiliation between the Company and the main Shareholders.
PT RHB Securities Indonesia is not an insider as defined in the Capital Market Law and the information contained in this report is not considered as insider information prohibited by law. Insider means: a. a commissioner, director or employee of an Issuer or Public Company;
b. a substantial shareholder of an Issuer or Public Company;
c. an individual, who because of his position or profession, or because of a business relationship with an Issuer or Public Company, has access to inside information; and
d. an individual who within the last six months was a Person defined in letters a, b or c, above.
Singapore RHB Research Institute Singapore Pte Ltd and/or its subsidiaries and/or associated companies do not make a market in any securities covered in this report, except for: (a) - The staff of RHB Research Institute Singapore Pte Ltd and its subsidiaries and/or its associated companies do not serve on any board or trustee positions of any issuer whose securities are covered in this report, except for: (a) - RHB Research Institute Singapore Pte Ltd and/or its subsidiaries and/or its associated companies do not have and have not within the last 12 months had any corporate finance advisory relationship with the issuer of the securities covered in this report or any other relationship (including a shareholding of 1% or more in the securities covered in this report) that may create a potential conflict of interest, except for: (a) - Hong Kong RHBSHK or any of its group companies may have financial interests in in relation to an issuer or a new listing applicant (as the case may be) the securities in respect of which are reviewed in the report, and such interests aggregate to an amount equal to or more than (a) 1% of the subject company’s market capitalization (in the case of an issuer as defined under paragraph 16 of the Code of Conduct for Persons Licensed by or Registered with the Securities and Futures Commission (the “Code of Conduct”); and/or (b) an amount equal to or more than 1% of the subject company’s issued share capital, or issued units, as applicable (in the case of a new listing applicant as defined in the Code of Conduct). Further, the analysts named in this report or their associates may have financial interests in relation to an issuer or a new listing applicant (as the case may be) in the securities which are reviewed in the report.
Major Cineplex Thailand Results Review
23 February 2016 Communications | Media
15
RHBSHK or any of its group companies may make a market in the securities covered by this report. RHBSHK or any of its group companies may have analysts or their associates, individual(s) employed by or associated with RHBSHK or any of its group companies serving as an officer of the company or any of the companies covered by this report. RHBSHK or any of its group companies may have received compensation or a mandate for investment banking services to the company or any of the companies covered by this report within the past 12 months. Note: The reference to “group companies” above refers to a group company of RHBSHK that carries on a business in Hong Kong in (a) investment banking; (b) proprietary trading or market making; or (c) agency broking, in relation to securities listed or traded on The Stock Exchange of Hong Kong Limited.
Kuala Lumpur Hong Kong Singapore
RHB Research Institute Sdn Bhd Level 11, Tower One, RHB Centre
Jalan Tun Razak Kuala Lumpur
Malaysia Tel : +(60) 3 9280 2185 Fax : +(60) 3 9284 8693
RHB Securities Hong Kong Ltd.
12th Floor World-Wide House 19 Des Voeux Road Central, Hong Kong
Tel : +(852) 2525 1118 Fax : +(852) 2810 0908
RHB Research Institute Singapore
Pte Ltd (formerly known as DMG & Partners Research Pte Ltd)
10 Collyer Quay #09-08 Ocean Financial Centre
Singapore 049315 Tel : +(65) 6533 1818 Fax : +(65) 6532 6211
Jakarta Shanghai Bangkok
PT RHB Securities Indonesia Wisma Mulia, 20th Floor
Jl. Jenderal Gatot Subroto No. 42 Jakarta 12710, Indonesia Tel : +(6221) 2783 0888 Fax : +(6221) 2783 0777
RHB (China) Investment Advisory Co. Ltd.
Suite 4005, CITIC Square 1168 Nanjing West Road
Shanghai 20041 China
Tel : +(8621) 6288 9611 Fax : +(8621) 6288 9633
RHB Securities (Thailand) PCL
10th Floor, Sathorn Square Office Tower 98, North Sathorn Road, Silom
Bangrak, Bangkok 10500 Thailand
Tel: +(66) 2 862 9999 Fax : +(66) 2 862 9799
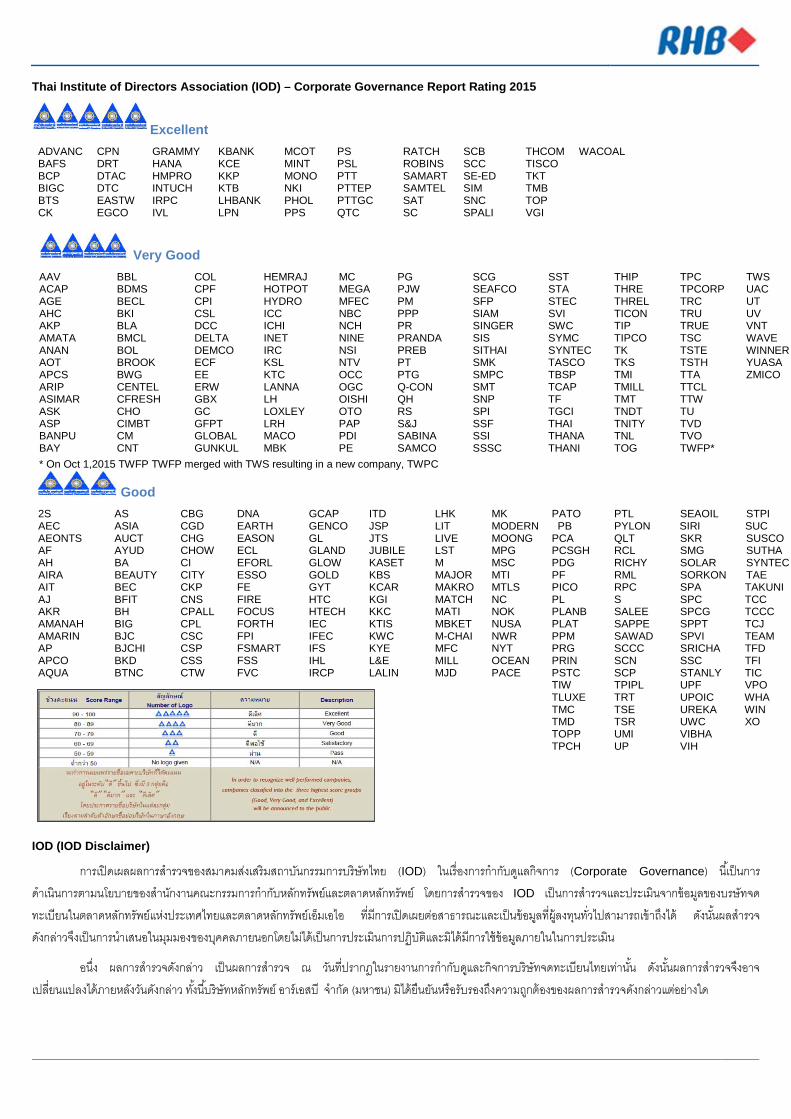
Thai Institute of Directors Association (IOD) – Corporate Governance Report Rating 2015
Excellent ADVANC CPN GRAMMY KBANK MCOT PS RATCH SCB THCOM WACOAL BAFS DRT HANA KCE MINT PSL ROBINS SCC TISCO BCP DTAC HMPRO KKP MONO PTT SAMART SE-ED TKT BIGC DTC INTUCH KTB NKI PTTEP SAMTEL SIM TMB BTS EASTW IRPC LHBANK PHOL PTTGC SAT SNC TOP CK EGCO IVL LPN PPS QTC SC SPALI VGI
Very Good AAV BBL COL HEMRAJ MC PG SCG SST THIP TPC TWS ACAP BDMS CPF HOTPOT MEGA PJW SEAFCO STA THRE TPCORP UAC AGE BECL CPI HYDRO MFEC PM SFP STEC THREL TRC UT AHC BKI CSL ICC NBC PPP SIAM SVI TICON TRU UV AKP BLA DCC ICHI NCH PR SINGER SWC TIP TRUE VNT AMATA BMCL DELTA INET NINE PRANDA SIS SYMC TIPCO TSC WAVE ANAN BOL DEMCO IRC NSI PREB SITHAI SYNTEC TK TSTE WINNER AOT BROOK ECF KSL NTV PT SMK TASCO TKS TSTH YUASA APCS BWG EE KTC OCC PTG SMPC TBSP TMI TTA ZMICO ARIP CENTEL ERW LANNA OGC Q-CON SMT TCAP TMILL TTCL ASIMAR CFRESH GBX LH OISHI QH SNP TF TMT TTW ASK CHO GC LOXLEY OTO RS SPI TGCI TNDT TU ASP CIMBT GFPT LRH PAP S&J SSF THAI TNITY TVD BANPU CM GLOBAL MACO PDI SABINA SSI THANA TNL TVO BAY CNT GUNKUL MBK PE SAMCO SSSC THANI TOG TWFP* * On Oct 1,2015 TWFP TWFP merged with TWS resulting in a new company, TWPC
Good 2S AS CBG DNA GCAP ITD LHK MK PATO PTL SEAOIL STPI AEC ASIA CGD EARTH GENCO JSP LIT MODERN PB PYLON SIRI SUC AEONTS AUCT CHG EASON GL JTS LIVE MOONG PCA QLT SKR SUSCO AF AYUD CHOW ECL GLAND JUBILE LST MPG PCSGH RCL SMG SUTHA AH BA CI EFORL GLOW KASET M MSC PDG RICHY SOLAR SYNTEC AIRA BEAUTY CITY ESSO GOLD KBS MAJOR MTI PF RML SORKON TAE AIT BEC CKP FE GYT KCAR MAKRO MTLS PICO RPC SPA TAKUNI AJ BFIT CNS FIRE HTC KGI MATCH NC PL S SPC TCC AKR BH CPALL FOCUS HTECH KKC MATI NOK PLANB SALEE SPCG TCCC AMANAH BIG CPL FORTH IEC KTIS MBKET NUSA PLAT SAPPE SPPT TCJ AMARIN BJC CSC FPI IFEC KWC M-CHAI NWR PPM SAWAD SPVI TEAM AP BJCHI CSP FSMART IFS KYE MFC NYT PRG SCCC SRICHA TFD APCO BKD CSS FSS IHL L&E MILL OCEAN PRIN SCN SSC TFI AQUA BTNC CTW FVC IRCP LALIN MJD PACE PSTC SCP STANLY TIC TIW TPIPL UPF VPO TLUXE TRT UPOIC WHA TMC TSE UREKA WIN TMD TSR UWC XO TOPP UMI VIBHA TPCH UP VIH
IOD (IOD Disclaimer)
การเปิดเผลผลการสํารวจของสมาคมสง่เสริมสถาบนักรรมการบริษัทไทย (IOD) ในเร่ืองการกํากบัดแูลกิจการ (Corporate Governance) นีเ้ป็นการ
ดําเนินการตามนโยบายของสํานกังานคณะกรรมการกํากบัหลกัทรัพย์และตลาดหลกัทรัพย์ โดยการสํารวจของ IOD เป็นการสํารวจและประเมินจากข้อมลูของบรษัทจด
ทะเบียนในตลาดหลกัทรัพย์แหง่ประเทศไทยและตลาดหลกัทรัพย์เอ็มเอไอ ที่มีการเปิดเผยตอ่สาธารณะและเป็นข้อมลูที่ผู้ลงทนุทัว่ไปสามารถเข้าถงึได้ ดงันัน้ผลสํารวจ
ดงักลา่วจงึเป็นการนําเสนอในมมุมองของบคุคลภายนอกโดยไมไ่ด้เป็นการประเมินการปฏิบตัิและมิได้มีการใช้ข้อมลูภายในในการประเมิน
อนึ่ง ผลการสาํรวจดงักลา่ว เป็นผลการสํารวจ ณ วนัที่ปรากฎในรายงานการกํากบัดแูละกิจการบริษัทจดทะเบียนไทยเทา่นัน้ ดงันัน้ผลการสํารวจจงึอาจ
เปลี่ยนแปลงได้ภายหลงัวนัดงักลา่ว ทัง้นีบ้ริษัทหลกัทรัพย์ อาร์เอสบี จํากดั (มหาชน) มิได้ยืนยนัหรือรับรองถึงความถกูต้องของผลการสํารวจดงักลา่วแตอ่ยา่งใด
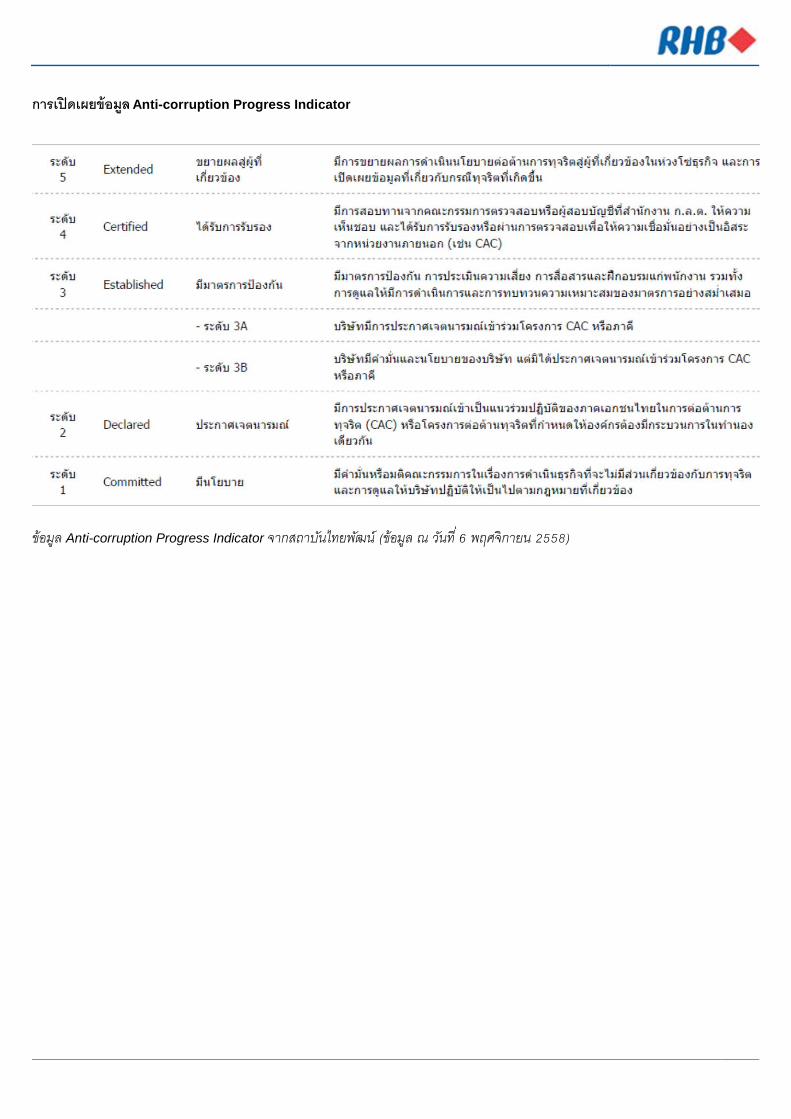
การเปิดเผยข้อมูล Anti-corruption Progress Indicator
ข้อมูล Anti-corruption Progress Indicator จากสถาบนัไทยพฒัน์ (ข้อมูล ณ วนัที ่6 พฤศจิกายน 2558)