textile mills limited - gul ahmed...
TRANSCRIPT
T e x t i l e M i l l s L i m i t e d
Quarterly ReportCondensed Interim Financial Information
For The Nine Months Ended March 31, 2013

Company Information
BOARD OF DIRECTORS MOHOMED BASHIR - Chairman & Chief ExecutiveZAIN BASHIR - Non Executive DirectorZIAD BASHIR - Executive DirectorMOHAMMED ZAKI BASHIR - Executive DirectorABDUL AZIZ YOUSUF - Executive DirectorS.M. NADIM SHAFIQULLAH - Independent Non Executive DirectorABDUL RAZAK BRAMCHARI - Non Executive DirectorDR. AMJAD WAHEED - Independent Non Executive DirectorADNAN AFRIDI - Independent Non Executive Director
CHIEF FINANCIAL OFFICER MOHAMMED SALEEM SATTAR
COMPANY SECRETARY MOHAMMED SALIM GHAFFAR
AUDIT COMMITTEE S.M. NADIM SHAFIQULLAH - Chairman & MemberZAIN BASHIR - MemberMOHAMMED ZAKI BASHIR - MemberMOHAMMED SALIM GHAFFAR - Secretary
BANKERS ALLIED BANK LIMITEDBANK AL HABIB LIMITEDBARCLAYS BANK PLC PAKISTANBANK ALFALAH LIMITED - ISLAMIC BANKINGBANKISLAMI PAKISTAN LIMITEDBURJ BANK LIMITEDCITIBANK, N.A.DUBAI ISLAMIC BANK PAKISTAN LIMITEDFAYSAL BANK LIMITEDHABIB BANK LIMITEDHABIB METROPOLITAN BANK LIMITEDHSBC BANK MIDDLE EAST LIMITEDMCB BANK LIMITEDMEEZAN BANK LIMITEDMEEZAN BANK LIMITEDNATIONAL BANK OF PAKISTANNIB BANK LIMITEDSAMBA BANK LIMITEDSILKBANK LIMITEDSTANDARD CHARTERED BANK (PAKISTAN) LIMITEDUNITED BANK LIMITED
AUDITORS HYDER BHIMJI & CO.Chartered Accountants
INTERNAL AUDITORS ANJUM ASIM SHAHID RAHMANChartered Accountants
LEGAL ADVISORS A.K. BROHI & COADVOCATES
REGISTERED OFFICE PLOT NO.82MAIN NATIONAL HIGHWAYLANDHI, KARACHI-75120
SHARE REGISTRAR FAMCO ASSOCIATES (PRIVATE) LIMITED1ST FLOOR, STATE LIFE BUILDING NO. 1-AOFF: I.I. CHUNDRIGAR ROAD, KARACHI-74000PHONE NO. (021) 32427012, 32426597 & 32425467FAX NO. (021) 32426752
MILLS LANDHI INDUSTRIAL AREAKARACHI-75120
E-MAIL [email protected]
URL www.gulahmed.com
Quarterly Accounts Mar. 2013 1

Directors’ Review
Directors of Gul Ahmed Textile Mills Limited are pleased to present review of the affairs of the Company for the nine months ended March 31, 2013.
Economic and Industrial ReviewPakistan is going through a democratic transition phase as the elections are due in the second week of May, 2013. Caretaker setup is placed with challenging jobs of conducting fair elections amid worsening law and order situation and managing the troubled economy along with possible dealing with IMF for new loans and/or rescheduling. The Government has so far repaid to IMF USD 2.2 billion in the current year and the next payment is due in the last quarter of this year amounting to USD 838 million. The pressure on balance of payment and foreign exchange reserves is likely to continue in the fourth quarter.
With the end of the third quarter the economic and social challenges have become more acute in our country. Despite of obstacles like worsening law and order situation, energy crisis and depreciating rupee, the textile industry is striving hard to maintain its performance. The departed government has also applied for the GSP plus scheme to qualify for the duty free export status to the European Union which will lift up performance of the textile industry. Besides bringing down the levy of duties, prices of utilities should also be brought down to the minimum level in order to accelerate production activity.
Financial PerformanceDespite the unfavorable business environment relating to energy and governance in Pakistan the Company has witnessed encouraging results. During the nine months ended March 31, 2013, sales have increased by 18% as compared to the corresponding period resulting in a gross profit amounting to Rs. 3.2 billion showing a growth of 31%.
March 2013 March 2012 Rs. In million
Sales 21,308 18,070Gross profit 3,210 2,458Profit before tax after providing
depreciation / amortization of Rs. 563 million (2012: Rs. 552 million) 501 (99)
Profit after tax 373 (280)
Future ProspectsMajor policy reforms are not expected until the new government is elected. However, your Company is aggressively working on improving the quality of products and its marketing strategy to explore new markets in various segments. We are working on multiple business segments so that we can hedge our sales policies so that we are not over dependent on any one segment.
We see that both our sales and profit margins increasing through the rest of the year should we not witness any drastic change in conditions relating to energy or governance.
Consolidated Financial StatementsConsolidated financial statements for the nine months ended March 31, 2013 of FY 2012-13 of the Company and its subsidiaries Gul Ahmed International Limited (FZC) UAE, GTM (Europe) Limited UK and GTM USA Corporation USA are attached.
AcknowledgementDirectors acknowledge and appreciate the efforts of the employees and valuable support of the various Government Departments, Financial Institutions and our customers.
For and on behalf of the Board
Mohomed BashirKarachi Chairman and Chief ExecutiveApril 25, 2013
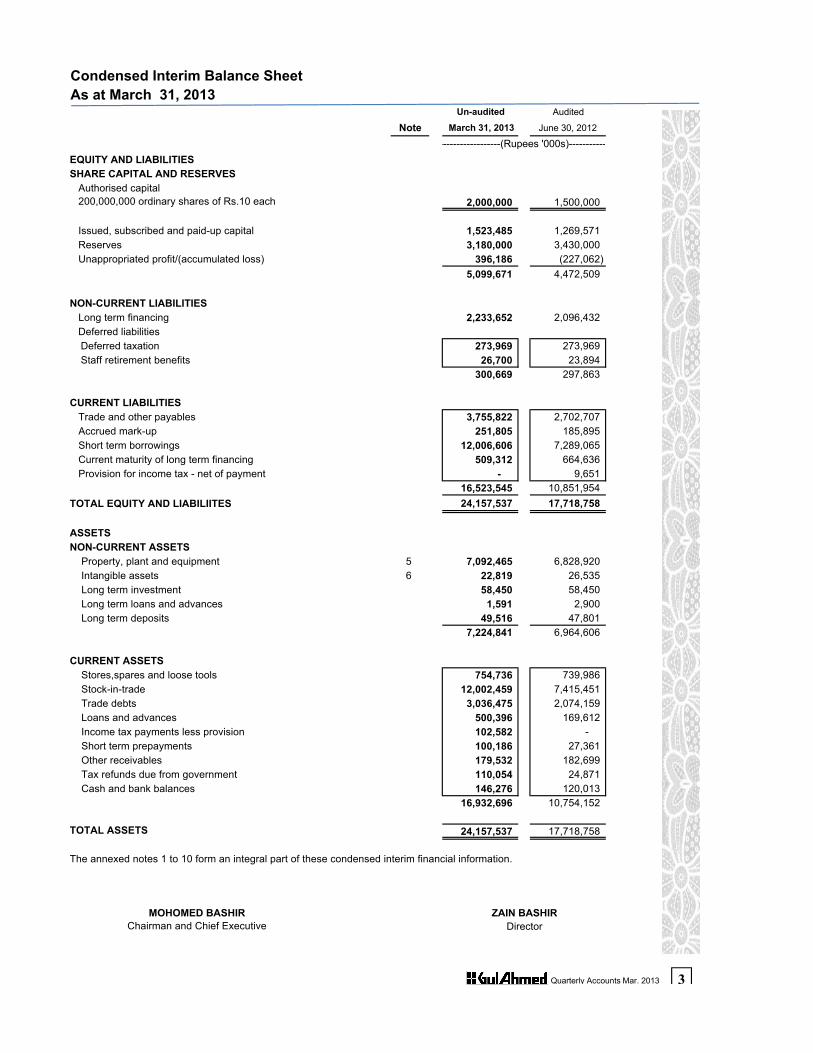
Condensed Interim Balance Sheet As at March 31, 2013
Un-audited Audited
Note March 31, 2013 June 30, 2012
EQUITY AND LIABILITIESSHARE CAPITAL AND RESERVES Authorised capital 200,000,000 ordinary shares of Rs.10 each 2,000,000 1,500,000
Issued, subscribed and paid-up capital 1,523,485 1,269,571 Reserves 3,180,000 3,430,000 Unappropriated profit/(accumulated loss) 396,186 (227,062)
5,099,671 4,472,509
NON-CURRENT LIABILITIES Long term financing 2,233,652 2,096,432 Deferred liabilities
Deferred taxation 273,969 273,969Staff retirement benefits 26,700 23,894
300,669 297,863
CURRENT LIABILITIES Trade and other payables 3,755,822 2,702,707 Accrued mark-up 251,805 185,895 Short term borrowings 12,006,606 7,289,065 Current maturity of long term financing 509,312 664,636 Provision for income tax - net of payment - 9,651
16,523,545 10,851,954
--------------------(Rupees '000s)--------------
16,523,545 10,851,954TOTAL EQUITY AND LIABILIITES 24,157,537 17,718,758
ASSETSNON-CURRENT ASSETS Property, plant and equipment 5 7,092,465 6,828,920 Intangible assets 6 22,819 26,535 Long term investment 58,450 58,450 Long term loans and advances 1,591 2,900 Long term deposits 49,516 47,801
7,224,841 6,964,606
CURRENT ASSETS Stores,spares and loose tools 754,736 739,986 Stock-in-trade 12,002,459 7,415,451 Trade debts 3,036,475 2,074,159 Loans and advances 500,396 169,612 Income tax payments less provision 102,582 - Short term prepayments 100,186 27,361 Other receivables 179,532 182,699 Tax refunds due from government 110,054 24,871 Cash and bank balances 146,276 120,013
16,932,696 10,754,152
TOTAL ASSETS 24,157,537 17,718,758
The annexed notes 1 to 10 form an integral part of these condensed interim financial information.
MOHOMED BASHIR ZAIN BASHIRChairman and Chief Executive Director
Quarterly Accounts Mar. 2013 3

Condensed Interim Profit and Loss Account (Un-audited)For The Nine Months Ended March 31, 2013
January to March 2013
January to March 2012
July to March 2013
July to March 2012
-------------------------------(Rupees '000s)-------------------------------
Sales 8,144,857 6,411,344 21,308,028 18,069,706
Cost of sales Opening stock of finished goods 6,453,998 5,861,624 4,945,924 6,216,883 Cost of goods manufactured 6,160,237 4,613,670 16,419,927 13,497,330 Purchases and processing charges 1,738,566 589,382 4,229,039 1,496,548 Closing stock of finished goods (7,496,729) (5,599,028) (7,496,729) (5,599,028)
6,856,072 5,465,648 18,098,161 15,611,733
Gross profit 1,288,785 945,696 3,209,867 2,457,973
Distribution cost 384,136 338,999 1,024,834 875,578 Administrative expenses 268,126 228,658 750,865 667,962 Other operating expenses 20,083 - 39,689 -
672,345 567,657 1,815,388 1,543,540
616,440 378,039 1,394,479 914,433
Other operating income 2,848 5,229 24,968 14,993
Operating profit 619,288 383,268 1,419,447 929,426
Quarter ended Nine months ended
Finance cost 348,320 360,737 918,216 1,028,559
Profit/(loss) before taxation 270,968 22,531 501,231 (99,133)
Provision for taxation 68,983 65,393 127,983 180,847
Profit/(loss) after taxation 201,985 (42,862) 373,248 (279,980)
-----------------------------(Rupees)------------------------------Re-Stated Re-Stated
Earnings/(loss) per share - basic anddiluted (Rs.) 1.35 (0.31) 2.62 (2.02)
The annexed notes 1 to 10 form an integral part of these condensed interim financial information.
MOHOMED BASHIRChairman and Chief Executive Director
ZAIN BASHIR
Quarterly Accounts Mar. 2013 4

Condensed Interim Statement Of Comprehensive Income (Un-audited)For The Nine Months Ended March 31, 2013
January to March
January to March
July to March
July to March
2013 2012 2013 2012----------------------------(Rupees '000s)---------------------------
Profit/(loss) after taxation 201,985 (42,862) 373,248 (279,980)
Other comprehensive income - - - -
Total comprehensive income 201,985 (42,862) 373,248 (279,980)
The annexed notes 1 to 10 form an integral part of these condensed interim financial information.
MOHOMED BASHIR ZAIN BASHIRChairman and Chief Executive Director
Quarter ended Nine months ended
Quarterly Accounts Mar. 2013 5

Condensed Interim Cash Flow Statement (Un-audited)For The Nine Months Ended March 31, 2013
March 31, 2013
March 31, 2012
------------(Rupees '000s)------------
CASH FLOWS FROM OPERATING ACTIVITIES
Profit/(loss) before taxation 501,231 (99,133)
Adjustments for: Depreciation 554,465 542,260 Amortisation 9,006 10,085 Provision for gratuity 15,060 20,446 Finance cost 918,216 1,028,559 Provision for slow moving/obsolete items 9,216 7,728 Provision for doubtful debts 22,369 21,900 Profit on sale of property, plant and equipment (16,168) (8,879)
2,013,395 1,522,966 Changes in working capital:
(Increase)/decrease in current assets Stores, spares and loose tools (23,966) (2,058) Stock-in-trade (4,587,008) 1,116,243 Trade debts (984,684) (659,798) Loans and advances (330,784) (194,844)
Nine months
Loans and advances (330,784) (194,844) Prepayments (72,825) (76,564) Other receivables 3,167 61,949 Tax refunds due from government (85,183) 31,584
(6,081,283) 276,512 Increase in current liabilities Trade and other payables 1,053,115 748,970
(5,028,168) 1,025,482 Cash (used in)/generated from operations (3,014,773) 2,548,448
Payments for: Gratuity (12,254) (5,208) Finance cost (852,306) (1,002,381) Income tax paid (240,217) (160,945) Long term loans and advances 1,309 1,202 Long term deposits (1,715) (9,591) Net cash (used in)/generated from operating activities (4,119,956) 1,371,525
Quarterly Accounts Mar. 2013 6

March 31, 2013
March 31, 2012
------------(Rupees '000s)------------
CASH FLOWS FROM INVESTING ACTIVITIES
Addition to property, plant and equipment (868,313) (586,313) Addition to intangible assets (5,289) (2,020) Proceeds from sale of property, plant and equipment 66,470 23,103 Net cash used in investing activities (807,132) (565,230)
CASH FLOWS FROM FINANCING ACTIVITIES
Long term loans acquired 532,791 355,784 Repayments of long term loans (550,895) (541,483) Proceeds from issue of right shares 253,914 -
Net cash generated from/(used in) financing activities 235,810 (185,699)
Net (decrease)/increase in cash and cash equivalents (4,691,278) 620,596
Cash and cash equivalents - at the beginning of the period (7,169,052) (9,675,835)
Cash and cash equivalents - at the end of the period (11,860,330) (9,055,239)
CASH AND CASH EQUIVALENTS
Nine months
CASH AND CASH EQUIVALENTS
Cash and cash equivalents comprises of :
Cash and bank balances 146,276 110,099 Short term borrowings (12,006,606) (9,165,338)
(11,860,330) (9,055,239)
The annexed notes 1 to 10 form an integral part of these condensed interim financial information.
MOHOMED BASHIR ZAIN BASHIRChairman and Chief Executive Director
Quarterly Accounts Mar. 2013 7

Condensed Interim Statement of Changes in Equity (Un-audited)For The Nine Months Ended March 31, 2013
Share capital
Revenue reserve
Capital reserve
Reserve for Issue of bonus share
Un-appropriated
profit Total
Balance as at June 30, 2011 634,785 2,430,000 450,446 - 1,197,642 4,712,873
Transfer to reserve for issue of bonus shares - - (450,446) 634,786 (184,340) -
Transfer to revenue reserve - 1,000,000 - - (1,000,000) -
Transaction with owners
Issuance of bonus shares for the year ended June 30, 2011 634,786 - - (634,786) - -
Total comprehensive income
Profit for the nine months ended March 31, 2012 - - - - (279,980) (279,980)
Other comprehensive income - - - - - -
Total comprehensive income for the period - - - - (279,980) (279,980)
Balance as at March 31, 2012 1,269,571 3,430,000 - - (266,678) 4,432,893
Total comprehensive income
-----------------------------------------------------------(Rupees '000s)---------------------------------------------------------
Profit for the period April 1, 2012 to June 30, 2012 - - - - 39,616 39,616
Other comprehensive income - - - - - -
Total comprehensive income for the year - - - - 39,616 39,616.00
Balance as at June 30, 2012 1,269,571 3,430,000 - - (227,062) 4,472,509 -
Transfer to revenue reserve - (250,000) - - 250,000 -
Transaction with owners
Issue of right shares 253,914 - - - - 253,914
Total comprehensive income
Profit for the nine months ended March 31, 2013 - - - - 373,248 373,248
Other comprehensive income - - - - - -
Total comprehensive income for the period - - - - 373,248 373,248
Balance as at March 31, 2013 1,523,485 3,180,000 - - 396,186 5,099,671
The annexed notes 1 to 10 form an integral part of these condensed interim financial information.
MOHOMED BASHIRChairman and Chief Executive
ZAIN BASHIRDirector
Quarterly Accounts Mar. 2013 8
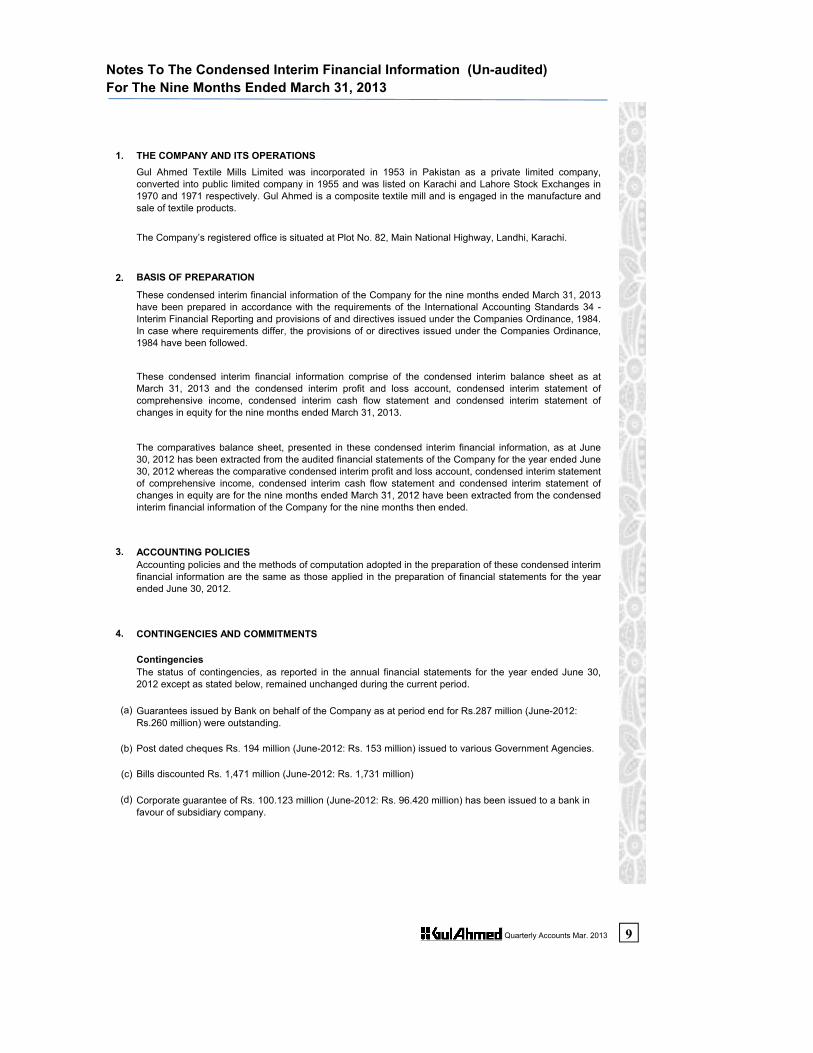
Notes To The Condensed Interim Financial Information (Un-audited)For The Nine Months Ended March 31, 2013
1. THE COMPANY AND ITS OPERATIONS
2. BASIS OF PREPARATION
The Company’s registered office is situated at Plot No. 82, Main National Highway, Landhi, Karachi.
Gul Ahmed Textile Mills Limited was incorporated in 1953 in Pakistan as a private limited company,converted into public limited company in 1955 and was listed on Karachi and Lahore Stock Exchanges in1970 and 1971 respectively. Gul Ahmed is a composite textile mill and is engaged in the manufacture andsale of textile products.
These condensed interim financial information of the Company for the nine months ended March 31, 2013have been prepared in accordance with the requirements of the International Accounting Standards 34 -Interim Financial Reporting and provisions of and directives issued under the Companies Ordinance, 1984.In case where requirements differ, the provisions of or directives issued under the Companies Ordinance,1984 have been followed.
These condensed interim financial information comprise of the condensed interim balance sheet as atMarch 31, 2013 and the condensed interim profit and loss account, condensed interim statement ofcomprehensive income, condensed interim cash flow statement and condensed interim statement ofchanges in equity for the nine months ended March 31, 2013.
The comparatives balance sheet, presented in these condensed interim financial information, as at June30, 2012 has been extracted from the audited financial statements of the Company for the year ended June30, 2012 whereas the comparative condensed interim profit and loss account, condensed interim statementof comprehensive income, condensed interim cash flow statement and condensed interim statement ofchanges in equity are for the nine months ended March 31, 2012 have been extracted from the condensed
3. ACCOUNTING POLICIES
4. CONTINGENCIES AND COMMITMENTS
Contingencies
(a)
(b)
(c) Bills discounted Rs. 1,471 million (June-2012: Rs. 1,731 million)
(d) Corporate guarantee of Rs. 100.123 million (June-2012: Rs. 96.420 million) has been issued to a bank in favour of subsidiary company.
changes in equity are for the nine months ended March 31, 2012 have been extracted from the condensedinterim financial information of the Company for the nine months then ended.
Post dated cheques Rs. 194 million (June-2012: Rs. 153 million) issued to various Government Agencies.
Guarantees issued by Bank on behalf of the Company as at period end for Rs.287 million (June-2012: Rs.260 million) were outstanding.
Accounting policies and the methods of computation adopted in the preparation of these condensed interimfinancial information are the same as those applied in the preparation of financial statements for the yearended June 30, 2012.
The status of contingencies, as reported in the annual financial statements for the year ended June 30,2012 except as stated below, remained unchanged during the current period.
Quarterly Accounts Mar. 2013 9

Notes To The Condensed Interim Financial Information (Un-audited)For The Nine Months Ended March 31, 2013
CommitmentsCompany is committed for certain expenditures which are stated as follows:
March 31, 2013
June 30, 2012
------------(Rupees '000s)------------
- Capital expenditure 171,424 196,876 - Non capital expenditure items under letters of credits 220,431 373,728
391,855 570,604
5. PROPERTY, PLANT AND EQUIPMENT
Operating assets
Opening book value 6,606,533 6,582,082
Additions during the period:Buildings and structures on leasehold land 6,140 98,876 Plant and machinery 490,884 531,789 Office equipment 14,482 51,563 Furniture and fixtures 2,748 6,490 Vehicles 57,489 99,020
571,743 787,738
Book values of assets disposed-off during the periodPlant and machinery (46,661) (4,200) Office equipment (32) (2,440) Vehicles (3,609) (14,668) Vehicles (3,609) (14,668)
(50,302) (21,308)
Depreciation charge for the period (554,465) (741,979)
Book value of operating fixed assets 6,573,509 6,606,533
Capital work in progress
Opening 222,387 71,643
Addition - Machinery 631,804 716,067 - Building 75,821 64,895
- Others 14,843 9,302 722,468 790,264
Transferred - Machinery (425,899) (540,890) - Building - (82,617)
- Others - (16,013) (425,899) (639,520)
Closing 518,956 222,387
Book Value of property, plant and equipment 7,092,465 6,828,920
6. INTANGIBLE ASSETS
Opening book value 26,535 38,630 Additions during the period 5,289 746 Amortisation charge for the period (9,005) (12,841) Closing net book value 22,819 26,535
Quarterly Accounts Mar. 2013 10

Notes To The Condensed Interim Financial Information (Un-audited)For The Nine Months Ended March 31, 2013
7. SEGMENT INFORMATION
The Company has the following two reportable business segments:
a) Spinning: Production of different qualities of yarn using both natural and artificial fibers
b) Processing: Production of grey fabric, its processing into various types of fabrics for sale as well as to manufacture home textile products.Transactions among the business segments are recorded at cost.
7.1 Segmental profitability (Rs. 000s)
March 2013 March 2012 March 2013 March 2012 March 2013 March 2012 March 2013 March 2012
Sales 7,876,359 7,329,287 14,750,156 13,537,370 (1,318,487) (2,796,951) 21,308,028 18,069,706 Cost of sales 7,055,178 7,379,764 12,361,470 11,028,920 (1,318,487) (2,796,951) 18,098,161 15,611,733 Gross profit 821,181 (50,477) 2,388,686 2,508,450 - - 3,209,867 2,457,973 Administrative & selling expenses 199,360 106,862 1,576,339 1,436,678 1,775,699 1,543,540
621,821 (157,339) 812,347 1,071,772 - - 1,434,168 914,433 Financial charges 918,216 1,028,559 Other operating expenses 39,689 - Other operating income (24,968) (14,993) Taxation 127,983 180,847Profit/(loss) after taxation 373,248 (279,980)
7.2 Segment assets and liabilities
March 2013 June 2012 March 2013 June 2012 March 2013 June 2012 March 2013 June 2012
Assets 7,501,754 5,214,791 14,675,814 11,008,064 1,979,969 1,495,903 24,157,537 17,718,758
Liabilities 1,091,636 1,181,032 4,106,891 3,429,346 13,859,339 8,635,871 19,057,866 13,246,249
7.3 Unallocated items represent those assets, liabilities, income and expenses which are common to all segments and investment in subsidiaries.
Profit/(loss) before tax and before charging following
----------------------------------------------------------------------(Rupees '000s)------------------------------------------------------------------------
TOTAL
For the nine months ended
TOTAL SPINNING PROCESSING ELIMINATION OF INTER SEGMENT TRANSACTION
SPINNING PROCESSING UNALLOCATED
Quarterly Accounts Mar. 2013 11

Notes To The Condensed Interim Financial Information (Un-audited)For The Nine Months Ended March 31, 2013
7.4 Information by geographical areaRevenue Non-current assets
March March March June2013 2012 2013 2012
-------------------------------(Rupees '000s)-----------------------------------Pakistan 8,893,175 7,597,996 7,166,391 6,906,156 Germany 2,166,656 1,839,309 - - United Kingdom 2,287,229 1,843,919 - - United States 1,413,856 1,309,835 - - China 1,478,952 1,524,245 - - France 827,314 682,916 - - Netherland 768,682 683,885 - United Arab Emirates 187,061 522,183 58,450 58,450 Other Countries 3,285,103 2,346,480 - -
# 21,308,028 18,350,768 7,224,841 6,964,606
8. TRANSACTIONS AND BALANCES WITH RELATED PARTIES
Nature of transaction July 01, 2012 to March 31,
2013
July 01, 2011 to March 31,
2012
Subsidiaries Purchase of goods 42,996 497Sale of goods 619,597 1,059,384
Associated Companies Purchase of goods 54,302 35,371& other related parties Sale of goods 650 4,821
Rent paid 5,400 4,365Fees paid 1,250 1,000Commission / rebate received 2,603 2,900Bills discounted 918,806 442,717Commission / bank charges paid 18,466 15,224Mark up / interest charged 84,706 91,362Provident fund contribution 41,390 37,421
Nature of balances
As at March 31,
2013
As at June 30, 2012
Subsidiaries Corporate guarantee issued in favourof subsidiary company 100,123 96,420Trade & other payable 99,551 2,858Long term investment 58,450 58,450Trade debts 191,481 139,703Advance from customer - 15,897
Associated Companies Deposit with bank 60,361 44,498& other related parties Borrowing from bank 1,447,050 1,144,905
Bank guarantee 223,472 203,472Trade & other payable 8,189 12,615Accrued mark up 16,880 26,430Trade debts 5,055 759Loans to key management personnel 2,599 5,183
Relationship with The Company
Outstanding Balances
The related parties comprise subsidiaries, associated companies, companies where directors also holddirectorship, directors of the Company and key management personnel. The Company in the normal course ofbusiness carried out transaction with various related parties.
------------(Rupees '000s)------------
Quarterly Accounts Mar. 2013 12

Notes To The Condensed Interim Financial Information (Un-audited)For The Nine Months Ended March 31, 2013
9. DATE OF AUTHORISATION
10. GENERAL
Figures have been rounded off to the nearest thousand rupees.
ZAIN BASHIRDirector Chairman and Chief Executive
There are no transactions with directors of the Company and key management personnelother than those under the terms of employment for the period ending Mar-2013 amounting to Rs.312 million (Mar-2012: Rs. 287 million) on account of remuneration.
These condensed interim financial information were authorised for issue on April 25, 2013 by theBoard of Directors of the Company.
Allocations for the workers' profit participation fund, workers' welfare fund and taxation are interim andfinal liability will be determined on the basis of annual results.
MOHOMED BASHIR
Quarterly Accounts Mar. 2013 13

T e x t i l e M i l l s L i m i t e d
Consolidated AccountsConsolidated Condensed Interim Financial Information
For The Nine Months Ended March 31, 2013

Consolidated Condensed Interim Balance SheetAs at March 31, 2013
Un-audited Audited
Note March 31, 2013 June 30, 2012
EQUITY AND LIABILITIES
SHARE CAPITAL AND RESERVES Authorised capital 200,000,000 ordinary shares of Rs.10 each 2,000,000 1,500,000
Issued, subscribed and paid-up capital 1,523,485 1,269,571 Reserves 3,266,371 3,507,237 Unappropriated profit/ (accumulated loss) 512,716 (123,758)
5,302,572 4,653,050
NON-CURRENT LIABILITIES Long term financing 2,233,652 2,096,432 Deferred liabilities
Deferred taxation 284,467 284,467 Staff retirement benefits 30,690 27,952
315,157 312,419
CURRENT LIABILITIES Trade and other payables 3,772,495 2,703,860 Accrued mark-up 251,805 185,895 Short term borrowings 12,006,606 7,349,525 Current maturity of long term financing 509,312 664,636 Provision for Income tax - net of payment - 11,293
16,540,218 10,915,209TOTAL EQUITY AND LIABILIITES 24,391,599 17,977,110
------------(Rupees '000s)---------
TOTAL EQUITY AND LIABILIITES 24,391,599 17,977,110
ASSETSNON-CURRENT ASSETS Property, plant and equipment 5 7,103,843 6,839,436 Intangible assets 6 25,203 29,465 Long term loans and advances 1,591 2,900 Long term deposits 49,516 47,801
7,180,153 6,919,602
CURRENT ASSETS Stores,spares and loose tools 754,736 739,986 Stock-in-trade 12,125,464 7,481,834 Trade debts 3,126,593 2,272,265 Loans and advances 507,847 175,611 Income tax payments less provision 101,427 - Short term prepayments 114,282 39,487 Other receivables 183,876 182,699 Tax refunds due from government 111,886 25,903 Cash and bank balances 185,335 139,723
17,211,446 11,057,508
TOTAL ASSETS 24,391,599 17,977,110
The annexed notes 1 to 10 form an integral part of these consolidated condensed interim financial information.
MOHOMED BASHIR ZAIN BASHIRChairman and Chief Executive Director
Quarterly Accounts Mar. 2013 14

Consolidated Condensed Interim Profit And Loss Account (Un-audited)For The Nine Months Ended March 31, 2013
January to March 2013
January to March 2012
July to March 2013
July to March 2012
------------------------------(Rupees '000s)-----------------------------
Sales 8,241,848 6,484,890 21,574,083 18,350,768
Cost of sales Opening stock of finished goods 6,596,088 5,939,949 5,012,308 6,312,736 Cost of goods manufactured 6,160,237 4,613,670 16,419,927 13,497,330 Purchases and processing charges 1,765,346 616,843 4,420,221 1,622,373 Closing stock of finished goods (7,619,734) (5,669,904) (7,619,734) (5,669,904)
6,901,937 5,500,558 18,232,721 15,762,535
Gross profit 1,339,911 984,332 3,341,362 2,588,233
Distribution cost 390,913 342,397 1,040,414 887,800 Administrative expenses 305,188 253,838 847,037 742,573 Other operating expenses 20,083 - 39,689 -
716,184 596,235 1,927,140 1,630,373
623,727 388,097 1,414,222 957,860
Other operating income 3,007 5,235 25,127 15,505
Quarter ended Nine months ended
Operating profit 626,734 393,332 1,439,349 973,365
Finance cost 347,575 369,935 923,721 1,057,714
Profit/(loss) before taxation 279,159 23,397 515,628 (84,349)
Provision for taxation 70,138 65,077 129,154 182,843
Profit/(loss) after taxation 209,021 (41,680) 386,474 (267,192)
-----------------------------------(Rupees)-------------------------------Re-Stated Re-Stated
Earning/(loss) per share - basic anddiluted (Rs.) 1.40 (0.30) 2.71 (1.93)
The annexed notes 1 to 10 form an integral part of these consolidated condensed interim financial information.
MOHOMED BASHIRChairman and Chief Executive Director
ZAIN BASHIR
Quarterly Accounts Mar. 2013 15

Consolidated Condensed Interim Statement Of Comprehensive Income (Un-audited)For The Nine Months Ended March 31, 2013
January to March 2013
January to March 2012
July to March 2013
July to March 2012
----------------------------(Rupees '000s)---------------------------
Profit/(loss) after taxation 209,021 (41,680) 386,474 (267,192)
Other comprehensive income 367 2,498 9,134 17,545
Total comprehensive income 209,388 (39,182) 395,608 (249,647)
The annexed notes 1 to 10 form an integral part of these consolidated condensed interim financial information.
MOHOMED BASHIR ZAIN BASHIRChairman and Chief Executive Director
Quarter ended Nine months ended
Quarterly Accounts Mar. 2013 16

Consolidated Condensed Interim Cash Flow Statement (Un-audited)For The Nine Months Ended March 31, 2013
Nine months
March 31, 2013
March 31, 2012
------------(Rupees '000s)------------
CASH FLOWS FROM OPERATING ACTIVITIES
Profit/(loss) before taxation 515,628 (84,349)
Adjustments for: Depreciation 558,043 544,525 Amortisation 10,625 11,432 Provision for gratuity 14,992 21,290 Finance cost 923,721 1,057,714 Provision for slow moving/obsolete items 9,216 7,728 Provision for doubtful debts 22,369 21,900 Profit on sale of property, plant and equipment (16,327) (9,390)
2,038,267 1,570,850 Changes in working capital:
(Increase)/decrease in current assets Stores, spares and loose tools (23,966) (2,058) Stock-in-trade (4,643,630) 1,141,220 Trade debts (876,696) (641,904) Loans and advances (332,237) (199,032) Prepayments (74,795) (78,557) Other receivables (1,176) 61,949 Tax refunds due from government (85,983) 31,987
(6,038,483) 313,605 (6,038,483) 313,605 Increase in current liabilities Trade and other payables 1,068,635 705,743
(4,969,848) 1,019,348 Cash (used in)/generated from operations (2,931,581) 2,590,198
Payments for: Gratuity (12,254) (5,208) Finance cost (857,811) (1,031,536) Income tax paid (241,875) (162,596) Long term loans and advances 1,309 1,202 Long term deposits (1,715) (9,591) Net cash (used in)/generated from operating activities (4,043,927) 1,382,469
Quarterly Accounts Mar. 2013 17

Consolidated Condensed Interim Cash Flow Statement (Un-audited)For The Nine Months Ended March 31, 2013
Nine months
March 31, 2013
March 31, 2012
------------(Rupees '000s)------------
CASH FLOWS FROM INVESTING ACTIVITIES
Addition to property, plant and equipment (872,752) (589,519) Addition to intangible assets (6,363) (2,020) Proceeds from sale of property, plant and equipment 66,629 25,222 Net cash used in investing activities (812,486) (566,317)
CASH FLOWS FROM FINANCING ACTIVITIES
Long term loans acquired 532,791 355,784 Repayments of long term loans (550,895) (541,483) Proceeds from issue of right shares 253,914 -
Net cash generated from/(used) in financing activities 235,810 (185,699) Exchange difference on translation of foreign subsidiaries 9,134 17,545
Net (decrease)/ increase in cash and cash equivalents (4,611,469) 647,998
Cash and cash equivalents - at the beginning of the period (7,209,802) (9,731,717)
Cash and cash equivalents - at the end of the period (11,821,271) (9,083,719)
CASH AND CASH EQUIVALENTS
Cash and cash equivalents comprises of :
Cash and bank balances 185,335 138,139 Short term borrowings (12,006,606) (9,221,858)
(11,821,271) (9,083,719)
The annexed notes 1 to 10 form an integral part of these consolidated condensed interim financial information.
MOHOMED BASHIR ZAIN BASHIRChairman and Chief Executive Director
Quarterly Accounts Mar. 2013 18

Consolidated Condensed Interim Statement Of Changes In Equity (Un-audited) For The Nine Months Ended March 31, 2013
Share capital
Revenue reserve
Exchange difference on translation of
foreign subsidiaries
Capital reserve
Statutory reserve
Reserve for Issue of bonus
share
Un-appropriated
profit Total
Balance as at June 30, 2011 634,785 2,430,000 44,788 450,446 8,290 - 1,278,023 4,846,332
Transfer to reserve for issue of bonus shares - - - (450,446) - 634,786 (184,340) -
Transfer to revenue reserve - 1,000,000 - - - - (1,000,000) -
Transaction with owners
Issuance of bonus shares for the year 634,786 - - - - (634,786) - -
Total comprehensive income
- - - - - - (267,192) (267,192)
Other comprehensive income - - 17,545 - - - - 17,545
Total comprehensive income for the period - - 17,545 - - - (267,192) (249,647)
Balance as at March 31, 2012 1,269,571 3,430,000 62,333 - 8,290 - (173,509) 4,596,685
Transfer to statutory reserve - - - - 1,856 - (1,856) -
Total comprehensive income
Loss for the nine months ended March 31, 2012
-----------------------------------------------------------------------------------(Rupees '000s)---------------------------------------------------------------------------------
Total comprehensive income
Profit for the period April 1, 2012 to June 30, 2012 - - - - - - 51,607 51,607
Other comprehensive income - - 4,758 - - - - 4,758
Total comprehensive income for the year - - 4,758 - - - 51,607 56,365
Balance as at June 30, 2012 1,269,571 3,430,000 67,091 - 10,146 - (123,758) 4,653,050
Transfer from revenue reserve - (250,000) - - - - 250,000 -
Transaction with owners
Issue of right shares 253,914 - - - - - - 253,914
Total comprehensive income
Profit for the nine months ended March 31, 2013 - - - - - - 386,474 386,474
Other comprehensive income - - 9,134 - - - - 9,134
Total comprehensive income for the period - - 9,134 - - - 386,474 395,608
Balance as at March 31, 2013 1,523,485 3,180,000 76,225 - 10,146 - 512,716 5,302,572
The annexed notes 1 to 10 form an integral part of these consolidated condensed interim financial information.
MOHOMED BASHIRChairman and Chief Executive Director
ZAIN BASHIR
Quarterly Accounts Mar. 2013 19
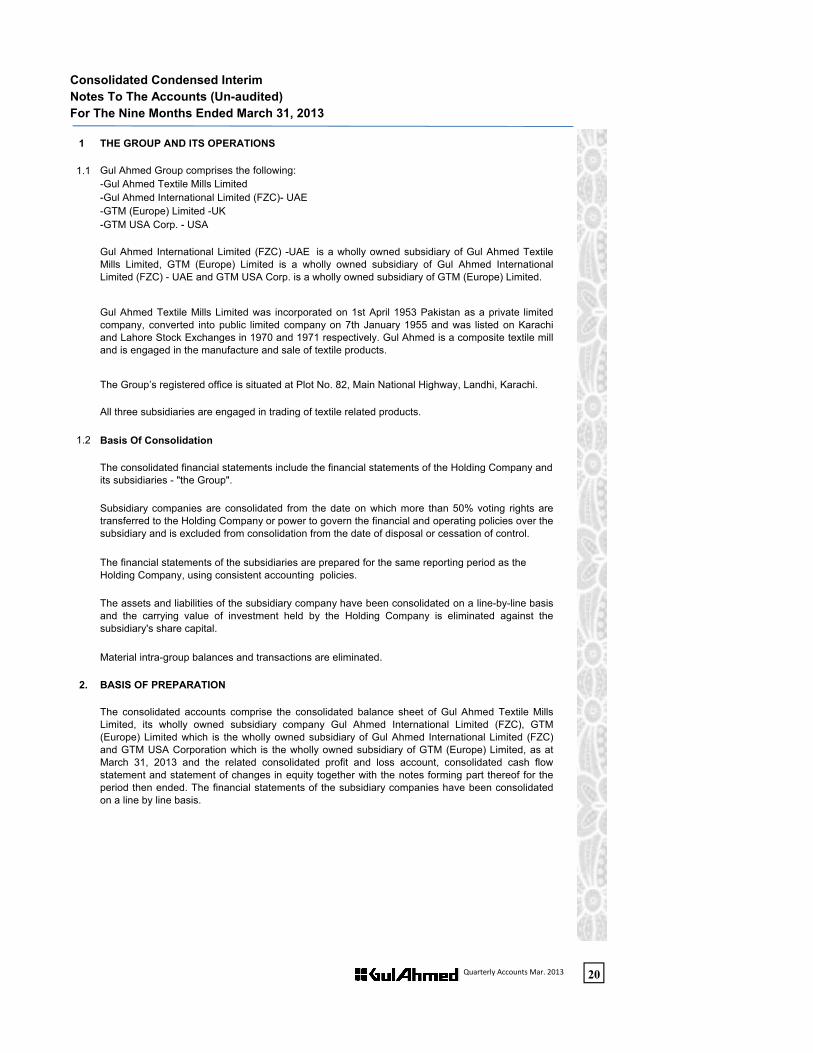
Consolidated Condensed Interim Notes To The Accounts (Un-audited)For The Nine Months Ended March 31, 2013
1 THE GROUP AND ITS OPERATIONS
1.1 Gul Ahmed Group comprises the following:-Gul Ahmed Textile Mills Limited-Gul Ahmed International Limited (FZC)- UAE-GTM (Europe) Limited -UK-GTM USA Corp. - USA
The Group’s registered office is situated at Plot No. 82, Main National Highway, Landhi, Karachi.
All three subsidiaries are engaged in trading of textile related products.
1.2 Basis Of Consolidation
Gul Ahmed International Limited (FZC) -UAE is a wholly owned subsidiary of Gul Ahmed TextileMills Limited, GTM (Europe) Limited is a wholly owned subsidiary of Gul Ahmed InternationalLimited (FZC) - UAE and GTM USA Corp. is a wholly owned subsidiary of GTM (Europe) Limited.
Gul Ahmed Textile Mills Limited was incorporated on 1st April 1953 Pakistan as a private limitedcompany, converted into public limited company on 7th January 1955 and was listed on Karachiand Lahore Stock Exchanges in 1970 and 1971 respectively. Gul Ahmed is a composite textile milland is engaged in the manufacture and sale of textile products.
The consolidated financial statements include the financial statements of the Holding Company and its subsidiaries - "the Group".
Material intra-group balances and transactions are eliminated.
2. BASIS OF PREPARATION
The consolidated accounts comprise the consolidated balance sheet of Gul Ahmed Textile MillsLimited, its wholly owned subsidiary company Gul Ahmed International Limited (FZC), GTM(Europe) Limited which is the wholly owned subsidiary of Gul Ahmed International Limited (FZC)and GTM USA Corporation which is the wholly owned subsidiary of GTM (Europe) Limited, as atMarch 31, 2013 and the related consolidated profit and loss account, consolidated cash flowstatement and statement of changes in equity together with the notes forming part thereof for theperiod then ended. The financial statements of the subsidiary companies have been consolidatedon a line by line basis.
Subsidiary companies are consolidated from the date on which more than 50% voting rights aretransferred to the Holding Company or power to govern the financial and operating policies over thesubsidiary and is excluded from consolidation from the date of disposal or cessation of control.
The assets and liabilities of the subsidiary company have been consolidated on a line-by-line basisand the carrying value of investment held by the Holding Company is eliminated against thesubsidiary's share capital.
The financial statements of the subsidiaries are prepared for the same reporting period as the Holding Company, using consistent accounting policies.
Quarterly Accounts Mar. 2013 20

Notes to the Condensed Interim Consolidated Financial Information (Un-audited)For The Nine Months Ended March 31, 2013
3. ACCOUNTING POLICIES
4. CONTINGENCIES AND COMMITMENTS
These consolidated condensed interim financial information of the Group for the nine months ended March31, 2013 have been prepared in accordance with the requirements of the International AccountingStandards 34 - Interim Financial Reporting and provisions of and directives issued under the CompaniesOrdinance, 1984. In case where requirements differ, the provisions of or directives issued under theCompanies Ordinance, 1984 have been followed.
These consolidated condensed interim financial information comprise of the consolidated condensed interimbalance sheet as at March 31, 2013 and the consolidated condensed interim profit and loss account,consolidated condensed interim statement of comprehensive income, consolidated condensed interim cashflow statement and consolidated condensed interim statement of changes in equity for the nine monthsended March 31, 2013.
The comparatives balance sheet, presented in these consolidated condensed interim financial information,as at June 30, 2012 has been extracted from the audited financial statements of the Group for the yearended June 30, 2012 whereas the comparative consolidated condensed interim profit and loss account,consolidated condensed interim statement of comprehensive income, consolidated condensed interim cashflow statement and consolidated condensed interim statement of changes in equity are for the nine monthsended March 31, 2012 have been extracted from the consolidated condensed interim financial informationof the Group for the nine months ended March 31, 2012.
Accounting policies and method of computations adopted for the preparation of these consolidatedcondensed interim financial information are the same as those applied in the preparation of the consolidatedfinancial statements for the year ended June 30, 2012
(a)
(b) Post dated cheques Rs. 194 million (June-2012: Rs.153 million) issued to various Government Agencies.
(c) Bills discounted Rs. 1,471 million (June-2012: Rs. 1,731 million)
(d)
CommitmentsGroup is committed for certain expenditures which are stated as follows:
March 31, 2013
June 30, 2012
------------(Rupees '000s)------------- Capital expenditure 171,424 196,876 - Non capital expenditure items under letters of credits 220,431 373,728
391,855 570,604
Guarantees issued by Bank on behalf of the Group as at period end for Rs.287 million (June-2012: Rs.260 million) were outstanding.
Corporate guarantee of Rs. 100.123 million (June-2012: Rs. 96.420) has been issued to a bank in favour of subsidiary company.
The status of contingencies, as reported in the annual financial statements for the year ended June 30,2012except as stated below, remained unchanged during the current period.
Quarterly Accounts Mar. 2013 21
Notes to the Condensed Interim Consolidated Financial Information (Un-audited)For The Nine Months Ended March 31, 2013
March 31, 2013
June 30, 2012
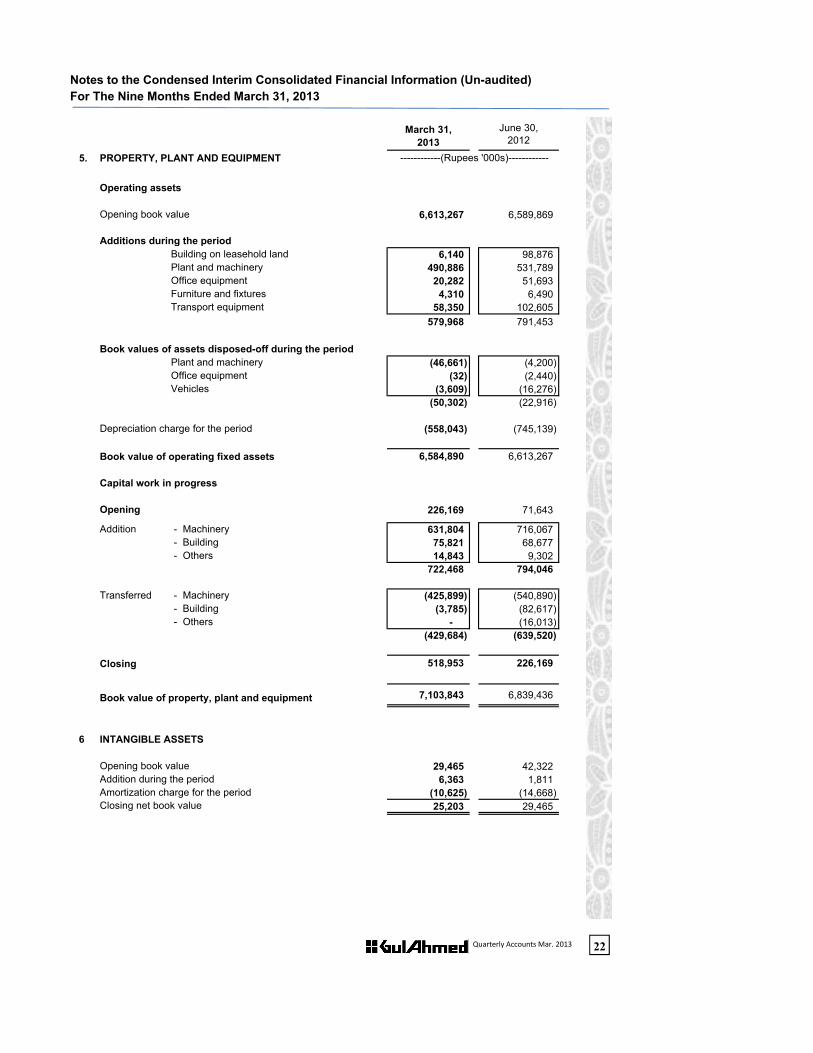
5. PROPERTY, PLANT AND EQUIPMENT ------------(Rupees '000s)------------
Operating assets
Opening book value 6,613,267 6,589,869
Additions during the periodBuilding on leasehold land 6,140 98,876 Plant and machinery 490,886 531,789 Office equipment 20,282 51,693 Furniture and fixtures 4,310 6,490 Transport equipment 58,350 102,605
579,968 791,453
Book values of assets disposed-off during the periodPlant and machinery (46,661) (4,200) Office equipment (32) (2,440) Vehicles (3,609) (16,276)
(50,302) (22,916)
Depreciation charge for the period (558,043) (745,139)
Book value of operating fixed assets 6,584,890 6,613,267
Capital work in progress
Opening 226,169 71,643
Addition - Machinery 631,804 716,067 - Building 75,821 68,677
- Others 14,843 9,302 722,468 794,046
Transferred - Machinery (425,899) (540,890) - Building (3,785) (82,617)
- Others - (16,013) (429,684) (639,520)
Closing 518,953 226,169
Book value of property, plant and equipment 7,103,843 6,839,436
6 INTANGIBLE ASSETS
Opening book value 29,465 42,322Addition during the period 6,363 1,811Amortization charge for the period (10,625) (14,668)Closing net book value 25,203 29,465
Quarterly Accounts Mar. 2013 22

Notes to the Condensed Interim Consolidated Financial Information (Un-audited)For The Nine Months Ended March 31, 2013
7. SEGMENT INFORMATION
The Group has the following three reportable business segments:
a) Spinning: Production of different qualities of yarn using both natural and artificial fibers
b) Processing: Production of grey fabric, its processing into various types of fabrics for sale as well as to manufacture home textile products
c) Overseas subsidiaries: These subsidiaries are also in the textile business reselling product to the ultimate customers, imported from Parent Company
Transactions among the business segments are recorded at cost.
7.1 Segmental Profitability
March 2013
March 2012
March 2013
March 2012
March 2013
March 2012
March 2013
March 2012
March 2013
March 2012
March 2013
March 2012
March 2013
March 2012
Sales 7,876,359 7,329,287 14,750,156 13,537,370 384,893 329,083 570,127 1,010,838 11,452 - (2,018,904) (3,855,810) 21,574,083 18,350,768Cost of Sales 7,055,178 7,379,764 12,361,470 11,028,920 310,181 265,686 528,548 958,990 - - (2,022,656) (3,870,825) 18,232,721 15,762,535
Gross profit 821,181 (50,477) 2,388,686 2,508,450 74,712 63,397 41,579 51,848 11,452 - 3,752 15,015 3,341,362 2,588,233
GTM (EUROPE) LIMITED UK
For the nine months
------------------------------------------------------------------------------------------------------------ (Rs. 000s) -------------------------------------------------------------------------------------------------------------
GTM USA CORP. ELIMINATION OF INTER
SEGMENT TRANSACTION
TOTAL COMPANY SPINNING PROCESSING GUL AHMED
INTERNATIONAL LIMITED FZC- UAE
Administrative & selling expenses 199,360 106,862 1,576,339 1,436,678 60,763 46,530 39,175 40,303 11,814 - - - 1,887,451 1,630,373
621,821 (157,339) 812,347 1,071,772 13,949 16,867 2,404 11,545 (362) - 3,752 15,015 1,453,911 957,860
Financial charges 923,721 1,057,714 Other operating expenses 39,689 - Other operating income (25,127) (15,505) Taxation 129,154 182,843
Profit/(loss) after taxation 386,474 (267,192)
7.2 Segment assets and liabilities
March 2013
June 2012
March 2013
June 2012
March 2013
June 2012
March 2013
June 2012
March 2013
June 2012
March 2013
June 2012
March 2013
June 2012
Assets 7,501,754 5,214,791 14,440,188 10,811,953 325,540 208,829 134,063 236,046 10,085 9,588 1,979,969 1,495,903 24,391,599 17,977,110
Liabilities 1,091,636 1,181,032 4,007,341 3,409,303 75,815 15,056 52,273 80,173 2,623 2,625 13,859,339 8,635,871 19,089,027 13,324,060
7.3 Unallocated items represent those assets, liabilities income and expenses which are common to all segments and investment in subsidiaries.
Profit/(loss) before tax and before charging following
Processing GUL AHMED
INTERNATIONAL LIMITED FZC- UAE
GTM (EUROPE) LIMITED UK Spinning GTM USA CORP. Unallocated Total Company
Quarterly Accounts Mar. 2013 23

Notes to the Condensed Interim Consolidated Financial Information (Un-audited)For The Nine Months Ended March 31, 2013
7.4 Information by geographical area
March 2013
March 2012
March 2013
June 2012
Pakistan 9,753,144 7,597,996 7,166,392 6,906,156 Germany 2,166,656 1,839,309 - - United Kingdom 2,280,148 1,843,919 2,618 3,621 United States 1,413,856 1,309,835 4,288 3,782 China 1,478,952 1,524,245 - - France 831,000 682,916 - Netherland 768,682 683,885 - United Arab Emirates 391,529 522,183 6,855 6,043 Other Countries 2,490,116 2,346,480 - - Total 21,574,083 18,350,768 7,180,153 6,919,602
8. TRANSACTIONS AND BALANCES WITH RELATED PARTIES
Relationship with The Company
Nature of transaction July 01, 2012 to March 31,
2013
July 01, 2011 to March 31,
2012
------------(Rupees '000s)------------Associated Companies Purchase of goods 54,302 35,371& other related parties Sale of goods 650 4,821
Revenue Non-current assets
------------------------------------ (Rs. 000s) ----------------------------------
The related parties comprise subsidiaries, associated companies, companies where directors alsohold directorship, directors of the Group and key management personnel. The Group in the normalcourse of business carried out transaction with various related parties.
& other related parties Sale of goods 650 4,821Rent paid 5,400 4,365Fees paid 1,250 1,000Commission / Rebate received 2,603 2,900Bills discounted 918,806 442,717Commission / Bank charges paid 18,466 15,224Mark up / Interest charged 84,706 91,362Provident Fund Contribution 41,390 37,421
Outstanding Balances Nature of balances
As at March 31,
2013
As at June 30,
2012
Associated Companies Deposit with bank 60,361 44,498& other related parties Borrowing from bank 1,447,050 1,144,905
Bank guarantee 223,472 203,472Trade & other payable 8,189 12,615Accrued Mark up 16,880 26,430Trade debts 5,055 759Loans to key management personnel 2,599 5,183
There are no transactions with directors of the Group and key management personnel other thanthose under the terms of employment for the period ending Mar-2013 amounting to Rs. 312 million(Mar-2012: Rs. 287 million) on account of remuneration.
Quarterly Accounts Mar. 2013 24
Notes to the Condensed Interim Consolidated Financial Information (Un-audited)For The Nine Months Ended March 31, 2013
9. DATE OF AUTHORISATION
10. GENERAL
Figures have been rounded off to the nearest thousand rupees.
ZAIN BASHIRDirectorChairman and Chief Executive
These consolidated condensed interim financial information were authorised for issue on April 25,2013 by the Board of Directors of the Group.
Allocations for the workers' profit participation fund, workers' welfare fund and taxation are interim andfinal liability will be determined on the basis of annual results.
MOHOMED BASHIR
Quarterly Accounts Mar. 2013 25