texas triangle as megalopolis
TRANSCRIPT

8/14/2019 Texas Triangle as Megalopolis
http://slidepdf.com/reader/full/texas-triangle-as-megalopolis 1/6
HoustonBusinessFEDERALRESERVEBANKOFDALLAS • HOUSTONBRANCH • APRIL2004
A Perspective on the Houston Economy
them to seek out roles thatcomplemented economicstrengths developing elsewherein the Triangle. 1 Where one citywas strong, the others wouldbe weak, so the cities’ matureindustrial structures could fittogether neatly, like pieces of a puzzle, with little overlap.A comparison of the cities’
strengths indicated such indus-trial complementarity exists,and statistical tests stronglyconfirmed the app arent com-pleme ntarity is no illusion.
This article looks at thesame puzzle, but from a differ-ent angle. If the Triangle citiesare really a megalopolis, dividedinto four parts by geographyand history, their complemen-
tarity implies we can add thefour together and approximatewhat would have developed inthat other reality with a longriver or saltwater bay. If ourhypothesis is reasonable, weshould be able to compare theindustrial structure of the com-bined Triangle cities to NewYork, Los Angeles and the othertop U.S. metro areas, and itsplace in the hierarchy of U.Scities should be comparable.When we’re finished, we wouldknow whether the combined
The Texas Triangleas Megalopolis
If the Triangle cities
are really a megalopolis,divided into four parts
by geography and history, their
complementarityimplies we can add
the four together and
approximate what would have developed
in that other realitywith a long river or
saltwater bay.
he January issue of Hous-ton Business proposed that the
Texas Triangle metro areas of Austin, Dallas/Fort Worth,Houston and San Antonio existas distinct cities largely becauseof Texas geography. With along, navigable river reachingthe heart of the state or a deepsaltwater bay or other inletmaking Waco or Temple a sea-port, many of the roles playedby the Triangle cities could
have been combined at a singlelocation. Combining Houston’sport, Dallas’ inland distributionfunction, San Antonio’s reachinto deep South Texas andnorthern Mexico, and even thestate’s political capital into oneplace could have produced aThird Coast megalopolis torival New York, Los Angelesand Chicago.
The previous article alsosuggested that the Trianglecities did not develop inde-pendently, as proximity forced
T

8/14/2019 Texas Triangle as Megalopolis
http://slidepdf.com/reader/full/texas-triangle-as-megalopolis 2/6
Texas Triangle cities would
constitute a megalopolis.
ComparisonsTable 1 lists the nation’s six
largest metropolitan areas,ranked by population and totalpersonal income in 2001: NewYork, Los Angeles, Chicago,Washington, San Francisco andPhiladelphia. 2 The combinedTexas Triangle metro areas rank as
No. 3 when inserted into thelist, with 13.2 million people,behind Los Angeles (16.7 mil-lion) and ahead of Chicago (9.3million). The top cities are th esame whether ranked by popu-lation or personal income,although Washington and SanFrancisco switch places, withWashington one place aheadbased on population and SanFrancisco ahead on personalincome. 3
Table 1 shows wide dispar-ity in per capita income for themetro areas. San Francisco andNew York stand at the top of the list, and the Texas Triangleand Los Angeles are at the bot-tom. Where reasonable com-parisons could be found, cost-of-living indexes are shown. 4
They strongly suggest that highper capita income and a highcost of living are related, andhigh living costs may play a
role in elevating local income
levels. Even aside from thecost-of-living figures, however,we see that per capita incomein the Texas Triangle is not thatmuch different from Philadel-phia, Chicago and Los Angeles.
To look at the industrialstructure of the nation’s largestmetro areas, we turn to thelocation quotient ( LQ ij ), definedas it was in the January article.
percent share of income earned
LQij =in industry i in city j
percent share of income earnedin industry i in the United States
If LQ ij is greater than 1, it indi-cates a larger than normal con-centration of activity in the city(with “normal” based on a typi-cal place in the United States)and that industry i is a likelysource of exports. If LQ
ijis less
than 1, the industry is not wellrepresented in the city, and thegoods or services the industryproduces are probably imported.For goods and services that areinherently local—dry cleanersand grocery stores, for exam-ple— the location quotient istypically close to 1, as thegoods or services are neitherexported nor impo rted. (Exportsand imports are defined as goodsand services that leave or enterthe metro area, not necessarily
those that cross international
borders.)Table 2 lists all location
quotients greater than 1.15 forthe Texas Triangle and the sixlargest U.S. metro areas, indi-cating ind ustries that are 15percent or more overrepre-sented in the metro area com-pared with a typical place inthe United States. The list isbased on wages, salaries and
emp loyer-paid ben efits in 2000,using the Standard IndustrialClassification system, in useuntil last year. About 60 indus-tries were available in the TexasTriangle, for example. 5 The listgives us a good idea of thesecities’ exports, important indefining the local economybecause e xports generate theincome to pay for imports andsupport local activity.
Major Metro ProfilesExport industries in the
Texas Triangle include oil (oilextraction, oil refining, com-mod ity ch emicals), sop histi-cated corporate services (engi-neering and managementservices, business services),transportation (air transporta-tion, water transportation, trans-portation services), communi-cations and wholesale trade.Financial strength is limited to
Table 1
Economic Characteristics of Texas Triangle a nd M ajor U.S. M etro Areas, 2001
Population Personal income Per capita income Cost of livingM illions Rank Billions of dollars Rank (dollars) (U.S. = 100)
New York 21.3 1 872.7 1 40,949 n/aLos Angeles 16.7 2 508.2 2 30,360 140.9Texas Triangle 13.2 3 433.4 3 32,897 96.7Chicago 9.3 4 331.3 4 35,751 n/aWashington 7.8 5 302.7 6 38,915 112.3San Francisco 7.1 6 326.8 5 45,778 183.0Philadelphia 6.2 7 216.2 7 34,750 121.1
NOTE: All metro area population and income figures are based on the c onsolidated metro area definition. This includes the Texas Triangle definition, except for Austin and San Antonio,for w hich an M SA definition is used. The cost-of-living f igures use the best possible fit, using primary metro area data, for example, for Los Angeles and Philadelphia.
SOURCES: Bureau of Economic Analysis; American Chamber of Commerce Research Association.
2

8/14/2019 Texas Triangle as Megalopolis
http://slidepdf.com/reader/full/texas-triangle-as-megalopolis 3/6
gion. The industries that re-main after comb ining the Trian-gle cities into a single metroarea are true national indus-tries, reaching outside the stateto the rest of the nation. Thisfall in the number of industriesis one more indication of thedeep -seated e conomic interde-pendence among the fourmetro areas.
The LQ s work well in iden-tifying a predictable list of
national indu stries for thelargest U.S. metro areas: ap-parel and financial services inNew York; movies, amusementsand transportation services inLos Angeles; primary and fabri-cated metals in Chicago; gov-ernment in Washington; hightech in San Francisco; andhealth care and pharmaceuti-cals in Philadelphia.
Corporate services are animportant feature common to
real estate and investment com-panies.
The most striking aspect of the Texas Triangle list is that ithas only 16 export industries.This compares with the 54 forthe cities separately: six inAustin, 14 in Dallas/Fort Worth,15 in Houston and 19 in SanAntonio. 6 The collapse in thenumber of export industries isthe result of many of themserving only the Triangle re-
Table 2Export Sectors in M ajor U.S. M etro Areas, as Indic ated by Location Quotients
Texa s Triangle. Oil and gas ext ract ion (7.49); heavy construc tion (1.73); electr onic and other elec tric equipment (1.54); chemicals andallied products (1.21); petroleum and coal products (2.22); water transportat ion (1.32); transportation by air (1.71); transportation services(2.52); communications (1.41); electric, gas, and sanitary services (2.15); wholesale trade (1.31); real estate (1.31); holding and otherinvestment companies (1.54); business services (1.17); miscellaneous repair (1.19); engineering and management services (1.20).
New York. Other forestr y and f ishing (4.19); apparel and other t extiles (1.63); printing and publishing (1.70); chemicals and all ied produc ts
(1.76); local and interurban transportation (1.98); communications (1.37); apparel and accessory stores (1.42); depository and nondeposi-tory institutions (1.47); security and c ommodity brokers (4.95); insurance carrier s (1.28); insurance agents, brokers and services (1.20);real estate (1.15); holding and other investment offices (2.74); private households (1.33); motion pictures (1.58); legal services (1.62);educational services (1.33); social services (1.29); museums, botanical and zoological gardens (1.62); engineering and managementservices (1.18).
Los Angele s. Furniture and fixtures (1.43); other transportat ion equipment (1.95); instruments and r elated products (1.84); miscellaneousmanufacturing industries (1.42); apparel and other t extiles (2.71); petroleum and coal products (1.37); water t ransportation (1.87);transportat ion servic es (1.63); food stores (1.61); apparel and accessories (1.25); home furniture and furnishings stores (1.24); real estate(1.48); private households (1.90); auto repair and services (1.17); miscellaneous repair services (1.21); amusement and recreation services(1.90); motion pictures (8.91); legal services (1.25); engineering and management services (1.70); local government (1.19).
Chicago. Primary metal industr ies (2.10); fabricated metal products (1.53); electr onic and other elec tric al equipment (1.37); miscellaneousmanufacturing industries (1.22); food and kindred products (1.29); printing and publishing (1.41); chemicals and allied products (1.17);petroleum and coal (1.30); rubber and miscellaneous plastics (1.37); tr ansportation by air (1.48); transportat ion services (1.49); wholesaletrade (1.28); depository and nondepository institutions (1.28); secur ity and commodity dealers (1.16); insurance c arrier s (1.30); holding andother investment companies (1.18); business services (1.17); legal services (1.53); museums, botanical and zoological gardens (1.82);membership organizations (1.19); engineering and management services (1.41).
Washington . Other forestry and fishing (13.1); business services (1.55); legal services (1.77); educational services (1.40);social services (1.17); membership organizations (2.19); engineering and management services (1.94); federal civilian government (4.78);military (1.99).
San Francisco. Industrial machinery (3.52); electr onic and other elec tric equipment (3.36); instruments and related produc ts (3.34);petroleum and coal product s (2.20); water transportat ion (1.21); apparel and acc essories (1.58); home furniture and furnishings stores(1.39); security and commodity brokers (1.50); business services (2.20); engineering and management services (1.36).
Philadelphia. Chemicals and allied pr oducts (3.66); local and interurban transportation (1.26); apparel and accessories (1.20); miscella-neous retail (1.16); depository and nondepository insti tutions (1.40); insurance carr iers (1.49); insurance agents, brokers and services(1.43); hotels and other lodging (2.30); health services (1.21); legal services (1.46); educational services (2.12); social services (1.43);engineering and management services (1.15).
NOTE: Location quotients are shown in parentheses; onlyLQ s greater than 1.15 are shown.
SOURCE: Author’s ca lculat ions.
3
8/14/2019 Texas Triangle as Megalopolis
http://slidepdf.com/reader/full/texas-triangle-as-megalopolis 4/6
the largest metro areas, withengineering and managementservices the only export from allcities. Five cities export legalservices and four export busi-
ness services. Financial servicesare strong in Chicago and NewYork, w hile Philadelphia a ndSan Francisco show strength insome financial services. Wash-ington, Los Angeles and theTexas Triangle show little or nostrength in financial servicesother than in real estate.
In manufacturing, bothpetroleum refining and chemi-cals are found in four cities.Silicon Valley gives San Fran-cisco a strong tech sector, evi-denced by exports of instru-ments, electrical machinery andnon electrical machinery. TheTexas Triangle and Chicagoalso export electrical machinery.
Water transpo rtation andtransportation services are im-portant in two cities, as well asthe Texas Triangle. Air trans-portation emerges as an exp ortonly in Chicago and the Triangle.
Four cities are meccas for
retail apparel shopping (NewYork, Philadelphia, San Fran-cisco and Los Angeles) and twofor retail home furnishings (LosAngeles and San Francisco).
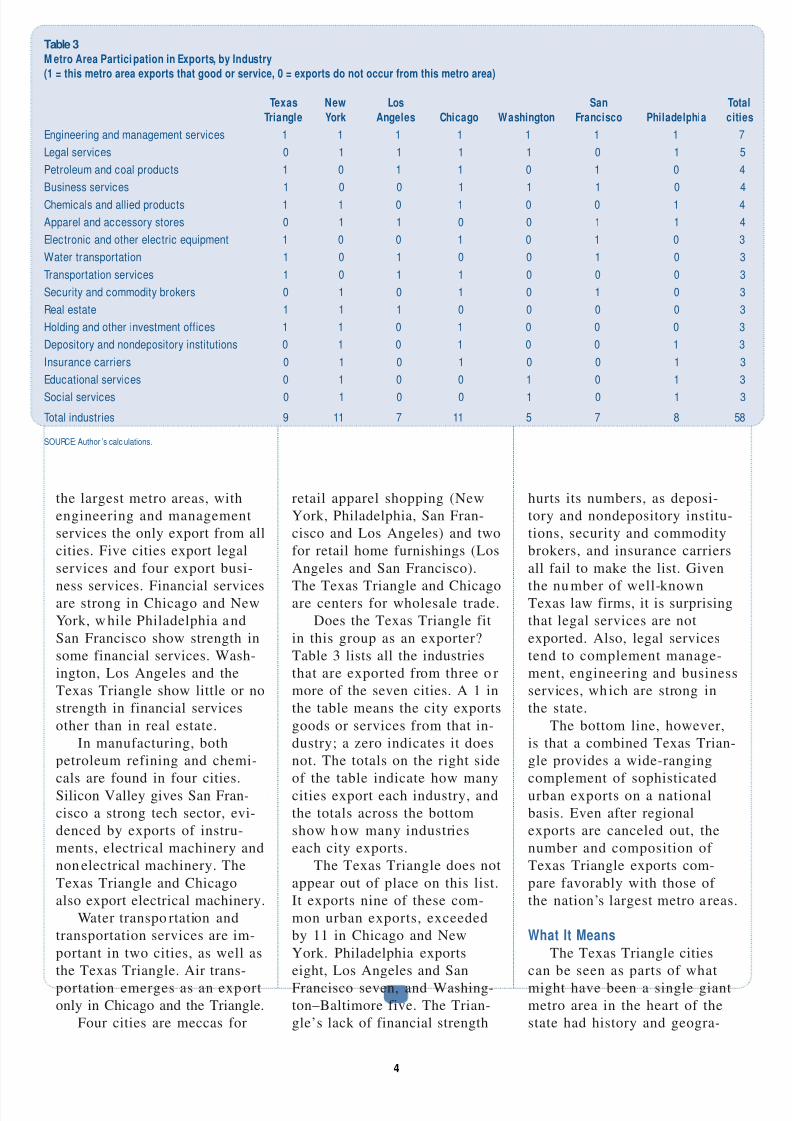
The Texas Triangle and Chicagoare centers for wholesale trade.Does the Texas Triangle fit
in this group as an exporter?Table 3 lists all the industriesthat are exported from three o rmore of the seven cities. A 1 inthe table means the city exportsgoods or services from that in-dustry; a zero indicates it doesnot. The totals on the right sideof the table indicate how manycities export each industry, andthe totals across the bottomshow h ow many industrieseach city exports.
The Texas Triangle does notappear out of place on this list.It exports nine of these com-mon urban exports, exceededby 11 in Chicago and NewYork. Philadelphia exportseight, Los Angeles and SanFrancisco seven, and Washing-ton–Baltimore five. The Trian-gle’s lack of financial strength
hurts its numbers, as deposi-tory and nondepository institu-tions, security and commoditybrokers, and insurance carriersall fail to make the list. Given
the nu mber of well-knownTexas law firms, it is surprisingthat legal services are notexported. Also, legal servicestend to complement manage-ment, engineering and businessservices, wh ich are strong inthe state.
The bottom line, however,is that a combined Texas Trian-gle provides a wide-rangingcomplement of sophisticatedurban exports on a nationalbasis. Even after regionalexports are canceled out, thenumber and composition of Texas Triangle exports com-pare favorably with those of the nation’s largest metro a reas.
What It MeansThe Texas Triangle cities
can be seen as parts of whatmight have been a single giantmetro area in the heart of thestate had history and geogra-
Table 3
M etro Area Participation in Exports, by Industry(1 = this metro area exports that good or service, 0 = exports do not occur from this metro area)
Texas New Los San TotalTriangle York Angeles Chicago Washington Francisco Philadelphia cities
Engineering and management services 1 1 1 1 1 1 1 7Legal services 0 1 1 1 1 0 1 5Petroleum and coal products 1 0 1 1 0 1 0 4Business services 1 0 0 1 1 1 0 4Chemicals and allied products 1 1 0 1 0 0 1 4Apparel and accessory stores 0 1 1 0 0 1 1 4Electronic and other electric equipment 1 0 0 1 0 1 0 3Water transportation 1 0 1 0 0 1 0 3Transportation services 1 0 1 1 0 0 0 3Security and commodity brokers 0 1 0 1 0 1 0 3Real estate 1 1 1 0 0 0 0 3Holding and other investment offices 1 1 0 1 0 0 0 3Depository and nondepository institutions 0 1 0 1 0 0 1 3Insurance carriers 0 1 0 1 0 0 1 3Educational services 0 1 0 0 1 0 1 3Social services 0 1 0 0 1 0 1 3
Total industries 9 11 7 11 5 7 8 58
SOURCE: Author ’s calc ulations.
4
8/14/2019 Texas Triangle as Megalopolis
http://slidepdf.com/reader/full/texas-triangle-as-megalopolis 5/6
phy been different. Still, theproximity of the pieces—Hous-ton, Dallas/Fort Worth, Austinand San Antonio —forced themto specialize in such a way thatthey strongly complement eachother. That complementarityallows us to add them togetherfor a reasonable approximationof what the single Texas mega-lopolis might have looked likehad geography only cooperated.
Adding the pieces of thefour metros dramatically short-ens the list of metro exports.Individually, the four metroshave 54 export industries, but
combined, the Texas Trianglehas only 16. These remainingindustries are national indus-tries, and those that disappearhave sales that occur onlywithin the Triangle. This lastobservation is the flip side of the previous article’s conclu-sion: The cities are economiccomplements, with strength inany one city matched b y weak-
ness elsewhe re. Growth in on ecity stimulates growth in com-plementary industries, many of which will be located elsewherein the Triangle.
There is no question thatthe Texas Triangle cities havedeveloped their own pe rsonali-ties. Dallas and Houston areconservative and highly busi-ness-oriented; San Antonio is a
more relaxed mix of agricul-ture, the military and tourism.Austin is music, high tech anduniversity life, set against thebackdrop of state politics.These p ersonality differences,along with sibling rivalries,breed their own intercitysquabbles.
Dallas has long pumpeditself up with the myth that ithas no economic reason toexist and that it lives by its witsalone, despite the fact that itsniche as a distribution and
County; Chicago– Gary– Kenosha;Washington –Baltimore; San Francisco–Oakland –San Jose; Philadelphia –Wilmington –Atlantic City; Dallas –FortWorth; Houston –Galveston–Brazoria;San Anton io; Austin –San Marcos.
3 The Dallas and Houston CMSAs rankednumber nine and 10, respectively,in 2001. Based on population, theBoston –Worcester and Detroit– AnnArbor–Flint CMSAs ranked numberseven and eight. Table 1 of theJanuary article contains comparabledata for individual Texas Trianglemetro areas.
4 American Chamber of CommerceResearch Association, ACCRA Cost of
Living Index , various issues, 2001 and2002. Data reported for New York and Chicago were too limited in geo-
graphic scope to make any metrowidecomparisons. The comparisons thatwere available, however, indicate thatChicago would stand a few percentagepoints above the national average, andNew York would be well above thenational average.
5 Nondisclosure of data is a recurringproblem. Data are not disclosed inU.S. government publications unlessthere are three or more respondents inthe sector, or if one respondent is solarge that its data dominate the results.In a number of cases where nondisclo-sure was an issue, we used adjacent ortrend values to fill in and completecomparisons. This was especially truewithin the Texas Triangle, where anyone nondisclosure out of four citiescould eliminate a comparison. Few if any of the inserted values were mean-ingful to the results, other than toallow a better picture of overallresults.
6 Export industries for individual TexasTriangle metro areas are in Table 2 of the January article.
regional financial cente r couldnot be more secure. Houstonhas pined for diversificationaway from oil. San Antonio hasbeen accused of being toorelaxed, allowing other urbanrivals—especially Houston andDallas—to steal growth thatrightfully belongs in SouthTexas. Austin has leveraged itsdistinctive charm to find itself at the peak and trough of every speculative bubble thathas moved through the state inthe past 30 years.
Our results suggest that thepe rsonality differen ces a reprobably meaningless in termsof their ability to greatly affectthe state’s economic develop-ment. At best, they are periph-eral. At worst, the family rivalryis a waste of resources in anuphill battle against deeplyrooted economic fundamentals.Good news in Dallas or SanAntonio is good news for therest of the Triangle cities. And
because of the division of eco-nomic roles across the Triangle,it is generally futile for one of the cities to go head-to-headwith another one in its area of economic strength. From thisperspective, it is difficult to seethese cities as real economicrivals at all, and a strategy of cooperative, statewide develop-ment p rograms makes much
more sense than competitionwithin the region.
—Robert W. Gilmer
Notes1 “The Simple Economics of the Texas
Triangle,” Houston Business , January2004.
2 The broadest definition of each metroarea is used, normally the consolidatedmetropolitan statistical area (CMSA)definition, except for Austin and San
Antonio, which are metropolitan statis-tical areas (MSAs). The definitionsused: New York –New Jersey– LongIsland; Los Angeles –Riverside –Orange
5

8/14/2019 Texas Triangle as Megalopolis
http://slidepdf.com/reader/full/texas-triangle-as-megalopolis 6/6
Downtown would b enefit from
a consolidation of ChevronTexaco into its 1500 Louisianalocation, but this would do lit-tle for metro-area occupancyrates. Retail occupancy is up abit, and industrial space isdow n slightly.
Oil Machinery and ServicesThere is not much change
here. The overall domestic rig
count has moved up 20 to 30rigs in recent weeks, but therigs are for low-risk, land-baseddrilling, which adds little to thedemand for oil services. Off-shore drilling remains at thedepressed levels of the 1999drilling downturn. Only 89 rigswere working the Gulf of Mex-ico in early April. No cure is insight for the gulf; seismic activ-ities and producer plans indi-cate that no one intends to re-turn there soon. Capacity isslack and price mediocre. Inter-national activity remains strongin Latin America and the Mid-dle East, weak in West Africaand the North Sea.
PetrochemicalsAfter five years of gloomy
news from the petrochemicalindustry, 2004 has brought thefirst signs of recovery. Petro-chemical demand is very strong,and only a few areas still sufferfrom serious overcapacity prob-lems. With turnaround seasonunder way in March, takingsome capacity temporarily out
HoustonBeigeBook April 2004
ob growth remains elu-
sive in Houston. What lookedlike a picture of solid growth inJanuary—1.7 percent over theprior six months, 3.5 percentfor the last three —changedentirely with the February em-ployment release. Anothermonth’s data and revisions tothe prior month’s left Houstonwith only 1.2 percent growthfor six months and 1.5 percent
for the last three. Growth is nolonger without jobs, but jobgrowth is weak given the eco-nom ic backdrop of solid U.S.and global expan sion.
Retail SalesSomeone threw the right
switch during the week afterChristmas; Houston’s retailsales have been doing fine eversince. Almost all retailers arecomfortably meeting plans forthe year, and high-end retailersare substantially exceeding them.Cost pressures are growing fromenergy and employee benefits,however. Hiring remains scarce.
Real EstateThe real estate story remains
largely unchanged. Both newand used homes opened theyear with record sales, drivenby low interest rates. Lower-priced homes remain the hotsegment of the market as first-time buyers seek to qualify fora mortgage. Warm weather andthe end of the school yearshould add fuel to this fire incoming months.
Apartment occupancy con-tinues its two-year decline, and
prospects are bleak with n ewunits coming on line. Occu-pan cy rates for office spacealso continue to fall citywide.
J
For more information or copies of this publication, contact Bill Gilmer at(713) 652-1546 [email protected], or write Bill Gilmer, Houston Branch,Federal Reserve Bank of Dallas, P.O. Box 2578, Houston, TX 77252. This publication isalso available on the Internet atwww.dallasfed.org .
The views expressed are those of the authors and do not necessarily reflect the positionsof the Federal Reserve Bank of Dallas or the Federal Reserve System.
of service, shortages cropped up
in ethylene and styrene, andchlorine customers were put onallocation. Competition fromcheap imports has been limitedby a weak dollar and by Chinesepurchases of much of the Asianoutput that might have be enshipped to the United States.Price increases are being seenin a long list of basic chemicalsand plastics: ethylene, propy-
lene, polypropylene, styrene,po lystyrene , chlorine, po lyvinylchloride and PET bottle plastic.
RefiningGasoline prices have been
supported by strong U.S. de-mand, reduced capacity due torefinery turnarounds, and stateand local environmental re-quirements for 15 different kindsof gasoline. Pump prices set anall-time record in March (if notadjusted for inflation). Withgasoline inventories scrapingthe bottom of the five-yearrange, refiners have enjoyedsome of their best marginssince 1999. Seasonal turnaroundsare now ending, capacity uti-lization is rising, and invento-ries should respon d to higherproduction in the weeks ahead.
The markets shrugged off recent ratification of a previ-ously announced OPEC pro-duction cut. Unable to pass onthe current high prices inworld crude markets, OPECmembers will probably con-tinue to make crude available.