tetrahedral ligand** non-interpenetrated cu-based mof ... · supporting information...
TRANSCRIPT

Supporting Information
Non-Interpenetrated Cu-based MOF Constructed from a Rediscovered
Tetrahedral Ligand
Komal M Patila Shane G Telferb Stephen C Morattia Omid T Qazvinib and Lyall R
Hantona
a Department of Chemistry Te Tari Hua-Ruanuku University of Otago P O Box 56
Dunedin 9054 New Zealand
b MacDiarmid Institute of Advanced Materials and Nanotechnology Institute of
Fundamental Sciences Massey University Palmerston North 4474 New Zealand
Electronic Supplementary Material (ESI) for CrystEngCommThis journal is copy The Royal Society of Chemistry 2017
Table of Contents
SUPPORTING INFORMATION S1
S11 SYNTHESIS OF LIGAND (L) S2S12 SYNTHESIS AND X-RAY STRUCTURE SOLUTION DETAILS FOR UOF-1 S3S13 SELECTED DETAILS OF DATA COLLECTIONS AND STRUCTURE REFINEMENTSS6S14 THERMAL ANALYSIS (TGA AND DSC) S7S15 POWDER X-RAY ANALYSIS S9S16 ACTIVATION TECHNIQUESS10S17 GAS ADSORPTION ISOTHERMS OF UOF-1S12S18 COMPARATIVE DATA OF CU-PTS STRUCTURES IN THE LITERATURE S17S19 IDEAL ADSORBED SOLUTION THEORY (IAST) CALCULATIONS S18S110 HEAT OF ADSORPTION (QST) CALCULATIONSS20S111 REFERENCES S23
S2
S11 Synthesis of Ligand (L)
AlCl3 Benzene
t-BuBr ON Reflux
I2PIFA
CHCl348h RT
Cu CN DMF130 degC 48h
I
I
I
CN
NC
CN
I
CN
73-8940
95COOH
HOOC
COOH
COOH
KOHEthyleneGlycol
72h 180 degC
94
Scheme S1 Synthesis of 1357ndashtetrakis(4-carboxyphenyl)adamantane (L)
S3
S12 Synthesis and X-ray structure solution details for UOF-1
The solvothermal reaction of Cu(NO3)23H2O and L in 11 vv solvent mixture of DMF and
C2H5OH was carried out in a pressure tube The pressure tube was protected with a thick
steel blast tube and subjected to a heating regime of slowly raising the temperature to 120 degC
over six hours maintaining the temperature at 120 degC for 48 hours and then slowly cooling to
room temperature at about 2 Chour This heating regime resulted in a brown precipitate
The precipitate was dissolved with 4 drops of conc HCl and further heated for seven days at
170 degC and again cooled to room temperature at about 2 Chour to produce a blue solution
To an aliquot of this solution CH2Cl2 was slowly diffused in for about two months and
resulted in the formation of turquoise crystals of UOF-1DMF (procedure 1) in very small
quantities (Figure S1)
Two data sets were collected on this compound however the quality of the data was very
poor Many attempts to reproduce these crystals by varying the solvents and Cu(II) salts and
using acids such as HCl and HNO3 at various stages of synthesis and also by varying
reaction conditions were unsuccessful In most of the cases either clear solutions or very
small quantities of microcrystalline precipitates were obtained In an attempt to improve the
quantity and quality of the crystals the following modifications were successful
Concentrated HCl was replaced by dilute HBF4 (24 vv dilution in DMF) and instead of
using pressure tubes and a heating and cooling regime the reaction was carried in a Borosil
vial by heating the reaction mixture in an isothermal oven at 80 degC for about 24 hours The
resultant crystals of UOF-1DMF (procedure 2 Figure S1) obtained by adopting these
modifications were in better yield and were also straightforward to synthesise when
compared to the previous method The quality of the single crystals was also poor and the
crystals did not diffract beyond a resolution of 175 Aring Importantly the cell dimensions for
crystals of both the UOF-1DMF samples were the same indicating an efficient synthesis of
this MOF with time of synthesis reduced from 2-3 months to 24 hours Infrared analysis of a
crystalline sample of UOF-1DMF confirmed the presence of L as the peaks at 2926ndash2853
(adamantyl CndashH group) 1702 (CndashO stretching) 1607 and 1544 (C=C bending COOndash
asymmetric stretching) 1401 (COOndash symmetric stretching) and 763ndash526 cmndash1 (aromatic CndashH
bending) were observed The IR spectrum indicated complete deprotonation of the L ligand
as the OndashH stretches and bends in the regions of 1289ndash1271 and 1083ndash1042 cm-1 were very
weak These peaks were very strong in the IR spectrum of the native L ligand The
S4
value ie the difference between the asym(COO) and sym(COO) between 143ndash206 cmndash1
indicated that the carboxylate groups were bound to the Cu(II) cations in a symmetric
bridging mode1 2 There were problems in obtaining consistent microanalysis for these
materials To address this issue several crystals were manually separated from a number of
crystal jars washed with acetone dried in vacuo and microanalysed It was found that for
three such analyses the C H and N values ranged between 505ndash523 42ndash46 and 14ndash
38 respectively The calculated C H and N values for the completely desolvated
framework were 617 38 and 00 (Calc for C38H28O8Cu2) respectively and for the
solvated framework as indicated by SCXRD these values were 534 73 and 109
(Calc for C38H28O8Cu214DMF2H2O) respectively The traces of nitrogen in these samples
could be due to residual DMF molecules The lower carbon content than the completely
desolvated framework suggested that the void space in the MOF might have been replaced by
H2O molecules from the atmosphere
Three data sets were collected of this compound The overall quality of data was poor
mainly because of the presence of a large number of uncoordinated and disordered solvent
molecules within the structure The solvent molecules in the structure were estimated using
the PLATON SQUEEZE3 routine In a total void volume of 4486 Aring3 1905 electrons were
SQUEEZEd from the structure This residual electron density was assigned to 7 DMF
molecules per Cu(II) cation
[19054 = 29125 e per Cu(II) cation 7(DMF) = 7(40) e= 280 e]
Figure S1 An image of the single crystals of UOF-1DMF obtained from procedure 1 (left)
procedure 2 (centre) and bulk synthesis of UOF-1DMF (right) displaying the improvement in
quality and quantity of crystals The scale of these images is 100 m
In attempts to obtain better structure solution the DMF from the as-synthesized crystals was
exchanged with acetone to yield turquoise coloured crystals of [Cu2(L)(H2O)2]
18(CH3)2CO (UOF-1(CH3)2CO) The solvent molecules in the structure were estimated
using the PLATON SQUEEZE3 routine In a total void volume of 4447 Aring3 1117 electrons
S5
were SQUEEZEd from the structure This residual electron density was assigned to 9
acetone molecules per Cu(II) cation
[11174 = 27925 e per Cu(II) cation 9(acetone) = 9(32) e= 288 e]
After soaking the crystals in dry acetone the solvent was removed and fresh DEF was added
to yield turquoise coloured crystals of [Cu2(L)(H2O)2]8DEF (UOF-1DEF) and this
structure was reported The structure was severely disordered and contained large ADPs
Owing to the low data quality and that the solvent molecules were severely disordered they
could not be adequately located in the Fourier maps The solvent molecules were
SQUEEZEd from the structure using the PLATON SQUEEZE3 routine SQUEEZing the
structure resulted in significant reduction of the R1 and wR2 values The R1 and wR2 values
before SQUEEZing were 2736 and 5965 respectively while after SQUEEZing these
values reduced to 967 and 3027 respectively In a total void volume of 4349 Aring3 835
electrons were SQUEEZEd from the structure This residual electron density was assigned to
4 DEF molecules per Cu(II) cation
[8354 = 20875 e per Cu(II) cation 4(DEF) = 4(56) e= 224 e]
The DMF from the as-synthesized crystals was exchanged with dry CH2Cl2 to yield dark blue
coloured crystals These dark blue crystals quickly changed its colour to green upon exposure
to air A dramatic change in space group from tetragonal P42mmc to a lower symmetry
orthorhombic Cccm (UOF-1CH2Cl2) was observed However this change in space group
had no impact on the PtS topology The solvent molecules in the structure were estimated
using the PLATON SQUEEZE3 routine In a total void volume of 8791 Aring3 2468 electrons
were SQUEEZEd from the structure This residual electron density was assigned to 7
CH2Cl2 molecules per Cu(II) cation
[24688 = 3085 e per Cu(II) cation 7(CH2Cl2) = 7(42) e= 294 e]
S6
S13 Selected details of data collections and structure refinementsTable S1 Crystal data for UOF-1
Structure UOF-1DMF
(Procedure 1)
UOF-1DMF
(Procedure 2)
UOF-1(CH3)2CO UOF-1DEF UOF-1CH2Cl2
Formula C19H15CuO5(C3H7NO)7 minus C19H15CuO5(C3H6O)9 C19H15CuO5(C5H11NO)4 C19H15CuO5(CH2Cl2)7
Formula weight 89852 minus 90958 79146 98140
Crystal System Tetragonal Tetragonal Tetragonal Tetragonal Orthorhombic
Space group P42mmc P42mmc P42mmc P42mmc Cccm
a Aring 14686(5) 14456(4) 147093(16) 143700(13) 19302(5)
b Aring 14686(5) 14456(4) 147093(16) 143700(13) 21805(4)
c Aring 26103(9) 26369(2) 26053(3) 26464(3) 26364(4)
αdeg 90 90 90 90 90
βdeg 90 90 90 90 90
γdeg 90 90 90 90 90
VAring3 5630(3) 5511(2) 56369(14) 54648(12) 11096(4)
Z 4 minus 4 4 8
TK 1000(2) 1000(2) 1000(2) 100(2) 100(2)
micrommndash10992 minus 0987 0860 6972
Total reflections 22352 41185 11025 10870 9509
Unique reflections
(Rint)2826 (03546) 3099 (02132) 1764 (01590) 1696 (00835) 2655 (00551)
Resolution Range 3452-67989 3485-74342 3004-67684 3075-51813 3487-52644
R1 indices [Igt2σ(I)] 01617 minus 01241 00967 01329
ωR2 (all data) 05054 minus 03808 03027 03615
Goodness-of-fit 1007 minus 1244 1017 0857
Radiation type Cu Kα Cu Kα Cu Kα Cu Kα Cu Kα
S7
S14 Thermal Analysis (TGA and DSC)
Figure S2 The thermograms showing concerted collapse of the framework after the initial loss of
solvent molecules These thermograms were obtained by heating the single crystals of UOF-
1DMF (in black) at a temperature increase rate of 5 Cmin and the vacuum dried crystals of
UOF-1(CH3)2CO (in red) at a temperature increase rate of 20 Cmin both under a N2
atmosphere
Figure S3 The thermogram of ligand L showing decomposition post 360 C This thermogram
was obtained by heating native L at a temperature increase rate of 20 Cmin under a N2
atmosphere
S8
Figure S4 The DSC curves are obtained by heating the single crystals of as-synthesized UOF-
1DMF and vacuum dried UOF-1(CH3)2CO at a temperature increase rate of 2 Cmin under a
N2 atmosphere The DSC curve of UOF-1DMF (in blue) shows the presence of H2O and DMF in
the crystals The DSC curve of the vacuum dried UOF-1(CH3)2CO (in red) shows the presence of
acetone and some trace DMF in the crystals
S9
S15 Powder X-Ray Analysis
Figure S5 The simulated and the actual PXRD pattern of bulk sample of UOF-1DMF showing
phase purity of the material
Figure S6 The actual PXRD pattern of bulk sample of UOF-1DMF UOF-1(CH3)2CO and
UOF-1H2O showing stability of the material in water
S10
Figure S7 The simulated PXRD pattern of UOF-1CH2Cl2 and the actual pattern of bulk sample
of UOF-1DMF and UOF-1CH2Cl2 when exposed to air showing broadening of peaks due to the
presence of moisture from the atmosphere
S11
S16 Activation Techniques
Figure S8 Top The images of as-synthesized UOF-1(CH3)2CO (left) UOF-1DMF (middle)
and UOF-1CH2Cl2 (right) showing the difference in colour upon soaking in CH2Cl2 Middle The
images of the UOF-1CH2Cl2 crystals which were dried under high vacuum for 14 hours (left) and
the colour change observed in this sample upon exposure to air Bottom The image of the UOF-
1s-CO2 obtained by activating UOF-1DMF with supercritical CO2 followed by exposure to a
dynamic vacuum at 298 K
S12
S161 Procedure for activation of UOF-1E and UOF-1F
A freshly prepared UOF-1DMF sample was obtained from a single synthesis batch and
activated by soaking in dry CH2Cl2 The DMF solvent from these crystals was removed and
10 mL of dry CH2Cl2 was added to it After 10 minutes the solvent was removed and
replenished with fresh dry CH2Cl2 This process was repeated 3-4 times and the crystals were
then soaked in dry CH2Cl2 for 24 hours After 24 hours the solvent was removed and fresh
dry CH2Cl2 solvent was added This resulted in a change of the crystal colour from turquoise
to dark blue after which these crystals were transferred to a pre-weighed analysis tube The
excess CH2Cl2 was removed under dynamic vacuum at 10ndash6 torr by heating the tube at 298 K
for 40 hours The sample mass was calculated using the degassed sample after the sample
tube was backfilled with N2 gas The sample mass recorded was 297 mg
Another sample was activated using supercritical CO2 (UOF-1s-CO2) The solvent of the
freshly prepared single crystals of UOF-1DMF was exchanged with dry acetone over three
days and the solvent was removed and fresh solvent was replenished each day On the fourth
day the solvent was removed and then the crystals were activated with five purges with
liquid CO2 over three hours conversion to the supercritical state and standing overnight
followed by a slow bleed of the CO2 over several hours The sample was then placed in a
sample tube whilst minimising exposure to the atmosphere then subjected to a dynamic
vacuum at 10ndash6 torr with heating to 298 K for 20 hours This heatingvacuum step resulted in
a change of the crystal colour from turquoise to dark blue The sample mass was calculated
using the degassed sample after the sample tube was backfilled with N2 gas
S13
S17 Gas adsorption isotherms of UOF-1CH2Cl2 and UOF-1s-CO2
Figure S9 N2 adsorption isotherm at 77 K with adsorption shown as filled markers and desorption
shown as hollow markers together with BET surface area plots for activated UOF-1CH2Cl2
S14
Figure S10 N2 adsorption isotherm at 77 K with adsorption shown as filled markers and
desorption shown as hollow markers together with BET surface area plots for activated UOF-1s-
CO2
S15
Figure S11 The plot of isotherms for UOF-1s-CO2 with adsorption shown as filled markers and
desorption shown as hollow markers
S16
Figure S12 The plot of isotherms for UOF-1s-CO2 with adsorption shown as filled markers and desorption shown as hollow markers
S17
S171 Gas Adsorption Summary
Table S2 A summary of the UOF-1CH2Cl2 and UOF-1s-CO2 gas adsorption results
Gas Temperature (K)
Amount adsorbed by UOF-1s-CO2 at
P = 1 bar (cm3 g-1)
Amount adsorbed by
UOF-1CH2Cl2 at P = 1 bar
(cm3 g-1)
Measurement 1 Measurement 2 Measurement 3
77 212 227 213 114
195 269 460 320 243
273 289 168 450 332N2
298 116 Not measurable Not measurable Not measurable
195 143 177 140 109
273 490 898 487 437CO2
298 275 431 302 279
273 134 307 149 130CH4
298 571 862 554 619
H2 77 970 158 119 Not measured
gas adsorbed at 06 bar
S18
S18 Comparative Data of Cu-PtS Structures in the Literature
Table S3 A summary of the literature review on Cu-PtS structures
MOFs Type of network
Type of activation
SA (m2 gndash1) Pore Dimensions
(Aring)
Potential void volume
()
Ref
[Cu2(H2O)2(A1)] nDMF
Non-interpenetrated
Thermal 685 27times99 51times83
58 4
[Cu2(H2O)2(A1)] 4DMA2H2O
Non-interpenetrated
(CH3)2CO exchange +
Vacuum drying
382 27times99 51times83
48 5
CH2Cl2 exchange +
Vacuum drying
526
[Cu2(A2)(H2O)2] middot6DEFmiddot2H2O
Non-interpenetrated CH2Cl2
exchange + Freeze drying
1560195times7 84times7 72
CH2Cl2 exchange +
Vacuum drying
791
[Cu2(A3)(H2O)2] middot14DEFmiddot5H2O
2-fold interpenetrated CH2Cl2
exchange + Freeze drying
1020
212times35 74times74 73
6
[Cu2(A4)(DMF)2] middot2DMFmiddot4H2O
Homo-crossed network
CH2Cl2 exchange +
Freeze drying
555 10times89 42
[Cu2(A5)(H2O)2] middot12DEFmiddot26H2O
2-fold interpenetrated
CH2Cl2 exchange +
Freeze drying
262 256times106 797
MOF-11 Non-interpenetrated
Thermal 560a 6ndash65 50 8
[Cu2(A6)(H2O)2] middot14DMFmiddot10H2O
Non-interpenetrated
Not mentioned 1217ordf (calc 6044)b
10times10 25times5 81 9
[Cu2(A7)(H2O)2] middot13DMF
Non-interpenetrated
(CH3)2CO exchange +
Vacuum drying
733a 9times9 75 10
CH2Cl2 exchange +
Vacuum drying
357
UOF-1 Non-interpenetrated (CH3)2CO and
s-CO2 exchange +
Vacuum drying
570261times12 147times97 79 This
work
H4A1 = tetrakis[4-(carboxyphenyl)oxamethyl]methane H4A2 = tetrakis(4-carboxyphenyl)methane H4A3 = tetrakis(4-carboxyphenyl-4-phenyl)methane H4A4 = tetrakis(4-carboxyphenylethene)methane H4A5 = tetrakis(4-carboxyphenylethynyl-4-phenyl)methane H4A6 = 55-(4-carboxyphenyl)-26-dihydroxy-[113131-Quaterphenyl]-44-dicarboxylic acid H4A7 = 55-(4-carboxyphenyl)-26-diethoxy-[113131-Quaterphenyl]-44-dicarboxylic acid Surface area measured by BET isotherm unless specified as (a) Langmuir surface area (b) calculated surface area using GCMC simulations
S19
S19 Pore Size Distribution
Figure S13 The pore size distributions calculated using the QSDFT method from the N2 isotherm
of UOF-1s-CO2 at 77 K using a slit-cylindrical adsorption kernel
Table S4 A summary of the QSDFT method
Pore Volume 0303 cc g-1
Surface area 607579 m2 g-1
Lower confidence limit 3925 AringFitting error 0065Half pore width (Mode) 5255 AringMoving point average Off
S20
S110 Ideal Adsorbed Solution Theory (IAST) Calculations
Dual-site Langmuir (DSLangmuir) was found to be the best model for fitting each gas adsorption isotherms at 273 K DSLangmuir is the sum of Langmuir isotherm models for two types of sites and is expressed as
119873(119875) = 1198721
1198701119875
1 + 1198701119875+ 1198722
1198702119875
1 + 1198702119875
where Mi is the number of adsorption sites of type i which have Langmuir constant Ki
The selectivity for a mixture of 15 CO2 and 85 CH4 or N2 at 273 K was calculated based on the IAST method using pyIAST11
Figure S14 Isotherm fitting parameters for UOF-1s-CO2 at 273 K
S21
Figure S15 Isotherm fitting parameters for UOF-1s-CO2 at 273 K
Figure S16 The selectivity for a mixture of 15 CO2 and 85 N2 (in blue) and 15 CO2 and
85 CH4 (in red) at 273 K was calculated based on the IAST method using pyIAST
S22
S111 Heat of Adsorption (Qst) Calculations
The isosteric heat of adsorption (Qst) values were calculated from CO2 and CH4 isotherms measured at 273 K and 298 K These isotherms were first fitted to a virial equation given below
ln 119875 = ln 119873 +1119879
119898
sum119894 = 0
119886119894 119873119894 +
1119879
119899
sum119894 = 0
119887119894 119873119894
The fitting parameters from the above equation were used as follows to calculate Qst
119876119904119905 =‒ 119877119898
sum119894 = 0
119886119894 119873119894
S23
0 10 20 30 40 50 600
4
8
12
16
20
24
28
32
Uptake (STP cm3 g-1)
Qst
(kJ m
ol-1
)
Figure S17 Top Virial equation fit for CO2 adsorption isotherms Bottom Isosteric heat of
adsorption plot for the adsorption of CO2 by UOF-1s-CO2
S24
0 2 4 6 8 10 12 14 160
4
8
12
16
20
24
28
Uptake (STP cm3 g-1)
Qst
(kJ m
ol-1
)
Figure S18 Top Virial equation fit for CH4 adsorption isotherms Bottom Isosteric heat of
adsorption plot for the adsorption of CH4 by UOF-1s-CO2
S25
S112 References
1 M V Marinho M I Yoshida K J Guedes K Krambrock A J Bortoluzzi M
Houmlrner F C Machado and W M Teles Inorg Chem 2004 43 1539-1544
2 L F Marques M V Marinho C C Correa N L Speziali R Diniz and F C
Machado Inorg Chim Acta 2011 368 242-246
3 A Spek Acta Crystallogr C 2015 71 9-18
4 J Tian R K Motkuri and P K Thallapally Cryst Growth Des 2010 10 3843-
3846
5 L-L Liang J Zhang S-B Ren G-W Ge Y-Z Li H-B Du and X-Z You
CrystEngComm 2010 12 2008-2010
6 L Ma A Jin Z Xie and W Lin Angew Chem Int Ed 2009 48 9905-9908
7 D Liu Z Xie L Ma and W Lin Inorg Chem 2010 49 9107-9109
8 B Chen M Eddaoudi T M Reineke J W Kampf M OKeeffe and O M Yaghi J
Am Chem Soc 2000 122 11559-11560
9 S Wu L Ma L-S Long L-S Zheng and W Lin Inorg Chem 2009 48 2436-
2442
10 L Ma J Y Lee J Li and W Lin Inorg Chem 2008 47 3955-3957
11 C M Simon B Smit and M Haranczyk Comput Phys Commun 2016 200 364-
380
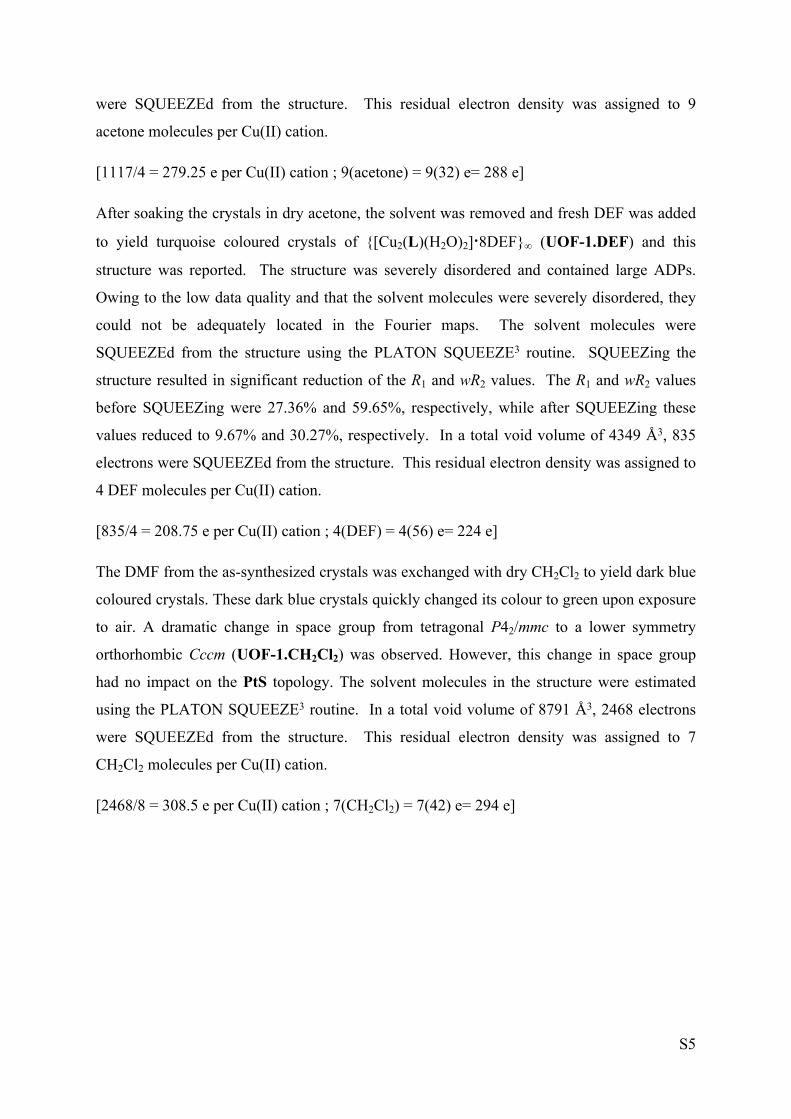
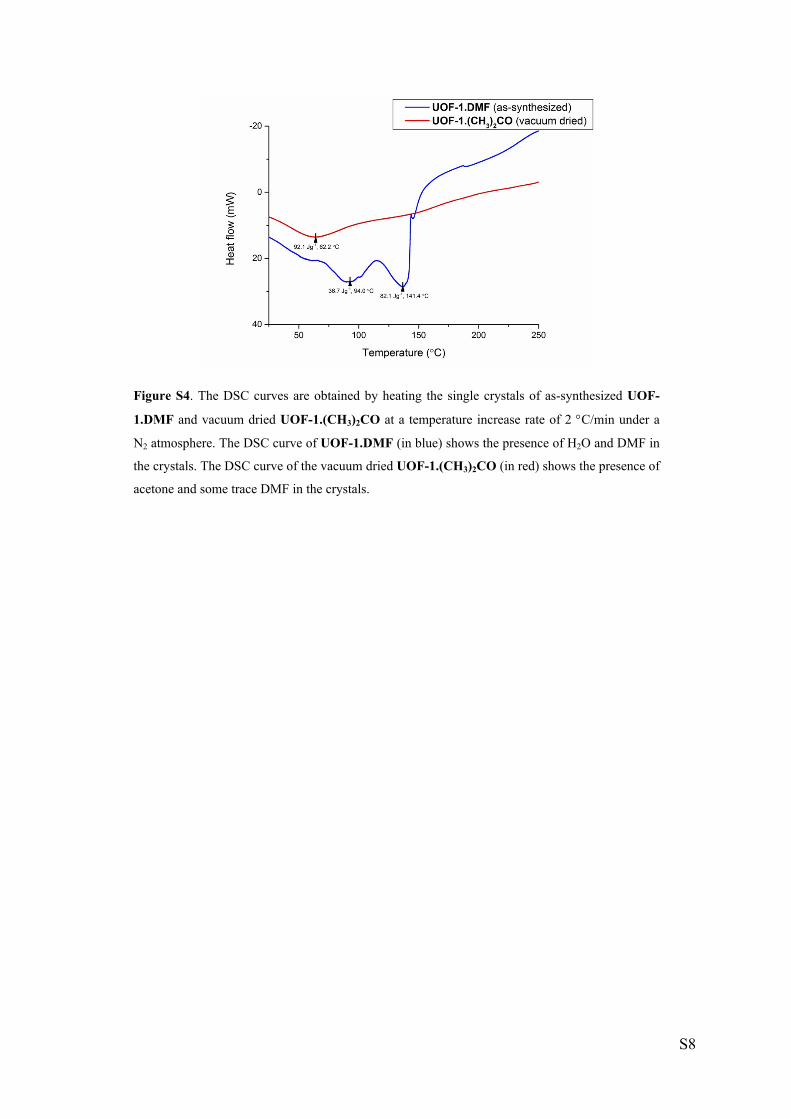
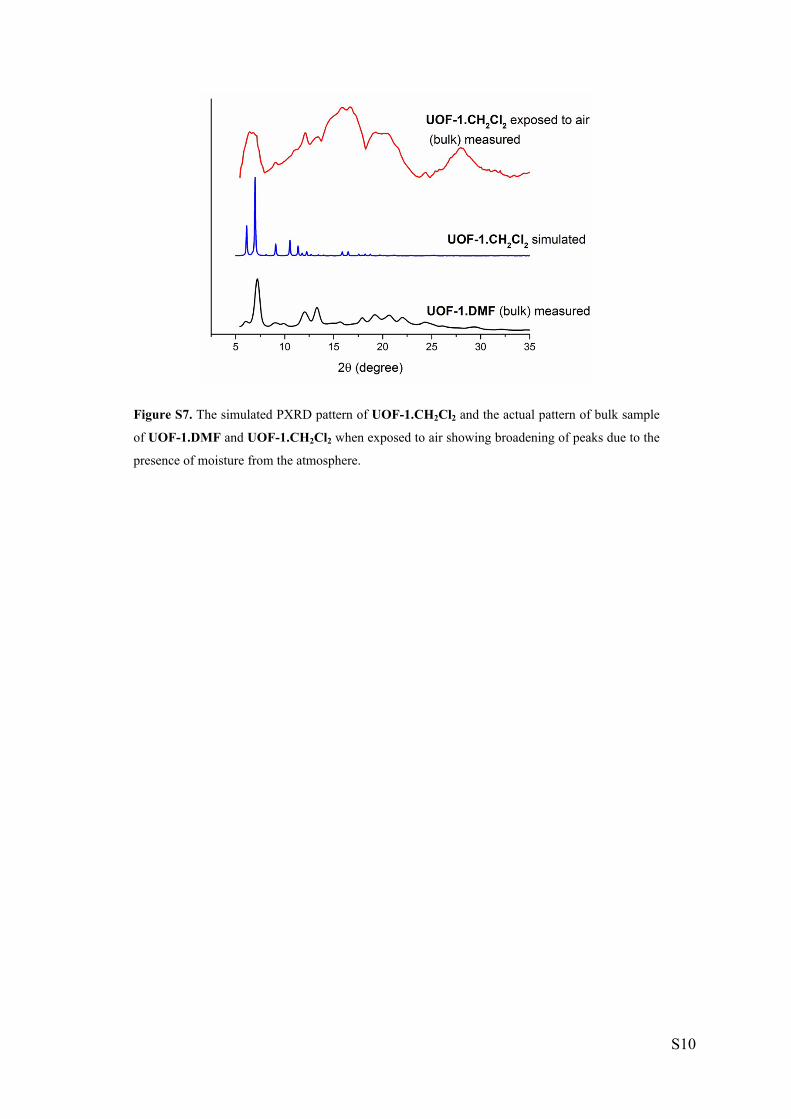
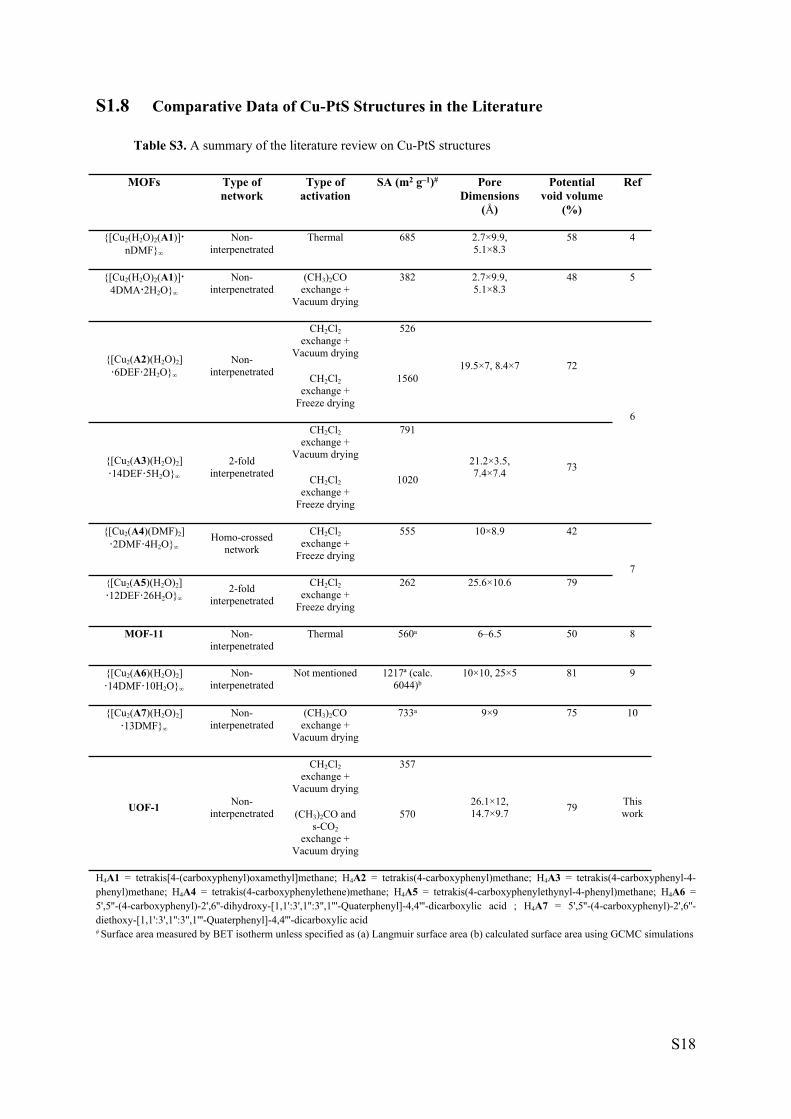
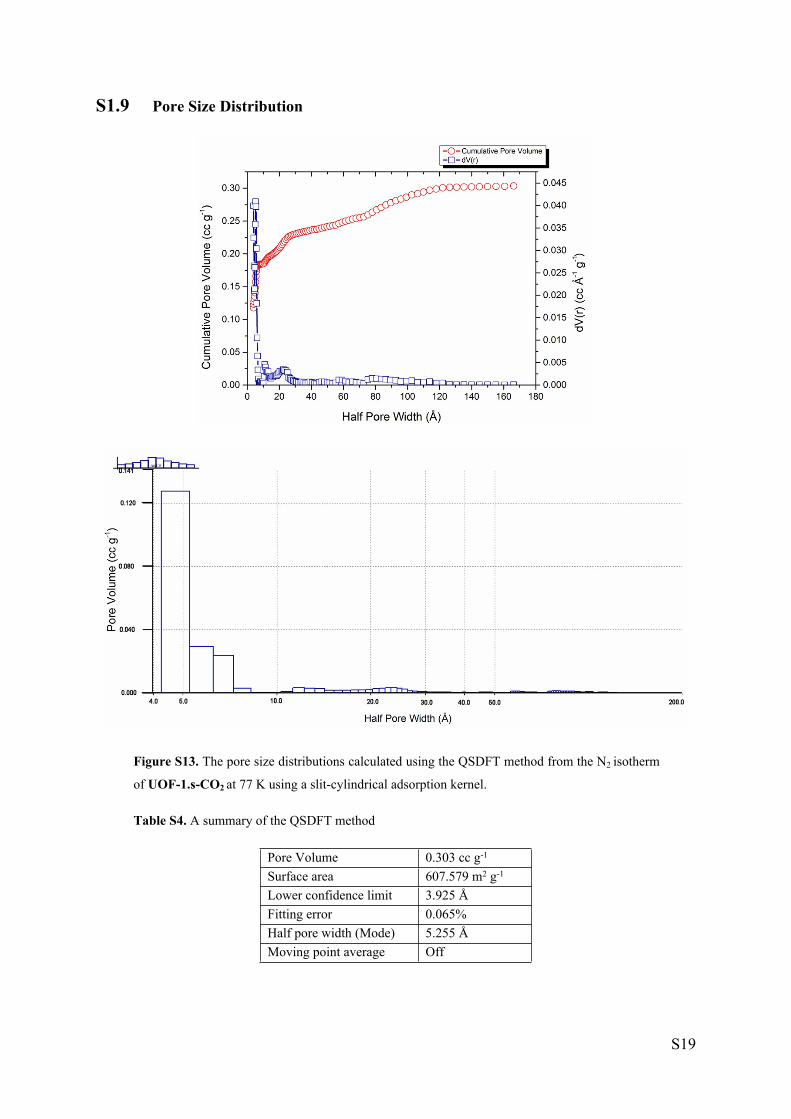
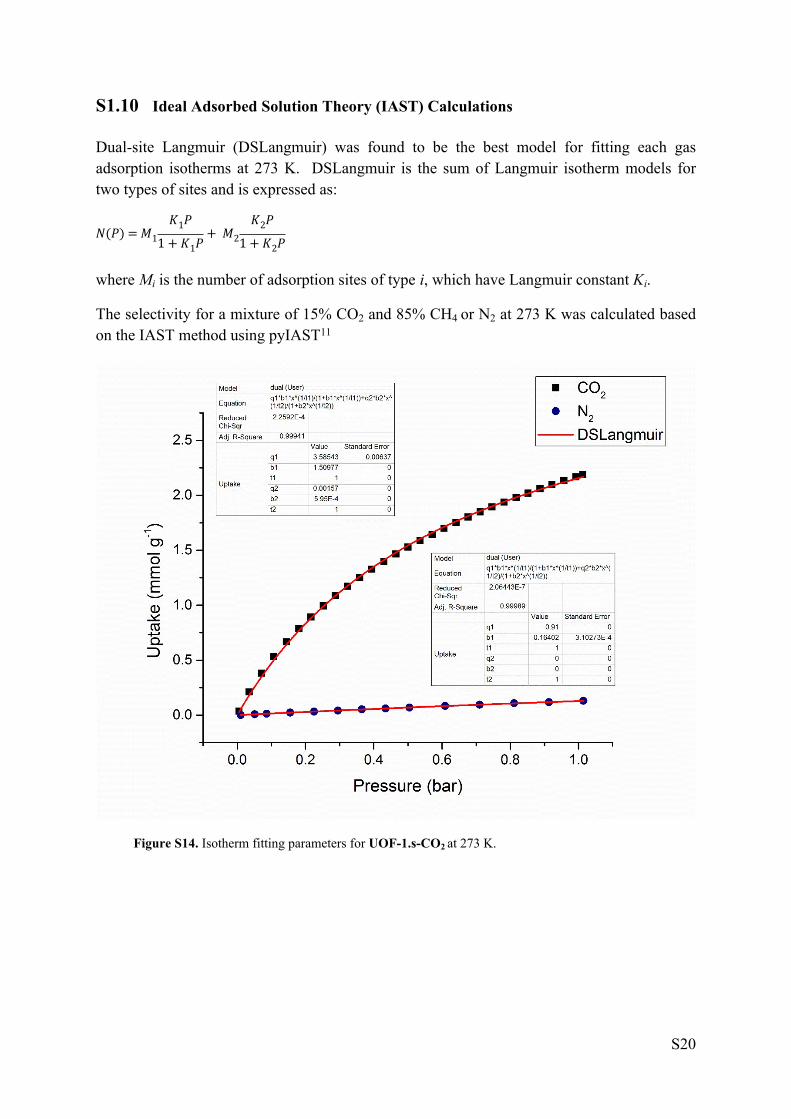