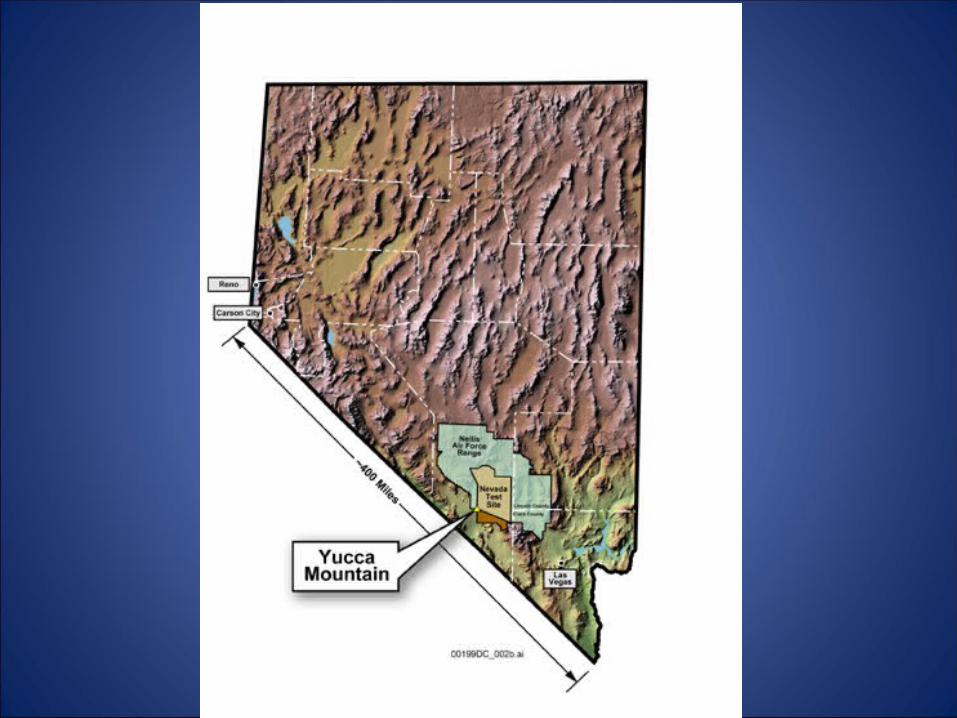
testing models for basaltic volcanism: implications for yucca mountain, nevada
DESCRIPTION
Testing Models for Basaltic Volcanism: Implications for Yucca Mountain, Nevada. Eugene Smith, UNLV Clinton Conrad, University of Hawaii Terry Plank, Lamont Doherty Earth Observatory Ashley Tibbetts, UNLV Deborah Keenan, Geoscience Consultants. Acknowledgements. - PowerPoint PPT PresentationTRANSCRIPT

Testing Models for Basaltic Volcanism: Implications for Yucca
Mountain, Nevada
Eugene Smith, UNLVClinton Conrad, University of Hawaii
Terry Plank, Lamont Doherty Earth ObservatoryAshley Tibbetts, UNLV
Deborah Keenan, Geoscience Consultants

Acknowledgements
• Nuclear Waste Division of Clark County, Nevada
• Nevada Agency for Nuclear Projects


Crater Flat-Lunar Crater Volcanic Field
From Smith et al. (2002) and Smith and Keenan (2005)
Death Valley

Main Point
• It is important to understand the process of volcanism before calculating the probability of future events.
• Understanding the process is especially important for 1,000,000 year compliance periods.

Models
• Deep vs. shallow melting.
Crust
LM
Asthenosphere
LC
30 Km
60-100 Km
Traditional model
Deep Melting model
Shallow melting=very little additional activity and lower probability of disruption
Deep melting=higher potential of additional activityAnd higher probability of repository disruption

Is melting deep or shallow?What is the temperature of melting?
•Use Geobarometers to estimate depth of magma generation.
•Use Geothermometer to estimate melting temperature
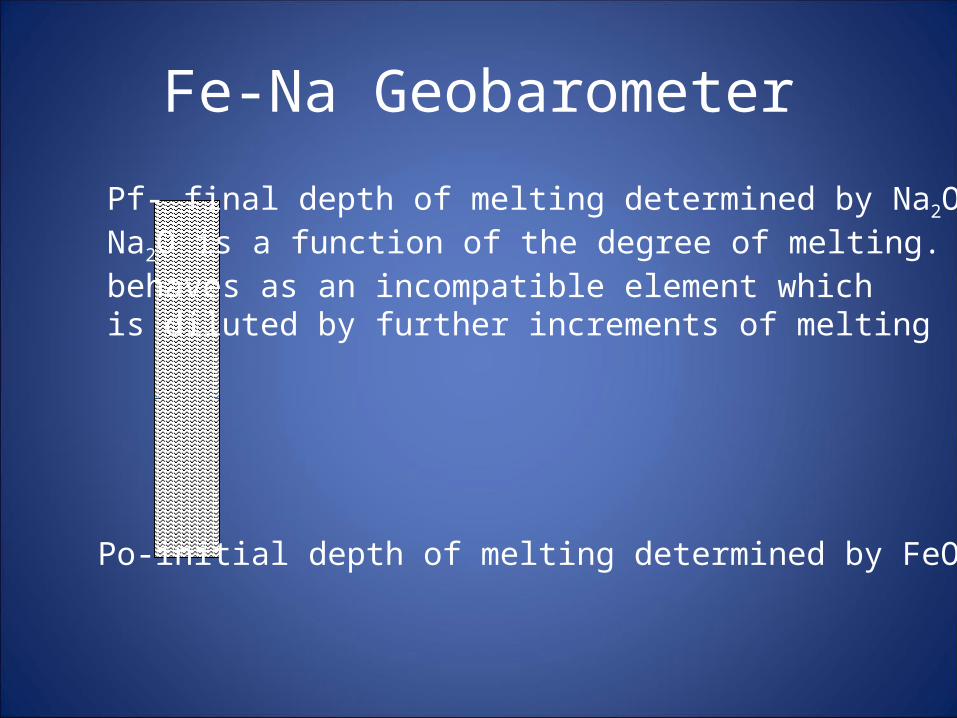
Fe-Na Geobarometer
Po-initial depth of melting determined by FeO
Pf- final depth of melting determined by Na2O.Na2O is a function of the degree of melting. Na2Obehaves as an incompatible element whichis diluted by further increments of melting

High melting temperatures and asthenospheric melting
Blue LM from Jones et al. (1996). Z boundary from Zandt et al. (1995). References in Wang et al. (2002).
From Wang et al. (2002)

Si melt Barometer
• Being developed by Cin-Ty Lee (Rice) and Terry Plank (Lamont-Doherty).
• Technique has not been published but is based on the reaction Mg2SiO4 (ol) + SiO2 (melt) = Mg2Si2O6 (opx).

Si melt Barometer
• The notion of this barometer is not new but experimental data is now coming available to calibrate it.
• Appears to be independent of temperature and composition.
shear velocity anomaly (%)
6 0 -6
100
50
150
Dep
th (
km)
-120 -118 -116
Great Valley
Sierra Nevada
Owens Valley
Big PineW E
new
Wang et al
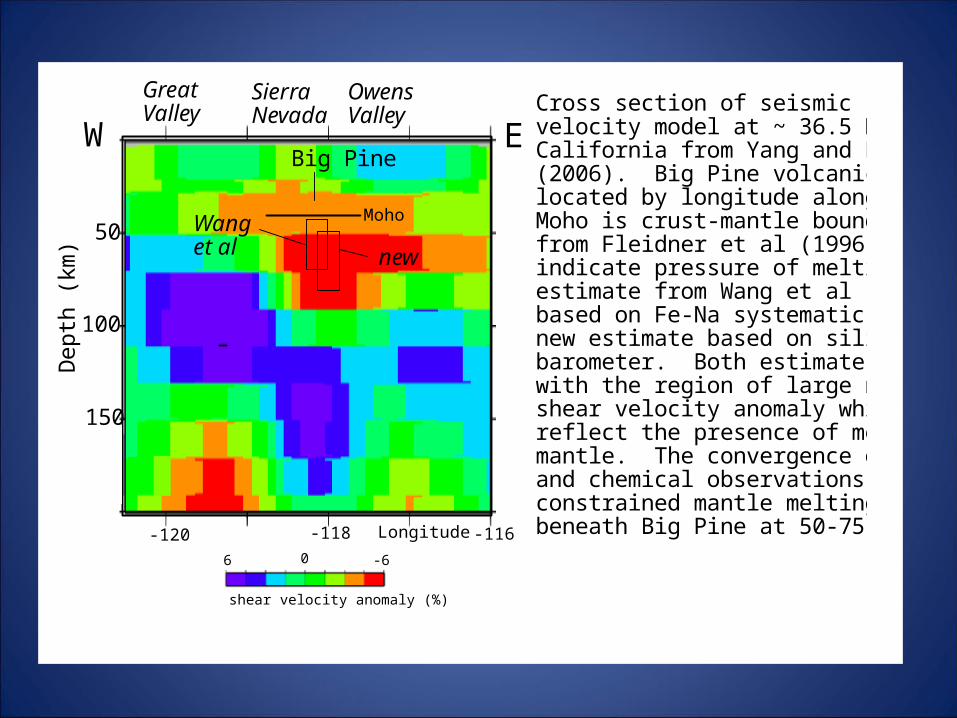
Cross section of seismic shear wave velocity model at ~ 36.5 N across California from Yang and Forsyth (2006). Big Pine volcanic field located by longitude along profile. Moho is crust-mantle boundary from Fleidner et al (1996). Boxes indicate pressure of melting estimate from Wang et al (2002), based on Fe-Na systematics, and new estimate based on silica barometer. Both estimates overlap with the region of large negative shear velocity anomaly which may reflect the presence of melt in the mantle. The convergence of seismic and chemical observations point to a constrained mantle melting region beneath Big Pine at 50-75 km depth. Longitude
Moho

Olivine-Liquid GeothermometerSugawara (2000)
• Basalt from Lathrop Wells near Yucca Mountain is ideal for calculating temperatures– Limited range of FeO and MgO (<0.5 wt. %)– Few crystals (2 to 4 vol % olivine only) – Olivine core compositions show limited range
(Fo76-79) and reflect equilibrium with the host liquid.

Model
Crust
Lithospheric Mantle
Asthenospheric Mantle
40 Km ~ 1 MPa
70 Km ~ 2 MPa
Peridotite,Olivine Fo90High MgO/FeO
Melting
During ascent-30-40% of olivine removedRemaining olivine becomesEnriched in FeO
Eruption, olivine less abundant but has higher FeO/MgO, Fo79

Geothermometer Step 1-Crystallization (Eruption temperatures)
• Line shows liquids in equilibrium with Fo79 olivine with temperatures calculated by the Sugawara (2000) thermometer.
•1155 to 1165 º C-- dry•1025 to 1035 º C --4.6 wt. % water•In agreement with 1005 ± 20 º C determined by Nicholis and Rutherford (2004).

GeothermometerStep-2 Melting temperature
• Lathrop Wells basalt only contains olivine crystals, so add olivine (changing its composition) until it is in equilibrium with an average mantle olivine of Fo90.
• Requires 38 to 40 % olivine addition and assumes a Fe/Mg exchange coefficient of 0.3

Melting TemperatureLathrop Wells Basalt
• Melting temperature• 1440-1450 º C dry
• 1330-1340 º C wet
• These temperatures are typical of the asthenosphere (1350 ºC and are too high for lithosphere.

Model
Crust
Lithospheric Mantle
Asthenospheric Mantle
40 Km ~ 1 MPa
70 Km ~ 2 MPa
Peridotite,Olivine Fo90High MgO/FeO
Melting
1025 to 1035 CEruption
1330-1340 C melting
1350C
850 C
1100 C
TOO HOT to be lithospheric mantle

Summary
Geobarometers indicate deep melting in the asthenosphere.
Geothermometer indicates melting of hot asthenospheric mantle.
Next-Mantle flow patterns and the control of volcanism
Deep Melting
• Must explain:– Hotter mantle temperatures– Narrow belt of volcanism– Episodic pattern with basaltic volcanism occurring
in same belt for as long as 11 Ma

Clint Conrad, Johns Hopkins University
NA plate 2 cm/yr-westMantle 3 cm/yr-eastSo 5 cm/yr shear atBase of the lithosphere
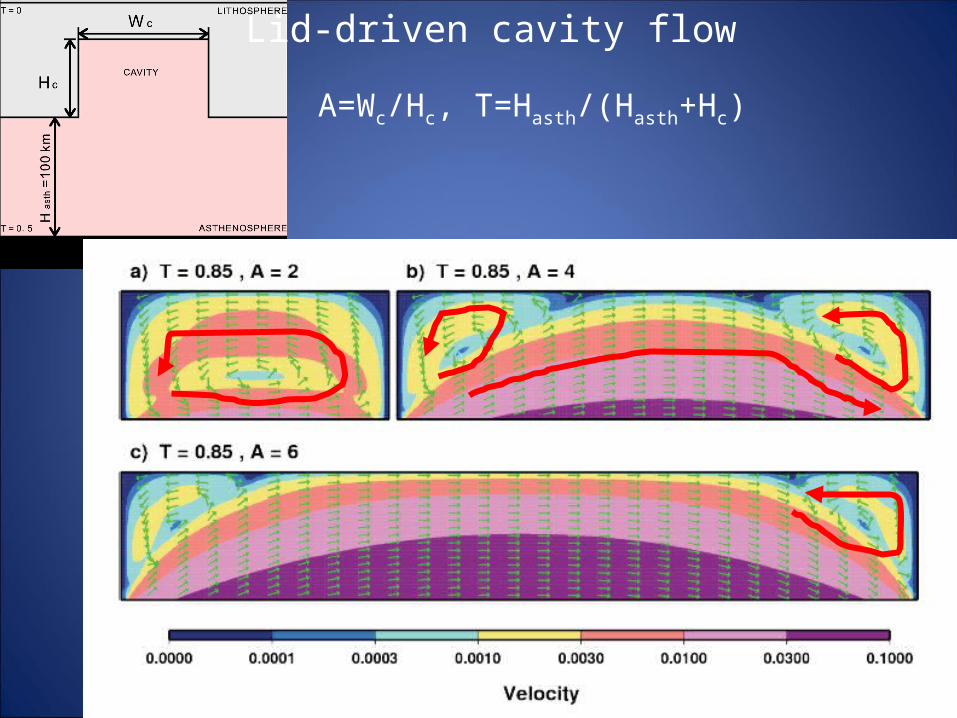
Lid-driven cavity flow
A=Wc/Hc, T=Hasth/(Hasth+Hc)

200 degrees hotter- 10 to 100 times lessviscous
1 cm/yr


Asthenosphere
Lithospheric Mantle
Crust
Next Area of Hot Mantle
2 cm/yr
3 cm/yr
~ 1 cm/yrupwelling
0
2
4
6
8
10
12
0123456789101112131415
Age
Nu
mb
er o
f E
ven
ts
Lunar Crater-ReveilleCrater Flat
A tape recording of mantleThermal
Anomalies?
100-200 km

Western US relative P-velocity variations
Low velocity zones (red) may be areas of hotter lithosphere or asthenospheric.
Spaced 100 to 200 km apart
From presentation by K. Dueker,University of Wyoming
Spacing of Thermal Pockets
• Thermal Pockets spaced 100-200 km apart and are 50 to 300 km wide.
• At shear rate of 5 cm year, 2-4 million years between pockets and 1 to 6 million years for pocket to pass a specific point.
• Do we observe these patterns in the geologic record?

0
2
4
6
8
10
12
0123456789101112131415
AgeN
um
ber
of
Eve
nts
Lunar Crater-Reveille
Crater Flat
Number of Dated Volcanic Events vs. Age
0.5 m.y. bins
How can episodic pattern be explained?


Summary• Melting is deep and in the asthenosphere. • Location of volcanic field controlled by mantle
processes.• Another peak of activity may occur at Yucca
Mountain. Timing and size of peak depend on the size of the next mantle thermal anomaly.
Summary
• High-quality geophysical data required to test models and predict next eruptive period.
• Probability of disruption of repository may be 1-2 orders of magnitude larger than presently calculated.