testing 10be exposure dating of holocene cirque moraines...
TRANSCRIPT

Testing 10Be Exposure Dating of Holocene Cirque Moraines using Glaciolacustrine Sediments in the Sierra Nevada, California
Thesis Proposal for the Master of Science Degree Department of Geology, Western Washington University
Bellingham, Washington
William Cary August 31, 2016
Approved by Advisory Committee Members:
Chair, Dr. Douglas H. Clark
Dr. Robert J. Mitchell
Dr. Colin Amos

1
1.0 Introduction
Alpine glaciers are sensitive indicators of climate and associated climate changes (Meier, 1962);
glaciers advance or retreat in response to changes in winter precipitation and summer ablation (Leonard,
1989). These glacial fluctuations effect local ecosystems, geology, and people. Temperate glaciers, like
those in the Western Cordillera of the contiguous U.S., are often a dominant source of late-season cold
water for local drainages (Fountain and Tangborn, 1985). Rapidly retreating glaciers can also produce
geomorphic hazards including debris flows, mass failures of over-steepened valley walls, outburst floods
from proglacial moraine lakes (Moore et al., 2009), and may even contribute to sea level rise (Meier et al.,
2007). As such, it is crucial to understand how glaciers have fluctuated in the past in order to understand
how they might respond in the future; patterns of glacier extents during warmer and drier climates in the
mid-Holocene may provide a closer analogy to future climate conditions than records related to the more
recent Little Ice Age (LIA, ~1,000-100 yr B.P.) (Menounos et al., 2009) and historical observations. Few
studies, however, provide records of glacier changes over the entire Holocene and, consequently, little is
known of potential spatial and temporal variability in glacial fluctuations with respect to regional climate
change within a given range in the contiguous United States. Proxy records provide a longer, more
complete records of glacial advance and retreat.
Two primary means of constraining glacial climate records are direct dating of moraines and
indirect dating of glaciolacustrine sediment records down-valley of glacial deposits; each method has
benefits and limitations. Moraines directly record periods of maximum advance and, therefore, cooling
and/or increased winter precipitation. With the advent of cosmogenic radionuclide (CRN) exposure
dating, moraines within the contiguous Unites States, which did not advance into forests and cannot be
dated by radiocarbon isotopes (e.g., Mood and Smith, 2015; Wiles et al., 2011) can be directly dated. This
method offers a means of constraining patterns of such climate intervals across broad regions.
Conversely, glaciolacustrine deposits provide detailed, continuous records of glacier activity in individual
valleys, from growth to maxima and then retreat. However, glacial lake sediment cores are difficult to
collect and are typically restricted to only a few locations, hindering testing of regional patterns of glacier
activity.
10Be CRN analysis of boulders is now a well-established method for dating Pleistocene moraines
(Doughty et al., 2015; Schaefer et al., 2015; Putnam et al., 2013; Schaefer et al., 2009; Licciardi et al.,
2004; Brugger, 2007). Earth is constantly being bombarded by cosmic radiation, some of which reaches
the Earth’s surface where it is progressively absorbed within the upper few meters and interacts with
specific elements in rocks to produce several rare isotopes, or CRNs (Cockburn and Summerfield, 2004).
By analyzing the concentrations of CRNs in rocks, and the rates at which they are produced, timing and
rates of various geomorphic processes or events can be quantified. In terms of dating, CRN

2
concentrations are used to estimate the time elapsed since a rock was exposed at the surface. Until
recently, however, the analytical uncertainties were too large to reliably date boulder emplacement in
Holocene deposits. Recent advances in analytic methods at a few labs have enabled precise 10Be exposure
dating of boulders as young as late LIA (Zimmerman, 2014). Early results from an ongoing study testing
the viability of this new ability on outermost Holocene moraine boulders in the Sierra Nevada in CA has
yielded some unexpected findings; whereas some moraines have boulder ages that are all consistent with
late LIA formation (150-300 yr B.P.), other moraines have groupings of ages that are all thousands of
years older (Figures 1-5) (Clark et al., 2015).
This wide spread of moraine exposure ages conflicts with previous studies of Holocene glaciation
in the range based on geomorphic mapping and lake sediment coring, which indicate that maximum
Holocene glacial extents occurred during the late LIA (Konrad and Clark, 1998; Bowerman and Clark,
2011). Although inheritance (prior exposure of rocks in the cirque headwalls) may account for some of
the pre-LIA boulder ages, this explanation is inconsistent with both the groupings of older ages, and with
the absence of any LIA ages in several of these deposits. Alternative explanations are that the ages are
accurate and Holocene glaciation in the Sierra Nevada was far more complex than previously thought, or
that other processes affect moraine formation on these cirque glaciers (e.g., periglacial activity and/or
rockfall events).
My research objective is to analyze lake sediments below pertinent Holocene cirque glaciers in
the Sierra Nevada of California to test these disparate hypotheses. As glaciers grow the glacial abrasion of
bedrock increases due to larger affected surface area and higher flow rates. This abrasion increases the
flux of glacial rock flour (fine-grained suspended rock powder that is produced by basal abrasion) into
downstream proglacial lakes where it gradually settles onto the lake bottom (Dahl et al., 2003; Karlén,
1981). Conversely, as glaciers shrink, rock flour production and deposition will decrease. These changes
in rock flour production are recorded in pro-glacial lake sediment stratigraphy (Leonard, 1985; Karlén,
1981). Such sediment records can thus yield continuous records of glaciation in a basin. Rock flour
sedimentation rates may remain relatively high with respect to ice extent for up to the first century after
ice decline due to unstable glaciogenic deposits being exposed to fluvial processes during ice recession;
this process may create a lag of peak rock flour deposition in the glaciolacustrine record with respect to
the glacier mass-balance (Leonard, 1986). In the Sierra Nevada, however, Bowerman and Clark (2011)
argue that the small, boulder-dominated moraines typical of Holocene deposits in the range do not exhibit
the same lag effect.
By developing high-resolution continuous lake core records below three of the dated moraine
sequences, my study will help test whether the wide spread of 10Be CRN ages in the Sierra Nevada
accurately records Holocene glacial events or, alternatively, may reflect other largely unrecognized

3
geomorphic processes. Either result will have substantial implications for the study of Holocene moraine
deposits and glacial records both in the Sierra Nevada and elsewhere. If CRN ages are accurate as
depicted in the glaciolacustrine record, then CRN dating will be an important tool in future study of
Holocene glacial fluctuations worldwide and would indicate a much more spatially and temporally
complex climate in the Sierra Nevada than the current literature suggests. If the CRN ages are not
validated, it would imply other non-glacial processes are affecting these exposure ages and further work
needs to be completed for CRN dating to be a viable option for reliably dating small Holocene cirque
moraines.
2.0 Background 2.1 Geologic Setting This study will focus on Holocene cirque glaciers in the Sierra Nevada of California, part of the
Western North American Cordillera (Figure 6). Specific field locations include the moraines and lakes
below the Lyell and Maclure Glaciers in Yosemite National Park and near Lake Tahoe in the Desolation
Wilderness. At each site, the cirques have steep north to northeast-facing headwalls that act as wind-traps
for snow in the winter and provide sun shielding during the summer, minimizing ice ablation. The Lyell
Glacier has recently stagnated, however, and is no longer considered a glacier by definition (Stock and
Anderson, 2012). Conversely, as of 2007, the Maclure Glacier is still flowing at the same rate (2.6 cm per
day) that John Muir first measured in 1872 despite losing over half its total surface area. Stock and
Anderson (2012) suggested that this consistent flow rate may reflect a shift from internal deformation to
basal sliding as the main mode of flow. All of the Desolation glaciers, near Mt. Price, are extinct with no
permanent snow/ice features in the associated cirques.
Bedrock of the Maclure and Lyell field sites consists of granodiorite, metavolcanic rock, diorite,
and gabbro (Huber et al., 2003). Bedrock of the Desolation field site comprises granodiorite, diorite,
gabbro, and granite (Saucedo et al., 2005). These high-alpine regions in the Sierra Nevada have been
scoured by multiple generations of glaciation throughout the Pleistocene (e.g., Tahoe, Tenaya, Tioga,
Recess Peak, Matthes) (Rood et al., 2011; Phillips et al., 2009; Sharp and Birman, 1963; Clark and
Gillespie, 1997), such that the field sites near the Holocene moraines are predominantly stripped,
relatively fresh, and often polished bedrock. The Holocene moraines at each field site are characterized by
steep, unstable slopes, a lack of vegetation (even lichen in many cases), and sharp, well-defined contacts
with surrounding bedrock; these features indicate a very young age of deposition (Figure 7).

4
The target lakes associated with these glaciers are well suited for lake sediment core analysis
because they are all bedrock dammed, directly fed by glacier outwash from the cirques, and are
immediately down-slope of the mapped Neoglacial maxima at each site (Figures 8 & 9) (Clark and
Gillespie, 1997). Consequently, these lakes should have captured continuous sedimentation (glacial rock
flour) from glacial advances and retreats throughout the entire Holocene (e.g., Bowerman and Clark,
2011). There are also historical accounts and photographic evidence of the last glacial advance at each
site during the late LIA. Lake sediment cores can be correlated with these known historical advance to
calibrate and validate core analysis.
2.2 Post-LGM Climate and Glacial fluctuations of the western North American Cordilleran
Mountain glaciers throughout most of the American Cordillera reached their late-Pleistocene
maxima during Oxygen Isotope Stage 2 (~25-18 ka), after which most experienced rapid retreat and
largely disappeared in most regions by ~15-16 ka (e.g., Margold et al., 2014; Riedel et al., 2010; Brugger,
2007; Guido et al., 2007; Licciardi et al., 2004; Briner et al., 2005). Following a short interval of warmer
and drier conditions, portions of the highest mountains experienced a brief period of glacier advance
during or immediately before the European Younger Dryas period (e.g., Clark and Gillespie, 1997; Davis
et al., 2009; Menounos et al., 2009; Osborn et al., 2012). In the Sierra Nevada, this event is termed the
Recess Peak advance and ended before ∼13,100±85 cal. years BP (Clark and Gillespie, 1997), shortly
before the beginning of the Holocene at 11.7 ka. In most regions, including the Sierra Nevada, these latest
Pleistocene advances extended beyond any subsequent Holocene advances (Davis et al., 2009; Clark and
Gillespie, 1997), and, thus, provide a distinct limit on extent of any Neoglacial activity.
Globally, the early Holocene, ~11.0-5.0 ka, was characterized by relatively warm conditions,
known as the Altithermal. Following the Altithermal, overall cooling of ~0.7°C through the middle to late
Holocene culminated in the Little Ice Age of the last Millennium (Marcott et al., 2013).. Glaciers in the
North American Cordillera appear to have responded to these shifts in temperatures through a series of
advances and retreats. Alaskan glaciers advanced at about 4.5-4.0, 3.3-2.9, 2.2-2.0, 1.4-1.2 ka and then
with progressively larger advances during the last millennium at 1180-1320, 1540-1710 and 1810-1880
CE (broadly encompassing the extent of the LIA) (Solomina et al., 2015; Wiles et al., 2011). Glaciers in
western Canada were the least extensive in the early Holocene from ~11-7 ka. However, several minor
advances occurred in this period at ~8.6-8.2, ~7.4-6.5, ~4.4-4.0, ~3.5-2.8, ~1.7-1.3 ka and the past
millennium (LIA) (Menounos et al., 2009). Mood and Smith (2015) documented similar timings of
glacial fluctuations in the British Columbia Coast Mountains with the addition of one advance from 5.4-
5.3 ka. Neoglacial advances on Mt Baker in the North Cascades occurred at ~6.0 ka, ~2.2 ka, ~1.6 ka,

5
~0.9 ka, ~0.4 ka, and peaked with the maximum LIA extents in the mid-1800s (Osborn et al., 2012). In all
accounts these glacier advances are characterized by successively larger glacial extents through the
Holocene, peaking during the height of the LIA (~18th & 19th centuries). Since the end of the LIA (~200
yrs BP), global temperatures have increased and are now warmer than during ~75% of the Holocene
(Marcott et al., 2013).
Most moraine evidence of early Neoglacial activity in the U.S. Cordillera prior to the latest LIA
push has been over-ridden and obliterated, obscuring the terrestrial Neoglacial record in many ranges.
Additionally, because these glaciers predominantly terminate above the treeline (in contrast to those in
Alaska, Canada, and the larger Cascade volcanoes), these deposits contain little or no datable organic
material associated with the timing of formation. Accordingly, alternative methods must be employed to
date moraines and discern longer-term histories (pre-LIA maximum), primarily CRN dating and
glaciolacustrine proxy records.
2.2.1 Sierra Nevada Glacial Record Early studies documented the activity and extent of glaciers in the Sierra Nevada. John Muir
(1875) first documented “living glaciers” in the range in 1871 by recording flow rates on the Maclure
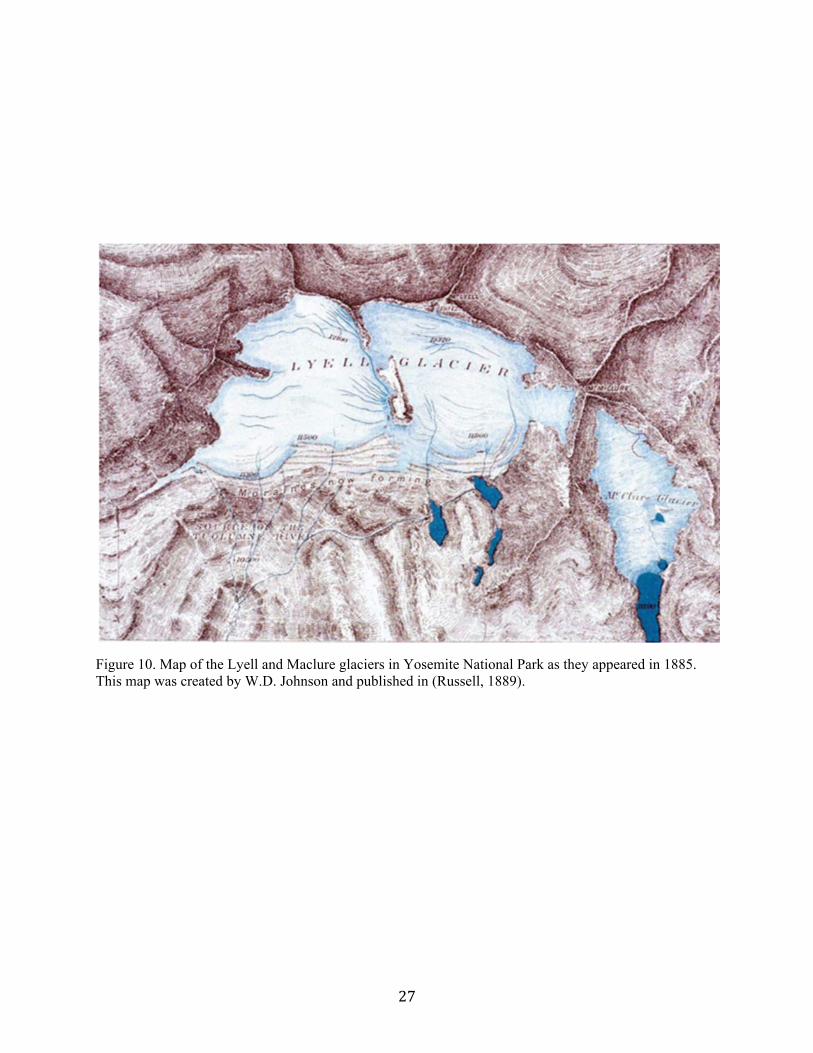
Glacier in 1872. The first glacier map in the Sierra Nevada, of the Lyell and Maclure glaciers (Figure 10),
indicates that both glaciers were at or near their Holocene maximum positions in 1885 (Russell, 1889).
More recent studies by Basagic and Fountain (2011) and Basagic (2008) compare these early studies with
subsequent historical observations to document a consistent overall decrease in glacial extent from the
first observations to the present.
Stock et al. (2013) recently measured flow rates over four years (2009-2012) of both the Lyell
and Maclure glaciers in Yosemite National Park. Their measurements showed no detectable movement at
the Lyell Glacier, indicating that the glacier had stagnated by 2012. Despite a significant decrease in size,
the Maclure Glacier is still flowing at about 7.2 meters per year, the same rate John Muir measured in
1872. The dominant mode of movement for the Maclure Glacier may have shifted from dominantly
internal deformation to basal sliding because the glacier is melting more rapidly and has less volume and,
thus, less mass to cause deformation (Stock and Anderson, 2012).
Glacial fluctuations during the Holocene in the Sierra Nevada appear to follow a similar, though
abbreviated, overall pattern to glaciers in the mountain ranges farther north. Following the retreat of the
late-glacial Recess Peak glaciers (~12,000 cal yr BP), the Sierra Nevada appears to have remained
essentially unglaciated until the late Holocene (Clark and Gillespie, 1997; Phillips et al., 2009). Based on
the rock flour record below the Palisade Glacier (Bowerman and Clark, 2011) and the Conness Glacier

6
(Konrad and Clark, 1998), glacial maxima of progressively larger extent were interpreted at ~3200,
~2200, ~1600, ~700, and ~250-170 cal yr BP. The most recent advance (Matthes in the Sierra Nevada,
traditionally regarded as LIA) was considered the most extensive Neoglacial advance and apparently
obliterated geomorphic evidence of previous Neoglacial advances. This interpretation, however, is based
on local records of a few glaciers and the correlation of mapped moraine extents. Inferring regional
significance and glacial fluctuations for the entire Sierra Nevada from two sites may be problematic.
3.0 Methods
3.1 Site Selection Three glacial systems were selected in two field areas located in the Sierra Nevada (Figure 6) to
test Holocene glacial-age disparities for numerous reasons. The associated moraine sequences have
preliminary CRN dates, which show dramatic differences in exposure ages between various moraines.
Moraines are distinct and geomorphically well defined. There are no existing glaciolacustrine records at
the sites and the proglacial lakes are well-situated down-valley of the maximum Neoglacial extent as to
record a complete sediment record. The granitic basins have been stripped by prior glacier advances,
which should result in a clean rock flour record. The Yosemite field sites (Lyell and Maclure) exhibit two
distinct moraine records according to preliminary 10Be ages despite close proximity (directly adjacent
glaciers), so the potential local variability of glacier activity can be directly tested. Additionally, the
Desolation field site is the northernmost location of mapped Neoglacial moraines in the Sierra Nevada, so
I can test the regional variability of glacier responses. All sites are accessible by trail and pack mules are
available in Yosemite to aid with equipment transport.
3.2 Remote and Field Mapping I have completed preliminary mapping of both the modern glacier extents and the maximum
potential Neoglacial extents at each target sites using lidar imagery (2007-Yosemite NP) and
georeferenced Google Earth imagery (2013-Yosemite NP, 2012-Desolation) in ArcGIS 10.3.1. For this
study, I consider “modern” to be 2013 in Yosemite and 2012 in the Desolation Wilderness because these
are the dates of the most recent low-snow imagery available. This ensures that the imagery depicts actual
glacial extents versus residual winter snow. Surface areas of the glaciers were calculated for each extent
of each respective glacier using ArcGIS.

7
During this summer (2016), I will conduct additional field mapping of specific moraines that
were poorly resolved in remote mapping. I will record moraine positions on aerial imagery as well as with
either a Trimble GeoXH 6000 GPS unit or a Garmin 64 S GPS unit. I will also attempt to map the current
ice limits of the Maclure and Lyell glaciers. This mapping will only be feasible if weather and snow
conditions permit.
3.3 Lake Sediment Coring
Proglacial lakes in the Sierra Nevada provide excellent sites for recording changes in glacial rock
flour production. The glacially stripped granitic cirque basins typical of the range have only a few
primary sources of clastic sediment: rock flour (if a glacier is present), slope-wash, stream bedload, and
aeolian dust. In contrast to the fine silt size of rock flour, slope wash and bedload in Sierra Nevada basins
are generally dominated by sand-sized gruss and larger sediments (Bowerman and Clark, 2011).
Additionally, aeolian dust, although similar in size to rock flour, is generally more weathered, less
magnetic, and so has a weaker magnetic susceptibility (MS) signal (Rosenbaum et al., 2012; Matthews et
al., 2000; Snowball, 1993). Rock flour is typically blue-grey in color, which is reflected in the visual
stratigraphy of glaciolacustrine sediments (Dahl et al., 2003) and during times of increased glacial
activity, the rock flour signal inundates the organic signal, which is reflected by a coincident decrease in
Loss on Ignition (LOI) (Bakke et al., 2005; Dahl et al., 2003; Matthews et al., 2000; Karlén, 1981).
Terrestrial macrofossils are usually present, having been deposited and incorporated into the lake
sediments, providing a means to date interpreted glacial maxima using radiocarbon dating (e.g.,
Bowerman and Clark, 2011; Konrad and Clark, 1998; Clark and Gillespie, 1997). These ages of glacial
maxima, interpreted and dated from the glaciolacustrine record, can then be directly compared to the
preliminary CRN ages.
3.3.1 Bathymetry The deepest portions of lake basins usually provide the highest resolution and most complete
sediment records (Larsen et al., 1998). For this reason, mapping the bathymetry of each targeted lake
basin is crucial to retrieving a sediment core record that captures the longest duration of sedimentation.
The depth of the lake is also crucial to establish which and how much coring equipment will be needed
for successful core recovery. I will primarily use the Livingston piston corer, which can be used in lake
depths of up to ~20 meters from a raft. During the summer of 2015, I collected detailed bathymetric data
of all potential lake core sites below the Price cirques, and the Lyell and Maclure glaciers. For each lake, I

8
recorded depth data along a systematic grid in a 2-man inflatable raft, taking GPS points every ~5-15
meters, using the Trimble GeoXH 6000, and recording the water depth using a handheld bathymetry
meter. In the lab, the GPS data were differentially corrected (most uncertainties were < 1m). In Surfer 8,
the GPS data were compiled and used to create detailed bathymetry maps from which specific coring
targets were identified.
3.3.2 Coring and Coring Equipment Protocol
I will core at least one lake below each glacier using two lake coring systems, operated from a
backpackable floating raft. For deeper sediments, I will use a 2-in (50.8 mm) diameter modified
Livingston piston corer (Wright Jr., 1967). This system uses a series of solid extension rods to reach from
the lake surface to the sediment-water interface, coring in one-meter pushes. At each lake, I will collect
two adjacent, but vertically offset, Livingston cores. This will ensure a complete stratigraphic record
without any gaps between pushes. The cores will then be extruded into split PVC pipes with foam filling
any void space and duct taped together for safe transport out of the field area and to the lab. The foam will
help preserve core stratigraphy until it can be stored and analyzed.
To recover high-resolution samples of the poorly consolidated uppermost sediments, I will use a
Glew corer (Glew, 1991). This system is a single-push percussion system and so does not require casing.
The core barrel and the core head (with attached weight) are lowered on a rope line to within a meter of
the sediment-water interface. From this position, the system is dropped to the bottom for the initial drive
into the sediment; after which, a secondary weight, centered on the main line, is lowered from the surface
using a secondary line. Upon reaching the core head, the weight is raised and lowered repeatedly to pound
the core barrel to its final depth. Because the uppermost sediments recovered by the Glew corers are so
poorly consolidated, transporting them out of the field is not feasible. Instead, I will sample them in the
field; prior to sampling though, I will record magnetic susceptibility using a battery-operated Bartington
MS2-C meter, recording every cm. I will collect bulk samples at 1-cm intervals through the cores and
preserve them in plastic sample bags for transport back to the lab.

9
3.4 Lab Work
3.4.1 LacCore Analyses Detailed and high-resolution analysis of core stratigraphy is critical in order to establish the
timing and magnitude of the glacial rock flour signal and to differentiate it from other non-glacial
components such as organic matter and slope-wash. I have received a 2016 LacCore Visiting Graduate
Student Travel Grant which will supply me with $1,000 to cover the cost of shipping cores to the LacCore
facility at the University of Minnesota, airfare, housing, and any incidental lab fees/equipment costs while
I complete the Initial Core Description (ICD) process under direct supervision. I plan to focus data
collection within the ICD on whole and split cores using the MSCL (targeting magnetic susceptibility),
core splitting and surface preparation, visual stratigraphy / macroscopic sediment description, and
capturing high resolution imagery. Additional analyses, including electrical resistivity, gamma density,
color spectrophotometry and laser size analysis are also available at the lab and may be beneficial, but
access to these tests will depend on availability of funding not directly covered by the grant. All the
analyses above would yield critical information about glacial and non-glacial sediment production in the
basin.
3.4.2 WWU Sediment Coring Lab Analyses Further core analyses will be conducted in the Sediment Coring Lab at WWU, including loss-on-
ignition (LOI), laser particle size analysis, 210Pb dating, and tephra analysis on our SEM microprobe. LOI
provides a measure of the proportion of organic matter vs. minerogenic sediment in a sample and is often
used in glacial studies as an inverse indicator for inorganic deposition (Bakke et al., 2005; Dahl et al.,
2003; Matthews et al., 2000; Karlén, 1981). Laser particle size analysis will likely be conducted using the
WWU Department Malvern Mastersizer 2000. This analysis can be critical to distinguish glaciogenic
clastic sediments (i.e. rock flour that is typically fine-silt sized) from non-glaciogenic clastic sediments
(typically coarser, deposited by inlet creeks and slope-wash into the target basins) (Dahl et al., 2003).
Based on other cores collected in the region (Clark and Gillespie, 1997; Konrad and Clark, 1998), I
anticipate encountering at least one late-Holocene Mono Craters tephra (~650 cal yr B.P.) in the Yosemite
lakes and early Holocene Mazama ash (7600 cal yr B.P.) or Tsoyowata ash (Mazama precursor) in all
lakes. 210Pb dating, to be conducted in the Wetlands Ecology Lab using a Canberra GL 282R Ge gamma
spectrometer, will yield age constraints on the uppermost, young core stratigraphy and tephra analysis
will provide additional reference points for age control.

10
3.4.3 LLNL Radiocarbon Dating I will sample the cores for macrofossils to radiocarbon date via accelerator mass spectrometry
(AMS). For each lake, I plan to constrain the stratigraphy with at least 3-5 radiocarbon dates. I will
process and analyze the samples at the Center for Accelerator Mass Spectrometry at LLNL. WWU’s
Geology Department has a collaborative agreement with LLNL, which will allow me to process my
samples at their lab facility and, in return, receive a reduced rate of $250 per sample. For each lake, I will
establish a composite master stratigraphy, and by incorporating age constraints from the AMS
radiocarbon analyses, the tephrachronology, and the 210Pb into a Bacon age-depth model (Blaauw and
Christen, 2011), I will develop continuous high-resolution age models for each lake. These age
constraints will allow me to determine the timing of glacial fluctuations including advances, retreats, non-
glacial periods, and any other event recorded in the lake sediments. Upon the completion of my core
analysis, I will be able to directly compare 10Be CRN ages to periods of glacial activity as reflected by the
rock flour signal in the cores.
4.0 Preliminary Results
4.1 Mapping of Maximum Neoglacial Extent
Maximum Neoglacial glacier extents in Yosemite are 0.329 km2 (Maclure Glacier), 0.456 km2
(West Lyell lobe), and 0.653 km2 (East Lyell lobe). Modern (2013) glacier extents are 0.140 km2
(Maclure Glacier), 0.244 km2 (West Lyell lobe), and 0.0481 km2 (East Lyell lobe), marking a substantial
decrease in size of these glaciers (Figure 11). The smallest decrease in size was about 47% on the West
Lyell Glacier from Neoglacial to modern. The East Lyell Glacier lobe exhibits the largest decrease from
Neoglacial to modern in Yosemite losing ~93% of its surface area. Desolation Wilderness maximum
Neoglacial extents are 0.023 km2, 0.0241 km2 and 0.037 km2 and 0.117 km2 (both occurring in the same
cirque reflecting different neoglacial events). All of these glaciers have since disappeared entirely.
4.2 Bathymetry
The results from preliminary fieldwork during the summer of 2015 show all lakes can be cored
from an anchored raft during summer conditions. Five out of the six target lakes beneath the Lyell and
Maclure glaciers are less than eleven meters deep (Figures 12-16). The lowermost lake below the Maclure
Glacier (Maclure Lake) is approximately seventeen meters deep, which is still feasible to core from a raft
(Figure 17). The uppermost basin of Lake Aloha, beneath the Price cirque moraines, is 12 meters at its

11
deepest point (Figure 18). All of these target lakes fall within the water depth limit of ~20 meters for the
Livingston coring system from a floating raft.
5.0 Anticipated Results
There are two end-member possibilities of anticipated results:
1) Periods of glacial activity, particularly peaks in glaciation as recorded in the glaciolacustrine
records, are largely consistent with the 10Be moraine exposure ages determined by LLNL. This
consistency between proxy records would support the viability and accuracy of applying high precision
CRN dating to young Holocene cirque glacier deposits. Exposure dating is a much more convenient and
less labor-intensive method of dating glacial deposits across a broad region than is lake coring. As such,
proving the effectiveness for CRN dating would have a significant influence on future studies of
Holocene glaciation. This result would also have profound implications for Holocene glaciation in the
Sierra Nevada and elsewhere in the western Cordillera, indicating it is much more spatially and
temporally complex than previously thought.
2) Alternatively, my lake sediment cores may indicate little or no glacial activity during the time
intervals indicated by the early and mid-Holocene CRN ages (pre-4000 yr ago), as indicated by previous
studies in the region (Bowerman and Clark, 2011; Konrad and Clark, 1998). This result would indicate
that other non-glacial, geomorphic processes complicate the moraine CRN ages including possible slope
processes (e.g., rockfall events), unusual periglacial processes (e.g., enhanced freeze-thaw activity,
protalus rampart formation, slow-flow phenomena), or some unrecognized processes related to
inheritance in the cirque headwalls and/or reworking past moraine deposits (e.g., Li et al., 2016). It is
possible that some of these processes may be reflected in the lake core records (e.g., enhanced gruss
related to rockfall/earthquake events), which may allow me to further constrain these options.
My results could also indicate explanations that lie somewhere between these two end-member
anticipated results. The CRN ages could be corroborated by lake core analysis during a certain time
period, but not for others. Regardless, my study will yield relevant and robust results regarding Holocene
glaciation in the Sierra Nevada as well as provide some potentially significant new constraints to this new
capability of CRN dating.

12
6.0 Timeline Table 1: Detailed schedule of tasks and the predicted time frame respectively.
2016 2017 Task Aug Sep Oct Nov Dec Jan Feb Mar Apr May Jun
Lit Review ✔ ✔ ✔ ✔ ✔ ✔ ✔ ✔ ✔ ✔Lake Coring & Field Mapping ✔
LacCore Analyses ✔
WWU Lab Analyses ✔ ✔
AMS 14C Dating ✔ ✔ Data Analysis ✔ ✔ ✔ ✔ ✔ Writing drafts ✔ ✔ ✔ ✔ ✔ ✔ ✔ ✔ ✔ Thesis Defense
& Publish ✔ ✔

13
7.0 References Bakke, J., Nesje, A., Dahl, S.O., and others, 2005, Utilizing physical sediment variability in glacier-fed
lakes for continuous glacier reconstructions during the Holocene, northern Folgefonna, western Norway: The Holocene, v. 15, p. 161–176.
Basagic, H.J., 2008, Quantifying Twentieth Century Glacier Change in the Sierra Nevada, California: Portland State University, 115 p.
Basagic, H.J., and Fountain, A.G., 2011, Quantifying 20th Century Glacier Change in the Sierra Nevada, California: Arctic, Antarctic, and Alpine Research, v. 43, p. 317–330, doi: 10.1657/1938-4246-43.3.317.
Blaauw, M., and Christen, A., 2011, Flexible Paleoclimate Age-Depth Models Using an Autoregressive Gamma Process: Bayesian Analysis, v. 6, p. 457–474, doi: 10.1214/11-BA618.
Bowerman, N.D., and Clark, D.H., 2011, Holocene glaciation of the central Sierra Nevada, California: Quaternary Science Reviews, v. 30, p. 1067–1085, doi: 10.1016/j.quascirev.2010.10.014.
Briner, J.P., Kaufman, D.S., Manley, W.F., Finkel, R.C., and Caffee, M.W., 2005, Cosmogenic exposure dating of late Pleistocene moraine stabilization in Alaska: Geological Society of America Bulletin, v. 117, p. 1108–1120.
Brugger, K.A., 2007, Cosmogenic 10Be and 36Cl ages from Late Pleistocene terminal moraine complexes in the Taylor River drainage basin, central Colorado, USA: Quaternary Science Reviews, v. 26, p. 494–499, doi: 10.1016/j.quascirev.2006.09.006.
Clark, D.H., and Gillespie, A.R., 1997, Timing and significance of Late-glacial and Holocene cirque glaciation in the Sierra Nevada, California: Quaternary International, v. 38-39, p. 21–38, doi: 10.1016/S1040-6182(96)00024-9.
Clark, D.H., Hidy, A.J., Zimmerman, S.H., Finkel, R.C., Stock, G.M., and Schaefer, J.M., 2015, Wide span of exposure ages on Holocene moraines in the Sierra Nevada: process or climatic controls?, https://gsa.confex.com/gsa/2015AM/webprogram/Paper269088.html (accessed November 2015).
Cockburn, H.A.P., and Summerfield, M.A., 2004, Geomorphological applications of cosmogenic isotope analysis: Progress in Physical Geography, v. 28, p. 1–42, doi: 10.1191/0309133304pp395oa.
Dahl, S.O., Bakke, J., and Nesje, A., 2003, Reconstruction of former glacier equilibrium-line altitudes based on proglacial sites: an evaluation of approaches and selection of sites: Quaternary Science Reviews, v. 22, p. 275–287.
Davis, P.T., Menounos, B., and Osborn, G., 2009, Holocene and latest Pleistocene alpine glacier fluctuations: a global perspective: Quaternary Science Reviews, v. 28, p. 2021–2033, doi: 10.1016/j.quascirev.2009.05.020.
Doughty, A.M., Schaefer, J.M., Putnam, A.E., Denton, G.H., Kaplan, M.R., Barrell, D.J.A., Andersen, B.G., Kelley, S.E., Finkel, R.C., and Schwartz, R., 2015, Mismatch of glacier extent and summer insolation in Southern Hemisphere mid-latitudes: Geology, v. 43, p. 407–410, doi: 10.1130/G36477.1.

14
Fountain, A.G., and Tangborn, W.V., 1985, The Effect of Glaciers on Streamflow Variations: Water Resources Research, v. 21, p. 579–586, doi: 10.1029/WR021i004p00579.
Glew, J.R., 1991, Miniature gravity corer for recovering short sediment cores: Journal of Paleolimnology, v. 5, p. 285–287.
Guido, Z.S., Ward, D.J., and Anderson, R.S., 2007, Pacing the post-last glacial maximum demise of the Animas Valley Glacier and the San Juan Mountain ice cap, Colorado: Geology [Boulder], v. 35, p. 739–742, doi: 10.1130/G23596A.1.
Huber, N.K., Bateman, P.C., Wahrhaftig, C., Aitken, D., and Phillips, E., 2003, Geologic Map of Yosemite National Park and Vicinity, California: a digital database: U.S. Geological Survey, http://pubs.usgs.gov/imap/i1874/ (accessed April 2016).
Karlén, W., 1981, Lacustrine Sediment Studies. A Technique to Obtain a Continous Record of Holocene Glacier Variations: Geografiska Annaler. Series A, Physical Geography, v. 63, p. 273, doi: 10.2307/520840.
Konrad, S.K., and Clark, D.H., 1998, Evidence for an Early Neoglacial Glacier Advance from Rock Glaciers and Lake Sediments in the Sierra Nevada, California, U.S.A.: Arctic and Alpine Research, v. 30, p. 272, doi: 10.2307/1551975.
Larsen, C.P.S., Pienitz, R., Smol, J.P., Moser, K.A., Cumming, B.F., Blais, J.M., MacDonald, G.M., and Hall, R.I., 1998, Relations between lake morphometry and the presence of laminated lake sediments: a re-examination of Larsen and MacDonald (1993): Quaternary Science Reviews, v. 17, p. 711–717.
Leonard, E.M., 1989, Climatic Change in the Colorado Rocky Mountains: Estimates Based on Modern Climate at Late Pleistocene Equilibrium Lines: Arctic and Alpine Research, v. 21, p. 245, doi: 10.2307/1551563.
Leonard, E.M., 1985, Glaciological and climatic controls on lake sedimentation, Canadian Rock Mountains: Zeitschrift fur gletscherkunde und glazialgeologie, v. 21, p. 35–42.
Leonard, E.M., 1986, Varve studies at Hector Lake, Alberta, Canada, and the relationship between glacial activity and sedimentation: Quaternary Research, v. 25, p. 199–214, doi: 10.1016/0033-5894(86)90057-8.
Licciardi, J.M., Clark, P.U., Brook, E.J., Elmore, D., and Sharma, P., 2004, Variable responses of western US glaciers during the last deglaciation: Geology, v. 32, p. 81–84.
Li, Y., Li, Y., Harbor, J., Liu, G., Yi, C., and Caffee, M.W., 2016, Cosmogenic 10Be constraints on Little Ice Age glacial advances in the eastern Tian Shan, China: Quaternary Science Reviews, v. 138, p. 105–118, doi: 10.1016/j.quascirev.2016.02.023.
Marcott, S.A., Shakun, J.D., Clark, P.U., and Mix, A.C., 2013, A Reconstruction of Regional and Global Temperature for the Past 11,300 Years: Science, v. 339, p. 1198–1201, doi: 10.1126/science.1228026.
Margold, M., Stroeven, A.P., Clague, J.J., and Heyman, J., 2014, Timing of terminal Pleistocene deglaciation at high elevations in southern and central British Columbia constrained by 10Be

15
exposure dating: Quaternary Science Reviews, v. 99, p. 193–202, doi: 10.1016/j.quascirev.2014.06.027.
Matthews, J., Dahl, S.O., Nesje, A., Berrisford, M.S., and Carin Andersson, 2000, Holocene glacier variations in central Jotunheimen, southern Norway based on distal glaciolacustrine sediment cores: Quaternary Science Reviews, v. 19, p. 1625–1647, doi: 10.1016/S0277-3791(00)00008-1.
Meier, M.F., 1962, Proposed definitions for glacier mass balance terms: Journal of Glaciology, v. 4, p. 252–261.
Meier, M.F., Dyurgerov, M.B., Rick, U.K., O’Neel, S., Pfeffer, W.T., Anderson, R.S., Anderson, S.P., and Glazovsky, A.F., 2007, Glaciers Dominate Eustatic Sea-Level Rise in the 21st Century: Science, v. 317, p. 1064–1067, doi: 10.1126/science.1143906.
Menounos, B., Osborn, G., Clague, J.J., and Luckman, B.H., 2009, Latest Pleistocene and Holocene glacier fluctuations in western Canada: Quaternary Science Reviews, v. 28, p. 2049–2074, doi: 10.1016/j.quascirev.2008.10.018.
Mood, B.J., and Smith, D.J., 2015, Holocene glacier activity in the British Columbia Coast Mountains, Canada: Quaternary Science Reviews, v. 128, p. 14–36, doi: 10.1016/j.quascirev.2015.09.002.
Moore, R.D., Fleming, S.W., Menounos, B., Wheate, R., Fountain, A., Stahl, K., Holm, K., and Jakob, M., 2009, Glacier change in western North America: influences on hydrology, geomorphic hazards and water quality: Hydrological Processes, v. 23, p. 42–61, doi: 10.1002/hyp.7162.
Osborn, G., Menounos, B., Ryane, C., Riedel, J., Clague, J.J., Koch, J., Clark, D., Scott, K., and Davis, P.T., 2012, Latest Pleistocene and Holocene glacier fluctuations on Mount Baker, Washington: Quaternary Science Reviews, v. 49, p. 33–51, doi: 10.1016/j.quascirev.2012.06.004.
Phillips, F.M., Zreda, M., Plummer, M.A., Elmore, D., and Clark, D.H., 2009, Glacial geology and chronology of Bishop Creek and vicinity, eastern Sierra Nevada, California: Geological Society of America Bulletin, v. 121, p. 1013–1033, doi: 10.1130/B26271.1.
Putnam, A.E., Schaefer, J.M., Denton, G.H., Barrell, D.J.A., Birkel, S.D., Andersen, B.G., Kaplan, M.R., Finkel, R.C., Schwartz, R., and Doughty, A.M., 2013, The Last Glacial Maximum at 44°S documented by a 10Be moraine chronology at Lake Ohau, Southern Alps of New Zealand: Quaternary Science Reviews, v. 62, p. 114–141, doi: 10.1016/j.quascirev.2012.10.034.
Riedel, J.L., Clague, J.J., and Ward, B.C., 2010, Timing and extent of early marine oxygen isotope stage 2 alpine glaciation in Skagit Valley, Washington: Quaternary Research, v. 73, p. 313–323, doi: 10.1016/j.yqres.2009.10.004.
Rood, D.H., Burbank, D.W., and Finkel, R.C., 2011, Chronology of glaciations in the Sierra Nevada, California, from 10Be surface exposure dating: Quaternary Science Reviews, v. 30, p. 646–661, doi: 10.1016/j.quascirev.2010.12.001.
Rosenbaum, J.G., Reynolds, R.L., and Colman, S.M., 2012, Fingerprinting of glacial silt in lake sediments yields continuous records of alpine glaciation (35–15ka), western USA: Quaternary Research, v. 78, p. 333–340, doi: 10.1016/j.yqres.2012.06.004.

16
Russell, I.C., 1889, Quaternary history of Mono Valley, California: United States Geological Survey, p. 261-394 p.
Saucedo, G.J., Little, J.D., Watkins, S.E., Davis, J.R., Mascorro, M.T., Walker, V.D., and Ford, E.W., 2005, Geologic map of the Lake Tahoe basin, California and Nevada: California Geological Survey.
Schaefer, J.M., Denton, G.H., Kaplan, M., Putnam, A., Finkel, R.C., Barrell, D.J., Andersen, B.G., Schwartz, R., Mackintosh, A., Chinn, T., and others, 2009, High-frequency Holocene glacier fluctuations in New Zealand differ from the northern signature: science, v. 324, p. 622–625.
Schaefer, J.M., Putnam, A.E., Denton, G.H., Kaplan, M.R., Birkel, S., Doughty, A.M., Kelley, S., Barrell, D.J.A., Finkel, R.C., Winckler, G., Anderson, R.F., Ninneman, U.S., Barker, S., Schwartz, R., et al., 2015, The Southern Glacial Maximum 65,000 years ago and its Unfinished Termination: Quaternary Science Reviews, v. 114, p. 52–60, doi: 10.1016/j.quascirev.2015.02.009.
Sharp, R.P., and Birman, J.H., 1963, Additions to classical sequence of Pleistocene glaciations, Sierra Nevada, California: Geologic Society of America Bulletin, v. 74, p. 1079–1086.
Snowball, I., 1993, Mineral magnetic properties of Holocene lake sediments and soils from the Kårsa valley, Lappland, Sweden, and their relevance to palaeoenvironmental reconstruction: Terra Nova, v. 5, p. 258–270, doi: 10.1111/j.1365-3121.1993.tb00257.x.
Solomina, O.N., Bradley, R.S., Hodgson, D.A., Ivy-Ochs, S., Jomelli, V., Mackintosh, A.N., Nesje, A., Owen, L.A., Wanner, H., Wiles, G.C., and Young, N.E., 2015, Holocene glacier fluctuations: Quaternary Science Reviews, v. 111, p. 9–34, doi: 10.1016/j.quascirev.2014.11.018.
Stock, G., and Anderson, R., 2012, FINAL REPORT December 2012:, http://www.cfc.umt.edu/cesu/Reports/NPS/CU/2009/09_11Anderson_YOSE_glaciers_fnl%20rpt.pdf (accessed October 2015).
Stock, G.M., Anderson, R.S., and Devine, P., 2013, Retreat and stagnation of Little Ice Age glaciers in Yosemite National Park: Abstracts with Programs - Geological Society of America, v. 45, p. 53–53.
Wiles, G.C., Lawson, D.E., Lyon, E., Wiesenberg, N., and D’Arrigo, R.D., 2011, Tree-ring dates on two pre-Little Ice Age advances in Glacier Bay National Park and Preserve, Alaska, USA: Quaternary Research, v. 76, p. 190–195, doi: 10.1016/j.yqres.2011.05.005.
Wright Jr., H.E., 1967, A square-rod piston sampler for lake sediments: Journal of Sediment Petrology, v. 37, p. 975–976.
Zimmerman, S.H., 2014, High-precision 10Be dating of late Holocene glaciation in the Sierra Nevada: Testing hypotheses of the Little Ice Age and Holocene climate change: Lawrence Livermore National Laboratory, 1–17 p.

17
8.0 Tables
Table 2. Maximum Neoglacial and modern glacier surface area extent as well as the respective decrease in extent from Neoglacial to Modern.
Glacier Area of glacial extent (km2) Decrease in glacial extent (%)
Maclure (Neoglacial) 0.329 - Maclure (modern) 0.140 57.4
West Lyell (Neoglacial) 0.456 - West Lyell (modern) 0.244 46.5
East Lyell (Neoglacial) 0.653 - East Lyell (modern) 0.048 92.6 Price 1 (Neoglacial) 0.037 -
Price 1 (modern) 0.000 100 Price 2 (Neoglacial) 0.023 -
Price 2 (modern) 0.000 100 Price 3 (Neoglacial) 0.117 -
Price 3 (modern) 0.000 100 Price 4 (Neoglacial) 0.024 -
Price 4 (modern) 0.000 100

18
9.0 Figures
Figure 1. Preliminary CRN ages displayed for the associated boulders along each moraine sequence of the Lyell Glacier and Maclure Glacier in Yosemite National Park. Moraine crests are shown by yellow lines and sampled boulder locations are shown by red dots. Figure from Clark (2015).

19
Figure 2. Preliminary CRN ages are displayed along each moraine sequence of the Price glaciers in the Desolation Wilderness. Moraine crests are shown by yellow lines and sampled boulder locations are shown by red dots. Figure from Clark (2015).

20
Figure 3. Camel diagram of preliminary 10Be ages from the Lyell A lobe of the Lyell Glacier in Yosemite National Park.

21
Figure 4. Camel diagram of preliminary 10Be ages from the Maclure Glacier in Yosemite National Park.

22
Figure 5. Camel diagram of preliminary 10Be ages from the extinct glaciers beneath Mt Price in the Desolation Wilderness.

23
Figure 6. Location map of Sierra Nevada field sites. Lake coring sites for this study are indicated by yellow stars. Red stars indicate the remaining 10Be CRN study sites. From north to south: Price glaciers, Conness Glacier, Lyell and Maclure glaciers, and the Palisade Glacier and Agassiz rock glacier. (Base map from http://www.mappery.com/California-elevation-Map).

24
Figure 7. Photographs of the (a) Lyell terminal Neoglacial moraine and upper lake, (b) Desolation terminal Neoglacial moraine, and (c) Maclure terminal Neoglacial moraine. All are fresh, sharp crested with steep sides, boulder covered, and lacking vegetation.

25
Figure 8. Aerial imagery of the Yosemite field sites indicating primary targets for lake coring (all in glacial melt-water streams). Red lines indicate the maximum Neoglacial extents and yellow dots indicate 10Be CRN sample sites on terminal moraines of Maclure Glacier and both lobes of the Lyell Glacier. Imagery taken from 9/14/2013 (Google Earth).

26
Figure 9. Aerial imagery of the Desolation field site indicating primary targets for lake coring (all in glacial melt-water streams). Red lines indicate the maximum Neoglacial extents. Imagery taken from 8/28/2012 (Google Earth).
27
Figure 10. Map of the Lyell and Maclure glaciers in Yosemite National Park as they appeared in 1885. This map was created by W.D. Johnson and published in (Russell, 1889).

28
Figure 11. Neoglacial extent (light blue) and modern extent (dark blue) of the Lyell Glacier and Maclure Glacier. Five of the six target lakes are outlined in green (lower Lyell lake is farther north). Hillshade created from a 2007 LIDAR survey of Yosemite National Park.

29
Figure 12. Bathymetry map of the upper Lyell lake based off measured water depths (blue triangles). Contours are in meters. The star indicates the target coring location for this lake.

30
Figure 13. Bathymetry map of the middle Lyell lake based off measured water depths (blue triangles). Contours are in meters. The star indicates the target coring location for this lake.

31
Figure 14. Bathymetry map of the lower Lyell lake based off measured water depths (blue triangles). Contours are in meters. The star indicates the target coring location for this lake.

32
Figure 15. Bathymetry map of the upper Maclure lake based off measured water depths (blue triangles). Contours are in meters. The star indicates the target coring location for this lake.

33
Figure 16. Bathymetry map of the middle Maclure lake based off measured water depths (blue triangles). Contours are in meters. The star indicates the target coring location for this lake.

34
Figure 17. Bathymetry map of the lower Maclure lake based off measured water depths (blue triangles). Contours are in meters. The star indicates the target coring location for this lake.

35
Figure 18. Bathymetry map of the two uppermost basins of Lake Aloha based off measured water depths (blue triangles). Contours are in meters. The stars indicate target coring locations for these basins.