test results of benchmark fatigue tests on · pdf filetest results of benchmark fatigue tests...
TRANSCRIPT

`
TEST RESULTS OF BENCHMARK FATIGUE TESTS ON UD COUPONS
OB_TG1_R008 rev. 000
Draft version Confidential
D. J. Lekou
OPTIMAT BLADES
TG 1
OB_TG1_R008_rev.0
OPTIMAT BLADES Page 2 of 18 Last saved 28/11/2003 1:17 PM
Change record
Issue/revision date pages Summary of changes
draft 27.11.2003 Na na

OB_TG1_R008_rev.0
OPTIMAT BLADES Page 3 of 18 Last saved 28/11/2003 1:17 PM
Table of Contents
1. INTRODUCTION.............................................................................................................................. 4 2. EQUIPMENT ..................................................................................................................................... 5 3. COUPON DIMENSIONS AND PREPARATION.......................................................................... 6 4. TESTING PROCEDURES................................................................................................................ 8 5. RESULTS.......................................................................................................................................... 11
5.1. FATIGUE TESTS AT R=-1 ............................................................................................................. 11 6. CONCLUSIONS............................................................................................................................... 16 7. REFERENCES ................................................................................................................................. 18

OB_TG1_R008_rev.0
OPTIMAT BLADES Page 4 of 18 Last saved 28/11/2003 1:17 PM
1. INTRODUCTION
The work described in this report has been co-financed by the European Commission in the framework of the project under contract no ENK6-CT2001-00552, RELIABLE OPTIMAL USE OF MATERIALS FOR WIND TURBINE ROTOR BLADES (OPTIMAT BLADES). Coupon tests have been carried out within the benchmark phase in order to be able to compare results between different laboratories. In this report a detailed description of the coupon testing conducted at CRES within the framework of the OPTIMAT BLADES project. Results of the fatigue experiments from tests in unidirectional (UD) Glass/Epoxy coupons, which were carried out in the period August November 2003, are outlined.
OB_TG1_R008_rev.0
OPTIMAT BLADES Page 5 of 18 Last saved 28/11/2003 1:17 PM
2. EQUIPMENT
During testing the following equipment has been used:
• MTS ±250 kN coupon testing machine including:
o Load cell of ±100kN range, with an accuracy of at least 0.2% full scale
o LVDT of ±75mm range, with accuracy of at least 0.2% full scale o Hydraulic grip supply with maximum pressure adjusted to 14MPa.
• HBM Strain gauges of nominal electric resistance 350Ω, with a gauge length of 6mm connected each through HBM ME30 amplifiers with an output range of ±10V with HBM amplifier system MGA. Specifically following types of strain gauges have been used:
o Single strain gauges HBM 6/350 LY41, with amplifiers adjusted to 2000 µε/V for axial strain measurements.
o Single strain gauges HBM 6/350 LY61, with amplifiers adjusted to 2000 µε/V for axial strain measurements as an alternative to the previous type.
• PT100 with Micrelec amplifier type CLT-RT-420 adjusted to 10ºC+60ºC
• A 64 channel Data Acquisition System with a 16Bits A/D conversion card.
• A Vaisala Temperature and Humidity sensor type HMP131Y
• A Vaisala analog barometer type PTB100A All abovementioned equipment is calibrated according to the procedures of laboratory and certificates of traceable to NIST calibration data are kept at CRES facilities. Line calibration has been performed on all incoming signals to the data acquisition system used during testing. In particular strain gauge line calibration has been performed using Instrument Division Measurement Group Inc strain gauge simulator type 1550Α, while line calibration for the PT100 Wahl calibrator type TRC-82Β has been used.
OB_TG1_R008_rev.0
OPTIMAT BLADES Page 6 of 18 Last saved 28/11/2003 1:17 PM
3. COUPON DIMENSIONS AND PREPARATION
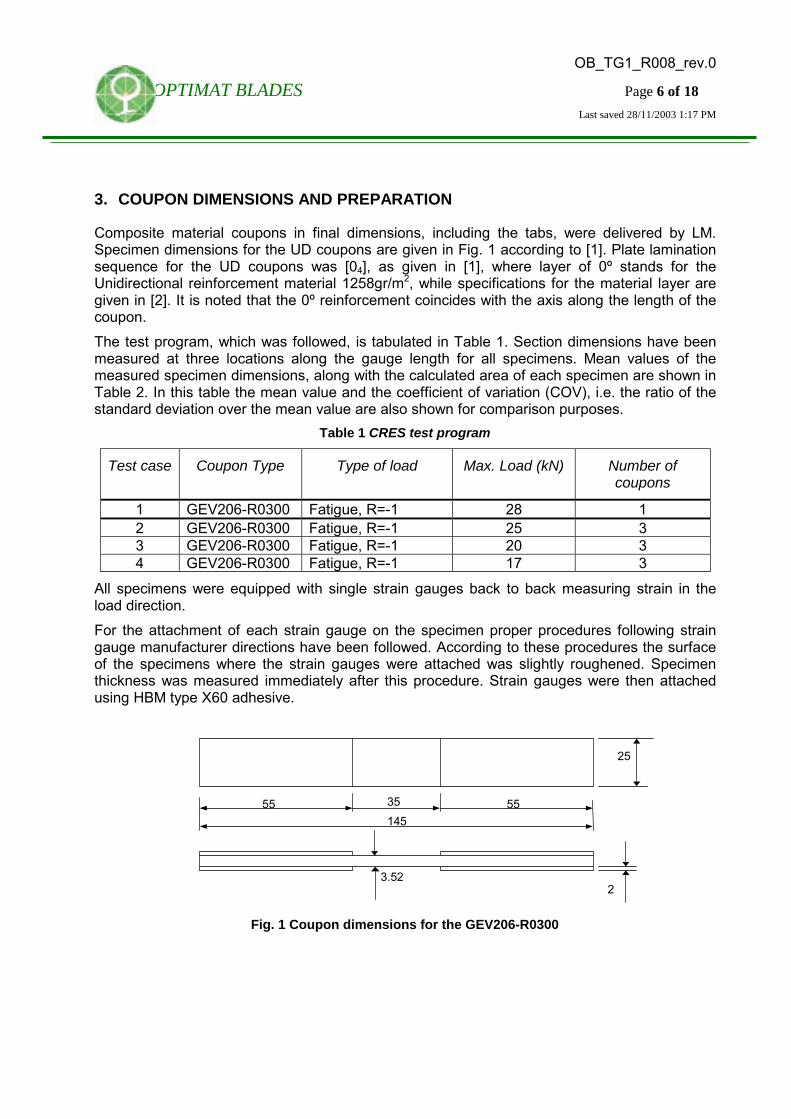
Composite material coupons in final dimensions, including the tabs, were delivered by LM. Specimen dimensions for the UD coupons are given in Fig. 1 according to [1]. Plate lamination sequence for the UD coupons was [04], as given in [1], where layer of 0º stands for the Unidirectional reinforcement material 1258gr/m2, while specifications for the material layer are given in [2]. It is noted that the 0º reinforcement coincides with the axis along the length of the coupon. The test program, which was followed, is tabulated in Table 1. Section dimensions have been measured at three locations along the gauge length for all specimens. Mean values of the measured specimen dimensions, along with the calculated area of each specimen are shown in Table 2. In this table the mean value and the coefficient of variation (COV), i.e. the ratio of the standard deviation over the mean value are also shown for comparison purposes.
Table 1 CRES test program
Test case Coupon Type Type of load Max. Load (kN) Number of coupons
1 GEV206-R0300 Fatigue, R=-1 28 1 2 GEV206-R0300 Fatigue, R=-1 25 3 3 GEV206-R0300 Fatigue, R=-1 20 3 4 GEV206-R0300 Fatigue, R=-1 17 3
All specimens were equipped with single strain gauges back to back measuring strain in the load direction. For the attachment of each strain gauge on the specimen proper procedures following strain gauge manufacturer directions have been followed. According to these procedures the surface of the specimens where the strain gauges were attached was slightly roughened. Specimen thickness was measured immediately after this procedure. Strain gauges were then attached using HBM type X60 adhesive.
2 3.52
145 55 55 35
25
Fig. 1 Coupon dimensions for the GEV206-R0300

OB_TG1_R008_rev.0
OPTIMAT BLADES Page 7 of 18 Last saved 28/11/2003 1:17 PM
Table 2 Specimen dimensions
Specimen No Thickness (mm)
Width (mm)
Area (mm2)
GEV206-R0300-0265 3.66 24.79 90.83 GEV206-R0300-0266 3.73 24.80 92.45 GEV206-R0300-0267 3.68 24.75 91.13 GEV206-R0300-0268 3.66 24.76 90.59 GEV206-R0300-0270 3.73 24.80 92.55 GEV206-R0300-0271 3.66 25.07 91.66 GEV206-R0300-0272 3.72 24.78 92.23 GEV206-R0300-0273 3.74 24.75 92.57 GEV206-R0300-0274 3.65 24.82 90.59 GEV206-R0300-0078 3.71 25.25 93.75
Mean value 3.69 24.86 91.84 COV (%) 0.96 0.67 1.14
OB_TG1_R008_rev.0
OPTIMAT BLADES Page 8 of 18 Last saved 28/11/2003 1:17 PM
4. TESTING PROCEDURES
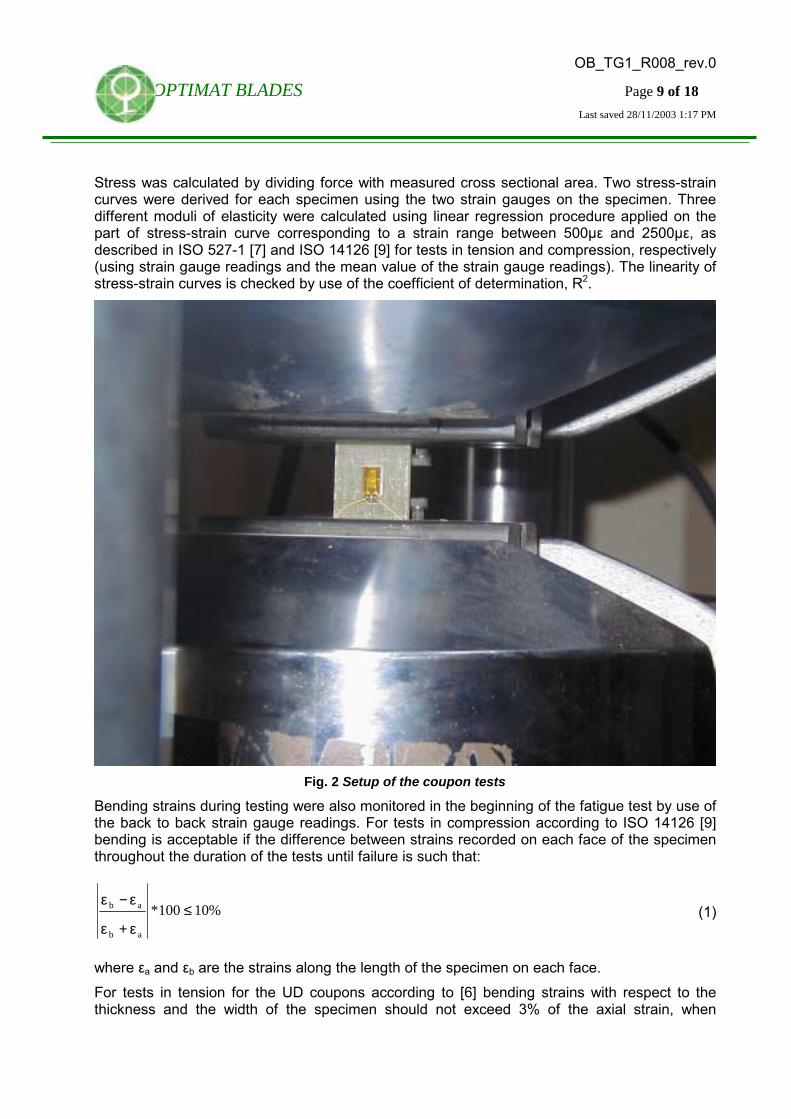
For all experiments conducted coupons were aligned and mounted on the MTS 810 system, first in the moving grips of the machine and then in the fixed grips, with a procedure similar to the one described in [3]. Maximum hydraulic pressure of the grip system was set at 14MPa, with a minimum of 10MPa. Initial strain during the mounting procedure did not exceed 500µε for any coupon. However, some bending strains were exhibited, which are an indication of an initially slightly curved surface of the coupons, as already discussed for coupons tested under static loading [4]. After the gripping of the coupon on the test machine by load control, any initial pre-stress due to clamping of the specimen was minimized at a ramp rate of 0.2kN/sec. The initial conditions (strain gauge and displacement readings) for each test were taken after this minimization of pre-stresses. Fatigue tests were performed under load control, with test frequency ranging from 0.9 to 4.5Hz, depending on the stress (strain) level. Strain was recorded using two single strain gauge attached on the central area of the coupons, one on each face. Moreover, a PT100 temperature sensor was attached near the tab of the lower grip to monitor any significant temperature rise in a number of coupons. During the whole test, applied force, actuator's displacement, as well as strain measurements by the strain gauges were continuously monitored with a sampling frequency of 16Hz, while the environmental conditions (room temperature, relative humidity and atmospheric pressure), as well as the temperature from the PT100 were monitored at 1Hz. Fig. 2 presents a picture of the coupon testing set-up. It should be noted, however that strain gauge readings were lost early during the fatigue experiments, due to failure of the strain gauges attached on each specimen. Problems with temperature measurements with PT100 sensors, which were detached from the specimen probably due to failure of the glue after some cycles, were also observed. Therefore, since by the procedure followed one could not assure that the PT100 sensors would remain attached on the specimens for the whole duration of the fatigue test, thus measuring the exhibited temperature rise, it was decided to lower the testing frequency and skip the temperature measurements. Testing frequencies were reported in [3] and these were used as reference. Moreover, the effectiveness of the use of PT100 sensors for the specimen internal temperature increase measurement due to fatigue loading was questioned in [5], along with the method of forced cooling of the specimen by a fan during testing. Since at the time of testing air temperature inside the laboratory was above 30ºC it was decided that the lower testing frequencies were necessary in order to produce results comparable to the other laboratories within the OPTIMAT BLADES project. Apart for the initial stiffness of each specimen, stiffness was derived as the slope of the curve of the actuator displacement versus the applied load, measured from the machine load cell during the whole test. At the beginning of each fatigue test 2 slow cycles were applied with the same amplitude and mean value for the load as for the rest of the experiment, but at a frequency of 0.02Hz for the measurement of the initial stiffness. After these 2 cycles the test continued immediately with the selected test frequency according to the applied stress level. In order to monitor the stiffness change during the test the slow fatigue cycles were repeated after a predefined number of cycles, e.g. every 10,000 cycles for tests targeting more than 100,000 cycles.
OB_TG1_R008_rev.0
OPTIMAT BLADES Page 9 of 18 Last saved 28/11/2003 1:17 PM
Stress was calculated by dividing force with measured cross sectional area. Two stress-strain curves were derived for each specimen using the two strain gauges on the specimen. Three different moduli of elasticity were calculated using linear regression procedure applied on the part of stress-strain curve corresponding to a strain range between 500µε and 2500µε, as described in ISO 527-1 [7] and ISO 14126 [9] for tests in tension and compression, respectively (using strain gauge readings and the mean value of the strain gauge readings). The linearity of stress-strain curves is checked by use of the coefficient of determination, R2.
Fig. 2 Setup of the coupon tests
Bending strains during testing were also monitored in the beginning of the fatigue test by use of the back to back strain gauge readings. For tests in compression according to ISO 14126 [9] bending is acceptable if the difference between strains recorded on each face of the specimen throughout the duration of the tests until failure is such that:
%10100*ab
ab ≤ε+ε
ε−ε (1)
where εa and εb are the strains along the length of the specimen on each face. For tests in tension for the UD coupons according to [6] bending strains with respect to the thickness and the width of the specimen should not exceed 3% of the axial strain, when

OB_TG1_R008_rev.0
OPTIMAT BLADES Page 10 of 18 Last saved 28/11/2003 1:17 PM
measured at the mid span of the elasticity modulus calculation range. However, for the experiments conducted, the bending strains were only measured with respect to the thickness of the coupon. Therefore, the condition that must be satisfied is:
%3100*ab
ab ≤ε+ε
ε−ε (2)
while the measurement was taken when the axial strain was about 1500µε.

OB_TG1_R008_rev.0
OPTIMAT BLADES Page 11 of 18 Last saved 28/11/2003 1:17 PM
5. RESULTS
5.1. Fatigue tests at R=-1 In total 10 fatigue tests have been performed at R=-1. Most coupons failed at their end tab, in tension, while part of the coupon between the tabs was torn out from the grip. A characteristic picture of a coupon after failure is shown in Fig. 3.
Fig. 3 Coupon GEV206-R0300-0273 after failure
Measurements were focused on the displacement and strain exhibited by the specimen during the fatigue loading at constant force (stress) amplitude and mean value. In Table 3 fatigue test data are collectively shown. Maximum stress value refers to the absolute maximum value of the stress recorded during the initial slow cycles. The corresponding strain recorded as the average of the two back-to-back strain gauges is given in the 4th column of the table. The bending as a percentage of the axial strain exhibited on the table corresponds to the bending recorded at the minimum load during the two initial slow cycles. Therefore, it can be seen that at least during the initial testing face no coupons exceeds the 10% bending limit set during the compression phase.

OB_TG1_R008_rev.0
OPTIMAT BLADES Page 12 of 18 Last saved 28/11/2003 1:17 PM
Table 3 Summary of fatigue tests conducted at R=-1
Specimen # Load (kN)
Max. Stress (MPa)
Initial Max. Strain (µε)
Frequency (Hz)
Bending (%)
Cycles to failure
GEV206-R0300-0265 ±20.00 221.0 5569 2.25 6.600 433,521 GEV206-R0300-0266 ±17.00 185.1 4658 4.32 5.148 1,502,047 GEV206-R0300-0267 ±20.00 220.5 5513 2.25 7.502 479,546 GEV206-R0300-0268 ±28.00 309.8 7731 0.90 4.895 41,581 GEV206-R0300-0270 ±17.00 184.7 4783 3.00 2.032 1,063,405 GEV206-R0300-0271 ±20.00 219.0 5668 2.25 0.118 422,882 GEV206-R0300-0272 ±17.00 185.5 4763 3.00 2.513 1,307,035 GEV206-R0300-0273 ±25.00 270.7 6995 1.20 0.273 62,149 GEV206-R0300-0274 ±25.00 276.8 7005 1.20 1.410 76,709 GEV206-R0300-0078 ±25.00 268.2 7065 1.00 0.901 63,605
In Table 4 the experimentally derived values for the modulus of elasticity are presented, determined by each strain gauge separately and by averaging the two strain gauge readings, as described in Section 4. Fig. 4 presents the stress-strain response during the initial two loading cycles, part of which was also used according to ISO 527-5 [6] in tension and ISO 14126 [9] in compression for the derivation of elasticity modulus, as an example for two specimens with strain measured as the average of the two strain gauge readings on each coupon. The difference of the elasticity modulus determined by the two back-to-back coupons on each specimen seems to have a positive relationship to the bending strains observed during testing. The advantage of using the back to back configuration, apart from reassuring that no bending strains are imposed on the coupons, at least during the early stages of the experiments, is that the elasticity modulus can be determined giving a lesser coefficient of variation. In other words, the uncertainties involved in the elasticity modulus measurement are reduced by use of the two strain gauges. The coefficient of determination, R2, is shown on the table only for the linear estimation of the E-modulus from the average strain for reference purposes. The mean value and the coefficient of variation (COV) for the measured and estimated properties are also shown in this table.

OB_TG1_R008_rev.0
OPTIMAT BLADES Page 13 of 18 Last saved 28/11/2003 1:17 PM
-250
-200
-150
-100
-50
0
50
100
150
200
250
-6000 -4000 -2000 0 2000 4000 6000
Strain (microstrain)
Stre
ss (M
Pa)
GEV206-R0300-0272GEV206-R0300-0267
Fig. 4 Example of stress-strain curves during the initial slow cycles for two coupons
Table 4 Experimentally derived values of modulus of elasticity
Specimen # E-modulus Tension (GPa) E-modulus Compression (GPa)
E-1 E-2 E-ave R2 E-1 E-2 E-ave R2
GEV206-R0300-0265 38.85 40.82 39.91 0.9999 37.72 41.98 39.67 0.9991 GEV206-R0300-0266 41.26 37.95 39.59 0.9998 41.60 37.82 39.62 0.9999 GEV206-R0300-0267 42.06 38.85 40.24 0.9998 43.06 38.23 40.29 0.9995 GEV206-R0300-0268 39.08 41.64 40.42 0.9996 38.72 41.76 40.27 0.9999 GEV206-R0300-0270 38.66 39.69 39.23 0.9998 38.59 40.18 39.20 0.9998 GEV206-R0300-0271 38.64 39.45 38.93 0.9993 38.49 39.05 38.67 0.9979 GEV206-R0300-0272 39.17 38.97 38.82 0.9997 38.74 38.74 38.73 0.9999 GEV206-R0300-0273 39.20 39.01 39.25 0.9991 39.50 39.26 39.27 0.9969 GEV206-R0300-0274 40.18 39.44 39.99 0.9996 40.31 39.78 39.91 0.9970 GEV206-R0300-0078 38.31 38.67 38.64 0.9985 38.65 38.88 38.70 0.9974
Mean value 39.54 39.45 39.49 39.54 39.57 39.42 COV (%) 3.13 2.72 1.53 4.19 3.52 1.54
Fig. 5 presents the bending strain exhibited by coupon GEV206-R0300-0267 during the compression part of the first slow cycle. It is clearly seen that the smaller the applied stress the larger the bending strain exhibited. It should be noted that the largest bending strains recorded during the fatigue testing campaign were for this coupon.

OB_TG1_R008_rev.0
OPTIMAT BLADES Page 14 of 18 Last saved 28/11/2003 1:17 PM
-50
0
50
100
150
200
250
300
350
400
450
-250 -200 -150 -100 -50 0 50
Stress (MPa)
Bend
ing
Stra
in (m
icro
stra
in)
Fig. 5 Bending strain during the initial cycle (compression part) for coupon GEV206-R0300-0267
Since the strain gauges failed during the early stages of the fatigue test, stiffness was also calculated as the slope of the force versus displacement response during the slow cycles. This enables the monitoring of stiffness reduction during the fatigue test. Results for the stiffness reduction during the fatigue test are given for all tests in Fig. 6, while it should be noted that stiffness reduction is expressed relative to the initial stiffness value, i.e. starting from an initial level of 100% at the initial cycling. .

OB_TG1_R008_rev.0
OPTIMAT BLADES Page 15 of 18 Last saved 28/11/2003 1:17 PM
-60
-50
-40
-30
-20
-10
01.0E+00 1.0E+01 1.0E+02 1.0E+03 1.0E+04 1.0E+05 1.0E+06 1.0E+07
Number of cycles
Stiff
ness
deg
rada
tion
(%)
GEV206-R0300-0274GEV206-R0300-0273GEV206-R0300-0078GEV206-R0300-0272GEV206-R0300-0270GEV206-R0300-0271GEV206-R0300-0265GEV206-R0300-0267GEV206-R0300-0266GEV206-R0300-0268
Fig. 6 Stiffness reduction with respect to number of fatigue cycles

OB_TG1_R008_rev.0
OPTIMAT BLADES Page 16 of 18 Last saved 28/11/2003 1:17 PM
6. CONCLUSIONS
Results of fatigue coupon tests with respect to their initial stiffness (elasticity modulus measurements) were found in good agreement with the static test results reported in [4], giving in tension a mean value of 39.5 GPa and in compression 39.4 GPa with a coefficient of variation of 1.5% for both tension and compression results. Fatigue results of UD coupon tests are plotted in strain versus number of cycles to failure (εN)- graphs in Fig. 7 for R=-1 tests, while the respective stress versus number of cycles to failure (SN)-graph is shown in Fig. 8. It should be noted, that the experiments were conducted at constant force (stress), thus, the strain range presented in Fig. 7 is the initial one. Furthermore, the stress range shown in Fig. 8 is derived by dividing the applied force range by the section area, as calculated by measurements of the initial thickness and width of each specimen. The logarithmic regression fit of maximum strain versus number of cycles to failure (εN) curve is given by:
( ) 16089Nln98.807a +−=ε
where aε denotes the initial maximum exhibited strain measured in microstrain and N the number of cycles to failure, while the corresponding coefficient of determination, R2, is 0.9902. The corresponding logarithmic regression fit of maximum stress versus number of cycles to failure is given by:
( ) 2.628Nln481.31a +−=σ
where aσ denotes the maximum stress measured in MPa. The corresponding coefficient of determination, R2, is equal to 0.9662.
y = -807.98Ln(x) + 16089R2 = 0.9902
2000
3000
4000
5000
6000
7000
8000
9000
10,000 100,000 1,000,000 10,000,000Number of cycles to failure
εa (m
icro
stra
in)
Exp. DataLog. (Exp. Data)
Fig. 7 Initial maximum strain versus cycles to failure

OB_TG1_R008_rev.0
OPTIMAT BLADES Page 17 of 18 Last saved 28/11/2003 1:17 PM
y = -31.481Ln(x) + 628.2R2 = 0.9662
100
150
200
250
300
350
10,000 100,000 1,000,000 10,000,000Number of cycles to failure
σa (M
Pa)
Exp. DataLog. (Exp. Data)
Fig. 8 Maximum stress versus cycles to failure
When comparing the obtained fatigue results for the UD coupons at R=-1 with results from other testing institutes within the OPTIMAT BLADES project, e.g. results from University of Patras [3], it is seen that the S-N curve is higher. This is probably the result of testing under different testing frequency, as for the current fatigue tests lower frequencies have been used than the ones reported in [3]. The important effect of testing frequency has been already discussed within the framework of the OPTIMAT BLADES project, with the aim of both producing reliable fatigue results and optimizing time needed for conducting the tests of the composite material coupons. The last recommendations for testing speeds were outlined in [3], however, each testing institute had to combine the recommendations with the available testing facility environment, so that the temperature of each fatigued coupons should not exceed 35ºC. Therefore, it was decided that at CRES lower testing frequencies than those recommended should be used.
OB_TG1_R008_rev.0
OPTIMAT BLADES Page 18 of 18 Last saved 28/11/2003 1:17 PM
7. REFERENCES
[1] O. Krause, Test plan report of TG1; Describing material, laminates and tests, OPTIMAT BLADES, ENK6-CT2001-00552, OB_TG1_R001, Rev.0, 2003
[2] T. K. Jacobsen, Reference material (OPTIMAT); Glass-epoxy material, OPTIMAT BLADES ENK6-CT2001-00552, OB-SCR001, 2002
[3] T. P. Philippidis, A. P. Vassilopoulos, T. T. Assimakopoulou, V. Passipoularidis, Static and Fatigue tests of OPTIMAT UD coupons; Benchmark Tests, OPTIMAT BLADES, ENK6-CT2001-00552, OB_TG2_R012, Rev.0, 2003
[4] D. J. Lekou, Test results of benchmark static tests on UD and MD coupons, OPTIMAT BLADES, ENK6-CT2001-00552, OB_TG1_R007, Rev.0, 2003
[5] A. G. Dutton, M. J. Blanch, S-N curve specification and temperature (including a note on temperature heating effects during fatigue of composite materials), OPTIMAT BLADES, ENK6-CT2001-00552, OB_TG5_N001, rev.0, 2003
[6] BS EN ISO 527-5: 1997, Plastics Determination of tensile properties, Part 5: Test conditions for unidirectional fibre-reinforced plastic composites.
[7] BS EN ISO 527-1: 1996, Plastics Determination of tensile properties, Part 1: General principles
[8] ASTM D 3039M-93, Standard Test Method for Tensile Properties of Polymer Matrix Composite Materials
[9] ISO 14126: 1999, Fibre-reinforce plastic composites Determination of compressive properties in the in-plane direction