test results of benchmark static and fatigue tests on ud ... · residual strength tests on standard...
TRANSCRIPT

RESIDUAL STRENGTH TESTS ON
STANDARD OB SPECIMENS
OB_TG5_R0?? rev. 000
Confidential
D. J. Lekou K. Rossis
OPTIMAT BLADES
TG 5

OB_TG5_R0??_rev.0
2 of 24 Last saved 3/7/2006 16:09
OPTIMAT BLADES Page
Change record
Issue/revision date pages Summary of changes
draft 20.06.2006 Na new document

OB_TG5_R0??_rev.0
3 of 24 Last saved 3/7/2006 16:09
OPTIMAT BLADES Page
Table of Contents
1. INTRODUCTION.............................................................................................................................. 4 2. EQUIPMENT ..................................................................................................................................... 5 3. COUPON DIMENSIONS AND PREPARATION .......................................................................... 6 4. TESTING PROCEDURES.............................................................................................................. 10
4.1. TEST PROCEDURE FOR RESIDUAL STRENGTH TESTS OF COUPONS TYPE GEV213-R0390 .......... 10 4.2. TEST PROCEDURE FOR RESIDUAL STRENGTH TESTS OF COUPONS TYPE GEV207-R0400 .......... 11
5. RESIDUAL STRENGTH TESTS RESULTS................................................................................ 13 5.1. COUPONS GEV213-R0390 AT R=-1........................................................................................... 13 5.2. COUPONS OF TYPE GEV213-R0390 TESTED AT R=10 ............................................................... 14 5.3. COUPONS OF TYPE GEV207-R0400 TESTED AT R=10 ............................................................... 17
6. DISCUSSION OF THE RESULTS ................................................................................................ 23 7. REFERENCES ................................................................................................................................. 24

OB_TG5_R0??_rev.0
4 of 24 Last saved 3/7/2006 16:09
OPTIMAT BLADES Page
1. INTRODUCTION
The work described in this report has been co-financed by the European Commission in the framework of the project under contract no ENK6-CT2001-00552, RELIABLE OPTIMAL USE OF MATERIALS FOR WIND TURBINE ROTOR BLADES (OPTIMAT BLADES). Residual strength tests have been carried out within TG5: Residual Strength and Condition Assessment, in order to be investigate the material degradation of the standard OB specimen after constant amplitude loading. In this report a detailed description of the residual strength testing conducted at CRES within the framework of the OPTIMAT BLADES project is presented. The experiments on Glass/Epoxy coupons outlined in this document, were carried out in the period August 2005 – April 2006. Coupons were to be fatigued at the 3 stress levels determined in [2] and at 3 life fractions, i.e. 20/50/80% [3], [4]. One half of each group would be tested for residual tensile strength and the other for residual compressive strength.

OB_TG5_R0??_rev.0
5 of 24 Last saved 3/7/2006 16:09
OPTIMAT BLADES Page
2. EQUIPMENT
During testing the following equipment has been used:
• MTS ±250 kN coupon testing machine including:
o Load cell of ±100kN range, with an accuracy of at least 0.2% full scale for the tests of coupons of type GEV207-R0400
o Load cell of ±50kN range, with an accuracy of at least 0.2% full scale for the tests of coupons of type GEV213-R0390
o LVDT of ±75mm range, with accuracy of at least 0.2% full scale
o Hydraulic grip supply with pressure adjusted to 14MPa.
• HBM Strain gauges of nominal electric resistance 350Ω, with a gauge length of 6mm connected each through HBM ME30 amplifiers with an output range of ±10V with HBM amplifier system MGA. Specifically following type of strain gauge has been used:
o Single strain gauges HBM 6/350 LY41, with amplifier adjusted to 2000 με/V for axial strain measurements.
• A 64 channel Data Acquisition System with a 16Bits A/D conversion card.
• A Vaisala Temperature and Humidity sensor type HMP131Y
All abovementioned equipment is calibrated according to the laboratory procedures and certificates of traceable to NIST calibration data are kept at CRES facilities. Line calibration has been performed on all incoming signals to the data acquisition system used during testing. In particular strain gauge line calibration has been performed using Instrument Division Measurement Group Inc strain gauge simulator type 1550Α.
OB_TG5_R0??_rev.0
6 of 24 Last saved 3/7/2006 16:09
OPTIMAT BLADES Page
3. COUPON DIMENSIONS AND PREPARATION
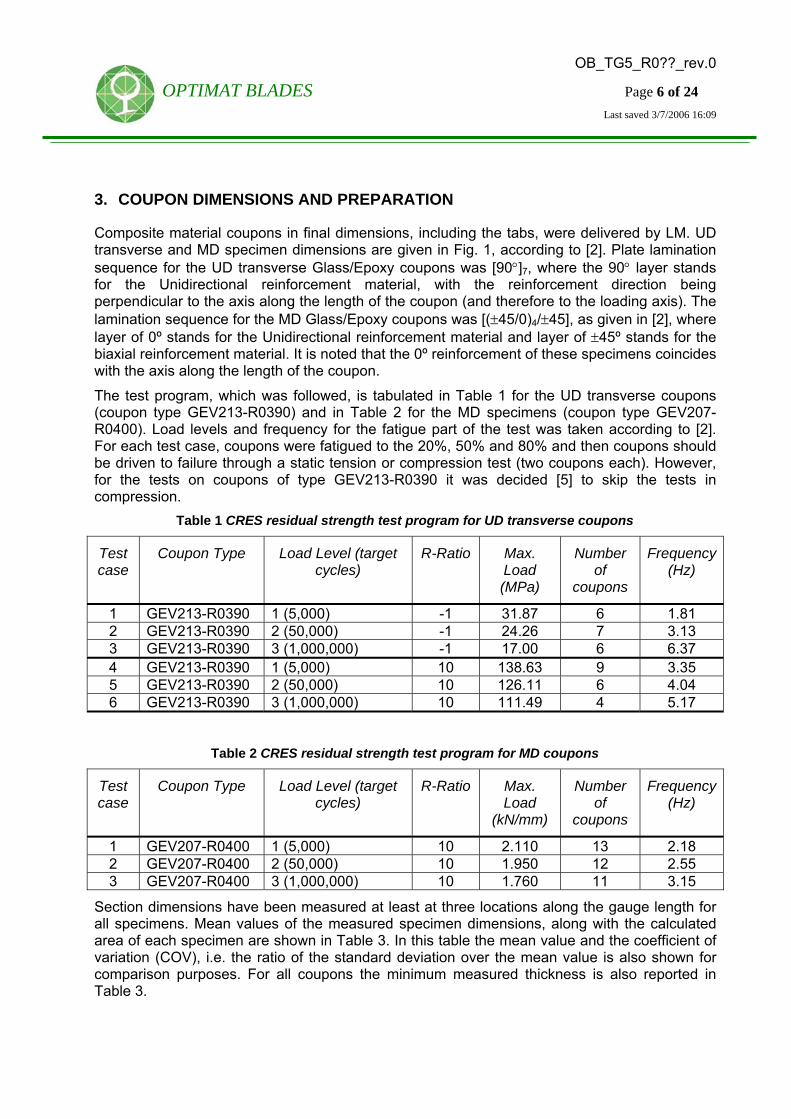
Composite material coupons in final dimensions, including the tabs, were delivered by LM. UD transverse and MD specimen dimensions are given in Fig. 1, according to [2]. Plate lamination sequence for the UD transverse Glass/Epoxy coupons was [90°]7, where the 90° layer stands for the Unidirectional reinforcement material, with the reinforcement direction being perpendicular to the axis along the length of the coupon (and therefore to the loading axis). The lamination sequence for the MD Glass/Epoxy coupons was [(±45/0)4/±45], as given in [2], where layer of 0º stands for the Unidirectional reinforcement material and layer of ±45º stands for the biaxial reinforcement material. It is noted that the 0º reinforcement of these specimens coincides with the axis along the length of the coupon.
The test program, which was followed, is tabulated in Table 1 for the UD transverse coupons (coupon type GEV213-R0390) and in Table 2 for the MD specimens (coupon type GEV207-R0400). Load levels and frequency for the fatigue part of the test was taken according to [2]. For each test case, coupons were fatigued to the 20%, 50% and 80% and then coupons should be driven to failure through a static tension or compression test (two coupons each). However, for the tests on coupons of type GEV213-R0390 it was decided [5] to skip the tests in compression.
Table 1 CRES residual strength test program for UD transverse coupons
Test case
Coupon Type Load Level (target cycles)
R-Ratio Max. Load (MPa)
Number of
coupons
Frequency (Hz)
1 GEV213-R0390 1 (5,000) -1 31.87 6 1.81 2 GEV213-R0390 2 (50,000) -1 24.26 7 3.13 3 GEV213-R0390 3 (1,000,000) -1 17.00 6 6.37 4 GEV213-R0390 1 (5,000) 10 138.63 9 3.35 5 GEV213-R0390 2 (50,000) 10 126.11 6 4.04 6 GEV213-R0390 3 (1,000,000) 10 111.49 4 5.17
Table 2 CRES residual strength test program for MD coupons
Test case
Coupon Type Load Level (target cycles)
R-Ratio Max. Load
(kN/mm)
Number of
coupons
Frequency (Hz)
1 GEV207-R0400 1 (5,000) 10 2.110 13 2.18 2 GEV207-R0400 2 (50,000) 10 1.950 12 2.55 3 GEV207-R0400 3 (1,000,000) 10 1.760 11 3.15
Section dimensions have been measured at least at three locations along the gauge length for all specimens. Mean values of the measured specimen dimensions, along with the calculated area of each specimen are shown in Table 3. In this table the mean value and the coefficient of variation (COV), i.e. the ratio of the standard deviation over the mean value is also shown for comparison purposes. For all coupons the minimum measured thickness is also reported in Table 3.

OB_TG5_R0??_rev.0
7 of 24 Last saved 3/7/2006 16:09
OPTIMAT BLADES Page
Strain gauges were attached on some specimens to calibrate the findings of measuring stiffness before and after the load cycles by use of the LVDT. It should be noted that the use of the LVDT was mandatory, due to the fact that the strain gauges do not survive the fatigue cycles and in order to attach new strain gauges to measure the stiffness before the final static test to failure the coupon has to be removed from the machine and then re-positioned. This however, means that small differences in the stiffness measurement due to the renewed positioning of the specimen might affect the stiffness degradation results. Two strain gauges on a back to back configuration were used measuring strain in the load direction. The two strain gauges were used to reassure that no bending strains would arise during the clamping and/or loading of the specimen on the testing machine. Coupons having strain gauges are marked with an asterisk in Table 3.
2 6.57 (6.16)
150 (145) 55 55 40 (35)
25
Fig. 1 Coupon dimensions for the MD and UD transverse specimens (number in parenthesis refer
to the UD transverse specimens)
For the attachment of each strain gauge on the specimen proper procedures following strain gauge manufacturer directions have been followed. According to these procedures the surface of the specimens where the strain gauges were attached was slightly roughened with sand paper. Specimen thickness was measured immediately after this procedure. Strain gauges were then attached using HBM type X60 adhesive.

OB_TG5_R0??_rev.0
8 of 24 Last saved 3/7/2006 16:09
OPTIMAT BLADES Page
Table 3 Specimen dimensions
Thickness (mm) R-Ratio Specimen No
Average Minimum Width (mm) Area (mm2)
GEV213-R0390-0429 6.05 6.03 24.99 151.19GEV213-R0390-0430 6.17 6.13 25.16 155.15GEV213-R0390-0431 6.07 6.03 25.08 152.32GEV213-R0390-0432 6.00 5.93 25.11 150.56GEV213-R0390-0434 6.13 6.09 25.10 153.93GEV213-R0390-0436 6.14 6.12 25.08 153.99GEV213-R0390-0437 6.15 6.13 25.36 155.88GEV213-R0390-0438 6.16 6.12 25.28 155.64GEV213-R0390-0439 6.09 6.03 25.34 154.34GEV213-R0390-0440 6.07 6.06 25.30 153.55GEV213-R0390-0441 6.27 6.23 25.44 159.49GEV213-R0390-0442 6.16 6.14 25.29 155.77GEV213-R0390-0443 6.10 6.09 25.14 153.44GEV213-R0390-0444 6.03 5.98 25.34 152.70GEV213-R0390-0445 6.11 6.09 25.28 154.40GEV213-R0390-0446 6.19 6.17 25.35 156.94GEV213-R0390-0447 6.07 6.03 25.16 152.54GEV213-R0390-0448 6.17 6.15 25.31 156.23
R =
-1
GEV213-R0390-0450 6.07 6.04 25.34 153.73 Mean Value 6.12 6.08 25.23 154.30 COV (%) 1.06 1.17 0.50 1.37
GEV213-R0390-0411 5.95 5.94 25.14 149.70GEV213-R0390-0412 6.10 6.08 24.98 152.44GEV213-R0390-0413 6.15 6.06 25.13 154.60GEV213-R0390-0414* 6.16 6.14 25.20 155.18GEV213-R0390-0415* 6.14 6.04 25.15 154.50GEV213-R0390-0416* 6.15 6.06 25.13 154.60GEV213-R0390-0417* 6.12 6.04 25.15 153.89GEV213-R0390-0418* 5.98 5.94 25.13 150.25GEV213-R0390-0419* 6.04 6.00 25.21 152.37GEV213-R0390-0420* 6.06 6.04 25.10 152.17GEV213-R0390-0421* 5.94 5.89 25.16 149.57GEV213-R0390-0422 6.05 5.98 25.02 151.35GEV213-R0390-0423 6.10 6.05 25.13 153.29GEV213-R0390-0424 6.15 6.14 25.13 154.45GEV213-R0390-0425 6.08 6.05 25.10 152.54GEV213-R0390-0428 6.12 6.05 24.75 151.45GEV213-R0390-0433 6.21 6.16 25.08 155.63GEV213-R0390-0435 6.09 6.06 25.02 152.30
R =
10
GEV213-R0390-0449 6.07 6.01 25.34 153.87 Mean Value 6.09 6.04 25.11 152.85 COV (%) 1.19 1.15 0.46 1.19

OB_TG5_R0??_rev.0
9 of 24 Last saved 3/7/2006 16:09
OPTIMAT BLADES Page
Table 3 (continued) Specimen dimensions
Thickness (mm) R-Ratio Specimen No Average Minimum
Width (mm) Area (mm2)
GEV207-R0400-0092* 6.79 6.73 25.19 171.10GEV207-R0400-0093* 6.79 6.64 24.93 169.25GEV207-R0400-0094 6.95 6.92 25.24 175.34GEV207-R0400-0095 6.91 6.89 25.24 174.39GEV207-R0400-0096 6.90 6.85 25.25 174.26GEV207-R0400-0353 6.87 6.86 25.24 173.33GEV207-R0400-0354 6.82 6.75 25.32 172.66GEV207-R0400-0355 6.88 6.83 25.29 174.06GEV207-R0400-0356 6.82 6.73 25.32 172.66GEV207-R0400-0357 6.81 6.72 25.29 172.17GEV207-R0400-0358 6.82 6.74 25.36 172.99GEV207-R0400-0359 6.79 6.74 25.32 171.95GEV207-R0400-0360 6.78 6.71 25.38 172.15GEV207-R0400-0361 6.78 6.75 25.39 172.17GEV207-R0400-0362 6.88 6.82 25.24 173.57GEV207-R0400-0363 6.81 6.74 25.37 172.85GEV207-R0400-0364 6.83 6.79 25.31 172.85GEV207-R0400-0365 6.82 6.79 25.22 171.91GEV207-R0400-0366 6.81 6.73 25.29 172.15GEV207-R0400-0367 6.83 6.74 25.38 173.42GEV207-R0400-0368 6.84 6.74 25.29 172.90GEV207-R0400-0369 6.77 6.72 25.36 171.70GEV207-R0400-0370 6.89 6.87 25.09 172.82GEV207-R0400-0371 6.82 6.78 25.31 172.53GEV207-R0400-0372 6.77 6.72 25.37 171.84GEV207-R0400-0373 6.82 6.75 25.36 172.89GEV207-R0400-0374 6.82 6.77 25.28 172.32GEV207-R0400-0375 6.81 6.78 25.25 171.99GEV207-R0400-0378 6.81 6.76 25.07 170.64GEV207-R0400-0379 6.76 6.72 25.39 171.70GEV207-R0400-0380 6.83 6.75 25.19 172.11GEV207-R0400-0381 6.79 6.76 25.30 171.79GEV207-R0400-0382 6.79 6.73 25.28 171.58GEV207-R0400-0383 6.76 6.68 25.40 171.73GEV207-R0400-0384 6.79 6.76 25.40 172.40GEV207-R0400-0385 6.77 6.72 25.41 171.92
R =
10
GEV207-R0400-0386 6.76 6.72 25.33 171.29 Mean Value 6.81 6.75 25.28 172.20 COV (%) 0.75 1.00 0.38 0.76

OB_TG5_R0??_rev.0
10 of 24 Last saved 3/7/2006 16:09
OPTIMAT BLADES Page
4. TESTING PROCEDURES
For all experiments conducted, coupons were aligned and mounted on the MTS 810 system, first in the moving grip of the machine and then in the fixed grip, with a procedure similar to the one described in [1]. Hydraulic pressure of the grip system was set at 14 MPa, with a minimum of 10 MPa. Load, displacement and strain (where applicable) readings were zeroed after the position of the specimen in the moving grip of the machine (upper end of coupon free).
During the whole test, applied force, actuator's displacement, as well as strain measurements by the strain gauges (where applicable) were continuously monitored with a minimum sampling frequency of 8Hz, while the environmental conditions (room temperature, relative humidity and atmospheric pressure) were monitored at 1Hz. It should be noted, however that strain gauge readings were lost early during the fatigue experiments, due to failure of the strain gauges attached on each specimen. Thus, as already pointed out, in order to avoid removing the specimen from the testing machine, the initial and final elasticity measurement was conducted through the displacement of the actuator reading. In Fig. 2 a coupon between the grips of the testing machine is shown.
The residual strength tests consisted of following steps:
1. Initial Young modulus measurement in compression
2. Initial Young modulus measurement in tension
3. Constant Amplitude fatigue test at a certain stress level and until a specific life fraction
4. Final Young modulus measurement in compression
5. Final Young modulus measurement in tension
6. Residual strength test to failure in tension or compression
4.1. Test procedure for residual strength tests of coupons type GEV213-R0390 No residual strength tests to failure in compression were performed for this case, following the decision taken during the TG5 meeting [5].
For the initial Young modulus measurement in compression, coupons were loaded until maximum –5kN and then unloaded. This load corresponds to a strain of about -2500με, as predermined using the results of elasticity from the preceding static tests [6]. Thus the initial stiffness in compression was measured in the range 500με – 2500με (–1.0kN – 5.0kN). Tests were performed in displacement control, at 1 mm/min [2]. For the initial Young modulus measurement in tension, coupons were loaded until 2kN and then unloaded. This load does not correspond to 2500με, however, since during the initial phase of the OPTIMAT BLADES project, some coupons of type GEV313-R0390 failed at rather low loads without reaching 2500με of strain, it was judged safer to load the coupons only up to this load. From the experimental results this 2kN load corresponds to 1000με. Thus the initial stiffness in tension was calculated in the range 500με to 1000με (0.7kN – 2.0kN). Tests were performed in displacement control, at 0.25 mm/min [2]. Stress was calculated by dividing force with measured cross sectional area.
In case the coupon was equipped with strain gauges, the elasticity measurement in both tension and compression was performed through the average reading of the two strain gauges attached on a back-to-back configuration on the specimen. In parallel the elasticity modulus was also calculated through the readings of the LVDT measuring the displacement of the actuator.
OB_TG5_R0??_rev.0
11 of 24 Last saved 3/7/2006 16:09
OPTIMAT BLADES Page
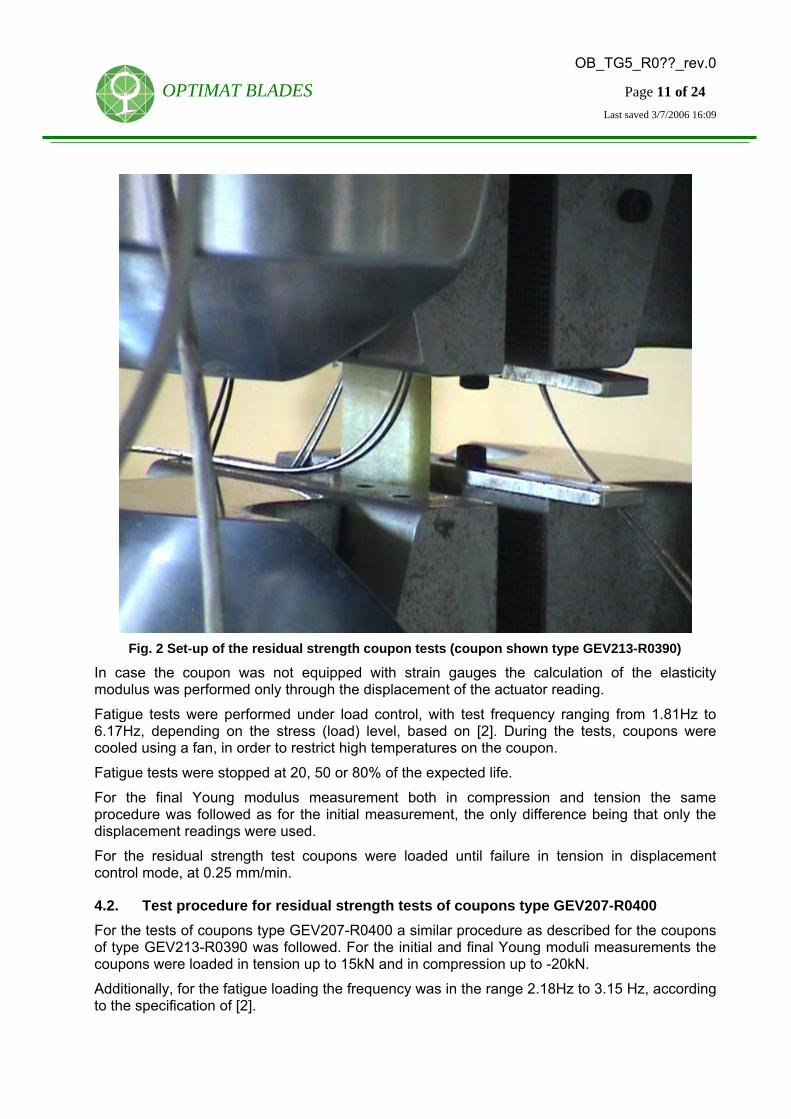
Fig. 2 Set-up of the residual strength coupon tests (coupon shown type GEV213-R0390)
In case the coupon was not equipped with strain gauges the calculation of the elasticity modulus was performed only through the displacement of the actuator reading.
Fatigue tests were performed under load control, with test frequency ranging from 1.81Hz to 6.17Hz, depending on the stress (load) level, based on [2]. During the tests, coupons were cooled using a fan, in order to restrict high temperatures on the coupon.
Fatigue tests were stopped at 20, 50 or 80% of the expected life.
For the final Young modulus measurement both in compression and tension the same procedure was followed as for the initial measurement, the only difference being that only the displacement readings were used.
For the residual strength test coupons were loaded until failure in tension in displacement control mode, at 0.25 mm/min.
4.2. Test procedure for residual strength tests of coupons type GEV207-R0400 For the tests of coupons type GEV207-R0400 a similar procedure as described for the coupons of type GEV213-R0390 was followed. For the initial and final Young moduli measurements the coupons were loaded in tension up to 15kN and in compression up to -20kN.
Additionally, for the fatigue loading the frequency was in the range 2.18Hz to 3.15 Hz, according to the specification of [2].

OB_TG5_R0??_rev.0
12 of 24 Last saved 3/7/2006 16:09
OPTIMAT BLADES Page
Moreover, residual strength tests were performed both in tension and compression. In case the coupons were loaded until failure in compression, test was applied in displacement control mode at a speed of 1mm/min.

OB_TG5_R0??_rev.0
13 of 24 Last saved 3/7/2006 16:09
OPTIMAT BLADES Page
5. RESIDUAL STRENGTH TESTS RESULTS
5.1. Coupons GEV213-R0390 at R=-1 In total 19 coupons of type GEV213-R0390 have been tested for the residual strength derivation at R=-1. 6 coupons failed prematurely during the fatigue cycles. The rest 13 coupons were successfully tested to find the residual tension strength. In Table 4 test results, regarding the residual strength are collectively shown. In Table 5 results regarding the stiffness degradation of these coupons are shown. For all coupons the stiffness was calculated using the readings of the LVDT. It should be mentioned that for the stiffness in tension the coefficient of determination of the linear fit in some cases was relative low, below 0.9.
Table 4 Summary of residual strength tests conducted on coupons type GEV213-R0390 at R=-1
Specimen # Load (kN) Stress (MPa)
Number of cycles
Stress level
Life (%)
RL (kN)
RS (MPa)
GEV213-R0390-0429 ±4.818 ±31.87 2,500 1 50 7.79 51.55GEV213-R0390-0430 ±4.944 ±31.87 1,000 1 20 8.69 56.00GEV213-R0390-0431 ±4.854 ±31.87 1,000 1 20 8.75 57.49GEV213-R0390-0432 ±4.798 ±31.87 2,500 1 50 5.11 33.94GEV213-R0390-0434 ±2.617 ±17.00 200,000 3 20 7.16 46.49GEV213-R0390-0436 ±4.907 ±31.87 4,000 1 80 5.87 38.15GEV213-R0390-0437 ±4.967 ±31.87 4,000 1 80 6.03 38.70GEV213-R0390-0438 ±3.775 ±24.26 10,000 2 20 8.20 52.69GEV213-R0390-0439 ±3.744 ±24.26 10,000 2 20 7.24 46.92GEV213-R0390-0440 ±3.725 ±24.26 20,208 2 40 PMF PMFGEV213-R0390-0441 ±3.869 ±24.26 25,000 2 50 8.23 51.63GEV213-R0390-0442 ±3.778 ±24.26 22,859 2 46 PMF PMFGEV213-R0390-0443 ±3.722 ±24.26 13,065 2 26 PMF PMFGEV213-R0390-0444 ±2.595 ±17.00 200,000 3 20 6.70 43.89GEV213-R0390-0445 ±2.624 ±17.00 500,000 3 50 5.86 37.95GEV213-R0390-0446 ±2.667 ±17.00 500,000 3 50 6.73 42.88GEV213-R0390-0447 ±2.596 ±17.00 644,478 3 64 PMF PMFGEV213-R0390-0448 ±2.655 ±17.00 623,627 3 62 PMF PMFGEV213-R0390-0450 ±3.729 ±24.26 17,597 2 35 PMF PMF

OB_TG5_R0??_rev.0
14 of 24 Last saved 3/7/2006 16:09
OPTIMAT BLADES Page
Table 5 Modulus of elasticity of coupons type GEV213-R0390 tested at R=-1
Specimen # E-modulus Tension (GPa) E-modulus Compression (GPa)
Einitial Efinal Ef/Ei Einitial Efinal Ef/Ei
GEV213-R0390-0429 12.94 11.45 0.88 15.48 14.25 0.92 GEV213-R0390-0430 11.73 14.39 1.23 14.28 14.80 1.04 GEV213-R0390-0431 10.29 12.95 1.26 15.04 15.69 1.04 GEV213-R0390-0432 11.91 9.42 0.79 15.57 13.65 0.88 GEV213-R0390-0434 12.29 11.95 0.97 14.95 14.90 1.00 GEV213-R0390-0436 14.41 9.36 0.65 14.64 13.21 0.90 GEV213-R0390-0437 11.16 9.62 0.86 15.93 13.72 0.86 GEV213-R0390-0438 14.66 11.69 0.80 15.09 15.10 1.00 GEV213-R0390-0439 12.49 11.57 0.93 14.65 14.71 1.00 GEV213-R0390-0440 12.00 - 15.07 - GEV213-R0390-0441 12.93 11.31 0.87 14.00 14.07 1.01 GEV213-R0390-0442 12.07 - 14.86 - GEV213-R0390-0443 13.19 - 15.38 - GEV213-R0390-0444 12.54 11.25 0.90 15.11 14.75 0.98 GEV213-R0390-0445 12.49 10.80 0.86 14.08 14.38 1.02 GEV213-R0390-0446 12.21 11.10 0.91 14.52 14.64 1.01 GEV213-R0390-0447 11.86 - 14.90 - GEV213-R0390-0448 10.99 - 13.96 - GEV213-R0390-0450 12.86 - 15.08 -
Mean value 12.37 14.87 COV (%) 8.49 3.63
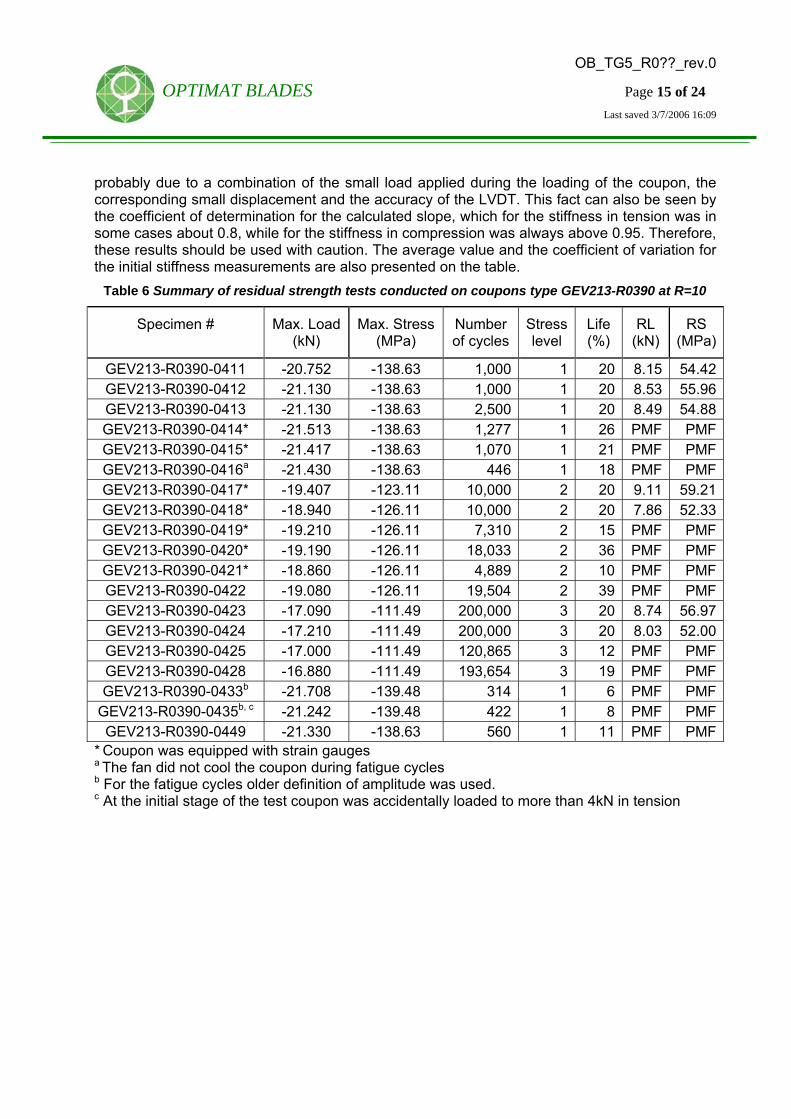
5.2. Coupons of type GEV213-R0390 tested at R=10 In total 19 tests have been performed at R=10 on coupons type GEV213-R0390. Most of the coupons failed prematurely during the fatigue cycles. Only 7 coupons were driven to failure through static testing to derive their residual strength. The results of the tests are collectively shown in Table 6. In this table coupons that were equipped with strain gauges are marked with an asterisk. During the test on coupon GEV213-R0390-416 a fan was not used, thus, the premature failure of the coupon could be due to the higher temperatures during the fatigue cycles. Moreover, for coupons GEV213-R0390-433 and GEV213-R0390-435 older definitions for the load amplitude and frequency were used of document [2]. Finally, coupon GEV213-R0390-0435 was accidentally loaded to more than 4kN during the initial static test for the stiffness measurement in tension.
For all coupons the stiffness was calculated through the reading of the displacement of the actuator in both tension and compression. These results are collectively shown in Table 7. On this table also the results from the measurements of the initial stiffness using the strain gauges are shown. From the results of the strain gauges two coupons, namely GEV213-R0390-0418 and GEV213-R0390-0421, exhibited relative high bending strains, with bending at the minimum load during the initial fatigue cycles exceeding 10%. These coupons are marked with superscript a on the table. What should be noted is the difference for the initial measurement of the stiffness in tension by the LVDT from that obtained with the strain gauges. This result is
OB_TG5_R0??_rev.0
15 of 24 Last saved 3/7/2006 16:09
OPTIMAT BLADES Page
probably due to a combination of the small load applied during the loading of the coupon, the corresponding small displacement and the accuracy of the LVDT. This fact can also be seen by the coefficient of determination for the calculated slope, which for the stiffness in tension was in some cases about 0.8, while for the stiffness in compression was always above 0.95. Therefore, these results should be used with caution. The average value and the coefficient of variation for the initial stiffness measurements are also presented on the table.
Table 6 Summary of residual strength tests conducted on coupons type GEV213-R0390 at R=10
Specimen # Max. Load (kN)
Max. Stress (MPa)
Number of cycles
Stress level
Life (%)
RL (kN)
RS (MPa)
GEV213-R0390-0411 -20.752 -138.63 1,000 1 20 8.15 54.42GEV213-R0390-0412 -21.130 -138.63 1,000 1 20 8.53 55.96GEV213-R0390-0413 -21.130 -138.63 2,500 1 20 8.49 54.88GEV213-R0390-0414* -21.513 -138.63 1,277 1 26 PMF PMFGEV213-R0390-0415* -21.417 -138.63 1,070 1 21 PMF PMFGEV213-R0390-0416a -21.430 -138.63 446 1 18 PMF PMFGEV213-R0390-0417* -19.407 -123.11 10,000 2 20 9.11 59.21GEV213-R0390-0418* -18.940 -126.11 10,000 2 20 7.86 52.33GEV213-R0390-0419* -19.210 -126.11 7,310 2 15 PMF PMFGEV213-R0390-0420* -19.190 -126.11 18,033 2 36 PMF PMFGEV213-R0390-0421* -18.860 -126.11 4,889 2 10 PMF PMFGEV213-R0390-0422 -19.080 -126.11 19,504 2 39 PMF PMFGEV213-R0390-0423 -17.090 -111.49 200,000 3 20 8.74 56.97GEV213-R0390-0424 -17.210 -111.49 200,000 3 20 8.03 52.00GEV213-R0390-0425 -17.000 -111.49 120,865 3 12 PMF PMFGEV213-R0390-0428 -16.880 -111.49 193,654 3 19 PMF PMFGEV213-R0390-0433b -21.708 -139.48 314 1 6 PMF PMF
GEV213-R0390-0435b, c -21.242 -139.48 422 1 8 PMF PMFGEV213-R0390-0449 -21.330 -138.63 560 1 11 PMF PMF
* Coupon was equipped with strain gauges
a The fan did not cool the coupon during fatigue cycles b For the fatigue cycles older definition of amplitude was used. c At the initial stage of the test coupon was accidentally loaded to more than 4kN in tension

OB_TG5_R0??_rev.0
16 of 24 Last saved 3/7/2006 16:09
OPTIMAT BLADES Page
Table 7 Modulus of elasticity of coupons type GEV213-R0390 tested at R=10
Specimen # E-modulus Tension (GPa) E-modulus Compression (GPa)
Einitial Efinal Es.g Einitial Efinal Es.g.
GEV213-R0390-0411 13.38 13.63 15.85 15.49 GEV213-R0390-0412 13.27 12.33 15.56 14.35 GEV213-R0390-0413 11.82 10.52 14.47 14.99 GEV213-R0390-0414* 13.20 - 14.92 14.30 - 15.04 GEV213-R0390-0415* 13.29 - 15.17 14.41 - 15.75 GEV213-R0390-0416 13.73 - 14.87 - GEV213-R0390-0417* 12.01 10.27 15.28 14.90 14.86 15.52 GEV213-R0390-0418*a 15.14 13.49 15.78 15.64 15.80 15.90 GEV213-R0390-0419* 12.19 - 14.61 14.61 - 15.11 GEV213-R0390-0420* 12.13 - 15.02 14.98 - 15.22 GEV213-R0390-0421*a 14.14 - 15.49 15.97 - 15.63 GEV213-R0390-0422 13.63 - 15.85 - GEV213-R0390-0423 12.73 11.93 15.12 15.18 GEV213-R0390-0424 11.80 11.45 15.41 14.26 GEV213-R0390-0425 11.02 - 14.61 - GEV213-R0390-0428 14.98 - 14.78 - GEV213-R0390-0433 13.23 - 14.39 - GEV213-R0390-0435 11.97 - 14.55 - GEV213-R0390-0449 12.87 - 15.54 -
Mean value 12.98 15.18 15.04 15.45COV (%) 8.41 2.53 3.72 2.16
* Coupon equipped with strain gauges a Bending during compression above 10%

OB_TG5_R0??_rev.0
17 of 24 Last saved 3/7/2006 16:09
OPTIMAT BLADES Page
Fig. 3 Example of coupon type GEV213-R0390 right after failure, still on the testing machine
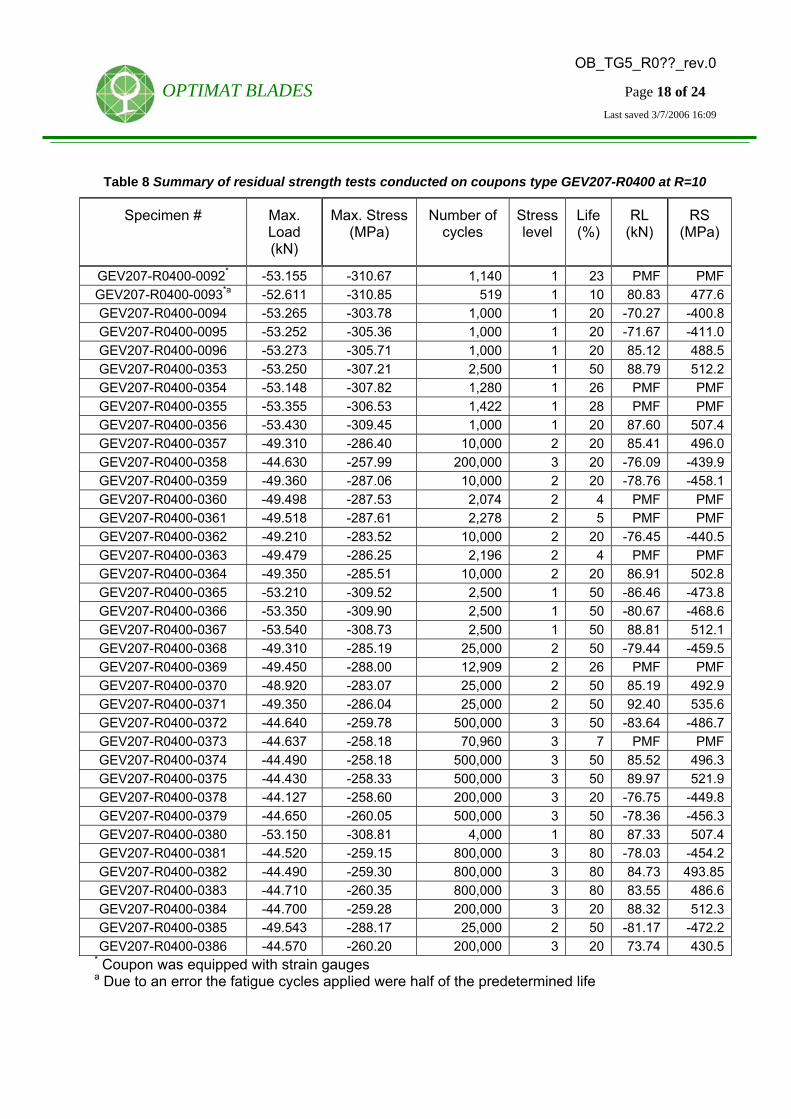
5.3. Coupons of type GEV207-R0400 tested at R=10 In this section results are presented of the tests conducted on coupons of type GEV207-R0400. In total 36 specimens were tested. In Table 8 the residual strength tests conducted are collectively shown. 8 coupons failed during the fatigue cycling. From the rest 16 coupons were tested for the derivation of the residual strength in tension and 12 were tested to final failure in compression. Except for two coupons the initial and final Young modulus in tension and compression was measured using the reading of the displacement of the actuator. The results of these measurements are collectively shown in Table 9. For the two coupons, which were equipped with strain gauges additionally to the measurement using the LVDT, the initial elasticity modulus in both tension and compression was calculated using the results of the strain gauges.
OB_TG5_R0??_rev.0
18 of 24 Last saved 3/7/2006 16:09
OPTIMAT BLADES Page
Table 8 Summary of residual strength tests conducted on coupons type GEV207-R0400 at R=10
Specimen # Max. Load (kN)
Max. Stress (MPa)
Number of cycles
Stress level
Life (%)
RL (kN)
RS (MPa)
GEV207-R0400-0092* -53.155 -310.67 1,140 1 23 PMF PMFGEV207-R0400-0093*a -52.611 -310.85 519 1 10 80.83 477.6GEV207-R0400-0094 -53.265 -303.78 1,000 1 20 -70.27 -400.8GEV207-R0400-0095 -53.252 -305.36 1,000 1 20 -71.67 -411.0GEV207-R0400-0096 -53.273 -305.71 1,000 1 20 85.12 488.5GEV207-R0400-0353 -53.250 -307.21 2,500 1 50 88.79 512.2GEV207-R0400-0354 -53.148 -307.82 1,280 1 26 PMF PMFGEV207-R0400-0355 -53.355 -306.53 1,422 1 28 PMF PMFGEV207-R0400-0356 -53.430 -309.45 1,000 1 20 87.60 507.4GEV207-R0400-0357 -49.310 -286.40 10,000 2 20 85.41 496.0GEV207-R0400-0358 -44.630 -257.99 200,000 3 20 -76.09 -439.9GEV207-R0400-0359 -49.360 -287.06 10,000 2 20 -78.76 -458.1GEV207-R0400-0360 -49.498 -287.53 2,074 2 4 PMF PMFGEV207-R0400-0361 -49.518 -287.61 2,278 2 5 PMF PMFGEV207-R0400-0362 -49.210 -283.52 10,000 2 20 -76.45 -440.5GEV207-R0400-0363 -49.479 -286.25 2,196 2 4 PMF PMFGEV207-R0400-0364 -49.350 -285.51 10,000 2 20 86.91 502.8GEV207-R0400-0365 -53.210 -309.52 2,500 1 50 -86.46 -473.8GEV207-R0400-0366 -53.350 -309.90 2,500 1 50 -80.67 -468.6GEV207-R0400-0367 -53.540 -308.73 2,500 1 50 88.81 512.1GEV207-R0400-0368 -49.310 -285.19 25,000 2 50 -79.44 -459.5GEV207-R0400-0369 -49.450 -288.00 12,909 2 26 PMF PMFGEV207-R0400-0370 -48.920 -283.07 25,000 2 50 85.19 492.9GEV207-R0400-0371 -49.350 -286.04 25,000 2 50 92.40 535.6GEV207-R0400-0372 -44.640 -259.78 500,000 3 50 -83.64 -486.7GEV207-R0400-0373 -44.637 -258.18 70,960 3 7 PMF PMFGEV207-R0400-0374 -44.490 -258.18 500,000 3 50 85.52 496.3GEV207-R0400-0375 -44.430 -258.33 500,000 3 50 89.97 521.9GEV207-R0400-0378 -44.127 -258.60 200,000 3 20 -76.75 -449.8GEV207-R0400-0379 -44.650 -260.05 500,000 3 50 -78.36 -456.3GEV207-R0400-0380 -53.150 -308.81 4,000 1 80 87.33 507.4GEV207-R0400-0381 -44.520 -259.15 800,000 3 80 -78.03 -454.2GEV207-R0400-0382 -44.490 -259.30 800,000 3 80 84.73 493.85GEV207-R0400-0383 -44.710 -260.35 800,000 3 80 83.55 486.6GEV207-R0400-0384 -44.700 -259.28 200,000 3 20 88.32 512.3GEV207-R0400-0385 -49.543 -288.17 25,000 2 50 -81.17 -472.2GEV207-R0400-0386 -44.570 -260.20 200,000 3 20 73.74 430.5
* Coupon was equipped with strain gauges a Due to an error the fatigue cycles applied were half of the predetermined life

OB_TG5_R0??_rev.0
19 of 24 Last saved 3/7/2006 16:09
OPTIMAT BLADES Page
Table 9 Modulus of elasticity of coupons type GEV207-R0400 tested at R=10
Specimen # E-modulus Tension (GPa) E-modulus Compression (GPa)
Einitial Efinal Ef/Ei Es.g,
init. Einitial Efinal Ef/Ei Es.g. init.
GEV207-R0400-0092* 25.43 - 26.73 26.73 - 26.16 GEV207-R0400-0093* 26.68 21.34 0.80 26.94 27.04 24.15 0.89 26.87 GEV207-R0400-0094 27.22 20.44 0.75 27.14 23.52 0.87 GEV207-R0400-0095 26.87 20.03 0.75 25.96 24.13 0.93 GEV207-R0400-0096 27.80 20.17 0.73 26.84 24.60 0.92 GEV207-R0400-0353 27.10 18.17 0.67 26.62 27.13 1.02 GEV207-R0400-0354 27.76 - 27.80 - GEV207-R0400-0355 27.43 - 27.19 - GEV207-R0400-0356 26.61 19.05 0.72 26.77 27.89 1.04 GEV207-R0400-0357 27.41 18.57 0.68 26.84 25.25 0.94 GEV207-R0400-0358 27.37 19.80 0.72 26.92 20.63 0.77 GEV207-R0400-0359 24.04 19.79 0.82 26.70 21.22 0.79 GEV207-R0400-0360 28.20 - 28.76 - GEV207-R0400-0361 27.00 - 28.46 - GEV207-R0400-0362 26.85 20.84 0.78 26.51 21.82 0.82 GEV207-R0400-0363 27.21 - 27.18 - GEV207-R0400-0364 26.83 17.30 0.64 26.72 24.95 0.93 GEV207-R0400-0365 27.32 21.49 0.79 27.49 21.36 0.78 GEV207-R0400-0366 27.25 23.39 0.86 27.10 22.69 0.84 GEV207-R0400-0367 27.29 18.67 0.68 26.91 26.00 0.97 GEV207-R0400-0368 28.04 20.54 0.73 26.36 23.73 0.90 GEV207-R0400-0369 26.69 - 25.98 - GEV207-R0400-0370 27.74 17.55 0.63 26.13 23.63 0.90 GEV207-R0400-0371 28.70 19.10 0.67 27.68 24.47 0.88 GEV207-R0400-0372 26.43 19.63 0.74 26.55 19.95 0.75 GEV207-R0400-0373 27.64 - 27.33 - GEV207-R0400-0374 25.71 17.65 0.69 26.35 21.77 0.83 GEV207-R0400-0375 26.29 18.09 0.69 25.68 21.91 0.85 GEV207-R0400-0378 25.45 20.04 0.79 26.92 20.05 0.74 GEV207-R0400-0379 26.81 19.16 0.71 28.06 21.10 0.75 GEV207-R0400-0380 25.73 19.47 0.76 26.09 23.75 0.91 GEV207-R0400-0381 27.97 19.40 0.69 26.87 21.46 0.80 GEV207-R0400-0382 27.36 18.17 0.66 26.31 21.67 0.82 GEV207-R0400-0383 27.57 21.61 0.78 26.27 19.46 0.74 GEV207-R0400-0384 27.35 21.30 0.78 27.21 24.02 0.88 GEV207-R0400-0385 26.71 18.51 0.69 24.85 19.72 0.79 GEV207-R0400-0386 26.23 19.29 0.74 26.62 23.68 0.89
Mean value 26.98 26.84 COV (%) 3.92 2.78
In Fig. 4 absolute residual strength for coupons GEV207-R0400 tested at R=10 is shown. The ultimate strength of the coupons was taken as 535MPa in tension and –459MPa in

OB_TG5_R0??_rev.0
20 of 24 Last saved 3/7/2006 16:09
OPTIMAT BLADES Page
compression. In Fig. 5 the stiffness degradation as measured is presented versus the life fraction.
0.60
0.65
0.70
0.75
0.80
0.85
0.90
0.95
1.00
1.05
1.10
0.00 0.20 0.40 0.60 0.80 1.00
n/N
Sm
ax/U
TS
Level 1bLevel 1b TensionLevel 3level 3 Tensionlevel 2Level 2 Tension
Fig. 4 Absolute residual strength versus life fraction for coupons GEV207-R0400 tested at R=10

OB_TG5_R0??_rev.0
21 of 24 Last saved 3/7/2006 16:09
OPTIMAT BLADES Page
0.60
0.65
0.70
0.75
0.80
0.85
0.90
0.95
1.00
1.05
1.10
0.00 0.10 0.20 0.30 0.40 0.50 0.60 0.70 0.80 0.90n/N
Ef/E
i
Level 1bLevel 1b TensionLevel 3level 3 Tensionlevel 2Level 2 Tension
Fig. 5 Stiffness degradation versus life fraction for coupons type GEV207-R0400 tested at R-10.

OB_TG5_R0??_rev.0
22 of 24 Last saved 3/7/2006 16:09
OPTIMAT BLADES Page
Fig. 6 Example of coupon type GEV207-R0400 at failure

OB_TG5_R0??_rev.0
23 of 24 Last saved 3/7/2006 16:09
OPTIMAT BLADES Page
6. DISCUSSION OF THE RESULTS
The tests conducted within TG5 by CRES aim to serve as input for the strength and stiffness degradation models formed within the OPTIMAT BLADES project. However, CRES undertook the testing of a fraction of the necessary tests. Therefore, the data presented are limited for a further detailed analysis on the material degradation due to fatigue cycling.
Moreover, the stiffness and thus the stiffness degradation were measured using the readings of the displacement of the actuator. This was necessary, since the strain gauges attached on the coupons did not survive the fatigue cycles and the coupons shouldn’t be repositioned in the grips before final failure, so as to have comparable results. Due to this fact, the absolute numbers of elasticity modulus measured should be treated with caution and should be taken into account only when stiffness degradation is to be taken as input.

OB_TG5_R0??_rev.0
24 of 24 Last saved 3/7/2006 16:09
OPTIMAT BLADES Page
7. REFERENCES
[1] T. P. Philippidis, A. P. Vassilopoulos, T. T. Assimakopoulou, V. Passipoularidis, Static and Fatigue tests of OPTIMAT UD coupons; Benchmark Tests, OPTIMAT BLADES, ENK6-CT2001-00552, OB_TG2_R012, Rev.0, 2003
[2] O. Krause, T. P. Philippidis, General Test Specification, OPTIMAT BLADES, ENK6-CT2001-00552, OB_TC_R014, Rev.5, 2005
[3] M. J. Blanch, G. Dutton, T. P. Philippidis, R. Nijssen, Recommended procedure for conducting OPTIMAT Blades residual strength test, OPTIMAT BLADES, ENK6-CT2001-00552, OB_TG5_R002, 2003
[4] Geoff Dutton, Detailed Plan of Action WP13 and WP14 (TG5), OPTIMAT BLADES, ENK6-CT2001-00552, OB_TG5_R001, 2003
[5] Geoff Dutton, Minutes of TG5 meeting; Meeting 8, CRES, Greece, OPTIMAT BLADES, ENK6-CT2001-00552, OB_TG5_M008, 2005
[6] T. P. Philippidis, Implementation of “Blade material behavior under complex stress states” in technical standards. OPTIMAT BLADES ENK6-CT2001-00552, OB_TG2_R027, 2005.