test report no.: 1-0042/15-01-15-a - tim · test standard/s ieee 1528-2003 ... 0 a 33 11 512 661...
TRANSCRIPT

TEST REPORT Test Report No.: 1-0042/15-01-15-A
Testing Laboratory Applicant
CETECOM ICT Services GmbH Untertürkheimer Straße 6 – 10 66117 Saarbrücken/Germany Phone: + 49 681 5 98 - 0 Fax: + 49 681 5 98 - 9075 Internet: http://www.cetecom.com e-mail: [email protected] Accredited Test Laboratory: The testing laboratory (area of testing) is accredited according to DIN EN ISO/IEC 17025 (2005) by the Deutsche Akkreditierungsstelle GmbH (DAkkS) The accreditation is valid for the scope of testing procedures as stated in the accreditation certificate with the registration number: D-PL-12076-01-00
Blackberry Limited 440 Phillip Street Waterloo, ON N2L 5R9 CANADA Contact: Masud Attayi, P.Eng. Sr. Manager, Regulatory Certification & Compliance e-mail: [email protected] Phone: +1 51 98 88 74 65 x 72442 Fax: +1 51 98 88 69 06
Manufacturer Blackberry Limited 2200 University Avenue East Waterloo, ON N2K 0A7 Canada
Test Standard/s
IEEE 1528-2003 Recommended Practice for Determining the Peak Spatial-Average Specific Absorption Rate (SAR)in the Human Head from Wireless Communications Devices: Measurement Techniques
RSS-102 Issue 5 Radio Frequency Exposure Compliance of Radiocommunication Apparatus (All Frequency Bands)
For further applied test standards please refer to section 3 of this test report.
Test Item Kind of test item: Blackberry Smartphone Device type: portable device Model name: RHM181LW (STV100-4)S/N serial number: 1161466041 / 1161466952 / 1161466951 / 1161467034 / 1161509684 / 1161509633 FCC-ID: L6ARHM180LW IMEI-Number: 004402243072927 / 004402243072810 / 004402243072919 / 004402243072901 /
00440224308011010 / 004402243080037 Hardware status: CER-62543-001 Rev 2-x06-01 Software status: AAC273 Frequency: see technical details Antenna: integrated antenna Battery option: integrated battery Accessories: holster Test sample status: identical prototype Exposure category: general population / uncontrolled environment
This test report is electronically signed and valid without handwriting signature. For verification of the electronic signatures, the public keys can be requested at the testing laboratory.
Test Report authorised: Test performed:
Thomas Vogler Marco SciglianoLab Manager Testing Manager Radio Communications & EMC Radio Communications & EMC

Test report no.: 1-0042/15-01-15-A
Page 2 of 223
1 Table of contents
1 Table of contents ............................................................................................................................................ 2
2 General information ....................................................................................................................................... 4
2.1 Notes and disclaimer .................................................................................................................. 4 2.2 Application details ....................................................................................................................... 4 2.3 Statement of compliance ............................................................................................................ 4 2.4 Technical details .......................................................................................................................... 5 2.5 Transmitter and Antenna Operating Configurations ............................................................... 6
3 Test standards/ procedures references ....................................................................................................... 7
3.1 RF exposure limits ...................................................................................................................... 9
4 Summary of Measurement Results ............................................................................................................ 10
4.1 SAR measurement variability and measurement uncertainty analysis ............................... 11
5 Test Environment ......................................................................................................................................... 12
6 Test Set-up .................................................................................................................................................... 13
6.1 Measurement system ................................................................................................................ 13 6.1.1 System Description ...................................................................................................................... 13 6.1.2 Test environment ......................................................................................................................... 14 6.1.3 Probe description ......................................................................................................................... 14 6.1.4 Phantom description .................................................................................................................... 16 6.1.5 Device holder description ............................................................................................................ 17 6.1.6 Scanning procedure .................................................................................................................... 18 6.1.7 Spatial Peak SAR Evaluation ...................................................................................................... 19 6.1.8 Data Storage and Evaluation ....................................................................................................... 20 6.1.9 Tissue simulating liquids: dielectric properties ............................................................................ 22 6.1.10 Tissue simulating liquids: parameters ......................................................................................... 23 6.1.11 Measurement uncertainty evaluation for SAR test ...................................................................... 27 6.1.12 Measurement uncertainty evaluation for System Check ............................................................. 32 6.1.13 System check .............................................................................................................................. 34 6.1.14 System check procedure ............................................................................................................. 36 6.1.15 System validation ........................................................................................................................ 37
7 Detailed Test Results ................................................................................................................................... 38
7.1 Conducted power measurements ............................................................................................ 38 7.1.1 Conducted power measurements GSM 850 MHz ....................................................................... 39 7.1.2 Conducted power measurements GSM 1900 MHz ..................................................................... 39 7.1.3 Conducted power measurements WCDMA FDD V (850 MHz) ................................................... 41 7.1.4 Conducted power measurements WCDMA FDD IV (1700 MHz) ................................................ 42 7.1.5 Conducted power measurements WCDMA FDD II (1900 MHz) ................................................. 43 7.1.6 Test-set-up information for WCDMA / HSPDA / HSUPA ............................................................ 44 7.1.7 Conducted power measurements LTE FDD 2 1900 MHz ........................................................... 49 7.1.8 Conducted power measurements LTE FDD 4 1700 MHz ........................................................... 52 7.1.9 Conducted power measurements LTE FDD 7 2600 MHz ........................................................... 55 7.1.10 Conducted power measurements LTE FDD 13 700 MHz ........................................................... 57 7.1.11 Conducted power measurements LTE FDD 17 700 MHz ........................................................... 58 7.1.12 Conducted power measurements LTE TDD 41 2600 MHz ......................................................... 59 7.1.13 Justification of SAR measurements in LTE mode ....................................................................... 63 7.1.14 MPR information in LTE mode .................................................................................................... 63 7.1.15 LTE TDD test configuration ......................................................................................................... 64 7.1.16 Carrier Aggregation LTE FDD 7 (Intra Band) .............................................................................. 66 7.1.17 Conducted power measurements WLAN 5 GHz ......................................................................... 67 7.1.18 Conducted power measurements WLAN 5 GHz ......................................................................... 69 7.1.1 Conducted average power measurements Bluetooth 2.4 GHz ................................................... 76 7.2 SAR test results ......................................................................................................................... 77 7.2.1 General description of test procedures ....................................................................................... 77 7.2.2 Results overview ......................................................................................................................... 78

Test report no.: 1-0042/15-01-15-A
Page 3 of 223
7.2.3 Multiple Transmitter Information ................................................................................................ 117
8 Test equipment and ancillaries used for tests ........................................................................................ 125
9 Observations ............................................................................................................................................... 126
Annex A: System performance check .................................................................................................... 127
Annex A.1: System performance check 2.4 and 5 GHz .......................................................................... 154
Annex B: DASY5 measurement results ................................................................................................. 163
Annex B.2: GSM 835MHz ........................................................................................................................... 163 Annex B.3: GSM 1900MHz ......................................................................................................................... 167 Annex B.4: UMTS FDD II ............................................................................................................................ 170 Annex B.5: UMTS FDD IV ........................................................................................................................... 175 Annex B.6: UMTS FDD V ............................................................................................................................ 180 Annex B.7: LTE FDD 2................................................................................................................................ 183 Annex B.8: LTE FDD 4................................................................................................................................ 186 Annex B.9: LTE FDD 7................................................................................................................................ 189 Annex B.10: LTE FDD 13............................................................................................................................ 192 Annex B.11: LTE FDD 17............................................................................................................................ 195 Annex B.12: LTE TDD 41............................................................................................................................ 198 Annex B.13: WLAN2.4/5GHz and Bluetooth2.4GHz ................................................................................ 201 Annex B.14: Liquid depth .......................................................................................................................... 216
Annex C: Photo documentation .............................................................................................................. 222
Annex D: Calibration parameters ........................................................................................................... 222
Annex E: Document History .................................................................................................................... 223
Annex F: Further Information ................................................................................................................. 223

Test report no.: 1-0042/15-01-15-A
Page 4 of 223
2 General information 2.1 Notes and disclaimer The test results of this test report relate exclusively to the test item specified in this test report. CETECOM ICT Services GmbH does not assume responsibility for any conclusions and generalisations drawn from the test results with regard to other specimens or samples of the type of the equipment represented by the test item. The test report may only be reproduced or published in full. Reproduction or publication of extracts from the report requires the prior written approval of CETECOM ICT Services GmbH. This test report is electronically signed and valid without handwriting signature. For verification of the electronic signatures, the public keys can be requested at the testing laboratory. The testing service provided by CETECOM ICT Services GmbH has been rendered under the current "General Terms and Conditions for CETECOM ICT Services GmbH". CETECOM ICT Services GmbH will not be liable for any loss or damage resulting from false, inaccurate, inappropriate or incomplete product information provided by the customer. Under no circumstances does the CETECOM ICT Services GmbH test report include any endorsement or warranty regarding the functionality, quality or performance of any other product or service provided. Under no circumstances does the CETECOM ICT Services GmbH test report include or imply any product or service warranties from CETECOM ICT Services GmbH, including, without limitation, any implied warranties of merchantability, fitness for purpose, or non-infringement, all of which are expressly disclaimed by CETECOM ICT Services GmbH. All rights and remedies regarding vendor’s products and services for which CETECOM ICT Services GmbH has prepared this test report shall be provided by the party offering such products or services and not by CETECOM ICT Services GmbH. In no case this test report can be considered as a Letter of Approval. 2.2 Application details Date of receipt of order: 2015-06-08 Date of receipt of test item: 2015-07-28 Start of test: 2015-07-29 End of test: 2015-09-15 Person(s) present during the test:
2.3 Statement of compliance The SAR values found for the RHM181LW (STV100-4) Blackberry Smartphone are below the maximum recommended levels of 1.6 W/Kg as averaged over any 1 g tissue according to the FCC rule §2.1093, the ANSI/IEEE C 95.1:1992, the NCRP Report Number 86 for uncontrolled environment, according to the Health Canada’s Safety Code 6 and the Industry Canada Radio Standards Specification RSS-102 for General Population/Uncontrolled exposure. For body worn operation, this device has been tested and meets FCC RF exposure guidelines when used with any accessory that contains no metal and that positions the handset a minimum of 15 mm from the body. Use of other accessories may not ensure compliance with FCC RF exposure guidelines. According to KDB pub 941225 D06 this device has been tested with 10 mm distance to the phantom for operation in WLAN hot spot mode.

Test report no.: 1-0042/15-01-15-A
Page 5 of 223
2.4 Technical details
Ban
d te
sted
for
this
test
rep
ort
Tec
hnol
ogy
Low
est t
rans
mit
freq
uenc
y/M
Hz
Hig
hest
tran
smit
freq
uenc
y/M
Hz
Low
est r
ecei
ve F
requ
ency
/MH
z
Hig
hest
rec
eive
Fre
quen
cy/M
Hz
Kin
d of
mod
ulat
ion
Pow
er C
lass
Tes
ted
pow
er c
ontr
ol le
vel
GP
RS
/EG
PR
S m
obile
sta
tion
clas
s
GP
RS
/EG
PR
S m
ultis
lot c
lass
(E)G
PR
S v
oice
mod
e or
DT
M
Tes
t cha
nnel
low
Tes
t cha
nnel
mid
dle
Tes
t cha
nnel
hig
h
Max
imum
out
put p
ower
/dB
m )
*
GSM 880.2 914.8 925.2 959.8GMSK8-PSK
4E2
5 A 33 11 975 37 124 31.0
GSM DCS 1710.2 1784.8 1805.2 1879.8GMSK8-PSK
1E2
0 A 33 11 512 698 885 29.4
GSM cellular 824.2 848.8 869.2 893.8GMSK8-PSK
4E2
5 A 33 11 128 190 251 31.5
GSM PCS 1850.2 1909.8 1930.2 1989.8GMSK8-PSK
1E2
0 A 33 11 512 661 810 29.4
UMTS FDD I 1922.4 1977.6 2112.4 2167.6 QPSK 3 max -- -- -- 9612 9750 9888 24.3
UMTS FDD II 1852.4 1907.6 1932.4 1987.6 QPSK 3 max -- -- -- 9262 9400 9538 24.6
UMTS FDD IV 1712.4 1752.6 2112.4 2152.6 QPSK 3 max -- -- -- 1312 1412 1513 24.1
UMTS FDD V 826.4 846.6 871.4 891.6 QPSK 3 max -- -- -- 4132 4182 4233 24.1
UMTS FDD VIII 882.4 912.6 927.4 957.6 QPSK 3 max -- -- -- 2712 2788 2863 24.5
LTE FDD 1 1920 1980 2110 2170 QPSK 3 max -- -- -- 18100 18300 18500 23.3
LTE FDD 2 1850 1910 1930 1990 QPSK 3 max -- -- -- 18700 18900 19100 23.3
LTE FDD 3 1710 1785 1805 1880 QPSK 3 max -- -- -- 19300 19575 19850 23.8
LTE FDD 4 1710 1755 2110 2155 QPSK 3 max -- -- -- 20050 20175 20300 23.4
LTE FDD 7 2500 2570 2620 2690 QPSK 3 max -- -- -- 20850 21100 21350 23.1
LTE FDD 8 880 915 925 960 QPSK 3 max -- -- -- 21500 21625 21750 23.7
LTE FDD 13 777 787 746 756 QPSK 3 max -- -- -- 23205 23230 23255 23.9
LTE FDD 17 704 716 734 746 QPSK 3 max -- -- -- 23780 23790 23800 23.7
LTE FDD 20 832 862 791 821 QPSK 3 max -- -- -- 24250 24300 24350 24.2
LTE FDD 28 703 748 758 803 QPSK 3 max -- -- -- 27310 27435 27560 23.6
LTE TDD 41 2496 2690 2496 2690 QPSK 3 max -- -- -- --- 41055 --- 23.7
WLAN 2412 2472 2412 2472 CCK
OFDM-- max -- -- -- 1 6 13 17.5
WLAN
US 2412 2462 2412 2462
CCK OFDM
-- max -- -- -- 1 6 11 17.9
WLAN 5180 5240 5180 5240 OFDM -- max -- -- -- -- 40 -- 15.5
WLAN 5260 5320 5260 5320 OFDM -- max -- -- -- -- 56 -- 15.8

Test report no.: 1-0042/15-01-15-A
Page 6 of 223
WLAN 5500 5700 5500 5700 OFDM -- max -- -- -- -- -- 140 15.3
WLAN 5745 5825 5745 5825 OFDM -- max -- -- -- 149 -- -- 15.7
BT 2402 2480 2402 2480 GFSK 3 max -- -- -- 0 39 78 7.8
)*: measured slotted peak power for GSM, averaged max. RMS power for UMTS, LTE, WLAN and BT. LTE and CA Release 10
2.5 Transmitter and Antenna Operating Configurations
Simultaneous transmission conditions GSM UMTS LTE WLAN2.4 (0) WLAN2.4 (1) WLAN5 (0) WLAN5 (1) BT/BLE1
GSM x x x x x UMTS x x x x x LTE x x x x x
WLAN2.4 (0) x x x x x WLAN2.4 (1) x x x x x
WLAN 5GHz (0) x x x x x WLAN 5GHz (1) x x x x x
BT/BLE1 x x x x x x x Table 1: Simultaneous transmission conditions (0) – primary antenna (1) – secondary antenna BLE1 - Bluetooth low energy

Test report no.: 1-0042/15-01-15-A
Page 7 of 223
3 Test standards/ procedures references Test Standard Version Test Standard Description IEEE 1528-2003 2003-04 Recommended Practice for Determining the Peak Spatial-
Average Specific Absorption Rate (SAR) in the Human Head from Wireless Communications Devices: Measurement Techniques
IEEE 1528-2013 2014-06 Recommended Practice for Determining the Peak Spatial-Average Specific Absorption Rate (SAR) in the Human Head from Wireless Communications Devices: Measurement Techniques
IEEE Std. C95-3 2002 IEEE Recommended Practice for the Measurement of Potentially Hazardous Electromagnetic Fields – RF and Microwave
IEEE Std. C95-1 2005 IEEE Standard for Safety Levels with Respect to Human Exposure to Radio Frequency Electromagnetic Fields, 3 kHz to 300 GHz.

Test report no.: 1-0042/15-01-15-A
Page 8 of 223
FCC KDBs:
KDB 865664D01v01 February 7, 2014
FCC OET SAR measurement requirements 100 MHz to 6 GHz
KDB 865664D02v01 May 28, 2013
RF Exposure Compliance Reporting and Documentation Considerations
KDB 447498D01v05 February 7, 2014
Mobile and Portable Devices RF Exposure Procedures and Equipment Authorization Policies
KDB 648474D04v01 December 4, 2013
SAR Evaluation Considerations for Wireless Handsets
KDB 941225D01v03 October 16, 2014
SAR Measurements Procedures for 3G Devices
KDB 941225D05v02 December 5, 2013
SAR for LTE Devices
KDB 941225D05Av01 August 12, 2014
LTE Rel. 10 KDB Inquiry Sheet
KDB 941225D06v02 October 16, 2014
SAR Evaluation Procedures for Portable Devices with Wireless Router Capabilities
KDB 941225D07v01 May 28, 2013
UMPS Mini Tablet
KDB 248227D01v02 June 08, 2015
SAR Measurement Procedures for 802.11 a/b/g Transmitters
KDB 616217D04v01 May 28, 2013
SAR Evaluation Considerations for Laptop, Notebook, Netbook and Tablet Computers.

Test report no.: 1-0042/15-01-15-A
Page 9 of 223
3.1 RF exposure limits
Human Exposure Uncontrolled Environment General Population
Controlled Environment Occupational
Spatial Peak SAR* (Brain and Trunk)
1.60 mW/g 8.00 mW/g
Spatial Average SAR** (Whole Body)
0.08 mW/g 0.40 mW/g
Spatial Peak SAR*** (Hands/Feet/Ankle/Wrist)
4.00 mW/g 20.00 mW/g
Table 2: RF exposure limits The limit applied in this test report is shown in bold letters Notes: * The Spatial Peak value of the SAR averaged over any 1 gram of tissue (defined as a tissue volume in
the shape of a cube) and over the appropriate averaging time ** The Spatial Average value of the SAR averaged over the whole body. *** The Spatial Peak value of the SAR averaged over any 10 grams of tissue (defined as a tissue volume
in the shape of a cube) and over the appropriate averaging time. Uncontrolled Environments are defined as locations where there is the exposure of individuals who have no knowledge or control of their exposure. Controlled Environments are defined as locations where there is exposure that may be incurred by persons who are aware of the potential for exposure, (i.e. as a result of employment or occupation).

Test report no.: 1-0042/15-01-15-A
Page 10 of 223
4 Summary of Measurement Results
No deviations from the technical specifications ascertained
Deviations from the technical specifications ascertained
Maximum SAR value reported for 1g (W/kg)
PCE DTS UNII
head 1.154 0.240 0.169
body worn 15 mm distance 0.934 0.112 0.379
hotspot operation 10 mm distance 1.165 0.053 0.180
collocated situations
ΣSAR evaluation 1.482
head SAR1g results(W/kg)
Measured Extrapolated
GSM 850 0.133 0.184 GSM 1900 0.520 0.701
UMTS FDD II 0.557 0.667 UMTS FDD IV 0.896 1.154 UMTS FDD V 0.253 0.326
LTE FDD 2 0.629 0.810 LTE FDD 4 0.612 0.736 LTE FDD 7 0.241 0.298
LTE FDD 13 0.136 0.139 LTE FDD 17 0.071 0.079 LTE TDD 41 0.135 0.145 WLAN 2450 0.199 0.240
BT 2450 0.011 0.015 WLAN 5 GHz 0.109 0.169

Test report no.: 1-0042/15-01-15-A
Page 11 of 223
hotspot SAR1g results(W/kg)
Measured Extrapolated
GSM 850 0.682 0.948 GSM 1900 0.720 1.141
UMTS FDD II 0.815 0.925 UMTS FDD IV 1.090 1.165 UMTS FDD V 0.577 0.743
LTE FDD 2 0.662 0.932 LTE FDD 4 0.832 1.047 LTE FDD 7 0.779 0.946
LTE FDD 13 0.296 0.303 LTE FDD 17 0.182 0.195 LTE TDD 41 0.614 0.658 WLAN 2450 0.043 0.053
BT 2450 0.019 0.025 WLAN 5 GHz 0.133 0.180
body worn SAR1g results(W/kg)
Measured Extrapolated
GSM 850 0.386 0.533 GSM 1900 0.537 0.724
UMTS FDD II 0.725 0.934 UMTS FDD IV 0.696 0.891 UMTS FDD V 0.258 0.317
LTE FDD 2 0.608 0.714 LTE FDD 4 0.619 0.744 LTE FDD 7 0.378 0.465
LTE FDD 13 0.178 0.182 LTE FDD 17 0.124 0.133 LTE TDD 41 0.369 0.369 WLAN 2450 0.093 0.112
BT 2450 0.007 0.009 WLAN 5 GHz 0.274 0.379
4.1 SAR measurement variability and measurement uncertainty analysis This analysis is required for worst case results larger than 0.8 W/kg.
frequency band highest original measurement result at worst
case position (W/kg)
repeated measurement result at worst case
position (W/kg)
ratio <1.2
UMTS FDD II 0.815 0.778 1.05
UMTS FDD IV head 0.896 0.866 1.03
UMTS FDD IV body 1.090 1.000 1.09
LTE FDD 4 0.817 0.832 1.02
Test report no.: 1-0042/15-01-15-A
Page 12 of 223
5 Test Environment Ambient temperature: 20 – 24 °C Tissue Simulating liquid: 20 – 24 °C Relative humidity content: 40 – 50 % Air pressure: not relevant for this kind of testing Power supply: 230 V / 50 Hz
Exact temperature values for each test are shown in the table(s) under 7.1 and/or on the measurement plots.

Test report no.: 1-0042/15-01-15-A
Page 13 of 223
6 Test Set-up
6.1 Measurement system
6.1.1 System Description
The DASY system for performing compliance tests consists of the following items:
A standard high precision 6-axis robot (Stäubli RX/TX family) with controller and software. An arm extension for accommodating the data acquisition electronics (DAE).
A dosimetric probe, i.e. an isotropic E-field probe optimized and calibrated for usage in tissue simulating
liquid.
A data acquisition electronic (DAE) which performs the signal amplification, signal multiplexing, AD-conversion, offset measurements, mechanical surface detection, collision detection, etc. The unit is battery powered with standard or rechargeable batteries. The signal is optically transmitted to the EOC.
The Electro-Optical Coupler (EOC) performs the conversion from the optical into a digital electric signal of the DAE. The EOC is connected to the DASY measurement server.
The DASY measurement server, which performs all real-time data evaluation for field measurements and surface detection, controls robot movements and handles safety operation. A computer operating Windows 7.
DASY software and SEMCAD data evaluation software. Remote control with teach panel and additional circuitry for robot safety such as warning lamps, etc. The generic twin phantom enabling the testing of left-hand and right-hand usage. The triple flat and eli phantom for the testing of handheld and body-mounted wireless devices. The device holder for handheld mobile phones and mounting device adaptor for laptops Tissue simulating liquid mixed according to the given recipes. System check dipoles allowing to validate the proper functioning of the system.

Test report no.: 1-0042/15-01-15-A
Page 14 of 223
6.1.2 Test environment The DASY measurement system is placed in a laboratory room within an environment which avoids influence on SAR measurements by ambient electromagnetic fields and any reflection from the environment. The pictures at the beginning of the photo documentation show a complete view of the test environment. The system allows the measurement of SAR values larger than 0.005 mW/g. 6.1.3 Probe description
Isotropic E-Field Probe ET3DV6 for Dosimetric Measurements Technical data according to manufacturer information
Construction Symmetrical design with triangular core Built-in optical fiber for surface detection system Built-in shielding against static charges PEEK enclosure material (resistant to organic solvents, e.g., glycolether)
Calibration In air from 10 MHz to 2.5 GHz In head tissue simulating liquid (HSL) at 900 (800-1000) MHz and 1.8 GHz (1700-1910 MHz) (accuracy ± 9.5%; k=2) Calibration for other liquids and frequencies upon request
Frequency 10 MHz to 3 GHz (dosimetry); Linearity: ± 0.2 dB (30 MHz to 3 GHz)
Directivity ± 0.2 dB in HSL (rotation around probe axis) ± 0.4 dB in HSL (rotation normal to probe axis)
Dynamic range 5 µW/g to > 100 mW/g; Linearity: ± 0.2 dB Optical Surface Detection
± 0.2 mm repeatability in air and clear liquids over diffuse reflecting surfaces (ET3DV6 only)
Dimensions
Overall length: 330 mm Tip length: 16 mm Body diameter: 12 mm Tip diameter: 6.8 mm Distance from probe tip to dipole centers: 2.7 mm
Application General dosimetry up to 3 GHz Compliance tests of mobile phones Fast automatic scanning in arbitrary phantoms (ET3DV6)

Test report no.: 1-0042/15-01-15-A
Page 15 of 223
Isotropic E-Field Probe ES3DV3 for Dosimetric Measurements
Technical data according to manufacturer informationConstruction Symmetrical design with triangular core
Interleaved sensors Built-in shielding against static charges PEEK enclosure material (resistant to organic solvents, e.g., butyl diglycol)
Calibration Calibration certificate in Appendix D Frequency 10 MHz to 3 GHz (dosimetry); Linearity: ± 0.2 dB (30 MHz to 3
GHz) Directivity ± 0.2 dB in HSL (rotation around probe axis)
± 0.3 dB in HSL (rotation normal to probe axis) Dynamic range 5 µW/g to > 100 mW/g; Linearity: ± 0.2 dB Dimensions
Overall length: 330 mm Tip length: 20 mm Body diameter: 12 mm Tip diameter: 3.9 mm Distance from probe tip to dipole centers: 2.0 mm
Application General dosimetry up to 3 GHz Compliance tests of mobile phones Fast automatic scanning in arbitrary phantoms (ES3DV3)
Isotropic E-Field Probe EX3DV4 for Dosimetric Measurements
Technical data according to manufacturer information Construction Symmetrical design with triangular core
Interleaved sensors Built-in shielding against static charges PEEK enclosure material (resistant to organic solvents, e.g., DGBE)
Calibration ISO/IEC 17025 calibration service available. Frequency 10 MHz to >6 GHz (dosimetry); Linearity: ± 0.2 dB (30 MHz to
6 GHz) Directivity ± 0.3 dB in HSL (rotation around probe axis)
± 0.5 dB in tissue material (rotation normal to probe axis) Dynamic range 10 µW/g to > 100 mW/g; Linearity: ± 0.2 dB (noise: typically<1
µW/g) Dimensions
Overall length: 337 mm (Tip: 20mm) Tip length: 2.5 mm (Body: 12mm) Typical distance from probe tip to dipole centers: 1mm
Application High precision dosimetric measurements in any exposure scenario (e.g., very strong gradient fields). Only probe which enables compliance testing for frequencies up to 6 GHz with precision of better 30%.

Test report no.: 1-0042/15-01-15-A
Page 16 of 223
6.1.4 Phantom description The used SAM Phantom meets the requirements specified in FCC KDB865664 D01 for Specific Absorption Rate (SAR) measurements. The phantom consists of a fibreglass shell integrated in a wooden table. It allows left-hand and right-hand head as well as body-worn measurements with a maximum liquid depth of 18 cm in head position and 22 cm in planar position (body measurements). The thickness of the Phantom shell is 2 mm +/- 0.1 mm.
Triple Modular Phantom consists of three identical modules which can be installed and removed separately without emptying the liquid. It includes three reference points for phantom installation. Covers prevent evaporation of the liquid. Phantom material is resistant to DGBE based tissue simulating liquids.
ear reference point left hand side
reference point flat position
ear reference point right hand side

Test report no.: 1-0042/15-01-15-A
Page 17 of 223
6.1.5 Device holder description The DASY device holder has two scales for device rotation (with respect to the body axis) and the device inclination (with respect to the line between the ear openings). The plane between the ear openings and the mouth tip has a rotation angle of 65°. The bottom plate contains three pair of bolts for locking the device holder. The device holder positions are adjusted to the standard measurement positions in the three sections. This device holder is used for standard mobile phones or PDA’s only. If necessary an additional support of polystyrene material is used.
Larger DUT’s (e.g. notebooks) cannot be tested using this device holder. Instead a support of bigger polystyrene cubes and thin polystyrene plates is used to position the DUT in all relevant positions to find and measure spots with maximum SAR values. Therefore those devices are normally only tested at the flat part of the SAM.

Test report no.: 1-0042/15-01-15-A
Page 18 of 223
6.1.6 Scanning procedure
The DASY installation includes predefined files with recommended procedures for measurements and system check. They are read-only document files and destined as fully defined but unmeasured masks. All test positions (head or body-worn) are tested with the same configuration of test steps differing only in the grid definition for the different test positions.
The „reference“ and „drift“ measurements are located at the beginning and end of the batch process.
They measure the field drift at one single point in the liquid over the complete procedure. The indicated drift is mainly the variation of the DUT’s output power and should vary max. +/- 5 %.
The highest integrated SAR value is the main concern in compliance test applications. These values can
mostly be found at the inner surface of the phantom and cannot be measured directly due to the sensor offset in the probe. To extrapolate the surface values, the measurement distances to the surface must be known accurately. A distance error of 0.5mm could produce SAR errors of 6% at 1800 MHz. Using predefined locations for measurements is not accurate enough. Any shift of the phantom (e.g., slight deformations after filling it with liquid) would produce high uncertainties. For an automatic and accurate detection of the phantom surface, the DASY5 system uses the mechanical surface detection. The detection is always at touch, but the probe will move backward from the surface the indicated distance before starting the measurement.
The „area scan“ measures the SAR above the DUT or verification dipole on a parallel plane to the surface.
It is used to locate the approximate location of the peak SAR with 2D spline interpolation. The robot performs a stepped movement along one grid axis while the local electrical field strength is measured by the probe. The probe is touching the surface of the SAM during acquisition of measurement values. The scan uses different grid spacings for different frequency measurements. Standard grid spacing for head measurements in frequency ranges ≤ 2GHz is 15 mm in x- and y- dimension. For higher frequencies a finer resolution is needed, thus for the grid spacing is reduced according the following table:
Area scan grid spacing for different frequency ranges Frequency range Grid spacing ≤ 2 GHz ≤ 15 mm 2 – 4 GHz ≤ 12 mm 4 – 6 GHz ≤ 10 mm
Grid spacing and orientation have no influence on the SAR result. For special applications where the standard scan method does not find the peak SAR within the grid, e.g. mobile phones with flip cover, the grid can be adapted in orientation. Results of this coarse scan are shown in annex B.
A „zoom scan” measures the field in a volume around the 2D peak SAR value acquired in the previous
„coarse“ scan. It uses a fine meshed grid where the robot moves the probe in steps along all the 3 axis (x,y and z-axis) starting at the bottom of the Phantom. The grid spacing for the cube measurement is varied according to the measured frequency range, the dimensions are given in the following table:
Zoom scan grid spacing and volume for different frequency ranges
Frequency range Grid spacing for x, y axis
Grid spacing for z axis
Minimum zoom scan volume
≤ 2 GHz ≤ 8 mm ≤ 5 mm ≥ 30 mm 2 – 3 GHz ≤ 5 mm ≤ 5 mm ≥ 28 mm 3 – 4 GHz ≤ 5 mm ≤ 4 mm ≥ 28 mm 4 – 5 GHz ≤ 4 mm ≤ 3 mm ≥ 25 mm 5 – 6 GHz ≤ 4 mm ≤ 2 mm ≥ 22 mm
DASY is also able to perform repeated zoom scans if more than 1 peak is found during area scan. In this document, the evaluated peak 1g and 10g averaged SAR values are shown in the 2D-graphics in annex B. Test results relevant for the specified standard (see section 3) are shown in table form in section 7.

Test report no.: 1-0042/15-01-15-A
Page 19 of 223
6.1.7 Spatial Peak SAR Evaluation The spatial peak SAR - value for 1 and 10 g is evaluated after the Cube measurements have been done. The basis of the evaluation are the SAR values measured at the points of the fine cube grid consisting of all points in the three directions x, y and z. The algorithm that finds the maximal averaged volume is separated into three different stages.
The data between the dipole center of the probe and the surface of the phantom are extrapolated. This data cannot be measured since the center of the dipole is 1 to 2.7 mm away from the tip of the probe and the distance between the surface and the lowest measuring point is about 1 mm (see probe calibration sheet). The extrapolated data from a cube measurement can be visualized by selecting ‘Graph Evaluated’.
The maximum interpolated value is searched with a straight-forward algorithm. Around this maximum the
SAR - values averaged over the spatial volumes (1g or 10 g) are computed using the 3d-spline interpolation algorithm. If the volume cannot be evaluated (i.e., if a part of the grid was cut off by the boundary of the measurement area) the evaluation will be started on the corners of the bottom plane of the cube.
All neighbouring volumes are evaluated until no neighbouring volume with a higher average value is
found. Extrapolation The extrapolation is based on a least square algorithm [W. Gander, Computermathematik, p.168-180]. Through the points in the first 3 cm along the z-axis, polynomials of order four are calculated. These polynomials are then used to evaluate the points between the surface and the probe tip. The points, calculated from the surface, have a distance of 1 mm from each other. Interpolation The interpolation of the points is done with a 3d-Spline. The 3d-Spline is composed of three one-dimensional splines with the "Not a knot"-condition [W. Gander, Computermathematik, p.141-150] (x, y and z -direction) [Numerical Recipes in C, Second Edition, p.123ff ]. Volume Averaging At First the size of the cube is calculated. Then the volume is integrated with the trapezoidal algorithm. 8000 points (20x20x20) are interpolated to calculate the average. Advanced Extrapolation DASY uses the advanced extrapolation option which is able to compensate boundary effects on E-field probes.

Test report no.: 1-0042/15-01-15-A
Page 20 of 223
6.1.8 Data Storage and Evaluation Data Storage The DASY software stores the acquired data from the data acquisition electronics as raw data (in microvolt readings from the probe sensors), together with all necessary software parameters for the data evaluation (probe calibration data, liquid parameters and device frequency and modulation data) in measurement files with the extension ".DA4", “.DA5x”. The software evaluates the desired unit and format for output each time the data is visualized or exported. This allows verification of the complete software setup even after the measurement and allows correction of incorrect parameter settings. For example, if a measurement has been performed with a wrong crest factor parameter in the device setup, the parameter can be corrected afterwards and the data can be re-evaluated. The measured data can be visualized or exported in different units or formats, depending on the selected probe type ([V/m], [A/m], [°C], [mW/g], [mW/cm²], [dBrel], etc.). Some of these units are not available in certain situations or show meaningless results, e.g., a SAR output in a lossless media will always be zero. Raw data can also be exported to perform the evaluation with other software packages. Data Evaluation by SEMCAD
The SEMCAD software automatically executes the following procedures to calculate the field units from the microvolt readings at the probe connector. The parameters used in the evaluation are stored in the configuration modules of the software: Probe parameters: - Sensitivity Normi, ai0, ai1, ai2 - Conversion factor ConvFi - Diode compression point Dcpi Device parameters: - Frequency f - Crest factor cf Media parameters: - Conductivity - Density These parameters must be set correctly in the software. They can be found in the component documents or they can be imported into the software from the configuration files issued for the DASY components. In the direct measuring mode of the multimeter option, the parameters of the actual system setup are used. In the scan visualization and export modes, the parameters stored in the corresponding document files are used. The first step of the evaluation is a linearization of the filtered input signal to account for the compression characteristics of the detector diode. The compensation depends on the input signal, the diode type and the DC-transmission factor from the diode to the evaluation electronics.

Test report no.: 1-0042/15-01-15-A
Page 21 of 223
If the exciting field is pulsed, the crest factor of the signal must be known to correctly compensate for peak power. The formula for each channel can be given as:
Vi = Ui + Ui2 cf/dcpi
with Vi = compensated signal of channel i (i = x, y, z) Ui = input signal of channel i (i = x, y, z) cf = crest factor of exciting field (DASY parameter) dcpi = diode compression point (DASY parameter)
From the compensated input signals the primary field data for each channel can be evaluated:
E-field probes: Ei = (Vi / Normi ConvF)1/2
H-field probes: Hi = (Vi)1/2 (ai0 + ai1f + ai2f2)/f with Vi = compensated signal of channel i (i = x, y, z) Normi = sensor sensitivity of channel i (i = x, y, z) [mV/(V/m)2] for E-field Probes ConvF = sensitivity enhancement in solution aij = sensor sensitivity factors for H-field probes f = carrier frequency [GHz] Ei = electric field strength of channel i in V/m Hi = magnetic field strength of channel i in A/m The RSS value of the field components gives the total field strength (Hermitian magnitude):
Etot = (Ex2 + EY
2 + Ez
2)1/2
The primary field data are used to calculate the derived field units.
SAR = (Etot2 ) / ( 1000)
with SAR = local specific absorption rate in mW/g Etot = total field strength in V/m = conductivity in [mho/m] or [Siemens/m] = equivalent tissue density in g/cm3
Note that the density is normally set to 1 (or 1.06), to account for actual brain density rather than the density of the simulation liquid.The power flow density is calculated assuming the excitation field to be a free space field.
Ppwe = Etot2 / 3770 or Ppwe = Htot
2 37.7 with Ppwe = equivalent power density of a plane wave in mW/cm2 Etot = total electric field strength in V/m Htot = total magnetic field strength in A/m

Test report no.: 1-0042/15-01-15-A
Page 22 of 223
6.1.9 Tissue simulating liquids: dielectric properties The following materials are used for producing the tissue-equivalent materials. (Liquids used for tests described in section 7. are marked with ): Ingredients (% of weight)
Frequency (MHz)
frequency band
450 750 835 900 1450 1750 1900 2450 5000
Water 38.56 41.1 41.45 40.92 54.37 55.35 55.19 54.7 64 - 78 Salt (NaCl) 3.95 1.4 1.45 1.48 0.63 0.38 0.19 0.0 2 - 3
Sugar 56.32 57.0 56.0 56.5 0.0 0.0 0.0 0.0 0.0 HEC 0.98 0.2 1.0 1.0 0.0 0.0 0.0 0.0 0.0
Bactericide 0.19 0.2 0.1 0.1 0.1 0.1 0.1 0.1 0.0 Tween 20 0.0 0.0 0.0 0.0 44.90 44.17 44.52 45.2 0.0 Emulsifiers 0.0 0.0 0.0 0.0 0.0 0.0 0.0 0.0 9 - 15 Mineral Oil 0.0 0.0 0.0 0.0 0.0 0.0 0.0 0.0 11 - 18
Table 3: Head tissue dielectric properties Ingredients (% of weight)
Frequency (MHz)
frequency band
450 750 835 900 1450 1750 1900 2450 5000
Water 51.16 51.7 52.4 56.0 71.40 71.45 71.56 71.65 64 - 78 Salt (NaCl) 1.49 0.9 1.40 0.76 0.55 0.5 0.39 0.3 2 - 3
Sugar 46.78 47.2 45.0 41.76 0.0 0.0 0.0 0.0 0.0 HEC 0.52 0.0 1.0 1.21 0.0 0.0 0.0 0.0 0.0
Bactericide 0.05 0.1 0.1 0.27 0.1 0.1 0.1 0.1 0.0 Tween 20 0.0 0.0 0.0 0.0 27.95 27.95 27.95 27.95 0.0 Emulsifiers 0.0 0.0 0.0 0.0 0.0 0.0 0.0 0.0 9 - 15 Mineral Oil 0.0 0.0 0.0 0.0 0.0 0.0 0.0 0.0 11 - 18
Table 4: Body tissue dielectric properties Salt: 99+% Pure Sodium Chloride Water: De-ionized, 16M+ resistivity Sugar: 98+% Pure Sucrose HEC: Hydroxyethyl Cellulose
Tween 20: Polyoxyethylene (20) sorbitan monolaurate

Test report no.: 1-0042/15-01-15-A
Page 23 of 223
6.1.10 Tissue simulating liquids: parameters
Liquid HSL
Freq. (MHz)
Target head tissue Measurement head tissue Measuremen
t date Permittivity Conductivity
(S/m) Permitt
ivity Dev. %
Conductivity Dev. % ε'' (S/m)
750 709 42.15 0.89 41.6 -1.2% 21.93 0.86 -2.8% 2015-08-24 725 42.07 0.89 41.5 -1.5% 21.79 0.88 -1.4% 750 41.94 0.89 41.1 -2.0% 21.61 0.90 0.9% 782 41.78 0.90 40.7 -2.6% 21.42 0.93 4.0%
850/900 824 41.56 0.90 41.7 0.4% 19.95 0.91 1.7% 2015-08-19 825 41.55 0.90 41.7 0.4% 19.95 0.92 1.8% 835 41.50 0.90 41.5 0.0% 20.03 0.93 3.4% 837 41.50 0.90 41.5 0.0% 20.01 0.93 3.3% 847 41.50 0.91 41.3 -0.4% 19.96 0.94 3.0% 849 41.50 0.92 41.3 -0.5% 19.94 0.94 2.9%
1750 1712 40.13 1.35 39.1 -2.7% 13.81 1.32 -2.6% 2015-07-31 1720 40.11 1.35 39.0 -2.8% 13.82 1.32 -2.4% 1732 40.10 1.36 38.9 -2.9% 13.81 1.33 -2.3% 1745 40.08 1.37 38.9 -2.9% 13.84 1.34 -1.8% 1750 40.07 1.37 38.9 -3.0% 13.85 1.35 -1.7% 1752 40.07 1.37 38.9 -3.0% 13.84 1.35 -1.7%
1900 1850 40.00 1.40 40.1 0.2% 12.94 1.33 -4.9% 2015-07-29 1852 40.00 1.40 40.1 0.2% 12.94 1.33 -4.8% 1860 40.00 1.40 40.0 0.1% 12.96 1.34 -4.2% 1880 40.00 1.40 40.0 -0.1% 13.00 1.36 -2.9% 1900 40.00 1.40 39.9 -0.2% 13.05 1.38 -1.5% 1908 40.00 1.40 39.9 -0.3% 13.06 1.39 -1.0% 1910 40.00 1.40 39.9 -0.3% 13.04 1.39 -1.0%
2600 2510 39.12 1.87 38.2 -2.5% 12.88 1.80 -3.6% 2015-08-04 2535 39.09 1.89 38.0 -2.7% 12.96 1.83 -3.4% 2560 39.06 1.92 38.0 -2.7% 13.03 1.86 -3.4% 2600 39.01 1.96 37.8 -3.0% 13.13 1.90 -3.3%
2600 2510 39.12 1.87 38.8 -0.9% 13.30 1.86 -0.5% 2015-09-01 2535 39.09 1.89 38.7 -1.0% 13.35 1.88 -0.5% 2560 39.06 1.92 38.6 -1.3% 13.31 1.90 -1.3% 2568 39.05 1.93 38.6 -1.2% 13.36 1.91 -1.1% 2593 39.02 1.96 38.5 -1.4% 13.54 1.95 -0.2% 2600 39.01 1.96 38.4 -1.5% 13.55 1.96 -0.2% 2637 38.96 2.00 38.3 -1.6% 13.58 1.99 -0.6% 2680 38.91 2.05 38.2 -1.8% 13.66 2.04 -0.7%
Table 5: Parameter of the head tissue simulating liquid
Test report no.: 1-0042/15-01-15-A
Page 24 of 223
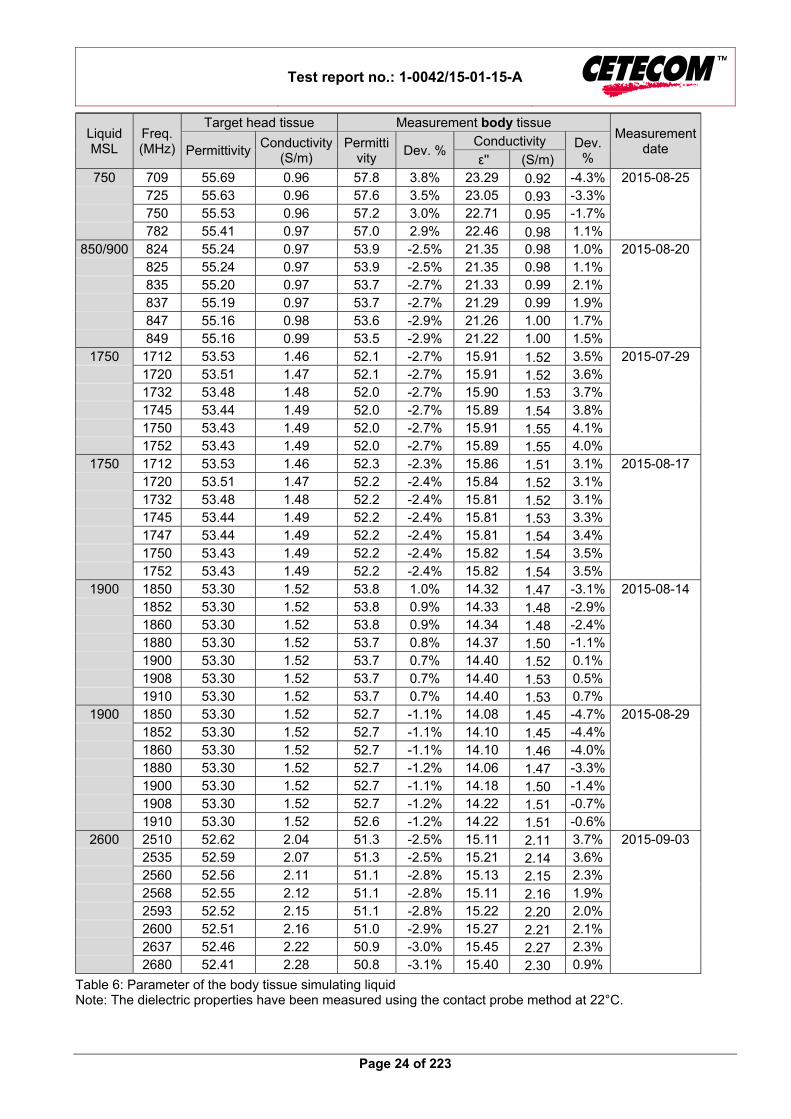
Liquid MSL
Freq. (MHz)
Target head tissue Measurement body tissue Measurement
date Permittivity Conductivity
(S/m) Permitti
vity Dev. %
Conductivity Dev. % ε'' (S/m)
750 709 55.69 0.96 57.8 3.8% 23.29 0.92 -4.3% 2015-08-25 725 55.63 0.96 57.6 3.5% 23.05 0.93 -3.3% 750 55.53 0.96 57.2 3.0% 22.71 0.95 -1.7% 782 55.41 0.97 57.0 2.9% 22.46 0.98 1.1%
850/900 824 55.24 0.97 53.9 -2.5% 21.35 0.98 1.0% 2015-08-20 825 55.24 0.97 53.9 -2.5% 21.35 0.98 1.1% 835 55.20 0.97 53.7 -2.7% 21.33 0.99 2.1% 837 55.19 0.97 53.7 -2.7% 21.29 0.99 1.9% 847 55.16 0.98 53.6 -2.9% 21.26 1.00 1.7% 849 55.16 0.99 53.5 -2.9% 21.22 1.00 1.5%
1750 1712 53.53 1.46 52.1 -2.7% 15.91 1.52 3.5% 2015-07-29 1720 53.51 1.47 52.1 -2.7% 15.91 1.52 3.6% 1732 53.48 1.48 52.0 -2.7% 15.90 1.53 3.7% 1745 53.44 1.49 52.0 -2.7% 15.89 1.54 3.8% 1750 53.43 1.49 52.0 -2.7% 15.91 1.55 4.1% 1752 53.43 1.49 52.0 -2.7% 15.89 1.55 4.0%
1750 1712 53.53 1.46 52.3 -2.3% 15.86 1.51 3.1% 2015-08-17 1720 53.51 1.47 52.2 -2.4% 15.84 1.52 3.1% 1732 53.48 1.48 52.2 -2.4% 15.81 1.52 3.1% 1745 53.44 1.49 52.2 -2.4% 15.81 1.53 3.3% 1747 53.44 1.49 52.2 -2.4% 15.81 1.54 3.4% 1750 53.43 1.49 52.2 -2.4% 15.82 1.54 3.5% 1752 53.43 1.49 52.2 -2.4% 15.82 1.54 3.5%
1900 1850 53.30 1.52 53.8 1.0% 14.32 1.47 -3.1% 2015-08-14 1852 53.30 1.52 53.8 0.9% 14.33 1.48 -2.9% 1860 53.30 1.52 53.8 0.9% 14.34 1.48 -2.4% 1880 53.30 1.52 53.7 0.8% 14.37 1.50 -1.1% 1900 53.30 1.52 53.7 0.7% 14.40 1.52 0.1% 1908 53.30 1.52 53.7 0.7% 14.40 1.53 0.5% 1910 53.30 1.52 53.7 0.7% 14.40 1.53 0.7%
1900 1850 53.30 1.52 52.7 -1.1% 14.08 1.45 -4.7% 2015-08-29 1852 53.30 1.52 52.7 -1.1% 14.10 1.45 -4.4% 1860 53.30 1.52 52.7 -1.1% 14.10 1.46 -4.0% 1880 53.30 1.52 52.7 -1.2% 14.06 1.47 -3.3% 1900 53.30 1.52 52.7 -1.1% 14.18 1.50 -1.4% 1908 53.30 1.52 52.7 -1.2% 14.22 1.51 -0.7% 1910 53.30 1.52 52.6 -1.2% 14.22 1.51 -0.6%
2600 2510 52.62 2.04 51.3 -2.5% 15.11 2.11 3.7% 2015-09-03 2535 52.59 2.07 51.3 -2.5% 15.21 2.14 3.6% 2560 52.56 2.11 51.1 -2.8% 15.13 2.15 2.3% 2568 52.55 2.12 51.1 -2.8% 15.11 2.16 1.9% 2593 52.52 2.15 51.1 -2.8% 15.22 2.20 2.0% 2600 52.51 2.16 51.0 -2.9% 15.27 2.21 2.1% 2637 52.46 2.22 50.9 -3.0% 15.45 2.27 2.3% 2680 52.41 2.28 50.8 -3.1% 15.40 2.30 0.9%
Table 6: Parameter of the body tissue simulating liquid Note: The dielectric properties have been measured using the contact probe method at 22°C.

Test report no.: 1-0042/15-01-15-A
Page 25 of 223
Dielectric Parameters For Head Liquid
Liquid HSL
Freq. (MHz)
Measured HSL Target HSL
Devation (%)Date
Measured
Ƹ'ᵣ Ƹ''ᵣ σ
(S/m) Ƹ'ᵣ
σ (S/m)
Ƹ'ᵣ σ
(S/m)MM/DD/YY
2450
2400 37.61 13.28 1.77 39.3 1.76 -4.30 0.74
2425 37.53 13.34 1.80 39.2 1.78 -4.26 1.10 2450 37.43 13.41 1.83 39.2 1.80 -4.52 1.54 2480 37.31 13.49 1.86 39.2 1.83 -4.82 1.70 2400 38.06 13.23 1.77 39.3 1.76 -3.16 0.38
2450
2425 37.94 13.29 1.79 39.2 1.78 -3.22 0.72
15.09.2015 2450 37.92 13.37 1.82 39.2 1.80 -3.28 1.20 2480 37.77 13.42 1.85 39.2 1.83 -3.65 1.21 2400 37.61 13.28 1.77 39.3 1.76 -4.30 0.74 2425 37.53 13.34 1.80 39.2 1.78 -4.26 1.10
5200
5180 34.39 16.29 4.70 36.0 4.63 -4.47 1.41
08.09.2015 5200 34.35 16.30 4.71 36.0 4.66 -4.59 1.17 5240 34.25 16.35 4.77 35.9 4.70 -4.61 1.39 5280 34.18 16.36 4.81 35.9 4.74 -4.79 1.41 5320 34.11 16.40 4.85 35.8 4.78 -4.73 1.54
5200
5180 34.77 16.33 4.71 36.0 4.63 -3.42 1.64
14.09.2015 5200 34.71 16.35 4.73 36.0 4.66 -3.58 1.50 5240 34.65 16.39 4.78 35.9 4.70 -3.48 1.66 5280 34.56 16.43 4.83 35.9 4.74 -3.73 1.82 5320 34.50 16.47 4.87 35.8 4.78 -3.63 1.98
5500
5500 34.14 16.64 5.09 35.6 4.96 -4.10 2.65
09.09.2015 5580 33.92 16.67 5.17 35.6 5.04 -4.72 2.67 5640 33.87 16.74 5.25 35.5 5.11 -4.59 2.79 5720 33.64 16.76 5.33 35.4 5.19 -4.97 2.76
5500
5500 34.21 16.62 5.09 35.6 4.96 -3.90 2.53
14.09.2015 5580 34.06 16.69 5.18 35.6 5.04 -4.33 2.80 5640 33.98 16.72 5.25 35.5 5.11 -4.28 2.66 5720 33.82 16.81 5.35 35.4 5.19 -4.46 3.07
5800
5745 33.85 16.91 5.40 35.4 5.21 -4.38 3.73
09.09.2015 5775 33.79 16.94 5.44 35.3 5.24 -4.28 3.86 5800 33.72 16.94 5.47 35.3 5.27 -4.48 3.72 5825 33.65 16.97 5.50 35.3 5.30 -4.67 3.76
5800
5745 33.76 16.80 5.37 35.4 5.21 -4.63 3.06
14.09.2015 5775 33.70 16.84 5.41 35.3 5.24 -4.53 3.25 5800 33.66 16.87 5.44 35.3 5.27 -4.65 3.29 5825 33.63 16.88 5.47 35.3 5.30 -4.73 3.21
Table 7: Parameter of the head tissue simulating liquid tested by applicant itself.

Test report no.: 1-0042/15-01-15-A
Page 26 of 223
Dielectric Parameters For Muscle Liquid
Liquid MSL
Freq. (MHz)
Measured MSL Target MSL
Devation (%) Date
Measured
Ƹ'ᵣ Ƹ''ᵣ σ
(S/m) Ƹ'ᵣ
σ (S/m)
Ƹ'ᵣ σ
(S/m) MM/DD/YY
2450
2400 50.77 14.61 1.95 52.8 1.90 -3.84 2.67
2425 50.67 14.71 1.98 52.7 1.93 -3.85 2.82 2450 50.59 14.82 2.02 52.7 1.95 -4.00 3.59 2480 50.47 14.92 2.06 52.7 1.99 -4.23 3.44
2450
2400 50.52 14.66 1.96 52.8 1.90 -4.33 3.05
15.09.2015 2425 50.40 14.70 1.98 52.7 1.93 -4.36 2.76 2450 50.40 14.81 2.02 52.7 1.95 -4.37 3.50 2480 50.24 14.88 2.05 52.7 1.99 -4.66 3.16
5200
5180 46.86 19.21 5.54 49.0 5.28 -4.37 4.84
09.09.2015 5200 46.81 19.22 5.56 49.0 5.30 -4.47 4.91 5240 46.72 19.23 5.61 49.0 5.35 -4.65 4.78 5280 46.62 19.26 5.66 48.9 5.39 -4.66 4.96 5320 46.52 19.30 5.71 48.9 5.44 -4.87 4.99
5500
5500 46.68 19.15 5.86 48.6 5.65 -3.95 3.71
09.09.2015 5580 46.65 19.25 5.98 48.5 5.74 -3.81 4.11 5640 46.60 19.31 6.06 48.4 5.81 -3.72 4.28 5720 46.42 19.36 6.16 48.3 5.91 -3.89 4.24
5800
5745 46.41 19.39 6.20 48.3 5.94 -3.91 4.33
09.09.2015 5775 46.38 19.43 6.24 48.2 5.97 -3.78 4.56 5800 46.32 19.43 6.27 48.2 6.00 -3.90 4.49 5825 46.24 19.45 6.30 48.2 6.03 -4.07 4.52
Table 8: Parameter of the body tissue simulating liquid tested by applicant itself.

Test report no.: 1-0042/15-01-15-A
Page 27 of 223
6.1.11 Measurement uncertainty evaluation for SAR test
DASY5 Uncertainty Budget
According to IEEE 1528/2003 and IEC 62209-1 for the 300 MHz - 3 GHz range
ncertainty Valu Divisor ci ci Standard Uncertainty
± % (1g) (10g) ± %, (1g) ± %, (10g)
Measurement SystemProbe calibration ± 6.0 % Normal 1 1 1 ± 6.0 % ± 6.0 % ∞Axial isotropy ± 4.7 % Rectangular √ 3 0.7 0.7 ± 1.9 % ± 1.9 % ∞Hemispherical isotropy ± 9.6 % Rectangular √ 3 0.7 0.7 ± 3.9 % ± 3.9 % ∞Boundary effects ± 1.0 % Rectangular √ 3 1 1 ± 0.6 % ± 0.6 % ∞Probe linearity ± 4.7 % Rectangular √ 3 1 1 ± 2.7 % ± 2.7 % ∞System detection limits ± 1.0 % Rectangular √ 3 1 1 ± 0.6 % ± 0.6 % ∞Readout electronics ± 0.3 % Normal 1 1 1 ± 0.3 % ± 0.3 % ∞Response time ± 0.8 % Rectangular √ 3 1 1 ± 0.5 % ± 0.5 % ∞Integration time ± 2.6 % Rectangular √ 3 1 1 ± 1.5 % ± 1.5 % ∞RF ambient noise ± 3.0 % Rectangular √ 3 1 1 ± 1.7 % ± 1.7 % ∞RF ambient reflections ± 3.0 % Rectangular √ 3 1 1 ± 1.7 % ± 1.7 % ∞Probe positioner ± 0.4 % Rectangular √ 3 1 1 ± 0.2 % ± 0.2 % ∞Probe positioning ± 2.9 % Rectangular √ 3 1 1 ± 1.7 % ± 1.7 % ∞Max.SAR evaluation ± 1.0 % Rectangular √ 3 1 1 ± 0.6 % ± 0.6 % ∞Test Sample RelatedDevice positioning ± 2.9 % Normal 1 1 1 ± 2.9 % ± 2.9 % 145Device holder uncertainty ± 3.6 % Normal 1 1 1 ± 3.6 % ± 3.6 % 5Power drift ± 5.0 % Rectangular √ 3 1 1 ± 2.9 % ± 2.9 % ∞Phantom and Set-upPhantom uncertainty ± 4.0 % Rectangular √ 3 1 1 ± 2.3 % ± 2.3 % ∞Liquid conductivity (target) ± 5.0 % Rectangular √ 3 0.64 0.43 ± 1.8 % ± 1.2 % ∞Liquid conductivity (meas.) ± 5.0 % Rectangular √ 3 0.64 0.43 ± 1.8 % ± 1.2 % ∞Liquid permittivity (target) ± 5.0 % Rectangular √ 3 0.6 0.49 ± 1.7 % ± 1.4 % ∞Liquid permittivity (meas.) ± 5.0 % Rectangular √ 3 0.6 0.49 ± 1.7 % ± 1.4 % ∞Combined Std. ± 11.1 % ± 10.8 % 387Expanded Std. ± 22.1 % ± 21.6 %
Source ofuncertainty
Probability Distribution
vi2 or
veff
Table 9: Measurement uncertainties Worst-Case uncertainty budget for DASY5 assessed according to IEEE 1528/2003. The budget is valid for 2G and 3G communication signals and frequency range 300MHz - 3 GHz. For these conditions it represents a worst-case analysis. For specifc tests and configurations, the uncertainty could be considerable smaller.

Test report no.: 1-0042/15-01-15-A
Page 28 of 223
Relative DASY5 Uncertainty Budget for SAR Tests
According to IEEE 1528/2013 and IEC62209/2011 for the 0.3 - 3GHz range
ncertainty Valu Divisor ci ci Standard Uncertainty
± % (1g) (10g) ± %, (1g) ± %, (10g)
Measurement SystemProbe calibration ± 6.0 % Normal 1 1 1 ± 6.0 % ± 6.0 % ∞Axial isotropy ± 4.7 % Rectangular √ 3 0.7 0.7 ± 1.9 % ± 1.9 % ∞Hemispherical isotropy ± 9.6 % Rectangular √ 3 0.7 0.7 ± 3.9 % ± 3.9 % ∞Boundary effects ± 1.0 % Rectangular √ 3 1 1 ± 0.6 % ± 0.6 % ∞Probe linearity ± 4.7 % Rectangular √ 3 1 1 ± 2.7 % ± 2.7 % ∞System detection limits ± 1.0 % Rectangular √ 3 1 1 ± 0.6 % ± 0.6 % ∞Modulation Response ± 2.4 % Rectangular √ 3 1 1 ± 1.4 % ± 1.4 % ∞Readout electronics ± 0.3 % Normal 1 1 1 ± 0.3 % ± 0.3 % ∞Response time ± 0.8 % Rectangular √ 3 1 1 ± 0.5 % ± 0.5 % ∞Integration time ± 2.6 % Rectangular √ 3 1 1 ± 1.5 % ± 1.5 % ∞RF ambient noise ± 3.0 % Rectangular √ 3 1 1 ± 1.7 % ± 1.7 % ∞RF ambient reflections ± 3.0 % Rectangular √ 3 1 1 ± 1.7 % ± 1.7 % ∞Probe positioner ± 0.4 % Rectangular √ 3 1 1 ± 0.2 % ± 0.2 % ∞Probe positioning ± 2.9 % Rectangular √ 3 1 1 ± 1.7 % ± 1.7 % ∞Max. SAR evaluation ± 2.0 % Rectangular √ 3 1 1 ± 1.2 % ± 1.2 % ∞Test Sample RelatedDevice positioning ± 2.9 % Normal 1 1 1 ± 2.9 % ± 2.9 % 145Device holder uncertainty ± 3.6 % Normal 1 1 1 ± 3.6 % ± 3.6 % 5Power drift ± 5.0 % Rectangular √ 3 1 1 ± 2.9 % ± 2.9 % ∞Phantom and Set-upPhantom uncertainty ± 6.1 % Rectangular √ 3 1 1 ± 3.5 % ± 3.5 % ∞SAR correction ± 1.9 % Rectangular √ 3 1 0.84 ± 1.1 % ± 0.9 % ∞Liquid conductivity (meas.) ± 5.0 % Rectangular √ 3 0.78 0.71 ± 2.3 % ± 2.0 % ∞Liquid permittivity (meas.) ± 5.0 % Rectangular √ 3 0.26 0.26 ± 0.8 % ± 0.8 % ∞Temp. Unc. - Conductivity ± 3.4 % Rectangular √ 3 0.78 0.71 ± 1.5 % ± 1.4 % ∞Temp. Unc. - Permittivity ± 0.4 % Rectangular √ 3 0.23 0.26 ± 0.1 % ± 0.1 % ∞Combined Uncertainty ± 11.3 % ± 11.3 % 330Expanded Std. Uncertainty
± 22.7 % ± 22.5 %
Error DescriptionProbability Distribution
vi2 or
veff
Table 10: Measurement uncertainties Worst-Case uncertainty budget for DASY5 assessed according to IEEE 1528/2013 and IEC 62209-1/2011 standards. The budget is valid for the frequency range 300MHz -3 GHz and represents a worst-case analysis. For specific tests and configurations, the uncertainty could be considerable smaller.

Test report no.: 1-0042/15-01-15-A
Page 29 of 223
DASY5 Uncertainty Budget
According to IEC 62209-2/2010 for the 300 MHz - 6 GHz rangeDivisor ci ci Standard Uncertainty
(1g) (10g) ± %, (1g) ± %, (10g)
Measurement SystemProbe calibration ± 6.6 % Normal 1 1 1 ± 6.6 % ± 6.6 % ∞Axial isotropy ± 4.7 % Rectangular √ 3 0.7 0.7 ± 1.9 % ± 1.9 % ∞Hemispherical isotropy ± 9.6 % Rectangular √ 3 0.7 0.7 ± 3.9 % ± 3.9 % ∞Boundary effects ± 2.0 % Rectangular √ 3 1 1 ± 1.2 % ± 1.2 % ∞Probe linearity ± 4.7 % Rectangular √ 3 1 1 ± 2.7 % ± 2.7 % ∞System detection limits ± 1.0 % Rectangular √ 3 1 1 ± 0.6 % ± 0.6 % ∞Modulation Response ± 2.4 % Rectangular √ 3 1 1 ± 1.4 % ± 1.4 % ∞Readout electronics ± 0.3 % Normal 1 1 1 ± 0.3 % ± 0.3 % ∞Response time ± 0.8 % Rectangular √ 3 1 1 ± 0.5 % ± 0.5 % ∞Integration time ± 2.6 % Rectangular √ 3 1 1 ± 1.5 % ± 1.5 % ∞RF ambient noise ± 3.0 % Rectangular √ 3 1 1 ± 1.7 % ± 1.7 % ∞RF ambient reflections ± 3.0 % Rectangular √ 3 1 1 ± 1.7 % ± 1.7 % ∞Probe positioner ± 0.8 % Rectangular √ 3 1 1 ± 0.5 % ± 0.5 % ∞Probe positioning ± 6.7 % Rectangular √ 3 1 1 ± 3.9 % ± 3.9 % ∞Post-processing ± 4.0 % Rectangular √ 3 1 1 ± 2.3 % ± 2.3 % ∞Test Sample RelatedDevice positioning ± 2.9 % Normal 1 1 1 ± 2.9 % ± 2.9 % 145Device holder uncertainty ± 3.6 % Normal 1 1 1 ± 3.6 % ± 3.6 % 5Power drift ± 5.0 % Rectangular √ 3 1 1 ± 2.9 % ± 2.9 % ∞Phantom and Set-upPhantom uncertainty ± 7.9 % Rectangular √ 3 1 1 ± 4.6 % ± 4.6 % ∞SAR correction ± 1.9 % Rectangular √ 3 1 0.84 ± 1.1 % ± 0.9 % ∞Liquid conductivity (meas.) ± 5.0 % Rectangular √ 3 0.78 0.71 ± 2.3 % ± 2.0 % ∞Liquid permittivity (meas.) ± 5.0 % Rectangular √ 3 0.26 0.26 ± 0.8 % ± 0.8 % ∞Temp. Unc. - Conductivity ± 3.4 % Rectangular √ 3 0.78 0.71 ± 1.5 % ± 1.4 % ∞Temp. Unc. - Permittivity ± 0.4 % Rectangular √ 3 0.23 0.26 ± 0.1 % ± 0.1 % ∞Combined Uncertainty ± 12.7 % ± 12.6 % 330Expanded Std. Uncertainty
± 25.4 % ± 25.3 %
Source ofuncertainty
Probability Distribution
vi2 or
veff
Uncertainty Value
Table 11: Measurement uncertainties. Worst-Case uncertainty budget for DASY5 assessed according to according to IEC 62209-2/2010 standard. The budget is valid for the frequency range 300MHz - 6 GHz and represents a worst-case analysis. For specific tests and configurations, the uncertainty could be considerable smaller.

Test report no.: 1-0042/15-01-15-A
Page 30 of 223
Divisor ci ci
(1g) (10g) ± %, (1g) ± %, (10g)
Measurement SystemProbe calibration ± 6.6 % Normal 1 1 1 ± 6.6 % ± 6.6 % ∞Axial isotropy ± 4.7 % Rectangular √ 3 0.7 0.7 ± 1.9 % ± 1.9 % ∞Hemispherical isotropy ± 9.6 % Rectangular √ 3 0.7 0.7 ± 3.9 % ± 3.9 % ∞Boundary effects ± 2.0 % Rectangular √ 3 1 1 ± 1.2 % ± 1.2 % ∞Probe linearity ± 4.7 % Rectangular √ 3 1 1 ± 2.7 % ± 2.7 % ∞System detection limits ± 1.0 % Rectangular √ 3 1 1 ± 0.6 % ± 0.6 % ∞Readout electronics ± 0.3 % Normal 1 1 1 ± 0.3 % ± 0.3 % ∞Response time ± 0.8 % Rectangular √ 3 1 1 ± 0.5 % ± 0.5 % ∞Integration time ± 2.6 % Rectangular √ 3 1 1 ± 1.5 % ± 1.5 % ∞RF ambient noise ± 3.0 % Rectangular √ 3 1 1 ± 1.7 % ± 1.7 % ∞RF ambient reflections ± 3.0 % Rectangular √ 3 1 1 ± 1.7 % ± 1.7 % ∞Probe positioner ± 0.8 % Rectangular √ 3 1 1 ± 0.5 % ± 0.5 % ∞Probe positioning ± 6.7 % Rectangular √ 3 1 1 ± 3.9 % ± 3.9 % ∞Max. SAR evaluation ± 4.0 % Rectangular √ 3 1 1 ± 2.3 % ± 2.3 % ∞Test Sample RelatedDevice positioning ± 2.9 % Normal 1 1 1 ± 2.9 % ± 2.9 % 145Device holder uncertainty ± 3.6 % Normal 1 1 1 ± 3.6 % ± 3.6 % 5Power drift ± 5.0 % Rectangular √ 3 1 1 ± 2.9 % ± 2.9 % ∞Phantom and Set-upPhantom uncertainty ± 4.0 % Rectangular √ 3 1 1 ± 2.3 % ± 2.3 % ∞Liquid conductivity (target) ± 5.0 % Rectangular √ 3 0.64 0.43 ± 1.8 % ± 1.2 % ∞Liquid conductivity (meas.) ± 5.0 % Rectangular √ 3 0.64 0.43 ± 1.8 % ± 1.2 % ∞Liquid permittivity (target) ± 5.0 % Rectangular √ 3 0.6 0.49 ± 1.7 % ± 1.4 % ∞Liquid permittivity (meas.) ± 5.0 % Rectangular √ 3 0.6 0.49 ± 1.7 % ± 1.4 % ∞Combined Uncertainty ± 12.1 % ± 11.9 % 330Expanded Std. Uncertainty
± 24.3 % ± 23.8 %
Relative DASY5 Uncertainty Budget for SAR Tests
Error DescriptionProbability Distribution
vi2 or
veff
Standard UncertaintyUncertainty Value
According to IEEE 1528/2003 and IEC 62209-1 for the 3 - 6 GHz range
Table 12: Measurement uncertainties Worst-Case uncertainty budget for DASY5 valid for 3G communication signals and frequency range 3 - 6 GHz. Probe calibration error reflects uncertainty of the EX3D probe. For specific tests and configurations, the uncertainty could be considerable smaller.

Test report no.: 1-0042/15-01-15-A
Page 31 of 223
Divisor ci ci
(1g) (10g) ± %, (1g) ± %, (10g)
Measurement SystemProbe calibration ± 6.6 % Normal 1 1 1 ± 6.6 % ± 6.6 % ∞Axial isotropy ± 4.7 % Rectangular √ 3 0.7 0.7 ± 1.9 % ± 1.9 % ∞Hemispherical isotropy ± 9.6 % Rectangular √ 3 0.7 0.7 ± 3.9 % ± 3.9 % ∞Boundary effects ± 2.0 % Rectangular √ 3 1 1 ± 1.2 % ± 1.2 % ∞Probe linearity ± 4.7 % Rectangular √ 3 1 1 ± 2.7 % ± 2.7 % ∞System detection limits ± 1.0 % Rectangular √ 3 1 1 ± 0.6 % ± 0.6 % ∞Modulation Response ± 2.4 % Rectangular √ 3 1 1 ± 1.4 % ± 1.4 % ∞Readout electronics ± 0.3 % Normal 1 1 1 ± 0.3 % ± 0.3 % ∞Response time ± 0.8 % Rectangular √ 3 1 1 ± 0.5 % ± 0.5 % ∞Integration time ± 2.6 % Rectangular √ 3 1 1 ± 1.5 % ± 1.5 % ∞RF ambient noise ± 3.0 % Rectangular √ 3 1 1 ± 1.7 % ± 1.7 % ∞RF ambient reflections ± 3.0 % Rectangular √ 3 1 1 ± 1.7 % ± 1.7 % ∞Probe positioner ± 0.8 % Rectangular √ 3 1 1 ± 0.5 % ± 0.5 % ∞Probe positioning ± 6.7 % Rectangular √ 3 1 1 ± 3.9 % ± 3.9 % ∞Max. SAR evaluation ± 4.0 % Rectangular √ 3 1 1 ± 2.3 % ± 2.3 % ∞Test Sample RelatedDevice positioning ± 2.9 % Normal 1 1 1 ± 2.9 % ± 2.9 % 145Device holder uncertainty ± 3.6 % Normal 1 1 1 ± 3.6 % ± 3.6 % 5Power drift ± 5.0 % Rectangular √ 3 1 1 ± 2.9 % ± 2.9 % ∞Phantom and Set-upPhantom uncertainty ± 6.6 % Rectangular √ 3 1 1 ± 3.8 % ± 3.8 % ∞SAR correction ± 1.9 % Rectangular √ 3 1 0.84 ± 1.1 % ± 0.9 % ∞Liquid conductivity (meas.) ± 5.0 % Rectangular √ 3 0.78 0.71 ± 2.3 % ± 2.0 % ∞Liquid permittivity (meas.) ± 5.0 % Rectangular √ 3 0.26 0.26 ± 0.8 % ± 0.8 % ∞Temp. Unc. - Conductivity ± 3.4 % Rectangular √ 3 0.78 0.71 ± 1.5 % ± 1.4 % ∞Temp. Unc. - Permittivity ± 0.4 % Rectangular √ 3 0.23 0.26 ± 0.1 % ± 0.1 % ∞Combined Uncertainty ± 12.4 % ± 12.4 % 330Expanded Std. Uncertainty
± 24.9 % ± 24.8 %
Relative DASY5 Uncertainty Budget for SAR Tests
Error DescriptionProbability Distribution
vi2 or
veff
Standard UncertaintyUncertainty Value
According to IEEE 1528/2013 and IEC62209-1/2011 (3-6GHz range)
Table 13: Measurement uncertainties Worst-Case uncertainty budget for DASY5 assessed according to IEEE 1528/2013 and IEC 62209-1/2011 standards. The budget is valid for the frequency range 3GHz -6GHz and represents a worst-case analysis. For specific tests and configurations, the uncertainty could be considerable smaller.

Test report no.: 1-0042/15-01-15-A
Page 32 of 223
6.1.12 Measurement uncertainty evaluation for System Check
Divisor ci ci
(1g) (10g)
Measurement SystemProbe calibration ± 6.0 % Normal 1 1 1 ± 6.0 % ± 6.0 % ∞Axial isotropy ± 4.7 % Rectangular √ 3 0.7 0.7 ± 1.9 % ± 1.9 % ∞Hemispherical isotropy ± 0.0 % Rectangular √ 3 0.7 0.7 ± 0.0 % ± 0.0 % ∞Boundary effects ± 1.0 % Rectangular √ 3 1 1 ± 0.6 % ± 0.6 % ∞Probe linearity ± 4.7 % Rectangular √ 3 1 1 ± 2.7 % ± 2.7 % ∞System detection limits ± 1.0 % Rectangular √ 3 1 1 ± 0.6 % ± 0.6 % ∞Readout electronics ± 0.3 % Normal 1 1 1 ± 0.3 % ± 0.3 % ∞Response time ± 0.0 % Rectangular √ 3 1 1 ± 0.0 % ± 0.0 % ∞Integration time ± 0.0 % Rectangular √ 3 1 1 ± 0.0 % ± 0.0 % ∞RF ambient conditions ± 3.0 % Rectangular √ 3 1 1 ± 1.7 % ± 1.7 % ∞Probe positioner ± 0.4 % Rectangular √ 3 1 1 ± 0.2 % ± 0.2 % ∞Probe positioning ± 2.9 % Rectangular √ 3 1 1 ± 1.7 % ± 1.7 % ∞Max. SAR evaluation ± 1.0 % Rectangular √ 3 1 1 ± 0.6 % ± 0.6 % ∞Test Sample RelatedDev. of experimental dipole ± 0.0 % Rectangular √ 3 1 1 ± 0.0 % ± 0.0 % ∞Source to liquid distance ± 2.0 % Rectangular √ 3 1 1 ± 1.2 % ± 1.2 % ∞Power drift ± 3.4 % Rectangular √ 3 1 1 ± 2.0 % ± 2.0 % ∞Phantom and Set-upPhantom uncertainty ± 4.0 % Rectangular √ 3 1 1 ± 2.3 % ± 2.3 % ∞SAR correction ± 1.9 % Rectangular √ 3 1 0.84 ± 1.1 % ± 0.9 % ∞Liquid conductivity (meas.) ± 5.0 % Normal 1 0.78 0.71 ± 3.9 % ± 3.6 % ∞Liquid permittivity (meas.) ± 5.0 % Normal 1 0.26 0.26 ± 1.3 % ± 1.3 % ∞Temp. unc. - Conductivity ± 1.7 % Rectangular √ 3 0.78 0.71 ± 0.8 % ± 0.7 % ∞Temp. unc. - Permittivity ± 0.3 % Rectangular √ 3 0.23 0.26 ± 0.0 % ± 0.0 % ∞Combined Uncertainty ± 9.1 % ± 8.9 % 330Expanded Std. Uncertainty
± 18.2 % ± 17.9 %
for the 0.3 - 3 GHz rangeUncertainty of a System Performance Check with DASY5 System
Source ofuncertainty
Probability Distribution
vi2 or
veff
Uncertainty Value
Standard Uncertainty
± %, (1g) ± %, (10g)
Table 14: Measurement uncertainties of the System Check with DASY5 (0.3-3GHz)

Test report no.: 1-0042/15-01-15-A
Page 33 of 223
Divisor ci ci
(1g) (10g)
Measurement SystemProbe calibration ± 6.6 % Normal 1 1 1 ± 6.6 % ± 6.6 % ∞Axial isotropy ± 4.7 % Rectangular √ 3 0.7 0.7 ± 1.9 % ± 1.9 % ∞Hemispherical isotropy ± 0.0 % Rectangular √ 3 0.7 0.7 ± 0.0 % ± 0.0 % ∞Boundary effects ± 1.0 % Rectangular √ 3 1 1 ± 0.6 % ± 0.6 % ∞Probe linearity ± 4.7 % Rectangular √ 3 1 1 ± 2.7 % ± 2.7 % ∞System detection limits ± 1.0 % Rectangular √ 3 1 1 ± 0.6 % ± 0.6 % ∞Readout electronics ± 0.3 % Normal 1 1 1 ± 0.3 % ± 0.3 % ∞Response time ± 0.0 % Rectangular √ 3 1 1 ± 0.0 % ± 0.0 % ∞Integration time ± 0.0 % Rectangular √ 3 1 1 ± 0.0 % ± 0.0 % ∞RF ambient conditions ± 3.0 % Rectangular √ 3 1 1 ± 1.7 % ± 1.7 % ∞Probe positioner ± 0.8 % Rectangular √ 3 1 1 ± 0.5 % ± 0.5 % ∞Probe positioning ± 6.7 % Rectangular √ 3 1 1 ± 3.9 % ± 3.9 % ∞Max. SAR evaluation ± 1.0 % Rectangular √ 3 1 1 ± 0.6 % ± 0.6 % ∞Test Sample RelatedDev. of experimental dipole ± 0.0 % Rectangular √ 3 1 1 ± 0.0 % ± 0.0 % ∞Source to liquid distance ± 2.0 % Rectangular √ 3 1 1 ± 1.2 % ± 1.2 % ∞Power drift ± 3.4 % Rectangular √ 3 1 1 ± 2.0 % ± 2.0 % ∞Phantom and Set-upPhantom uncertainty ± 4.0 % Rectangular √ 3 1 1 ± 2.3 % ± 2.3 % ∞SAR correction ± 1.9 % Rectangular √ 3 1 0.84 ± 1.1 % ± 0.9 % ∞Liquid conductivity (meas.) ± 5.0 % Normal 1 0.78 0.71 ± 3.9 % ± 3.6 % ∞Liquid permittivity (meas.) ± 5.0 % Normal 1 0.26 0.26 ± 1.3 % ± 1.3 % ∞Temp. unc. - Conductivity ± 1.7 % Rectangular √ 3 0.78 0.71 ± 0.8 % ± 0.7 % ∞Temp. unc. - Permittivity ± 0.3 % Rectangular √ 3 0.23 0.26 ± 0.0 % ± 0.0 % ∞Combined Uncertainty ± 10.1 % ± 10.0 % 330Expanded Std. Uncertainty
± 20.2 % ± 19.9 %
for the 3 - 6 GHz rangeUncertainty of a System Performance Check with DASY5 System
Source ofuncertainty
Probability Distribution
vi2 or
veff
Uncertainty Value
Standard Uncertainty
± %, (1g) ± %, (10g)
Table 15: Measurement uncertainties of the System Check with DASY5 (3-6GHz) Note: Worst case probe calibration uncertainty has been applied for all probes used during the measurements.

Test report no.: 1-0042/15-01-15-A
Page 34 of 223
6.1.13 System check
The system check is performed for verifying the accuracy of the complete measurement system and performance of the software. The system check is performed with tissue equivalent material according to IEEE 1528. The following table shows system check results for all frequency bands and tissue liquids used during the tests (plot(s) see annex A).
System performence check (1000 mW)
System validation
Kit Probe Frequency
Target SAR1g /mW/g
(+/- 10%)
Target SAR10g /mW/g
(+/- 10%)
Measured SAR1g / mW/g
SAR1g dev.
Measured SAR10g / mW/g
SAR10g dev.
Measured date
D750V3 S/N: 1041
ES3DV3 S/N: 3320
750 MHz head
8.52 5.56 8.41 -1.3% 5.56 0.0% 2015-08-24
D750V3 S/N: 1041
ES3DV3 S/N: 3320
750 MHz head
8.52 5.56 8.35 -2.0% 5.53 -0.5% 2015-08-25
D750V3 S/N: 1041
ET3DV6 S/N: 1554
750 MHz body
8.75 5.79 8.24 -5.8% 5.61 -3.1% 2015-08-25
D750V3 S/N: 1041
ET3DV6 S/N: 1554
750 MHz body
8.75 5.79 8.28 -5.4% 5.62 -2.9% 2015-08-26
D750V3 S/N: 1041
ET3DV6 S/N: 1554
750 MHz body
8.75 5.79 8.29 -5.3% 5.62 -2.9% 2015-08-27
D835V2 S/N: 4d153
ET3DV6 S/N: 1554
835 MHz head
9.58 6.21 9.82 2.5% 6.51 4.8% 2015-08-19
D835V2 S/N: 4d153
ET3DV6 S/N: 1554
835 MHz head
9.58 6.21 9.85 2.8% 6.54 5.3% 2015-08-21
D835V2 S/N: 4d153
ES3DV3 S/N: 3320
835 MHz body
9.40 6.12 9.80 4.3% 6.50 6.2% 2015-08-20
D835V2 S/N: 4d153
ES3DV3 S/N: 3320
835 MHz body
9.40 6.12 9.88 5.1% 6.53 6.7% 2015-08-21
D1750V2 S/N: 1093
ES3DV3 S/N: 3326
1750 MHz head
37.20 19.90 35.40 -4.8% 19.00 -4.5% 2015-07-31
D1750V2 S/N: 1093
ES3DV3 S/N: 3320
1750 MHz head
37.20 19.90 36.00 -3.2% 19.30 -3.0% 2015-08-04
D1750V2 S/N: 1093
ES3DV3 S/N: 3326
1750 MHz body
37.50 20.30 37.70 0.5% 20.10 -1.0% 2015-07-29
D1750V2 S/N: 1093
ET3DV6 S/N: 1554
1750 MHz body
37.50 20.30 35.80 -4.5% 20.00 -1.5% 2015-08-17
D1750V2 S/N: 1093
ET3DV6 S/N: 1554
1750 MHz body
37.50 20.30 35.80 -4.5% 20.00 -1.5% 2015-08-18
D1750V2 S/N: 1093
ET3DV6 S/N: 1554
1750 MHz body
37.50 20.30 34.60 -7.7% 19.30 -4.9% 2015-08-19
D1900V2 S/N: 5d009
ES3DV3 S/N: 3320
1900 MHz head
41.10 21.40 39.50 -3.9% 20.80 -2.8% 2015-07-29
D1900V2 S/N: 5d009
ES3DV3 S/N: 3320
1900 MHz head
41.10 21.40 39.20 -4.6% 20.70 -3.3% 2015-07-30
D1900V2 S/N: 5d009
ES3DV3 S/N: 3320
1900 MHz body
40.50 21.50 41.30 2.0% 22.10 2.8% 2015-08-14
D1900V2 S/N: 5d009
ES3DV3 S/N: 3320
1900 MHz body
40.50 21.50 41.20 1.7% 21.90 1.9% 2015-08-17
D1900V2 S/N: 5d009
ES3DV3 S/N: 3320
1900 MHz body
40.50 21.50 42.10 4.0% 22.30 3.7% 2015-08-18
D1900V2 S/N: 5d009
ES3DV3 S/N: 3320
1900 MHz body
40.50 21.50 42.50 4.9% 22.60 5.1% 2015-08-19
D1900V2 S/N: 5d009
EX3DV4 S/N: 3944
1900 MHz body
40.50 21.50 38.60 -4.7% 20.60 -4.2% 2015-08-29

Test report no.: 1-0042/15-01-15-A
Page 35 of 223
System performence check (1000 mW)
System validation
Kit Probe Frequency
Target SAR1g /mW/g
(+/- 10%)
Target SAR10g /mW/g
(+/- 10%)
Measured SAR1g / mW/g
SAR1g dev.
Measured SAR10g / mW/g
SAR10g dev.
Measured date
D2600V2 S/N: 1040
EX3DV4 S/N: 3944
2600 MHz head
58.00 26.10 55.80 -3.8% 24.70 -5.4% 2015-08-04
D2600V2 S/N: 1040
EX3DV4 S/N: 3944
2600 MHz head
56.90 25.90 59.80 5.1% 27.10 4.6% 2015-09-01
D2600V2 S/N: 1040
EX3DV4 S/N: 3944
2600 MHz body
56.80 25.90 54.80 -3.5% 24.30 -6.2% 2015-09-03
D2600V2 S/N: 1040
EX3DV4 S/N: 3944
2600 MHz body
56.80 25.90 56.80 0.0% 25.30 -2.3% 2015-09-04
D2600V2 S/N: 1040
EX3DV4 S/N: 3944
2600 MHz body
56.80 25.90 56.70 -0.2% 25.70 -0.8% 2015-09-05
Table 16: Results system check
System check performed by the applicant itself Measured Area &
Zoom Dev. (%)
Target Deviation (%)
Date MeasuredFreq.
(MHz) Dipole Serial
Probe Serial
Scan Type
SAR 1g
SAR 10g
Zoom Scan
1g 10g 1g 10g MM/DD/YY
2450 747 3225 Area 55.1 25.9
1.47
09.04.15 Zoom 54.3 25.6 52.8 24.6 2.84 4.07
2450 747 3225 Area 55.9 26.0
2.01
09.15.15 Zoom 54.8 25.8 52.8 24.6 3.79 4.88
5200 1033 3592 Area 78.4 22.0
-6.56
09.14.15 Zoom 83.9 24.3 79.4 22.6 5.67 7.52
5500 1033 3592 Area 85.8 23.7
-5.19
09.09.15 Zoom 90.5 25.9 84.4 23.9 7.23 8.37
5500 1033 3592 Area 85.6 23.9
-4.89
09.14.15 Zoom 90.0 26.1 84.4 23.9 6.64 9.21
5800 1033 3592 Area 82.7 23.0
-3.61
09.09.15 Zoom 85.8 24.6 79.4 22.6 8.06 8.85
5800 1033 3592 Area 83.0 22.8
-1.31
09.14.15 Zoom 84.1 24.2 79.4 22.6 5.92 7.08
Table 17: Results system check performed by the applicant itself

Test report no.: 1-0042/15-01-15-A
Page 36 of 223
6.1.14 System check procedure The system check is performed by using a validation dipole which is positioned parallel to the planar part of the SAM phantom at the reference point. The distance of the dipole to the SAM phantom is determined by a plexiglass spacer. The dipole is connected to the signal source consisting of signal generator and amplifier via a directional coupler, N-connector cable and adaption to SMA. It is fed with a power of 1000 mW for frequencies below 2 GHz or 100 mW for frequencies above 2 GHz. To adjust this power a power meter is used. The power sensor is connected to the cable before the system check to measure the power at this point and do adjustments at the signal generator. At the outputs of the directional coupler both return loss as well as forward power are controlled during the validation to make sure that emitted power at the dipole is kept constant. This can also be checked by the power drift measurement after the test (result on plot). System check results have to be equal or near the values determined during dipole calibration (target SAR in table above) with the relevant liquids and test system.

Test report no.: 1-0042/15-01-15-A
Page 37 of 223
6.1.15 System validation The system validation is performed in a similar way as a system check. It needs to be performed once a SAR measurement system has been established and allows an evaluation of the system accuracy with all components used together with the specified system. It has to be repeated at least once a year or when new system components are used (DAE, probe, phantom, dipole, liquid type). In addition to the procedure used during system check a system validation also includes checks of probe isotropy, probe modulation factor and RF signal. The following table lists the system validations relevant for this test report:
Frequency (MHz)
Test System DASY
SW Dipole
Type /SN
Probe Type /
SN
Calibrated signal type(s)
DAE unit Type / SN
head validation
body validation
750 Saarbrücken
/ SAR-1 V52.8.7
D750V2 / 1041
ES3DV3 / 1554
CW DAE3/
477 2015-06-17 2015-08-25
835 Saarbrücken
/ SAR-1 V52.8.7
D835V2 / 4d153
ES3DV3 / 1554
CW DAE3/
477 2015-08-19 2015-07-03
1750 Saarbrücken
/ SAR-1 V52.8.7
D1750V2 / 1093
ES3DV6 / 1554
CW DAE4/
477 2015-07-21 2015-07-24
750 Saarbrücken
/ SAR-2 V52.8.7
D750V2 / 1041
ES3DV3 / 3320
CW DAE3 /
413 2015-03-04 2015-03-13
835 Saarbrücken
/ SAR-2 V52.8.7
D835V2 / 4d153
ES3DV3 / 3320
CW DAE3 /
413 2015-03-13 2015-04-30
1750 Saarbrücken
/ SAR-2 V52.8.7
D1750V2 / 1093
ES3DV3 / 3320
CW DAE3 /
413 2015-07-22 2015-07-23
1900 Saarbrücken
/ SAR-2 V52.8.7
D1900V2 / 5d009
ES3DV3 / 3320
CW DAE3 /
413 2015-07-23 2015-08-01
1900 Saarbrücken
/ SAR-2 V52.8.7
D2450V2 / 710
EX3DV4 / 3944
CW DAE3 /
413 2015-08-02 2015-08-02
2450 Saarbrücken
/ SAR-2 V52.8.7
D2450V2 / 710
EX3DV4 / 3944
CW DAE3 /
413 2015-07-28 2015-06-17
2450 Saarbrücken
/ SAR-2 V52.8.7
D2450V2 / 710
EX3DV4 / 3944
CW DAE3 /
413 2015-08-28 2015-09-02
1750 Saarbrücken
/ SAR-3 V52.8.7
D1750V2 / 1093
ES3DV3 / 3326
CW DAE4/ 1387
2015-07-09 2015-07-08

Test report no.: 1-0042/15-01-15-A
Page 38 of 223
7 Detailed Test Results
7.1 Conducted power measurements For the measurements the Rohde & Schwarz Radio Communication Tester CMU 200 and CMW500 were used. The output power was measured using an integrated RF connector and attached RF cable. The conducted output power was also checked before and after each SAR measurement. The resulting power values were within a 0.2 dB tolerance of the values shown below. Note: CMU200 measures GSM peak and average output power for active timeslots.
For SAR the time based average power is relevant. The difference in-between depends on the duty cycle of the TDMA signal:
No. of timeslots 1 2 3 4 Duty Cycle 1 : 8 1: 4 1 : 2.66 1 : 2 time based avg. power compared to slotted avg. power
- 9.03 dB - 6.02 dB - 4.26 dB - 3.01 dB
The signalling modes differ as follows :
mode coding scheme modulation GPRS CS1 to CS4 GMSK
EGPRS (EDGE) MCS1 to MCS4 GMSK EGPRS (EDGE) MCS5 to MCS9 8PSK
Apart from modulation change (GMSK/8PSK) coding schemes differ in code rate without influence on the RF signal. Therefore one coding scheme per mode was selected for conducted power measurements.

Test report no.: 1-0042/15-01-15-A
Page 39 of 223
7.1.1 Conducted power measurements GSM 850 MHz
Conducted output power GSM 850 MHz (dBm) Slotted avg. power Time based avg. power
TS mod. upper limit
CH 128 CH 190 CH 251 CH 128 CH 190 CH 251 824.2 MHz 836.6 MHz 848.8 MHz 824.2 MHz 836.6 MHz 848.8 MHz
1 GMSK 34.5 33.6 33.6 33.1 24.57 24.57 24.07 2 GMSK 32.5 31.5 30.9 31.1 25.48 24.88 25.08 3 GMSK 31.0 29.4 28.6 28.6 25.14 24.34 24.34 4 GMSK 29.5 27.3 27.4 27.2 24.29 24.39 24.19 1 8PSK 28.5 27.0 26.5 26.4 17.97 17.47 17.37 2 8PSK 27.0 25.3 25.0 25.0 19.28 18.98 18.98 3 8PSK 25.5 23.8 23.5 23.4 19.54 19.24 19.14 4 8PSK 24.5 22.6 22.2 22.1 19.59 19.19 19.09
Table 18: Test results conducted power measurement GSM 850 MHz
Conducted output power GSM 850 MHz (dBm) DTM-Mode Slotted avg. power Time based avg. power
TS mod. upper limit
CH 128 CH 190 CH 251 CH 128 CH 190 CH 251 824.2 MHz 836.6 MHz 848.8 MHz 824.2 MHz 836.6 MHz 848.8 MHz
2 GMSK + 1GMSK 32.5 31.4 30.8 31.1 25.38 24.78 25.08 3 GMSK + 2GMSK 31.0 29.6 28.8 28.7 25.34 24.54 24.44 2 GMSK + 1 8PSK 32.5 25.5 25.2 25.2 19.48 19.18 19.18 3 GMSK + 2 8PSK 31.0 25.3 25.1 25.0 21.04 20.84 20.74
Table 19: Test results conducted power measurement GSM 850 MHz DTM-Mode 7.1.2 Conducted power measurements GSM 1900 MHz
Conducted output power GSM 1900 MHz (dBm) Slotted avg. power Time based avg. power
TS mod. upper limit
CH 512 CH 661 CH 810 CH 512 CH 661 CH 810 1850.2 MHz
1880.0 MHz
1909.8 MHz1850.2 MHz
1880.0 MHz
1909.8 MHz
1 GMSK 31.5 30.2 30.3 30.4 21.17 21.27 21.37 2 GMSK 30.5 29.2 29.2 29.4 23.18 23.18 23.38 3 GMSK 28.0 26.4 26.4 26.4 22.14 22.14 22.14 4 GMSK 27.5 26.0 26.0 26.0 22.99 22.99 22.99 1 8PSK 27.5 25.5 25.5 25.4 16.47 16.47 16.37 2 8PSK 26.0 24.1 24.0 23.8 18.08 17.98 17.78 3 8PSK 25.0 23.0 22.9 22.8 18.74 18.64 18.54 4 8PSK 24.0 21.7 21.6 21.6 18.69 18.59 18.59
Table 20: Test results conducted power measurement GSM 1900 MHz
Conducted output power GSM 1900 MHz (dBm) DTM-Mode Slotted avg. power Time based avg. power
TS mod. upper limit
CH 512 CH 661 CH 810 CH 512 CH 661 CH 810 1850.2 MHz
1880.0 MHz
1909.8 MHz
1850.2 MHz
1880.0 MHz
1909.8 MHz
2 GMSK + 1GMSK 30.5 29.1 29.2 29.3 23.08 23.18 23.28 3 GMSK + 2GMSK 28.0 26.6 26.5 26.6 22.34 22.24 22.34 2 GMSK + 1 8PSK 30.5 24.3 24.3 24.0 18.28 18.28 17.98 3 GMSK + 2 8PSK 28.0 24.2 24.2 24.0 19.94 19.94 19.74

Test report no.: 1-0042/15-01-15-A
Page 40 of 223
Table 21: Test results conducted power measurement GSM 1900 MHz DTM-Mode
Conducted output power GSM 1900 MHz (dBm) with Power Reduction Slotted avg. power Time based avg. power
TS mod. upper limit
CH 512 CH 661 CH 810 CH 512 CH 661 CH 810 1850.2 MHz
1880.0 MHz
1909.8 MHz1850.2 MHz
1880.0 MHz
1909.8 MHz
1 GMSK 31.5 30.3 30.4 29.9 21.27 21.37 20.87 2 GMSK 29.0 27.0 27.9 27.1 20.98 21.88 21.08 3 GMSK 27.0 25.5 25.6 25.5 21.24 21.34 21.24 4 GMSK 25.5 23.3 23.3 23.4 20.29 20.29 20.39 1 8PSK 27.5 25.5 25.5 25.4 16.47 16.47 16.37 2 8PSK 26.0 24.1 24.0 23.8 18.08 17.98 17.78 3 8PSK 25.0 23.0 22.9 22.8 18.74 18.64 18.54 4 8PSK 24.0 21.7 21.6 21.6 18.69 18.59 18.59
Table 22: Test results conducted power measurement GSM 1900 MHz with MHS back off mode active
Conducted output power GSM 1900 MHz (dBm) DTM-Mode with Power Reduction Slotted avg. power Time based avg. power
TS mod. upper limit
CH 512 CH 661 CH 810 CH 512 CH 661 CH 810 1850.2 MHz 1880.0 MHz 1909.8 MHz 1850.2 MHz 1880.0 MHz 1909.8 MHz
2 GMSK + 1GMSK 29.0 27.0 27.8 27.0 20.98 21.78 20.98 3 GMSK + 2GMSK 27.0 25.6 25.7 25.6 21.34 21.44 21.34 2 GMSK + 1 8PSK 29.0 24.4 24.3 24.2 18.38 18.28 18.18 3 GMSK + 2 8PSK 27.0 24.3 24.2 24.2 20.04 19.94 19.94
Table 23: Test results conducted power measurement GSM 850 MHz DTM-Mode with MHS back off mode active

Test report no.: 1-0042/15-01-15-A
Page 41 of 223
7.1.3 Conducted power measurements WCDMA FDD V (850 MHz)
Max. RMS output power 850 MHz (FDD V) / dBm
mode CH 4132 / 826.4 MHz CH 4182 / 836.6 MHz CH 4233 / 846.6 MHz
RMC 12.2 kbit/s 24.1 23.9 23.9
RMC 64 kbit/s 24.1 23.9 23.8
RMC 144 kbit/s 24.1 23.9 23.8
RMC 384 kbit/s 24.1 23.9 23.8
AMR 4.75 kbit/s 24.1 23.9 23.8
AMR 5.15 kbit/s 24.1 23.9 23.9
AMR 5.9 kbit/s 24.1 23.9 23.9
AMR 6.7 kbit/s 24.1 23.9 23.9
AMR 7.4 kbit/s 24.1 23.9 23.9
AMR 7.95 kbit/s 24.1 23.9 23.9
AMR 10.2 kbit/s 24.1 23.9 23.9
AMR 12.2 kbit/s 24.1 23.9 23.9
HSDPA Sub test 1 23.0 22.8 22.8
HSDPA Sub test 2 21.5 21.4 21.4
HSDPA Sub test 3 20.5 20.3 20.1
HSDPA Sub test 4 20.2 19.8 19.8
DC-HSDPA Sub test 1 22.8 22.7 22.7
DC-HSDPA Sub test 2 22.7 22.7 22.6
DC-HSDPA Sub test 3 22.1 22.1 22.0
DC-HSDPA Sub test 4 22.1 22.2 21.9
HSUPA Sub test 1 22.4 22.2 22.3
HSUPA Sub test 2 20.1 19.9 19.8
HSUPA Sub test 3 21.0 20.9 20.8
HSUPA Sub test 4 20.3 20.1 20.2
HSUPA Sub test 5 22.9 22.6 22.7
Table 24: Test results conducted power measurement UMTS FDD V 850MHz

Test report no.: 1-0042/15-01-15-A
Page 42 of 223
7.1.4 Conducted power measurements WCDMA FDD IV (1700 MHz)
Max. RMS output power FDD IV (1700MHz) / dBm
mode
Channel / frequency
1312 / 1712.4 MHz 1412 / 1732.4 MHz 1513 / 1752.6 MHz
full back off
diff. full back off
diff. full back off
diff.
RMC 12.2 kbit/s 24.1 21.5 2.6 23.9 21.3 2.6 23.7 21.1 2.6
RMC 64 kbit/s 24.1 21.4 2.7 23.9 21.2 2.7 23.7 21.0 2.7
RMC 144 kbit/s 24.0 21.4 2.6 23.9 21.3 2.6 23.7 21.1 2.6
RMC 384 kbit/s 24.1 21.4 2.7 23.8 21.1 2.7 23.6 20.9 2.7
AMR 4.75 kbit/s 24.0 21.4 2.6 23.9 21.3 2.6 23.7 21.1 2.6
AMR 5.15 kbit/s 24.1 21.5 2.6 23.8 21.2 2.6 23.6 21.0 2.6
AMR 5.9 kbit/s 24.0 21.2 2.8 23.8 21.0 2.8 23.6 20.8 2.8
AMR 6.7 kbit/s 24.0 21.4 2.6 23.8 21.2 2.6 23.6 21.0 2.6
AMR 7.4 kbit/s 24.0 21.4 2.6 23.9 21.3 2.6 23.7 21.1 2.6
AMR 7.95 kbit/s 24.1 21.4 2.7 23.8 21.1 2.7 23.6 20.9 2.7
AMR 10.2 kbit/s 24.0 21.4 2.6 23.7 21.1 2.6 23.6 21.0 2.6
AMR 12.2 kbit/s 24.1 21.5 2.6 23.7 21.1 2.6 23.7 21.1 2.6
HSDPA Sub test 1 22.9 20.4 2.5 22.6 20.0 2.6 22.5 20.0 2.5
HSDPA Sub test 2 21.4 18.7 2.7 21.3 18.8 2.5 21.1 18.6 2.5
HSDPA Sub test 3 21.0 18.4 2.6 20.7 18.1 2.6 20.6 17.9 2.7
HSDPA Sub test 4 19.8 17.2 2.6 19.6 17.0 2.6 19.5 16.7 2.8
DC-HSDPA Sub test 1 22.8 20.3 2.5 22.3 19.9 2.4 22.4 19.9 2.5
DC-HSDPA Sub test 2 22.8 20.3 2.5 22.2 19.9 2.3 22.3 19.8 2.5
DC-HSDPA Sub test 3 22.1 19.7 2.4 19.7 19.2 0.5 19.8 19.1 0.7
DC-HSDPA Sub test 4 22.2 19.8 2.4 19.7 19.2 0.5 19.7 19.2 0.5
HSUPA Sub test 1 22.4 19.9 2.5 22.3 19.7 2.6 21.4 18.8 2.6
HSUPA Sub test 2 20.8 18.1 2.7 20.7 18.1 2.6 20.6 17.8 2.8
HSUPA Sub test 3 22.0 19.4 2.6 21.7 19.0 2.7 21.4 19.3 2.1
HSUPA Sub test 4 20.3 17.5 2.8 21.1 18.4 2.7 20.9 18.3 2.6
HSUPA Sub test 5 23.0 20.2 2.8 22.4 19.7 2.7 22.5 19.8 2.7 Table 25: Test results conducted power measurement UMTS FDD IV 1700MHz measured with MHS back off mode active / inactive

Test report no.: 1-0042/15-01-15-A
Page 43 of 223
7.1.5 Conducted power measurements WCDMA FDD II (1900 MHz)
Max. RMS output power FDD II (1900MHz) / dBm
mode
Channel / frequency
9262 / 1852.4 MHz 9400 / 1880.0 MHz 9538 / 1907.6 MHz
full back off
diff. full back off
diff. full back off
diff.
RMC 12.2 kbit/s 23.9 21.8 2.1 24.6 21.5 3.1 23.9 21.2 2.7
RMC 64 kbit/s 23.8 21.7 2.1 24.6 21.4 3.2 23.9 21.2 2.7
RMC 144 kbit/s 23.8 21.7 2.1 24.6 21.4 3.2 23.9 21.2 2.7
RMC 384 kbit/s 23.7 21.7 2.0 24.6 21.4 3.2 23.9 21.2 2.7
AMR 4.75 kbit/s 23.7 21.7 2.0 24.5 21.4 3.1 23.8 21.2 2.6
AMR 5.15 kbit/s 23.8 21.7 2.1 24.6 21.5 3.1 23.9 21.2 2.7
AMR 5.9 kbit/s 23.8 21.7 2.1 24.6 21.5 3.1 23.9 21.2 2.7
AMR 6.7 kbit/s 23.7 21.7 2.0 24.5 21.5 3.0 23.8 21.2 2.6
AMR 7.4 kbit/s 23.8 21.7 2.1 24.6 21.5 3.1 23.8 21.2 2.6
AMR 7.95 kbit/s 23.8 21.8 2.0 24.6 21.5 3.1 23.8 21.2 2.6
AMR 10.2 kbit/s 23.8 21.8 2.0 24.6 21.4 3.2 23.9 21.2 2.7
AMR 12.2 kbit/s 23.8 21.8 2.0 24.6 21.5 3.1 23.9 21.2 2.7
HSDPA Sub test 1 22.8 20.7 2.1 23.0 21.5 1.5 22.9 21.0 1.9
HSDPA Sub test 2 21.8 19.8 2.0 22.0 20.1 1.9 21.6 19.7 1.9
HSDPA Sub test 3 20.3 18.2 2.1 20.4 18.3 2.1 20.4 18.4 2.0
HSDPA Sub test 4 20.1 18.0 2.1 20.3 18.2 2.1 20.4 18.3 2.1
DC-HSDPA Sub test 1 23.0 21.0 2.0 23.1 21.0 2.1 22.8 20.7 2.1
DC-HSDPA Sub test 2 22.9 21.0 1.9 23.0 20.9 2.1 22.7 20.6 2.1
DC-HSDPA Sub test 3 22.3 20.4 1.9 22.4 20.5 1.9 22.1 20.1 2.0
DC-HSDPA Sub test 4 22.4 20.5 1.9 22.4 20.4 2.0 22.2 20.0 2.2
HSUPA Sub test 1 23.0 21.0 2.0 23.1 21.0 2.1 22.5 20.5 2.0
HSUPA Sub test 2 20.4 18.5 1.9 20.6 18.6 2.0 20.6 18.5 2.1
HSUPA Sub test 3 21.5 19.4 2.1 21.5 19.3 2.2 21.6 19.5 2.1
HSUPA Sub test 4 21.2 18.8 2.4 21.2 18.9 2.3 21.0 19.0 2.0
HSUPA Sub test 5 23.0 20.9 2.1 23.0 21.0 2.0 23.0 20.9 2.1 Table 26: Test results conducted power measurement UMTS FDD II 1900MHz measured with MHS back off mode active / inactive Remark: None of the HSDPA/HSUPA settings leads to conducted power values exceeding the conducted power in RMC mode by more than 0.25 dB. Therefore no additional SAR measurements were performed in HSDPA/HSUPA mode.

Test report no.: 1-0042/15-01-15-A
Page 44 of 223
7.1.6 Test-set-up information for WCDMA / HSPDA / HSUPA a) WCDMA RMC In RMC (reference measurement channel) mode the conducted power at 4 different bit rates was measured. They correspond with the used spreading factors as follows:
Bit rate 12.2 kbit/s 64 kbit/s 144 kbit/s 384 kbit/s Spreading factor (SF) 64 16 8 4
In RMC mode only DPCCH and DPDCH are active. As bit rate changes do not influence the relative power of any code channel the measured RMS output power remains on the same level which is set to maximum by TPC (Transmit power control) pattern type 'All 1'. b) HSDPA HSDPA adds the HS-DPCCH in uplink as a control channel for high speed data transfer in downlink. In HSDPA mode 4 sub-tests are defined by 3GPP 34.121 according to the following table:
Sub-test c d d (SF) c/d hs(1) CM(dB)(2)
1 2/15 15/15 64 2/15 4/15 0.0 2 12/15(3) 15/15(3) 64 12/15(3) 24/15 1.0 3 15/15 8/15 64 15/8 30/15 1.5 4 15/15 4/15 64 15/4 30/15 1.5
Note 1: ACK, ACK, CQI = 8 Ahs = hs/c = 30/15 hs = 30/15 * c
Note 2 : CM = 1 for c/d = 12/15, hs/c = 24/15 Note 3 : For subtest 2 the c/d ratio of 12/15 for the TFC during the measurement period (TF1, TF0) is achieved by setting the signalled gain factors for the reference TFC (TF1,TF1) to c = 11/15 and d = 15/15
Table 27: Sub-tests for UMTS Release 5 HSDPA The c and d gain factors for DPCCH and DPDCH were set according to the values in the above table, hs for HS-DPCCH is set automatically to the correct value when ACK, ACK, CQI = 8. The variation of the c /d ratio causes a power reduction at sub-tests 2 - 4. The measurements were performed with a Fixed Reference Channel (FRC) and H-Set 1 QPSK.
Parameter Value Nominal average inf. bit rate 534 kbit/s Inter-TTI Distance 3 TTI’s Number of HARQ Processes 2 Processes Information Bit Payload 3202 Bits MAC-d PDU size 336 Bits Number Code Blocks 1 Block Binary Channel Bits Per TTI 4800 Bits Total Available SMLs in UE 19200 SMLs Number of SMLs per HARQ Process 9600 SMLs Coding Rate 0.67 Number of Physical Channel Codes 5
Table 28: settings of required H-Set 1 QPSK acc. to 3GPP 34.121

Test report no.: 1-0042/15-01-15-A
Page 45 of 223
c) DC-HSDPA (3GPP Release 8) Dual Cell – HSDPA has been signalized using the following settings for connection setup:
Parameter During Connection Setup
Value
P-CPICH_Ec/Ior -10 dB P-CCPCH -12 SCH_Ec/Ior -12 PICH_Ec/Ior -15 HS-PDSCH off HS-SCCH_1 off DPCH_Ec/Ior -5 OCNS_Ec/Ior -3.1
Table 29: Downlink Physical Channels according to 3GPP 34.121 Table E.5.0 The fixed reference channel has been set to H-set 12 according to 3GPP TS 34.121 Table C.8.1.12:
Parameter Unit Value Nominal Average Inf. Bit Rate kbit/s 60 Inter-TTI Distance TTI’s 1 Information Bit Payload (NINF) Bits 120 Number Code Blocks Blocks 1 Binary Channel Bits Per TTI Bits 960 Total Available SML’s in UE SML’s 19200 Number of SML’s per HARQ Process SML’s 3200 Coding Rate 0.15 Number of Physical Channel Codecs Codecs 1 Modulation QPSK Note 1: The RMC is intended to be used for DC-HSDPA mode and both cells shall transmit with identical parameters as listed in the table. Note 2: Maximum number of transmission is limited to 1, i.e., retransmission is not allowed. The redundancy and constellation version 0 shall be used.
Table 30: H-Set 12 QPSK configuration The same Sub-test settings as for Release 5 HSDPA were used for the tests.

Test report no.: 1-0042/15-01-15-A
Page 46 of 223
d) HSUPA In HSUPA mode additional code channels (E-DPCCH, E-DPDCHn) are added for data transfer in uplink at higher bit rates. 5 sub-tests are defined by 3GPP 34.121 according to the following table :
Sub-test
c d d (SF) c/d hs(1) ec ed ec
(SF)
ed
(code)
CM(2)
(dB) MPR (dB)
AG(4)
Index E-TFCI
1 11/15(3) 15/15(3) 64 11/15(3) 22/15 209/225 1039/225 4 1 1.0 0.0 20 75 2 6/15 15/15 64 6/15 12/15 12/15 94/75 4 1 3.0 2.0 12 67
3 15/15 9/15 64 15/9 30/15 30/15 �ed1:47/15�ed2:47/15
4 2 2.0 1.0 15 92
4 2/15 15/15 64 2/15 4/15 2/15 56/75 4 1 3.0 2.0 17 71 5 15/15(4) 15/15(4) 64 15/15(4) 30/15 24/15 134/15 4 1 1.0 0.0 21 81
Note 1: ACK, ACK, CQI = 8 Ahs = hs/c = 30/15 hs = 30/15 * c
Note 2 : CM = 1 for c/d = 12/15, hs/c = 24/15. For all other combinations of DPDCH, DPCCH, HS-DPCCH, E-DPDCH and E-DPCCH the MPR is based on the relative CM difference Note 3 : For subtest 1 the c/d ratio of 11/15 for the TFC during the measurement period (TF1, TF0) is achieved by setting the signalled gain factors for the reference TFC (TF1,TF1) to c = 10/15 and d = 15/15 Note 4 : For subtest 5 the c/d ratio of 15/15 for the TFC during the measurement period (TF1, TF0) is achieved by setting the signalled gain factors for the reference TFC (TF1,TF1) to c = 14/15 and d = 15/15 Note 5 : Testing UE using E-DPDCH Physical Layer category 1 Sub-test 3 is not required according to TS 25.306 Table 5.1g Note 6 : ed can not be set directly; it is set by Absolute Grant Value
Table 31: Subtests for UMTS Release 6 HSUPA To achieve the settings above some additional procedures were defined by 3GPP 34.121. Those have been included in an application note for the CMU200 and were exactly followed : - Test mode connection (BS signal tab) : RMC 12.2 kbit/s + HSPA 34.108 with loop mode 1 - HS-DSCH settings (BS signal tab): - FRC with H-set 1 QPSK - ACK-NACK repetition factor = 3 - CQI feedback cycle = 4ms - CQI repetition factor = 2 - HSUPA-specific signalling settings (UE signal tab) : - E-TFCI table index = 0 - E-DCH minimum set E-TFCI = 9 - Puncturing limit non-max = 0.84 - max. number of channelisation codes = 2x SF4 - Initial Serving Grant Value = Off - HSDPA and HSUPA Gain factors (UE signal tab)
Sub-test c d ACK, ACK, CQI DPCCH )* 1 10 15 8 6 2 6 15 8 8 3 15 9 8 8 4 2 15 8 5 5 14 15 8 7
)* : ec and ed ratios (relative to c and d) are set by DPCCH

Test report no.: 1-0042/15-01-15-A
Page 47 of 223
- HSUPA Reference E-TFCIs (UE signal tab > HSUPA gain factors) :
Sub-test 1, 2, 4, 5
Number of E-TFCIs 5 Reference E-TFCI 11 67 71 75 81 Reference E-TFCI
power offset 4 18 23 26 27
Sub-test 3
Number of E-TFCIs 2 Reference E-TFCI 11 92 Reference E-TFCI
power offset 4 18
- HSUPA-specific generator parameters (BS Signal tab > HSUPA > E-AGCH > AG Pattern)
Sub-test Absolute Grant Value (AG Index) 1 20 2 12 3 15 4 17 5 21
- Power Level settings (BS Signal tab > Node B-settings): - Level reference : Output Channel Power (lor) - Output Channel Power (lor) : -86 dBm - Downlink Physical Channel Settings (BS signal tab) - P-CPICH : -10 dB - S-CPICH : Off - P-SCH : -15 dB - S-SCH : -15 dB - P-CCPCH : -12 dB - S-CCPCH : -12 dB - PICH : -15 dB - AICH : -12 dB - DPDCH : -10 dB - HS-SCCH : -8 dB - HS-PDSCH : -3 dB - E-AGCH : -20 dB - E-RGCH/E-HICH - 20 dB - E-RGCH Active : Off The settings above were stored once for each sub-test and recalled before the measurement. HSUPA test procedure : To reach maximum output power in HSUPA mode the following procedures were followed: 3 different TPC patterns were defined : Set 1 : Closed loop with target power 10 dBm Set 2 : Single Pattern+Alternating with binary pattern '11111' for 1 dB steps 'up' Set 3 : Single Pattern+Alternating with binary pattern '00000' for 1 dB steps 'down'

Test report no.: 1-0042/15-01-15-A
Page 48 of 223
After recalling a certain HSUPA sub-test the HSUPA E-AGCH graph with E-TFCI event counter is displayed. After starting with the closed loop command the power is increased in 1 dB steps by activating pattern set 2 until the UE decreases the transmitted E-TFCI. At this point set 3 is activated once to reduce the output power to the value at which the original E-TFCI, which is required for the sub-test, appears again. For conducted power measurements the same steps are repeated in the power menu to read out the corresponding maximum RMS output power with the target E-TFCI. For SAR measurements it is useful to switch to Code Domain Power vs. Time display. Here the CMU200 shows relative power values (max. and min.) of each code channel which should roughly correspond to the numerators of the gain factors e.g. :
Sub-test c d hs ec ed
5 15 15 30 24 134 By this way a surveillance of signalling conditions is possible to make sure that HSUPA code channels are active during the complete SAR measurement.

Test report no.: 1-0042/15-01-15-A
Page 49 of 223
7.1.7 Conducted power measurements LTE FDD 2 1900 MHz
Bandwidth (MHz)
Channel / Frequency
(MHz)
Resource block
allocation
Pavg (dBm)
Pavg (dBm) back off dev.
dB
Pavg (dBm)
Pavg (dBm) back off dev.
dB QPSK QPSK 16-QAM 16-QAM
1.4
18607 / 1850.7
1 RB low 22.9 19.7 3.2 22.3 20.1 2.2
1 RB mid 23.0 19.8 3.2 22.4 20.3 2.1
1 RB high 23.0 20.0 3.0 22.3 20.1 2.2
50% RB low 22.9 19.8 3.1 22.1 19.9 2.2
50% RB mid 22.9 19.8 3.1 22.1 19.9 2.2
50% RB high 22.9 19.7 3.2 22.1 19.9 2.2
100% RB 21.9 19.7 2.2 20.8 19.7 1.1
18900 / 1880.0
1 RB low 23.1 19.5 3.6 22.0 19.4 2.6
1 RB mid 23.0 19.5 3.5 22.3 19.6 2.7
1 RB high 23.1 19.4 3.7 22.1 19.4 2.7
50% RB low 22.7 19.3 3.4 22.0 19.6 2.4
50% RB mid 23.0 19.4 3.6 22.1 19.6 2.5
50% RB high 22.8 19.2 3.6 22.1 19.5 2.6
100% RB 21.9 19.3 2.6 21.1 19.5 1.6
19193 / 1909.3
1 RB low 22.4 18.9 3.5 21.4 19.0 2.4
1 RB mid 22.5 18.9 3.6 21.4 19.1 2.3
1 RB high 22.4 18.9 3.5 21.5 19.0 2.5
50% RB low 22.2 18.7 3.5 21.3 18.8 2.5
50% RB mid 22.2 18.7 3.5 21.4 18.9 2.5
50% RB high 22.2 18.7 3.5 21.3 18.8 2.5
100% RB 21.2 18.7 2.5 20.3 18.8 1.5
3.0
18615 / 1851.5
1 RB low 22.9 20.3 2.6 22.3 20.4 1.9
1 RB mid 23.1 19.9 3.2 22.4 20.2 2.2
1 RB high 23.0 20.2 2.8 22.4 20.4 2.0
50% RB low 21.9 19.8 2.1 20.8 19.7 1.1
50% RB mid 22.0 19.8 2.2 20.9 19.8 1.1
50% RB high 22.0 19.8 2.2 20.9 19.7 1.2
100% RB 22.0 19.8 2.2 21.0 19.9 1.1
18900 / 1880.0
1 RB low 23.0 19.5 3.5 22.0 19.6 2.4
1 RB mid 23.1 19.4 3.7 22.1 19.6 2.5
1 RB high 23.0 19.4 3.6 21.9 19.5 2.4
50% RB low 21.9 19.4 2.5 21.1 19.7 1.4
50% RB mid 21.9 19.4 2.5 21.1 19.6 1.5
50% RB high 21.8 19.4 2.4 21.0 19.6 1.4
100% RB 22.0 19.4 2.6 20.9 19.4 1.5
19185 / 1908.5
1 RB low 22.1 18.8 3.3 21.2 18.9 2.3
1 RB mid 22.1 18.8 3.3 21.3 18.8 2.5
1 RB high 22.2 18.7 3.5 21.4 19.0 2.4
50% RB low 21.2 18.8 2.4 20.3 18.9 1.4
50% RB mid 21.2 18.8 2.4 20.3 19.0 1.3
50% RB high 21.3 18.8 2.5 20.4 19.0 1.4
100% RB 21.2 18.8 2.4 20.3 18.9 1.4

Test report no.: 1-0042/15-01-15-A
Page 50 of 223
Bandwidth (MHz)
Channel / Frequency
(MHz)
Resource block
allocation
Pavg (dBm)
Pavg (dBm) back off dev.
dB
Pavg (dBm)
Pavg (dBm) back off dev.
dB QPSK QPSK 16-QAM 16-QAM
5.0
18625 / 1852.5
1 RB low 22.8 19.9 2.9 22.4 20.5 1.9
1 RB mid 23.0 19.8 3.2 22.6 20.4 2.2
1 RB high 23.1 20.0 3.1 22.7 20.5 2.2
50% RB low 22.0 19.8 2.2 21.1 20.0 1.1
50% RB mid 22.1 19.8 2.3 21.2 20.0 1.2
50% RB high 22.1 19.8 2.3 21.3 20.0 1.3
100% RB 22.0 19.8 2.2 21.1 19.9 1.2
18900 / 1880.0
1 RB low 23.4 19.6 3.8 22.2 19.6 2.6
1 RB mid 22.9 19.4 3.5 21.9 19.6 2.3
1 RB high 23.0 19.6 3.4 22.0 19.6 2.4
50% RB low 22.0 19.4 2.6 21.0 19.4 1.6
50% RB mid 22.0 19.5 2.5 21.0 19.5 1.5
50% RB high 21.9 19.3 2.6 21.0 19.4 1.6
100% RB 21.9 19.4 2.5 20.9 19.4 1.5
19175 / 1907.5
1 RB low 22.6 19.1 3.5 21.7 19.2 2.5
1 RB mid 22.3 18.9 3.4 22.3 21.6 0.7
1 RB high 22.4 18.9 3.5 21.5 19.2 2.3
50% RB low 21.2 18.9 2.3 20.4 19.0 1.4
50% RB mid 21.1 18.8 2.3 20.2 19.0 1.2
50% RB high 21.1 18.8 2.3 20.4 19.0 1.4
100% RB 21.3 18.9 2.4 20.2 19.0 1.2
10.0
18650 / 1855
1 RB low 22.8 20.3 2.5 22.1 20.2 1.9
1 RB mid 23.2 20.0 3.2 22.5 20.4 2.1
1 RB high 23.3 20.0 3.3 22.4 20.2 2.2
50% RB low 22.0 19.7 2.3 21.0 19.7 1.3
50% RB mid 22.1 19.8 2.3 21.2 19.9 1.3
50% RB high 22.2 19.8 2.4 21.3 19.8 1.5
100% RB 22.1 19.7 2.4 21.1 19.8 1.3
18900 / 1880
1 RB low 23.0 19.5 3.5 22.4 20.0 2.4
1 RB mid 22.9 19.5 3.4 21.9 19.4 2.5
1 RB high 22.8 19.4 3.4 22.1 19.5 2.6
50% RB low 21.9 19.4 2.5 21.0 19.6 1.4
50% RB mid 21.9 19.5 2.4 21.0 19.6 1.4
50% RB high 21.8 19.4 2.4 20.9 19.5 1.4
100% RB 21.8 19.4 2.4 20.8 19.5 1.3
19150 / 1905
1 RB low 22.5 19.0 3.5 22.0 19.4 2.6
1 RB mid 22.3 18.9 3.4 21.5 18.8 2.7
1 RB high 22.4 18.8 3.6 21.6 19.0 2.6
50% RB low 21.4 18.9 2.5 20.4 18.9 1.5
50% RB mid 21.5 18.9 2.6 20.5 19.0 1.5
50% RB high 21.3 18.9 2.4 20.3 18.9 1.4
100% RB 21.5 19.0 2.5 20.3 19.0 1.3

Test report no.: 1-0042/15-01-15-A
Page 51 of 223
Bandwidth (MHz)
Channel / Frequency
(MHz)
Resource block
allocation
Pavg (dBm)
Pavg (dBm) back off dev.
dB
Pavg (dBm)
Pavg (dBm) back off dev.
dB QPSK QPSK 16-QAM 16-QAM
15.0
18675 / 1857.5
1 RB low 23.0 20.2 2.8 22.3 20.3 2.0
1 RB mid 23.2 20.0 3.2 22.5 20.3 2.2
1 RB high 23.5 19.9 3.6 22.7 20.0 2.7
50% RB low 22.1 20.0 2.1 21.2 20.0 1.2
50% RB mid 22.2 19.9 2.3 21.3 19.9 1.4
50% RB high 22.2 19.9 2.3 21.2 19.9 1.3
100% RB 22.2 20.0 2.2 21.2 20.0 1.2
18900 / 1880.0
1 RB low 23.2 19.5 3.7 22.3 19.9 2.4
1 RB mid 23.1 19.6 3.5 22.2 19.8 2.4
1 RB high 23.1 19.5 3.6 22.2 19.8 2.4
50% RB low 22.1 19.5 2.6 21.0 19.5 1.5
50% RB mid 22.1 19.6 2.5 21.1 19.5 1.6
50% RB high 22.1 19.5 2.6 21.1 19.5 1.6
100% RB 22.0 19.6 2.4 21.0 19.6 1.4
19125 / 1902.5
1 RB low 22.9 19.6 3.3 21.6 19.2 2.4
1 RB mid 22.7 19.4 3.3 21.4 18.9 2.5
1 RB high 22.7 18.9 3.8 21.3 18.8 2.5
50% RB low 21.6 19.2 2.4 20.6 19.2 1.4
50% RB mid 21.6 19.1 2.5 20.6 19.1 1.5
50% RB high 21.5 19.0 2.5 20.5 19.0 1.5
100% RB 21.6 19.1 2.5 20.6 19.1 1.5
20.0
18700 / 1860
1 RB low 22.9 19.9 3.0 22.3 20.5 1.8
1 RB mid 23.2 19.8 3.4 22.7 20.2 2.5
1 RB high 23.2 19.5 3.7 23.0 20.6 2.4
50% RB low 22.1 19.9 2.2 21.2 19.9 1.3
50% RB mid 22.3 19.9 2.4 21.2 19.9 1.3
50% RB high 22.3 19.7 2.6 21.3 19.7 1.6
100% RB 22.3 19.9 2.4 21.2 19.9 1.3
18900 / 1880
1 RB low 23.3 19.6 3.7 22.6 19.9 2.7
1 RB mid 23.1 19.5 3.6 22.5 19.8 2.7
1 RB high 22.9 19.4 3.5 22.3 19.9 2.4
50% RB low 22.2 19.6 2.6 21.0 19.4 1.6
50% RB mid 22.2 19.4 2.8 21.1 19.4 1.7
50% RB high 22.1 19.5 2.6 21.1 19.5 1.6
100% RB 22.0 19.5 2.5 21.1 19.5 1.6
19100 / 1900
1 RB low 22.9 19.4 3.5 22.5 20.0 2.5
1 RB mid 22.6 19.2 3.4 22.8 19.9 2.9
1 RB high 22.5 19.0 3.5 22.2 19.7 2.5
50% RB low 21.7 19.2 2.5 20.6 19.2 1.4
50% RB mid 21.6 19.1 2.5 20.5 19.1 1.4
50% RB high 21.6 19.1 2.5 20.7 19.2 1.5
100% RB 21.7 19.2 2.5 20.7 19.3 1.4
Table 32: Test results conducted power measurement LTE FDD 2 1900 MHz.

Test report no.: 1-0042/15-01-15-A
Page 52 of 223
7.1.8 Conducted power measurements LTE FDD 4 1700 MHz
Bandwidth (MHz)
Channel / Frequency
(MHz)
Resource block
allocation
Pavg (dBm)
Pavg (dBm) back off
dev. dB
Pavg (dBm)
Pavg (dBm) back off
dev. dB
QPSK QPSK 16-QAM 16-QAM
1.4
19957 / 1710.7
1 RB low 23.3 20.0 3.3 22.6 20.2 2.4
1 RB mid 23.4 20.2 3.2 22.6 20.5 2.1
1 RB high 23.4 20.1 3.3 22.7 20.3 2.4
50% RB low 23.2 19.9 3.3 22.4 20.1 2.3
50% RB mid 23.2 20.0 3.2 22.4 20.2 2.2
50% RB high 23.2 19.9 3.3 22.5 20.1 2.4
100% RB 22.1 19.8 2.3 20.9 19.7 1.2
20175 / 1732.5
1 RB low 23.1 19.9 3.2 22.0 19.9 2.1
1 RB mid 23.0 19.9 3.1 22.2 20.0 2.2
1 RB high 23.0 19.9 3.1 21.9 19.9 2.0
50% RB low 22.9 19.7 3.2 22.1 19.9 2.2
50% RB mid 22.9 19.7 3.2 22.1 19.9 2.2
50% RB high 22.8 19.7 3.1 22.1 19.9 2.2
100% RB 21.8 19.7 2.1 21.0 19.9 1.1
20393 / 1754.3
1 RB low 22.7 19.8 2.9 21.8 19.9 1.9
1 RB mid 22.7 19.6 3.1 21.9 20.0 1.9
1 RB high 22.8 19.7 3.1 21.9 19.9 2.0
50% RB low 22.6 19.6 3.0 21.6 19.6 2.0
50% RB mid 22.6 19.5 3.1 21.7 19.6 2.1
50% RB high 22.7 19.5 3.2 21.7 19.6 2.1
100% RB 21.5 19.5 2.0 20.6 19.6 1.0
3
19965 / 1711.5
1 RB low 23.3 19.9 3.4 22.6 20.4 2.2
1 RB mid 23.4 20.0 3.4 22.7 20.5 2.2
1 RB high 23.4 20.2 3.2 22.8 20.6 2.2
50% RB low 22.1 19.9 2.2 21.0 19.7 1.3
50% RB mid 22.1 19.9 2.2 21.0 19.8 1.2
50% RB high 22.2 20.0 2.2 21.0 19.8 1.2
100% RB 22.2 20.0 2.2 21.2 20.0 1.2
20175 / 1732.5
1 RB low 23.0 19.8 3.2 22.0 19.9 2.1
1 RB mid 22.8 19.9 2.9 22.1 19.9 2.2
1 RB high 23.0 19.8 3.2 22.0 19.8 2.2
50% RB low 21.9 19.8 2.1 21.1 20.0 1.1
50% RB mid 21.9 19.8 2.1 21.0 20.0 1.0
50% RB high 21.9 19.7 2.2 21.0 19.9 1.1
100% RB 21.9 19.8 2.1 20.8 19.7 1.1
20385 / 1753.5
1 RB low 22.7 19.8 2.9 21.6 19.7 1.9
1 RB mid 22.6 19.6 3.0 21.6 19.4 2.2
1 RB high 22.7 19.7 3.0 21.7 19.6 2.1
50% RB low 21.6 19.7 1.9 20.7 19.7 1.0
50% RB mid 21.6 19.6 2.0 20.6 19.7 0.9
50% RB high 21.6 19.7 1.9 20.6 19.8 0.8
100% RB 21.6 19.7 1.9 20.5 19.7 0.8

Test report no.: 1-0042/15-01-15-A
Page 53 of 223
Bandwidth (MHz)
Channel / Frequency
(MHz)
Resource block
allocation
Pavg (dBm)
Pavg (dBm) back off dev.
dB
Pavg (dBm)
Pavg (dBm) back off dev.
dB QPSK QPSK 16-QAM 16-QAM
5
19975 / 1712.5
1 RB low 23.3 20.0 3.3 23.2 20.9 2.3
1 RB mid 23.0 19.9 3.1 22.8 20.5 2.3
1 RB high 23.3 20.1 3.2 22.9 20.7 2.2
50% RB low 22.1 20.0 2.1 21.2 20.2 1.0
50% RB mid 22.2 20.0 2.2 21.2 20.2 1.0
50% RB high 22.2 19.9 2.3 21.3 20.1 1.2
100% RB 22.1 20.0 2.1 21.2 20.1 1.1
20175 / 1732.5
1 RB low 23.3 20.0 3.3 22.2 20.1 2.1
1 RB mid 22.8 19.7 3.1 21.6 19.8 1.8
1 RB high 23.2 19.9 3.3 22.2 19.9 2.3
50% RB low 21.9 19.8 2.1 21.0 19.8 1.2
50% RB mid 21.9 19.8 2.1 20.9 19.8 1.1
50% RB high 21.9 19.7 2.2 20.9 19.8 1.1
100% RB 21.8 19.7 2.1 20.8 19.7 1.1
20375 / 1752.5
1 RB low 22.9 20.0 2.9 21.9 19.9 2.0
1 RB mid 22.8 19.7 3.1 23.0 22.2 0.8
1 RB high 22.9 19.8 3.1 21.9 19.7 2.2
50% RB low 21.6 19.6 2.0 20.7 19.7 1.0
50% RB mid 21.6 19.7 1.9 20.7 19.7 1.0
50% RB high 21.5 19.6 1.9 20.6 19.7 0.9
100% RB 21.6 19.7 1.9 20.6 19.7 0.9
10
20000 / 1715.0
1 RB low 23.7 20.1 3.6 22.6 20.4 2.2
1 RB mid 23.4 20.2 3.2 22.6 20.4 2.2
1 RB high 23.5 20.1 3.4 22.6 20.3 2.3
50% RB low 22.2 20.0 2.2 21.2 20.1 1.1
50% RB mid 22.2 20.0 2.2 21.2 20.1 1.1
50% RB high 22.2 19.9 2.3 21.2 20.0 1.2
100% RB 22.2 20.0 2.2 21.2 20.0 1.2
20175 / 1732.5
1 RB low 23.1 20.0 3.1 22.3 20.5 1.8
1 RB mid 22.9 19.8 3.1 22.1 19.7 2.4
1 RB high 22.9 19.7 3.2 22.2 20.1 2.1
50% RB low 21.9 19.8 2.1 21.0 19.9 1.1
50% RB mid 22.0 19.8 2.2 21.1 19.9 1.2
50% RB high 22.0 19.7 2.3 21.0 19.8 1.2
100% RB 21.8 19.7 2.1 20.9 19.8 1.1
20350 / 1750.0
1 RB low 23.1 19.9 3.2 22.3 20.2 2.1
1 RB mid 22.9 19.9 3.0 21.7 19.7 2.0
1 RB high 22.8 19.8 3.0 22.0 19.9 2.1
50% RB low 21.6 19.6 2.0 20.6 19.6 1.0
50% RB mid 21.7 19.7 2.0 20.6 19.7 0.9
50% RB high 21.6 19.6 2.0 20.6 19.6 1.0
100% RB 21.6 19.7 1.9 20.6 19.6 1.0

Test report no.: 1-0042/15-01-15-A
Page 54 of 223
Bandwidth (MHz)
Channel / Frequency
(MHz)
Resource block
allocation
Pavg (dBm)
Pavg (dBm) back off dev.
dB
Pavg (dBm)
Pavg (dBm) back off dev.
dB QPSK QPSK 16-QAM 16-QAM
15
20025 / 1717.5
1 RB low 23.3 20.1 3.2 22.6 20.4 2.2
1 RB mid 23.5 20.0 3.5 22.7 20.3 2.4
1 RB high 23.4 20.1 3.3 22.6 20.4 2.2
50% RB low 22.2 19.9 2.3 21.3 20.0 1.3
50% RB mid 22.3 19.9 2.4 21.3 20.0 1.3
50% RB high 22.3 19.9 2.4 21.3 19.9 1.4
100% RB 22.2 19.9 2.3 21.2 20.0 1.2
20175 / 1732.5
1 RB low 23.3 19.9 3.4 22.6 20.3 2.3
1 RB mid 22.8 19.7 3.1 22.3 20.0 2.3
1 RB high 22.8 19.7 3.1 22.2 19.9 2.3
50% RB low 21.9 19.9 2.0 20.8 19.8 1.0
50% RB mid 21.9 19.8 2.1 21.0 19.8 1.2
50% RB high 21.9 19.7 2.2 20.9 19.7 1.2
100% RB 21.9 19.7 2.2 20.9 19.8 1.1
20325 / 1747.5
1 RB low 23.1 20.0 3.1 21.7 19.7 2.0
1 RB mid 22.9 19.7 3.2 21.7 19.6 2.1
1 RB high 23.1 19.8 3.3 21.7 19.5 2.2
50% RB low 21.8 19.7 2.1 20.7 19.7 1.0
50% RB mid 21.8 19.8 2.0 20.8 19.7 1.1
50% RB high 21.8 19.7 2.1 20.7 19.7 1.0
100% RB 21.7 19.7 2.0 20.7 19.7 1.0
20
20050 / 1720.0
1 RB low 23.3 20.0 3.3 23.2 20.6 2.6
1 RB mid 23.4 20.0 3.4 22.9 20.3 2.6
1 RB high 23.1 19.9 3.2 22.7 20.4 2.3
50% RB low 22.2 19.9 2.3 21.2 20.0 1.2
50% RB mid 22.3 19.9 2.4 21.2 19.9 1.3
50% RB high 22.1 20.0 2.1 21.1 20.0 1.1
100% RB 22.2 20.0 2.2 21.2 20.0 1.2
20175 / 1732.5
1 RB low 23.1 20.0 3.1 22.4 20.5 1.9
1 RB mid 22.9 19.7 3.2 22.1 20.1 2.0
1 RB high 22.6 19.6 3.0 22.0 20.1 1.9
50% RB low 21.9 19.9 2.0 20.9 19.9 1.0
50% RB mid 21.8 19.8 2.0 20.8 19.7 1.1
50% RB high 21.8 19.7 2.1 20.7 19.7 1.0
100% RB 21.8 19.8 2.0 20.9 19.8 1.1
20300 / 1745.0
1 RB low 23.2 19.7 3.5 22.6 20.5 2.1
1 RB mid 22.9 19.6 3.3 22.4 20.2 2.2
1 RB high 22.9 19.5 3.4 22.5 20.2 2.3
50% RB low 21.8 19.7 2.1 20.8 19.7 1.1
50% RB mid 21.9 19.7 2.2 20.8 19.7 1.1
50% RB high 21.9 19.7 2.2 20.9 19.7 1.2
100% RB 21.9 19.7 2.2 20.9 19.7 1.2
Table 33: Test results conducted power measurement LTE FDD 4 1700 MHz.
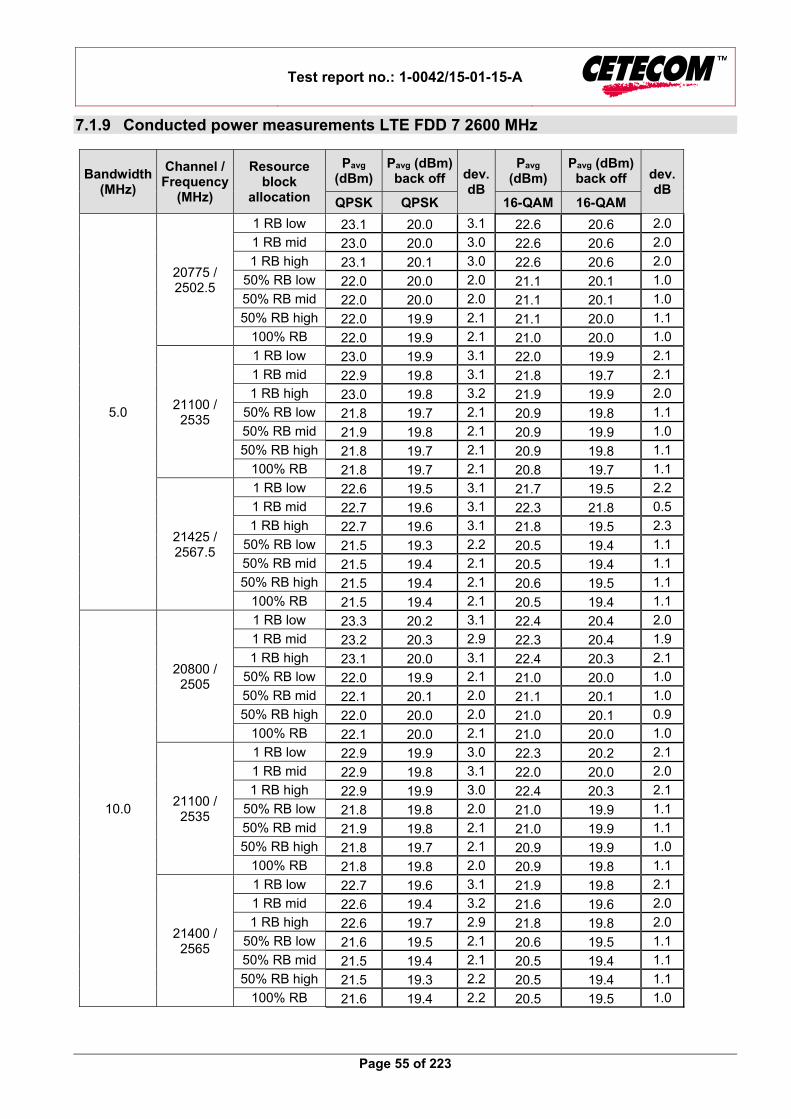
Test report no.: 1-0042/15-01-15-A
Page 55 of 223
7.1.9 Conducted power measurements LTE FDD 7 2600 MHz
Bandwidth (MHz)
Channel / Frequency
(MHz)
Resource block
allocation
Pavg (dBm)
Pavg (dBm) back off dev.
dB
Pavg (dBm)
Pavg (dBm) back off dev.
dB QPSK QPSK 16-QAM 16-QAM
5.0
20775 / 2502.5
1 RB low 23.1 20.0 3.1 22.6 20.6 2.0
1 RB mid 23.0 20.0 3.0 22.6 20.6 2.0
1 RB high 23.1 20.1 3.0 22.6 20.6 2.0
50% RB low 22.0 20.0 2.0 21.1 20.1 1.0
50% RB mid 22.0 20.0 2.0 21.1 20.1 1.0
50% RB high 22.0 19.9 2.1 21.1 20.0 1.1
100% RB 22.0 19.9 2.1 21.0 20.0 1.0
21100 / 2535
1 RB low 23.0 19.9 3.1 22.0 19.9 2.1
1 RB mid 22.9 19.8 3.1 21.8 19.7 2.1
1 RB high 23.0 19.8 3.2 21.9 19.9 2.0
50% RB low 21.8 19.7 2.1 20.9 19.8 1.1
50% RB mid 21.9 19.8 2.1 20.9 19.9 1.0
50% RB high 21.8 19.7 2.1 20.9 19.8 1.1
100% RB 21.8 19.7 2.1 20.8 19.7 1.1
21425 / 2567.5
1 RB low 22.6 19.5 3.1 21.7 19.5 2.2
1 RB mid 22.7 19.6 3.1 22.3 21.8 0.5
1 RB high 22.7 19.6 3.1 21.8 19.5 2.3
50% RB low 21.5 19.3 2.2 20.5 19.4 1.1
50% RB mid 21.5 19.4 2.1 20.5 19.4 1.1
50% RB high 21.5 19.4 2.1 20.6 19.5 1.1
100% RB 21.5 19.4 2.1 20.5 19.4 1.1
10.0
20800 / 2505
1 RB low 23.3 20.2 3.1 22.4 20.4 2.0
1 RB mid 23.2 20.3 2.9 22.3 20.4 1.9
1 RB high 23.1 20.0 3.1 22.4 20.3 2.1
50% RB low 22.0 19.9 2.1 21.0 20.0 1.0
50% RB mid 22.1 20.1 2.0 21.1 20.1 1.0
50% RB high 22.0 20.0 2.0 21.0 20.1 0.9
100% RB 22.1 20.0 2.1 21.0 20.0 1.0
21100 / 2535
1 RB low 22.9 19.9 3.0 22.3 20.2 2.1
1 RB mid 22.9 19.8 3.1 22.0 20.0 2.0
1 RB high 22.9 19.9 3.0 22.4 20.3 2.1
50% RB low 21.8 19.8 2.0 21.0 19.9 1.1
50% RB mid 21.9 19.8 2.1 21.0 19.9 1.1
50% RB high 21.8 19.7 2.1 20.9 19.9 1.0
100% RB 21.8 19.8 2.0 20.9 19.8 1.1
21400 / 2565
1 RB low 22.7 19.6 3.1 21.9 19.8 2.1
1 RB mid 22.6 19.4 3.2 21.6 19.6 2.0
1 RB high 22.6 19.7 2.9 21.8 19.8 2.0
50% RB low 21.6 19.5 2.1 20.6 19.5 1.1
50% RB mid 21.5 19.4 2.1 20.5 19.4 1.1
50% RB high 21.5 19.3 2.2 20.5 19.4 1.1
100% RB 21.6 19.4 2.2 20.5 19.5 1.0

Test report no.: 1-0042/15-01-15-A
Page 56 of 223
Bandwidth (MHz)
Channel / Frequency
(MHz)
Resource block
allocation
Pavg (dBm) QPSK
Pavg (dBm)
back off QPSK
dev. dB
Pavg (dBm)
16-QAM
Pavg (dBm) back off 16-QAM
dev. dB
15.0
20825 / 2507.5
1 RB low 23.2 20.2 3.0 22.4 20.5 1.9
1 RB mid 23.2 20.2 3.0 22.4 20.4 2.0
1 RB high 23.0 20.0 3.0 22.2 20.3 1.9
50% RB low 21.9 19.9 2.0 21.0 20.0 1.0
50% RB mid 22.0 20.0 2.0 21.0 20.0 1.0
50% RB high 21.9 20.0 1.9 21.0 20.0 1.0
100% RB 21.9 19.9 2.0 21.0 20.0 1.0
21100 / 2535
1 RB low 22.8 19.9 2.9 22.2 20.2 2.0
1 RB mid 22.8 19.8 3.0 22.3 20.3 2.0
1 RB high 22.8 19.8 3.0 22.1 20.4 1.7
50% RB low 21.8 19.8 2.0 20.9 19.8 1.1
50% RB mid 21.9 19.9 2.0 20.9 19.8 1.1
50% RB high 21.9 19.9 2.0 20.9 19.9 1.0
100% RB 21.8 19.8 2.0 20.8 19.9 0.9
21375 / 2562.5
1 RB low 22.6 19.7 2.9 21.5 19.4 2.1
1 RB mid 22.5 19.6 2.9 21.3 19.2 2.1
1 RB high 22.7 19.7 3.0 21.3 19.2 2.1
50% RB low 21.5 19.4 2.1 20.5 19.4 1.1
50% RB mid 21.5 19.4 2.1 20.4 19.4 1.0
50% RB high 21.3 19.3 2.0 20.3 19.2 1.1
100% RB 21.4 19.3 2.1 20.4 19.4 1.0
20.0
20850 / 2510
1 RB low 23.1 20.0 3.1 22.5 20.5 2.0
1 RB mid 23.1 19.9 3.2 22.5 20.5 2.0
1 RB high 22.9 19.7 3.2 22.3 20.4 1.9
50% RB low 22.0 20.0 2.0 21.0 20.0 1.0
50% RB mid 22.1 20.0 2.1 21.0 20.1 0.9
50% RB high 21.9 19.9 2.0 20.9 19.9 1.0
100% RB 21.9 19.9 2.0 20.9 19.9 1.0
21100 / 2535
1 RB low 22.9 19.8 3.1 22.2 20.3 1.9
1 RB mid 22.9 19.9 3.0 22.3 20.3 2.0
1 RB high 22.8 20.0 2.8 22.3 20.3 2.0
50% RB low 21.9 19.8 2.1 20.9 19.8 1.1
50% RB mid 21.9 19.8 2.1 20.9 19.8 1.1
50% RB high 21.9 19.8 2.1 20.9 19.8 1.1
100% RB 21.8 19.8 2.0 20.9 19.8 1.1
21350 / 2560
1 RB low 22.7 19.6 3.1 22.4 20.4 2.0
1 RB mid 22.6 19.4 3.2 22.1 19.9 2.2
1 RB high 22.4 19.2 3.2 22.0 19.8 2.2
50% RB low 21.6 19.5 2.1 20.6 19.5 1.1
50% RB mid 21.5 19.4 2.1 20.5 19.4 1.1
50% RB high 21.4 19.3 2.1 20.4 19.3 1.1
100% RB 21.4 19.4 2.0 20.6 19.5 1.1 Table 34: Test results conducted power measurement LTE FDD 7 2600 MHz.

Test report no.: 1-0042/15-01-15-A
Page 57 of 223
7.1.10 Conducted power measurements LTE FDD 13 700 MHz
Bandwidth (MHz)
Channel / Frequency
(MHz)
Resource block
allocation
Pavg (dBm) QPSK
Pavg (dBm)
16-QAM
5
23205 / 779.5
1 RB low 23.4 23
1 RB mid 23.4 22.9
1 RB high 23.6 23.3
50% RB low 22.3 21.4
50% RB mid 22.5 21.6
50% RB high 22.4 21.6
100% RB 22.4 21.5
23230 / 782
1 RB low 23.6 22.7
1 RB mid 23.8 22.7
1 RB high 23.8 22.8
50% RB low 22.6 21.7
50% RB mid 22.7 21.8
50% RB high 22.6 21.7
100% RB 22.7 21.6
23255 / 784.5
1 RB low 24.0 22.9
1 RB mid 23.7 24.3
1 RB high 23.8 22.9
50% RB low 22.6 21.6
50% RB mid 22.6 21.6
50% RB high 22.6 21.7
100% RB 22.6 21.6
10
23230 / 782
1 RB low 23.9 22.8
1 RB mid 23.8 22.8
1 RB high 23.8 23
50% RB low 22.5 21.5
50% RB mid 22.7 21.8
50% RB high 22.7 21.6
100% RB 22.8 21.7 Table 35: Test results conducted power measurement LTE FDD13 700 MHz.

Test report no.: 1-0042/15-01-15-A
Page 58 of 223
7.1.11 Conducted power measurements LTE FDD 17 700 MHz
Bandwidth (MHz)
Channel / Frequency
(MHz)
Resource block
allocation
Pavg (dBm) QPSK
Pavg (dBm)
16-QAM
5
23755 / 706.5
1 RB low 23.6 23.2
1 RB mid 23.4 23.1
1 RB high 23.6 23.3
50% RB low 22.4 21.5
50% RB mid 22.5 21.6
50% RB high 22.4 21.6
100% RB 22.4 21.5
23780 / 710.0
1 RB low 23.6 22.5
1 RB mid 23.4 22.5
1 RB high 23.7 22.7
50% RB low 22.4 21.5
50% RB mid 22.5 21.5
50% RB high 22.5 21.5
100% RB 22.4 21.4
23825 / 713.5
1 RB low 23.5 22.7
1 RB mid 23.6 24.4
1 RB high 23.8 22.9
50% RB low 22.4 21.5
50% RB mid 22.6 21.6
50% RB high 22.5 21.5
100% RB 22.5 21.5
10
23780 / 709.0
1 RB low 23.6 22.8
1 RB mid 23.5 22.8
1 RB high 23.7 22.9
50% RB low 22.4 21.5
50% RB mid 22.5 21.5
50% RB high 22.5 21.5
100% RB 22.5 21.5
23780 / 710.0
1 RB low 23.4 22.9
1 RB mid 23.4 22.5
1 RB high 23.6 23
50% RB low 22.4 21.5
50% RB mid 22.5 21.6
50% RB high 22.5 21.6
100% RB 22.4 21.5
23800 / 711.0
1 RB low 23.6 22.6
1 RB mid 23.4 22.4
1 RB high 23.6 22.6
50% RB low 22.4 21.4
50% RB mid 22.4 21.5
50% RB high 22.5 21.5
100% RB 22.5 21.5 Table 36: Test results conducted power measurement LTE FDD 17 700 MHz.

Test report no.: 1-0042/15-01-15-A
Page 59 of 223
7.1.12 Conducted power measurements LTE TDD 41 2600 MHz
Bandwidth (MHz)
Channel / Frequency
(MHz)
Resource block
allocation
Pavg (dBm)
Pavg (dBm) back off dev.
dB
Pavg (dBm)
Pavg (dBm) back off dev.
dB QPSK QPSK 16-QAM 16-QAM
5
39675 / 2498.5
1 RB low 22.0 18.5 3.5 21.3 19.1 2.2
1 RB mid 22.5 19.0 3.5 21.8 19.8 2.0
1 RB high 22.9 19.5 3.4 22.1 20.2 1.9
50% RB low 21.4 18.9 2.5 20.3 19.1 1.2
50% RB mid 21.7 19.2 2.5 20.6 19.4 1.2
50% RB high 21.9 19.4 2.5 20.8 19.6 1.2
100% RB 21.7 19.2 2.5 20.6 19.5 1.1
40185 / 2549.5
1 RB low 22.8 19.4 3.4 22.3 19.6 2.7
1 RB mid 22.8 19.3 3.5 22.2 19.6 2.6
1 RB high 22.7 19.1 3.6 22.0 19.5 2.5
50% RB low 21.9 19.5 2.4 20.9 19.5 1.4
50% RB mid 21.9 19.4 2.5 21.0 19.5 1.5
50% RB high 21.9 19.4 2.5 20.9 19.4 1.5
100% RB 21.9 19.4 2.5 20.9 19.4 1.5
40620 / 2593.0
1 RB low 22.8 19.4 3.4 22.3 20.2 2.1
1 RB mid 22.8 19.7 3.1 22.3 20.2 2.1
1 RB high 22.7 19.7 3.0 22.2 20.2 2.0
50% RB low 21.7 19.6 2.1 20.7 19.6 1.1
50% RB mid 21.8 19.6 2.2 20.9 19.6 1.3
50% RB high 21.8 19.6 2.2 20.8 19.6 1.2
100% RB 21.8 19.6 2.2 20.8 19.5 1.3
41055 / 2636.5
1 RB low 23.3 20.3 3.0 22.6 20.5 2.1
1 RB mid 23.2 20.1 3.1 22.5 20.5 2.0
1 RB high 23.2 20.1 3.1 22.4 20.4 2.0
50% RB low 22.4 20.4 2.0 21.4 20.3 1.1
50% RB mid 22.4 20.3 2.1 21.3 20.3 1.0
50% RB high 22.4 20.3 2.1 21.3 20.3 1.0
100% RB 22.4 20.3 2.1 21.4 20.3 1.1
41565 / 2687.5
1 RB low 22.5 19.6 2.9 21.8 19.8 2.0
1 RB mid 22.2 19.4 2.8 21.5 19.5 2.0
1 RB high 21.8 18.9 2.9 21.1 19.1 2.0
50% RB low 21.6 19.7 1.9 20.7 19.6 1.1
50% RB mid 21.4 19.6 1.8 20.4 19.4 1.0
50% RB high 21.2 19.3 1.9 20.2 19.2 1.0
100% RB 21.4 19.6 1.8 20.4 19.4 1.0

Test report no.: 1-0042/15-01-15-A
Page 60 of 223
Bandwidth (MHz)
Channel / Frequency
(MHz)
Resource block
allocation
Pavg (dBm)
Pavg (dBm) back off dev.
dB
Pavg (dBm)
Pavg (dBm) back off dev.
dB QPSK QPSK 16-QAM 16-QAM
10
39700 / 2501.0
1 RB low 22.2 18.5 3.7 21.4 19.1 2.3
1 RB mid 23.4 19.6 3.8 22.5 20.3 2.2
1 RB high 23.1 19.7 3.4 22.2 19.8 2.4
50% RB low 21.7 19.2 2.5 20.7 19.5 1.2
50% RB mid 22.3 19.9 2.4 21.3 20.1 1.2
50% RB high 22.1 19.8 2.3 21.1 19.9 1.2
100% RB 22.0 19.7 2.3 21.0 20.0 1.0
40185 / 2549.5
1 RB low 22.8 19.3 3.5 21.8 19.3 2.5
1 RB mid 22.9 19.3 3.6 21.8 19.3 2.5
1 RB high 22.5 18.9 3.6 21.5 19.1 2.4
50% RB low 21.9 19.5 2.4 20.9 19.5 1.4
50% RB mid 22.0 19.5 2.5 21.0 19.5 1.5
50% RB high 21.8 19.3 2.5 20.8 19.3 1.5
100% RB 21.9 19.5 2.4 20.9 19.5 1.4
40620 / 2593.0
1 RB low 22.6 19.3 3.3 22.1 19.9 2.2
1 RB mid 22.7 19.4 3.3 22.1 20.2 1.9
1 RB high 22.5 19.6 2.9 22.0 20.0 2.0
50% RB low 21.7 19.6 2.1 20.8 19.6 1.2
50% RB mid 21.7 19.7 2.0 20.9 19.7 1.2
50% RB high 21.6 19.6 2.0 20.7 19.6 1.1
100% RB 21.6 19.6 2.0 20.8 19.6 1.2
41055 / 2636.5
1 RB low 23.1 20.2 2.9 22.3 20.5 1.8
1 RB mid 23.2 20.2 3.0 22.4 20.3 2.1
1 RB high 23.0 19.9 3.1 22.1 20.0 2.1
50% RB low 22.3 20.3 2.0 21.4 20.4 1.0
50% RB mid 22.4 20.4 2.0 21.4 20.4 1.0
50% RB high 22.2 20.2 2.0 21.3 20.3 1.0
100% RB 22.3 20.3 2.0 21.4 20.3 1.1
41540 / 2685.0
1 RB low 22.4 19.7 2.7 21.4 19.7 1.7
1 RB mid 22.5 19.7 2.8 21.4 19.6 1.8
1 RB high 21.6 18.8 2.8 20.6 18.5 2.1
50% RB low 21.7 19.9 1.8 20.7 19.8 0.9
50% RB mid 21.7 19.8 1.9 20.7 19.7 1.0
50% RB high 21.3 19.4 1.9 20.3 19.3 1.0
100% RB 21.6 19.7 1.9 20.6 19.6 1.0

Test report no.: 1-0042/15-01-15-A
Page 61 of 223
Bandwidth (MHz)
Channel / Frequency
(MHz)
Resource block
allocation
Pavg (dBm)
Pavg (dBm) back off dev.
dB
Pavg (dBm)
Pavg (dBm) back off dev.
dB QPSK QPSK 16-QAM 16-QAM
15
39725 / 2503.5
1 RB low 23.1 19.3 3.8 22.2 19.9 2.3
1 RB mid 23.3 19.8 3.5 22.4 20.0 2.4
1 RB high 23.8 20.4 3.4 22.9 20.6 2.3
50% RB low 22.1 19.7 2.4 21.2 20.1 1.1
50% RB mid 22.3 20.0 2.3 21.4 20.1 1.3
50% RB high 22.5 20.1 2.4 21.5 20.2 1.3
100% RB 22.3 19.9 2.4 21.3 19.9 1.4
40185 / 2549.5
1 RB low 23.5 19.9 3.6 22.8 20.2 2.6
1 RB mid 22.8 19.3 3.5 22.1 19.6 2.5
1 RB high 23.1 19.4 3.7 22.4 20.2 2.2
50% RB low 22.1 19.7 2.4 21.1 19.7 1.4
50% RB mid 22.0 19.6 2.4 21.0 19.6 1.4
50% RB high 21.9 19.5 2.4 20.9 19.6 1.3
100% RB 21.9 19.6 2.3 21.0 19.6 1.4
40620 / 2593.0
1 RB low 23.3 19.8 3.5 22.8 20.6 2.2
1 RB mid 22.7 19.7 3.0 22.2 20.2 2.0
1 RB high 23.2 19.8 3.4 22.6 20.6 2.0
50% RB low 21.8 19.7 2.1 20.9 19.8 1.1
50% RB mid 21.8 19.7 2.1 20.9 19.8 1.1
50% RB high 21.8 19.7 2.1 20.9 19.8 1.1
100% RB 21.8 19.7 2.1 20.8 19.7 1.1
41055 / 2636.5
1 RB low 23.8 20.6 3.2 23.0 21.0 2.0
1 RB mid 23.2 20.2 3.0 22.4 20.3 2.1
1 RB high 23.5 20.5 3.0 22.7 20.4 2.3
50% RB low 22.4 20.4 2.0 21.5 20.5 1.0
50% RB mid 22.4 20.4 2.0 21.5 20.5 1.0
50% RB high 22.4 20.4 2.0 21.5 20.5 1.0
100% RB 22.3 20.4 1.9 21.4 20.4 1.0
41515 / 2682.5
1 RB low 23.0 20.1 2.9 22.3 20.4 1.9
1 RB mid 22.5 19.7 2.8 21.8 20.0 1.8
1 RB high 22.2 19.3 2.9 21.5 19.3 2.2
50% RB low 21.8 20.1 1.7 20.8 20.1 0.7
50% RB mid 21.8 19.9 1.9 20.8 19.9 0.9
50% RB high 21.6 19.7 1.9 20.6 19.6 1.0
100% RB 21.7 19.8 1.9 20.8 19.9 0.9

Test report no.: 1-0042/15-01-15-A
Page 62 of 223
Bandwidth (MHz)
Channel / Frequency
(MHz)
Resource block
allocation
Pavg (dBm)
Pavg (dBm) back off dev.
dB
Pavg (dBm)
Pavg (dBm) back off dev.
dB QPSK QPSK 16-QAM 16-QAM
20
39750 / 2506.0
1 RB low 23.10 19.4 3.7 22.4 20.2 2.2
1 RB mid 23.50 20.0 3.5 22.7 20.3 2.4
1 RB high 23.70 20.1 3.6 23.0 20.5 2.5
50% RB low 22.60 20.3 2.3 21.6 20.6 1.0
50% RB mid 22.50 20.2 2.3 21.5 20.2 1.3
50% RB high 22.50 20.4 2.1 21.5 20.5 1.0
100% RB 22.80 20.4 2.4 21.8 20.4 1.4
40185 / 2549.5
1 RB low 23.40 20.0 3.4 22.6 20.3 2.3
1 RB mid 22.80 19.4 3.4 22.1 19.6 2.5
1 RB high 23.10 19.3 3.8 22.3 20.1 2.2
50% RB low 22.50 19.9 2.6 21.6 20.0 1.6
50% RB mid 22.00 19.6 2.4 21.1 19.6 1.5
50% RB high 22.20 19.6 2.6 21.3 20.0 1.3
100% RB 22.40 19.8 2.6 21.5 19.9 1.6
40620 / 2593.0
1 RB low 23.30 19.8 3.5 22.6 20.4 2.2
1 RB mid 22.70 19.7 3.0 21.9 19.9 2.0
1 RB high 23.20 19.9 3.3 22.4 20.5 1.9
50% RB low 22.20 20.0 2.2 21.3 20.1 1.2
50% RB mid 21.70 19.7 2.0 20.9 19.8 1.1
50% RB high 22.20 20.1 2.1 21.3 20.2 1.1
100% RB 22.20 20.0 2.2 21.2 20.1 1.1
41055 / 2636.5
1 RB low 23.70 20.7 3.0 23.0 21.2 1.8
1 RB mid 23.10 20.1 3.0 22.4 20.4 2.0
1 RB high 23.30 20.4 2.9 22.6 20.5 2.1
50% RB low 22.80 20.6 2.3 21.8 20.6 1.2
50% RB mid 22.40 20.4 2.0 21.4 20.4 1.0
50% RB high 22.70 20.4 2.3 21.7 20.5 1.2
100% RB 22.70 20.5 2.3 21.8 20.5 1.3
41490 / 2680.0
1 RB low 22.70 20.0 2.7 21.9 20.2 1.7
1 RB mid 22.40 19.7 2.7 21.7 19.9 1.8
1 RB high 22.40 19.3 3.1 21.6 19.4 2.2
50% RB low 21.80 20.1 1.7 20.9 20.2 0.7
50% RB mid 21.80 20.0 1.8 20.8 20.0 0.8
50% RB high 21.80 20.0 1.8 20.8 19.8 1.0
100% RB 21.70 20.1 1.6 20.8 20.1 0.7 Table 37: Test results conducted power measurement LTE FDD 41 2600 MHz.

Test report no.: 1-0042/15-01-15-A
Page 63 of 223
7.1.13 Justification of SAR measurements in LTE mode According to Chapter 5 ‘SAR test procedures for LTE devices of FCC KDB Publication 941225 D05 the following test configurations for standalone measurements of the largest channel bandwidth (chapter 5.2) had to be taken into consideration: 5.2.1. QPSK with 1 RB allocation Start with the largest channel bandwidth and measure SAR for QPSK with 1 RB allocation, using the RB offset and required test channel combination with the highest maximum output power for RB offsets at the upper edge, middle and lower edge of each required test channel. When the reported SAR is ≤ 0.8 W/kg, testing of the remaining RB offset configurations and required test channels is not required for 1 RB allocation; otherwise, SAR is required for the remaining required test channels and only for the RB offset configuration with the highest output power for that channel.6 When the reported SAR of a required test channel is > 1.45 W/kg, SAR is required for all three RB offset configurations for that required test channel. 5.2.2. QPSK with 50% RB allocation The procedures required for 1 RB allocation in 5.2.1 are applied to measure the SAR for QPSK with 50% RB allocation. 5.2.3. QPSK with 100% RB allocation For QPSK with 100% RB allocation, SAR is not required when the highest maximum output power for 100 % RB allocation is less than the highest maximum output power in 50% and 1 RB allocations and the highest reported SAR for 1 RB and 50% RB allocation in 5.2.1 and 5.2.2 are ≤ 0.8 W/kg. Otherwise, SAR is measured for the highest output power channel and if the reported SAR is > 1.45 W/kg, the remaining required test channels must also be tested. 5.2.4. Higher order modulations For each modulation besides QPSK; e.g., 16-QAM, 64-QAM, apply the QPSK procedures in sections 5.2.1, 5.2.2 and 5.2.3 to determine the QAM configurations that may need SAR measurement. For each configuration identified as required for testing, SAR is required only when the highest maximum output power for the configuration in the higher order modulation is > ½ dB higher than the same configuration in QPSK or when the reported SAR for the QPSK configuration is > 1.45 W/kg. Testing of other channel bandwidths was not necessary because the output power of equivalent channel configurations was less than ½ dB larger compared to the largest channel bandwidth and reported SAR was < 1.45 W/kg. Conducted and radiated measurements were performed with the maximum number of bundled TTIs supported by the DUT (see section 2.4 for details). 7.1.14 MPR information in LTE mode There is a permanently applied MPR implemented by the manufacturer. MPR is enabled for this device according to 3GPP TS36.101.
Modulation Channel bandwidth / resource block configuration Target
MPR 3 GPP MPR 1.4 MHz 3 MHz 5 MHz 10 MHz 15 MHz 20 MHz
QPSK > 5 > 4 > 8 > 12 > 16 > 18 1 ≤ 1 16QAM ≤ 5 ≤ 4 ≤ 8 ≤ 12 ≤ 16 ≤ 18 1 ≤ 1 16QAM > 5 > 4 > 8 > 12 > 16 > 18 2 ≤ 2
Therefore there is no power reduction at 1.4 MHz bandwidth with 50% RB allocation (3 RBs). Additional differences in conducted power are not caused by implemented MPR but depend on measurement uncertainty and allowable tolerances per 3GPP or tune-up. A-MPR was disabled for all SAR tests.

Test report no.: 1-0042/15-01-15-A
Page 64 of 223
7.1.15 LTE TDD test configuration LTE Devices using Time-Division Duplex (TDD) Systems must be tested using a fixed periodic duty factor according the highest transmission duty factor implemented for the device and supported by the Defined 3GPP LTE TDD configurations. (FCC KDB 941225 D05 SAR for LTE Devices v02r03) TDD LTE Band 38 and 41 support Type 2 Frame Structure as described in the following tables from the 3GPP TS 36.211 section 4.2.

Test report no.: 1-0042/15-01-15-A
Page 65 of 223
Figure 4.2-1 shows that a radio frame is divided in ten subframes that consist of Uplink- / Downlink- and Special-subframes. The Duty Cycle for LTE TDD should be calculated on Uplink-subframes and Special- subframes as both contain Uplink transmissions. The following formula is used for the calculation of the Duty Cycle. (With Uplink-subframes counted according the table 4.2-2) Duty Cycle = (30720TS×Ups+Uplink Component×Specials)/(307200Ts) According to table 4.2-1 the Uplink component of the Special-subframes is: Uplink Component=UpPTS This results in the following formula: Duty Cycle = [30720TS×Ups+UpPTS×Specials]/(307200Ts) The measured configuration of the device, which results in the highest output, was derived from the following table:
Uplink-downlink
configuration
Subframe number
Configuration of special subframe
Normal cyclic prefix in downlink Extended cyclic prefix in downlink
Normal cyclic prefix in uplink Extended cyclic prefix in
uplink Normal cyclic prefix in uplink Extended cyclic prefix in
uplink
D S U configuration 0 ~ 4
configuration 5 ~ 9
configuration 0 ~ 4
configuration 5 ~ 9
configuration 0 ~ 3
configuration 4 ~ 7
configuration 0 ~ 3
configuration 4 ~ 7
0 2 2 6 61.43% 62.85% 61.67% 63.33% 61.43% 62.85% 61.67% 63.33%
1 4 2 4 41.43% 42.85% 41.67% 43.33% 41.43% 42.85% 41.67% 43.33%
2 6 2 2 21.43% 22.85% 21.67% 23.33% 21.43% 22.85% 21.67% 23.33%
3 6 1 3 30.71% 31.43% 30.83% 31.67% 30.71% 31.43% 30.83% 31.67%
4 7 1 2 20.71% 21.43% 20.83% 21.67% 20.71% 21.43% 20.83% 21.67%
5 8 1 1 10.71% 11.43% 10.83% 11.67% 10.71% 11.43% 10.83% 11.67%
6 3 2 1 51.43% 52.85% 51.67% 53.33% 51.43% 52%.85 51.67% 53.33%
Therefore SAR for LTE TDD should be tested with the highest transmission duty factor (63.33%) using Uplink-downlink configuration 0 and Special-subframe configuration 7 (Frame structure type 2).

Test report no.: 1-0042/15-01-15-A
Page 66 of 223
7.1.16 Carrier Aggregation LTE FDD 7 (Intra Band)
CA - Conducted Output Power LTE FDD 7 - Intra-Band
PCC with activated SCC
Bandwidth (MHz)
Channel / Frequency (MHz)
Resource block
allocation
Average Output Power (dBm)
3300 / 2675 MHZ DL BW 20 MHz
3300 / 2675 MHZ DL BW 15 MHz
3300 / 2675 MHZ DL BW 10 MHz
QPSK (dBm) (dBm) (dBm)
10 UL: 20800 / 2505.0 DL: 2800 / 2625.0
1 RB low 23.3 23.2 23.2 23.3
15 UL: 20825 / 2507.5 DL: 2825 / 2627.5
1 RB low 23.2 23.1 23.1 23.1
20 UL: 20850 / 2510.0 DL: 2850 / 2630.0
1 RB low 23.1 23.1 23.1 23.1
Table 38: Test results conducted power measurement LTE FDD 7 2600 MHz – CA – Intra Band.
CA - Conducted Output Power LTE FDD 7 - Intra-Band with MHS mode activated / power back off
PCC with activated SCC
Bandwidth (MHz)
Channel / Frequency (MHz)
Resource block
allocation
Average Output Power (dBm)
3300 / 2675 MHZ DL BW 20 MHz
3300 / 2675 MHZ DL BW 15 MHz
3300 / 2675 MHZ DL BW 10 MHz
QPSK (dBm) (dBm) (dBm)
10 UL: 20800 / 2505.0 DL: 2800 / 2625.0
1 RB low 1 RB mid 20.3 20.3 20.3
15 UL: 20825 / 2507.5 DL: 2825 / 2627.5
1 RB low 1 RB low 20.2 20.2 20.2
20 UL: 20850 / 2510.0 DL: 2850 / 2630.0
1 RB low 1 RB low 20.0 20.0 20.0
Table 39: Test results conducted power measurement LTE FDD 7 2600 MHz – CA – Intra Band with MHS mode activated / power back off.

Test report no.: 1-0042/15-01-15-A
Page 67 of 223
THE TESTS FOR WLAN WERE PERFORMED BY THE APPLICANT ITSELF.
7.1.17 Conducted power measurements WLAN 5 GHz Primary Antenna:
802.11b maximum average conducted output power [dBm]
Band [MHz]
Ch MHS /
Back off 1Mbps 2Mbps 5.5Mbps 11Mbps 22Mbps
2450 1
Off 16.8 -- -- -- --
On 10.1 -- 10.2 -- 10.2
6
Off 17.3 -- -- -- --
On 10.2 -- 10.4 -- 10.4
11 Off 17.9 18.1 18.0 18.0 --
On 10.8 -- 10.9 -- 11.0 Table 40: Test results conducted power measurement 802.11b
802.11g maximum average conducted output power [dBm] Band [MHz]
Ch MHS /
Back off 6Mbps 9Mbps 12Mbps 18Mbps 24Mbps 36Mbps 48Mbps 54Mbps
2450 1
Off 16.0 -- -- -- -- -- -- --
On 10.7 -- -- -- 10.8 -- -- 10.7
6
Off 16.2 -- -- -- -- -- -- --
On 11.0 -- -- -- 11.0 -- -- 11.2
11
Off 16.8 16.8 16.8 16.8 -- 16.1 -- 15.6
On 11.3 -- -- -- 11.5 -- -- 11.6 Table 41: Test results conducted power measurement 802.11g
802.11n HT-20 maximum average conducted output power [dBm]
Band Ch MHS /
Back off MCS-0 MCS-1 MCS-2 MCS-3 MCS-4 MCS-5 MCS-6 MCS-7
6.5Mbps 13Mbps 19.5Mbps 26Mbps 39Mbps 52Mbps 58.5Mbps 65Mbps
2450 1
Off 15.7 -- -- -- -- -- -- --
On 10.5 -- -- -- 10.8 -- -- 10.5
6
Off 16.3 -- -- -- -- -- -- --
On 11.0 -- -- -- 11.3 -- -- 11.0
11
Off 16.8 16.7 16.6 -- -- 15.7 -- 14.3
On 11.2 -- -- -- 11.2 -- -- 11.3 Table 42: Test results conducted power measurement 802.11n HT-20
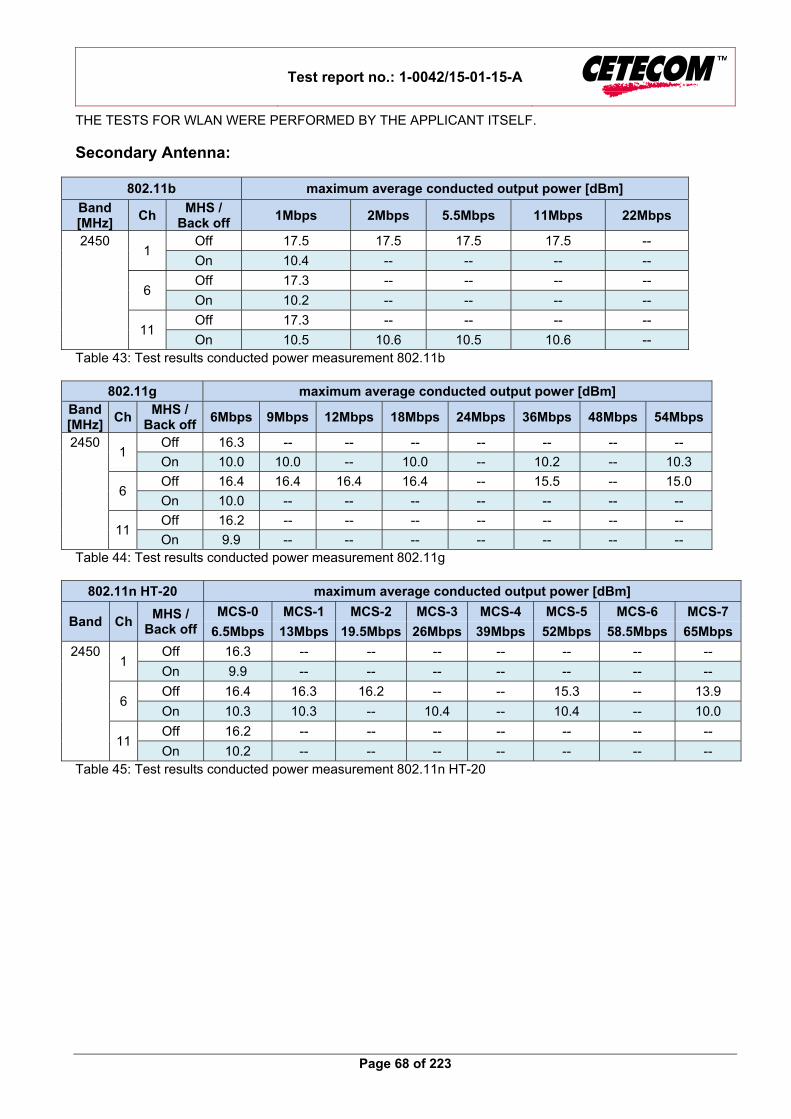
Test report no.: 1-0042/15-01-15-A
Page 68 of 223
THE TESTS FOR WLAN WERE PERFORMED BY THE APPLICANT ITSELF.
Secondary Antenna:
802.11b maximum average conducted output power [dBm]
Band [MHz]
Ch MHS /
Back off 1Mbps 2Mbps 5.5Mbps 11Mbps 22Mbps
2450 1
Off 17.5 17.5 17.5 17.5 --
On 10.4 -- -- -- --
6
Off 17.3 -- -- -- --
On 10.2 -- -- -- --
11 Off 17.3 -- -- -- --
On 10.5 10.6 10.5 10.6 -- Table 43: Test results conducted power measurement 802.11b
802.11g maximum average conducted output power [dBm] Band [MHz]
Ch MHS /
Back off 6Mbps 9Mbps 12Mbps 18Mbps 24Mbps 36Mbps 48Mbps 54Mbps
2450 1
Off 16.3 -- -- -- -- -- -- --
On 10.0 10.0 -- 10.0 -- 10.2 -- 10.3
6
Off 16.4 16.4 16.4 16.4 -- 15.5 -- 15.0
On 10.0 -- -- -- -- -- -- --
11
Off 16.2 -- -- -- -- -- -- --
On 9.9 -- -- -- -- -- -- -- Table 44: Test results conducted power measurement 802.11g
802.11n HT-20 maximum average conducted output power [dBm]
Band Ch MHS /
Back off MCS-0 MCS-1 MCS-2 MCS-3 MCS-4 MCS-5 MCS-6 MCS-7
6.5Mbps 13Mbps 19.5Mbps 26Mbps 39Mbps 52Mbps 58.5Mbps 65Mbps
2450 1
Off 16.3 -- -- -- -- -- -- --
On 9.9 -- -- -- -- -- -- --
6
Off 16.4 16.3 16.2 -- -- 15.3 -- 13.9
On 10.3 10.3 -- 10.4 -- 10.4 -- 10.0
11
Off 16.2 -- -- -- -- -- -- --
On 10.2 -- -- -- -- -- -- -- Table 45: Test results conducted power measurement 802.11n HT-20

Test report no.: 1-0042/15-01-15-A
Page 69 of 223
THE TESTS FOR WLAN WERE PERFORMED BY THE APPLICANT ITSELF.
7.1.18 Conducted power measurements WLAN 5 GHz Primary Antenna:
802.11a maximum average conducted output power [dBm] Band Ch 6Mbps 9Mbps 12Mbps 18Mbps 24Mbps 36Mbps 48Mbps 54Mbps5200 36 15.0 --- --- --- --- --- --- ---
40 15.1 --- --- --- --- --- --- --- 44 15.0 --- --- --- --- --- --- --- 48 15.3 15.3 15.2 15.2 14.0 --- --- 14.0
5300 52 15.1 --- --- --- --- --- --- --- 56 15.0 --- --- --- --- --- --- --- 60 15.0 --- --- --- --- --- --- --- 64 15.3 15.2 15.0 15.0 14.1 --- --- 14.0
5600 100 14.9 --- --- --- --- --- --- --- 104 15.0 --- --- --- --- --- --- --- 108 15.1 --- --- --- --- --- --- --- 112 15.1 --- --- --- --- --- --- --- 116 15.2 --- --- --- --- --- --- --- 120 15.2 --- --- --- --- --- --- --- 124 15.2 --- --- --- --- --- --- --- 128 15.4 15.3 15.2 15.2 14.0 --- --- 14.1 132 15.3 --- --- --- --- --- --- --- 136 15.3 --- --- --- --- --- --- --- 140 15.1 --- --- --- --- --- --- ---
5800 149 15.8 --- --- --- --- --- --- --- 153 15.9 15.7 15.7 15.7 14.4 --- --- 14.3 157 15.6 --- --- --- --- --- --- --- 161 15.4 --- --- --- --- --- --- --- 165 15.3 --- --- --- --- --- --- ---
Table 46: Test results conducted power measurement 802.11a
802.11a maximum average conducted output power [dBm] MHS / Power back off active
Band Ch 6Mbps 9Mbps 12Mbps 18Mbps 24Mbps 36Mbps 48Mbps 54Mbps5200 36 10.0 --- --- --- 10.0 --- --- 10.0
40 10.3 --- --- --- 10.3 --- --- 9.9 44 10.3 --- --- --- 10.2 --- --- 10.3 48 10.4 --- --- --- 10.3 --- --- 10.4
5800 149 10.7 --- --- --- 10.7 --- --- 10.7 153 10.7 --- --- --- 10.7 --- --- 10.5 157 10.6 --- --- --- 10.6 --- --- 10.6 161 10.5 --- --- --- 10.5 --- --- 10.4 165 10.3 --- --- --- 10.3 --- --- 10.3
Table 47: Test results conducted power measurement 802.11a – MHS /Power back off active

Test report no.: 1-0042/15-01-15-A
Page 70 of 223
THE TESTS FOR WLAN WERE PERFORMED BY THE APPLICANT ITSELF.
802.11n HT-20 maximum average conducted output power [dBm]
Band [MHz]
Ch MCS-0 MCS-1 MCS-2 MCS-3 MCS-4 MCS-5 MCS-6 MCS-7 MCS-8 6.5Mbps 13Mbps 19.5Mbps 26Mbps 39Mbps 52Mbps 58.5Mbps 65Mbps 78Mbps
5200 48 15.1 15.0 15.1 14.1 --- 13.9 --- 13.3 --- 5300 64 15.0 14.9 14.9 14.1 --- 14.0 --- 13.0 --- 5600 128 15.3 15.3 15.3 14.1 --- 13.7 --- 13.0 --- 5800 153 15.5 15.5 15.5 14.5 --- 14.0 --- 13.4 ---
Table 48: Test results conducted power measurement 802.11n HT-20
802.11n HT-20 maximum average conducted output power [dBm] MHS / Power back off active
Band [MHz]
Ch MCS-0 MCS-1 MCS-2 MCS-3 MCS-4 MCS-5 MCS-6 MCS-7 MCS-8 6.5Mbps 13Mbps 19.5Mbps 26Mbps 39Mbps 52Mbps 58.5Mbps 65Mbps 78Mbps
5200 48 10.5 --- --- --- 10.5 --- --- 10.2 ---5800 149 10.6 --- --- --- 10.6 --- --- 10.8 ---
Table 49: Test results conducted power measurement 802.11n HT-20 – MHS /Power back off active
802.11ac VHT-20 maximum average conducted output power [dBm] Band [MHz]
Ch MCS-0 MCS-1 MCS-2 MCS-3 MCS-4 MCS-5 MCS-6 MCS-7 MCS-8 MCS-9 6.5Mbps 13Mbps 19.5Mbps 26Mbps 39Mbps 52Mbps 58.5Mbps 65Mbps 78Mbps
5200 36 14.8 --- --- --- --- --- --- --- --- --- 40 15.0 --- --- --- --- --- --- --- --- --- 44 15.0 --- --- --- --- --- --- --- --- --- 48 15.1 15.1 15.1 14.1 --- 13.9 --- 13.3 --- 6.4
5300 52 14.8 --- --- --- --- --- --- --- --- --- 56 14.9 --- --- --- --- --- --- --- --- --- 60 14.9 --- --- --- --- --- --- --- --- --- 64 15.1 15.1 15.0 14.1 --- 14.1 --- 13.1 --- 4.7
5600 100 14.7 --- --- --- --- --- --- --- --- --- 104 14.9 --- --- --- --- --- --- --- --- --- 108 15.0 --- --- --- --- --- --- --- --- --- 112 14.9 --- --- --- --- --- --- --- --- --- 116 15.0 --- --- --- --- --- --- --- --- --- 120 15.1 --- --- --- --- --- --- --- --- --- 124 15.2 15.2 15.2 14.0 --- 13.9 --- 13.1 --- 4.9 128 15.2 --- --- --- --- --- --- --- --- --- 132 15.2 --- --- --- --- --- --- --- --- --- 136 15.2 --- --- --- --- --- --- --- --- --- 140 15.1 --- --- --- --- --- --- --- --- ---
5800 149 15.8 15.8 15.8 14.8 --- 14.5 --- 13.5 --- 5.4 153 15.8 --- --- --- --- --- --- --- --- --- 157 15.5 --- --- --- --- --- --- --- --- --- 161 15.3 --- --- --- --- --- --- --- --- --- 165 15.2 --- --- --- --- --- --- --- --- ---
Table 50: Test results conducted power measurement 802.11ac VHT-20
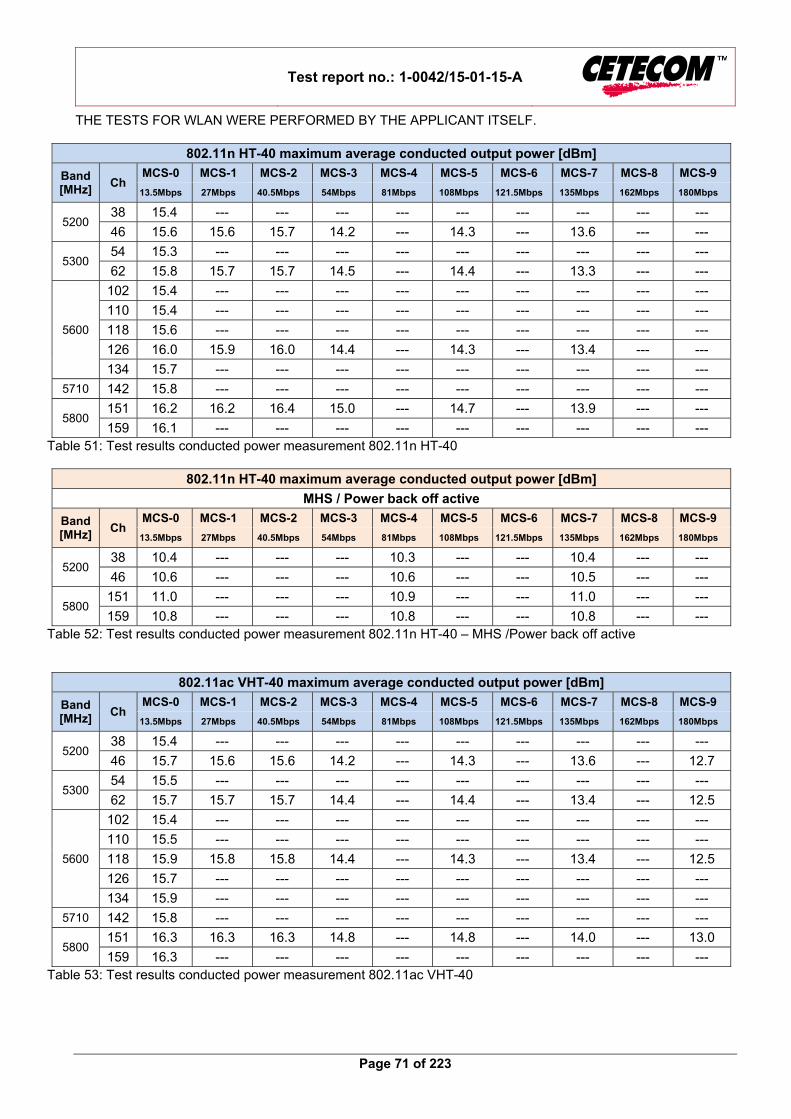
Test report no.: 1-0042/15-01-15-A
Page 71 of 223
THE TESTS FOR WLAN WERE PERFORMED BY THE APPLICANT ITSELF.
802.11n HT-40 maximum average conducted output power [dBm]
Band [MHz]
Ch MCS-0 MCS-1 MCS-2 MCS-3 MCS-4 MCS-5 MCS-6 MCS-7 MCS-8 MCS-9
13.5Mbps 27Mbps 40.5Mbps 54Mbps 81Mbps 108Mbps 121.5Mbps 135Mbps 162Mbps 180Mbps
5200 38 15.4 --- --- --- --- --- --- --- --- ---
46 15.6 15.6 15.7 14.2 --- 14.3 --- 13.6 --- ---
5300 54 15.3 --- --- --- --- --- --- --- --- ---
62 15.8 15.7 15.7 14.5 --- 14.4 --- 13.3 --- ---
5600
102 15.4 --- --- --- --- --- --- --- --- ---
110 15.4 --- --- --- --- --- --- --- --- ---
118 15.6 --- --- --- --- --- --- --- --- ---
126 16.0 15.9 16.0 14.4 --- 14.3 --- 13.4 --- ---
134 15.7 --- --- --- --- --- --- --- --- ---
5710 142 15.8 --- --- --- --- --- --- --- --- ---
5800 151 16.2 16.2 16.4 15.0 --- 14.7 --- 13.9 --- ---
159 16.1 --- --- --- --- --- --- --- --- --- Table 51: Test results conducted power measurement 802.11n HT-40
802.11n HT-40 maximum average conducted output power [dBm]
MHS / Power back off active
Band [MHz]
Ch MCS-0 MCS-1 MCS-2 MCS-3 MCS-4 MCS-5 MCS-6 MCS-7 MCS-8 MCS-9
13.5Mbps 27Mbps 40.5Mbps 54Mbps 81Mbps 108Mbps 121.5Mbps 135Mbps 162Mbps 180Mbps
5200 38 10.4 --- --- --- 10.3 --- --- 10.4 --- ---
46 10.6 --- --- --- 10.6 --- --- 10.5 --- ---
5800 151 11.0 --- --- --- 10.9 --- --- 11.0 --- ---
159 10.8 --- --- --- 10.8 --- --- 10.8 --- --- Table 52: Test results conducted power measurement 802.11n HT-40 – MHS /Power back off active
802.11ac VHT-40 maximum average conducted output power [dBm]
Band [MHz]
Ch MCS-0 MCS-1 MCS-2 MCS-3 MCS-4 MCS-5 MCS-6 MCS-7 MCS-8 MCS-9
13.5Mbps 27Mbps 40.5Mbps 54Mbps 81Mbps 108Mbps 121.5Mbps 135Mbps 162Mbps 180Mbps
5200 38 15.4 --- --- --- --- --- --- --- --- ---
46 15.7 15.6 15.6 14.2 --- 14.3 --- 13.6 --- 12.7
5300 54 15.5 --- --- --- --- --- --- --- --- ---
62 15.7 15.7 15.7 14.4 --- 14.4 --- 13.4 --- 12.5
5600
102 15.4 --- --- --- --- --- --- --- --- ---
110 15.5 --- --- --- --- --- --- --- --- ---
118 15.9 15.8 15.8 14.4 --- 14.3 --- 13.4 --- 12.5
126 15.7 --- --- --- --- --- --- --- --- ---
134 15.9 --- --- --- --- --- --- --- --- ---
5710 142 15.8 --- --- --- --- --- --- --- --- ---
5800 151 16.3 16.3 16.3 14.8 --- 14.8 --- 14.0 --- 13.0
159 16.3 --- --- --- --- --- --- --- --- --- Table 53: Test results conducted power measurement 802.11ac VHT-40

Test report no.: 1-0042/15-01-15-A
Page 72 of 223
THE TESTS FOR WLAN WERE PERFORMED BY THE APPLICANT ITSELF.
802.11ac VHT-80 maximum average conducted output power [dBm]
Band Ch MCS-0 MCS-1 MCS-2 MCS-3 MCS-4 MCS-5 MCS-6 MCS-7 MCS-8 MCS-9
29.3Mbps 58.5Mbps 87.8Mbps 117Mbps 175.5Mbps 234Mbps 263.3Mbps 292.5Mbps 351Mbps 390Mbps
5200 42 14.0 14.0 14.0 13.8 --- 13.8 --- 13.0 --- 11.4
5300 58 14.0 14.0 13.9 13.7 --- 13.7 --- 12.8 --- 10.9
5600
106 13.8 --- --- --- --- --- --- --- --- ---
122 14.1 14.0 14.0 13.7 --- 13.7 --- 12.8 --- 10.4
138 14.0 --- --- --- --- --- --- --- --- ---
5800 155 14.5 14.5 14.5 14.1 --- 14.1 --- 13.3 --- 10.9 Table 54: Test results conducted power measurement 802.11ac VHT-80

Test report no.: 1-0042/15-01-15-A
Page 73 of 223
THE TESTS FOR WLAN WERE PERFORMED BY THE APPLICANT ITSELF.
Secondary Antenna:
802.11a maximum average conducted output power [dBm] Band Ch 6Mbps 9Mbps 12Mbps 18Mbps 24Mbps 36Mbps 48Mbps 54Mbps5200 36 16.6 16.6 16.6 16.6 15.5 --- --- 15.5
40 16.5 --- --- --- --- --- --- --- 44 16.4 --- --- --- --- --- --- --- 48 16.3 --- --- --- --- --- --- ---
5300 52 15.4 --- --- --- --- --- --- --- 56 15.3 --- --- --- --- --- --- --- 60 15.4 --- --- --- --- --- --- --- 64 15.5 15.5 15.5 15.5 14.5 --- --- 14.5
5600 100 15.8 15.8 15.8 15.8 14.7 --- --- 14.7 104 15.7 --- --- --- --- --- --- --- 108 15.7 --- --- --- --- --- --- --- 112 15.4 --- --- --- --- --- --- --- 116 15.5 --- --- --- --- --- --- --- 120 15.2 --- --- --- --- --- --- --- 124 15.1 --- --- --- --- --- --- --- 128 14.8 --- --- --- --- --- --- --- 132 14.8 --- --- --- --- --- --- --- 136 14.5 --- --- --- --- --- --- --- 140 14.2 --- --- --- --- --- --- ---
5800 149 15.2 15.2 15.2 15.2 13.9 --- --- 13.9 153 15.0 --- --- --- --- --- --- --- 157 15.0 --- --- --- --- --- --- --- 161 15.0 --- --- --- --- --- --- --- 165 14.9 --- --- --- --- --- --- ---
Table 55: Test results conducted power measurement 802.11a
802.11a maximum average conducted output power [dBm] MHS / Power back off active
Band Ch 6Mbps 9Mbps 12Mbps 18Mbps 24Mbps 36Mbps 48Mbps 54Mbps5200 36 11.2 --- --- --- 11.2 --- --- 11.2
40 11.1 --- --- --- 11.1 --- --- 11.1 44 10.8 --- --- --- 10.7 --- --- 10.8 48 10.7 --- --- --- 10.6 --- --- 10.7
5800 149 9.8 --- --- --- 9.8 --- --- 9.6 153 9.7 --- --- --- 9.5 --- --- 9.7 157 9.5 --- --- --- 9.5 --- --- 9.4 161 9.6 --- --- --- 9.6 --- --- 9.3 165 9.4 --- --- --- 9.3 --- --- 9.4
Table 56: Test results conducted power measurement 802.11a – MHS /Power back off active

Test report no.: 1-0042/15-01-15-A
Page 74 of 223
THE TESTS FOR WLAN WERE PERFORMED BY THE APPLICANT ITSELF.
802.11n HT-20 maximum average conducted output power [dBm]
Band [MHz]
Ch MCS-0 MCS-1 MCS-2 MCS-3 MCS-4 MCS-5 MCS-6 MCS-7 MCS-8 6.5Mbps 13Mbps 19.5Mbps 26Mbps 39Mbps 52Mbps 58.5Mbps 65Mbps 78Mbps
5200 36 16.6 16.6 16.6 15.5 --- 15.5 --- 14.5 --- 5300 64 15.5 15.5 15.5 14.4 --- 14.3 --- 13.5 --- 5600 100 15.8 15.8 15.8 14.8 --- 14.8 --- 13.5 --- 5800 149 15.2 15.2 15.2 14.1 --- 14.1 --- 13.0 ---
Table 57: Test results conducted power measurement 802.11n HT-20
802.11n HT-20 maximum average conducted output power [dBm] MHS / Power back off active
Band [MHz]
Ch MCS-0 MCS-1 MCS-2 MCS-3 MCS-4 MCS-5 MCS-6 MCS-7 MCS-8 6.5Mbps 13Mbps 19.5Mbps 26Mbps 39Mbps 52Mbps 58.5Mbps 65Mbps 78Mbps
5200 36 11.3 --- --- --- 11.3 --- --- 11.1 ---5800 149 9.9 --- --- --- 9.9 --- --- 9.6 ---
Table 58: Test results conducted power measurement 802.11n HT-20 – MHS /Power back off active
802.11ac VHT-20 maximum average conducted output power [dBm] Band [MHz]
Ch MCS-0 MCS-1 MCS-2 MCS-3 MCS-4 MCS-5 MCS-6 MCS-7 MCS-8 MCS-9 6.5Mbps 13Mbps 19.5Mbps 26Mbps 39Mbps 52Mbps 58.5Mbps 65Mbps 78Mbps
5200 36 16.6 16.5 16.5 15.5 --- 15.5 --- 14.6 --- 7.9 40 16.4 --- --- --- --- --- --- --- --- --- 44 16.2 --- --- --- --- --- --- --- --- --- 48 16.1 --- --- --- --- --- --- --- --- ---
5300 52 15.4 --- --- --- --- --- --- --- --- --- 56 15.4 --- --- --- --- --- --- --- --- --- 60 15.3 --- --- --- --- --- --- --- --- --- 64 15.5 15.5 15.5 14.5 --- 14.5 --- 13.5 --- 5.3
5600 100 15.9 15.9 15.9 14.5 --- 14.5 --- 13.6 --- 5.5 104 15.6 --- --- --- --- --- --- --- --- --- 108 15.5 --- --- --- --- --- --- --- --- --- 112 15.3 --- --- --- --- --- --- --- --- --- 116 15.3 --- --- --- --- --- --- --- --- --- 120 15.1 --- --- --- --- --- --- --- --- --- 124 15.1 --- --- --- --- --- --- --- --- --- 128 14.6 --- --- --- --- --- --- --- --- --- 132 14.7 --- --- --- --- --- --- --- --- --- 136 14.4 --- --- --- --- --- --- --- --- --- 140 14.3 --- --- --- --- --- --- --- --- ---
5800 149 15.2 15.2 15.2 14.0 --- 14.1 --- 13.0 --- 5.0 153 15.0 --- --- --- --- --- --- --- --- --- 157 14.7 --- --- --- --- --- --- --- --- --- 161 14.6 --- --- --- --- --- --- --- --- --- 165 14.6 --- --- --- --- --- --- --- --- ---
Table 59: Test results conducted power measurement 802.11ac VHT-20

Test report no.: 1-0042/15-01-15-A
Page 75 of 223
THE TESTS FOR WLAN WERE PERFORMED BY THE APPLICANT ITSELF.
802.11n HT-40 maximum average conducted output power [dBm]
Band [MHz]
Ch MCS-0 MCS-1 MCS-2 MCS-3 MCS-4 MCS-5 MCS-6 MCS-7 MCS-8 MCS-9
13.5Mbps 27Mbps 40.5Mbps 54Mbps 81Mbps 108Mbps 121.5Mbps 135Mbps 162Mbps 180Mbps
5200 38 17.0 17.0 17.0 15.8 --- 15.8 --- 14.8 --- ---
46 17.0 17.0 17.0 15.5 --- 15.7 --- 14.6 --- ---
5300 54 16.1 16.1 16.1 15.0 --- 15.0 --- 13.8 --- ---
62 16.0 --- --- --- --- --- --- --- --- ---
5600
102 16.5 16.5 16.5 15.0 --- 15.0 --- 13.9 --- ---
110 16.3 --- --- --- --- --- --- --- --- ---
118 16.0 --- --- --- --- --- --- --- --- ---
126 15.6 15.6 15.6 14.3 --- 14.3 --- 13.4 --- ---
134 15.2 --- --- --- --- --- --- --- --- ---
5800 151 15.8 15.8 15.7 14.3 --- 14.3 --- 13.3 --- ---
159 15.4 --- --- --- --- --- --- --- --- --- Table 60: Test results conducted power measurement 802.11n HT-40
802.11n HT-40 maximum average conducted output power [dBm]
MHS / Power back off active
Band [MHz]
Ch MCS-0 MCS-1 MCS-2 MCS-3 MCS-4 MCS-5 MCS-6 MCS-7 MCS-8 MCS-9
13.5Mbps 27Mbps 40.5Mbps 54Mbps 81Mbps 108Mbps 121.5Mbps 135Mbps 162Mbps 180Mbps
5200 38 11.3 --- --- --- 11.0 --- --- 11.2 --- ---
46 11.1 --- --- --- 11.0 --- --- 11.1 --- ---
5800 151 10.2 --- --- --- 10.2 --- --- 10.1 --- ---
159 10.0 --- --- --- 9.9 --- --- 9.6 --- --- Table 61: Test results conducted power measurement 802.11n HT-40 – MHS /Power back off active
802.11ac VHT-40 maximum average conducted output power [dBm]
Band [MHz]
Ch MCS-0 MCS-1 MCS-2 MCS-3 MCS-4 MCS-5 MCS-6 MCS-7 MCS-8 MCS-9
13.5Mbps 27Mbps 40.5Mbps 54Mbps 81Mbps 108Mbps 121.5Mbps 135Mbps 162Mbps 180Mbps
5200 38 17.3 17.3 17.2 16.0 --- 15.7 --- 15.0 --- 14.0
46 17.0 --- --- --- --- --- --- --- --- ---
5300 54 16.0 --- --- --- --- --- --- --- --- ---
62 16.1 16.1 16.1 14.9 --- 14.9 --- 13.8 --- 12.9
5600
102 16.4 16.4 16.5 15.0 --- 15.0 --- 13.8 --- 13.0
110 16.2 --- --- --- --- --- --- --- --- ---
118 15.8 --- --- --- --- --- --- --- --- ---
126 15.5 --- --- --- --- --- --- --- --- ---
134 15.1 --- --- --- --- --- --- --- --- ---
5800 151 15.9 15.8 15.8 14.3 --- 14.3 --- 13.4 --- 12.6
159 15.8 --- --- --- --- --- --- --- --- --- Table 62: Test results conducted power measurement 802.11ac VHT-40

Test report no.: 1-0042/15-01-15-A
Page 76 of 223
THE TESTS FOR WLAN WERE PERFORMED BY THE APPLICANT ITSELF.
802.11ac VHT-80 maximum average conducted output power [dBm]
Band Ch MCS-0 MCS-1 MCS-2 MCS-3 MCS-4 MCS-5 MCS-6 MCS-7 MCS-8 MCS-9
29.3Mbps 58.5Mbps 87.8Mbps 117Mbps 175.5Mbps 234Mbps 263.3Mbps 292.5Mbps 351Mbps 390Mbps
5200 42 15.3 15.3 15.2 15.2 15.1 15.2 15.2 14.2 12.8 12.9
5300 58 14.2 14.2 --- 14.2 --- 14.2 --- 13.2 11.4 11.3
5600
106 14.6 14.6 --- 14.2 --- 14.3 --- 13.2 --- 10.9
122 14.0 --- --- --- --- --- --- --- --- ---
138 13.3 --- --- --- --- --- --- --- --- ---
5800 155 14.0 13.9 --- 13.7 --- 13.7 --- 12.7 --- 10.6 Table 63: Test results conducted power measurement 802.11ac VHT-80
THE TESTS FOR BLUETOOTH WERE PERFORMED BY THE APPLICANT ITSELF.
7.1.1 Conducted average power measurements Bluetooth 2.4 GHz
Channel Frequency (MHz)Average power (dBm)
GFSK π/4 DQPSK 8-DPSK 0 2402 5.5 3.0 3.1
39 2441 7.8 4.4 4.6
78 2480 5.4 1.6 1.6
Table 64: Test results conducted average power measurement Bluetooth 2.4 GHz

Test report no.: 1-0042/15-01-15-A
Page 77 of 223
7.2 SAR test results
7.2.1 General description of test procedures
The DUT is tested using CMU 200 and CMW 500 communications testers as controller unit to set test channels and maximum output power to the DUT, as well as for measuring the conducted peak power.
Test positions as described in the tables above are in accordance with the specified test standard. Tests in body position were performed in that configuration, which generates the highest time based
averaged output power (see conducted power results). Tests in head position with GSM were performed in voice mode with 1 timeslot unless
GPRS/EGPRS/DTM function allows parallel voice and data traffic on 2 or more timeslots (see section 2.4 for details).
UMTS was tested in RMC mode with 12.2 kbit/s and TPC bits set to ‘all 1’. WLAN was tested by the Applicant itself. For body worn operation, this device has been tested and meets FCC RF exposure guidelines when used
with any accessory that contains no metal and that positions the handset a minimum of 15 mm from the body. Use of other accessories may not ensure compliance with FCC RF exposure guidelines.
According to FCC KDB pub 941225 D06 this device has been tested with 10 mm distance to the phantom for operation in WLAN hot spot mode.
Per FCC KDB pub 941225 D06 the edges with antennas within 2.5 cm are required to be evaluated for SAR to cover WLAN hot spot function.
For SAR measurements test samples with fixed power back off have been used in GSM 1900, UMTS FDD II/IV and LTE FDD 2/4/7/41 mode for all configurations that require power back off during normal operation in hot spot mode.
According to IEEE 1528 the SAR test shall be performed at middle channel. Testing of top and bottom channel is optional.
According to KDB 447498 D01 testing of other required channels within the operating mode of a frequency band is not required when the reported 1-g or 10-g SAR for the mid-band or highest output power channel is: ≤ 0.8 W/kg or 2.0 W/kg, for 1-g or 10-g respectively, when the transmission band is ≤ 100 MHz ≤ 0.6 W/kg or 1.5 W/kg, for 1-g or 10-g respectively, when the transmission band is between 100
MHz and 200 MHz ≤ 0.4 W/kg or 1.0 W/kg, for 1-g or 10-g respectively, when the transmission band is ≥ 200 MHz
IEEE 1528-2003 requires the middle channel to be tested first. This generally applies to wireless devices that are designed to operate in technologies with tight tolerances for maximum output power variations across channels in the band. When the maximum output power variation across the required test channels is > ½ dB, instead of the middle channel, the highest output power channel must be used.

Test report no.: 1-0042/15-01-15-A
Page 78 of 223
7.2.2 Results overview
measured / extrapolated SAR numbers - Head - GSM 850 MHz
Ch. Freq. (MHz)
time slots
Position cond. Pmax (dBm) SAR1g (W/kg) SAR10g (W/kg) power
drift (dB)
liquid (°C) declared** measured meas. extrap. meas. extrap.
128 824.2 2 left cheek 32.5 31.5 0.101 0.127 0.075 0.095 -0.02 22.5128 824.2 2 left tilted 15° 32.5 31.5 0.067 0.085 0.051 0.064 -0.05 22.5128 824.2 2 right cheek 32.5 31.5 0.115 0.145 0.090 0.114 0.10 22.5190 836.6 2 right cheek 32.5 30.9 0.111 0.160 0.088 0.127 0.06 22.5251 848.8 2 right cheek 32.5 31.1 0.133 0.184 0.105 0.145 0.00 22.5128 824.2 2 right tilted 15° 32.5 31.5 0.073 0.092 0.056 0.071 0.04 22.5
slider open 128 824.2 2 left cheek 32.5 31.5 0.070 0.088 0.053 0.067 0.03 22.5128 824.2 2 left tilted 15° 32.5 31.5 0.042 0.053 0.032 0.041 -0.04 22.5128 824.2 2 right cheek 32.5 31.5 0.079 0.099 0.061 0.077 -0.04 22.5128 824.2 2 right tilted 15° 32.5 31.5 0.050 0.063 0.039 0.049 0.01 22.5
Table 65: Test results head SAR GSM 850MHz GMSK 2TS in uplink (see max. SAR plot in Annex B.2: GSM 835MHz page 163) Note: The device supports DTM class 11 with max. 3 timeslots in uplink. SAR measurements were performed in the configuration with highest calculated time based averaged output power (see section 7.1.1). Therefore 2 timeslots in uplink were used for test.
measured / extrapolated SAR numbers - hotspot mode - GSM 850 MHz
Ch. Freq. (MHz)
time slots
Position cond. Pmax (dBm) SAR1g (W/kg) SAR10g (W/kg) power
drift (dB)
liquid (°C)
dist. (mm)declared** meas. meas. extrap. meas. extrap.
128 824.2 2 front 32.5 31.5 0.301 0.379 0.236 0.297 0.05 22.8 10 128 824.2 2 rear 32.5 31.5 0.390 0.491 0.220 0.277 0.03 22.8 10 128 824.2 2 left edge 32.5 31.5 0.156 0.196 0.108 0.136 0.03 22.8 10 128 824.2 2 right edge 32.5 31.5 0.309 0.389 0.217 0.273 0.01 22.8 10 128 824.2 2 bottom edge 32.5 31.5 0.340 0.428 0.186 0.234 0.01 22.8 10 128 824.2 2 top edge 32.5 31.5 0.013 0.016 0.009 0.011 0.00 22.8 10
slider open 128 824.2 2 front 32.5 31.5 0.270 0.340 0.167 0.210 -0.01 22.8 10 128 824.2 2 rear 32.5 31.5 0.512 0.645 0.290 0.365 0.04 22.8 10 190 836.6 2 rear 32.5 30.9 0.656 0.948 0.373 0.539 -0.02 22.8 10 251 848.8 2 rear 32.5 31.1 0.682 0.941 0.407 0.562 0.01 22.8 10 128 824.2 2 left edge 32.5 31.5 0.132 0.166 0.092 0.115 0.06 22.8 10 128 824.2 2 right edge 32.5 31.5 0.250 0.315 0.172 0.217 -0.02 22.8 10 128 824.2 2 bottom edge 32.5 31.5 0.322 0.405 0.180 0.227 0.10 22.8 10 128 824.2 2 top edge 32.5 31.5 0.013 0.016 0.009 0.011 0.08 22.8 10
Table 66: Test results hotspot mode SAR GSM 850 MHz (see max. SAR plot in Annex B.2: GSM 835MHz)
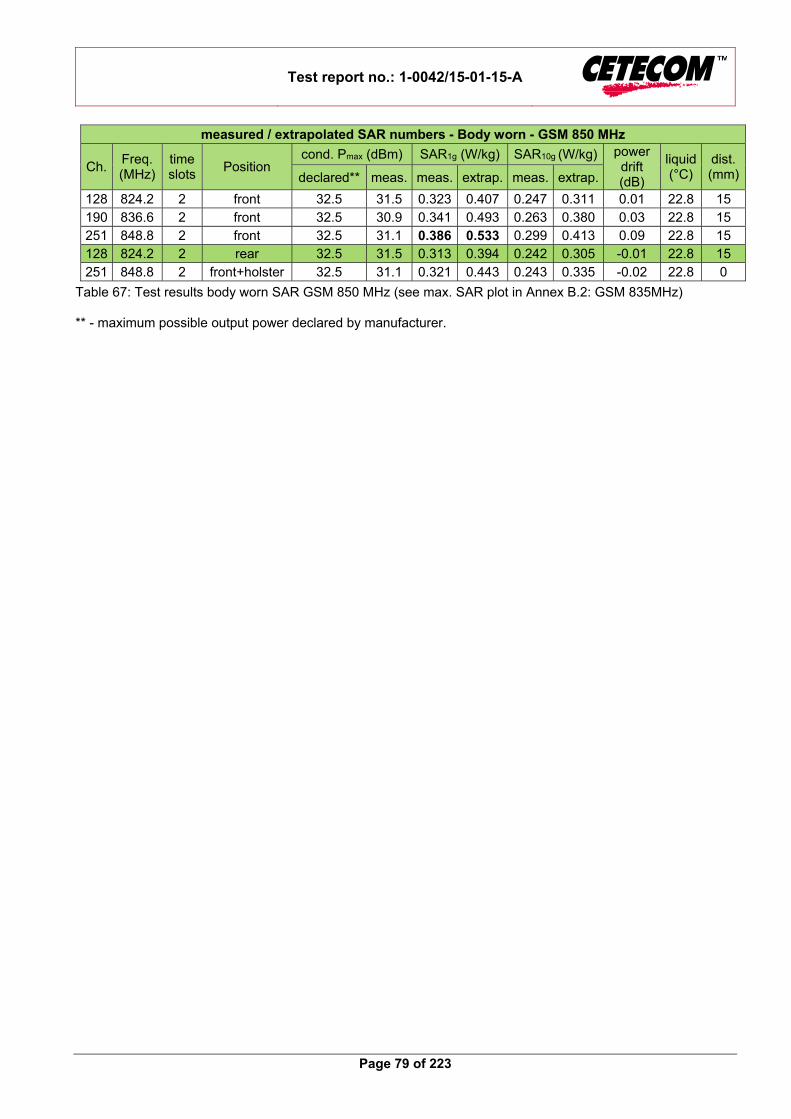
Test report no.: 1-0042/15-01-15-A
Page 79 of 223
measured / extrapolated SAR numbers - Body worn - GSM 850 MHz
Ch. Freq. (MHz)
time slots
Position cond. Pmax (dBm) SAR1g (W/kg) SAR10g (W/kg) power
drift (dB)
liquid (°C)
dist. (mm)declared** meas. meas. extrap. meas. extrap.
128 824.2 2 front 32.5 31.5 0.323 0.407 0.247 0.311 0.01 22.8 15 190 836.6 2 front 32.5 30.9 0.341 0.493 0.263 0.380 0.03 22.8 15 251 848.8 2 front 32.5 31.1 0.386 0.533 0.299 0.413 0.09 22.8 15 128 824.2 2 rear 32.5 31.5 0.313 0.394 0.242 0.305 -0.01 22.8 15 251 848.8 2 front+holster 32.5 31.1 0.321 0.443 0.243 0.335 -0.02 22.8 0
Table 67: Test results body worn SAR GSM 850 MHz (see max. SAR plot in Annex B.2: GSM 835MHz) ** - maximum possible output power declared by manufacturer.

Test report no.: 1-0042/15-01-15-A
Page 80 of 223
measured / extrapolated SAR numbers - Head - GSM 1900 MHz
Ch. Freq. (MHz)
time slots
Position cond. Pmax (dBm) SAR1g (W/kg) SAR10g (W/kg) power
drift (dB)
liquid (°C) declared** measured meas. extrap. meas. extrap.
661 1880.0 2 left cheek 30.5 29.2 0.434 0.585 0.279 0.376 0.02 22.2661 1880.0 2 left tilted 15° 30.5 29.2 0.248 0.335 0.151 0.204 -0.12 22.2661 1880.0 2 right cheek 30.5 29.2 0.218 0.294 0.145 0.196 0.01 22.2661 1880.0 2 right tilted 15° 30.5 29.2 0.232 0.313 0.140 0.189 -0.11 22.2
slider open 512 1850.2 2 left cheek 30.5 29.2 0.469 0.633 0.305 0.411 0.17 22.2661 1880.0 2 left cheek 30.5 29.2 0.520 0.701 0.326 0.440 0.04 22.2810 1909.8 2 left cheek 30.5 29.4 0.383 0.493 0.245 0.316 0.10 22.2661 1880.0 2 left tilted 15° 30.5 29.2 0.260 0.351 0.173 0.233 0.02 22.2661 1880.0 2 right cheek 30.5 29.2 0.242 0.326 0.159 0.214 0.07 22.2661 1880.0 2 right tilted 15° 30.5 29.2 0.259 0.349 0.161 0.217 0.03 22.2
Table 68: Test results head SAR GSM 1900MHz GMSK 2TS in uplink (see max. SAR plot in Annex B.3: GSM 1900MHz page 167)
Note: The device supports DTM class 11 with max. 3 timeslots in uplink. SAR measurements were performed in the configuration with highest calculated time based averaged output power (see section 7.1.2). Therefore 2 timeslots in uplink were used for test.
measured / extrapolated SAR numbers - hotspot mode - GSM 1900 MHz
Ch. Freq. (MHz)
time slots
Position cond. Pmax (dBm) SAR1g (W/kg) SAR10g (W/kg) power
drift (dB)
liquid (°C)
dist. (mm)declared** meas. meas. extrap. meas. extrap.
661 1880.0 2 front 29.0 27.9 0.289 0.372 0.162 0.209 0.08 22.4 10 661 1880.0 2 rear 29.0 27.9 0.515 0.663 0.314 0.405 -0.02 22.4 10 661 1880.0 2 left edge 29.0 27.9 0.322 0.415 0.195 0.251 0.01 22.4 10 661 1880.0 2 right edge 29.0 27.9 0.057 0.073 0.035 0.045 -0.10 22.4 10 661 1880.0 2 top edge 29.0 27.9 0.043 0.055 0.028 0.036 0.04 22.4 10 661 1880.0 2 bottom edge 29.0 27.9 0.220 0.283 0.122 0.157 0.04 22.4 10
slider open 661 1880.0 2 front 29.0 27.9 0.375 0.483 0.236 0.304 -0.01 22.4 10 512 1850.2 2 rear 29.0 27.0 0.720 1.141 0.441 0.699 -0.04 22.4 10 661 1880.0 2 rear 29.0 27.9 0.626 0.806 0.379 0.488 -0.04 22.4 10 810 1909.8 2 rear 29.0 27.1 0.556 0.861 0.335 0.519 -0.02 22.4 10 661 1880.0 2 left edge 29.0 27.9 0.248 0.319 0.154 0.198 -0.01 22.4 10 661 1880.0 2 right edge 29.0 27.9 0.058 0.074 0.035 0.045 0.03 22.4 10 661 1880.0 2 top edge 29.0 27.9 0.083 0.106 0.050 0.065 0.54 22.4 10 661 1880.0 2 bottom edge 29.0 27.9 0.118 0.152 0.073 0.094 -0.54 22.4 10
Table 69: Test results hotspot mode SAR GSM 1900 (see max. SAR plot in Annex B.3: GSM 1900MHz)

Test report no.: 1-0042/15-01-15-A
Page 81 of 223
measured / extrapolated SAR numbers - Body worn - GSM 1900 MHz
Ch. Freq. (MHz)
time slots
Position cond. Pmax (dBm) SAR1g (W/kg) SAR10g (W/kg) power
drift (dB)
liquid (°C)
dist. (mm)declared** meas. meas. extrap. meas. extrap.
661 1880.0 2 front 30.5 29.2 0.166 0.224 0.097 0.131 0.07 21.3 15 512 1850.2 2 rear 30.5 29.2 0.537 0.724 0.354 0.478 0.01 21.3 15 661 1880.0 2 rear 30.5 29.2 0.445 0.600 0.290 0.391 0.02 21.3 15 810 1909.8 2 rear 30.5 29.4 0.367 0.473 0.235 0.303 -0.04 21.3 15 512 1850 2 rear + holster 30.5 29.2 0.254 0.343 0.169 0.228 -0.03 21.3 0
Table 70: Test results body worn SAR GSM 1900 (see max. SAR plot in Annex B.3: GSM 1900MHz) ** - maximum possible output power declared by manufacturer

Test report no.: 1-0042/15-01-15-A
Page 82 of 223
measured / extrapolated SAR numbers - Head - UMTS FDD II 1880 MHz
Ch. Freq. (MHz)
test cond.
Position cond. Pmax (dBm) SAR1g (W/kg) SAR10g (W/kg) power
drift(dB)liquid (°C) declared** measured meas. extrap. meas. extrap.
9400 1880.0 RMC left cheek 25.0 24.6 0.507 0.556 0.329 0.361 0.12 22.29400 1880.0 RMC left tilted 15° 25.0 24.6 0.243 0.266 0.153 0.168 -0.05 22.29400 1880.0 RMC right cheek 25.0 24.6 0.284 0.311 0.191 0.209 0.03 22.29400 1880.0 RMC right tilted 15° 25.0 24.6 0.255 0.280 0.155 0.170 -0.06 22.2
slider open 9262 1852.4 RMC left cheek 25.0 23.9 0.518 0.667 0.341 0.439 0.05 22.29400 1880.0 RMC left cheek 25.0 24.6 0.557 0.611 0.365 0.400 0.10 22.29538 1907.6 RMC left cheek 25.0 23.9 0.505 0.651 0.327 0.421 0.04 22.29400 1880.0 RMC left tilted 15° 25.0 24.6 0.383 0.420 0.253 0.277 0.01 22.29400 1880.0 RMC right cheek 25.0 24.6 0.319 0.350 0.212 0.232 0.02 22.29400 1880.0 RMC right tilted 15° 25.0 24.6 0.384 0.421 0.240 0.263 -0.02 22.2
Table 71: Test results head SAR UMTS FDD II 1880 MHz (see max. SAR plot in Annex B.4: UMTS FDD II page 170)
measured / extrapolated SAR numbers - hotspot mode - UMTS FDD II 1880 MHz
Ch. Freq. (MHz)
test cond.
Position cond. Pmax (dBm) SAR1g (W/kg) SAR10g (W/kg) power
drift(dB) liquid (°C)
dist. (mm)declared** meas. meas. extrap. meas. extrap.
9400 1880.0 RMC front 22.0 21.5 0.234 0.263 0.129 0.145 0.00 21.3 10 9262 1852.4 RMC rear 22.0 21.8 0.778 0.815 0.486 0.509 0.01 21.3 10 9400 1880.0 RMC rear 22.0 21.5 0.719 0.807 0.441 0.495 0.08 21.3 10 9538 1907.6 RMC rear 22.0 21.2 0.644 0.774 0.387 0.465 0.02 21.3 10 9400 1880.0 RMC left edge 22.0 21.5 0.435 0.488 0.257 0.288 -0.01 21.3 10 9400 1880.0 RMC right edge 22.0 21.5 0.054 0.060 0.033 0.037 0.11 21.3 10 9400 1880.0 RMC top edge 22.0 21.5 0.083 0.093 0.056 0.063 0.03 21.3 10 9400 1880.0 RMC bottom edge 22.0 21.5 0.387 0.434 0.211 0.237 -0.01 21.3 10
slider open 9400 1880.0 RMC front 22.0 21.5 0.577 0.647 0.362 0.406 0.00 21.3 10 9262 1852.4 RMC rear 22.0 21.8 0.809 0.847 0.501 0.525 -0.01 21.3 10 9400 1880.0 RMC rear 22.0 21.5 0.815 0.914 0.501 0.562 0.01 21.3 10 9538 1907.6 RMC rear 22.0 21.2 0.769 0.925 0.469 0.564 0.11 21.3 10 9400 1880.0 RMC left edge 22.0 21.5 0.325 0.365 0.201 0.226 0.00 21.3 10 9400 1880.0 RMC right edge 22.0 21.5 0.106 0.119 0.063 0.071 -0.02 21.3 10 9400 1880.0 RMC top edge 22.0 21.5 0.074 0.083 0.047 0.052 -0.09 21.3 10 9400 1880.0 RMC bottom edge 22.0 21.5 0.213 0.239 0.129 0.145 0.01 21.3 10 9400 1880.0 RMC rear* 22.0 21.5 0.778 0.873 0.486 0.545 0.00 21.3 10
Table 72: Test results hotspot mode SAR UMTS FDD II 1880 MHz (see max. SAR plot in Annex B.4: UMTS FDD II) * - repeated at the highest SAR measurement according to the FCC KDB 865664 ** - maximum possible output power declared by manufacturer

Test report no.: 1-0042/15-01-15-A
Page 83 of 223
measured / extrapolated SAR numbers - Body worn - UMTS FDD II 1880 MHz
Ch. Freq. (MHz)
test cond.
Position cond. Pmax (dBm) SAR1g (W/kg) SAR10g (W/kg) power
drift(dB) liquid (°C)
dist. (mm)declared** meas. meas. extrap. meas. extrap.
9400 1880.0 RMC front 25.0 24.6 0.231 0.253 0.135 0.148 0.01 21.3 15 9262 1852.4 RMC rear 25.0 23.9 0.725 0.934 0.473 0.609 0.02 21.3 15 9400 1880.0 RMC rear 25.0 24.6 0.678 0.743 0.440 0.482 0.01 21.3 15 9538 1907.6 RMC rear 25.0 23.9 0.537 0.692 0.344 0.443 0.03 21.3 15
9262 1852.4 RMC rear+holster 25.0 24.6 0.346 0.379 0.226 0.248 0.00 21.3 0
Table 73: Test results body worn SAR UMTS FDD II 1880 MHz (see max. SAR plot in Annex B.4: UMTS FDD II)

Test report no.: 1-0042/15-01-15-A
Page 84 of 223
measured / extrapolated SAR numbers - Head - UMTS FDD IV 1700 MHz
Ch. Freq. (MHz)
test cond.
Position cond. Pmax (dBm) SAR1g (W/kg) SAR10g (W/kg) power
drift (dB)
liquid (°C) declared** measured meas. extrap. meas. extrap.
1312 1712 RMC left cheek 25.0 24.1 0.866 1.065 0.561 0.690 -0.07 22.51413 1732 RMC left cheek 25.0 23.9 0.896 1.154 0.568 0.732 0.03 22.51513 1753 RMC left cheek 25.0 23.7 0.844 1.139 0.538 0.726 0.01 22.51413 1732 RMC left tilted 15° 25.0 23.9 0.406 0.523 0.258 0.332 -0.04 22.51413 1732.4 RMC right cheek 25.0 23.9 0.365 0.470 0.240 0.309 0.03 22.51413 1732.4 RMC right tilted 15° 25.0 23.9 0.416 0.536 0.247 0.318 0.00 22.51413 1732 RMC left cheek* 25.0 23.9 0.866 1.116 0.557 0.718 -0.06 22.5
slider open 1413 1732 RMC left cheek 25.0 23.9 0.574 0.739 0.373 0.481 -0.03 22.51413 1732 RMC left tilted 15° 25.0 23.9 0.413 0.532 0.275 0.354 -0.02 22.51413 1732 RMC right cheek 25.0 23.9 0.314 0.405 0.210 0.271 0.03 22.51413 1732 RMC right tilted 15° 25.0 23.9 0.399 0.514 0.251 0.323 0.01 22.5
Table 74: Test results head SAR UMTS FDD IV 1700 MHz (see max. SAR plot in Annex B.5: UMTS FDD IV page 175)
measured / extrapolated SAR numbers - hotspot mode - UMTS FDD IV 1700 MHz
Ch. Freq. (MHz)
test cond.
Position cond. Pmax (dBm) SAR1g (W/kg) SAR10g (W/kg) power
drift (dB)
liquid (°C)
dist. (mm)declared** meas. meas. extrap. meas. extrap.
1413 1732 RMC front 22.0 21.3 0.498 0.585 0.327 0.384 -0.04 21.9 10 1312 1712 RMC rear 22.0 21.5 0.720 0.808 0.428 0.480 -0.04 21.9 10 1413 1732 RMC rear 22.0 21.3 0.670 0.787 0.384 0.451 -0.01 21.9 10 1513 1753 RMC rear 22.0 21.1 0.651 0.801 0.373 0.459 -0.03 21.9 10 1413 1732 RMC left edge 22.0 21.3 0.316 0.371 0.201 0.236 -0.04 21.9 10 1413 1732 RMC right edge 22.0 21.3 0.082 0.096 0.051 0.060 0.03 21.9 10 1413 1732 RMC bottom edge 22.0 21.3 0.271 0.318 0.162 0.190 -0.02 21.9 10 1413 1732 RMC top 22.0 21.3 0.117 0.137 0.072 0.084 -0.03 21.9 10
slider open 1413 1732 RMC front 22.0 21.3 0.531 0.624 0.338 0.397 -0.01 21.9 10 1312 1712 RMC rear 22.0 21.8 1.090 1.141 0.663 0.694 -0.05 21.9 10 1413 1732 RMC rear 22.0 21.3 0.992 1.165 0.607 0.713 -0.03 21.9 10 1513 1753 RMC rear 22.0 21.1 0.921 1.133 0.570 0.701 0.00 21.9 10 1413 1732 RMC left edge 22.0 21.3 0.335 0.394 0.215 0.253 -0.01 21.9 10 1413 1732 RMC right edge 22.0 21.3 0.101 0.119 0.063 0.074 0.04 21.9 10 1413 1732 RMC top edge 22.0 21.3 0.075 0.088 0.049 0.058 0.00 21.9 10 1413 1732 RMC bottom edge 22.0 21.3 0.200 0.235 0.125 0.147 -0.04 21.9 10 1312 1712.4 RMC rear* 22.0 21.8 1.000 1.047 0.598 0.626 -0.02 21.9 10
Table 75: Test results hotspot mode SAR UMTS FDD IV 1700 MHz (see max. SAR plot in Annex B.5: UMTS FDD IV) * - repeated at the highest SAR measurement according to the FCC KDB 865664 ** - maximum possible output power declared by manufacturer

Test report no.: 1-0042/15-01-15-A
Page 85 of 223
measured / extrapolated SAR numbers - Body worn - UMTS FDD IV 1700 MHz
Ch. Freq. (MHz)
test cond.
Position cond. Pmax (dBm) SAR1g (W/kg) SAR10g (W/kg) power
drift (dB)
liquid (°C)
dist. (mm)declared** meas. meas. extrap. meas. extrap.
1312 1712 RMC front 25.0 24.1 0.696 0.856 0.464 0.571 -0.07 22.6 15 1413 1732 RMC front 25.0 23.9 0.692 0.891 0.461 0.594 -0.10 22.6 15 1513 1753 RMC front 25.0 23.7 0.623 0.840 0.416 0.561 0.02 22.6 15 1312 1712 RMC rear 25.0 24.1 0.662 0.871 0.432 0.522 -0.12 21.9 15 1413 1732 RMC rear 25.0 23.9 0.631 0.871 0.378 0.522 -0.10 22.6 15 1513 1753 RMC rear 25.0 23.7 0.626 0.844 0.378 0.510 -0.06 21.9 15 1413 1732 RMC front+holster 25.0 23.9 0.345 0.444 0.238 0.307 -0.05 22.6 0
Table 76: Test results body worn SAR UMTS FDD IV 1700 MHz (see max. SAR plot in Annex B.5: UMTS FDD IV)

Test report no.: 1-0042/15-01-15-A
Page 86 of 223
measured / extrapolated SAR numbers - Head - UMTS FDD V 850 MHz
Ch. Freq. (MHz)
test cond.
Position cond. Pmax (dBm) SAR1g (W/kg) SAR10g (W/kg) power
drift (dB)
liquid (°C) declared** measured meas. extrap. meas. extrap.
4182 836.4 RMC left cheek 25.0 23.9 0.241 0.310 0.185 0.238 -0.01 21.04182 836.4 RMC left tilted 15° 25.0 23.9 0.162 0.209 0.126 0.162 -0.01 21.04132 826.4 RMC right cheek 25.0 24.1 0.246 0.303 0.194 0.239 -0.04 21.04182 836.4 RMC right cheek 25.0 23.9 0.242 0.312 0.190 0.245 -0.02 21.04233 846.6 RMC right cheek 25.0 23.9 0.253 0.326 0.199 0.256 -0.01 21.04182 836.4 RMC right tilted 15° 25.0 23.9 0.156 0.201 0.122 0.157 0.00 21.0
slider open 4182 836.4 RMC left cheek 25.0 23.9 0.150 0.193 0.116 0.149 0.01 21.04182 836.4 RMC left tilted 15° 25.0 23.9 0.094 0.121 0.073 0.094 0.03 21.04182 836.4 RMC right cheek 25.0 23.9 0.189 0.243 0.149 0.192 0.01 21.04182 836.4 RMC right tilted 15° 25.0 23.9 0.104 0.134 0.083 0.106 0.00 21.0
Table 77: Test results head SAR UMTS FDD V 850 MHz (see max. SAR plot in Annex B.6: UMTS FDD V page 180)
measured / extrapolated SAR numbers - hotspot mode - UMTS FDD V 850 MHz
Ch. Freq. (MHz)
test cond.
Position cond. Pmax (dBm) SAR1g (W/kg) SAR10g (W/kg) power
drift (dB)
liquid (°C)
dist. (mm)declared** meas. meas. extrap. meas. extrap.
4182 836.4 RMC front 25.0 23.9 0.247 0.318 0.192 0.247 -0.04 22.5 10 4182 836.4 RMC rear 25.0 23.9 0.390 0.502 0.220 0.283 -0.02 22.5 10 4182 836.4 RMC left edge 25.0 23.9 0.204 0.263 0.141 0.182 0.00 22.5 10 4182 836.4 RMC right edge 25.0 23.9 0.456 0.587 0.315 0.406 -0.01 22.5 10 4182 836.4 RMC top edge 25.0 23.9 0.014 0.018 0.010 0.013 0.03 22.5 10 4182 836.4 RMC bottom edge 25.0 23.9 0.422 0.544 0.229 0.295 -0.03 22.5 10
slider open 4182 836.4 RMC front 25.0 23.9 0.294 0.379 0.181 0.233 0.00 22.5 10 4132 826.4 RMC rear 25.0 24.1 0.548 0.674 0.313 0.385 0.01 22.5 10 4182 836.4 RMC rear 25.0 23.9 0.558 0.719 0.316 0.407 -0.09 22.5 10 4233 846.6 RMC rear 25.0 23.9 0.577 0.743 0.329 0.424 -0.01 22.5 10 4182 836.4 RMC left edge 25.0 23.9 0.131 0.169 0.091 0.117 -0.03 22.5 10 4182 836.4 RMC right edge 25.0 23.9 0.275 0.354 0.191 0.246 0.02 22.5 10 4182 836.4 RMC top edge 25.0 23.9 0.016 0.021 0.011 0.015 0.06 22.5 10 4182 836.4 RMC bottom edge 25.0 23.9 0.390 0.502 0.212 0.273 0.01 22.5 10
Table 78: Test results hotspot mode SAR UMTS FDD V 850 MHz (see max. SAR plot in Annex B.6: UMTS FDD V)
measured / extrapolated SAR numbers - Body worn - UMTS FDD V 850 MHz
Ch. Freq. (MHz)
test cond.
Position cond. Pmax (dBm) SAR1g (W/kg) SAR10g (W/kg) power
drift (dB)
liquid (°C)
dist. (mm)declared** meas. meas. extrap. meas. extrap.
4132 826.4 RMC front 25.0 24.1 0.258 0.317 0.199 0.245 0.02 22.5 15 4182 836.4 RMC front 25.0 23.9 0.238 0.307 0.183 0.236 -0.01 22.5 15 4233 846.6 RMC front 25.0 23.9 0.239 0.308 0.183 0.236 0.00 22.5 15 4182 836.4 RMC rear 25.0 23.9 0.195 0.251 0.150 0.193 0.02 22.5 15 4132 826.4 RMC front+holster 25.0 24.1 0.216 0.266 0.164 0.202 0.00 22.5 0
Table 79: Test results body worn SAR UMTS FDD V 850 MHz (see max. SAR plot in Annex B.6: UMTS FDD V) ** - maximum possible output power declared by manufacturer

Test report no.: 1-0042/15-01-15-A
Page 87 of 223
measured / extrapolated SAR numbers - Head - LTE FDD 2 1900 MHz
Ch. Freq. (MHz)
RB offset
Position cond. Pmax (dBm) SAR1g (W/kg) SAR10g (W/kg) power
drift (dB)
liquid (°C) declared** meas. meas. extrap. meas. extrap.
20MHz BW/1RB/QPSK 18900 1880.0 0 left cheek 24.0 23.3 0.531 0.624 0.336 0.395 0.17 22.218900 1880.0 0 left tilted 15° 24.0 23.3 0.270 0.317 0.166 0.195 -0.06 22.218900 1880.0 0 right cheek 24.0 23.3 0.285 0.335 0.188 0.221 0.08 22.218900 1880.0 0 right tilted 15° 24.0 23.3 0.277 0.325 0.168 0.197 -0.01 22.2
20MHz BW/50RB/QPSK 18700 1860.0 25 left cheek 23.0 22.3 0.387 0.455 0.248 0.291 0.06 22.218700 1860.0 25 left tilted 15° 23.0 22.3 0.192 0.226 0.118 0.139 0.03 22.218700 1860.0 25 right cheek 23.0 22.3 0.183 0.215 0.121 0.142 0.06 22.218700 1860.0 25 right tilted 15° 23.0 22.3 0.191 0.224 0.115 0.135 0.04 22.2
slider open 20MHz BW/1RB/QPSK
18700 1860.0 50 left cheek 24.0 23.2 0.622 0.748 0.393 0.472 0.10 22.218900 1880.0 0 left cheek 24.0 23.3 0.604 0.710 0.387 0.455 0.11 22.219100 1900.0 0 left cheek 24.0 22.9 0.629 0.810 0.399 0.514 0.11 22.218900 1880.0 0 left tilted 15° 24.0 23.3 0.350 0.411 0.233 0.274 0.01 22.218900 1880.0 0 right cheek 24.0 23.3 0.322 0.378 0.210 0.247 0.07 22.218900 1880.0 0 right tilted 15° 24.0 23.3 0.335 0.394 0.215 0.253 0.04 22.2
20MHz BW/50RB/QPSK 18700 1860.0 25 left cheek 23.0 22.3 0.432 0.508 0.276 0.324 0.04 22.218700 1860.0 25 left tilted 15° 23.0 22.3 0.262 0.308 0.173 0.203 0.10 22.218700 1860.0 25 right cheek 23.0 22.3 0.230 0.270 0.150 0.176 0.10 22.218700 1860.0 25 right tilted 15° 23.0 22.3 0.244 0.287 0.155 0.182 -0.03 22.2
Table 80: Test results head SAR LTE FDD 2 1900 MHz (see max. SAR plot in Annex B.7: LTE FDD 2 page 183)

Test report no.: 1-0042/15-01-15-A
Page 88 of 223
measured / extrapolated SAR numbers - hotspot mode - LTE FDD 2 1900 MHz
Ch. Freq. (MHz)
RB offset
Position cond. Pmax (dBm) SAR1g (W/kg) SAR10g (W/kg) power
drift (dB)
liquid (°C)
dist. (mm)declared** meas. meas. extrap. meas. extrap.
20MHz BW/1RB/QPSK 18700 1860.0 0 front 21.0 19.9 0.364 0.469 0.231 0.298 0.00 21.3 10 18700 1860.0 0 rear 21.0 19.9 0.471 0.607 0.266 0.343 -0.04 21.3 10 18900 1880.0 0 left edge 21.0 19.9 0.526 0.678 0.322 0.415 0.11 21.3 10 18900 1880.0 0 right edge 21.0 19.9 0.134 0.173 0.075 0.096 -0.05 21.3 10 18900 1880.0 0 top edge 21.0 19.9 0.071 0.092 0.043 0.055 0.10 21.3 10 18900 1880.0 0 bottom edge 21.0 19.9 0.326 0.420 0.184 0.237 -0.04 21.3 10
20MHz BW/50RB/QPSK 18700 1860.0 0 front 20.0 19.9 0.282 0.289 0.177 0.181 -0.01 21.3 10 18700 1860.0 0 rear 20.0 19.9 0.471 0.482 0.272 0.278 -0.02 21.3 10 18900 1880.0 0 left edge 20.0 19.9 0.411 0.421 0.251 0.257 0.00 21.3 10 18900 1880.0 0 right edge 20.0 19.9 0.096 0.099 0.055 0.056 -1.16 21.3 10 18900 1880.0 0 top edge 20.0 19.9 0.056 0.057 0.034 0.035 0.01 21.3 10 18900 1880.0 0 bottom edge 20.0 19.9 0.240 0.246 0.136 0.139 -0.01 21.3 10
slider open 20MHz BW/1RB/QPSK
18700 1860 0 front 21.0 19.9 0.395 0.509 0.251 0.323 -0.02 21.3 10 18700 1860 0 rear 21.0 19.9 0.595 0.767 0.369 0.475 0.02 21.3 10 18900 1880.0 0 rear 21.0 19.6 0.662 0.914 0.410 0.566 -0.04 21.3 10 19100 1900.0 0 rear 21.0 19.4 0.645 0.932 0.394 0.570 0.00 21.3 10 18700 1860 0 left edge 21.0 19.9 0.252 0.325 0.156 0.201 -0.03 21.3 10 18700 1860 0 right edge 21.0 19.9 0.070 0.090 0.042 0.054 -0.02 21.3 10 18700 1860 0 top edge 21.0 19.9 0.073 0.094 0.045 0.058 0.01 21.3 10 18700 1860 0 bottom edge 21.0 19.9 0.176 0.227 0.106 0.137 0.03 21.3 10
20MHz BW/50RB/QPSK 18700 1860 0 front 20.0 19.9 0.399 0.408 0.252 0.258 0.00 21.3 10 18700 1860 0 rear 20.0 19.9 0.605 0.619 0.374 0.383 0.01 21.3 10 18700 1860 0 left edge 20.0 19.9 0.253 0.259 0.157 0.161 0.03 21.3 10 18700 1860 0 right edge 20.0 19.9 0.071 0.072 0.043 0.044 -0.04 21.3 10 18700 1860 0 top edge 20.0 19.9 0.074 0.076 0.045 0.046 0.00 21.3 10 18700 1860 0 bottom edge 20.0 19.9 0.172 0.176 0.104 0.106 0.02 21.3 10
Table 81: Test results hotspot mode SAR LTE FDD 2 1900 MHz (see max. SAR plot in Annex B.7: LTE FDD 2)

Test report no.: 1-0042/15-01-15-A
Page 89 of 223
measured / extrapolated SAR numbers - Body worn - LTE FDD 2 1900 MHz
Ch. Freq. (MHz)
RB offset
Position cond. Pmax (dBm) SAR1g (W/kg) SAR10g (W/kg) power
drift (dB)
liquid (°C)
dist. (mm)declared** meas. meas. extrap. meas. extrap.
20MHz BW/1RB/QPSK 18900 1880.0 0 front 24.0 23.3 0.214 0.251 0.124 0.146 0.03 21.7 15 18700 1860.0 50 rear 24.0 23.2 0.501 0.602 0.325 0.391 -0.01 21.7 15 18900 1880.0 0 rear 24.0 23.3 0.608 0.714 0.394 0.463 0.02 21.7 15 19100 1900.0 0 rear 24.0 22.9 0.519 0.669 0.335 0.432 -0.02 21.7 15 18900 1880.0 0 rear+holster 24.0 23.3 0.267 0.314 0.173 0.203 -0.03 21.7 0
20MHz BW/50RB/QPSK 18700 1860.0 25 front 23.0 22.3 0.155 0.182 0.090 0.106 -0.04 21.7 15 18700 1860.0 25 rear 23.0 22.3 0.397 0.466 0.258 0.303 0.01 21.7 15
Table 82: Test results body worn SAR LTE FDD 2 1900 MHz (see max. SAR plot in Annex B.7: LTE FDD 2) ** - maximum possible output power declared by manufacturer

Test report no.: 1-0042/15-01-15-A
Page 90 of 223
measured / extrapolated SAR numbers - Head - LTE FDD 4 1750 MHz
Ch. Freq. (MHz)
RB offset
Position cond. Pmax (dBm) SAR1g (W/kg) SAR10g (W/kg) power
drift (dB)
liquid (°C) declared** meas. meas. extrap. meas. extrap.
20MHz BW/1RB/QPSK 20050 1720.0 50 left cheek 24.0 23.4 0.540 0.620 0.351 0.403 0.05 22.920050 1720.0 50 left tilted 15° 24.0 23.4 0.324 0.372 0.197 0.226 0.01 22.920050 1720.0 50 right cheek 24.0 23.4 0.297 0.341 0.195 0.224 -0.06 22.920050 1720.0 50 right tilted 15° 24.0 23.4 0.328 0.377 0.199 0.228 0.00 22.9
20MHz BW/50RB/QPSK 20050 1720.0 25 left cheek 23.0 22.3 0.430 0.505 0.278 0.327 0.05 22.920050 1720.0 25 left tilted 15° 23.0 22.3 0.252 0.296 0.154 0.181 -0.01 22.920050 1720.0 25 right cheek 23.0 22.3 0.259 0.304 0.170 0.200 0.01 22.920050 1720.0 25 right tilted 15° 23.0 22.3 0.262 0.308 0.159 0.187 0.05 22.9
slider open 20MHz BW/1RB/QPSK
20050 1720.0 50 left cheek 24.0 23.4 0.541 0.621 0.349 0.401 -0.04 22.920175 1732.5 0 left cheek 24.0 23.1 0.577 0.710 0.384 0.472 0.10 22.920300 1745.0 0 left cheek 24.0 23.2 0.612 0.736 0.403 0.485 0.02 22.920050 1720.0 50 left tilted 15° 24.0 23.4 0.333 0.382 0.226 0.259 -0.05 22.920050 1720.0 50 right cheek 24.0 23.4 0.287 0.330 0.195 0.224 -0.09 22.920050 1720.0 50 right tilted 15° 24.0 23.4 0.325 0.373 0.213 0.245 0.01 22.9
20MHz BW/50RB/QPSK 20050 1720.0 25 left cheek 23.0 22.3 0.428 0.503 0.277 0.325 0.00 22.920050 1720.0 25 left tilted 15° 23.0 22.3 0.265 0.311 0.179 0.210 0.04 22.920050 1720.0 25 right cheek 23.0 22.3 0.226 0.266 0.154 0.181 0.05 22.920050 1720.0 25 right tilted 15° 23.0 22.3 0.253 0.297 0.167 0.196 0.02 22.9
Table 83: Test results head SAR LTE FDD 4 1750 MHz (see max. SAR plot in Annex B.8: LTE FDD 4 page 186)

Test report no.: 1-0042/15-01-15-A
Page 91 of 223
measured / extrapolated SAR numbers - hotspot mode - LTE FDD 4 1750 MHz
Ch. Freq. (MHz)
RB offset
Position cond. Pmax (dBm) SAR1g (W/kg) SAR10g (W/kg) power
drift (dB)
liquid (°C)
dist. (mm)declared** meas. meas. extrap. meas. extrap.
20MHz BW/1RB/QPSK 20050 1720.0 0 front 21.0 20.0 0.370 0.466 0.243 0.306 -0.14 21.0 10 20050 1720.0 0 rear 21.0 20.0 0.537 0.676 0.342 0.431 -0.03 21.0 10 20050 1720.0 0 left edge 21.0 20.0 0.260 0.327 0.166 0.209 0.14 21.0 10 20050 1720.0 0 right edge 21.0 20.0 0.052 0.066 0.032 0.041 -0.04 21.0 10 20050 1720.0 0 top edge 21.0 20.0 0.201 0.253 0.123 0.155 -0.07 21.0 10 20050 1720.0 0 bottom edge 21.0 20.0 0.198 0.249 0.115 0.145 -0.02 21.0 10
20MHz BW/50RB/QPSK 20050 1720.0 50 front 20.0 20.0 0.306 0.306 0.200 0.200 0.00 21.0 10 20050 1720.0 50 rear 20.0 20.0 0.491 0.491 0.312 0.312 0.00 21.0 10 20050 1720.0 50 left edge 20.0 20.0 0.235 0.235 0.150 0.150 -0.04 21.0 10 20050 1720.0 50 right edge 20.0 20.0 0.029 0.029 0.018 0.018 -0.04 21.0 10 20050 1720.0 50 top edge 20.0 20.0 0.132 0.132 0.080 0.080 0.01 21.0 10 20050 1720.0 50 bottom edge 20.0 20.0 0.156 0.156 0.092 0.092 0.03 21.0 10
slider open 20MHz BW/1RB/QPSK
20050 1720.0 0 front 21.0 20.0 0.425 0.535 0.271 0.341 0.01 21.0 10 20050 1720.0 0 rear 21.0 20.0 0.817 1.029 0.500 0.629 0.10 21.0 10 20175 1732.5 0 rear 21.0 20.0 0.786 0.990 0.477 0.601 -0.02 21.0 10 20300 1745.0 0 rear 21.0 19.7 0.741 1.000 0.451 0.608 -0.09 21.0 10 20050 1720.0 0 left edge 21.0 20.0 0.563 0.709 0.365 0.460 -0.10 21.0 10 20050 1720.0 0 right edge 21.0 20.0 0.168 0.211 0.104 0.131 -0.05 21.0 10 20050 1720.0 0 top edge 21.0 20.0 0.055 0.069 0.036 0.045 0.18 21.0 10 20050 1720.0 0 bottom edge 21.0 20.0 0.578 0.728 0.348 0.438 0.10 21.0 10 20050 1720 0 rear* 21.0 20.0 0.832 1.047 0.513 0.646 -0.02 21.0 10
20MHz BW/50RB/QPSK 20050 1720.0 50 front 20.0 20.0 0.403 0.403 0.256 0.256 -0.01 21.0 10 20050 1720.0 50 rear 20.0 20.0 0.779 0.779 0.473 0.473 -0.03 21.0 10 20050 1720.0 50 left edge 20.0 20.0 0.430 0.430 0.277 0.277 -0.02 21.0 10 20050 1720.0 50 right edge 20.0 20.0 0.121 0.121 0.075 0.075 -0.01 21.0 10 20050 1720.0 50 top edge 20.0 20.0 0.056 0.056 0.035 0.035 -0.04 21.0 10 20050 1720.0 50 bottom edge 20.0 20.0 0.354 0.354 0.217 0.217 -0.07 21.0 10
20MHz BW/100RB/QPSK 20050 1720.0 0 front 20.0 20.0 0.402 0.402 0.256 0.256 -0.03 21.0 10 20050 1720.0 0 rear 20.0 20.0 0.796 0.796 0.483 0.483 0.03 21.0 10 20050 1720.0 0 left edge 20.0 20.0 0.290 0.290 0.187 0.187 -0.04 21.0 10 20050 1720.0 0 right edge 20.0 20.0 0.070 0.070 0.043 0.043 0.00 21.0 10 20050 1720.0 0 top edge 20.0 20.0 0.076 0.076 0.049 0.049 -0.03 21.0 10 20050 1720.0 0 bottom edge 20.0 20.0 0.227 0.227 0.140 0.140 0.01 21.0 10
Table 84: Test results hotspot mode SAR LTE FDD 4 1750 MHz (see max. SAR plot in Annex B.8: LTE FDD 4) * - repeated at the highest SAR measurement according to the FCC KDB 865664 ** - maximum possible output power declared by manufacturer
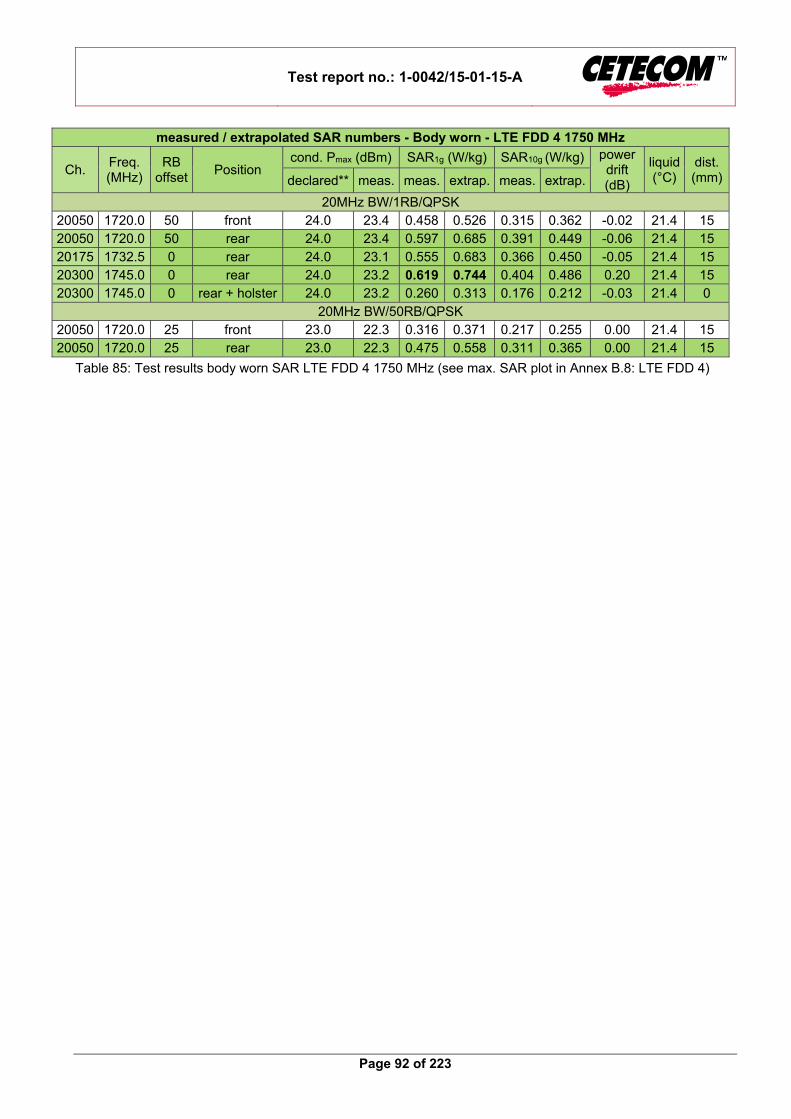
Test report no.: 1-0042/15-01-15-A
Page 92 of 223
measured / extrapolated SAR numbers - Body worn - LTE FDD 4 1750 MHz
Ch. Freq. (MHz)
RB offset
Position cond. Pmax (dBm) SAR1g (W/kg) SAR10g (W/kg) power
drift (dB)
liquid (°C)
dist. (mm)declared** meas. meas. extrap. meas. extrap.
20MHz BW/1RB/QPSK 20050 1720.0 50 front 24.0 23.4 0.458 0.526 0.315 0.362 -0.02 21.4 15 20050 1720.0 50 rear 24.0 23.4 0.597 0.685 0.391 0.449 -0.06 21.4 15 20175 1732.5 0 rear 24.0 23.1 0.555 0.683 0.366 0.450 -0.05 21.4 15 20300 1745.0 0 rear 24.0 23.2 0.619 0.744 0.404 0.486 0.20 21.4 15 20300 1745.0 0 rear + holster 24.0 23.2 0.260 0.313 0.176 0.212 -0.03 21.4 0
20MHz BW/50RB/QPSK 20050 1720.0 25 front 23.0 22.3 0.316 0.371 0.217 0.255 0.00 21.4 15 20050 1720.0 25 rear 23.0 22.3 0.475 0.558 0.311 0.365 0.00 21.4 15
Table 85: Test results body worn SAR LTE FDD 4 1750 MHz (see max. SAR plot in Annex B.8: LTE FDD 4)

Test report no.: 1-0042/15-01-15-A
Page 93 of 223
measured / extrapolated SAR numbers - Head - LTE FDD 7 2600 MHz
Ch. Freq. (MHz)
RB offset
Position cond. Pmax (dBm) SAR1g (W/kg) SAR10g (W/kg) power
drift (dB)
liquid (°C) declared** meas. meas. extrap. meas. extrap.
20MHz BW/1RB/QPSK 20850 2510 0 left cheek 24.0 23.1 0.077 0.095 0.041 0.050 -0.06 21.020850 2510 0 left tilted 15° 24.0 23.1 0.076 0.093 0.037 0.046 0.15 21.020850 2510 0 right cheek 24.0 23.1 0.170 0.209 0.090 0.111 0.11 21.020850 2510 0 right tilted 15° 24.0 23.1 0.054 0.066 0.027 0.033 0.08 21.0
20MHz BW/50RB/QPSK 20850 2510 25 left cheek 23.0 22.1 0.057 0.070 0.030 0.037 0.18 21.020850 2510 25 left tilted 15° 23.0 22.1 0.064 0.078 0.031 0.038 0.07 21.020850 2510 25 right cheek 23.0 22.1 0.131 0.161 0.070 0.086 0.11 21.020850 2510 25 right tilted 15° 23.0 22.1 0.045 0.055 0.022 0.028 0.04 21.0
slider open 20MHz BW/1RB/QPSK
20850 2510 0 left cheek 24.0 23.1 0.107 0.132 0.060 0.074 -0.02 21.020850 2510 0 left tilted 15° 24.0 23.1 0.105 0.129 0.054 0.067 0.08 21.020850 2510 0 right cheek 24.0 23.1 0.241 0.296 0.130 0.160 -0.12 21.021100 2535 0 right cheek 24.0 22.9 0.231 0.298 0.124 0.160 0.12 21.021350 2560 0 right cheek 24.0 22.7 0.197 0.266 0.104 0.140 0.08 21.020850 2510 0 right tilted 15° 24.0 23.1 0.081 0.099 0.042 0.052 0.01 21.0
20MHz BW/50RB/QPSK 20850 2510 25 left cheek 23.0 22.1 0.077 0.095 0.044 0.054 0.13 21.020850 2510 25 left tilted 15° 23.0 22.1 0.077 0.094 0.038 0.047 0.06 21.020850 2510 25 right cheek 23.0 22.1 0.190 0.234 0.101 0.124 0.00 21.020850 2510 25 right tilted 15° 23.0 22.1 0.064 0.079 0.033 0.041 0.03 21.0
Table 86: Test results head SAR LTE FDD 7 2600 MHz (see max. SAR plot in Annex B.9: LTE FDD 7 page 189)

Test report no.: 1-0042/15-01-15-A
Page 94 of 223
measured / extrapolated SAR numbers - hotspot mode - LTE FDD 7 2600 MHz
Ch. Freq. (MHz)
RB offset
Position cond. Pmax (dBm) SAR1g (W/kg) SAR10g (W/kg) power
drift (dB)
liquid (°C)
dist. (mm)declared** measured meas. extrap. meas. extrap.
20MHz BW/1RB/QPSK 20850 2510 0 front 20.5 20.0 0.312 0.350 0.150 0.168 -0.08 22.6 10 20850 2510 0 rear 20.5 20.0 0.385 0.432 0.184 0.206 -0.01 22.6 10 21100 2535 0 left edge 20.5 20.0 0.025 0.028 0.017 0.019 0.17 22.6 10 21100 2535 0 right edge 20.5 20.0 0.278 0.312 0.143 0.160 0.01 22.6 10 21100 2535 0 top edge 20.5 20.0 0.020 0.022 0.011 0.012 0.09 22.6 10 21100 2535 0 bottom edge 20.5 20.0 0.580 0.651 0.270 0.303 0.08 22.6 10
20MHz BW/50RB/QPSK 20850 2510 0 front 20.5 20.0 0.319 0.358 0.153 0.172 0.00 22.6 10 20850 2510 0 rear 20.5 20.0 0.395 0.443 0.187 0.210 -0.01 22.6 10 20850 2510 0 left edge 20.5 20.0 0.025 0.027 0.017 0.019 -0.07 22.6 10 20850 2510 0 right edge 20.5 20.0 0.288 0.323 0.148 0.166 -0.03 22.6 10 20850 2510 0 top edge 20.5 20.0 0.022 0.025 0.012 0.014 -0.02 22.6 10 20850 2510 0 bottom edge 20.5 20.0 0.619 0.695 0.287 0.322 -0.05 22.6 10
slider open 20MHz BW/1RB/QPSK
20850 2510 0 front 20.5 20.0 0.462 0.518 0.225 0.253 0.06 22.6 10 20850 2510 0 rear 20.5 20.0 0.472 0.530 0.231 0.259 -0.01 22.6 10 20850 2510 0 left edge 20.5 20.0 0.081 0.090 0.045 0.050 0.01 22.6 10 20850 2510 0 right edge 20.5 20.0 0.228 0.256 0.118 0.132 -0.04 22.6 10 20850 2510 0 top edge 20.5 20.0 0.021 0.023 0.011 0.012 -0.06 22.6 10 20850 2510 0 bottom edge 20.5 20.0 0.740 0.830 0.352 0.395 0.13 22.6 10 21100 2535 99 bottom edge 20.5 20.0 0.779 0.874 0.371 0.416 0.02 22.6 10 21350 2560 0 bottom edge 20.5 19.6 0.769 0.946 0.364 0.448 0.02 22.6 10
20MHz BW/50RB/QPSK 20850 2510 0 front 20.5 20.0 0.457 0.513 0.225 0.252 -0.01 22.6 10 20850 2510 0 rear 20.5 20.0 0.076 0.085 0.042 0.047 0.04 22.6 10 20850 2510 0 left edge 20.5 20.0 0.076 0.085 0.042 0.047 0.04 22.6 10 20850 2510 0 right edge 20.5 20.0 0.230 0.258 0.118 0.132 -0.04 22.6 10 20850 2510 0 top edge 20.5 20.0 0.020 0.022 0.011 0.012 0.32 22.6 10 20850 2510 0 bottom edge 20.5 20.0 0.744 0.835 0.352 0.395 -0.01 22.6 10
Table 87: Test results hotspot mode SAR LTE FDD 7 2600 MHz (see max. SAR plot in Annex B.9: LTE FDD 7) ** - maximum possible output power declared by manufacturer

Test report no.: 1-0042/15-01-15-A
Page 95 of 223
measured / extrapolated SAR numbers - Body worn - LTE FDD 7 2600 MHz
Ch. Freq. (MHz)
RB offset
Position cond. Pmax (dBm) SAR1g (W/kg) SAR10g (W/kg) power
drift (dB)
liquid (°C)
dist. (mm)declared** measured meas. extrap. meas. extrap.
20MHz BW/1RB/QPSK 20850 2510 0 front 24.0 23.1 0.318 0.391 0.167 0.205 0.12 22.6 15 20850 2510 0 rear 24.0 23.1 0.378 0.465 0.196 0.241 0.12 22.6 15 20850 2510 0 rear + holster 24.0 23.1 0.275 0.338 0.150 0.185 -0.13 22.6 0
20MHz BW/50RB/QPSK 20850 2510 25 front 23.0 22.1 0.260 0.320 0.137 0.169 0.01 22.6 15 20850 2510 25 rear 23.0 22.1 0.308 0.379 0.160 0.197 0.02 22.6 15
Table 88: Test results body worn SAR LTE FDD 7 2600 MHz (see max. SAR plot in Annex B.9: LTE FDD 7)

Test report no.: 1-0042/15-01-15-A
Page 96 of 223
measured / extrapolated SAR numbers - Head - LTE FDD 13 700 MHz
Ch. Freq. (MHz)
RB offset
Position cond. Pmax (dBm) SAR1g (W/kg) SAR10g (W/kg) power
drift (dB)
liquid (°C) declared** meas. meas. extrap. meas. extrap.
10MHz BW/1RB/QPSK 23230 782.0 0 left cheek 24.0 23.9 0.098 0.100 0.075 0.077 0.07 23.323230 782.0 0 left tilted 15° 24.0 23.9 0.074 0.076 0.057 0.059 0.04 23.323230 782.0 0 right cheek 24.0 23.9 0.136 0.139 0.103 0.105 0.00 23.323230 782.0 0 right tilted 15° 24.0 23.9 0.076 0.077 0.059 0.060 0.04 23.3
10MHz BW/25RB/QPSK 23230 782.0 12 left cheek 23.0 22.7 0.090 0.096 0.069 0.074 0.09 23.323230 782.0 12 left tilted 15° 23.0 22.7 0.067 0.072 0.052 0.056 0.04 23.323230 782.0 12 right cheek 23.0 22.7 0.126 0.135 0.095 0.102 0.07 23.323230 782.0 12 right tilted 15° 23.0 22.7 0.070 0.075 0.054 0.058 0.06 23.3
slider open 10MHz BW/1RB/QPSK
23230 782.0 0 left cheek 24.0 23.9 0.085 0.087 0.065 0.067 0.01 23.323230 782.0 0 left tilted 15° 24.0 23.9 0.055 0.056 0.043 0.044 0.02 23.323230 782.0 0 right cheek 24.0 23.9 0.104 0.106 0.079 0.081 0.03 23.323230 782.0 0 right tilted 15° 24.0 23.9 0.055 0.056 0.043 0.044 0.00 23.3
10MHz BW/25RB/QPSK 23230 782.0 12 left cheek 23.0 22.7 0.075 0.080 0.058 0.062 0.04 23.323230 782.0 12 left tilted 15° 23.0 22.7 0.048 0.052 0.037 0.040 0.03 23.323230 782.0 12 right cheek 23.0 22.7 0.097 0.104 0.074 0.079 0.07 23.323230 782.0 12 right tilted 15° 23.0 22.7 0.051 0.055 0.040 0.042 0.08 23.3
Table 89: Test results head SAR LTE FDD 13 700 MHz (see max. SAR plot in Annex B.10: LTE FDD 13 page 192)

Test report no.: 1-0042/15-01-15-A
Page 97 of 223
measured / extrapolated SAR numbers - hotspot mode - LTE FDD 13 700 MHz
Ch. Freq. (MHz)
RB offset
Position cond. Pmax (dBm) SAR1g (W/kg) SAR10g (W/kg) power
drift (dB)
liquid (°C)
dist. (mm)declared** meas. meas. extrap. meas. extrap.
10MHz BW/1RB/QPSK 23230 782.0 0 front 24.0 23.9 0.166 0.170 0.131 0.134 0.04 21.0 10 23230 782.0 0 rear 24.0 23.9 0.296 0.303 0.170 0.174 -0.03 21.0 10 23230 782.0 0 left edge 24.0 23.9 0.090 0.092 0.064 0.065 -0.02 21.0 10 23230 782.0 0 right edge 24.0 23.9 0.244 0.250 0.172 0.176 -0.02 21.0 10 23230 782 0 top edge 24.0 23.9 0.008 0.008 0.005 0.005 0.08 21.0 10 23230 782.0 0 bottom edge 24.0 23.9 0.240 0.246 0.139 0.142 0.01 21.0 10
10MHz BW/25RB/QPSK 23230 782.0 12 front 23.0 22.7 0.141 0.151 0.112 0.120 -0.01 21.0 10 23230 782.0 12 rear 23.0 22.7 0.228 0.244 0.131 0.140 0.01 21.0 10 23230 782.0 12 left edge 23.0 22.7 0.080 0.086 0.057 0.061 -0.03 21.0 10 23230 782.0 12 right edge 23.0 22.7 0.203 0.218 0.143 0.153 -0.01 21.0 10 23230 782.0 12 top edge 23.0 22.7 0.006 0.007 0.004 0.005 0.12 21.0 10 23230 782.0 12 bottom edge 23.0 22.7 0.184 0.197 0.105 0.113 0.07 21.0 10
slider open 10MHz BW/1RB/QPSK
23230 782 0 front 24.0 23.9 0.157 0.161 0.099 0.101 0.00 21.0 10 23230 782 0 rear 24.0 23.9 0.293 0.300 0.169 0.173 -0.05 21.0 10 23230 782 0 left edge 24.0 23.9 0.043 0.044 0.030 0.031 0.06 21.0 10 23230 782 0 right edge 24.0 23.9 0.209 0.214 0.148 0.151 -0.02 21.0 10 23230 782 0 top edge 24.0 23.9 0.008 0.008 0.006 0.006 -0.06 21.0 10 23230 782 0 bottom edge 24.0 23.9 0.250 0.256 0.147 0.150 -0.03 21.0 10
10MHz BW/25RB/QPSK 23230 782 12 front 23.0 22.7 0.135 0.145 0.107 0.115 -0.01 21.0 10 23230 782 12 rear 23.0 22.7 0.193 0.207 0.136 0.146 -0.04 21.0 10 23230 782 12 left edge 23.0 22.7 0.038 0.041 0.027 0.029 0.04 21.0 10 23230 782 12 right edge 23.0 22.7 0.193 0.207 0.136 0.146 -0.04 21.0 10 23230 782.0 12 top edge 23.0 22.7 0.007 0.007 0.005 0.005 0.02 21.0 10 23230 782 12 bottom edge 23.0 22.7 0.190 0.204 0.110 0.118 0.00 21.0 10
Table 90: Test results hotspot mode SAR LTE FDD 13 700 MHz (see max. SAR plot in Annex B.10: LTE FDD 13) ** - maximum possible output power declared by manufacturer

Test report no.: 1-0042/15-01-15-A
Page 98 of 223
measured / extrapolated SAR numbers - Body worn - LTE FDD 13 700 MHz
Ch. Freq. (MHz)
RB offset
Position cond. Pmax (dBm) SAR1g (W/kg) SAR10g (W/kg) power
drift (dB)
liquid (°C)
dist. (mm)declared** meas. meas. extrap. meas. extrap.
10MHz BW/1RB/QPSK 23230 782.0 0 front 24.0 23.9 0.160 0.164 0.126 0.129 -0.01 21.0 15 23230 782.0 0 rear 24.0 23.9 0.178 0.182 0.139 0.142 0.00 21.0 15 23230 782 0 rear+holster 24.0 23.9 0.166 0.170 0.129 0.132 -0.02 21.0 0
10MHz BW/25RB/QPSK 23230 782.0 12 front 23.0 22.7 0.140 0.150 0.110 0.118 -0.01 21.0 15 23230 782.0 12 rear 23.0 22.7 0.152 0.163 0.119 0.128 -0.01 21.0 15
Table 91: Test results body worn SAR LTE FDD 13 700 MHz (see max. SAR plot in Annex B.10: LTE FDD 13)

Test report no.: 1-0042/15-01-15-A
Page 99 of 223
measured / extrapolated SAR numbers - Head - LTE FDD 17 700 MHz
Ch. Freq. (MHz)
RB offset
Position cond. Pmax (dBm) SAR1g (W/kg) SAR10g (W/kg) power
drift (dB)
liquid (°C) declared** meas. meas. extrap. meas. extrap.
10MHz BW/1RB/QPSK 23780 709 50 left cheek 24.0 23.7 0.071 0.076 0.056 0.060 0.02 21.723780 709 50 left tilted 15° 24.0 23.7 0.038 0.041 0.031 0.033 -0.05 21.723780 709 50 right cheek 24.0 23.7 0.071 0.076 0.056 0.060 0.00 21.723780 709 50 right tilted 15° 24.0 23.7 0.040 0.043 0.032 0.035 0.01 21.7
10MHz BW/25RB/QPSK 23780 709 25 left cheek 23.0 22.5 0.060 0.068 0.048 0.053 0.06 21.723780 709 25 left tilted 15° 23.0 22.5 0.037 0.041 0.030 0.033 0.03 21.723780 709 25 right cheek 23.0 22.5 0.071 0.079 0.056 0.063 0.17 21.723780 709 25 right tilted 15° 23.0 22.5 0.040 0.044 0.032 0.036 0.11 21.7
slider open 10MHz BW/1RB/QPSK
23780 709.0 50 left cheek 24.0 23.7 0.042 0.045 0.033 0.036 0.01 21.723780 709.0 50 left tilted 15° 24.0 23.7 0.021 0.023 0.017 0.019 -0.03 21.723780 709.0 50 right cheek 24.0 23.7 0.047 0.050 0.037 0.040 0.12 21.723780 709.0 50 right tilted 15° 24.0 23.7 0.023 0.025 0.018 0.020 0.17 21.7
10MHz BW/25RB/QPSK 23780 709.0 25 left cheek 23.0 22.5 0.041 0.046 0.032 0.036 0.04 21.723780 709.0 25 left tilted 15° 23.0 22.5 0.015 0.017 0.011 0.012 -0.02 21.723780 709.0 25 right cheek 23.0 22.5 0.048 0.054 0.038 0.043 -0.20 21.723780 709.0 25 right tilted 15° 23.0 22.5 0.023 0.026 0.019 0.021 0.06 21.7
Table 92: Test results head SAR LTE FDD 17 700 MHz (see max. SAR plot in Annex B.11: LTE FDD 17 195)

Test report no.: 1-0042/15-01-15-A
Page 100 of 223
measured / extrapolated SAR numbers - hotspot mode - LTE FDD 17 700 MHz
Ch. Freq. (MHz)
RB offset
Position cond. Pmax (dBm) SAR1g (W/kg) SAR10g (W/kg) power
drift (dB)
liquid (°C)
dist. (mm)declared** meas. meas. extrap. meas. extrap.
10MHz BW/1RB/QPSK 23780 709 50 front 24.0 23.7 0.113 0.121 0.092 0.098 -0.05 21.0 10 23780 709 50 rear 24.0 23.7 0.142 0.152 0.112 0.120 -0.01 21.0 10 23780 709.0 50 left edge 24.0 23.7 0.100 0.107 0.072 0.077 0.03 21.0 10 23780 709.0 50 right edge 24.0 23.7 0.182 0.195 0.131 0.140 -0.03 21.0 10 23780 709.0 50 top edge 24.0 23.7 0.004 0.004 0.003 0.003 -0.07 21.0 10 23780 709.0 50 bottom edge 24.0 23.7 0.122 0.131 0.072 0.077 -0.03 21.0 10
10MHz BW/25RB/QPSK 23780 709 25 front 23.0 22.5 0.104 0.117 0.084 0.094 0.04 21.0 10 23780 709 25 rear 23.0 22.5 0.134 0.150 0.105 0.118 0.05 21.0 10 23780 709 25 left edge 23.0 22.5 0.095 0.107 0.068 0.077 -0.07 21.0 10 23780 709 25 right edge 23.0 22.5 0.168 0.188 0.121 0.136 -0.01 21.0 10 23780 709 25 top edge 23.0 22.5 0.004 0.004 0.003 0.003 0.02 21.0 10 23780 709 25 bottom edge 23.0 22.5 0.112 0.126 0.066 0.074 -0.05 21.0 10
slider open 10MHz BW/1RB/QPSK
23780 709 50 front 24.0 23.7 0.080 0.085 0.050 0.053 0.01 21.0 10 23780 709 50 rear 24.0 23.7 0.112 0.120 0.066 0.071 0.00 21.0 10 23780 709 50 left edge 24.0 23.7 0.017 0.018 0.012 0.013 -0.03 21.0 10 23780 709 50 right edge 24.0 23.7 0.063 0.067 0.045 0.049 -0.04 21.0 10 23780 709.0 50 top edge 24.0 23.7 0.002 0.002 0.001 0.001 -0.03 21.0 10 23780 709 50 bottom edge 24.0 23.7 0.111 0.119 0.067 0.071 0.03 21.0 10
10MHz BW/25RB/QPSK 23780 709 25 front 23.0 22.5 0.076 0.085 0.047 0.053 0.02 21.0 10 23780 709 25 rear 23.0 22.5 0.105 0.118 0.062 0.070 0.00 21.0 10 23780 709 25 left edge 23.0 22.5 0.016 0.017 0.011 0.013 0.07 21.0 10 23780 709 25 right edge 23.0 22.5 0.070 0.078 0.050 0.056 -0.01 21.0 10 23780 709 25 top edge 23.0 22.5 0.002 0.003 0.001 0.002 0.01 21.0 10 23780 709 25 bottom edge 23.0 22.5 0.101 0.113 0.061 0.068 0.03 21.0 10
Table 93: Test results hotspot mode SAR LTE FDD 17 700 MHz (see max. SAR plot in Annex B.11: LTE FDD 17) ** - maximum possible output power declared by manufacturer

Test report no.: 1-0042/15-01-15-A
Page 101 of 223
measured / extrapolated SAR numbers - Body worn - LTE FDD 17 700 MHz
Ch. Freq. (MHz)
RB offset
Position cond. Pmax (dBm) SAR1g (W/kg) SAR10g (W/kg) power
drift (dB)
liquid (°C)
dist. (mm)declared** meas. meas. extrap. meas. extrap.
10MHz BW/1RB/QPSK 23780 709 50 front 24.0 23.7 0.107 0.115 0.085 0.091 0.04 21.0 15 23780 709 50 rear 24.0 23.7 0.124 0.133 0.098 0.105 -0.01 21.0 15 23780 709 50 rear+holster 24.0 23.7 0.120 0.129 0.095 0.101 -0.05 21.0 0
10MHz BW/25RB/QPSK 23780 709 25 front 23.0 22.5 0.099 0.112 0.079 0.089 0.01 21.0 15 23780 709 25 rear 23.0 22.5 0.114 0.128 0.090 0.101 -0.01 21.0 15
Table 94: Test results body worn SAR LTE FDD 17 700 MHz (see max. SAR plot in Annex B.11: LTE FDD 17)
measured / extrapolated SAR numbers - Head - LTE TDD 41 2600 MHz
Ch. Freq. (MHz)
RB offset
Position cond. Pmax (dBm) SAR1g (W/kg) SAR10g (W/kg) power
drift (dB)
liquid (°C) declared** meas. meas. extrap. meas. extrap.
20MHz BW - QPSK - 1RB 41055 2636.5 0 left cheek 24.0 23.7 0.039 0.042 0.022 0.023 -0.04 22.641055 2636.5 0 left tilted 15° 24.0 23.7 0.063 0.068 0.031 0.033 0.03 22.641055 2636.5 0 right cheek 24.0 23.7 0.135 0.145 0.074 0.079 0.04 22.641055 2636.5 0 right tilted 15° 24.0 23.7 0.049 0.053 0.023 0.025 0.05 22.6
20MHz BW - QPSK - 50RB 41055 2636.5 0 left cheek 23.0 22.8 0.030 0.031 0.016 0.017 0.10 22.641055 2636.5 0 left tilted 15° 23.0 22.8 0.049 0.051 0.024 0.025 0.29 22.641055 2636.5 0 right cheek 23.0 22.8 0.109 0.114 0.060 0.063 0.04 22.641055 2636.5 0 right tilted 15° 23.0 22.8 0.037 0.039 0.018 0.018 0.08 22.6
slider open 41055 2636.5 0 left cheek 24.0 23.7 0.056 0.060 0.029 0.032 -0.08 22.641055 2636.5 0 left tilted 15° 24.0 23.7 0.071 0.076 0.036 0.038 0.12 22.641055 2636.5 0 right cheek 24.0 23.7 0.109 0.117 0.057 0.061 0.11 22.641055 2636.5 0 right tilted 15° 24.0 23.7 0.043 0.046 0.021 0.023 0.18 22.6
41055 2636.5 0 left cheek 23.0 22.8 0.047 0.049 0.025 0.026 0.08 22.641055 2636.5 0 left tilted 15° 23.0 22.8 0.055 0.058 0.027 0.028 -0.05 22.641055 2636.5 0 right cheek 23.0 22.8 0.091 0.095 0.048 0.050 -0.03 22.641055 2636.5 0 right tilted 15° 23.0 22.8 0.034 0.036 0.016 0.017 0.12 22.6
Table 95: Test results head SAR LTE TDD 41 2600 MHz (see max. SAR plot in Annex B.12: LTE TDD 41 page 198)

Test report no.: 1-0042/15-01-15-A
Page 102 of 223
measured / extrapolated SAR numbers - hotspot mode - LTE TDD 41 2600 MHz
Ch. Freq. (MHz)
RB offset
Position cond. Pmax (dBm) SAR1g (W/kg) SAR10g (W/kg) power
drift (dB)
liquid (°C)
dist. (mm)declared** meas. meas. extrap. meas. extrap.
20MHz BW - QPSK - 1RB 41055 2636.5 0 front 21.0 20.7 0.318 0.341 0.148 0.159 -0.01 22.6 10 41055 2636.5 0 rear 21.0 20.7 0.514 0.551 0.235 0.252 -0.01 22.6 10 41055 2636.5 0 left edge 21.0 20.7 0.027 0.029 0.016 0.017 0.18 22.6 10 41055 2636.5 0 right edge 21.0 20.7 0.182 0.195 0.091 0.098 -0.02 22.6 10 41055 2636.5 0 top edge 21.0 20.7 0.027 0.029 0.014 0.015 -0.01 22.6 10 41055 2636.5 0 bottom edge 21.0 20.7 0.598 0.641 0.262 0.281 -0.01 22.6 10
20MHz BW - QPSK - 50RB 41055 2636.5 0 front 21.0 20.6 0.311 0.341 0.145 0.159 0.02 22.6 10 41055 2636.5 0 rear 21.0 20.6 0.513 0.562 0.234 0.257 0.00 22.6 10 41055 2636.5 0 left edge 21.0 20.6 0.028 0.030 0.016 0.018 0.04 22.6 10 41055 2636.5 0 right edge 21.0 20.6 0.172 0.189 0.086 0.094 -0.03 22.6 10 41055 2636.5 0 top edge 21.0 20.6 0.024 0.026 0.012 0.013 -0.05 22.6 10 41055 2636.5 0 bottom edge 21.0 20.6 0.561 0.615 0.245 0.269 -0.01 22.6 10
slider open 20MHz BW - QPSK - 1RB
41055 2636.5 0 front 21.0 20.7 0.266 0.285 0.126 0.135 -0.02 22.6 10 41055 2636.5 0 rear 21.0 20.7 0.397 0.425 0.183 0.196 0.00 22.6 10 41055 2636.5 0 left edge 21.0 20.7 0.022 0.023 0.013 0.014 0.04 22.6 10 41055 2636.5 0 right edge 21.0 20.7 0.159 0.170 0.081 0.087 0.13 22.6 10 41055 2636.5 0 top edge 21.0 20.7 0.002 0.003 0.001 0.001 -0.07 22.6 10 41055 2636.5 0 bottom edge 21.0 20.7 0.614 0.658 0.270 0.289 -0.01 22.6 10
20MHz BW - QPSK - 50RB 41055 2636.5 0 front 21.0 20.6 0.261 0.286 0.123 0.135 0.09 22.6 10 41055 2636.5 0 rear 21.0 20.6 0.386 0.423 0.180 0.197 -0.12 22.6 10 41055 2636.5 0 left edge 21.0 20.6 0.022 0.024 0.013 0.014 -0.05 22.6 10 41055 2636.5 0 right edge 21.0 20.6 0.155 0.170 0.079 0.086 -0.06 22.6 10 41055 2636.5 0 top edge 21.0 20.6 0.008 0.009 0.004 0.004 0.17 22.6 10 41055 2636.5 0 bottom edge 21.0 20.6 0.591 0.648 0.260 0.285 0.07 22.6 10
Table 96: Test results hotspot mode SAR LTE TDD 41 2600 MHz (see max. SAR plot in Annex B.12: LTE TDD 41) ** - maximum possible output power declared by manufacturer
measured / extrapolated SAR numbers - Body worn - LTE TDD 41 2600 MHz
Ch. Freq. (MHz)
RB offset
Position cond. Pmax (dBm) SAR1g (W/kg) SAR10g (W/kg) power
drift (dB)
liquid (°C)
dist. (mm)declared** meas. meas. extrap. meas. extrap.
20MHz BW - QPSK - 1RB 41055 2636.5 0 front 24.0 23.7 0.276 0.296 0.139 0.149 -0.02 22.6 15 41055 2636.5 0 rear 24.0 24.0 0.369 0.369 0.186 0.186 0.00 22.6 15 41055 2636.5 0 rear +holster 24.0 24.0 0.219 0.219 0.115 0.115 -0.10 22.6 0
20MHz BW - QPSK - 50RB 41055 2636.5 0 front 23.0 22.8 0.214 0.224 0.108 0.113 0.03 22.6 15 41055 2636.5 0 rear 23.0 22.8 0.284 0.297 0.143 0.150 -0.01 22.6 15
Table 97: Test results body worn SAR LTE TDD 41 2600 MHz (see max. SAR plot in Annex B.12: LTE TDD 41)

Test report no.: 1-0042/15-01-15-A
Page 103 of 223
THE TESTS FOR WLAN WERE PERFORMED BY THE APPLICANT ITSELF.
Measured/Extrapolated SAR Values - Head - 802.11b DSSS 2450 MHz (Primary Antenna)
Position Data Rate
(Mbps) Ch.
Freq. (MHz)
Cond. Output Power (dBm) Duty
Factor (%)
1g SAR (W/Kg) Extrapolated SAR
Averaged over 10g (W/Kg)
Extrapolated Reported FULL SAR at
100% DF Declared Measured FAST SAR
FULL SAR
FAST SAR
FULL SAR
Slider Closed
Right Cheek
1
1 2412.0 18.5 16.8 95.0 0.083 0.080 0.122 0.118 0.124 0.038
6 2437.0 18.5 17.3 95.0 0.108 0.114 0.142 0.150 0.158 0.056
11 2462.0 18.5 17.9 95.0 0.184 0.199 0.211 0.228 0.240 0.097
Right 15⁰ Tilt
1
1 2412.0 0.000 0.000 0.000
6 2437.0 0.000 0.000 0.000
11 2462.0 18.5 17.9 95.0 0.142 0.154 0.163 0.177 0.186 0.071
Left Cheek
1
1 2412.0 0.000 0.000 0.000
6 2437.0 0.000 0.000 0.000
11 2462.0 18.5 17.9 95.0 0.087 0.085 0.099 0.097 0.102 0.046
Left 15⁰ Tilt
1
1 2412.0 0.000 0.000 0.000
6 2437.0 0.000 0.000 0.000
11 2462.0 18.5 17.9 95.0 0.072 0.071 0.082 0.082 0.086 0.037
Slider Open 0.000 0.000 0.000
Right Cheek
1
1 2412.0 0.000 0.000 0.000
6 2437.0 0.000 0.000 0.000
11 2462.0 18.5 17.9 95.0 0.174 0.182 0.200 0.209 0.219 0.094
Right 15⁰ Tilt
1
1 2412.0 0.000 0.000 0.000
6 2437.0 0.000 0.000 0.000
11 2462.0 18.5 17.9 95.0 0.062 0.066 0.071 0.076 0.080 0.036
Left Cheek
1
1 2412.0 0.000 0.000 0.000
6 2437.0 0.000 0.000 0.000
11 2462.0 18.5 17.9 95.0 0.178 0.172 0.204 0.197 0.207 0.090
Left 15⁰ Tilt
1
1 2412.0 0.000 0.000 0.000
6 2437.0 0.000 0.000 0.000
11 2462.0 18.5 17.9 95.0 0.077 0.078 0.088 0.090 0.095 0.038
Table 98: Test results head SAR WLAN 2450 MHz Primary Antenna (see max. SAR plot in Annex B.13:WLAN2.4/5GHz and Bluetooth2.4GHz)

Test report no.: 1-0042/15-01-15-A
Page 104 of 223
THE TESTS FOR WLAN WERE PERFORMED BY THE APPLICANT ITSELF.
Measured/Extrapolated SAR Values - Hotspot (10mm Spacing) - 802.11b DSSS 2450 MHz (Primary Antenna)
Position Data Rate
(Mbps) Ch.
Freq. (MHz)
Cond. Output Power (dBm) Duty
Factor (%)
1g SAR (W/Kg) Extrapolated SAR
Averaged over 10g (W/Kg)
Extrapolated Reported FULL SAR at
100% DF Declared Measured FAST SAR
FULL SAR
FAST SAR
FULL SAR
Slider Closed
10mm Back
1
1 2412.0 0.000 0.000 0.000
6 2437.0 0.000 0.000 0.000
11 2462.0 11.5 10.8 95.0 0.032 0.033 0.038 0.038 0.040
10mm Front
1
1 2412.0 0.000 0.000 0.000
6 2437.0 0.000 0.000 0.000
11 2462.0 11.5 10.8 95.0 0.007 0.007 0.008 0.008 0.009
10mm Left
1
1 2412.0 0.000 0.000 0.000
6 2437.0 0.000 0.000 0.000
11 2462.0 11.5 10.8 95.0 0.014 0.014 0.017 0.016 0.017
10mm Right
1
1 2412.0 0.000 0.000 0.000 6 2437.0 0.000 0.000 0.000
11 2462.0 11.5 10.8 95.0 0.000 0.000 0.000
10mm Top
1
1 2412.0 0.000 0.000 0.000
6 2437.0 0.000 0.000 0.000
11 2462.0 11.5 10.8 95.0 0.000 0.000 0.000
10mm + Headset
1
1 2412.0 0.000 0.000 0.000
6 2437.0 0.000 0.000 0.000
11 2462.0 0.000 0.000 0.000
Slider Open 0.000 0.000 0.000
10mm Back
1
1 2412.0 11.5 10.1 95.0 0.027 0.028 0.037 0.038 0.040
6 2437.0 11.5 10.2 95.0 0.034 0.034 0.046 0.046 0.049
11 2462.0 11.5 10.8 95.0 0.042 0.043 0.050 0.051 0.053
10mm Front
1
1 2412.0 0.000 0.000 0.000
6 2437.0 0.000 0.000 0.000
11 2462.0 11.5 10.8 95.0 0.009 0.009 0.011 0.011 0.011
10mm Left
1
1 2412.0 0.000 0.000 0.000
6 2437.0 0.000 0.000 0.000
11 2462.0 11.5 10.8 95.0 0.026 0.031 0.000 0.000
10mm Right
1
1 2412.0 0.000 0.000 0.000
6 2437.0 0.000 0.000 0.000
11 2462.0 11.5 10.8 95.0 0.000 0.001 0.000 0.000
10mm Top
1
1 2412.0 0.000 0.000 0.000
6 2437.0 0.000 0.000 0.000
11 2462.0 11.5 10.8 95.0 0.010 0.012 0.000 0.000
Table 99: Test results hotspot mode SAR WLAN 2450 MHz Primary Antenna (see max. SAR plot in Annex B.13:WLAN2.4/5GHz and Bluetooth2.4GHz) Bottom side edge positions for hotspot mode are not required since the distance from the WLAN antenna to the edge is greater than 2.5cm.

Test report no.: 1-0042/15-01-15-A
Page 105 of 223
THE TESTS FOR WLAN WERE PERFORMED BY THE APPLICANT ITSELF.
Measured/Extrapolated SAR Values - Body-Worn (15mm Spacing) - 802.11b DSSS 2450 MHz (Primary Antenna)
Position Data Rate
(Mbps) Ch.
Freq. (MHz)
Cond. Output Power (dBm) Duty
Factor (%)
1g SAR (W/Kg) Extrapolated SAR
Averaged over 10g (W/Kg)
Extrapolated Reported FULL SAR at
100% DF Declared Measured FAST SAR
FULL SAR
FAST SAR
FULL SAR
Slider Closed
15mm Back
1
1 2412.0 18.5 16.8 95.0 0.035 0.035 0.051 0.051 0.054 0.017
6 2437.0 18.5 17.3 95.0 0.065 0.062 0.085 0.082 0.086 0.031
11 2462.0 18.5 17.9 95.0 0.091 0.093 0.105 0.106 0.112 0.045
15mm Front
1
1 2412.0 0.000 0.000 0.000
6 2437.0 0.000 0.000 0.000
11 2462.0 18.5 17.9 95.0 0.021 0.022 0.024 0.025 0.026 0.012
Holster Back
1
1 2412.0 0.000 0.000 0.000
6 2437.0 0.000 0.000 0.000
11 2462.0 18.5 17.9 95.0 0.050 0.049 0.057 0.056 0.059 0.026
Table 100: Test results body worn SAR WLAN 2450 MHz Primary Antenna (see max. SAR plot in Annex B.13:WLAN2.4/5GHz and Bluetooth2.4GHz)

Test report no.: 1-0042/15-01-15-A
Page 106 of 223
THE TESTS FOR WLAN WERE PERFORMED BY THE APPLICANT ITSELF.
Measured/Extrapolated SAR Values - Head - 802.11b DSSS 2450 MHz (Secondary Antenna)
Position Data Rate
(Mbps) Ch.
Freq. (MHz)
Cond. Output Power (dBm) Duty
Factor (%)
1g SAR (W/Kg) Extrapolated SAR
Averaged over 10g (W/Kg)
Extrapolated Reported FULL SAR at
100% DF Declared Measured FAST SAR
FULL SAR
FAST SAR
FULL SAR
Slider Closed
Right Cheek
1
1 2412.0 18.5 17.5 95.0 0.028 0.029 0.035 0.037 0.038 0.017
6 2437.0 0.000 0.000 0.000
11 2462.0 0.000 0.000 0.000
Right 15⁰ Tilt
1
1 2412.0 18.5 17.5 95.0 0.035 0.035 0.044 0.044 0.046 0.018
6 2437.0 0.000 0.000 0.000
11 2462.0 0.000 0.000 0.000
Left Cheek
1
1 2412.0 18.5 17.5 95.0 0.046 0.055 0.058 0.069 0.073 0.027
6 2437.0 18.5 17.3 95.0 0.068 0.074 0.089 0.097 0.102 0.040
11 2462.0 18.5 17.3 95.0 0.063 0.070 0.082 0.092 0.096 0.038
Left 15⁰ Tilt
1
1 2412.0 18.5 17.5 95.0 0.063 0.070 0.079 0.087 0.092 0.033
6 2437.0 18.5 17.3 95.0 0.070 0.080 0.093 0.105 0.111 0.038
11 2462.0 18.5 17.3 95.0 0.062 0.071 0.082 0.093 0.098 0.330
Slider Open 0.000 0.000 0.000
Right Cheek
1
1 2412.0 18.5 17.5 95.0 0.022 0.022 0.028 0.028 0.029 0.012
6 2437.0 0.000 0.000 0.000
11 2462.0 0.000 0.000 0.000
Right 15⁰ Tilt
1
1 2412.0 18.5 17.5 95.0 0.017 0.018 0.022 0.022 0.023 0.008
6 2437.0 0.000 0.000 0.000
11 2462.0 0.000 0.000 0.000
Left Cheek
1
1 2412.0 18.5 17.5 95.0 0.025 0.025 0.032 0.031 0.033 0.013
6 2437.0 0.000 0.000 0.000
11 2462.0 0.000 0.000 0.000
Left 15⁰ Tilt
1
1 2412.0 18.5 17.5 95.0 0.015 0.016 0.019 0.020 0.021 0.008
6 2437.0 0.000 0.000 0.000
11 2462.0 0.000 0.000 0.000
Table 101: Test results head SAR WLAN 2450 Secondary Antenna (see max. SAR plot in Annex B.13:WLAN2.4/5GHz and Bluetooth2.4GHz)

Test report no.: 1-0042/15-01-15-A
Page 107 of 223
THE TESTS FOR WLAN WERE PERFORMED BY THE APPLICANT ITSELF.
Measured/Extrapolated SAR Values - Hotspot (10mm Spacing) - 802.11b DSSS 2450 MHz (Secondary Antenna)
Position Data Rate
(Mbps) Ch.
Freq. (MHz)
Cond. Output Power (dBm) Duty
Factor (%)
1g SAR (W/Kg) FAST SAR at
100% DF Extrapolated Reported FULL
SAR at 100% DF Declared Measured
FAST SAR
FULL SAR
FAST SAR
FULL SAR
Slider Closed
10mm Back
1
1 2412.0 11.5 10.4 95.0 0.000 0.000 0.000
6 2437.0 11.5 10.2 95.0 0.000 0.000 0.000
11 2462.0 11.5 10.5 95.0 0.020 0.025 0.000 0.000
10mm Front
1
1 2412.0 0.000 0.000 0.000
6 2437.0 0.000 0.000 0.000
11 2462.0 11.5 10.5 95.0 0.003 0.004 0.000 0.000
10mm Left
1
1 2412.0 0.000 0.000 0.000
6 2437.0 0.000 0.000 0.000
11 2462.0 11.5 10.5 95.0 0.000 0.000 0.000
10mm Right
1
1 2412.0 0.000 0.000 0.000
6 2437.0 0.000 0.000 0.000
11 2462.0 11.5 10.5 95.0 0.000 0.000 0.000
10mm Top
1
1 2412.0 0.000 0.000 0.000
6 2437.0 0.000 0.000 0.000
11 2462.0 11.5 10.5 95.0 0.000 0.000 0.000
10mm + Headset
1
1 2412.0 0.000 0.000 0.000
6 2437.0 0.000 0.000 0.000
11 2462.0 11.5 10.5 95.0 0.000 0.000 0.000
Slider Open 0.000 0.000 0.000
10mm Back
1
1 2412.0 11.5 10.4 95.0 0.025 0.032 0.000 0.000
6 2437.0 11.5 10.2 95.0 0.030 0.040 0.000 0.000
11 2462.0 11.5 10.5 95.0 0.033 0.035 0.041 0.044 0.046
10mm Front
1
1 2412.0 0.000 0.000 0.000
6 2437.0 0.000 0.000 0.000
11 2462.0 11.5 10.5 95.0 0.003 0.004 0.000 0.000
10mm Left
1
1 2412.0 0.000 0.000 0.000
6 2437.0 0.000 0.000 0.000
11 2462.0 11.5 10.5 95.0 0.000 0.000 0.000 0.000
10mm Right
1
1 2412.0 0.000 0.000 0.000
6 2437.0 0.000 0.000 0.000
11 2462.0 11.5 10.5 95.0 0.009 0.011 0.000 0.000
10mm Top
1
1 2412.0 0.000 0.000 0.000
6 2437.0 0.000 0.000 0.000
11 2462.0 11.5 10.5 95.0 0.002 0.002 0.000 0.000
Table 102: Test results hotspot mode SAR WLAN 2450 MHz Secondary Antenna (see max. SAR plot in Annex B.13:WLAN2.4/5GHz and Bluetooth2.4GHz) Bottom side edge positions for hotspot mode are not required since the distance from the WLAN antenna to the edge is greater than 2.5cm.

Test report no.: 1-0042/15-01-15-A
Page 108 of 223
THE TESTS FOR WLAN WERE PERFORMED BY THE APPLICANT ITSELF.
Measured/Extrapolated SAR Values - Body-Worn (15mm Spacing) - 802.11b DSSS 2450 MHz (Secondary Antenna)
Position Data Rate
(Mbps) Ch.
Freq. (MHz)
Cond. Output Power (dBm) Duty
Factor (%)
1g SAR (W/Kg) Extrapolated SAR
Averaged over 10g (W/Kg)
Extrapolated Reported FULL SAR at
100% DF Declared Measured FAST SAR
FULL SAR
FAST SAR
FULL SAR
Slider Closed
15mm Back
1
1 2412.0 18.5 17.5 95.0 0.033 0.035 0.042 0.044 0.046 0.017
6 2437.0 18.5 17.3 95.0 0.038 0.036 0.050 0.048 0.050 0.018
11 2462.0 18.5 17.3 95.0 0.040 0.038 0.053 0.051 0.053 0.019
15mm Front
1 1 2412.0 18.5 17.5 95.0 0.006 0.006 0.008 0.008 0.008 0.003
6 2437.0 0.000 0.000 0.000 11 2462.0 0.000 0.000 0.000
Holster Back
1
1 2412.0 18.5 17.5 95.0 0.018 0.017 0.023 0.022 0.023 0.009
6 2437.0 0.000 0.000 0.000
11 2462.0 0.000 0.000 0.000
Table 103: Test results body worn SAR WLAN 2450 MHz Secondary Antenna (see max. SAR plot in Annex B.13:WLAN2.4/5GHz and Bluetooth2.4GHz)

Test report no.: 1-0042/15-01-15-A
Page 109 of 223
THE TESTS FOR WLAN WERE PERFORMED BY THE APPLICANT ITSELF.
Measured/Extrapolated SAR Values - Head - 802.11 5000 MHz (Primary Antenna)
Pos. U- NII
802.11 Mode
Data Rate
(Mbps)
BW (MHz)
Ch. Freq. (MHz)
Cond. Output Power (dBm) Duty
Factor (%)
Extrapolated SAR
Averaged over 10g (W/Kg)
FULL SAR at 100%
DF Decl. Meas.
FULL SAR
FULL SAR
Slider Closed
Right Cheek
1 N 40 38 5190 0.000 0.000
46 5230 0.000 0.000
2A N MCS0 40 54 5270 17.0 15.3 95.0 0.079 0.117 0.123 0.032
62 5310 17.0 15.8 95.0 0.076 0.100 0.105 0.030
2C N MCS0 40
102 5510 17.0 15.4 95.0 0.000 0.000
118 5590 17.0 15.6 95.0 0.000 0.000
134 5670 17.0 15.7 95.0 0.050 0.067 0.071 0.019
3 N MCS0 40 151 5755 17.0 16.2 95.0 0.065 0.078 0.082 0.024
159 5795 17.0 16.1 95.0 0.000 0.000
Right 15⁰ Tilt
1 N 40 0.000 0.000
2A N MCS0 40 54 5270 17.0 15.3 95.0 0.095 0.140 0.147 0.036
2C N MCS0 40 0.000 0.000
3 N MCS0 40 0.000 0.000
Left Cheek
1 N 40 38 5190 0.000 0.000
46 5230 0.000 0.000
2A N MCS0 40 54 5270 17.0 15.3 95.0 0.087 0.129 0.136 0.035
62 5310 17.0 15.8 95.0 0.000 0.000
2C N MCS0 40
102 5510 17.0 15.4 95.0 0.000 0.000
118 5590 17.0 15.6 95.0 0.000 0.000
134 5670 17.0 15.7 95.0 0.048 0.064 0.068 0.020
3 N MCS0 40 151 5755 17.0 16.2 95.0 0.073 0.088 0.092 0.028
159 5795 17.0 16.1 95.0 0.000 0.000
Left 15⁰ Tilt
1 N 40 0.000 0.000
2A N MCS0 40 54 5270 17.0 15.3 95.0 0.109 0.161 0.169 0.041
2C N MCS0 40 0.000 0.000
3 N MCS0 40 0.000 0.000
Slider Open 0.000 0.000
Right Cheek
1 N 40 0.000 0.000
2A N MCS0 40 54 5270 17.0 15.3 95.0 0.104 0.154 0.162 0.033
2C N MCS0 40 0.000 0.000
3 N MCS0 40 0.000 0.000
Right 15⁰ Tilt
1 N 40 0.000 0.000
2A N MCS0 40 54 5270 17.0 15.3 95.0 0.083 0.123 0.129 0.028
2C N MCS0 40 0.000 0.000
3 N MCS0 40 0.000 0.000
Left Cheek
1 N 40 0.000 0.000
2A N MCS0 40 54 5270 17.0 15.3 95.0 0.032 0.047 0.049 0.011
2C N MCS0 40 0.000 0.000
3 N MCS0 40 0.000 0.000
Left 15⁰ Tilt
1 N 40 0.000 0.000
2A N MCS0 40 54 5270 17.0 15.3 95.0 0.053 0.079 0.082 0.020
2C N MCS0 40 0.000 0.000
3 N MCS0 40 0.000 0.000
Table 104: Test results head SAR WLAN 5 GHz (see max. SAR plot in Annex B.13:WLAN2.4/5GHz and Bluetooth2.4GHz)

Test report no.: 1-0042/15-01-15-A
Page 110 of 223
THE TESTS FOR WLAN WERE PERFORMED BY THE APPLICANT ITSELF.
Measured/Extrapolated SAR Values - Hotspot (10mm Spacing) - 802.11 5000 MHz (Primary Antenna)
Pos. U- NII
802.11 Mode
Data Rate
(Mbps)
BW (MHz)
Ch. Freq. (MHz)
Cond. Output Power (dBm) Duty
Factor (%)
Extrapolated SAR
Averaged over 10g (W/Kg)
FULL SAR at 100%
DF Decl. Meas.
FULL SAR
FULL SAR
Slider Closed
10mm Back
1 N MCS0 40 38 5190 11.5 10.4 95.0 0.000 0.000
46 5230 11.5 10.6 95.0 0.107 0.132 0.138
2A N MCS0 40 54 5270 0.000 0.000
62 5310 0.000 0.000
2C N MCS0 40
102 5510 0.000 0.000
118 5590 0.000 0.000
134 5670 0.000 0.000
3 N MCS0 40 151 5755 11.5 11.0 95.0 0.089 0.100 0.105
159 5795 0.000 0.000
Slider Open 0.000 0.000
10mm Back
1 N MCS0 40 38 5190 11.5 10.4 95.0 0.133 0.171 0.180
46 5230 11.5 10.6 95.0 0.125 0.154 0.161
2A N MCS0 40 54 5270 0.000 0.000
62 5310 0.000 0.000
2C N MCS0 40
102 5510 0.000 0.000
118 5590 0.000 0.000
134 5670 0.000 0.000
3 N MCS0 40 151 5755 11.5 11.0 95.0 0.116 0.130 0.137
159 5795 0.000 0.000
10mm Front
1 N MCS0 40 46 5230 11.5 10.6 95.0 0.011 0.013 0.014
2A N MCS0 0.000 0.000
2C N MCS0 0.000 0.000
3 N MCS0 0.000 0.000
10mm Left
1 N MCS0 40 46 5230 11.5 10.6 95.0 0.108 0.133 0.140
2A N MCS0 0.000 0.000
2C N MCS0 0.000 0.000
3 N MCS0 0.000 0.000
10mm Right
1 N MCS0 0.000 0.000
2A N MCS0 0.000 0.000
2C N MCS0 0.000 0.000
3 N MCS0 0.000 0.000
10mm Top
1 N MCS0 40 46 5230 11.5 10.6 95.0 0.016 0.020 0.021
2A N MCS0 0.000 0.000
2C N MCS0 0.000 0.000
3 N MCS0 0.000 0.000
Table 105: Test results hotspot mode SAR WLAN 5 GHz (see max. SAR plot in Annex B.13:WLAN2.4/5GHz and Bluetooth2.4GHz)

Test report no.: 1-0042/15-01-15-A
Page 111 of 223
THE TESTS FOR WLAN WERE PERFORMED BY THE APPLICANT ITSELF.
Measured/Extrapolated SAR Values - Body-Worn (15mm Spacing) - 802.11an 5000 MHz (Primary Antenna)
Pos. U- NII
802.11 Mode
Data Rate
(Mbps)
BW (MHz)
Ch. Freq. (MHz)
Cond. Output Power (dBm) Duty
Factor (%)
Extrapolated SAR
Averaged over 10g (W/Kg)
FULL SAR at 100%
DF Decl. Meas.
FULL SAR
FULL SAR
Slider Closed
15mm Back
1 N MCS0 40 38 5190 0.000 0.000
46 5230 0.000 0.000
2A N MCS0 40 54 5270 17.0 15.3 95.0 0.219 0.324 0.340 0.087
62 5310 17.0 15.8 95.0 0.274 0.361 0.379 0.106
2C N MCS0 40
102 5510 17.0 15.4 95.0 0.000 0.000
118 5590 17.0 15.6 95.0 0.000 0.000
134 5670 17.0 15.7 95.0 0.141 0.190 0.200 0.059
3 N MCS0 40 151 5755 17.0 16.2 95.0 0.232 0.279 0.293 0.085
159 5795 17.0 16.1 95.0 0.000 0.000
15mm Front
1 N MCS0 40 0.000 0.000
2A N MCS0 40 62 5310 17.0 15.8 95.0 0.030 0.040 0.042 0.017
2C N MCS0 40 0.000 0.000
3 N MCS0 40 0.000 0.000
Holster Back
1 N MCS0 40 0.000 0.000
2A N MCS0 40 62 5310 17.0 15.8 95.0 0.264 0.348 0.365 0.108
2C N MCS0 40 0.000 0.000
3 N MCS0 40 0.000 0.000
Table 106: Test results body worn SAR WLAN 5 GHz (see max. SAR plot in Annex B.13:WLAN2.4/5GHz and Bluetooth2.4GHz)

Test report no.: 1-0042/15-01-15-A
Page 112 of 223
THE TESTS FOR WLAN WERE PERFORMED BY THE APPLICANT ITSELF.
Measured/Extrapolated SAR Values - Head - 802.11 5000 MHz (Secondary Antenna)
Pos. U- NII
802.11 Mode
Data Rate
(Mbps)
BW (MHz)
Ch. Freq. (MHz)
Cond. Output Power (dBm) Duty
Factor (%)
Extrapolated SAR
Averaged over 10g (W/Kg)
FULL SAR at 100%
DF Decl. Meas.
FULL SAR
FULL SAR
Slider Closed
Right Cheek
1 N 40 38 5190 0.000 0.000
46 5230 0.000 0.000
2A N MCS 0 40 54 5270 17.0 16.1 95.0 0.007 0.008 0.009 0.001
62 5310 17.0 16.0 95.0 0.000 0.000
2C N MCS 0 40
102 5510 17.0 16.5 95.0 0.009 0.010 0.011 0.007
118 5590 17.0 16.0 95.0 0.000 0.000
134 5670 17.0 15.2 95.0 0.000 0.000
3 N MCS 0 40 151 5755 17.0 15.8 95.0 0.018 0.024 0.025 0.009
159 5795 17.0 15.4 95.0 0.000 0.000
Right 15⁰ Tilt
1 A MCS 0 40 0.000 0.000
2A N MCS 0 40 0.000 0.000
2C N MCS 0 40 0.000 0.000
3 N MCS 0 40 151 5755 17.0 15.8 95.0 0.018 0.024 0.025 0.010
Left Cheek
1 N MCS 0 40 38 5190 0.000 0.000
46 5230 0.000 0.000
2A N MCS 0 40 54 5270 17.0 16.1 95.0 0.015 0.018 0.019 0.005
62 5310 17.0 16.0 95.0 0.000 0.000
2C N MCS 0 40
102 5510 17.0 16.5 95.0 0.002 0.002 0.002 0.000
118 5590 17.0 16.0 95.0 0.000 0.000
134 5670 17.0 15.2 95.0 0.000 0.000
3 N MCS 0 40 151 5755 17.0 15.8 95.0 0.029 0.038 0.040 0.011
159 5795 17.0 15.4 95.0 0.000 0.000
Left 15⁰ Tilt
1 N MCS 0 40 0.000 0.000
2A N MCS 0 40 0.000 0.000
2C N MCS 0 40 0.000 0.000
3 N MCS 0 40 151 5755 17.0 15.8 95.0 0.026 0.034 0.036 0.009
Slider Open 0.000 0.000
Right Cheek
1 N MCS 0 40 0.000 0.000
2A N MCS 0 40 0.000 0.000
2C N MCS 0 40 0.000 0.000
3 N MCS 0 40 151 5755 17.0 15.8 95.0 0.028 0.037 0.039 0.012
Right 15⁰ Tilt
1 N MCS 0 40 0.000 0.000
2A N MCS 0 40 0.000 0.000
2C N MCS 0 40 0.000 0.000
3 N MCS 0 40 151 5755 17.0 15.8 0.1 0.014 0.019 0.037 0.008
Left Cheek
1 N MCS 0 40 0.000 0.000
2A N MCS 0 40 0.000 0.000
2C N MCS 0 40 0.000 0.000
3 N MCS 0 40 151 5755 17.0 15.8 95.0 0.003 0.004 0.004 0.001
Left 15⁰ Tilt
1 N MCS 0 40 0.000 0.000
2A N MCS 0 40 0.000 0.000
2C N MCS 0 40 0.000 0.000
3 N MCS 0 40 151 5755 17.0 15.8 95.0 0.010 0.013 0.014 0.006
Table 107: Test results head SAR WLAN 5 GHz (see max. SAR plot in Annex B.13:WLAN2.4/5GHz and Bluetooth2.4GHz)

Test report no.: 1-0042/15-01-15-A
Page 113 of 223
THE TESTS FOR WLAN WERE PERFORMED BY THE APPLICANT ITSELF.
Measured/Extrapolated SAR Values - Hotspot (10mm Spacing) - 802.11 5000 MHz (Secondary Antenna)
Pos. U- NII
802.11 Mode
Data Rate
(Mbps)
BW (MHz)
Ch. Freq. (MHz)
Cond. Output Power (dBm) Duty
Factor (%)
Extrapolated SAR
Averaged over 10g (W/Kg)
FULL SAR at 100%
DF Decl. Meas.
FULL SAR
FULL SAR
Slider Closed
10mm Back
1 N MCS0 40 38 5190 11.5 11.3 95.0 0.047 0.050 0.052
46 5230 11.5 11.1 95.0 0.000 0.000
2A N MCS0 40 54 5270 0.000 0.000
62 5310 0.000 0.000
2C N MCS0 40
102 5510 0.000 0.000
118 5590 0.000 0.000
134 5670 0.000 0.000
3 N MCS0 40 151 5755 11.5 10.2 95.0 0.066 0.089 0.094
159 5795 11.5 10.0 95.0 0.000 0.000
Slider Open 0.000 0.000
10mm Back
1 N MCS0 40 38 5190 11.5 11.3 95.0 0.065 0.068 0.072
46 5230 11.5 11.1 95.0 0.000 0.000
2A N MCS0 40 54 5270
62 5310
2C N MCS0 40
102 5510
118 5590
134 5670
3 N MCS0 40 151 5755 11.5 10.2 95.0 0.065 0.088 0.092
159 5795 11.5 10.0 95.0 0.075 0.106 0.112
10mm Front
1 N MCS0 40 0.000 0.000
2A N MCS0 40 0.000 0.000
2C N MCS0 40 0.000 0.000
3 N MCS0 40 159 5795 11.5 10.0 95.0 0.014 0.019 0.020
10mm Left
1 N MCS0 40 0.000 0.000
2A N MCS0 40 0.000 0.000
2C N MCS0 40 0.000 0.000
3 N MCS0 40 0.000 0.000
10mm Right
1 N MCS0 40 0.000 0.000
2A N MCS0 40 0.000 0.000
2C N MCS0 40 0.000 0.000
3 N MCS0 40 159 5795 11.5 10.0 95.0 0.032 0.044 0.047
10mm Top
1 N MCS0 40 0.000 0.000
2A N MCS0 40 0.000 0.000
2C N MCS0 40 0.000 0.000
3 N MCS0 40 159 5795 11.5 10.0 95.0 0.013 0.019 0.020
Table 108: Test results hotspot mode SAR WLAN 5 GHz (see max. SAR plot in Annex B.13:WLAN2.4/5GHz and Bluetooth2.4GHz)

Test report no.: 1-0042/15-01-15-A
Page 114 of 223
THE TESTS FOR WLAN WERE PERFORMED BY THE APPLICANT ITSELF.
Measured/Extrapolated SAR Values - Body-Worn (15mm Spacing) - 802.11an 5000 MHz (Primary Antenna)
Pos. U- NII
802.11 Mode
Data Rate
(Mbps)
BW (MHz)
Ch. Freq. (MHz)
Cond. Output Power (dBm) Duty
Factor (%)
Extrapolated SAR
Averaged over 10g (W/Kg)
FULL SAR at 100%
DF Decl. Meas.
FULL SAR
FULL SAR
Slider Closed
15mm Back
1 N MCS0 40 38 5190 0.000 0.000
46 5230 0.000 0.000
2A N MCS0 40 54 5270 17.0 16.1 95.0 0.087 0.108 0.113 0.041
62 5310 17.0 16.0 95.0 0.063 0.079 0.083 0.031
2C N MCS0 40
102 5510 17.0 16.5 95.0 0.065 0.073 0.077 0.021
118 5590 17.0 16.0 95.0 0.000 0.000
134 5670 17.0 15.2 95.0 0.000 0.000
3 N MCS0 40 151 5755 17.0 15.8 95.0 0.028 0.037 0.039 0.014
159 5795 17.0 15.4 95.0 0.000 0.000
15mm Front
1 N MCS0 40 0.000 0.000
2A N MCS0 40 54 5270 17.0 16.1 95.0 0.011 0.013 0.014 0.006
2C N MCS0 40 0.000 0.000
3 N MCS0 40 0.000 0.000
Holster Back
1 N MCS0 40 0.000 0.000
2A N MCS0 40 54 5270 17.0 16.1 95.0 0.076 0.094 0.098 0.035
2C N MCS0 40 0.000 0.000
3 N MCS0 40 0.000 0.000
Table 109: Test results body worn SAR WLAN 5 (see max. SAR plot in Annex B.13:WLAN2.4/5GHz and Bluetooth2.4GHz)

Test report no.: 1-0042/15-01-15-A
Page 115 of 223
THE TESTS FOR BLUETOOTH WERE PERFORMED BY THE APPLICANT ITSELF.
Measured/Extrapolated SAR Values - Head - Bluetooth 2450 MHz
Position Ch. Freq. (MHz)
Cond. Output Power (dBm) Power
Drift (dB)
1g SAR (W/Kg) Extrapolated SAR
Averaged over 10g (W/Kg)
Extrapolated Reported
Declared Measured FAST SAR
FULL SAR
FAST SAR
FULL SAR
Slider Closed
Right Cheek
0 2402.0 6.0 5.5 0.000 0.000
39 2441.0 9.0 7.8 0.03 0.012 0.011 0.015 0.015 0.005
78 2480.0 7.0 5.4 0.000 0.000
Right 15⁰ Tilt
0 2402.0 0.000 0.000
39 2441.0 9.0 7.8 -0.10 0.004 0.004 0.005 0.005 0.002
78 2480.0 0.000 0.000
Left Cheek
0 2402.0 0.000 0.000
39 2441.0 9.0 7.8 0.09 0.005 0.004 0.006 0.006 0.002
78 2480.0 0.000 0.000
Left 15⁰ Tilt
0 2402.0 0.000 0.000
39 2441.0 0.000 0.000
78 2480.0 0.000 0.000
Slider Open 0.000 0.000
Right Cheek
0 2402.0 0.000 0.000
39 2441.0 9.0 7.8 -0.06 0.009 0.009 0.011 0.012 0.004
78 2480.0 0.000 0.000
Right 15⁰ Tilt
0 2402.0 0.000 0.000
39 2441.0 0.000 0.000
78 2480.0 0.000 0.000
Left Cheek
0 2402.0 0.000 0.000
39 2441.0 0.000 0.000
78 2480.0 0.000 0.000
Left 15⁰ Tilt
0 2402.0 0.000 0.000
39 2441.0 0.000 0.000
78 2480.0 0.000 0.000
Table 110: Test results head SAR Bluetooth 2450 MHz (see max. SAR plot in Annex B.13:WLAN2.4/5GHz and Bluetooth2.4GHz) THE TESTS FOR BLUETOOTH WERE PERFORMED BY THE APPLICANT ITSELF.
Measured/Extrapolated SAR Values - Hotspot (10mm Spacing) - Bluetooth 2450 MHz
Position Ch. Freq. (MHz)
Cond. Output Power (dBm) Power
Drift (dB)
1g SAR (W/Kg) Extrapolated SAR
Averaged over 10g (W/Kg)
Extrapolated Reported
Declared Measured FAST SAR
FULL SAR
FAST SAR
FULL SAR
Slider Closed
10mm Back
0 2402.0 0.000 0.000
39 2441.0 9.0 7.8 -0.15 0.017 0.023 0.000
78 2480.0 0.000 0.000
Slider Open 0.000 0.000
10mm Back
0 2402.0 0.000 0.000
39 2441.0 9.0 7.8 0.23 0.017 0.019 0.023 0.025 0.009
78 2480.0 0.000 0.000
Table 111: Test results hotspot mode SAR Bluetooth 2450 MHz (see max. SAR plot in Annex B.13:WLAN2.4/5GHz and Bluetooth2.4GHz)

Test report no.: 1-0042/15-01-15-A
Page 116 of 223
THE TESTS FOR BLUETOOTH WERE PERFORMED BY THE APPLICANT ITSELF.
Measured/Extrapolated SAR Values - Body-Worn (15mm Spacing) - Bluetooth 2450 MHz
Position Ch. Freq. (MHz)
Cond. Output Power (dBm) Power
Drift (dB)
1g SAR (W/Kg) Extrapolated SAR
Averaged over 10g (W/Kg)
Extrapolated Reported
Declared Measured FAST SAR
FULL SAR
FAST SAR
FULL SAR
Slider Closed
15mm Back
0 2402.0 0.000 0.000
39 2441.0 9.0 7.8 0.17 0.009 0.007 0.012 0.009 0.003 78 2480.0 0.000 0.000
15mm Front
0 2402.0 0.000 0.000
39 2441.0 0.000 0.000
78 2480.0 0.000 0.000
Holster Back
0 2402.0 0.000 0.000
39 2441.0 0.000 0.000
78 2480.0 0.000 0.000
Table 112: Test results body worn SAR Bluetooth 2450 MHz (see max. SAR plot in Annex B.13:WLAN2.4/5GHz and Bluetooth2.4GHz)

Test report no.: 1-0042/15-01-15-A
Page 117 of 223
7.2.3 Multiple Transmitter Information The following tables list information which is relevant for the decision if a simultaneous transmit evaluation is necessary according to FCC KDB 447498D01 General RF Exposure Guidance v05.
reported SAR WWAN, BT and WLAN2.4GHz, ΣSAR evaluation slider closed
Frequency band Position SARmax /W/kg ΣSAR
WWAN BT WLAN2.4 (0) WLAN2.4 (1) <1.6W/kg GSM 850 left cheek 0.127 0.006 0.102 0.102 0.337
left tilted 15° 0.085 0.006 0.086 0.111 0.288 right cheek 0.184 0.015 0.240 0.038 0.477 right tilted 15° 0.092 0.005 0.186 0.046 0.329 front 10mm 0.379 0.025 0.009 0.004 0.417 rear 10mm 0.491 0.025 0.040 0.025 0.581 front 15mm 0.533 0.009 0.026 0.008 0.576 rear 15mm 0.394 0.009 0.112 0.053 0.568
GSM 1900 left cheek 0.585 0.006 0.102 0.102 0.795 left tilted 15° 0.335 0.006 0.086 0.111 0.538 right cheek 0.294 0.015 0.240 0.038 0.587 right tilted 15° 0.313 0.005 0.186 0.046 0.550 front 10mm 0.372 0.025 0.009 0.004 0.410 rear 10mm 0.663 0.025 0.040 0.025 0.753 front 15mm 0.224 0.009 0.026 0.008 0.267 rear 15mm 0.724 0.009 0.112 0.053 0.898
UMTS FDD II left cheek 0.556 0.006 0.102 0.102 0.766 left tilted 15° 0.266 0.006 0.086 0.111 0.469 right cheek 0.311 0.015 0.240 0.038 0.604 right tilted 15° 0.280 0.005 0.186 0.046 0.517 front 10mm 0.263 0.025 0.009 0.004 0.301 rear 10mm 0.815 0.025 0.040 0.025 0.905 front 15mm 0.253 0.009 0.026 0.008 0.296 rear 15mm 0.934 0.009 0.112 0.053 1.108
WCDMA FDD IV left cheek 1.154 0.006 0.102 0.102 1.364 left tilted 15° 0.523 0.006 0.086 0.111 0.726 right cheek 0.470 0.015 0.240 0.038 0.763 right tilted 15° 0.536 0.005 0.186 0.046 0.773 front 10mm 0.585 0.025 0.009 0.004 0.623 rear 10mm 0.808 0.025 0.040 0.025 0.898 front 15mm 0.891 0.009 0.026 0.008 0.934 rear 15mm 0.871 0.009 0.112 0.053 1.045
WCDMA FDD V left cheek 0.310 0.006 0.102 0.102 0.520 left tilted 15° 0.209 0.006 0.086 0.111 0.412 right cheek 0.326 0.015 0.240 0.038 0.619 right tilted 15° 0.201 0.005 0.186 0.046 0.438 front 10mm 0.318 0.025 0.009 0.004 0.356 rear 10mm 0.502 0.025 0.040 0.025 0.592 front 15mm 0.317 0.009 0.026 0.008 0.360 rear 15mm 0.251 0.009 0.112 0.053 0.425

Test report no.: 1-0042/15-01-15-A
Page 118 of 223
reported SAR WWAN, BT and WLAN2.4GHz, ΣSAR evaluation slider closed
Frequency band Position SARmax /W/kg ΣSAR
WWAN BT WLAN2.4 (0) WLAN2.4 (1) <1.6W/kg LTE FDD 2 left cheek 0.624 0.006 0.102 0.102 0.834
left tilted 15° 0.317 0.006 0.086 0.111 0.520 right cheek 0.335 0.015 0.240 0.038 0.628 right tilted 15° 0.325 0.005 0.186 0.046 0.562 front 10mm 0.469 0.025 0.009 0.004 0.507 rear 10mm 0.607 0.025 0.040 0.025 0.697 front 15mm 0.251 0.009 0.026 0.008 0.294 rear 15mm 0.714 0.009 0.112 0.053 0.888
LTE FDD 4 left cheek 0.620 0.006 0.102 0.102 0.830 left tilted 15° 0.372 0.006 0.086 0.111 0.575 right cheek 0.341 0.015 0.240 0.038 0.634 right tilted 15° 0.377 0.005 0.186 0.046 0.614 front 10mm 0.466 0.025 0.009 0.004 0.504 rear 10mm 0.676 0.025 0.040 0.025 0.766 front 15mm 0.526 0.009 0.026 0.008 0.569 rear 15mm 0.744 0.009 0.112 0.053 0.918
LTE FDD 7 left cheek 0.095 0.006 0.102 0.102 0.305 left tilted 15° 0.093 0.006 0.086 0.111 0.296 right cheek 0.209 0.015 0.240 0.038 0.502 right tilted 15° 0.066 0.005 0.186 0.046 0.303 front 10mm 0.350 0.025 0.009 0.004 0.388 rear 10mm 0.432 0.025 0.040 0.025 0.522 front 15mm 0.391 0.009 0.026 0.008 0.434 rear 15mm 0.465 0.009 0.112 0.053 0.639
LTE FDD 13 left cheek 0.100 0.006 0.102 0.102 0.310 left tilted 15° 0.076 0.006 0.086 0.111 0.279 right cheek 0.139 0.015 0.240 0.038 0.432 right tilted 15° 0.077 0.005 0.186 0.046 0.314 front 10mm 0.170 0.025 0.009 0.004 0.208 rear 10mm 0.303 0.025 0.040 0.025 0.393 front 15mm 0.164 0.009 0.026 0.008 0.207 rear 15mm 0.182 0.009 0.112 0.053 0.356
LTE FDD 17 left cheek 0.076 0.006 0.102 0.102 0.286 left tilted 15° 0.041 0.006 0.086 0.111 0.244 right cheek 0.079 0.015 0.240 0.038 0.372 right tilted 15° 0.044 0.005 0.186 0.046 0.281 front 10mm 0.121 0.025 0.009 0.004 0.159 rear 10mm 0.152 0.025 0.040 0.025 0.242 front 15mm 0.115 0.009 0.026 0.008 0.158 rear 15mm 0.133 0.009 0.112 0.053 0.307
LTE TDD 41 left cheek 0.042 0.006 0.102 0.102 0.252 left tilted 15° 0.068 0.006 0.086 0.111 0.271 right cheek 0.145 0.015 0.240 0.038 0.438 right tilted 15° 0.053 0.005 0.186 0.046 0.290 front 10mm 0.341 0.025 0.009 0.004 0.379 rear 10mm 0.562 0.025 0.040 0.025 0.652 front 15mm 0.296 0.009 0.026 0.008 0.339 rear 15mm 0.369 0.009 0.112 0.053 0.543

Test report no.: 1-0042/15-01-15-A
Page 119 of 223
reported SAR WWAN, BT and WLAN2.4GHz, ΣSAR evaluation slider open
Frequency band Position SARmax /W/kg ΣSAR
WWAN BT WLAN2.4 (0) WLAN2.4 (1) <1.6W/kg GSM 850 left cheek 0.088 0.012 0.207 0.033 0.340
left tilted 15° 0.053 0.012 0.095 0.021 0.181 right cheek 0.099 0.012 0.219 0.029 0.359 right tilted 15° 0.063 0.012 0.080 0.023 0.178 front 10mm 0.340 0.025 0.011 0.046 0.422 rear 10mm 0.948 0.025 0.053 0.046 1.072
GSM 1900 left cheek 0.701 0.012 0.207 0.033 0.953 left tilted 15° 0.351 0.012 0.095 0.021 0.479 right cheek 0.326 0.012 0.219 0.029 0.586 right tilted 15° 0.349 0.012 0.080 0.023 0.464 front 10mm 0.483 0.025 0.011 0.046 0.565 rear 10mm 1.141 0.025 0.053 0.046 1.265
UMTS FDD II left cheek 0.667 0.012 0.207 0.033 0.919 left tilted 15° 0.420 0.012 0.095 0.021 0.548 right cheek 0.350 0.012 0.219 0.029 0.610 right tilted 15° 0.421 0.012 0.080 0.023 0.536 front 10mm 0.647 0.025 0.011 0.046 0.729 rear 10mm 0.925 0.025 0.053 0.046 1.049
WCDMA FDD IV left cheek 0.739 0.012 0.207 0.033 0.991 left tilted 15° 0.532 0.012 0.095 0.021 0.660 right cheek 0.405 0.012 0.219 0.029 0.665 right tilted 15° 0.514 0.012 0.080 0.023 0.629 front 10mm 0.624 0.025 0.011 0.046 0.706 rear 10mm 1.165 0.025 0.053 0.046 1.289
WCDMA FDD V left cheek 0.193 0.012 0.207 0.033 0.445 left tilted 15° 0.121 0.012 0.095 0.021 0.249 right cheek 0.243 0.012 0.219 0.029 0.503 right tilted 15° 0.134 0.012 0.080 0.023 0.249 front 10mm 0.379 0.025 0.011 0.046 0.461 rear 10mm 0.743 0.025 0.053 0.046 0.867
LTE FDD 2 left cheek 0.810 0.012 0.207 0.033 1.062 left tilted 15° 0.411 0.012 0.095 0.021 0.539 right cheek 0.378 0.012 0.219 0.029 0.638 right tilted 15° 0.394 0.012 0.080 0.023 0.509 front 10mm 0.509 0.025 0.011 0.046 0.591 rear 10mm 0.932 0.025 0.053 0.046 1.056
LTE FDD 4 left cheek 0.736 0.012 0.207 0.033 0.988 left tilted 15° 0.382 0.012 0.095 0.021 0.510 right cheek 0.330 0.012 0.219 0.029 0.590 right tilted 15° 0.373 0.012 0.080 0.023 0.488 front 10mm 0.535 0.025 0.011 0.046 0.617 rear 10mm 1.047 0.025 0.053 0.046 1.171

Test report no.: 1-0042/15-01-15-A
Page 120 of 223
reported SAR WWAN, BT and WLAN2.4GHz, ΣSAR evaluation slider open
Frequency band Position SARmax /W/kg ΣSAR
WWAN BT WLAN2.4 (0) WLAN2.4 (1) <1.6W/kg LTE FDD 7 left cheek 0.132 0.012 0.207 0.033 0.384
left tilted 15° 0.129 0.012 0.095 0.021 0.257 right cheek 0.298 0.012 0.219 0.029 0.558 right tilted 15° 0.099 0.012 0.080 0.023 0.214 front 10mm 0.518 0.025 0.011 0.046 0.600 rear 10mm 0.530 0.025 0.053 0.046 0.654
LTE FDD 13 left cheek 0.087 0.012 0.207 0.033 0.339 left tilted 15° 0.056 0.012 0.095 0.021 0.184 right cheek 0.106 0.012 0.219 0.029 0.366 right tilted 15° 0.056 0.012 0.080 0.023 0.171 front 10mm 0.161 0.025 0.011 0.046 0.243 rear 10mm 0.300 0.025 0.053 0.046 0.424
LTE FDD 17 left cheek 0.046 0.012 0.207 0.033 0.298 left tilted 15° 0.023 0.012 0.095 0.021 0.151 right cheek 0.054 0.012 0.219 0.029 0.314 right tilted 15° 0.026 0.012 0.080 0.023 0.141 front 10mm 0.085 0.025 0.011 0.046 0.167 rear 10mm 0.120 0.025 0.053 0.046 0.244
LTE TDD 41 left cheek 0.060 0.012 0.207 0.033 0.312 left tilted 15° 0.076 0.012 0.095 0.021 0.204 right cheek 0.117 0.012 0.219 0.029 0.377 right tilted 15° 0.046 0.012 0.080 0.023 0.161 front 10mm 0.286 0.025 0.011 0.046 0.368 rear 10mm 0.425 0.025 0.053 0.046 0.549
Table 113: SARmax, ΣSAR evaluation.

Test report no.: 1-0042/15-01-15-A
Page 121 of 223
reported SAR WWAN, BT and WLAN 5GHz, ΣSAR evaluation slider closed
Frequency band Position SARmax /W/kg ΣSAR
WWAN BT WLAN5 (0) WLAN5 (1) <1.6W/kg GSM 850 left cheek 0.127 0.006 0.136 0.040 0.309
left tilted 15° 0.085 0.006 0.169 0.036 0.296 right cheek 0.184 0.015 0.123 0.025 0.347 right tilted 15° 0.092 0.005 0.147 0.025 0.269 front 10mm 0.379 0.025 0.138 0.094 0.636 rear 10mm 0.491 0.025 0.138 0.094 0.748 front 15mm 0.533 0.009 0.042 0.014 0.598 rear 15mm 0.394 0.009 0.379 0.113 0.895
GSM 1900 left cheek 0.585 0.006 0.136 0.040 0.767 left tilted 15° 0.335 0.006 0.169 0.036 0.546 right cheek 0.294 0.015 0.123 0.025 0.457 right tilted 15° 0.313 0.005 0.147 0.025 0.490 front 10mm 0.372 0.025 0.138 0.094 0.629 rear 10mm 0.663 0.025 0.138 0.094 0.920 front 15mm 0.224 0.009 0.042 0.014 0.289 rear 15mm 0.724 0.009 0.379 0.113 1.225
UMTS FDD II left cheek 0.556 0.006 0.136 0.040 0.738 left tilted 15° 0.266 0.006 0.169 0.036 0.477 right cheek 0.311 0.015 0.123 0.025 0.474 right tilted 15° 0.280 0.005 0.147 0.025 0.457 front 10mm 0.263 0.025 0.138 0.094 0.520 rear 10mm 0.815 0.025 0.138 0.094 1.072 front 15mm 0.253 0.009 0.042 0.014 0.318 rear 15mm 0.934 0.009 0.379 0.113 1.435
WCDMA FDD IV left cheek 1.154 0.006 0.136 0.040 1.336 left tilted 15° 0.523 0.006 0.169 0.036 0.734 right cheek 0.470 0.015 0.123 0.025 0.633 right tilted 15° 0.536 0.005 0.147 0.025 0.713 front 10mm 0.585 0.025 0.138 0.094 0.842 rear 10mm 0.808 0.025 0.138 0.094 1.065 front 15mm 0.891 0.009 0.042 0.014 0.956 rear 15mm 0.871 0.009 0.379 0.113 1.372
WCDMA FDD V left cheek 0.310 0.006 0.136 0.040 0.492 left tilted 15° 0.209 0.006 0.169 0.036 0.420 right cheek 0.326 0.015 0.123 0.025 0.489 right tilted 15° 0.201 0.005 0.147 0.025 0.378 front 10mm 0.318 0.025 0.138 0.094 0.575 rear 10mm 0.502 0.025 0.138 0.094 0.759 front 15mm 0.317 0.009 0.042 0.014 0.382 rear 15mm 0.251 0.009 0.379 0.113 0.752
LTE FDD 2 left cheek 0.624 0.006 0.136 0.040 0.806 left tilted 15° 0.317 0.006 0.169 0.036 0.528 right cheek 0.335 0.015 0.123 0.025 0.498 right tilted 15° 0.325 0.005 0.147 0.025 0.502 front 10mm 0.469 0.025 0.138 0.094 0.726 rear 10mm 0.607 0.025 0.138 0.094 0.864 front 15mm 0.251 0.009 0.042 0.014 0.316 rear 15mm 0.714 0.009 0.379 0.113 1.215

Test report no.: 1-0042/15-01-15-A
Page 122 of 223
reported SAR WWAN, BT and WLAN 5GHz, ΣSAR evaluation slider closed
Frequency band Position SARmax /W/kg ΣSAR
WWAN BT WLAN5 (0) WLAN5 (1) <1.6W/kg LTE FDD 4 left cheek 0.620 0.006 0.136 0.040 0.802
left tilted 15° 0.372 0.006 0.169 0.036 0.583 right cheek 0.341 0.015 0.123 0.025 0.504 right tilted 15° 0.377 0.005 0.147 0.025 0.554 front 10mm 0.466 0.025 0.138 0.094 0.723 rear 10mm 0.676 0.025 0.138 0.094 0.933 front 15mm 0.526 0.009 0.042 0.014 0.591 rear 15mm 0.744 0.009 0.379 0.113 1.245
LTE FDD 7 left cheek 0.095 0.006 0.136 0.040 0.277 left tilted 15° 0.093 0.006 0.169 0.036 0.304 right cheek 0.209 0.015 0.123 0.025 0.372 right tilted 15° 0.066 0.005 0.147 0.025 0.243 front 10mm 0.350 0.025 0.138 0.094 0.607 rear 10mm 0.432 0.025 0.138 0.094 0.689 front 15mm 0.391 0.009 0.042 0.014 0.456 rear 15mm 0.465 0.009 0.379 0.113 0.966
LTE FDD 13 left cheek 0.100 0.006 0.136 0.040 0.282 left tilted 15° 0.076 0.006 0.169 0.036 0.287 right cheek 0.139 0.015 0.123 0.025 0.302 right tilted 15° 0.077 0.005 0.147 0.025 0.254 front 10mm 0.170 0.025 0.138 0.094 0.427 rear 10mm 0.303 0.025 0.138 0.094 0.560 front 15mm 0.164 0.009 0.042 0.014 0.229 rear 15mm 0.182 0.009 0.379 0.113 0.683
LTE FDD 17 left cheek 0.076 0.006 0.136 0.040 0.258 left tilted 15° 0.041 0.006 0.169 0.036 0.252 right cheek 0.079 0.015 0.123 0.025 0.242 right tilted 15° 0.044 0.005 0.147 0.025 0.221 front 10mm 0.121 0.025 0.138 0.094 0.378 rear 10mm 0.152 0.025 0.138 0.094 0.409 front 15mm 0.115 0.009 0.042 0.014 0.180 rear 15mm 0.133 0.009 0.379 0.113 0.634
LTE TDD 41 left cheek 0.042 0.006 0.136 0.040 0.224 left tilted 15° 0.068 0.006 0.169 0.036 0.279 right cheek 0.145 0.015 0.123 0.025 0.308 right tilted 15° 0.053 0.005 0.147 0.025 0.230 front 10mm 0.341 0.025 0.138 0.094 0.598 rear 10mm 0.562 0.025 0.138 0.094 0.819 front 15mm 0.296 0.009 0.042 0.014 0.361 rear 15mm 0.369 0.009 0.379 0.113 0.870

Test report no.: 1-0042/15-01-15-A
Page 123 of 223
reported SAR WWAN, BT and WLAN 5GHz, ΣSAR evaluation slider open
Frequency band Position SARmax /W/kg ΣSAR
WWAN BT WLAN5 (0) WLAN5 (1) <1.6W/kg GSM 850 left cheek 0.088 0.012 0.049 0.004 0.153
left tilted 15° 0.053 0.012 0.082 0.014 0.161 right cheek 0.099 0.012 0.162 0.039 0.312 right tilted 15° 0.063 0.012 0.129 0.037 0.241 front 10mm 0.340 0.025 0.014 0.020 0.399 rear 10mm 0.948 0.025 0.180 0.112 1.265
GSM 1900 left cheek 0.701 0.012 0.049 0.004 0.766 left tilted 15° 0.351 0.012 0.082 0.014 0.459 right cheek 0.326 0.012 0.162 0.039 0.539 right tilted 15° 0.349 0.012 0.129 0.037 0.527 front 10mm 0.483 0.025 0.014 0.020 0.542 rear 10mm 1.141 0.025 0.180 0.112 1.458
UMTS FDD II left cheek 0.667 0.012 0.049 0.004 0.732 left tilted 15° 0.420 0.012 0.082 0.014 0.528 right cheek 0.350 0.012 0.162 0.039 0.563 right tilted 15° 0.421 0.012 0.129 0.037 0.599 front 10mm 0.647 0.025 0.014 0.020 0.706 rear 10mm 0.925 0.025 0.180 0.112 1.242
WCDMA FDD IV left cheek 0.739 0.012 0.049 0.004 0.804 left tilted 15° 0.532 0.012 0.082 0.014 0.640 right cheek 0.405 0.012 0.162 0.039 0.618 right tilted 15° 0.514 0.012 0.129 0.037 0.692 front 10mm 0.624 0.025 0.014 0.020 0.683 rear 10mm 1.165 0.025 0.180 0.112 1.482
WCDMA FDD V left cheek 0.193 0.012 0.049 0.004 0.258 left tilted 15° 0.121 0.012 0.082 0.014 0.229 right cheek 0.243 0.012 0.162 0.039 0.456 right tilted 15° 0.134 0.012 0.129 0.037 0.312 front 10mm 0.379 0.025 0.014 0.020 0.438 rear 10mm 0.743 0.025 0.180 0.112 1.060
LTE FDD 2 left cheek 0.810 0.012 0.049 0.004 0.875 left tilted 15° 0.411 0.012 0.082 0.014 0.519 right cheek 0.378 0.012 0.162 0.039 0.591 right tilted 15° 0.394 0.012 0.129 0.037 0.572 front 10mm 0.509 0.025 0.014 0.020 0.568 rear 10mm 0.932 0.025 0.180 0.112 1.249
LTE FDD 4 left cheek 0.736 0.012 0.049 0.004 0.801 left tilted 15° 0.382 0.012 0.082 0.014 0.490 right cheek 0.330 0.012 0.162 0.039 0.543 right tilted 15° 0.373 0.012 0.129 0.037 0.551 front 10mm 0.535 0.025 0.014 0.020 0.594 rear 10mm 1.047 0.025 0.180 0.112 1.364
LTE FDD 7 left cheek 0.132 0.012 0.049 0.004 0.197 left tilted 15° 0.129 0.012 0.082 0.014 0.237 right cheek 0.298 0.012 0.162 0.039 0.511 right tilted 15° 0.099 0.012 0.129 0.037 0.277 front 10mm 0.518 0.025 0.014 0.020 0.577 rear 10mm 0.530 0.025 0.180 0.112 0.847

Test report no.: 1-0042/15-01-15-A
Page 124 of 223
reported SAR WWAN, BT and WLAN 5GHz, ΣSAR evaluation slider open
Frequency band Position SARmax /W/kg ΣSAR
WWAN BT WLAN5 (0) WLAN5 (1) <1.6W/kg LTE FDD 13 left cheek 0.087 0.012 0.049 0.004 0.152
left tilted 15° 0.056 0.012 0.082 0.014 0.164 right cheek 0.106 0.012 0.162 0.039 0.319 right tilted 15° 0.056 0.012 0.129 0.037 0.234 front 10mm 0.161 0.025 0.014 0.020 0.220 rear 10mm 0.300 0.025 0.180 0.112 0.617
LTE FDD 17 left cheek 0.046 0.012 0.049 0.004 0.111 left tilted 15° 0.023 0.012 0.082 0.014 0.131 right cheek 0.054 0.012 0.162 0.039 0.267 right tilted 15° 0.026 0.012 0.129 0.037 0.204 front 10mm 0.085 0.025 0.014 0.020 0.144 rear 10mm 0.120 0.025 0.180 0.112 0.437
LTE TDD 41 left cheek 0.060 0.012 0.049 0.004 0.125 left tilted 15° 0.076 0.012 0.082 0.014 0.184 right cheek 0.117 0.012 0.162 0.039 0.330 right tilted 15° 0.046 0.012 0.129 0.037 0.224 front 10mm 0.286 0.025 0.014 0.020 0.345 rear 10mm 0.425 0.025 0.180 0.112 0.742
Table 114: SARmax, ΣSAR evaluation slider open Conclusion: ΣSAR < 1.6 W/kg, therefore simultaneous transmissions SAR measurement with the enlarged zoom scan measurement and volume scan post-processing procedures is not required. Minimum antenna separation distance between MAIN antenna and WLAN/Bluetooth antenna – 104 mm Antennas diagram see in Annex: Photo documentation

Test report no.: 1-0042/15-01-15-A
Page 125 of 223
8 Test equipment and ancillaries used for tests
To simplify the identification of the test equipment and/or ancillaries which were used, the reporting of the relevant test cases only refer to the test item number as specified in the table below.
Equipment Type Manufacturer Serial No. Last Calibration Frequency(months)
Dosimetric E-Field Probe ET3DV6 Schmid & Partner Engineering AG
1554 May 19, 2015 12
Dosimetric E-Field Probe
ES3DV3 Schmid & Partner Engineering AG
3320 February 25, 2015
12
Dosimetric E-Field Probe
ES3DV3 Schmid & Partner Engineering AG
3326 August 18, 2014 12
Dosimetric E-Field Probe
ES3DV3 Schmid & Partner Engineering AG
3326 August 12, 2015 12
Dosimetric E-Field Probe
EX3DV4 Schmid & Partner Engineering AG
3944 August 19, 2014 12
Dosimetric E-Field Probe
EX3DV4 Schmid & Partner Engineering AG
3944 August 14, 2015 12
750 MHz System Validation Dipole
D750V3 Schmid & Partner Engineering AG
1041 August 15, 2013 24
835 MHz System Validation Dipole
D835V2 Schmid & Partner Engineering AG
4d153 May 12, 2015 24
1750 MHz System Validation Dipole
D1750V2 Schmid & Partner Engineering AG
1093 May 13, 2015 24
1900 MHz System Validation Dipole
D1900V2 Schmid & Partner Engineering AG
5d009 May 13, 2015 24
2600 MHz System Validation Dipole
D2600V2 Schmid & Partner Engineering AG
1040 August 15, 2013 24
Data acquisition electronics DAE3V1 Schmid & Partner Engineering AG
413 January 15, 2015 12
Data acquisition electronics DAE3V1 Schmid & Partner Engineering AG
477 May 22, 2015 12
Data acquisition electronics DAE4 Schmid & Partner Engineering AG
1387 August 12, 2014 12
Data acquisition electronics DAE4 Schmid & Partner Engineering AG
1387 August 12, 2015 12
Software DASY52 52.8.7
Schmid & Partner Engineering AG
--- N/A --
Triple Modular Flat Phantom V5.1
QD 000 P51 C
Schmid & Partner Engineering AG
1154 N/A --
SAM Twin Phantom V5.0 QD 000 P40 C
Schmid & Partner Engineering AG
1813 N/A --
Universal Radio Communication Tester
CMU 200 Rohde & Schwarz 106826 February 11, 2015
24
Universal Radio Communication Tester
CMW500 Rohde & Schwarz 102375 January 28, 2015 24
Network Analyser 300 kHz to 6 GHz
8753ES Hewlett Packard)* US39174436 January 29, 2015 24
Dielectric Probe Kit 85070C Hewlett Packard US99360146 N/A 12 Signal Generator 8671B Hewlett Packard 2823A00656 January 29, 2015 24 Amplifier 25S1G4
(25 Watt) Amplifier Reasearch
20452 N/A --
Power Meter NRP Rohde & Schwarz 101367 January 21, 2015 24 Power Meter Sensor NRP Z22 Rohde & Schwarz 100227 January 21, 2015 12 Power Meter Sensor NRP Z22 Rohde & Schwarz 100234 January 21, 2015 12 Directional Coupler 778D Hewlett Packard 19171 January 21, 2015 12
)* : Network analyzer probe calibration against air, distilled water and a shorting block performed before measuring liquid parameters.

Test report no.: 1-0042/15-01-15-A
Page 126 of 223
The test equipment used by the applicant:
Manufacturer Test Equipment Model Number Serial Number Cal. Due
Date (MM/DD/YY)
SCHMID & Partner Engineering AG
E-field probe EX3DV4 3592 11/10/2015
SCHMID & Partner Engineering AG
E-field probe ES3DV3 3225 02/25/2016
SCHMID & Partner Engineering AG
Data Acquisition Electronics (DAE4)
DAE4 881 01/13/2016
SCHMID & Partner Engineering AG
Dipole Validation Kit D2450V2 747 11/14/2015
SCHMID & Partner Engineering AG
Dipole Validation Kit D5000V2 1033 11/08/2015
Agilent Technologies
Signal generator 8648C 4037U03155 09/25/2015
Agilent Technologies
Power meter E4419B GB40202821 09/25/2015
Agilent Technologies
Power sensor 8481A MY41095233 10/06/2015
Agilent Technologies
Power sensor 8481A MY41095417 10/06/2015
Amplifier Research Amplifier 5S1G4M3 300986 CNR Amplifier Research Coupler DC7144 300993 CNR
Agilent Technologies
Network analyzer 8753ES US39174857 10/24/2015
Agilent Technologies
Power meter N1911A MY45100905 06/09/2017
Agilent Technologies
Power sensor N1921A SG45240281 02/04/2016
Rohde & Schwarz Signal generator SMA 100 102106 11/28/2015 CPI Wireless
Solutions Amplifier VZC-6961K4 SK4310E5 CNR
Rohde & Schwarz Bluetooth Tester CBT 100370 11/25/2015 Weinschel Corp 20dB Attenuator 33-20-34 BMO697 CNR
9 Observations No observations exceeding those reported with the single test cases have been made.

Test report no.: 1-0042/15-01-15-A
Page 127 of 223
Annex A: System performance check
Date/Time: 24.08.2015 15:31:28 SystemPerformanceCheck-D750 HSL 2015-08-24 DUT: Dipole 750 MHz; Type: D750V3; Serial: 1041 Communication System: UID 0, CW (0); Communication System Band: D750 (750.0 MHz); Frequency: 750 MHz; Communication System PAR: 0 dB; PMF: 1 Medium parameters used: f = 750 MHz; σ = 0.902 S/m; εr = 41.12; ρ = 1000 kg/m3 Phantom section: Flat Section Measurement Standard: DASY5 DASY5 Configuration: - Probe: ES3DV3 - SN3320; ConvF(6.32, 6.32, 6.32); Calibrated: 25.02.2015; - Sensor-Surface: 4mm (Mechanical Surface Detection), z = 2.0, 32.0 - Electronics: DAE3 Sn413; Calibrated: 15.01.2015 - Phantom: SAM front; Type: QD000P40CC; Serial: TP-1041 - DASY52 52.8.7(1137); SEMCAD X 14.6.10(7164)
HSL750/d=15mm, Pin=1000 mW, dist=3.0mm/Area Scan (51x51x1): Interpolated grid: dx=1.500 mm, dy=1.500 mm Maximum value of SAR (interpolated) = 8.91 W/kg
HSL750/d=15mm, Pin=1000 mW, dist=3.0mm/Zoom Scan (7x8x7)/Cube 0: Measurement grid: dx=5mm, dy=5mm, dz=5mm Reference Value = 101.9 V/m; Power Drift = -0.00 dB Peak SAR (extrapolated) = 12.2 W/kg SAR(1 g) = 8.41 W/kg; SAR(10 g) = 5.56 W/kg Maximum value of SAR (measured) = 9.04 W/kg
0 dB = 9.04 W/kg = 9.56 dBW/kgAdditional information: ambient temperature: 23.7°C; liquid temperature: 23.3°C

Test report no.: 1-0042/15-01-15-A
Page 128 of 223
Date/Time: 25.08.2015 13:37:02 SystemPerformanceCheck-D750 HSL 2015-08-25 DUT: Dipole 750 MHz; Type: D750V3; Serial: 1041 Communication System: UID 0, CW (0); Communication System Band: D750 (750.0 MHz); Frequency: 750 MHz; Communication System PAR: 0 dB; PMF: 1 Medium parameters used: f = 750 MHz; σ = 0.902 S/m; εr = 41.12; ρ = 1000 kg/m3 Phantom section: Flat Section Measurement Standard: DASY5 DASY5 Configuration: - Probe: ES3DV3 - SN3320; ConvF(6.32, 6.32, 6.32); Calibrated: 25.02.2015; - Sensor-Surface: 4mm (Mechanical Surface Detection), z = 2.0, 32.0 - Electronics: DAE3 Sn413; Calibrated: 15.01.2015 - Phantom: SAM front; Type: QD000P40CC; Serial: TP-1041 - DASY52 52.8.7(1137); SEMCAD X 14.6.10(7164)
HSL750/d=15mm, Pin=1000 mW, dist=3.0mm/Area Scan (51x51x1): Interpolated grid: dx=1.500 mm, dy=1.500 mm Maximum value of SAR (interpolated) = 9.04 W/kg
HSL750/d=15mm, Pin=1000 mW, dist=3.0mm/Zoom Scan (7x7x7)/Cube 0: Measurement grid: dx=5mm, dy=5mm, dz=5mm Reference Value = 103.4 V/m; Power Drift = -0.19 dB Peak SAR (extrapolated) = 12.2 W/kg SAR(1 g) = 8.35 W/kg; SAR(10 g) = 5.53 W/kg Maximum value of SAR (measured) = 9.01 W/kg
0 dB = 9.01 W/kg = 9.55 dBW/kgAdditional information: ambient temperature: 23.0°C; liquid temperature: 21.7°C

Test report no.: 1-0042/15-01-15-A
Page 129 of 223
Date/Time: 25.08.2015 10:07:06 SystemPerformanceCheck-D750 body 2015-08-25 DUT: Dipole 750 MHz; Type: D750V3; Serial: 1041 Communication System: UID 0, CW (0); Communication System Band: D750 (750.0 MHz); Frequency: 750 MHz; Communication System PAR: 0 dB; PMF: 1 Medium parameters used: f = 750 MHz; σ = 0.948 S/m; εr = 57.225; ρ = 1000 kg/m3 Phantom section: Center Section Measurement Standard: DASY5 DASY5 Configuration: - Probe: ET3DV6 - SN1554; ConvF(6.77, 6.77, 6.77); Calibrated: 19.05.2015; - Sensor-Surface: 4mm (Mechanical Surface Detection), z = 2.7, 32.7 - Electronics: DAE3 Sn477; Calibrated: 22.05.2015 - Phantom: Triple Flat Phantom 5.1C; Type: QD 000 P51 CA; Serial: 1154 - DASY52 52.8.7(1137); SEMCAD X 14.6.10(7164)
MSL750/d=15mm, Pin=1000 mW, dist=4.0mm/Area Scan (51x51x1): Interpolated grid: dx=1.500 mm, dy=1.500 mm Maximum value of SAR (interpolated) = 8.74 W/kg
MSL750/d=15mm, Pin=1000 mW, dist=4.0mm/Zoom Scan (7x7x7)/Cube 0: Measurement grid: dx=5mm, dy=5mm, dz=5mm Reference Value = 100.4 V/m; Power Drift = -0.04 dB Peak SAR (extrapolated) = 11.3 W/kg SAR(1 g) = 8.24 W/kg; SAR(10 g) = 5.61 W/kg Maximum value of SAR (measured) = 8.88 W/kg
0 dB = 8.88 W/kg = 9.48 dBW/kgAdditional information: ambient temperature: 22.0°C; liquid temperature: 21.0°C

Test report no.: 1-0042/15-01-15-A
Page 130 of 223
Date/Time: 26.08.2015 15:37:15 SystemPerformanceCheck-D750 body 2015-08-26 DUT: Dipole 750 MHz; Type: D750V3; Serial: 1041 Communication System: UID 0, CW (0); Communication System Band: D750 (750.0 MHz); Frequency: 750 MHz; Communication System PAR: 0 dB; PMF: 1 Medium parameters used: f = 750 MHz; σ = 0.948 S/m; εr = 57.225; ρ = 1000 kg/m3 Phantom section: Center Section Measurement Standard: DASY5 DASY5 Configuration: - Probe: ET3DV6 - SN1554; ConvF(6.77, 6.77, 6.77); Calibrated: 19.05.2015; - Sensor-Surface: 4mm (Mechanical Surface Detection), z = 2.7, 32.7 - Electronics: DAE3 Sn477; Calibrated: 22.05.2015 - Phantom: Triple Flat Phantom 5.1C; Type: QD 000 P51 CA; Serial: 1154 - DASY52 52.8.7(1137); SEMCAD X 14.6.10(7164)
MSL750/d=15mm, Pin=1000 mW, dist=4.0mm/Area Scan (51x51x1): Interpolated grid: dx=1.500 mm, dy=1.500 mm Maximum value of SAR (interpolated) = 8.75 W/kg
MSL750/d=15mm, Pin=1000 mW, dist=4.0mm/Zoom Scan (8x7x7)/Cube 0: Measurement grid: dx=5mm, dy=5mm, dz=5mm Reference Value = 100.2 V/m; Power Drift = -0.01 dB Peak SAR (extrapolated) = 11.4 W/kg SAR(1 g) = 8.28 W/kg; SAR(10 g) = 5.62 W/kg Maximum value of SAR (measured) = 8.93 W/kg
0 dB = 8.93 W/kg = 9.51 dBW/kgAdditional information: position or distance of DUT to SAM: 0 mm ambient temperature: 23.3°C; liquid temperature: 22.8°C

Test report no.: 1-0042/15-01-15-A
Page 131 of 223
Date/Time: 27.08.2015 12:44:06 SystemPerformanceCheck-D750 body 2015-08-27 DUT: Dipole 750 MHz; Type: D750V3; Serial: 1041 Communication System: UID 0, CW (0); Communication System Band: D750 (750.0 MHz); Frequency: 750 MHz; Communication System PAR: 0 dB; PMF: 1 Medium parameters used: f = 750 MHz; σ = 0.948 S/m; εr = 57.225; ρ = 1000 kg/m3 Phantom section: Center Section Measurement Standard: DASY5 DASY5 Configuration: - Probe: ET3DV6 - SN1554; ConvF(6.77, 6.77, 6.77); Calibrated: 19.05.2015; - Sensor-Surface: 4mm (Mechanical Surface Detection), z = 2.7, 32.7 - Electronics: DAE3 Sn477; Calibrated: 22.05.2015 - Phantom: Triple Flat Phantom 5.1C; Type: QD 000 P51 CA; Serial: 1154 - DASY52 52.8.7(1137); SEMCAD X 14.6.10(7164)
MSL750/d=15mm, Pin=1000 mW, dist=4.0mm/Area Scan (51x51x1): Interpolated grid: dx=1.500 mm, dy=1.500 mm Maximum value of SAR (interpolated) = 8.80 W/kg
MSL750/d=15mm, Pin=1000 mW, dist=4.0mm/Zoom Scan (7x7x7)/Cube 0: Measurement grid: dx=5mm, dy=5mm, dz=5mm Reference Value = 99.022 V/m; Power Drift = 0.01 dB Peak SAR (extrapolated) = 11.5 W/kg SAR(1 g) = 8.29 W/kg; SAR(10 g) = 5.62 W/kg Maximum value of SAR (measured) = 8.98 W/kg
0 dB = 8.98 W/kg = 9.53 dBW/kgAdditional information: ambient temperature: 22.4°C; liquid temperature: 21.4°C

Test report no.: 1-0042/15-01-15-A
Page 132 of 223
Date/Time: 19.08.2015 17:51:02 SystemPerformanceCheck-D835 head 2015-08-19 DUT: Dipole 835 MHz; Type: D835V2; Serial: 4d153 Communication System: UID 0, CW (0); Communication System Band: D835 (835.0 MHz); Frequency: 835 MHz; Communication System PAR: 0 dB; PMF: 1 Medium parameters used: f = 835 MHz; σ = 0.931 S/m; εr = 41.524; ρ = 1000 kg/m3 Phantom section: Flat Section Measurement Standard: DASY5 DASY5 Configuration: - Probe: ET3DV6 - SN1554; ConvF(6.86, 6.86, 6.86); Calibrated: 19.05.2015; - Sensor-Surface: 4mm (Mechanical Surface Detection), z = 2.7, 32.7 - Electronics: DAE3 Sn477; Calibrated: 22.05.2015 - Phantom: SAM; Type: SAM; Serial: 1043 - DASY52 52.8.7(1137); SEMCAD X 14.6.10(7164)
HSL835/d=15mm, Pin=100 mW, dist=4.0mm/Area Scan (51x51x1): Interpolated grid: dx=1.500 mm, dy=1.500 mm Maximum value of SAR (interpolated) = 1.03 W/kg
HSL835/d=15mm, Pin=100 mW, dist=4.0mm/Zoom Scan (7x7x7)/Cube 0: Measurement grid: dx=5mm, dy=5mm, dz=5mm Reference Value = 34.730 V/m; Power Drift = 0.00 dB Peak SAR (extrapolated) = 1.40 W/kg SAR(1 g) = 0.982 W/kg; SAR(10 g) = 0.651 W/kg Maximum value of SAR (measured) = 1.06 W/kg
0 dB = 1.06 W/kg = 0.25 dBW/kgAdditional information: ambient temperature: 23.0°C; liquid temperature: 22.5°C
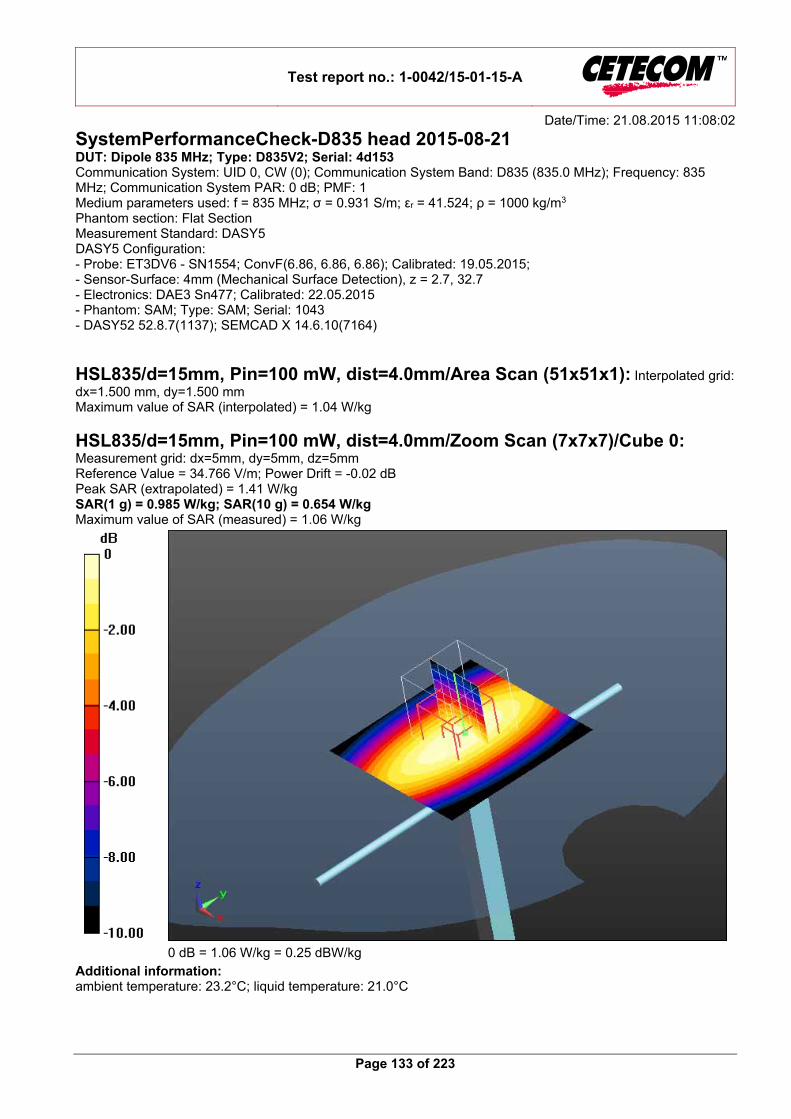
Test report no.: 1-0042/15-01-15-A
Page 133 of 223
Date/Time: 21.08.2015 11:08:02 SystemPerformanceCheck-D835 head 2015-08-21 DUT: Dipole 835 MHz; Type: D835V2; Serial: 4d153 Communication System: UID 0, CW (0); Communication System Band: D835 (835.0 MHz); Frequency: 835 MHz; Communication System PAR: 0 dB; PMF: 1 Medium parameters used: f = 835 MHz; σ = 0.931 S/m; εr = 41.524; ρ = 1000 kg/m3 Phantom section: Flat Section Measurement Standard: DASY5 DASY5 Configuration: - Probe: ET3DV6 - SN1554; ConvF(6.86, 6.86, 6.86); Calibrated: 19.05.2015; - Sensor-Surface: 4mm (Mechanical Surface Detection), z = 2.7, 32.7 - Electronics: DAE3 Sn477; Calibrated: 22.05.2015 - Phantom: SAM; Type: SAM; Serial: 1043 - DASY52 52.8.7(1137); SEMCAD X 14.6.10(7164)
HSL835/d=15mm, Pin=100 mW, dist=4.0mm/Area Scan (51x51x1): Interpolated grid: dx=1.500 mm, dy=1.500 mm Maximum value of SAR (interpolated) = 1.04 W/kg
HSL835/d=15mm, Pin=100 mW, dist=4.0mm/Zoom Scan (7x7x7)/Cube 0: Measurement grid: dx=5mm, dy=5mm, dz=5mm Reference Value = 34.766 V/m; Power Drift = -0.02 dB Peak SAR (extrapolated) = 1.41 W/kg SAR(1 g) = 0.985 W/kg; SAR(10 g) = 0.654 W/kg Maximum value of SAR (measured) = 1.06 W/kg
0 dB = 1.06 W/kg = 0.25 dBW/kgAdditional information: ambient temperature: 23.2°C; liquid temperature: 21.0°C

Test report no.: 1-0042/15-01-15-A
Page 134 of 223
Date/Time: 20.08.2015 17:26:02 SystemPerformanceCheck-D835 MSL 2015-08-20 DUT: Dipole 835 MHz; Type: D835V2; Serial: 4d153 Communication System: UID 0, CW (0); Communication System Band: D835 (835.0 MHz); Frequency: 835 MHz; Communication System PAR: 0 dB; PMF: 1 Medium parameters used: f = 835 MHz; σ = 0.991 S/m; εr = 53.694; ρ = 1000 kg/m3 Phantom section: Center Section Measurement Standard: DASY5 DASY5 Configuration: - Probe: ES3DV3 - SN3320; ConvF(6.11, 6.11, 6.11); Calibrated: 25.02.2015; - Sensor-Surface: 4mm (Mechanical Surface Detection), z = 2.0, 32.0 - Electronics: DAE3 Sn413; Calibrated: 15.01.2015 - Phantom: Triple Flat Phantom 5.1C; Type: QD 000 P51 CA; Serial: 1154 - DASY52 52.8.7(1137); SEMCAD X 14.6.10(7164)
MSL835/d=15mm, Pin=1000 mW, dist=4.0mm/Area Scan (51x51x1): Interpolated grid: dx=1.500 mm, dy=1.500 mm Maximum value of SAR (interpolated) = 10.4 W/kg
MSL835/d=15mm, Pin=1000 mW, dist=4.0mm/Zoom Scan (7x7x7)/Cube 0: Measurement grid: dx=5mm, dy=5mm, dz=5mm Reference Value = 104.4 V/m; Power Drift = 0.02 dB Peak SAR (extrapolated) = 14.2 W/kg SAR(1 g) = 9.8 W/kg; SAR(10 g) = 6.5 W/kg Maximum value of SAR (measured) = 10.5 W/kg
0 dB = 10.5 W/kg = 10.21 dBW/kgAdditional information: ambient temperature: 24.3°C; liquid temperature: 22.5 °C

Test report no.: 1-0042/15-01-15-A
Page 135 of 223
Date/Time: 21.08.2015 09:30:06 SystemPerformanceCheck-D835 MSL 2015-08-21 DUT: Dipole 835 MHz; Type: D835V2; Serial: 4d153 Communication System: UID 0, CW (0); Communication System Band: D835 (835.0 MHz); Frequency: 835 MHz; Communication System PAR: 0 dB; PMF: 1 Medium parameters used: f = 835 MHz; σ = 0.991 S/m; εr = 53.694; ρ = 1000 kg/m3 Phantom section: Center Section Measurement Standard: DASY5 DASY5 Configuration: - Probe: ES3DV3 - SN3320; ConvF(6.11, 6.11, 6.11); Calibrated: 25.02.2015; - Sensor-Surface: 4mm (Mechanical Surface Detection (Locations From Previous Scan Used)), Sensor-Surface: 4mm (Mechanical Surface Detection), z = 2.0, 32.0 - Electronics: DAE3 Sn413; Calibrated: 15.01.2015 - Phantom: Triple Flat Phantom 5.1C; Type: QD 000 P51 CA; Serial: 1154 - DASY52 52.8.7(1137); SEMCAD X 14.6.10(7164)
MSL835/d=15mm, Pin=1000 mW, dist=4.0mm/Area Scan (51x51x1): Interpolated grid: dx=1.500 mm, dy=1.500 mm Maximum value of SAR (interpolated) = 10.3 W/kg
MSL835/d=15mm, Pin=1000 mW, dist=4.0mm/Zoom Scan (8x7x7)/Cube 0: Measurement grid: dx=5mm, dy=5mm, dz=5mm Reference Value = 105.1 V/m; Power Drift = 0.01 dB Peak SAR (extrapolated) = 14.4 W/kg SAR(1 g) = 9.88 W/kg; SAR(10 g) = 6.53 W/kg Maximum value of SAR (measured) = 10.7 W/kg
0 dB = 10.7 W/kg = 10.29 dBW/kgAdditional information: ambient temperature: 23.3°C; liquid temperature: 22.5 °C

Test report no.: 1-0042/15-01-15-A
Page 136 of 223
Date/Time: 7/31/2015 11:26:22 AM SystemPerformanceCheck-D1750 head 2015-07-31 DUT: Dipole 1750 MHz; Type: D1750V2; Serial: 1093 Communication System: UID 0, CW (0); Communication System Band: D1750 (1750.0 MHz); Frequency: 1750 MHz; Communication System PAR: 0 dB; PMF: 1 Medium parameters used: f = 1750 MHz; σ = 1.349 S/m; εr = 38.864; ρ = 1000 kg/m3 Phantom section: Flat Section Measurement Standard: DASY5 DASY5 Configuration: - Probe: ES3DV3 - SN3326; ConvF(5.26, 5.26, 5.26); Calibrated: 8/18/2014; - Sensor-Surface: 4mm (Mechanical Surface Detection), z = 2.0, 32.0 - Electronics: DAE4 Sn1387; Calibrated: 8/12/2014 - Phantom: SAM front; Type: QD000P40CC; Serial: TP:1041 - DASY52 52.8.8(1222); SEMCAD X 14.6.10(7331)
HSL1750/d=10mm, Pin=1000mW/Area Scan (51x51x1): Interpolated grid: dx=1.500 mm, dy=1.500 mm Maximum value of SAR (interpolated) = 44.0 W/kg
HSL1750/d=10mm, Pin=1000mW/Zoom Scan (7x7x7)/Cube 0: Measurement grid: dx=5mm, dy=5mm, dz=5mm Reference Value = 174.6 V/m; Power Drift = -0.04 dB Peak SAR (extrapolated) = 62.9 W/kg SAR(1 g) = 35.4 W/kg; SAR(10 g) = 19 W/kg Maximum value of SAR (measured) = 39.9 W/kg
0 dB = 39.9 W/kg = 16.01 dBW/kgAdditional information: ambient temperature: 23.4°C; liquid temperature: 22.5°C

Test report no.: 1-0042/15-01-15-A
Page 137 of 223
Date/Time: 04.08.2015 11:37:46 SystemPerformanceCheck-D1750 HSL 2015-08-04 DUT: Dipole 1750 MHz; Type: D1750V2; Serial: 1093 Communication System: UID 0, CW (0); Communication System Band: D1750 (1750.0 MHz); Frequency: 1750 MHz; Communication System PAR: 0 dB; PMF: 1 Medium parameters used: f = 1750 MHz; σ = 1.349 S/m; εr = 38.864; ρ = 1000 kg/m3 Phantom section: Flat Section Measurement Standard: DASY5 DASY5 Configuration: - Probe: ES3DV3 - SN3320; ConvF(5.19, 5.19, 5.19); Calibrated: 25.02.2015; - Sensor-Surface: 4mm (Mechanical Surface Detection), z = 2.0, 32.0 - Electronics: DAE3 Sn413; Calibrated: 15.01.2015 - Phantom: SAM front; Type: QD000P40CC; Serial: TP-1041 - DASY52 52.8.7(1137); SEMCAD X 14.6.10(7164)
HSL1750/d=10mm, Pin=1000 mW, dist=3.0mm/Area Scan (51x51x1): Interpolated grid: dx=1.500 mm, dy=1.500 mm Maximum value of SAR (interpolated) = 46.4 W/kg
HSL1750/d=10mm, Pin=1000 mW, dist=3.0mm/Zoom Scan (7x7x7)/Cube 0: Measurement grid: dx=5mm, dy=5mm, dz=5mm Reference Value = 174.5 V/m; Power Drift = -0.03 dB Peak SAR (extrapolated) = 64.9 W/kg SAR(1 g) = 36 W/kg; SAR(10 g) = 19.3 W/kg Maximum value of SAR (measured) = 40.2 W/kg
0 dB = 40.2 W/kg = 16.04 dBW/kgAdditional information: ambient temperature: 23.8°C; liquid temperature: 22.9°C

Test report no.: 1-0042/15-01-15-A
Page 138 of 223
Date/Time: 7/29/2015 2:49:20 PM SystemPerformanceCheck-D1750 MSL 2015-07-29 DUT: Dipole 1750 MHz; Type: D1750V2; Serial: 1093 Communication System: UID 0, CW (0); Communication System Band: D1750 (1750.0 MHz); Frequency: 1750 MHz; Communication System PAR: 0 dB; PMF: 1 Medium parameters used: f = 1750 MHz; σ = 1.549 S/m; εr = 52.011; ρ = 1000 kg/m3 Phantom section: Center Section Measurement Standard: DASY5 DASY5 Configuration: - Probe: ES3DV3 - SN3326; ConvF(4.88, 4.88, 4.88); Calibrated: 8/18/2014; - Sensor-Surface: 3mm (Mechanical Surface Detection), z = 2.0, 32.0 - Electronics: DAE4 Sn1387; Calibrated: 8/12/2014 - Phantom: Triple Flat Phantom 5.1C; Type: QD 000 P51 CA; Serial: 1154 - DASY52 52.8.8(1222); SEMCAD X 14.6.10(7331)
HSL1750/d=10mm, Pin=1000mW/Area Scan (51x51x1): Interpolated grid: dx=1.500 mm, dy=1.500 mm Maximum value of SAR (interpolated) = 49.8 W/kg
HSL1750/d=10mm, Pin=1000mW/Zoom Scan (7x7x7)/Cube 0: Measurement grid: dx=5mm, dy=5mm, dz=5mm Reference Value = 176.1 V/m; Power Drift = 0.03 dB Peak SAR (extrapolated) = 66.5 W/kg SAR(1 g) = 37.7 W/kg; SAR(10 g) = 20.1 W/kg Maximum value of SAR (measured) = 47.4 W/kg
0 dB = 47.4 W/kg = 16.76 dBW/kgAdditional information: ambient temperature: 23.5°C; liquid temperature: 22.6°C

Test report no.: 1-0042/15-01-15-A
Page 139 of 223
Date/Time: 17.08.2015 07:50:32 SystemPerformanceCheck-D1750 body 2015-08-17 DUT: Dipole 1750 MHz; Type: D1750V2; Serial: 1093 Communication System: UID 0, CW (0); Communication System Band: D1750 (1750.0 MHz); Frequency: 1750 MHz; Communication System PAR: 0 dB; PMF: 1 Medium parameters used: f = 1750 MHz; σ = 1.54 S/m; εr = 52.171; ρ = 1000 kg/m3 Phantom section: Center Section Measurement Standard: DASY5 DASY5 Configuration: - Probe: ET3DV6 - SN1554; ConvF(4.81, 4.81, 4.81); Calibrated: 19.05.2015; - Sensor-Surface: 4mm (Mechanical Surface Detection (Locations From Previous Scan Used)), Sensor-Surface: 4mm (Mechanical Surface Detection), z = 2.7, 32.7 - Electronics: DAE3 Sn477; Calibrated: 22.05.2015 - Phantom: Triple Flat Phantom 5.1C; Type: QD 000 P51 CA; Serial: 1154 - DASY52 52.8.7(1137); SEMCAD X 14.6.10(7164)
MSL1750/d=10mm, Pin=100mW/Area Scan (51x51x1): Interpolated grid: dx=1.500 mm, dy=1.500 mm Maximum value of SAR (interpolated) = 4.98 W/kg
MSL1750/d=10mm, Pin=100mW/Zoom Scan (7x7x7)/Cube 0: Measurement grid: dx=5mm, dy=5mm, dz=5mm Reference Value = 56.043 V/m; Power Drift = -0.00 dB Peak SAR (extrapolated) = 5.22 W/kg SAR(1 g) = 3.58 W/kg; SAR(10 g) = 2 W/kg Maximum value of SAR (measured) = 4.07 W/kg
0 dB = 4.07 W/kg = 6.10 dBW/kgAdditional information: ambient temperature: 21.9°C; liquid temperature: 21.4°C

Test report no.: 1-0042/15-01-15-A
Page 140 of 223
Date/Time: 18.08.2015 10:03:41 SystemPerformanceCheck-D1750 body 2015-08-18 DUT: Dipole 1750 MHz; Type: D1750V2; Serial: 1093 Communication System: UID 0, CW (0); Communication System Band: D1750 (1750.0 MHz); Frequency: 1750 MHz; Communication System PAR: 0 dB; PMF: 1 Medium parameters used: f = 1750 MHz; σ = 1.54 S/m; εr = 52.171; ρ = 1000 kg/m3 Phantom section: Center Section Measurement Standard: DASY5 DASY5 Configuration: - Probe: ET3DV6 - SN1554; ConvF(4.81, 4.81, 4.81); Calibrated: 19.05.2015; - Sensor-Surface: 4mm (Mechanical Surface Detection (Locations From Previous Scan Used)), Sensor-Surface: 4mm (Mechanical Surface Detection), z = 2.7, 32.7 - Electronics: DAE3 Sn477; Calibrated: 22.05.2015 - Phantom: Triple Flat Phantom 5.1C; Type: QD 000 P51 CA; Serial: 1154 - DASY52 52.8.7(1137); SEMCAD X 14.6.10(7164)
MSL1750/d=10mm, Pin=100mW/Area Scan (51x51x1): Interpolated grid: dx=1.500 mm, dy=1.500 mm Maximum value of SAR (interpolated) = 4.97 W/kg
MSL1750/d=10mm, Pin=100mW/Zoom Scan (7x7x7)/Cube 0: Measurement grid: dx=5mm, dy=5mm, dz=5mm Reference Value = 56.031 V/m; Power Drift = -0.02 dB Peak SAR (extrapolated) = 5.21 W/kg SAR(1 g) = 3.58 W/kg; SAR(10 g) = 2 W/kg Maximum value of SAR (measured) = 4.06 W/kg
0 dB = 4.06 W/kg = 6.09 dBW/kgAdditional information: position or distance of DUT to SAM: 0 mm ambient temperature: °C; liquid temperature: °C

Test report no.: 1-0042/15-01-15-A
Page 141 of 223
Date/Time: 19.08.2015 15:32:52 SystemPerformanceCheck-D1750 body 2015-08-19 DUT: Dipole 1750 MHz; Type: D1750V2; Serial: 1093 Communication System: UID 0, CW (0); Communication System Band: D1750 (1750.0 MHz); Frequency: 1750 MHz; Communication System PAR: 0 dB; PMF: 1 Medium parameters used: f = 1750 MHz; σ = 1.54 S/m; εr = 52.171; ρ = 1000 kg/m3 Phantom section: Center Section Measurement Standard: DASY5 DASY5 Configuration: - Probe: ET3DV6 - SN1554; ConvF(4.81, 4.81, 4.81); Calibrated: 19.05.2015; - Sensor-Surface: 4mm (Mechanical Surface Detection), z = 2.7, 32.7 - Electronics: DAE3 Sn477; Calibrated: 22.05.2015 - Phantom: Triple Flat Phantom 5.1C; Type: QD 000 P51 CA; Serial: 1154 - DASY52 52.8.7(1137); SEMCAD X 14.6.10(7164)
MSL1750/d=10mm, Pin=100mW/Area Scan (51x51x1): Interpolated grid: dx=1.500 mm, dy=1.500 mm Maximum value of SAR (interpolated) = 4.65 W/kg
MSL1750/d=10mm, Pin=100mW/Zoom Scan (7x7x7)/Cube 0: Measurement grid: dx=5mm, dy=5mm, dz=5mm Reference Value = 53.631 V/m; Power Drift = -0.02 dB Peak SAR (extrapolated) = 5.04 W/kg SAR(1 g) = 3.46 W/kg; SAR(10 g) = 1.93 W/kg Maximum value of SAR (measured) = 3.93 W/kg
0 dB = 3.93 W/kg = 5.94 dBW/kgAdditional information: ambient temperature: 23.1°C; liquid temperature: 21.0°C

Test report no.: 1-0042/15-01-15-A
Page 142 of 223
Date/Time: 29.07.2015 13:25:19 SystemPerformanceCheck-D1900 HSL 2015-07-29 DUT: Dipole 1900 MHz; Type: D1900V2; Serial: 5d009 Communication System: UID 0, CW (0); Communication System Band: D1900 (1900.0 MHz); Frequency: 1900 MHz; Communication System PAR: 0 dB; PMF: 1 Medium parameters used: f = 1900 MHz; σ = 1.381 S/m; εr = 39.929; ρ = 1000 kg/m3 Phantom section: Flat Section Measurement Standard: DASY5 DASY5 Configuration: - Probe: ES3DV3 - SN3320; ConvF(5.04, 5.04, 5.04); Calibrated: 25.02.2015; - Sensor-Surface: 4mm (Mechanical Surface Detection), z = 2.0, 32.0 - Electronics: DAE3 Sn413; Calibrated: 15.01.2015 - Phantom: SAM front; Type: QD000P40CC; Serial: TP-1041 - DASY52 52.8.7(1137); SEMCAD X 14.6.10(7164)
HSL1900/d=10mm, Pin=1000 mW, dist=3.0mm/Area Scan (51x51x1): Interpolated grid: dx=1.500 mm, dy=1.500 mm Maximum value of SAR (interpolated) = 52.2 W/kg
HSL1900/d=10mm, Pin=1000 mW, dist=3.0mm/Zoom Scan (7x7x7)/Cube 0: Measurement grid: dx=5mm, dy=5mm, dz=5mm Reference Value = 181.1 V/m; Power Drift = 0.08 dB Peak SAR (extrapolated) = 71.5 W/kg SAR(1 g) = 39.5 W/kg; SAR(10 g) = 20.8 W/kg Maximum value of SAR (measured) = 44.6 W/kg
0 dB = 44.6 W/kg = 16.49 dBW/kgAdditional information: ambient temperature: 23.4°C; liquid temperature: 22.2°C

Test report no.: 1-0042/15-01-15-A
Page 143 of 223
Date/Time: 30.07.2015 08:54:08 SystemPerformanceCheck-D1900 HSL 2015-07-30 DUT: Dipole 1900 MHz; Type: D1900V2; Serial: 5d009 Communication System: UID 0, CW (0); Communication System Band: D1900 (1900.0 MHz); Frequency: 1900 MHz; Communication System PAR: 0 dB; PMF: 1 Medium parameters used: f = 1900 MHz; σ = 1.381 S/m; εr = 39.929; ρ = 1000 kg/m3 Phantom section: Flat Section Measurement Standard: DASY5 DASY5 Configuration: - Probe: ES3DV3 - SN3320; ConvF(5.04, 5.04, 5.04); Calibrated: 25.02.2015; - Sensor-Surface: 4mm (Mechanical Surface Detection), z = 2.0, 32.0 - Electronics: DAE3 Sn413; Calibrated: 15.01.2015 - Phantom: SAM front; Type: QD000P40CC; Serial: TP-1041 - DASY52 52.8.7(1137); SEMCAD X 14.6.10(7164)
HSL1900/d=10mm, Pin=1000 mW, dist=3.0mm/Area Scan (51x51x1): Interpolated grid: dx=1.500 mm, dy=1.500 mm Maximum value of SAR (interpolated) = 52.6 W/kg
HSL1900/d=10mm, Pin=1000 mW, dist=3.0mm/Zoom Scan (7x7x7)/Cube 0: Measurement grid: dx=5mm, dy=5mm, dz=5mm Reference Value = 180.3 V/m; Power Drift = 0.01 dB Peak SAR (extrapolated) = 70.6 W/kg SAR(1 g) = 39.2 W/kg; SAR(10 g) = 20.7 W/kg Maximum value of SAR (measured) = 44.1 W/kg
0 dB = 44.1 W/kg = 16.44 dBW/kgAdditional information: ambient temperature: 23.4°C; liquid temperature: 22.2°C

Test report no.: 1-0042/15-01-15-A
Page 144 of 223
Date/Time: 14.08.2015 13:44:27 SystemPerformanceCheck-D1900 MSL 2015-08-14 DUT: Dipole 1900 MHz; Type: D1900V2; Serial: 5d009 Communication System: UID 0, CW (0); Communication System Band: D1900 (1900.0 MHz); Frequency: 1900 MHz; Communication System PAR: 0 dB; PMF: 1 Medium parameters used: f = 1900 MHz; σ = 1.522 S/m; εr = 53.659; ρ = 1000 kg/m3 Phantom section: Center Section Measurement Standard: DASY5 DASY5 Configuration: - Probe: ES3DV3 - SN3320; ConvF(4.54, 4.54, 4.54); Calibrated: 25.02.2015; - Sensor-Surface: 3mm (Mechanical Surface Detection), z = 2.0, 32.0 - Electronics: DAE3 Sn413; Calibrated: 15.01.2015 - Phantom: Triple Flat Phantom 5.1C; Type: QD 000 P51 CA; Serial: 1154 - DASY52 52.8.7(1137); SEMCAD X 14.6.10(7164)
HSL1900/d=10mm, Pin=1000 mW, dist=3.0mm/Area Scan (51x51x1): Interpolated grid: dx=1.500 mm, dy=1.500 mm Maximum value of SAR (interpolated) = 56.7 W/kg
HSL1900/d=10mm, Pin=1000 mW, dist=3.0mm/Zoom Scan (8x7x7)/Cube 0: Measurement grid: dx=5mm, dy=5mm, dz=5mm Reference Value = 180.8 V/m; Power Drift = -0.03 dB Peak SAR (extrapolated) = 70.6 W/kg SAR(1 g) = 41.3 W/kg; SAR(10 g) = 22.1 W/kg Maximum value of SAR (measured) = 52.0 W/kg
0 dB = 52.0 W/kg = 17.16 dBW/kgAdditional information: ambient temperature: 23.8°C; liquid temperature: 23.4°C

Test report no.: 1-0042/15-01-15-A
Page 145 of 223
Date/Time: 17.08.2015 12:32:39 SystemPerformanceCheck-D1900 MSL 2015-08-17 DUT: Dipole 1900 MHz; Type: D1900V2; Serial: 5d009 Communication System: UID 0, CW (0); Communication System Band: D1900 (1900.0 MHz); Frequency: 1900 MHz; Communication System PAR: 0 dB; PMF: 1 Medium parameters used: f = 1900 MHz; σ = 1.522 S/m; εr = 53.659; ρ = 1000 kg/m3 Phantom section: Center Section Measurement Standard: DASY5 DASY5 Configuration: - Probe: ES3DV3 - SN3320; ConvF(4.54, 4.54, 4.54); Calibrated: 25.02.2015; - Sensor-Surface: 3mm (Mechanical Surface Detection), z = 2.0, 32.0 - Electronics: DAE3 Sn413; Calibrated: 15.01.2015 - Phantom: Triple Flat Phantom 5.1C; Type: QD 000 P51 CA; Serial: 1154 - DASY52 52.8.7(1137); SEMCAD X 14.6.10(7164)
MSL1900/d=10mm, Pin=1000 mW, dist=3.0mm/Area Scan (51x51x1): Interpolated grid: dx=1.500 mm, dy=1.500 mm Maximum value of SAR (interpolated) = 60.9 W/kg
MSL1900/d=10mm, Pin=1000 mW, dist=3.0mm/Zoom Scan (8x7x7)/Cube 0: Measurement grid: dx=5mm, dy=5mm, dz=5mm Reference Value = 188.5 V/m; Power Drift = 0.07 dB Peak SAR (extrapolated) = 71.6 W/kg SAR(1 g) = 41.2 W/kg; SAR(10 g) = 21.9 W/kg Maximum value of SAR (measured) = 51.8 W/kg
0 dB = 51.8 W/kg = 17.14 dBW/kgAdditional information: ambient temperature: 21.3°C; liquid temperature: 21.3°C

Test report no.: 1-0042/15-01-15-A
Page 146 of 223
Date/Time: 18.08.2015 11:17:16 SystemPerformanceCheck-D1900 MSL 2015-08-18 DUT: Dipole 1900 MHz; Type: D1900V2; Serial: 5d009 Communication System: UID 0, CW (0); Communication System Band: D1900 (1900.0 MHz); Frequency: 1900 MHz; Communication System PAR: 0 dB; PMF: 1 Medium parameters used: f = 1900 MHz; σ = 1.522 S/m; εr = 53.659; ρ = 1000 kg/m3 Phantom section: Center Section Measurement Standard: DASY5 DASY5 Configuration: - Probe: ES3DV3 - SN3320; ConvF(4.54, 4.54, 4.54); Calibrated: 25.02.2015; - Sensor-Surface: 3mm (Mechanical Surface Detection), z = 2.0, 32.0 - Electronics: DAE3 Sn413; Calibrated: 15.01.2015 - Phantom: Triple Flat Phantom 5.1C; Type: QD 000 P51 CA; Serial: 1154 - DASY52 52.8.7(1137); SEMCAD X 14.6.10(7164)
MSL1900/d=10mm, Pin=1000 mW, dist=3.0mm/Area Scan (51x51x1): Interpolated grid: dx=1.500 mm, dy=1.500 mm Maximum value of SAR (interpolated) = 62.5 W/kg
MSL1900/d=10mm, Pin=1000 mW, dist=3.0mm/Zoom Scan (7x7x7)/Cube 0: Measurement grid: dx=5mm, dy=5mm, dz=5mm Reference Value = 191.0 V/m; Power Drift = -0.04 dB Peak SAR (extrapolated) = 73.0 W/kg SAR(1 g) = 42.1 W/kg; SAR(10 g) = 22.3 W/kg Maximum value of SAR (measured) = 53.1 W/kg
0 dB = 53.1 W/kg = 17.25 dBW/kgAdditional information: ambient temperature: 22.2°C; liquid temperature: 22.4°C

Test report no.: 1-0042/15-01-15-A
Page 147 of 223
Date/Time: 19.08.2015 10:31:31 SystemPerformanceCheck-D1900 MSL 2015-08-19 DUT: Dipole 1900 MHz; Type: D1900V2; Serial: 5d009 Communication System: UID 0, CW (0); Communication System Band: D1900 (1900.0 MHz); Frequency: 1900 MHz; Communication System PAR: 0 dB; PMF: 1 Medium parameters used: f = 1900 MHz; σ = 1.522 S/m; εr = 53.659; ρ = 1000 kg/m3 Phantom section: Center Section Measurement Standard: DASY5 DASY5 Configuration: - Probe: ES3DV3 - SN3320; ConvF(4.54, 4.54, 4.54); Calibrated: 25.02.2015; - Sensor-Surface: 3mm (Mechanical Surface Detection), z = 2.0, 32.0 - Electronics: DAE3 Sn413; Calibrated: 15.01.2015 - Phantom: Triple Flat Phantom 5.1C; Type: QD 000 P51 CA; Serial: 1154 - DASY52 52.8.7(1137); SEMCAD X 14.6.10(7164)
MSL1900/d=10mm, Pin=1000 mW, dist=3.0mm/Area Scan (51x51x1): Interpolated grid: dx=1.500 mm, dy=1.500 mm Maximum value of SAR (interpolated) = 64.8 W/kg
MSL1900/d=10mm, Pin=1000 mW, dist=3.0mm/Zoom Scan (7x7x7)/Cube 0: Measurement grid: dx=5mm, dy=5mm, dz=5mm Reference Value = 193.9 V/m; Power Drift = 0.06 dB Peak SAR (extrapolated) = 73.5 W/kg SAR(1 g) = 42.5 W/kg; SAR(10 g) = 22.6 W/kg Maximum value of SAR (measured) = 53.6 W/kg
0 dB = 53.6 W/kg = 17.29 dBW/kgAdditional information: ambient temperature: 22.3°C; liquid temperature: 22.3°C

Test report no.: 1-0042/15-01-15-A
Page 148 of 223
Date/Time: 29.08.2015 12:29:53 SystemPerformanceCheck-D1900 MSL 2015-08-29 DUT: Dipole 1900 MHz; Type: D1900V2; Serial: 5d009 Communication System: UID 0, CW (0); Communication System Band: D1900 (1900.0 MHz); Frequency: 1900 MHz; Communication System PAR: 0 dB; PMF: 1 Medium parameters used: f = 1900 MHz; σ = 1.499 S/m; εr = 52.727; ρ = 1000 kg/m3 Phantom section: Center Section Measurement Standard: DASY5 DASY5 Configuration: - Probe: EX3DV4 - SN3944; ConvF(7.91, 7.91, 7.91); Calibrated: 14.08.2015; - Sensor-Surface: 3mm (Mechanical Surface Detection (Locations From Previous Scan Used)), Sensor-Surface: 3mm (Mechanical Surface Detection), z = 1.0, 31.0 - Electronics: DAE3 Sn413; Calibrated: 15.01.2015 - Phantom: Triple Flat Phantom 5.1C; Type: QD 000 P51 CA; Serial: 1154 - DASY52 52.8.7(1137); SEMCAD X 14.6.10(7164)
MSL1900/d=10mm, Pin=1000 mW, dist=3.0mm/Area Scan (51x51x1): Interpolated grid: dx=1.500 mm, dy=1.500 mm Maximum value of SAR (interpolated) = 57.9 W/kg
MSL1900/d=10mm, Pin=1000 mW, dist=3.0mm/Zoom Scan (7x7x7)/Cube 0: Measurement grid: dx=5mm, dy=5mm, dz=5mm Reference Value = 180.1 V/m; Power Drift = 0.04 dB Peak SAR (extrapolated) = 68.1 W/kg SAR(1 g) = 38.6 W/kg; SAR(10 g) = 20.6 W/kg Maximum value of SAR (measured) = 48.8 W/kg
0 dB = 48.8 W/kg = 16.88 dBW/kgAdditional information: ambient temperature: 23.8°C; liquid temperature: 22.4°C

Test report no.: 1-0042/15-01-15-A
Page 149 of 223
Date/Time: 04.08.2015 11:52:36 SystemPerformanceCheck-D2600 head 2015-08-04 DUT: Dipole 2600 MHz; Type: D2600V2; Serial: 1040 Communication System: UID 0, CW (0); Communication System Band: D2600 (2600.0 MHz); Frequency: 2600 MHz; Communication System PAR: 0 dB; PMF: 1 Medium parameters used: f = 2600 MHz; σ = 1.899 S/m; εr = 37.827; ρ = 1000 kg/m3 Phantom section: Flat Section Measurement Standard: DASY5 DASY5 Configuration: - Probe: EX3DV4 - SN3944; ConvF(7.33, 7.33, 7.33); Calibrated: 19.08.2014; - Sensor-Surface: 2mm (Mechanical Surface Detection), z = 1.0, 31.0 - Electronics: DAE3 Sn477; Calibrated: 22.05.2015 - Phantom: SAM; Type: SAM; Serial: 1043 - DASY52 52.8.7(1137); SEMCAD X 14.6.10(7164)
HSL2450_2600/d=10mm, Pin=100 mW, dist=2.0mm/Area Scan (81x81x1): Interpolated grid: dx=1.000 mm, dy=1.000 mm Maximum value of SAR (interpolated) = 8.83 W/kg
HSL2450_2600/d=10mm, Pin=100 mW, dist=2.0mm/Zoom Scan (7x7x7)/Cube 0: Measurement grid: dx=5mm, dy=5mm, dz=5mm Reference Value = 69.139 V/m; Power Drift = -0.01 dB Peak SAR (extrapolated) = 12.1 W/kg SAR(1 g) = 5.58 W/kg; SAR(10 g) = 2.47 W/kg Maximum value of SAR (measured) = 8.76 W/kg
0 dB = 8.76 W/kg = 9.43 dBW/kgAdditional information: ambient temperature: 22.8°C; liquid temperature: 21.4°C

Test report no.: 1-0042/15-01-15-A
Page 150 of 223
Date/Time: 01.09.2015 09:18:49 SystemPerformanceCheck-D2600 HSL 2015-09-01 DUT: Dipole 2600 MHz; Type: D2600V2; Serial: 1040 Communication System: UID 0, CW (0); Communication System Band: D2600 (2600.0 MHz); Frequency: 2600 MHz; Communication System PAR: 0 dB; PMF: 1 Medium parameters used: f = 2600 MHz; σ = 1.959 S/m; εr = 38.434; ρ = 1000 kg/m3 Phantom section: Flat Section Measurement Standard: DASY5 DASY5 Configuration: - Probe: EX3DV4 - SN3944; ConvF(7.15, 7.15, 7.15); Calibrated: 14.08.2015; - Sensor-Surface: 2mm (Mechanical Surface Detection), Sensor-Surface: 3mm (Mechanical Surface Detection), z = 1.0, 31.0 - Electronics: DAE3 Sn413; Calibrated: 15.01.2015 - Phantom: SAM front; Type: QD000P40CC; Serial: TP-1041 - DASY52 52.8.7(1137); SEMCAD X 14.6.10(7164)
HSL2600/d=10mm, Pin=1000 mW, dist=2.0mm/Area Scan (71x61x1): Interpolated grid: dx=1.000 mm, dy=1.100 mm Maximum value of SAR (interpolated) = 92.7 W/kg
HSL2600/d=10mm, Pin=1000 mW, dist=2.0mm/Zoom Scan (7x7x7)/Cube 0: Measurement grid: dx=5mm, dy=5mm, dz=5mm Reference Value = 202.6 V/m; Power Drift = -0.13 dB Peak SAR (extrapolated) = 126 W/kg SAR(1 g) = 59.8 W/kg; SAR(10 g) = 27.1 W/kg Maximum value of SAR (measured) = 80.2 W/kg
0 dB = 80.2 W/kg = 19.04 dBW/kgAdditional information: ambient temperature: 23.8°C; liquid temperature: 23.3°C

Test report no.: 1-0042/15-01-15-A
Page 151 of 223
Date/Time: 03.09.2015 14:03:04 SystemPerformanceCheck-D2600 MSL 2015-09-03 DUT: Dipole 2600 MHz; Type: D2600V2; Serial: 1040 Communication System: UID 0, CW (0); Communication System Band: D2600 (2600.0 MHz); Frequency: 2600 MHz; Communication System PAR: 0 dB; PMF: 1 Medium parameters used: f = 2600 MHz; σ = 2.208 S/m; εr = 51; ρ = 1000 kg/m3 Phantom section: Center Section Measurement Standard: DASY5 DASY5 Configuration: - Probe: EX3DV4 - SN3944; ConvF(7.37, 7.37, 7.37); Calibrated: 14.08.2015; - Sensor-Surface: 2mm (Mechanical Surface Detection), z = 1.0, 31.0 - Electronics: DAE3 Sn413; Calibrated: 15.01.2015 - Phantom: Triple Flat Phantom 5.1C; Type: QD 000 P51 CA; Serial: 1154 - DASY52 52.8.7(1137); SEMCAD X 14.6.10(7164)
MSL2600/d=10mm, Pin=1000 mW, dist=2.0mm/Area Scan (71x71x1): Interpolated grid: dx=1.000 mm, dy=1.000 mm Maximum value of SAR (interpolated) = 86.5 W/kg
MSL2600/d=10mm, Pin=1000 mW, dist=2.0mm/Zoom Scan (7x7x7)/Cube 0: Measurement grid: dx=5mm, dy=5mm, dz=5mm Reference Value = 197.6 V/m; Power Drift = 0.07 dB Peak SAR (extrapolated) = 116 W/kg SAR(1 g) = 54.8 W/kg; SAR(10 g) = 24.3 W/kg Maximum value of SAR (measured) = 85.7 W/kg
0 dB = 85.7 W/kg = 19.33 dBW/kgAdditional information: ambient temperature: 23.8 °C; liquid temperature: 22.6 °C

Test report no.: 1-0042/15-01-15-A
Page 152 of 223
Date/Time: 04.09.2015 11:42:47 SystemPerformanceCheck-D2600 MSL 2015-09-04 DUT: Dipole 2600 MHz; Type: D2600V2; Serial: 1040 Communication System: UID 0, CW (0); Communication System Band: D2600 (2600.0 MHz); Frequency: 2600 MHz; Communication System PAR: 0 dB; PMF: 1 Medium parameters used: f = 2600 MHz; σ = 2.208 S/m; εr = 51; ρ = 1000 kg/m3 Phantom section: Center Section Measurement Standard: DASY5 DASY5 Configuration: - Probe: EX3DV4 - SN3944; ConvF(7.37, 7.37, 7.37); Calibrated: 14.08.2015; - Sensor-Surface: 2mm (Mechanical Surface Detection), z = 1.0, 31.0 - Electronics: DAE3 Sn413; Calibrated: 15.01.2015 - Phantom: Triple Flat Phantom 5.1C; Type: QD 000 P51 CA; Serial: 1154 - DASY52 52.8.7(1137); SEMCAD X 14.6.10(7164)
MSL2600/d=10mm, Pin=1000 mW, dist=2.0mm/Area Scan (71x71x1): Interpolated grid: dx=1.000 mm, dy=1.000 mm Maximum value of SAR (interpolated) = 88.3 W/kg
MSL2600/d=10mm, Pin=1000 mW, dist=2.0mm/Zoom Scan (7x7x7)/Cube 0: Measurement grid: dx=5mm, dy=5mm, dz=5mm Reference Value = 200.0 V/m; Power Drift = 0.15 dB Peak SAR (extrapolated) = 120 W/kg SAR(1 g) = 56.8 W/kg; SAR(10 g) = 25.3 W/kg Maximum value of SAR (measured) = 88.7 W/kg
0 dB = 88.7 W/kg = 19.48 dBW/kgAdditional information: ambient temperature: 23.0°C; liquid temperature: 22.6°C

Test report no.: 1-0042/15-01-15-A
Page 153 of 223
Date/Time: 05.09.2015 19:02:52 SystemPerformanceCheck-D2600 MSL 2015-09-05 DUT: Dipole 2600 MHz; Type: D2600V2; Serial: 1040 Communication System: UID 0, CW (0); Communication System Band: D2600 (2600.0 MHz); Frequency: 2600 MHz; Communication System PAR: 0 dB; PMF: 1 Medium parameters used: f = 2600 MHz; σ = 2.208 S/m; εr = 51; ρ = 1000 kg/m3 Phantom section: Center Section Measurement Standard: DASY5 DASY5 Configuration: - Probe: EX3DV4 - SN3944; ConvF(7.37, 7.37, 7.37); Calibrated: 14.08.2015; - Sensor-Surface: 2mm (Mechanical Surface Detection), z = 1.0, 31.0 - Electronics: DAE3 Sn413; Calibrated: 15.01.2015 - Phantom: Triple Flat Phantom 5.1C; Type: QD 000 P51 CA; Serial: 1154 - DASY52 52.8.7(1137); SEMCAD X 14.6.10(7164)
MSL2600/d=10mm, Pin=1000 mW, dist=2.0mm/Area Scan (71x71x1): Interpolated grid: dx=1.000 mm, dy=1.000 mm Maximum value of SAR (interpolated) = 87.3 W/kg
MSL2600/d=10mm, Pin=1000 mW, dist=2.0mm/Zoom Scan (7x7x7)/Cube 0: Measurement grid: dx=5mm, dy=5mm, dz=5mm Reference Value = 196.9 V/m; Power Drift = 0.18 dB Peak SAR (extrapolated) = 117 W/kg SAR(1 g) = 56.7 W/kg; SAR(10 g) = 25.7 W/kg Maximum value of SAR (measured) = 86.9 W/kg
0 dB = 86.9 W/kg = 19.39 dBW/kgAdditional information: ambient temperature: 23.0°C; liquid temperature: 22.6°C

Test report no.: 1-0042/15-01-15-A
Page 154 of 223
Annex A.1: System performance check 2.4 and 5 GHz
The following tests were performed by the customer.
2450 MHz Date/Time: 9/4/2015 4:06:49 PM
Test Laboratory: BlackBerry RTS DipoleValidation_2450MHz_09_04_15_Amb_Tem_23.8C_Liq_Tem_23.0C DUT: Dipole 2450 MHz D2450V2; Type: D2450V2; Serial: D2450V2 - SN:747
Communication System: UID 0, CW (0); Frequency: 2450 MHz Medium parameters used: f = 2450 MHz; σ = 1.828 S/m; εr = 37.433; ρ = 1000 kg/m3 Phantom section: Flat Section Measurement Standard: DASY5 (IEEE/IEC/ANSI C63.19-2007) DASY Configuration:
Probe: ES3DV3 - SN3225; ConvF(4.6, 4.6, 4.6); Calibrated: 2/25/2015; Sensor-Surface: 3mm (Mechanical Surface Detection), z = 2.0, 32.0 Electronics: DAE4 Sn881; Calibrated: 1/13/2015 Phantom: SAM 1; Type: SAM 4.0; Serial: 1076 DASY52 52.8.8(1222); SEMCAD X 14.6.10(7331)
System Performance Check at Frequencies between 2 GHz - 3 GHz/d=10mm, Pin=1000mW, dist=3.0mm (ES-Probe)/Area Scan (41x81x1): Interpolated grid: dx=1.200 mm, dy=1.200 mm Reference Value = 191.3 V/m; Power Drift = 0.00 dB Fast SAR: SAR(1 g) = 55.1 W/kg; SAR(10 g) = 25.9 W/kg (SAR corrected for target medium) Maximum value of SAR (interpolated) = 73.8 W/kg System Performance Check at Frequencies between 2 GHz - 3 GHz/d=10mm, Pin=1000mW, dist=3.0mm (ES-Probe)/Zoom Scan (7x7x7) (7x7x7)/Cube 0: Measurement grid: dx=5mm, dy=5mm, dz=5mm Reference Value = 191.3 V/m; Power Drift = 0.00 dB Peak SAR (extrapolated) = 110 W/kg SAR(1 g) = 54.3 W/kg; SAR(10 g) = 25.6 W/kg (SAR corrected for target medium) Maximum value of SAR (measured) = 70.8 W/kg

Test report no.: 1-0042/15-01-15-A
Page 155 of 223
0 dB = 70.8 W/kg = 18.50 dBW/kg

Test report no.: 1-0042/15-01-15-A
Page 156 of 223
Date/Time: 9/15/2015 7:35:47 PM Test Laboratory: BlackBerry RTS DipoleValidation_2450MHz_09_15_15_Amb_Tem_23.9C_Liq_Tem_22.9C DUT: Dipole 2450 MHz D2450V2; Type: D2450V2; Serial: D2450V2 - SN:747
Communication System: UID 0, CW (0); Frequency: 2450 MHz Medium parameters used: f = 2450 MHz; σ = 1.822 S/m; εr = 37.915; ρ = 1000 kg/m3 Phantom section: Flat Section Measurement Standard: DASY5 (IEEE/IEC/ANSI C63.19-2007) DASY Configuration:
Probe: ES3DV3 - SN3225; ConvF(4.6, 4.6, 4.6); Calibrated: 2/25/2015; Sensor-Surface: 3mm (Mechanical Surface Detection), z = 2.0, 32.0 Electronics: DAE4 Sn881; Calibrated: 1/13/2015 Phantom: SAM 1; Type: SAM 4.0; Serial: 1076 DASY52 52.8.8(1222); SEMCAD X 14.6.10(7331)
System Performance Check at Frequencies between 2 GHz - 3 GHz/d=10mm, Pin=1000mW, dist=3.0mm (ES-Probe) 2/Area Scan (41x81x1): Interpolated grid: dx=1.200 mm, dy=1.200 mm Reference Value = 206.4 V/m; Power Drift = 0.00 dB Fast SAR: SAR(1 g) = 55.9 W/kg; SAR(10 g) = 26 W/kg (SAR corrected for target medium) Maximum value of SAR (interpolated) = 74.0 W/kg System Performance Check at Frequencies between 2 GHz - 3 GHz/d=10mm, Pin=1000mW, dist=3.0mm (ES-Probe) 2/Zoom Scan (7x7x7) (7x7x7)/Cube 0: Measurement grid: dx=5mm, dy=5mm, dz=5mm Reference Value = 206.4 V/m; Power Drift = 0.00 dB Peak SAR (extrapolated) = 110 W/kg SAR(1 g) = 54.8 W/kg; SAR(10 g) = 25.8 W/kg (SAR corrected for target medium) Maximum value of SAR (measured) = 71.3 W/kg
0 dB = 71.3 W/kg = 18.53 dBW/kg

Test report no.: 1-0042/15-01-15-A
Page 157 of 223
5000-6000 MHz Date/Time: 9/9/2015 5:14:20 AM
Test Laboratory: BlackBerry RTS DipoleValidation_5000MHz_09_09_15_Amb_Tem_23.7C_Liq_Tem_22.6C DUT: Dipole D5GHzV2; Type: D5GHzV2; Serial: D5GHzV2 - SN 1033
Communication System: UID 0, CW; Frequency: 5200 MHz Medium parameters used: f = 5200 MHz; σ = 4.715 S/m; εr = 34.347; ρ = 1000 kg/m3 Phantom section: Flat Section Measurement Standard: DASY5 (IEEE/IEC/ANSI C63.19-2007)
DASY Configuration:
Probe: EX3DV4 - SN3592; ConvF(4.63, 4.63, 4.63); Calibrated: 11/10/2014; Sensor-Surface: 2mm (Mechanical Surface Detection), z = 1.0, 31.0 Electronics: DAE4 Sn881; Calibrated: 1/13/2015 Phantom: SAM 1; Type: SAM 4.0; Serial: 1076 DASY52 52.8.8(1222); SEMCAD X 14.6.10(7331)
System Performance Check at Frequency 5200 MHz/d=10mm, Pin=1000mW, dist=2.0mm (EX-Probe)/Area Scan (61x81x1): Interpolated grid: dx=1.000 mm, dy=1.000 mm Reference Value = 204.2 V/m; Power Drift = 0.01 dB Fast SAR: SAR(1 g) = 81.6 W/kg; SAR(10 g) = 22.8 W/kg Maximum value of SAR (interpolated) = 178 W/kg System Performance Check at Frequency 5200 MHz/d=10mm, Pin=1000mW, dist=2.0mm (EX-Probe)/Zoom Scan (7x7x12) (7x7x7)/Cube 0: Measurement grid: dx=5mm, dy=5mm, dz=5mm Reference Value = 204.2 V/m; Power Drift = 0.01 dB Peak SAR (extrapolated) = 340 W/kg SAR(1 g) = 85.5 W/kg; SAR(10 g) = 24.7 W/kg Maximum value of SAR (measured) = 173 W/kg
Date/Time: 9/9/2015 7:17:50 AM
Test Laboratory: BlackBerry RTS DUT: Dipole D5GHzV2; Type: D5GHzV2; Serial: D5GHzV2 - SN:1033
Communication System: UID 0, CW (0); Frequency: 5500 MHz Medium parameters used: f = 5500 MHz; σ = 5.093 S/m; εr = 34.139; ρ = 1000 kg/m3 Phantom section: Flat Section Measurement Standard: DASY5 (IEEE/IEC/ANSI C63.19-2007)
DASY Configuration:
Probe: EX3DV4 - SN3592; ConvF(4.2, 4.2, 4.2); Calibrated: 11/10/2014; Sensor-Surface: 2mm (Mechanical Surface Detection), z = 1.0, 23.0 Electronics: DAE4 Sn881; Calibrated: 1/13/2015 Phantom: SAM 1; Type: SAM 4.0; Serial: 1076

Test report no.: 1-0042/15-01-15-A
Page 158 of 223
DASY52 52.8.8(1222); SEMCAD X 14.6.10(7331)
System Performance Check at Frequency 5500 MHz/d=10mm, Pin=1000mW, dist=2.0mm (EX-Probe)/Area Scan (61x81x1): Interpolated grid: dx=1.000 mm, dy=1.000 mm Reference Value = 203.3 V/m; Power Drift = -0.07 dB Fast SAR: SAR(1 g) = 85.8 W/kg; SAR(10 g) = 23.7 W/kg (SAR corrected for target medium) Maximum value of SAR (interpolated) = 191 W/kg System Performance Check at Frequency 5500 MHz/d=10mm, Pin=1000mW, dist=2.0mm (EX-Probe)/Zoom Scan (7x7x12) (7x7x12)/Cube 0: Measurement grid: dx=4mm, dy=4mm, dz=2mm Reference Value = 203.3 V/m; Power Drift = -0.07 dB Peak SAR (extrapolated) = 385 W/kg SAR(1 g) = 90.5 W/kg; SAR(10 g) = 25.9 W/kg (SAR corrected for target medium) Maximum value of SAR (measured) = 192 W/kg
Date/Time: 9/9/2015 9:38:51 AM Test Laboratory: BlackBerry RTS DUT: Dipole D5GHzV2; Type: D5GHzV2; Serial: D5GHzV2 - SN:1033
Communication System: UID 0, CW (0); Frequency: 5800 MHz Medium parameters used: f = 5800 MHz; σ = 5.464 S/m; εr = 33.717; ρ = 1000 kg/m3 Phantom section: Flat Section Measurement Standard: DASY5 (IEEE/IEC/ANSI C63.19-2007)
DASY Configuration:
Probe: EX3DV4 - SN3592; ConvF(4.34, 4.34, 4.34); Calibrated: 11/10/2014; Sensor-Surface: 2mm (Mechanical Surface Detection), z = 1.0, 23.0 Electronics: DAE4 Sn881; Calibrated: 1/13/2015 Phantom: SAM 1; Type: SAM 4.0; Serial: 1076 DASY52 52.8.8(1222); SEMCAD X 14.6.10(7331)
System Performance Check at Frequency 5800 MHz/d=10mm, Pin=1000mW, dist=2.0mm (EX-Probe)/Area Scan (61x81x1): Interpolated grid: dx=1.000 mm, dy=1.000 mm Reference Value = 194.6 V/m; Power Drift = 0.03 dB Fast SAR: SAR(1 g) = 82.7 W/kg; SAR(10 g) = 23 W/kg (SAR corrected for target medium) Maximum value of SAR (interpolated) = 185 W/kg System Performance Check at Frequency 5800 MHz/d=10mm, Pin=1000mW, dist=2.0mm (EX-Probe)/Zoom Scan (7x7x12) (9x9x12)/Cube 0: Measurement grid: dx=4mm, dy=4mm, dz=2mm Reference Value = 194.6 V/m; Power Drift = 0.03 dB Peak SAR (extrapolated) = 371 W/kg SAR(1 g) = 85.8 W/kg; SAR(10 g) = 24.6 W/kg (SAR corrected for target medium) Maximum value of SAR (measured) = 182 W/kg

Test report no.: 1-0042/15-01-15-A
Page 159 of 223
0 dB = 182 W/kg = 22.60 dBW/kg

Test report no.: 1-0042/15-01-15-A
Page 160 of 223
Date/Time: 9/14/2015 3:59:35 AM Test Laboratory: BlackBerry RTS DipoleValidation_5000MHz_09_14_15_Amb_Tem_23.9C_Liq_Tem_22.8C DUT: Dipole D5GHzV2; Type: D5GHzV2; Serial: D5GHzV2 - SN 1033 Communication System: UID 0, CW; Frequency: 5200 MHz Medium parameters used: f = 5200 MHz; σ = 4.73 S/m; εr = 34.714; ρ = 1000 kg/m3 Phantom section: Flat Section Measurement Standard: DASY5 (IEEE/IEC/ANSI C63.19-2007) DASY Configuration:
Probe: EX3DV4 - SN3592; ConvF(4.63, 4.63, 4.63); Calibrated: 11/10/2014; Sensor-Surface: 2mm (Mechanical Surface Detection), z = 1.0, 31.0 Electronics: DAE4 Sn881; Calibrated: 1/13/2015 Phantom: SAM 1; Type: SAM 4.0; Serial: 1076 DASY52 52.8.8(1222); SEMCAD X 14.6.10(7331)
System Performance Check at Frequency 5200 MHz/d=10mm, Pin=1000mW, dist=2.0mm (EX-Probe)/Area Scan (61x81x1): Interpolated grid: dx=1.000 mm, dy=1.000 mm Reference Value = 200.5 V/m; Power Drift = 0.04 dB Fast SAR: SAR(1 g) = 78.4 W/kg; SAR(10 g) = 22 W/kg Maximum value of SAR (interpolated) = 169 W/kg System Performance Check at Frequency 5200 MHz/d=10mm, Pin=1000mW, dist=2.0mm (EX-Probe)/Zoom Scan (7x7x12) (7x7x7)/Cube 0: Measurement grid: dx=5mm, dy=5mm, dz=5mm Reference Value = 200.5 V/m; Power Drift = 0.04 dB Peak SAR (extrapolated) = 333 W/kg SAR(1 g) = 83.9 W/kg; SAR(10 g) = 24.3 W/kg Maximum value of SAR (measured) = 170 W/kg
Date/Time: 9/14/2015 4:19:20 AM Test Laboratory: BlackBerry RTS DUT: Dipole D5GHzV2; Type: D5GHzV2; Serial: D5GHzV2 - SN:1033 Communication System: UID 0, CW (0); Frequency: 5500 MHz Medium parameters used: f = 5500 MHz; σ = 5.086 S/m; εr = 34.207; ρ = 1000 kg/m3 Phantom section: Flat Section Measurement Standard: DASY5 (IEEE/IEC/ANSI C63.19-2007) DASY Configuration:
Probe: EX3DV4 - SN3592; ConvF(4.2, 4.2, 4.2); Calibrated: 11/10/2014; Sensor-Surface: 2mm (Mechanical Surface Detection), z = 1.0, 23.0 Electronics: DAE4 Sn881; Calibrated: 1/13/2015 Phantom: SAM 1; Type: SAM 4.0; Serial: 1076 DASY52 52.8.8(1222); SEMCAD X 14.6.10(7331)
System Performance Check at Frequency 5500 MHz/d=10mm, Pin=1000mW, dist=2.0mm (EX-Probe)/Area Scan (61x81x1): Interpolated grid: dx=1.000 mm, dy=1.000 mm Reference Value = 205.8 V/m; Power Drift = -0.04 dB Fast SAR: SAR(1 g) = 85.6 W/kg; SAR(10 g) = 23.9 W/kg (SAR corrected for target medium) Maximum value of SAR (interpolated) = 188 W/kg

Test report no.: 1-0042/15-01-15-A
Page 161 of 223
System Performance Check at Frequency 5500 MHz/d=10mm, Pin=1000mW, dist=2.0mm (EX-Probe)/Zoom Scan (7x7x12) (7x7x12)/Cube 0: Measurement grid: dx=4mm, dy=4mm, dz=2mm Reference Value = 205.8 V/m; Power Drift = -0.04 dB Peak SAR (extrapolated) = 371 W/kg SAR(1 g) = 90 W/kg; SAR(10 g) = 26.1 W/kg (SAR corrected for target medium) Maximum value of SAR (measured) = 186 W/kg
Date/Time: 9/14/2015 6:03:23 AM Test Laboratory: BlackBerry RTS DUT: Dipole D5GHzV2; Type: D5GHzV2; Serial: D5GHzV2 - SN:1033 Communication System: UID 0, CW (0); Frequency: 5800 MHz Medium parameters used: f = 5800 MHz; σ = 5.442 S/m; εr = 33.66; ρ = 1000 kg/m3 Phantom section: Flat Section Measurement Standard: DASY5 (IEEE/IEC/ANSI C63.19-2007) DASY Configuration:
Probe: EX3DV4 - SN3592; ConvF(4.34, 4.34, 4.34); Calibrated: 11/10/2014; Sensor-Surface: 2mm (Mechanical Surface Detection), z = 1.0, 23.0 Electronics: DAE4 Sn881; Calibrated: 1/13/2015 Phantom: SAM 1; Type: SAM 4.0; Serial: 1076 DASY52 52.8.8(1222); SEMCAD X 14.6.10(7331)
System Performance Check at Frequency 5800 MHz/d=10mm, Pin=1000mW, dist=2.0mm (EX-Probe)/Area Scan (61x81x1): Interpolated grid: dx=1.000 mm, dy=1.000 mm Reference Value = 192.3 V/m; Power Drift = 0.08 dB Fast SAR: SAR(1 g) = 83 W/kg; SAR(10 g) = 22.8 W/kg (SAR corrected for target medium) Maximum value of SAR (interpolated) = 186 W/kg System Performance Check at Frequency 5800 MHz/d=10mm, Pin=1000mW, dist=2.0mm (EX-Probe)/Zoom Scan (7x7x12) (9x9x12)/Cube 0: Measurement grid: dx=4mm, dy=4mm, dz=2mm Reference Value = 192.3 V/m; Power Drift = 0.08 dB Peak SAR (extrapolated) = 366 W/kg SAR(1 g) = 84.1 W/kg; SAR(10 g) = 24.2 W/kg (SAR corrected for target medium) Maximum value of SAR (measured) = 179 W/kg

Test report no.: 1-0042/15-01-15-A
Page 162 of 223
0 dB = 179 W/kg = 22.53 dBW/kg

Test report no.: 1-0042/15-01-15-A
Page 163 of 223
Annex B: DASY5 measurement results
SAR plots for the highest measured SAR in each exposure configuration, wireless mode and frequency band combination according to FCC KDB 865664 D02
Annex B.2: GSM 835MHz
Date/Time: 19.08.2015 21:42:43 IEEE1528-GSM835 head DUT: Blackberry; Type: RHM181LW; Serial: 1161509633 Communication System: UID 0, GSM/GPRS 2TS (0); Communication System Band: GSM 850; Frequency: 848.8 MHz; Communication System PAR: 6.021 dB; PMF: 2.00009 Medium parameters used: f = 849 MHz; σ = 0.942 S/m; εr = 41.303; ρ = 1000 kg/m3 Phantom section: Right Section Measurement Standard: DASY5 DASY5 Configuration: - Probe: ET3DV6 - SN1554; ConvF(6.86, 6.86, 6.86); Calibrated: 19.05.2015; - Sensor-Surface: 4mm (Mechanical Surface Detection (Locations From Previous Scan Used)), Sensor-Surface: 4mm (Mechanical Surface Detection), z = 2.7, 32.7 - Electronics: DAE3 Sn477; Calibrated: 22.05.2015 - Phantom: SAM; Type: SAM; Serial: 1043 - DASY52 52.8.7(1137); SEMCAD X 14.6.10(7164)
Right-Hand-Side HSL 835/Touch Position - High/Area Scan (81x131x1): Interpolated grid: dx=1.500 mm, dy=1.500 mm Maximum value of SAR (interpolated) = 0.149 W/kg
Right-Hand-Side HSL 835/Touch Position - High/Zoom Scan (6x6x7)/Cube 0: Measurement grid: dx=7.5mm, dy=7.5mm, dz=5mm Reference Value = 12.544 V/m; Power Drift = 0.00 dB Peak SAR (extrapolated) = 0.162 W/kg SAR(1 g) = 0.133 W/kg; SAR(10 g) = 0.105 W/kg Maximum value of SAR (measured) = 0.141 W/kg
0 dB = 0.141 W/kg = -8.51 dBW/kgAdditional information: ambient temperature: 23.0°C; liquid temperature: 22.5°C

Test report no.: 1-0042/15-01-15-A
Page 164 of 223
Date/Time: 20.08.2015 16:48:47 FCC_EN62209-2 GSM850 hotspot DUT: Blackberry; Type: RHM181LW; Serial: 1161509684 Communication System: UID 0, GSM/GPRS 2TS (0); Communication System Band: GSM 850; Frequency: 836.6 MHz; Communication System PAR: 6.021 dB; PMF: 2.00009 Medium parameters used: f = 837 MHz; σ = 0.991 S/m; εr = 53.685; ρ = 1000 kg/m3 Phantom section: Center Section Measurement Standard: DASY5 DASY5 Configuration: - Probe: ES3DV3 - SN3320; ConvF(6.11, 6.11, 6.11); Calibrated: 25.02.2015; - Sensor-Surface: 3mm (Mechanical Surface Detection (Locations From Previous Scan Used)), Sensor-Surface: 3mm (Mechanical Surface Detection), z = 2.0, 32.0 - Electronics: DAE3 Sn413; Calibrated: 15.01.2015 - Phantom: Triple Flat Phantom 5.1C; Type: QD 000 P51 CA; Serial: 1154 - DASY52 52.8.7(1137); SEMCAD X 14.6.10(7164)
MSL850-10mm slider open/Rear Middle/Area Scan (81x151x1): Interpolated grid: dx=1.500 mm, dy=1.500 mm Maximum value of SAR (interpolated) = 0.794 W/kg
MSL850-10mm slider open/Rear Middle/Zoom Scan (6x6x7)/Cube 0: Measurement grid: dx=7.5mm, dy=7.5mm, dz=5mm Reference Value = 28.693 V/m; Power Drift = -0.02 dB Peak SAR (extrapolated) = 1.19 W/kg SAR(1 g) = 0.656 W/kg; SAR(10 g) = 0.373 W/kg Maximum value of SAR (measured) = 0.790 W/kg
0 dB = 0.790 W/kg = -1.02 dBW/kgAdditional information: position or distance of DUT to the phantom: 10 mm ambient temperature: 24.3°C; liquid temperature: 22.5 °C

Test report no.: 1-0042/15-01-15-A
Page 165 of 223
Date/Time: 20.08.2015 17:07:37 FCC_EN62209-2 GSM850 hotspot DUT: Blackberry; Type: RHM181LW; Serial: 1161509684 Communication System: UID 0, GSM/GPRS 2TS (0); Communication System Band: GSM 850; Frequency: 848.8 MHz; Communication System PAR: 6.021 dB; PMF: 2.00009 Medium parameters used: f = 849 MHz; σ = 1.002 S/m; εr = 53.542; ρ = 1000 kg/m3 Phantom section: Center Section Measurement Standard: DASY5 DASY5 Configuration: - Probe: ES3DV3 - SN3320; ConvF(6.11, 6.11, 6.11); Calibrated: 25.02.2015; - Sensor-Surface: 3mm (Mechanical Surface Detection (Locations From Previous Scan Used)), Sensor-Surface: 3mm (Mechanical Surface Detection), z = 2.0, 32.0 - Electronics: DAE3 Sn413; Calibrated: 15.01.2015 - Phantom: Triple Flat Phantom 5.1C; Type: QD 000 P51 CA; Serial: 1154 - DASY52 52.8.7(1137); SEMCAD X 14.6.10(7164)
MSL850-10mm slider open/Rear High/Area Scan (81x151x1): Interpolated grid: dx=1.500 mm, dy=1.500 mm Maximum value of SAR (interpolated) = 0.877 W/kg
MSL850-10mm slider open/Rear High/Zoom Scan (6x6x7)/Cube 0: Measurement grid: dx=7.5mm, dy=7.5mm, dz=5mm Reference Value = 28.737 V/m; Power Drift = 0.01 dB Peak SAR (extrapolated) = 1.19 W/kg SAR(1 g) = 0.682 W/kg; SAR(10 g) = 0.407 W/kg Maximum value of SAR (measured) = 0.816 W/kg
0 dB = 0.816 W/kg = -0.88 dBW/kgAdditional information: position or distance of DUT to the phantom: 10 mm ambient temperature: 24.3°C; liquid temperature: 22.5 °C

Test report no.: 1-0042/15-01-15-A
Page 166 of 223
Date/Time: 20.08.2015 12:18:17 FCC_EN62209-2 GSM850 body worn DUT: Blackberry; Type: RHM181LW; Serial: 1161509684 Communication System: UID 0, GSM/GPRS 2TS (0); Communication System Band: GSM 850; Frequency: 848.8 MHz; Communication System PAR: 6.021 dB; PMF: 2.00009 Medium parameters used: f = 849 MHz; σ = 1.002 S/m; εr = 53.542; ρ = 1000 kg/m3 Phantom section: Center Section Measurement Standard: DASY5 DASY5 Configuration: - Probe: ES3DV3 - SN3320; ConvF(6.11, 6.11, 6.11); Calibrated: 25.02.2015; - Sensor-Surface: 3mm (Mechanical Surface Detection (Locations From Previous Scan Used)), Sensor-Surface: 3mm (Mechanical Surface Detection), z = 2.0, 32.0 - Electronics: DAE3 Sn413; Calibrated: 15.01.2015 - Phantom: Triple Flat Phantom 5.1C; Type: QD 000 P51 CA; Serial: 1154 - DASY52 52.8.7(1137); SEMCAD X 14.6.10(7164)
MSL850-15mm/Front High/Area Scan (81x151x1): Interpolated grid: dx=1.500 mm, dy=1.500 mm Maximum value of SAR (interpolated) = 0.419 W/kg
MSL850-15mm/Front High/Zoom Scan (5x6x7)/Cube 0: Measurement grid: dx=7.5mm, dy=7.5mm, dz=5mm Reference Value = 21.186 V/m; Power Drift = 0.09 dB Peak SAR (extrapolated) = 0.479 W/kg SAR(1 g) = 0.386 W/kg; SAR(10 g) = 0.299 W/kg Maximum value of SAR (measured) = 0.421 W/kg
0 dB = 0.421 W/kg = -3.76 dBW/kgAdditional information: position or distance of DUT to the phantom: 15 mm ambient temperature: 23.6°C; liquid temperature: 22.8°C

Test report no.: 1-0042/15-01-15-A
Page 167 of 223
Annex B.3: GSM 1900MHz
Date/Time: 29.07.2015 19:13:35 IEEE1528-GSM1900 head DUT: Blackberry; Type: RHM181LW; Serial: 1161466952 Communication System: UID 0, GSM/GPRS 2TS (0); Communication System Band: GSM 1900; Frequency: 1880 MHz; Communication System PAR: 6.021 dB; PMF: 2.00009 Medium parameters used: f = 1880 MHz; σ = 1.359 S/m; εr = 39.968; ρ = 1000 kg/m3 Phantom section: Left Section Measurement Standard: DASY5 DASY5 Configuration: - Probe: ES3DV3 - SN3320; ConvF(5.04, 5.04, 5.04); Calibrated: 25.02.2015; - Sensor-Surface: 3mm (Mechanical Surface Detection (Locations From Previous Scan Used)), Sensor-Surface: 3mm (Mechanical Surface Detection), z = 2.0, 32.0 - Electronics: DAE3 Sn413; Calibrated: 15.01.2015 - Phantom: SAM front; Type: QD000P40CC; Serial: TP-1041 - DASY52 52.8.7(1137); SEMCAD X 14.6.10(7164)
Left-Hand-Side HSL slider open/Touch Position - Mid/Area Scan (81x131x1): Interpolated grid: dx=1.500 mm, dy=1.500 mm Maximum value of SAR (interpolated) = 0.624 W/kg
Left-Hand-Side HSL slider open/Touch Position - Mid/Zoom Scan (5x5x7)/Cube 0: Measurement grid: dx=7.5mm, dy=7.5mm, dz=5mm Reference Value = 21.773 V/m; Power Drift = 0.04 dB Peak SAR (extrapolated) = 0.775 W/kg SAR(1 g) = 0.520 W/kg; SAR(10 g) = 0.326 W/kg Maximum value of SAR (measured) = 0.603 W/kg
0 dB = 0.603 W/kg = -2.20 dBW/kgAdditional information: ambient temperature: 23.4°C; liquid temperature: 22.2°C

Test report no.: 1-0042/15-01-15-A
Page 168 of 223
Date/Time: 29.08.2015 10:33:52 FCC_EN62209-2 GSM1900 hotspot DUT: Blackberry; Type: RHM181LW; Serial: 1161466951 Communication System: UID 0, GSM/GPRS 2TS (0); Communication System Band: GSM 1900; Frequency: 1850.2 MHz; Communication System PAR: 6.021 dB; PMF: 2.00009 Medium parameters used (interpolated): f = 1850.2 MHz; σ = 1.45 S/m; εr = 52.736; ρ = 1000 kg/m3 Phantom section: Center Section Measurement Standard: DASY5 DASY5 Configuration: - Probe: EX3DV4 - SN3944; ConvF(7.91, 7.91, 7.91); Calibrated: 14.08.2015; - Sensor-Surface: 3mm (Mechanical Surface Detection (Locations From Previous Scan Used)), Sensor-Surface: 3mm (Mechanical Surface Detection), z = 1.0, 31.0 - Electronics: DAE3 Sn413; Calibrated: 15.01.2015 - Phantom: Triple Flat Phantom 5.1C; Type: QD 000 P51 CA; Serial: 1154 - DASY52 52.8.7(1137); SEMCAD X 14.6.10(7164)
MSL1900-10mm slider open/Rear Low/Area Scan (81x151x1): Interpolated grid: dx=1.500 mm, dy=1.500 mm Maximum value of SAR (interpolated) = 0.879 W/kg
MSL1900-10mm slider open/Rear Low/Zoom Scan (6x6x7)/Cube 0: Measurement grid: dx=7.5mm, dy=7.5mm, dz=5mm Reference Value = 23.716 V/m; Power Drift = -0.04 dB Peak SAR (extrapolated) = 1.11 W/kg SAR(1 g) = 0.720 W/kg; SAR(10 g) = 0.441 W/kg Maximum value of SAR (measured) = 0.853 W/kg
0 dB = 0.853 W/kg = -0.69 dBW/kgAdditional information: position or distance of DUT to the phantom: 10 mm ambient temperature: 23.8°C; liquid temperature: 22.4°C

Test report no.: 1-0042/15-01-15-A
Page 169 of 223
Date/Time: 17.08.2015 10:35:16 FCC_EN62209-2 GSM1900 body worn DUT: Blackberry; Type: RHM181LW; Serial: 1161466041 Communication System: UID 0, GSM/GPRS 2TS (0); Communication System Band: GSM 1900; Frequency: 1850.2 MHz; Communication System PAR: 6.021 dB; PMF: 2.00009 Medium parameters used (interpolated): f = 1850.2 MHz; σ = 1.474 S/m; εr = 53.815; ρ = 1000 kg/m3 Phantom section: Center Section Measurement Standard: DASY5 DASY5 Configuration: - Probe: ES3DV3 - SN3320; ConvF(4.54, 4.54, 4.54); Calibrated: 25.02.2015; - Sensor-Surface: 3mm (Mechanical Surface Detection (Locations From Previous Scan Used)), Sensor-Surface: 3mm (Mechanical Surface Detection), z = 2.0, 32.0 - Electronics: DAE3 Sn413; Calibrated: 15.01.2015 - Phantom: Triple Flat Phantom 5.1C; Type: QD 000 P51 CA; Serial: 1154 - DASY52 52.8.7(1137); SEMCAD X 14.6.10(7164)
MSL1900-15mm/Rear Low/Area Scan (81x151x1): Interpolated grid: dx=1.500 mm, dy=1.500 mm Maximum value of SAR (interpolated) = 0.617 W/kg
MSL1900-15mm/Rear Low/Zoom Scan (5x5x7)/Cube 0: Measurement grid: dx=7.5mm, dy=7.5mm, dz=5mm Reference Value = 20.173 V/m; Power Drift = 0.01 dB Peak SAR (extrapolated) = 0.762 W/kg SAR(1 g) = 0.537 W/kg; SAR(10 g) = 0.354 W/kg Maximum value of SAR (measured) = 0.620 W/kg
0 dB = 0.620 W/kg = -2.08 dBW/kgAdditional information: position or distance of DUT to the phantom: 15 mm ambient temperature: 21.3°C; liquid temperature: 21.3°C

Test report no.: 1-0042/15-01-15-A
Page 170 of 223
Annex B.4: UMTS FDD II
Date/Time: 29.07.2015 11:40:26 IEEE1528-UMTS FDD II head DUT: Blackberry; Type: RHM181LW; Serial: 1161466041 Communication System: UID 0, UMTS FDD (0); Communication System Band: UMTS FDD II; Frequency: 1852.4 MHz; Communication System PAR: 0 dB; PMF: 1 Medium parameters used (interpolated): f = 1852.4 MHz; σ = 1.333 S/m; εr = 40.066; ρ = 1000 kg/m3 Phantom section: Left Section Measurement Standard: DASY5 DASY5 Configuration: - Probe: ES3DV3 - SN3320; ConvF(5.04, 5.04, 5.04); Calibrated: 25.02.2015; - Sensor-Surface: 3mm (Mechanical Surface Detection (Locations From Previous Scan Used)), Sensor-Surface: 3mm (Mechanical Surface Detection), z = 2.0, 32.0 - Electronics: DAE3 Sn413; Calibrated: 15.01.2015 - Phantom: SAM front; Type: QD000P40CC; Serial: TP-1041 - DASY52 52.8.7(1137); SEMCAD X 14.6.10(7164)
Left-Hand-Side HSL slider open/Touch Position - Low/Area Scan (81x131x1): Interpolated grid: dx=1.500 mm, dy=1.500 mm Maximum value of SAR (interpolated) = 0.632 W/kg
Left-Hand-Side HSL slider open/Touch Position - Low/Zoom Scan (5x5x7)/Cube 0: Measurement grid: dx=7.5mm, dy=7.5mm, dz=5mm Reference Value = 21.788 V/m; Power Drift = 0.05 dB Peak SAR (extrapolated) = 0.754 W/kg SAR(1 g) = 0.518 W/kg; SAR(10 g) = 0.341 W/kg Maximum value of SAR (measured) = 0.591 W/kg
0 dB = 0.591 W/kg = -2.28 dBW/kgAdditional information: ambient temperature: 23.4°C; liquid temperature: 22.2°C

Test report no.: 1-0042/15-01-15-A
Page 171 of 223
Date/Time: 29.07.2015 11:25:39 IEEE1528-UMTS FDD II head DUT: Blackberry; Type: RHM181LW; Serial: 1161466041 Communication System: UID 0, UMTS FDD (0); Communication System Band: UMTS FDD II; Frequency: 1880 MHz; Communication System PAR: 0 dB; PMF: 1 Medium parameters used: f = 1880 MHz; σ = 1.359 S/m; εr = 39.968; ρ = 1000 kg/m3 Phantom section: Left Section Measurement Standard: DASY5 DASY5 Configuration: - Probe: ES3DV3 - SN3320; ConvF(5.04, 5.04, 5.04); Calibrated: 25.02.2015; - Sensor-Surface: 3mm (Mechanical Surface Detection (Locations From Previous Scan Used)), Sensor-Surface: 3mm (Mechanical Surface Detection), z = 2.0, 32.0 - Electronics: DAE3 Sn413; Calibrated: 15.01.2015 - Phantom: SAM front; Type: QD000P40CC; Serial: TP-1041 - DASY52 52.8.7(1137); SEMCAD X 14.6.10(7164)
Left-Hand-Side HSL slider open/Touch Position - Mid/Area Scan (81x131x1): Interpolated grid: dx=1.500 mm, dy=1.500 mm Maximum value of SAR (interpolated) = 0.691 W/kg
Left-Hand-Side HSL slider open/Touch Position - Mid/Zoom Scan (5x5x7)/Cube 0: Measurement grid: dx=7.5mm, dy=7.5mm, dz=5mm Reference Value = 22.337 V/m; Power Drift = 0.10 dB Peak SAR (extrapolated) = 0.811 W/kg SAR(1 g) = 0.557 W/kg; SAR(10 g) = 0.365 W/kg Maximum value of SAR (measured) = 0.638 W/kg
0 dB = 0.638 W/kg = -1.95 dBW/kgAdditional information: ambient temperature: 23.4°C; liquid temperature: 22.2°C

Test report no.: 1-0042/15-01-15-A
Page 172 of 223
Date/Time: 17.08.2015 15:38:06 FCC_EN62209-2 UMTS FDD II hotspot DUT: Blackberry; Type: RHM181LW; Serial: 1161467034 Communication System: UID 0, UMTS FDD (0); Communication System Band: UMTS FDD II; Frequency: 1880 MHz; Communication System PAR: 0 dB; PMF: 1 Medium parameters used: f = 1880 MHz; σ = 1.503 S/m; εr = 53.728; ρ = 1000 kg/m3 Phantom section: Center Section Measurement Standard: DASY5 DASY5 Configuration: - Probe: ES3DV3 - SN3320; ConvF(4.54, 4.54, 4.54); Calibrated: 25.02.2015; - Sensor-Surface: 3mm (Mechanical Surface Detection (Locations From Previous Scan Used)), Sensor-Surface: 3mm (Mechanical Surface Detection), z = 2.0, 32.0 - Electronics: DAE3 Sn413; Calibrated: 15.01.2015 - Phantom: Triple Flat Phantom 5.1C; Type: QD 000 P51 CA; Serial: 1154 - DASY52 52.8.7(1137); SEMCAD X 14.6.10(7164)
MSL1900-10mm open/Rear Middle/Area Scan (81x151x1): Interpolated grid: dx=1.500 mm, dy=1.500 mm Maximum value of SAR (interpolated) = 0.958 W/kg
MSL1900-10mm open/Rear Middle/Zoom Scan (6x6x7)/Cube 0: Measurement grid: dx=7.5mm, dy=7.5mm, dz=5mm Reference Value = 25.434 V/m; Power Drift = 0.01 dB Peak SAR (extrapolated) = 1.32 W/kg SAR(1 g) = 0.815 W/kg; SAR(10 g) = 0.501 W/kg Maximum value of SAR (measured) = 0.974 W/kg
0 dB = 0.974 W/kg = -0.11 dBW/kgAdditional information: position or distance of DUT to the phantom: 10 mm ambient temperature: 23.5°C; liquid temperature: 21.3°C

Test report no.: 1-0042/15-01-15-A
Page 173 of 223
Date/Time: 17.08.2015 16:07:47 FCC_EN62209-2 UMTS FDD II hotspot DUT: Blackberry; Type: RHM181LW; Serial: 1161467034 Communication System: UID 0, UMTS FDD (0); Communication System Band: UMTS FDD II; Frequency: 1907.6 MHz; Communication System PAR: 0 dB; PMF: 1 Medium parameters used: f = 1908 MHz; σ = 1.529 S/m; εr = 53.666; ρ = 1000 kg/m3 Phantom section: Center Section Measurement Standard: DASY5 DASY5 Configuration: - Probe: ES3DV3 - SN3320; ConvF(4.54, 4.54, 4.54); Calibrated: 25.02.2015; - Sensor-Surface: 3mm (Mechanical Surface Detection (Locations From Previous Scan Used)), Sensor-Surface: 3mm (Mechanical Surface Detection), z = 2.0, 32.0 - Electronics: DAE3 Sn413; Calibrated: 15.01.2015 - Phantom: Triple Flat Phantom 5.1C; Type: QD 000 P51 CA; Serial: 1154 - DASY52 52.8.7(1137); SEMCAD X 14.6.10(7164)
MSL1900-10mm open/Rear High/Area Scan (81x151x1): Interpolated grid: dx=1.500 mm, dy=1.500 mm Maximum value of SAR (interpolated) = 0.931 W/kg
MSL1900-10mm open/Rear High/Zoom Scan (5x5x7)/Cube 0: Measurement grid: dx=7.5mm, dy=7.5mm, dz=5mm Reference Value = 24.540 V/m; Power Drift = 0.11 dB Peak SAR (extrapolated) = 1.21 W/kg SAR(1 g) = 0.769 W/kg; SAR(10 g) = 0.469 W/kg Maximum value of SAR (measured) = 0.924 W/kg
0 dB = 0.924 W/kg = -0.34 dBW/kgAdditional information: position or distance of DUT to the phantom: 10 mm ambient temperature: 23.5°C; liquid temperature: 21.3°C

Test report no.: 1-0042/15-01-15-A
Page 174 of 223
Date/Time: 17.08.2015 11:47:52 FCC_EN62209-2 UMTS FDD II body worn DUT: Blackberry; Type: RHM181LW; Serial: 1161466041 Communication System: UID 0, UMTS FDD (0); Communication System Band: UMTS FDD II; Frequency: 1852.4 MHz; Communication System PAR: 0 dB; PMF: 1 Medium parameters used (interpolated): f = 1852.4 MHz; σ = 1.476 S/m; εr = 53.795; ρ = 1000 kg/m3 Phantom section: Center Section Measurement Standard: DASY5 DASY5 Configuration: - Probe: ES3DV3 - SN3320; ConvF(4.54, 4.54, 4.54); Calibrated: 25.02.2015; - Sensor-Surface: 3mm (Mechanical Surface Detection (Locations From Previous Scan Used)), Sensor-Surface: 3mm (Mechanical Surface Detection), z = 2.0, 32.0 - Electronics: DAE3 Sn413; Calibrated: 15.01.2015 - Phantom: Triple Flat Phantom 5.1C; Type: QD 000 P51 CA; Serial: 1154 - DASY52 52.8.7(1137); SEMCAD X 14.6.10(7164)
MSL1900-15mm/Rear Low/Area Scan (81x151x1): Interpolated grid: dx=1.500 mm, dy=1.500 mm Maximum value of SAR (interpolated) = 0.829 W/kg
MSL1900-15mm/Rear Low/Zoom Scan (6x6x7)/Cube 0: Measurement grid: dx=7.5mm, dy=7.5mm, dz=5mm Reference Value = 23.752 V/m; Power Drift = 0.02 dB Peak SAR (extrapolated) = 1.05 W/kg SAR(1 g) = 0.725 W/kg; SAR(10 g) = 0.473 W/kg Maximum value of SAR (measured) = 0.834 W/kg
0 dB = 0.834 W/kg = -0.79 dBW/kgAdditional information: position or distance of DUT to the phantom: 15 mm ambient temperature: 21.3°C; liquid temperature: 21.3°C
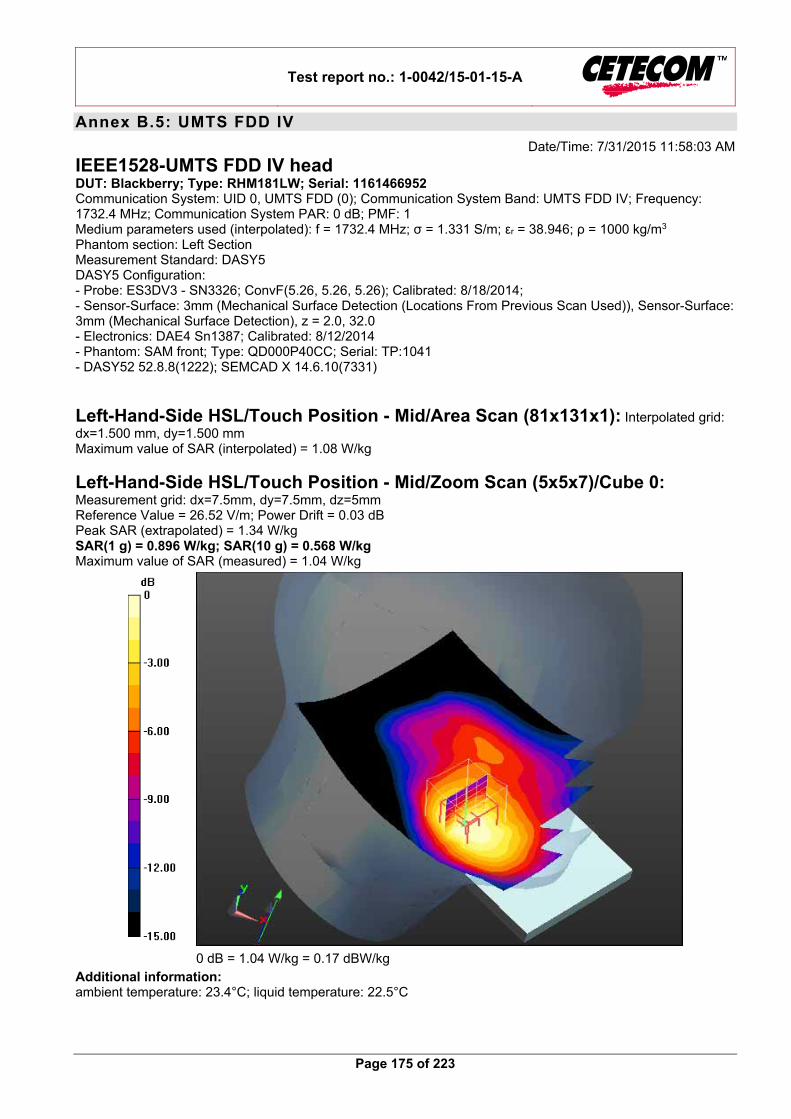
Test report no.: 1-0042/15-01-15-A
Page 175 of 223
Annex B.5: UMTS FDD IV
Date/Time: 7/31/2015 11:58:03 AM IEEE1528-UMTS FDD IV head DUT: Blackberry; Type: RHM181LW; Serial: 1161466952 Communication System: UID 0, UMTS FDD (0); Communication System Band: UMTS FDD IV; Frequency: 1732.4 MHz; Communication System PAR: 0 dB; PMF: 1 Medium parameters used (interpolated): f = 1732.4 MHz; σ = 1.331 S/m; εr = 38.946; ρ = 1000 kg/m3 Phantom section: Left Section Measurement Standard: DASY5 DASY5 Configuration: - Probe: ES3DV3 - SN3326; ConvF(5.26, 5.26, 5.26); Calibrated: 8/18/2014; - Sensor-Surface: 3mm (Mechanical Surface Detection (Locations From Previous Scan Used)), Sensor-Surface: 3mm (Mechanical Surface Detection), z = 2.0, 32.0 - Electronics: DAE4 Sn1387; Calibrated: 8/12/2014 - Phantom: SAM front; Type: QD000P40CC; Serial: TP:1041 - DASY52 52.8.8(1222); SEMCAD X 14.6.10(7331)
Left-Hand-Side HSL/Touch Position - Mid/Area Scan (81x131x1): Interpolated grid: dx=1.500 mm, dy=1.500 mm Maximum value of SAR (interpolated) = 1.08 W/kg
Left-Hand-Side HSL/Touch Position - Mid/Zoom Scan (5x5x7)/Cube 0: Measurement grid: dx=7.5mm, dy=7.5mm, dz=5mm Reference Value = 26.52 V/m; Power Drift = 0.03 dB Peak SAR (extrapolated) = 1.34 W/kg SAR(1 g) = 0.896 W/kg; SAR(10 g) = 0.568 W/kg Maximum value of SAR (measured) = 1.04 W/kg
0 dB = 1.04 W/kg = 0.17 dBW/kgAdditional information: ambient temperature: 23.4°C; liquid temperature: 22.5°C

Test report no.: 1-0042/15-01-15-A
Page 176 of 223
Date/Time: 17.08.2015 15:39:23 FCC_EN62209-2 UMTS FDD IV hotspot_PR DUT: Blackberry; Type: RHM181LW; Serial: 1161466951 Communication System: UID 0, UMTS FDD (0); Communication System Band: UMTS FDD IV; Frequency: 1712.4 MHz; Communication System PAR: 0 dB; PMF: 1 Medium parameters used (interpolated): f = 1712.4 MHz; σ = 1.511 S/m; εr = 52.287; ρ = 1000 kg/m3 Phantom section: Center Section Measurement Standard: DASY5 DASY5 Configuration: - Probe: ET3DV6 - SN1554; ConvF(4.81, 4.81, 4.81); Calibrated: 19.05.2015; - Sensor-Surface: 4mm (Mechanical Surface Detection (Locations From Previous Scan Used)), Sensor-Surface: 4mm (Mechanical Surface Detection), z = 2.7, 32.7 - Electronics: DAE3 Sn477; Calibrated: 22.05.2015 - Phantom: Triple Flat Phantom 5.1C; Type: QD 000 P51 CA; Serial: xxxx - DASY52 52.8.7(1137); SEMCAD X 14.6.10(7164)
MSL1750-10mm slider open/Rear Low/Area Scan (81x151x1): Interpolated grid: dx=1.500 mm, dy=1.500 mm Maximum value of SAR (interpolated) = 1.18 W/kg
MSL1750-10mm slider open/Rear Low/Zoom Scan (7x7x7)/Cube 0: Measurement grid: dx=7.5mm, dy=7.5mm, dz=5mm Reference Value = 29.871 V/m; Power Drift = -0.05 dB Peak SAR (extrapolated) = 1.66 W/kg SAR(1 g) = 1.09 W/kg; SAR(10 g) = 0.663 W/kg Maximum value of SAR (measured) = 1.17 W/kg
0 dB = 1.17 W/kg = 0.68 dBW/kgAdditional information: position or distance of DUT to SAM: 10 mm ambient temperature: 22.4°C; liquid temperature: 22.2°C

Test report no.: 1-0042/15-01-15-A
Page 177 of 223
Date/Time: 17.08.2015 15:24:47 FCC_EN62209-2 UMTS FDD IV hotspot_PR DUT: Blackberry; Type: RHM181LW; Serial: 1161466951 Communication System: UID 0, UMTS FDD (0); Communication System Band: UMTS FDD IV; Frequency: 1732.4 MHz; Communication System PAR: 0 dB; PMF: 1 Medium parameters used (interpolated): f = 1732.4 MHz; σ = 1.523 S/m; εr = 52.196; ρ = 1000 kg/m3 Phantom section: Center Section Measurement Standard: DASY5 DASY5 Configuration: - Probe: ET3DV6 - SN1554; ConvF(4.81, 4.81, 4.81); Calibrated: 19.05.2015; - Sensor-Surface: 4mm (Mechanical Surface Detection (Locations From Previous Scan Used)), Sensor-Surface: 4mm (Mechanical Surface Detection), z = 2.7, 32.7 - Electronics: DAE3 Sn477; Calibrated: 22.05.2015 - Phantom: Triple Flat Phantom 5.1C; Type: QD 000 P51 CA; Serial: xxxx - DASY52 52.8.7(1137); SEMCAD X 14.6.10(7164)
MSL1750-10mm slider open/Rear Middle/Area Scan (81x151x1): Interpolated grid: dx=1.500 mm, dy=1.500 mm Maximum value of SAR (interpolated) = 1.08 W/kg
MSL1750-10mm slider open/Rear Middle/Zoom Scan (6x6x7)/Cube 0: Measurement grid: dx=7.5mm, dy=7.5mm, dz=5mm Reference Value = 28.397 V/m; Power Drift = -0.03 dB Peak SAR (extrapolated) = 1.54 W/kg SAR(1 g) = 0.992 W/kg; SAR(10 g) = 0.607 W/kg Maximum value of SAR (measured) = 1.10 W/kg
0 dB = 1.10 W/kg = 0.41 dBW/kgAdditional information: position or distance of DUT to SAM: 10 mm ambient temperature: 22.4°C; liquid temperature: 22.2°CC

Test report no.: 1-0042/15-01-15-A
Page 178 of 223
Date/Time: 7/29/2015 12:14:24 PM FCC_EN62209-2 UMTS FDD IV body worn DUT: Blackberry; Type: RHM181LW; Serial: 1161466952 Communication System: UID 0, UMTS FDD (0); Communication System Band: UMTS FDD IV; Frequency: 1712.4 MHz; Communication System PAR: 0 dB; PMF: 1 Medium parameters used (interpolated): f = 1712.4 MHz; σ = 1.515 S/m; εr = 52.093; ρ = 1000 kg/m3 Phantom section: Center Section Measurement Standard: DASY5 DASY5 Configuration: - Probe: ES3DV3 - SN3326; ConvF(4.88, 4.88, 4.88); Calibrated: 8/18/2014; - Sensor-Surface: 3mm (Mechanical Surface Detection (Locations From Previous Scan Used)), Sensor-Surface: 3mm (Mechanical Surface Detection), z = 2.0, 32.0 - Electronics: DAE4 Sn1387; Calibrated: 8/12/2014 - Phantom: Triple Flat Phantom 5.1C; Type: QD 000 P51 CA; Serial: xxxx - DASY52 52.8.8(1222); SEMCAD X 14.6.10(7164)
MSL1750-15mm/Front Low/Area Scan (81x151x1): Interpolated grid: dx=1.500 mm, dy=1.500 mm Maximum value of SAR (interpolated) = 0.861 W/kg
MSL1750-15mm/Front Low/Zoom Scan (6x6x7)/Cube 0: Measurement grid: dx=7.5mm, dy=7.5mm, dz=5mm Reference Value = 23.811 V/m; Power Drift = -0.07 dB Peak SAR (extrapolated) = 1.01 W/kg SAR(1 g) = 0.696 W/kg; SAR(10 g) = 0.464 W/kg Maximum value of SAR (measured) = 0.797 W/kg
0 dB = 0.797 W/kg = -0.99 dBW/kgAdditional information: position or distance of DUT to the phantom: 15 mm ambient temperature: 23.5°C; liquid temperature: 22.6°C

Test report no.: 1-0042/15-01-15-A
Page 179 of 223
Date/Time: 7/29/2015 11:54:37 AM FCC_EN62209-2 UMTS FDD IV body worn DUT: Blackberry; Type: RHM181LW; Serial: 1161466952 Communication System: UID 0, UMTS FDD (0); Communication System Band: UMTS FDD IV; Frequency: 1732.4 MHz; Communication System PAR: 0 dB; PMF: 1 Medium parameters used (interpolated): f = 1732.4 MHz; σ = 1.532 S/m; εr = 52.043; ρ = 1000 kg/m3 Phantom section: Center Section Measurement Standard: DASY5 DASY5 Configuration: - Probe: ES3DV3 - SN3326; ConvF(4.88, 4.88, 4.88); Calibrated: 8/18/2014; - Sensor-Surface: 3mm (Mechanical Surface Detection (Locations From Previous Scan Used)), Sensor-Surface: 3mm (Mechanical Surface Detection), z = 2.0, 32.0 - Electronics: DAE4 Sn1387; Calibrated: 8/12/2014 - Phantom: Triple Flat Phantom 5.1C; Type: QD 000 P51 CA; Serial: xxxx - DASY52 52.8.8(1222); SEMCAD X 14.6.10(7164)
MSL1750-15mm/Front Middle/Area Scan (81x151x1): Interpolated grid: dx=1.500 mm, dy=1.500 mm Maximum value of SAR (interpolated) = 0.840 W/kg
MSL1750-15mm/Front Middle/Zoom Scan (6x6x7)/Cube 0: Measurement grid: dx=7.5mm, dy=7.5mm, dz=5mm Reference Value = 23.631 V/m; Power Drift = -0.10 dB Peak SAR (extrapolated) = 1.02 W/kg SAR(1 g) = 0.692 W/kg; SAR(10 g) = 0.461 W/kg Maximum value of SAR (measured) = 0.793 W/kg
0 dB = 0.793 W/kg = -1.01 dBW/kgAdditional information: position or distance of DUT to the phantom: 15 mm ambient temperature: 23.5°C; liquid temperature: 22.6°C

Test report no.: 1-0042/15-01-15-A
Page 180 of 223
Annex B.6: UMTS FDD V
Date/Time: 21.08.2015 15:26:03 IEEE1528-UMTS FDD V head DUT: Blackberry; Type: RHM181LW; Serial: 1161509633 Communication System: UID 0, UMTS FDD (0); Communication System Band: UMTS FDD V; Frequency: 846.6 MHz; Communication System PAR: 0 dB; PMF: 1 Medium parameters used: f = 847 MHz; σ = 0.94 S/m; εr = 41.318; ρ = 1000 kg/m3 Phantom section: Right Section Measurement Standard: DASY5 DASY5 Configuration: - Probe: ET3DV6 - SN1554; ConvF(6.86, 6.86, 6.86); Calibrated: 19.05.2015; - Sensor-Surface: 4mm (Mechanical Surface Detection (Locations From Previous Scan Used)), Sensor-Surface: 4mm (Mechanical Surface Detection), z = 2.7, 32.7 - Electronics: DAE3 Sn477; Calibrated: 22.05.2015 - Phantom: SAM; Type: SAM; Serial: 1043 - DASY52 52.8.7(1137); SEMCAD X 14.6.10(7164)
Right-Hand-Side HSL 835/Touch Position - High/Area Scan (81x131x1): Interpolated grid: dx=1.500 mm, dy=1.500 mm Maximum value of SAR (interpolated) = 0.263 W/kg
Right-Hand-Side HSL 835/Touch Position - High/Zoom Scan (6x6x7)/Cube 0: Measurement grid: dx=7.5mm, dy=7.5mm, dz=5mm Reference Value = 16.235 V/m; Power Drift = -0.01 dB Peak SAR (extrapolated) = 0.300 W/kg SAR(1 g) = 0.253 W/kg; SAR(10 g) = 0.199 W/kg Maximum value of SAR (measured) = 0.265 W/kg
0 dB = 0.265 W/kg = -5.77 dBW/kgAdditional information: ambient temperature: 22.5°C; liquid temperature: 21.0°C

Test report no.: 1-0042/15-01-15-A
Page 181 of 223
Date/Time: 21.08.2015 15:03:54 FCC_EN62209-2 UMTS FDD V hotspot DUT: Blackberry; Type: RHM181LW; Serial: 1161509684 Communication System: UID 0, UMTS FDD (0); Communication System Band: UMTS FDD V; Frequency: 846.6 MHz; Communication System PAR: 0 dB; PMF: 1 Medium parameters used: f = 847 MHz; σ = 1.002 S/m; εr = 53.551; ρ = 1000 kg/m3 Phantom section: Center Section Measurement Standard: DASY5 DASY5 Configuration: - Probe: ES3DV3 - SN3320; ConvF(6.11, 6.11, 6.11); Calibrated: 25.02.2015; - Sensor-Surface: 3mm (Mechanical Surface Detection (Locations From Previous Scan Used)), Sensor-Surface: 3mm (Mechanical Surface Detection), z = 2.0, 32.0 - Electronics: DAE3 Sn413; Calibrated: 15.01.2015 - Phantom: Triple Flat Phantom 5.1C; Type: QD 000 P51 CA; Serial: 1154 - DASY52 52.8.7(1137); SEMCAD X 14.6.10(7164)
MSL850-10mm slider open/Rear High/Area Scan (81x151x1): Interpolated grid: dx=1.500 mm, dy=1.500 mm Maximum value of SAR (interpolated) = 0.673 W/kg
MSL850-10mm slider open/Rear High/Zoom Scan (6x6x7)/Cube 0: Measurement grid: dx=7.5mm, dy=7.5mm, dz=5mm Reference Value = 25.785 V/m; Power Drift = -0.01 dB Peak SAR (extrapolated) = 1.05 W/kg SAR(1 g) = 0.577 W/kg; SAR(10 g) = 0.329 W/kg Maximum value of SAR (measured) = 0.708 W/kg
0 dB = 0.708 W/kg = -1.50 dBW/kgAdditional information: position or distance of DUT to the phantom: 10 mm ambient temperature: 23.3°C; liquid temperature: 22.5 °C

Test report no.: 1-0042/15-01-15-A
Page 182 of 223
Date/Time: 21.08.2015 11:21:27 FCC_EN62209-2 UMTS FDD V body worn DUT: Blackberry; Type: RHM181LW; Serial: 1161509684 Communication System: UID 0, UMTS FDD (0); Communication System Band: UMTS FDD V; Frequency: 826.4 MHz; Communication System PAR: 0 dB; PMF: 1 Medium parameters used (interpolated): f = 826.4 MHz; σ = 0.982 S/m; εr = 53.829; ρ = 1000 kg/m3 Phantom section: Center Section Measurement Standard: DASY5 DASY5 Configuration: - Probe: ES3DV3 - SN3320; ConvF(6.11, 6.11, 6.11); Calibrated: 25.02.2015; - Sensor-Surface: 3mm (Mechanical Surface Detection (Locations From Previous Scan Used)), Sensor-Surface: 3mm (Mechanical Surface Detection), z = 2.0, 32.0 - Electronics: DAE3 Sn413; Calibrated: 15.01.2015 - Phantom: Triple Flat Phantom 5.1C; Type: QD 000 P51 CA; Serial: 1154 - DASY52 52.8.7(1137); SEMCAD X 14.6.10(7164)
MSL850-15mm/Front Low/Area Scan (81x151x1): Interpolated grid: dx=1.500 mm, dy=1.500 mm Maximum value of SAR (interpolated) = 0.282 W/kg
MSL850-15mm/Front Low/Zoom Scan (5x5x7)/Cube 0: Measurement grid: dx=7.5mm, dy=7.5mm, dz=5mm Reference Value = 17.496 V/m; Power Drift = 0.02 dB Peak SAR (extrapolated) = 0.318 W/kg SAR(1 g) = 0.258 W/kg; SAR(10 g) = 0.199 W/kg Maximum value of SAR (measured) = 0.280 W/kg
0 dB = 0.280 W/kg = -5.53 dBW/kgAdditional information: position or distance of DUT to the phantom: 15 mm ambient temperature: 23.3°C; liquid temperature: 22.5 °C

Test report no.: 1-0042/15-01-15-A
Page 183 of 223
Annex B.7: LTE FDD 2
Date/Time: 30.07.2015 09:57:37 IEEE1528-LTE FDD 2 head DUT: Blackberry; Type: RHM181LW; Serial: 1161466041 Communication System: UID 0, LTE FDD (0); Communication System Band: LTE 2 (1900MHz); Frequency: 1900 MHz; Communication System PAR: 0 dB; PMF: 1 Medium parameters used: f = 1900 MHz; σ = 1.381 S/m; εr = 39.929; ρ = 1000 kg/m3 Phantom section: Left Section Measurement Standard: DASY5 DASY5 Configuration: - Probe: ES3DV3 - SN3320; ConvF(5.04, 5.04, 5.04); Calibrated: 25.02.2015; - Sensor-Surface: 3mm (Mechanical Surface Detection (Locations From Previous Scan Used)), Sensor-Surface: 3mm (Mechanical Surface Detection), z = 2.0, 32.0 - Electronics: DAE3 Sn413; Calibrated: 15.01.2015 - Phantom: SAM front; Type: QD000P40CC; Serial: TP-1041 - DASY52 52.8.7(1137); SEMCAD X 14.6.10(7164)
Left-Hand-Side HSL slider open - 20MHz BW - QPSK/Touch Position - High 1 RB - 0RB offset/Area Scan (81x131x1): Interpolated grid: dx=1.500 mm, dy=1.500 mm Maximum value of SAR (interpolated) = 0.756 W/kg
Left-Hand-Side HSL slider open - 20MHz BW - QPSK/Touch Position - High 1 RB - 0RB offset/Zoom Scan (5x5x7)/Cube 0: Measurement grid: dx=7.5mm, dy=7.5mm, dz=5mm Reference Value = 22.993 V/m; Power Drift = 0.11 dB Peak SAR (extrapolated) = 0.932 W/kg SAR(1 g) = 0.629 W/kg; SAR(10 g) = 0.399 W/kg Maximum value of SAR (measured) = 0.731 W/kg
0 dB = 0.731 W/kg = -1.36 dBW/kgAdditional information: ambient temperature: 23.4°C; liquid temperature: 22.2°C

Test report no.: 1-0042/15-01-15-A
Page 184 of 223
Date/Time: 19.08.2015 13:26:33 FCC_EN62209-2 LTE FDD 2 hotspot DUT: Blackberry; Type: RHM181LW; Serial: 1161467034 Communication System: UID 0, LTE FDD (0); Communication System Band: LTE 2 (1900MHz); Frequency: 1880 MHz; Communication System PAR: 0 dB; PMF: 1 Medium parameters used: f = 1880 MHz; σ = 1.503 S/m; εr = 53.728; ρ = 1000 kg/m3 Phantom section: Center Section Measurement Standard: DASY5 DASY5 Configuration: - Probe: ES3DV3 - SN3320; ConvF(4.54, 4.54, 4.54); Calibrated: 25.02.2015; - Sensor-Surface: 3mm (Mechanical Surface Detection (Locations From Previous Scan Used)), Sensor-Surface: 3mm (Mechanical Surface Detection), z = 2.0, 32.0 - Electronics: DAE3 Sn413; Calibrated: 15.01.2015 - Phantom: Triple Flat Phantom 5.1C; Type: QD 000 P51 CA; Serial: 1154 - DASY52 52.8.7(1137); SEMCAD X 14.6.10(7164)
MSL1900-10mm open - 20MHz BW - QPSK - 1RB - 0RB offset/Rear Middle/Area Scan (81x151x1): Interpolated grid: dx=1.500 mm, dy=1.500 mm Maximum value of SAR (interpolated) = 0.841 W/kg
MSL1900-10mm open - 20MHz BW - QPSK - 1RB - 0RB offset/Rear Middle/Zoom Scan (7x6x7)/Cube 0: Measurement grid: dx=7.5mm, dy=7.5mm, dz=5mm Reference Value = 23.543 V/m; Power Drift = -0.04 dB Peak SAR (extrapolated) = 1.12 W/kg SAR(1 g) = 0.662 W/kg; SAR(10 g) = 0.410 W/kg Maximum value of SAR (measured) = 0.781 W/kg
0 dB = 0.781 W/kg = -1.07 dBW/kgAdditional information: position or distance of DUT to the phantom: 10 mm ambient temperature: 23.0°C; liquid temperature: 21.3°C

Test report no.: 1-0042/15-01-15-A
Page 185 of 223
Date/Time: 18.08.2015 10:05:17 FCC_EN62209-2 LTE FDD 2 body worn DUT: Blackberry; Type: RHM181LW; Serial: 1161466041 Communication System: UID 0, LTE FDD (0); Communication System Band: LTE 2 (1900MHz); Frequency: 1880 MHz; Communication System PAR: 0 dB; PMF: 1 Medium parameters used: f = 1880 MHz; σ = 1.503 S/m; εr = 53.728; ρ = 1000 kg/m3 Phantom section: Center Section Measurement Standard: DASY5 DASY5 Configuration: - Probe: ES3DV3 - SN3320; ConvF(4.54, 4.54, 4.54); Calibrated: 25.02.2015; - Sensor-Surface: 3mm (Mechanical Surface Detection (Locations From Previous Scan Used)), Sensor-Surface: 3mm (Mechanical Surface Detection), z = 2.0, 32.0 - Electronics: DAE3 Sn413; Calibrated: 15.01.2015 - Phantom: Triple Flat Phantom 5.1C; Type: QD 000 P51 CA; Serial: 1154 - DASY52 52.8.7(1137); SEMCAD X 14.6.10(7164)
MSL1900-15mm - QPSK - 20MHz BW - 1RB/Rear Middle - 0RB offset/Area Scan (81x151x1): Interpolated grid: dx=1.500 mm, dy=1.500 mm Maximum value of SAR (interpolated) = 0.641 W/kg
MSL1900-15mm - QPSK - 20MHz BW - 1RB/Rear Middle - 0RB offset/Zoom Scan (5x5x7)/Cube 0: Measurement grid: dx=7.5mm, dy=7.5mm, dz=5mm Reference Value = 20.579 V/m; Power Drift = 0.02 dB Peak SAR (extrapolated) = 0.878 W/kg SAR(1 g) = 0.608 W/kg; SAR(10 g) = 0.394 W/kg Maximum value of SAR (measured) = 0.699 W/kg
0 dB = 0.699 W/kg = -1.56 dBW/kgAdditional information: position or distance of DUT to the phantom: 15 mm ambient temperature: 21.3°C; liquid temperature: 21.3°C

Test report no.: 1-0042/15-01-15-A
Page 186 of 223
Annex B.8: LTE FDD 4
Date/Time: 04.08.2015 22:13:12 IEEE1528-LTE FDD 4 head DUT: Blackberry; Type: RHM181LW; Serial: 1161466041 Communication System: UID 0, LTE FDD (0); Communication System Band: LTE 4 (1700MHz); Frequency: 1745 MHz; Communication System PAR: 0 dB; PMF: 1 Medium parameters used: f = 1745 MHz; σ = 1.343 S/m; εr = 38.899; ρ = 1000 kg/m3 Phantom section: Left Section Measurement Standard: DASY5 DASY5 Configuration: - Probe: ES3DV3 - SN3320; ConvF(5.19, 5.19, 5.19); Calibrated: 25.02.2015; - Sensor-Surface: 3mm (Mechanical Surface Detection (Locations From Previous Scan Used)), Sensor-Surface: 3mm (Mechanical Surface Detection), z = 2.0, 32.0 - Electronics: DAE3 Sn413; Calibrated: 15.01.2015 - Phantom: SAM front; Type: QD000P40CC; Serial: TP-1041 - DASY52 52.8.7(1137); SEMCAD X 14.6.10(7164)
Left-Hand-Side HSL - 20MHz BW - QPSK slider open/Touch Position - High - 1RB - 0RB offset/Area Scan (81x131x1): Interpolated grid: dx=1.500 mm, dy=1.500 mm Maximum value of SAR (interpolated) = 0.728 W/kg
Left-Hand-Side HSL - 20MHz BW - QPSK slider open/Touch Position - High - 1RB - 0RB offset/Zoom Scan (5x5x7)/Cube 0: Measurement grid: dx=7.5mm, dy=7.5mm, dz=5mm Reference Value = 23.561 V/m; Power Drift = 0.02 dB Peak SAR (extrapolated) = 0.878 W/kg SAR(1 g) = 0.612 W/kg; SAR(10 g) = 0.403 W/kg Maximum value of SAR (measured) = 0.704 W/kg
0 dB = 0.704 W/kg = -1.52 dBW/kgAdditional information: ambient temperature: 23.8°C; liquid temperature: 22.9°C

Test report no.: 1-0042/15-01-15-A
Page 187 of 223
Date/Time: 19.08.2015 14:35:16 FCC_EN62209-2 LTE FDD 4 hotspot DUT: Blackberry; Type: RHM181LW; Serial: 1161466951 Communication System: UID 0, LTE FDD (0); Communication System Band: LTE 4 (1700MHz); Frequency: 1720 MHz; Communication System PAR: 0 dB; PMF: 1 Medium parameters used: f = 1720 MHz; σ = 1.515 S/m; εr = 52.237; ρ = 1000 kg/m3 Phantom section: Center Section Measurement Standard: DASY5 DASY5 Configuration: - Probe: ET3DV6 - SN1554; ConvF(4.81, 4.81, 4.81); Calibrated: 19.05.2015; - Sensor-Surface: 3mm (Mechanical Surface Detection (Locations From Previous Scan Used)), Sensor-Surface: 4mm (Mechanical Surface Detection), z = 2.7, 32.7 - Electronics: DAE3 Sn477; Calibrated: 22.05.2015 - Phantom: Triple Flat Phantom 5.1C; Type: QD 000 P51 CA; Serial: xxxx - DASY52 52.8.7(1137); SEMCAD X 14.6.10(7164)
MSL1750-10mm slider open - QPSK - 20MHz BW - 1RB/Rear Low - 0RB offset wc/Area Scan (81x151x1): Interpolated grid: dx=1.500 mm, dy=1.500 mm Maximum value of SAR (interpolated) = 0.999 W/kg
MSL1750-10mm slider open - QPSK - 20MHz BW - 1RB/Rear Low - 0RB offset wc/Zoom Scan (6x6x7)/Cube 0: Measurement grid: dx=7.5mm, dy=7.5mm, dz=5mm Reference Value = 26.387 V/m; Power Drift = -0.02 dB Peak SAR (extrapolated) = 1.27 W/kg SAR(1 g) = 0.832 W/kg; SAR(10 g) = 0.513 W/kg Maximum value of SAR (measured) = 0.904 W/kg
0 dB = 0.904 W/kg = -0.44 dBW/kgAdditional information: position or distance of DUT to SAM: 10 mm ambient temperature: 23.1°C; liquid temperature: 21.4°C

Test report no.: 1-0042/15-01-15-A
Page 188 of 223
Date/Time: 18.08.2015 16:00:08 FCC_EN62209-2 LTE FDD 4 body worn DUT: Blackberry; Type: RHM181LW; Serial: 1161466041 Communication System: UID 0, LTE FDD (0); Communication System Band: LTE 4 (1700MHz); Frequency: 1745 MHz; Communication System PAR: 0 dB; PMF: 1 Medium parameters used: f = 1745 MHz; σ = 1.534 S/m; εr = 52.175; ρ = 1000 kg/m3 Phantom section: Center Section Measurement Standard: DASY5 DASY5 Configuration: - Probe: ET3DV6 - SN1554; ConvF(4.81, 4.81, 4.81); Calibrated: 19.05.2015; - Sensor-Surface: 3mm (Mechanical Surface Detection (Locations From Previous Scan Used)), Sensor-Surface: 4mm (Mechanical Surface Detection), z = 2.7, 32.7 - Electronics: DAE3 Sn477; Calibrated: 22.05.2015 - Phantom: Triple Flat Phantom 5.1C; Type: QD 000 P51 CA; Serial: xxxx - DASY52 52.8.7(1137); SEMCAD X 14.6.10(7164)
MSL1750-15mm - QPSK - 20MHz BW - 1RB/Rear High - 0RB offset/Area Scan (81x151x1): Interpolated grid: dx=1.500 mm, dy=1.500 mm Maximum value of SAR (interpolated) = 0.666 W/kg
MSL1750-15mm - QPSK - 20MHz BW - 1RB/Rear High - 0RB offset/Zoom Scan (5x5x7)/Cube 0: Measurement grid: dx=7.5mm, dy=7.5mm, dz=5mm Reference Value = 21.827 V/m; Power Drift = 0.20 dB Peak SAR (extrapolated) = 0.803 W/kg SAR(1 g) = 0.619 W/kg; SAR(10 g) = 0.404 W/kg Maximum value of SAR (measured) = 0.675 W/kg
0 dB = 0.675 W/kg = -1.71 dBW/kgAdditional information: position or distance of DUT to SAM: 15 mm ambient temperature: 21.9°C; liquid temperature: 21.4°C

Test report no.: 1-0042/15-01-15-A
Page 189 of 223
Annex B.9: LTE FDD 7
Date/Time: 04.08.2015 10:27:16 IEEE1528_EN62209-LTE FDD 7 head DUT: Blackberry; Type: RHM181LW; Serial: 1161466952 Communication System: UID 0, LTE FDD (0); Communication System Band: LTE 7 (2600MHz); Frequency: 2510 MHz; Communication System PAR: 0 dB; PMF: 1 Medium parameters used: f = 2510 MHz; σ = 1.798 S/m; εr = 38.156; ρ = 1000 kg/m3 Phantom section: Right Section Measurement Standard: DASY5 DASY5 Configuration: - Probe: EX3DV4 - SN3944; ConvF(7.33, 7.33, 7.33); Calibrated: 19.08.2014; - Sensor-Surface: 2mm (Mechanical Surface Detection (Locations From Previous Scan Used)), Sensor-Surface: 2mm (Mechanical Surface Detection), z = 1.0, 31.0 - Electronics: DAE3 Sn477; Calibrated: 22.05.2015 - Phantom: SAM; Type: SAM; Serial: 1043 - DASY52 52.8.7(1137); SEMCAD X 14.6.10(7164)
Right-Hand-Side HSL - 20MHz BW - QPSK - slider open/Touch Position - Low 1RB - 0RB offset/Area Scan (121x191x1): Interpolated grid: dx=1.000 mm, dy=1.000 mm Maximum value of SAR (interpolated) = 0.355 W/kg
Right-Hand-Side HSL - 20MHz BW - QPSK - slider open/Touch Position - Low 1RB - 0RB offset/Zoom Scan (7x7x7)/Cube 0: Measurement grid: dx=5mm, dy=5mm, dz=5mm Reference Value = 13.924 V/m; Power Drift = -0.12 dB Peak SAR (extrapolated) = 0.422 W/kg SAR(1 g) = 0.241 W/kg; SAR(10 g) = 0.130 W/kg Maximum value of SAR (measured) = 0.335 W/kg
0 dB = 0.335 W/kg = -4.75 dBW/kgAdditional information: ambient temperature: 22.8°C; liquid temperature: 21.4°C

Test report no.: 1-0042/15-01-15-A
Page 190 of 223
Date/Time: 05.09.2015 22:38:18 FCC_EN62209-2 LTE FDD 7 hotspot DUT: Blackberry; Type: RHM181LW; Serial: 1161466951 Communication System: UID 0, LTE FDD (0); Communication System Band: LTE 7 (2600MHz); Frequency: 2560 MHz; Communication System PAR: 0 dB; PMF: 1 Medium parameters used: f = 2560 MHz; σ = 2.155 S/m; εr = 51.096; ρ = 1000 kg/m3 Phantom section: Center Section Measurement Standard: DASY5 DASY5 Configuration: - Probe: EX3DV4 - SN3944; ConvF(7.37, 7.37, 7.37); Calibrated: 14.08.2015; - Sensor-Surface: 2mm (Mechanical Surface Detection), z = 1.0, 31.0 - Electronics: DAE3 Sn413; Calibrated: 15.01.2015 - Phantom: Triple Flat Phantom 5.1C; Type: QD 000 P51 CA; Serial: 1154 - DASY52 52.8.7(1137); SEMCAD X 14.6.10(7164)
MSL-10mm - 20MHz BW - QPSK - 1RB slider open/Bottom 0RB offset High/Area Scan (101x121x1): Interpolated grid: dx=1.000 mm, dy=1.000 mm Maximum value of SAR (interpolated) = 1.16 W/kg
MSL-10mm - 20MHz BW - QPSK - 1RB slider open/Bottom 0RB offset High/Zoom Scan (7x7x7)/Cube 0: Measurement grid: dx=5mm, dy=5mm, dz=5mm Reference Value = 22.102 V/m; Power Drift = 0.02 dB Peak SAR (extrapolated) = 1.52 W/kg SAR(1 g) = 0.769 W/kg; SAR(10 g) = 0.364 W/kg Maximum value of SAR (measured) = 1.15 W/kg
0 dB = 1.15 W/kg = 0.61 dBW/kgAdditional information: position or distance of DUT to the phantom: 10 mm ambient temperature: 23.0°C; liquid temperature: 22.6°C

Test report no.: 1-0042/15-01-15-A
Page 191 of 223
Date/Time: 04.09.2015 10:39:04 FCC_EN62209-2 LTE FDD 7 body worn DUT: Blackberry; Type: RHM181LW; Serial: 1161466951 Communication System: UID 0, LTE FDD (0); Communication System Band: LTE 7 (2600MHz); Frequency: 2510 MHz; Communication System PAR: 0 dB; PMF: 1 Medium parameters used: f = 2510 MHz; σ = 2.11 S/m; εr = 51.299; ρ = 1000 kg/m3 Phantom section: Center Section Measurement Standard: DASY5 DASY5 Configuration: - Probe: EX3DV4 - SN3944; ConvF(7.37, 7.37, 7.37); Calibrated: 14.08.2015; - Sensor-Surface: 2mm (Mechanical Surface Detection (Locations From Previous Scan Used)), Sensor-Surface: 2mm (Mechanical Surface Detection), z = 1.0, 31.0 - Electronics: DAE3 Sn413; Calibrated: 15.01.2015 - Phantom: Triple Flat Phantom 5.1C; Type: QD 000 P51 CA; Serial: 1154 - DASY52 52.8.7(1137); SEMCAD X 14.6.10(7164)
MSL-15mm - 20MHz BW - QPSK - 1RB/Rear 0RB offset Low/Area Scan (121x221x1): Interpolated grid: dx=1.000 mm, dy=1.000 mm Maximum value of SAR (interpolated) = 0.523 W/kg
MSL-15mm - 20MHz BW - QPSK - 1RB/Rear 0RB offset Low/Zoom Scan (7x7x7)/Cube 0: Measurement grid: dx=5mm, dy=5mm, dz=5mm Reference Value = 16.192 V/m; Power Drift = 0.12 dB Peak SAR (extrapolated) = 0.715 W/kg SAR(1 g) = 0.378 W/kg; SAR(10 g) = 0.196 W/kg Maximum value of SAR (measured) = 0.538 W/kg
0 dB = 0.538 W/kg = -2.69 dBW/kgAdditional information: position or distance of DUT to the phantom: 15 mm ambient temperature: 23.0°C; liquid temperature: 22.6°C

Test report no.: 1-0042/15-01-15-A
Page 192 of 223
Annex B.10: LTE FDD 13
Date/Time: 24.08.2015 13:54:04 IEEE1528-LTE FDD 13 head DUT: Blackberry; Type: RHM181LW; Serial: 1161509684 Communication System: UID 0, LTE FDD (0); Communication System Band: LTE 13 (700MHz); Frequency: 782 MHz; Communication System PAR: 0 dB; PMF: 1 Medium parameters used: f = 782 MHz; σ = 0.932 S/m; εr = 40.676; ρ = 1000 kg/m3 Phantom section: Right Section Measurement Standard: DASY5 DASY5 Configuration: - Probe: ES3DV3 - SN3320; ConvF(6.32, 6.32, 6.32); Calibrated: 25.02.2015; - Sensor-Surface: 3mm (Mechanical Surface Detection (Locations From Previous Scan Used)), Sensor-Surface: 3mm (Mechanical Surface Detection), z = 2.0, 32.0 - Electronics: DAE3 Sn413; Calibrated: 15.01.2015 - Phantom: SAM front; Type: QD000P40CC; Serial: TP-1041 - DASY52 52.8.7(1137); SEMCAD X 14.6.10(7164)
Right-Hand-Side HSL - QPSK - 10MHz BW - 1RB - 0RB offset/Touch Position - Mid/Area Scan (81x131x1): Interpolated grid: dx=1.500 mm, dy=1.500 mm Maximum value of SAR (interpolated) = 0.154 W/kg
Right-Hand-Side HSL - QPSK - 10MHz BW - 1RB - 0RB offset/Touch Position - Mid/Zoom Scan (6x5x7)/Cube 0: Measurement grid: dx=7.5mm, dy=7.5mm, dz=5mm Reference Value = 13.074 V/m; Power Drift = -0.00 dB Peak SAR (extrapolated) = 0.177 W/kg SAR(1 g) = 0.136 W/kg; SAR(10 g) = 0.103 W/kg Maximum value of SAR (measured) = 0.150 W/kg
0 dB = 0.150 W/kg = -8.24 dBW/kgAdditional information: ambient temperature: 23.7°C; liquid temperature: 23.3°C
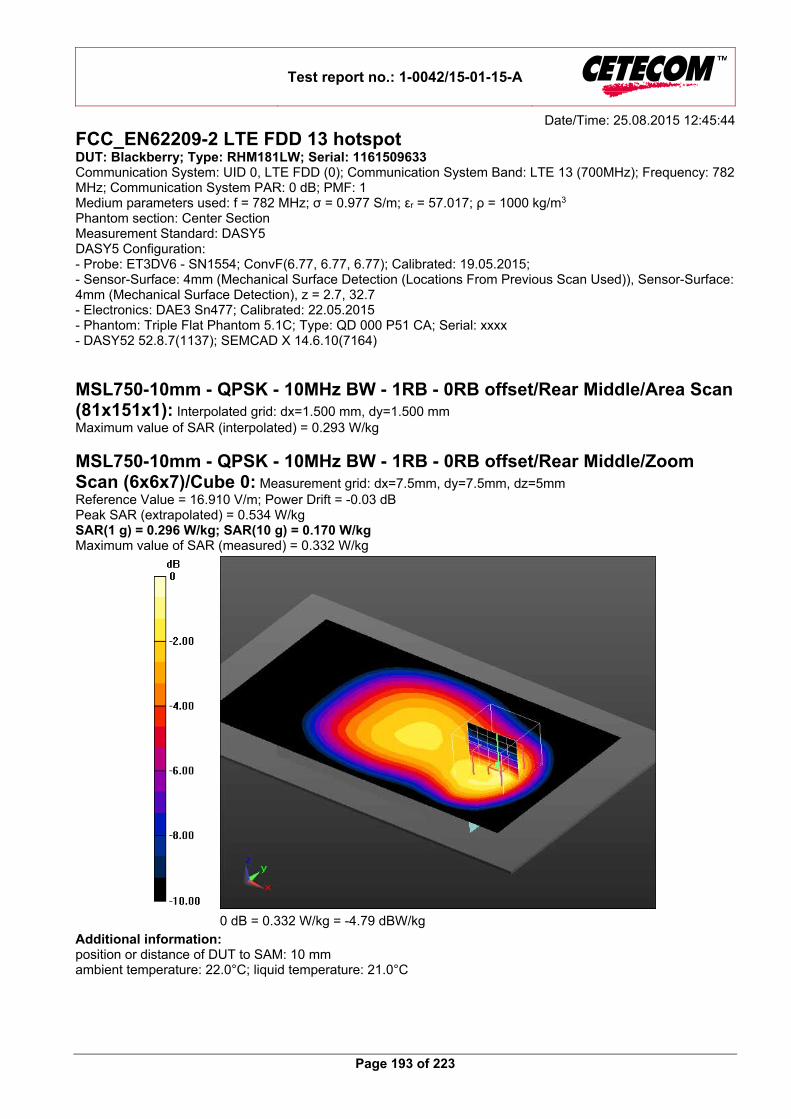
Test report no.: 1-0042/15-01-15-A
Page 193 of 223
Date/Time: 25.08.2015 12:45:44 FCC_EN62209-2 LTE FDD 13 hotspot DUT: Blackberry; Type: RHM181LW; Serial: 1161509633 Communication System: UID 0, LTE FDD (0); Communication System Band: LTE 13 (700MHz); Frequency: 782 MHz; Communication System PAR: 0 dB; PMF: 1 Medium parameters used: f = 782 MHz; σ = 0.977 S/m; εr = 57.017; ρ = 1000 kg/m3 Phantom section: Center Section Measurement Standard: DASY5 DASY5 Configuration: - Probe: ET3DV6 - SN1554; ConvF(6.77, 6.77, 6.77); Calibrated: 19.05.2015; - Sensor-Surface: 4mm (Mechanical Surface Detection (Locations From Previous Scan Used)), Sensor-Surface: 4mm (Mechanical Surface Detection), z = 2.7, 32.7 - Electronics: DAE3 Sn477; Calibrated: 22.05.2015 - Phantom: Triple Flat Phantom 5.1C; Type: QD 000 P51 CA; Serial: xxxx - DASY52 52.8.7(1137); SEMCAD X 14.6.10(7164)
MSL750-10mm - QPSK - 10MHz BW - 1RB - 0RB offset/Rear Middle/Area Scan (81x151x1): Interpolated grid: dx=1.500 mm, dy=1.500 mm Maximum value of SAR (interpolated) = 0.293 W/kg
MSL750-10mm - QPSK - 10MHz BW - 1RB - 0RB offset/Rear Middle/Zoom Scan (6x6x7)/Cube 0: Measurement grid: dx=7.5mm, dy=7.5mm, dz=5mm Reference Value = 16.910 V/m; Power Drift = -0.03 dB Peak SAR (extrapolated) = 0.534 W/kg SAR(1 g) = 0.296 W/kg; SAR(10 g) = 0.170 W/kg Maximum value of SAR (measured) = 0.332 W/kg
0 dB = 0.332 W/kg = -4.79 dBW/kgAdditional information: position or distance of DUT to SAM: 10 mm ambient temperature: 22.0°C; liquid temperature: 21.0°C

Test report no.: 1-0042/15-01-15-A
Page 194 of 223
Date/Time: 25.08.2015 12:03:38 FCC_EN62209-2 LTE FDD 13 body worn DUT: Blackberry; Type: RHM181LW; Serial: 1161509633 Communication System: UID 0, LTE FDD (0); Communication System Band: LTE 13 (700MHz); Frequency: 782 MHz; Communication System PAR: 0 dB; PMF: 1 Medium parameters used: f = 782 MHz; σ = 0.977 S/m; εr = 57.017; ρ = 1000 kg/m3 Phantom section: Center Section Measurement Standard: DASY5 DASY5 Configuration: - Probe: ET3DV6 - SN1554; ConvF(6.77, 6.77, 6.77); Calibrated: 19.05.2015; - Sensor-Surface: 4mm (Mechanical Surface Detection (Locations From Previous Scan Used)), Sensor-Surface: 4mm (Mechanical Surface Detection), z = 2.7, 32.7 - Electronics: DAE3 Sn477; Calibrated: 22.05.2015 - Phantom: Triple Flat Phantom 5.1C; Type: QD 000 P51 CA; Serial: xxxx - DASY52 52.8.7(1137); SEMCAD X 14.6.10(7164)
MSL750-15mm - QPSK - 10MHz BW - 1RB - 0RB offset/Rear Middle/Area Scan (81x151x1): Interpolated grid: dx=1.500 mm, dy=1.500 mm Maximum value of SAR (interpolated) = 0.194 W/kg
MSL750-15mm - QPSK - 10MHz BW - 1RB - 0RB offset/Rear Middle/Zoom Scan (5x5x7)/Cube 0: Measurement grid: dx=7.5mm, dy=7.5mm, dz=5mm Reference Value = 14.190 V/m; Power Drift = 0.00 dB Peak SAR (extrapolated) = 0.210 W/kg SAR(1 g) = 0.178 W/kg; SAR(10 g) = 0.139 W/kg Maximum value of SAR (measured) = 0.186 W/kg
0 dB = 0.186 W/kg = -7.30 dBW/kgAdditional information: position or distance of DUT to SAM: 15 mm ambient temperature: 22.0°C; liquid temperature: 21.0°C

Test report no.: 1-0042/15-01-15-A
Page 195 of 223
Annex B.11: LTE FDD 17
Date/Time: 25.08.2015 11:41:20 IEEE1528-LTE FDD 17 head DUT: Blackberry; Type: RHM181LW; Serial: 1161509684 Communication System: UID 0, LTE FDD (0); Communication System Band: LTE 17 (700MHz); Frequency: 709 MHz; Communication System PAR: 0 dB; PMF: 1 Medium parameters used: f = 709 MHz; σ = 0.865 S/m; εr = 41.64; ρ = 1000 kg/m3 Phantom section: Right Section Measurement Standard: DASY5 DASY5 Configuration: - Probe: ES3DV3 - SN3320; ConvF(6.32, 6.32, 6.32); Calibrated: 25.02.2015; - Sensor-Surface: 3mm (Mechanical Surface Detection (Locations From Previous Scan Used)), Sensor-Surface: 3mm (Mechanical Surface Detection), z = 2.0, 32.0 - Electronics: DAE3 Sn413; Calibrated: 15.01.2015 - Phantom: SAM front; Type: QD000P40CC; Serial: TP-1041 - DASY52 52.8.7(1137); SEMCAD X 14.6.10(7164)
Right-Hand-Side HSL - QPSK - 10MHz BW - 25RB - 25RB offset/Touch Position - Low/Area Scan (81x131x1): Interpolated grid: dx=1.500 mm, dy=1.500 mm Maximum value of SAR (interpolated) = 0.0793 W/kg
Right-Hand-Side HSL - QPSK - 10MHz BW - 25RB - 25RB offset/Touch Position - Low/Zoom Scan (5x5x7)/Cube 0: Measurement grid: dx=7.5mm, dy=7.5mm, dz=5mm Reference Value = 9.621 V/m; Power Drift = 0.17 dB Peak SAR (extrapolated) = 0.0860 W/kg SAR(1 g) = 0.071 W/kg; SAR(10 g) = 0.056 W/kg Maximum value of SAR (measured) = 0.0767 W/kg
0 dB = 0.0767 W/kg = -11.15 dBW/kgAdditional information: ambient temperature: 23.0°C; liquid temperature: 21.7°C
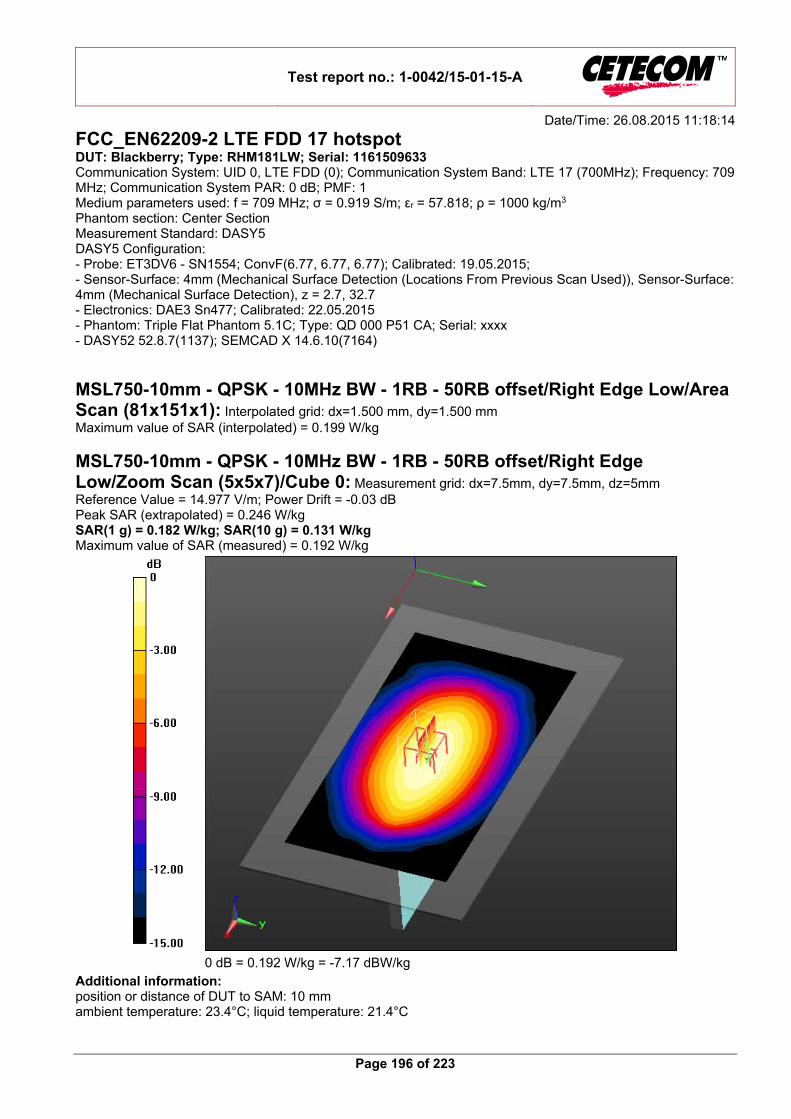
Test report no.: 1-0042/15-01-15-A
Page 196 of 223
Date/Time: 26.08.2015 11:18:14 FCC_EN62209-2 LTE FDD 17 hotspot DUT: Blackberry; Type: RHM181LW; Serial: 1161509633 Communication System: UID 0, LTE FDD (0); Communication System Band: LTE 17 (700MHz); Frequency: 709 MHz; Communication System PAR: 0 dB; PMF: 1 Medium parameters used: f = 709 MHz; σ = 0.919 S/m; εr = 57.818; ρ = 1000 kg/m3 Phantom section: Center Section Measurement Standard: DASY5 DASY5 Configuration: - Probe: ET3DV6 - SN1554; ConvF(6.77, 6.77, 6.77); Calibrated: 19.05.2015; - Sensor-Surface: 4mm (Mechanical Surface Detection (Locations From Previous Scan Used)), Sensor-Surface: 4mm (Mechanical Surface Detection), z = 2.7, 32.7 - Electronics: DAE3 Sn477; Calibrated: 22.05.2015 - Phantom: Triple Flat Phantom 5.1C; Type: QD 000 P51 CA; Serial: xxxx - DASY52 52.8.7(1137); SEMCAD X 14.6.10(7164)
MSL750-10mm - QPSK - 10MHz BW - 1RB - 50RB offset/Right Edge Low/Area Scan (81x151x1): Interpolated grid: dx=1.500 mm, dy=1.500 mm Maximum value of SAR (interpolated) = 0.199 W/kg
MSL750-10mm - QPSK - 10MHz BW - 1RB - 50RB offset/Right Edge Low/Zoom Scan (5x5x7)/Cube 0: Measurement grid: dx=7.5mm, dy=7.5mm, dz=5mm Reference Value = 14.977 V/m; Power Drift = -0.03 dB Peak SAR (extrapolated) = 0.246 W/kg SAR(1 g) = 0.182 W/kg; SAR(10 g) = 0.131 W/kg Maximum value of SAR (measured) = 0.192 W/kg
0 dB = 0.192 W/kg = -7.17 dBW/kgAdditional information: position or distance of DUT to SAM: 10 mm ambient temperature: 23.4°C; liquid temperature: 21.4°C

Test report no.: 1-0042/15-01-15-A
Page 197 of 223
Date/Time: 26.08.2015 09:21:07 FCC_EN62209-2 LTE FDD 17 body worn DUT: Blackberry; Type: RHM181LW; Serial: 1161509633 Communication System: UID 0, LTE FDD (0); Communication System Band: LTE 17 (700MHz); Frequency: 709 MHz; Communication System PAR: 0 dB; PMF: 1 Medium parameters used: f = 709 MHz; σ = 0.919 S/m; εr = 57.818; ρ = 1000 kg/m3 Phantom section: Center Section Measurement Standard: DASY5 DASY5 Configuration: - Probe: ET3DV6 - SN1554; ConvF(6.77, 6.77, 6.77); Calibrated: 19.05.2015; - Sensor-Surface: 4mm (Mechanical Surface Detection (Locations From Previous Scan Used)), Sensor-Surface: 4mm (Mechanical Surface Detection), z = 2.7, 32.7 - Electronics: DAE3 Sn477; Calibrated: 22.05.2015 - Phantom: Triple Flat Phantom 5.1C; Type: QD 000 P51 CA; Serial: xxxx - DASY52 52.8.7(1137); SEMCAD X 14.6.10(7164)
MSL750-15mm - QPSK - 10MHz BW - 1RB - 50RB offset/Rear Low/Area Scan (81x151x1): Interpolated grid: dx=1.500 mm, dy=1.500 mm Maximum value of SAR (interpolated) = 0.134 W/kg
MSL750-15mm - QPSK - 10MHz BW - 1RB - 50RB offset/Rear Low/Zoom Scan (5x5x7)/Cube 0: Measurement grid: dx=7.5mm, dy=7.5mm, dz=5mm Reference Value = 12.268 V/m; Power Drift = -0.01 dB Peak SAR (extrapolated) = 0.147 W/kg SAR(1 g) = 0.124 W/kg; SAR(10 g) = 0.098 W/kg Maximum value of SAR (measured) = 0.129 W/kg
0 dB = 0.129 W/kg = -8.89 dBW/kgAdditional information: position or distance of DUT to SAM: 15 mm ambient temperature: 22.0°C; liquid temperature: 21.0°C

Test report no.: 1-0042/15-01-15-A
Page 198 of 223
Annex B.12: LTE TDD 41
Date/Time: 01.09.2015 14:53:14 IEEE1528-LTE TDD 41 head DUT: Blackberry; Type: RHM181LW; Serial: 1161466951 Communication System: UID 0, LTE TDD (0); Communication System Band: LTE TDD 41; Frequency: 2636.5 MHz; Communication System PAR: 1.984 dB; PMF: 1 Medium parameters used (interpolated): f = 2636.5 MHz; σ = 1.991 S/m; εr = 38.341; ρ = 1000 kg/m3 Phantom section: Right Section Measurement Standard: DASY5 DASY5 Configuration: - Probe: EX3DV4 - SN3944; ConvF(7.15, 7.15, 7.15); Calibrated: 14.08.2015; - Sensor-Surface: 2mm (Mechanical Surface Detection (Locations From Previous Scan Used)), Sensor-Surface: 2mm (Mechanical Surface Detection), z = 1.0, 31.0 - Electronics: DAE3 Sn413; Calibrated: 15.01.2015 - Phantom: SAM front; Type: QD000P40CC; Serial: TP-1041 - DASY52 52.8.7(1137); SEMCAD X 14.6.10(7164)
Right-Hand-Side HSL - 20MHz BW - QPSK - 1RB/Touch Position - Ch 41055 - 0 RB offset/Area Scan (121x191x1): Interpolated grid: dx=1.000 mm, dy=1.000 mm Maximum value of SAR (interpolated) = 0.198 W/kg
Right-Hand-Side HSL - 20MHz BW - QPSK - 1RB/Touch Position - Ch 41055 - 0 RB offset/Zoom Scan (8x8x7)/Cube 0: Measurement grid: dx=5mm, dy=5mm, dz=5mm Reference Value = 9.801 V/m; Power Drift = 0.04 dB Peak SAR (extrapolated) = 0.237 W/kg SAR(1 g) = 0.135 W/kg; SAR(10 g) = 0.074 W/kg Maximum value of SAR (measured) = 0.186 W/kg
0 dB = 0.186 W/kg = -7.30 dBW/kgAdditional information: ambient temperature: 23.8 °C; liquid temperature: 22.6 °C

Test report no.: 1-0042/15-01-15-A
Page 199 of 223
Date/Time: 03.09.2015 17:11:42 FCC_EN62209-2 LTE TDD 41 hotspot DUT: Blackberry; Type: RHM181LW; Serial: 1161466951 Communication System: UID 0, LTE TDD (0); Communication System Band: LTE TDD 41; Frequency: 2636.5 MHz; Communication System PAR: 1.984 dB; PMF: 1 Medium parameters used (interpolated): f = 2636.5 MHz; σ = 2.265 S/m; εr = 50.874; ρ = 1000 kg/m3 Phantom section: Center Section Measurement Standard: DASY5 DASY5 Configuration: - Probe: EX3DV4 - SN3944; ConvF(7.37, 7.37, 7.37); Calibrated: 14.08.2015; - Sensor-Surface: 2mm (Mechanical Surface Detection (Locations From Previous Scan Used)), Sensor-Surface: 2mm (Mechanical Surface Detection), z = 1.0, 26.0 - Electronics: DAE3 Sn413; Calibrated: 15.01.2015 - Phantom: Triple Flat Phantom 5.1C; Type: QD 000 P51 CA; Serial: 1154 - DASY52 52.8.7(1137); SEMCAD X 14.6.10(7164)
MSL-10mm - 20MHz BW - QPSK - 1RB slider open/Bottom 0RB offset Ch 41055/Area Scan (101x121x1): Interpolated grid: dx=1.000 mm, dy=1.000 mm Maximum value of SAR (interpolated) = 0.949 W/kg
MSL-10mm - 20MHz BW - QPSK - 1RB slider open/Bottom 0RB offset Ch 41055/Zoom Scan (7x7x6)/Cube 0: Measurement grid: dx=5mm, dy=5mm, dz=5mm Reference Value = 19.424 V/m; Power Drift = -0.01 dB Peak SAR (extrapolated) = 1.27 W/kg SAR(1 g) = 0.614 W/kg; SAR(10 g) = 0.270 W/kg Maximum value of SAR (measured) = 0.950 W/kg
0 dB = 0.950 W/kg = -0.22 dBW/kgAdditional information: position or distance of DUT to the phantom: 10 mm ambient temperature: 23.0°C; liquid temperature: 22.6°C

Test report no.: 1-0042/15-01-15-A
Page 200 of 223
Date/Time: 03.09.2015 20:19:28 FCC_EN62209-2 LTE TDD 41 body worn DUT: Blackberry; Type: RHM181LW; Serial: 1161466951 Communication System: UID 0, LTE TDD (0); Communication System Band: LTE TDD 41; Frequency: 2636.5 MHz; Communication System PAR: 1.984 dB; PMF: 1 Medium parameters used (interpolated): f = 2636.5 MHz; σ = 2.265 S/m; εr = 50.874; ρ = 1000 kg/m3 Phantom section: Center Section Measurement Standard: DASY5 DASY5 Configuration: - Probe: EX3DV4 - SN3944; ConvF(7.37, 7.37, 7.37); Calibrated: 14.08.2015; - Sensor-Surface: 2mm (Mechanical Surface Detection (Locations From Previous Scan Used)), Sensor-Surface: 2mm (Mechanical Surface Detection), z = 1.0, 31.0 - Electronics: DAE3 Sn413; Calibrated: 15.01.2015 - Phantom: Triple Flat Phantom 5.1C; Type: QD 000 P51 CA; Serial: 1154 - DASY52 52.8.7(1137); SEMCAD X 14.6.10(7164)
MSL-15mm - 20MHz BW - QPSK - 1RB/Rear 0RB offset Ch 41055/Area Scan (121x221x1): Interpolated grid: dx=1.000 mm, dy=1.000 mm Maximum value of SAR (interpolated) = 0.536 W/kg
MSL-15mm - 20MHz BW - QPSK - 1RB/Rear 0RB offset Ch 41055/Zoom Scan (7x7x7)/Cube 0: Measurement grid: dx=5mm, dy=5mm, dz=5mm Reference Value = 15.541 V/m; Power Drift = -0.00 dB Peak SAR (extrapolated) = 0.720 W/kg SAR(1 g) = 0.369 W/kg; SAR(10 g) = 0.186 W/kg Maximum value of SAR (measured) = 0.532 W/kg
0 dB = 0.532 W/kg = -2.74 dBW/kgAdditional information: position or distance of DUT to the phantom: 15 mm ambient temperature: 23.0°C; liquid temperature: 22.6°C

Test report no.: 1-0042/15-01-15-A
Page 201 of 223
Annex B.13: WLAN2.4/5GHz and Bluetooth2.4GHz
802.11b (Primary Antenna_Core 0) Date: 9/4/2015
Test Lab: BlackBerry RTS DUT Name: BlackBerry Smartphone, Type: Sample, Serial: 1161463503
Configuration: Right‐Hand‐Side HSL ‐ 802.11b_Slider Closed Communication System: 802.11 b/g (2450) (0); Communication System Band: 802.11 b/g; Frequency: 2412 MHz Medium Parameters used: f=2412 MHz; σ = 1.786 S/m; εr = 37.574; ρ = 1.000 g/cm3
Phantom section: Right Section DASY Configuration:
Probe: ES3DV3 ‐ SN3225; ConvF: (4.6,4.6,4.6); Calibrated: 2/25/2015;
Sensor‐Surface: 3 mm (Mechanical Surface Detection)
Electronics: DAE4 Sn881; Calibrated: 1/13/2015
Phantom: SAM 1; Type: SAM 4.0; Serial: 1076
DASY52 52.8.8(1222); SEMCAD X Version 14.6.10 (7331)
Right‐Hand‐Side HSL ‐ 802.11b_Slider Closed/Touch Position ‐ 802.11b_chan11_amb_temp_23.7C_liq_temp_23.1C/Area Scan (131x181x1): Interpolated grid: dx=1.200 mm, dy=1.200 mm Reference Value = 5.118 V/m; Power Drift = 0.094 dB Fast SAR: SAR(1g) = 0.184 W/kg; SAR(10g) = 0.0939 W/kg Maximum value of SAR (interpolated) = 0.243 W/kg Right‐Hand‐Side HSL ‐ 802.11b_Slider Closed/Touch Position ‐ 802.11b_chan11_amb_temp_23.7C_liq_temp_23.1C/Zoom Scan (31x31x36)/Cube 0: Interpolated grid: dx=1.000 mm, dy=1.000 mm, dz=1.000 mm Reference Value = 5.118 V/m; Power Drift = 0.094 dB Averaged SAR: SAR(1g) = 0.199 W/kg; SAR(10g) = 0.0967 W/kg Maximum value of SAR (interpolated) = 0.408 W/kg
0 dB = 0.222 W/kg = ‐6.54 dBW/kg

Test report no.: 1-0042/15-01-15-A
Page 202 of 223
Date: 9/16/2015
Test Lab: BlackBerry RTS DUT Name: BlackBerry Smartphone, Type: Sample, Serial: 1161462755
Configuration: Mobile Hot Spot MSL ‐ 802.11b_Slider Open Communication System: 802.11 b/g (2450) (0); Communication System Band: 802.11 b/g; Frequency: 2412 MHz Medium Parameters used: f=2412 MHz; σ = 1.975 S/m; εr = 50.453; ρ = 1.000 g/cm3
Phantom section: Flat Section DASY Configuration:
Probe: ES3DV3 ‐ SN3225; ConvF: (4.34,4.34,4.34); Calibrated: 2/25/2015;
Sensor‐Surface: 3 mm (Mechanical Surface Detection)
Electronics: DAE4 Sn881; Calibrated: 1/13/2015
Phantom: SAM 2; Type: SAM 4.0; Serial: 1080
DASY52 52.8.8(1222); SEMCAD X Version 14.6.10 (7331)
Mobile Hot Spot MSL ‐ 802.11b_Slider Open/10mm Device Back ‐ 802.11b_chan11_amb_temp_24.0C_liq_temp_22.8C/Area Scan (101x101x1): Interpolated grid: dx=1.200 mm, dy=1.200 mm Reference Value = 2.621 V/m; Power Drift = ‐0.00644 dB Fast SAR: SAR(1g) = 0.0422 W/kg; SAR(10g) = 0.0203 W/kg Maximum value of SAR (interpolated) = 0.0570 W/kg Mobile Hot Spot MSL ‐ 802.11b_Slider Open/10mm Device Back ‐ 802.11b_chan11_amb_temp_24.0C_liq_temp_22.8C/Zoom Scan (31x31x36)/Cube 0: Interpolated grid: dx=1.000 mm, dy=1.000 mm, dz=1.000 mm Reference Value = 2.621 V/m; Power Drift = ‐0.00644 dB Averaged SAR: SAR(1g) = 0.0432 W/kg; SAR(10g) = 0.0198 W/kg Maximum value of SAR (interpolated) = 0.0973 W/kg
0 dB = 0.0571 W/kg = ‐12.43 dBW/kg

Test report no.: 1-0042/15-01-15-A
Page 203 of 223
Date: 9/6/2015
Test Lab: BlackBerry RTS DUT Name: BlackBerry Smartphone, Type: Sample, Serial: 1161463503
Configuration: Body Worn MSL ‐ 802.11b Communication System: 802.11 b/g (2450) (0); Communication System Band: 802.11 b/g; Frequency: 2412 MHz Medium Parameters used: f=2412 MHz; σ = 1.967 S/m; εr = 50.713; ρ = 1.000 g/cm3
Phantom section: Flat Section DASY Configuration:
Probe: ES3DV3 ‐ SN3225; ConvF: (4.34,4.34,4.34); Calibrated: 2/25/2015;
Sensor‐Surface: 3 mm (Mechanical Surface Detection)
Electronics: DAE4 Sn881; Calibrated: 1/13/2015
Phantom: SAM 2; Type: SAM 4.0; Serial: 1080
DASY52 52.8.8(1222); SEMCAD X Version 14.6.10 (7331)
Body Worn MSL ‐ 802.11b/15mm Device Back ‐ 802.11b_chan11_amb_temp_23.7C_liq_temp_23.7C/Area Scan (81x131x1): Interpolated grid: dx=1.200 mm, dy=1.200 mm Reference Value = 3.479 V/m; Power Drift = 0.265 dB Fast SAR: SAR(1g) = 0.0914 W/kg; SAR(10g) = 0.0445 W/kg Maximum value of SAR (interpolated) = 0.121 W/kg Body Worn MSL ‐ 802.11b/15mm Device Back ‐ 802.11b_chan11_amb_temp_23.7C_liq_temp_23.7C/Zoom Scan (31x31x36)/Cube 0: Interpolated grid: dx=1.000 mm, dy=1.000 mm, dz=1.000 mm Reference Value = 3.479 V/m; Power Drift = 0.265 dB Averaged SAR: SAR(1g) = 0.0927 W/kg; SAR(10g) = 0.0453 W/kg Maximum value of SAR (interpolated) = 0.187 W/kg
0 dB = 0.118 W/kg = ‐9.28 dBW/kg

Test report no.: 1-0042/15-01-15-A
Page 204 of 223
(Secondary Antenna_Core 1) Date: 9/7/2015
Test Lab: BlackBerry RTS DUT Name: BlackBerry Smartphone, Type: Sample, Serial: 1161463503
Configuration: Right‐Hand‐Side HSL ‐ 802.11b_Slider Closed Communication System: 802.11 b/g (2450) (0); Communication System Band: 802.11 b/g; Frequency: 2412 MHz Medium Parameters used: f=2412 MHz; σ = 1.786 S/m; εr = 37.574; ρ = 1.000 g/cm3
Phantom section: Right Section DASY Configuration:
Probe: ES3DV3 ‐ SN3225; ConvF: (4.6,4.6,4.6); Calibrated: 2/25/2015;
Sensor‐Surface: 3 mm (Mechanical Surface Detection)
Electronics: DAE4 Sn881; Calibrated: 1/13/2015
Phantom: SAM 1; Type: SAM 4.0; Serial: 1076
DASY52 52.8.8(1222); SEMCAD X Version 14.6.10 (7331)
Left‐Hand‐Side HSL ‐ 802.11b_Slider Closed/Tilt Position ‐ 802.11b_chan6_amb_temp_23.7C_liq_temp_22.9C/Area Scan (81x101x1): Interpolated grid: dx=1.200 mm, dy=1.200 mm Reference Value = 3.768 V/m; Power Drift = 0.353 dB Fast SAR: SAR(1g) = 0.0704 W/kg; SAR(10g) = 0.0356 W/kg Maximum value of SAR (interpolated) = 0.0924 W/kg Left‐Hand‐Side HSL ‐ 802.11b_Slider Closed/Tilt Position ‐ 802.11b_chan6_amb_temp_23.7C_liq_temp_22.9C/Zoom Scan (31x31x36)/Cube 0: Interpolated grid: dx=1.000 mm, dy=1.000 mm, dz=1.000 mm Reference Value = 3.768 V/m; Power Drift = 0.353 dB Averaged SAR: SAR(1g) = 0.0799 W/kg; SAR(10g) = 0.0378 W/kg Maximum value of SAR (interpolated) = 0.179 W/kg
0 dB = 0.0923 W/kg = ‐10.35 dBW/kg

Test report no.: 1-0042/15-01-15-A
Page 205 of 223
Date: 9/16/2015
Test Lab: BlackBerry RTS DUT Name: BlackBerry Smartphone, Type: Sample, Serial: 1161463503
Configuration: Mobile Hot Spot MSL ‐ 802.11b_Slider Closed Communication System: 802.11 b/g (2450) (0); Communication System Band: 802.11 b/g; Frequency: 2462 MHz Medium Parameters used: f=2462 MHz; σ = 2.034 S/m; εr = 50.309; ρ = 1.000 g/cm3
Phantom section: Flat Section DASY Configuration:
Probe: ES3DV3 ‐ SN3225; ConvF: (4.34,4.34,4.34); Calibrated: 2/25/2015;
Sensor‐Surface: 3 mm (Mechanical Surface Detection)
Electronics: DAE4 Sn881; Calibrated: 1/13/2015
Phantom: SAM 2; Type: SAM 4.0; Serial: 1080
DASY52 52.8.8(1222); SEMCAD X Version 14.6.10 (7331)
Mobile Hot Spot MSL ‐ 802.11b_Slider Open/10mm Device Back ‐ 802.11b_chan11_amb_temp_24.1C_liq_temp_23.0C/Area Scan (81x111x1): Interpolated grid: dx=1.200 mm, dy=1.200 mm Reference Value = 1.425 V/m; Power Drift = ‐0.142 dB Fast SAR: SAR(1g) = 0.0327 W/kg; SAR(10g) = 0.0157 W/kg Maximum value of SAR (interpolated) = 0.0440 W/kg Mobile Hot Spot MSL - 802.11b_Slider Open/10mm Device Back - 802.11b_chan11_amb_temp_24.1C_liq_temp_23.0C/Zoom Scan (31x31x36)/Cube 0: Interpolated grid: dx=1.000 mm, dy=1.000 mm, dz=1.000 mm Reference Value = 1.425 V/m; Power Drift = ‐0.142 dB Averaged SAR: SAR(1g) = 0.0350 W/kg; SAR(10g) = 0.0156 W/kg Maximum value of SAR (interpolated) = 0.0791 W/kg
0 dB = 0.0456 W/kg = ‐13.41 dBW/kg

Test report no.: 1-0042/15-01-15-A
Page 206 of 223
Date: 9/6/2015
Test Lab: BlackBerry RTS DUT Name: BlackBerry Smartphone, Type: Sample, Serial: 1161462755
Configuration: Body Worn MSL ‐ 802.11b Communication System: 802.11 b/g (2450) (0); Communication System Band: 802.11 b/g; Frequency: 2412 MHz Medium Parameters used: f=2412 MHz; σ = 1.967 S/m; εr = 50.713; ρ = 1.000 g/cm3
Phantom section: Flat Section DASY Configuration:
Probe: ES3DV3 ‐ SN3225; ConvF: (4.34,4.34,4.34); Calibrated: 2/25/2015;
Sensor‐Surface: 3 mm (Mechanical Surface Detection)
Electronics: DAE4 Sn881; Calibrated: 1/13/2015
Phantom: SAM 2; Type: SAM 4.0; Serial: 1080
DASY52 52.8.8(1222); SEMCAD X Version 14.6.10 (7331)
Body Worn MSL ‐ 802.11b/15mm Device Back ‐ 802.11b_chan11_amb_temp_23.7C_liq_temp_23.7C/Area Scan (81x81x1): Interpolated grid: dx=1.200 mm, dy=1.200 mm Reference Value = 1.488 V/m; Power Drift = 0.061 dB Fast SAR: SAR(1g) = 0.0404 W/kg; SAR(10g) = 0.0200 W/kg Maximum value of SAR (interpolated) = 0.0533 W/kg Body Worn MSL ‐ 802.11b/15mm Device Back ‐ 802.11b_chan11_amb_temp_23.7C_liq_temp_23.7C/Zoom Scan (31x31x36)/Cube 0: Interpolated grid: dx=1.000 mm, dy=1.000 mm, dz=1.000 mm Reference Value = 1.488 V/m; Power Drift = 0.061 dB Averaged SAR: SAR(1g) = 0.0384 W/kg; SAR(10g) = 0.0189 W/kg Maximum value of SAR (interpolated) = 0.0807 W/kg
0 dB = 0.0489 W/kg = ‐13.11 dBW/kg

Test report no.: 1-0042/15-01-15-A
Page 207 of 223
Bluetooth Date: 9/8/2015
Test Lab: BlackBerry RTS DUT Name: BlackBerry Smartphone, Type: Sample, Serial: 1161463503
Configuration: Right‐Hand‐Side HSL ‐ Bluetooth ‐ Slider Closed Communication System: Bluetooth (0); Communication System Band: Exported from older format (data unavailable ‐ please correct).; Frequency: 2441 MHz Medium Parameters used: f=2441 MHz; σ = 1.818 S/m; εr = 37.458; ρ = 1.000 g/cm3
Phantom section: Right Section DASY Configuration:
Probe: ES3DV3 ‐ SN3225; ConvF: (4.6,4.6,4.6); Calibrated: 2/25/2015;
Sensor‐Surface: 3 mm (Mechanical Surface Detection)
Electronics: DAE4 Sn881; Calibrated: 1/13/2015
Phantom: SAM 1; Type: SAM 4.0; Serial: 1076
DASY52 52.8.8(1222); SEMCAD X Version 14.6.10 (7331)
Right‐Hand‐Side HSL ‐ Bluetooth ‐ Slider Closed/Touch Position ‐ Bluetooth_chan39_amb_temp_22.7C_liq_temp_23.9C/Area Scan (131x161x1): Interpolated grid: dx=1.200 mm, dy=1.200 mm Reference Value = 1.340 V/m; Power Drift = 0.029 dB Fast SAR: SAR(1g) = 0.0116 W/kg; SAR(10g) = 0.00618 W/kg Maximum value of SAR (interpolated) = 0.0149 W/kg Right‐Hand‐Side HSL ‐ Bluetooth ‐ Slider Closed/Touch Position ‐ Bluetooth_chan39_amb_temp_22.7C_liq_temp_23.9C/Zoom Scan (36x36x36)/Cube 0: Interpolated grid: dx=1.000 mm, dy=1.000 mm, dz=1.000 mm Reference Value = 1.340 V/m; Power Drift = 0.029 dB Averaged SAR: SAR(1g) = 0.0110 W/kg; SAR(10g) = 0.00523 W/kg Maximum value of SAR (interpolated) = 0.0197 W/kg
0 dB = 0.0126 W/kg = ‐19.00 dBW/kg

Test report no.: 1-0042/15-01-15-A
Page 208 of 223
Date: 9/8/2015
Test Lab: BlackBerry RTS DUT Name: BlackBerry Smartphone, Type: Sample, Serial: 1161463503
Configuration: Mobile Hot Spot MSL ‐ Bluetooth ‐ Slider Open Communication System: Bluetooth (0); Communication System Band: Exported from older format (data unavailable ‐ please correct).; Frequency: 2441 MHz Medium Parameters used: f=2441 MHz; σ = 2.007 S/m; εr = 50.608; ρ = 1.000 g/cm3
Phantom section: Flat Section DASY Configuration:
Probe: ES3DV3 ‐ SN3225; ConvF: (4.34,4.34,4.34); Calibrated: 2/25/2015;
Sensor‐Surface: 3 mm (Mechanical Surface Detection)
Electronics: DAE4 Sn881; Calibrated: 1/13/2015
Phantom: SAM 2; Type: SAM 4.0; Serial: 1080
DASY52 52.8.8(1222); SEMCAD X Version 14.6.10 (7331)
Mobile Hot Spot MSL ‐ Bluetooth ‐ Slider Open/10mm Device Back ‐ Bluetooth_chan39_amb_temp_24.0C_liq_temp_22.5C/Area Scan (151x101x1): Interpolated grid: dx=1.200 mm, dy=1.200 mm Reference Value = 1.175 V/m; Power Drift = 0.228 dB Fast SAR: SAR(1g) = 0.0174 W/kg; SAR(10g) = 0.00885 W/kg Maximum value of SAR (interpolated) = 0.0232 W/kg Mobile Hot Spot MSL ‐ Bluetooth ‐ Slider Open/10mm Device Back ‐ Bluetooth_chan39_amb_temp_24.0C_liq_temp_22.5C/Zoom Scan (36x36x36)/Cube 0: Interpolated grid: dx=1.000 mm, dy=1.000 mm, dz=1.000 mm Reference Value = 1.175 V/m; Power Drift = 0.228 dB Averaged SAR: SAR(1g) = 0.0187 W/kg; SAR(10g) = 0.00865 W/kg Maximum value of SAR (interpolated) = 0.0911 W/kg
0 dB = 0.0251 W/kg = ‐16.00 dBW/kg

Test report no.: 1-0042/15-01-15-A
Page 209 of 223
Date: 9/8/2015
Test Lab: BlackBerry RTS DUT Name: BlackBerry Smartphone, Type: Sample, Serial: 1161463503
Configuration: Body Worn MSL ‐ Bluetooth ‐ Slider Closed Communication System: Bluetooth (0); Communication System Band: Exported from older format (data unavailable ‐ please correct).; Frequency: 2441 MHz Medium Parameters used: f=2441 MHz; σ = 2.007 S/m; εr = 50.608; ρ = 1.000 g/cm3
Phantom section: Flat Section DASY Configuration:
Probe: ES3DV3 ‐ SN3225; ConvF: (4.34,4.34,4.34); Calibrated: 2/25/2015;
Sensor‐Surface: 3 mm (Mechanical Surface Detection)
Electronics: DAE4 Sn881; Calibrated: 1/13/2015
Phantom: SAM 2; Type: SAM 4.0; Serial: 1080
DASY52 52.8.8(1222); SEMCAD X Version 14.6.10 (7331)
Body Worn MSL ‐ Bluetooth ‐ Slider Closed/15mm Device Back ‐ Bluetooth_chan39_amb_temp_24.0C_liq_temp_22.4C/Area Scan (151x201x1): Interpolated grid: dx=1.200 mm, dy=1.200 mm Reference Value = 0.575 V/m; Power Drift = 0.168 dB Fast SAR: SAR(1g) = 0.00885 W/kg; SAR(10g) = 0.00369 W/kg Maximum value of SAR (interpolated) = 0.0150 W/kg Body Worn MSL ‐ Bluetooth ‐ Slider Closed/15mm Device Back ‐ Bluetooth_chan39_amb_temp_24.0C_liq_temp_22.4C/Zoom Scan (31x31x36)/Cube 0: Interpolated grid: dx=1.000 mm, dy=1.000 mm, dz=1.000 mm Reference Value = 0.575 V/m; Power Drift = 0.168 dB Averaged SAR: SAR(1g) = 0.00652 W/kg; SAR(10g) = 0.00288 W/kg Maximum value of SAR (interpolated) = 0.0171 W/kg
0 dB = 0.00874 W/kg = ‐20.58 dBW/kg

Test report no.: 1-0042/15-01-15-A
Page 210 of 223
802.11a/n Date: 9/12/2015
Test Lab: BlackBerry RTS DUT Name: BlackBerry Smartphone, Type: Sample, Serial: 1161463503
Configuration: Right-Hand-Side HSL - 802.11a_n 5200 MHz Communication System: 802.11a/n (0); Communication System Band: UNII 1/2A/2C/3; Frequency: 5270 MHz, Communication System PAR: 0 dB; PMF: 1.12202e-005; Duty Cycle: 1:1 Medium Parameters used: f=5270 MHz; σ = 4.798 S/m; εr = 34.187; ρ = 1.000 g/cm3
Phantom section: Right Section DASY Configuration:
Probe: EX3DV4 - SN3592; ConvF: (4.63,4.63,4.63); Calibrated: 11/10/2014; Sensor-Surface: 2 mm (Mechanical Surface Detection) Electronics: DAE4 Sn881; Calibrated: 1/13/2015 Phantom: SAM 1; Type: SAM 4.0; Serial: 1076 DASY52 52.8.8(1222); SEMCAD X Version 14.6.10 (7331)
Left-Hand-Side HSL - 802.11a_n 5200 MHz/Tilt Position -802.11a-n_U-NII-2A_chan54_amb_temp_23.9C_liq_temp_23.3C/Area Scan (161x121x1): Interpolated grid: dx=1.000 mm, dy=1.000 mm Maximum value of SAR (interpolated) = 0.198 W/kg Left-Hand-Side HSL - 802.11a_n 5200 MHz/Tilt Position -802.11a-n_U-NII-2A_chan54_amb_temp_23.9C_liq_temp_23.3C/Zoom Scan (41x41x61)/Cube 0: Interpolated grid: dx=0.800 mm, dy=0.800 mm, dz=0.400 mm Reference Value = 2.244 V/m; Power Drift = -0.091 dB Averaged SAR: SAR(1g) = 0.109 W/kg; SAR(10g) = 0.0411 W/kg Maximum value of SAR (interpolated) = 0.403 W/kg
0 dB = 0.204 W/kg = ‐6.90 dBW/kg

Test report no.: 1-0042/15-01-15-A
Page 211 of 223
Date: 9/11/2015
Test Lab: BlackBerry RTS DUT Name: BlackBerry Smartphone, Type: Sample, Serial: 1161462755
Configuration: Mobile Hot Spot MSL - 802.11a_n 5200 MHz - Slider Open Communication System: 802.11a/n (0); Communication System Band: UNII 1/2A/2C/3; Frequency: 5190 MHz, Communication System PAR: 0 dB; PMF: 1.12202e-005; Duty Cycle: 1:1 Medium Parameters used: f=5190 MHz; σ = 5.552 S/m; εr = 46.851; ρ = 1.000 g/cm3
Phantom section: Flat Section DASY Configuration:
Probe: EX3DV4 - SN3592; ConvF: (4.06,4.06,4.06); Calibrated: 11/10/2014; Sensor-Surface: 2 mm (Mechanical Surface Detection) Electronics: DAE4 Sn881; Calibrated: 1/13/2015 Phantom: SAM 2; Type: SAM 4.0; Serial: 1080 DASY52 52.8.8(1222); SEMCAD X Version 14.6.10 (7331)
Mobile Hot Spot MSL - 802.11a_n 5200 MHz - Slider Open/10mm Device Back - 802.11a-n_U-NII-1_chan38_Amb_Temp_23.4C_Liquid_Temp_22.3C/Area Scan (81x81x1): Interpolated grid: dx=1.000 mm, dy=1.000 mm Maximum value of SAR (interpolated) = 0.270 W/kg Mobile Hot Spot MSL - 802.11a_n 5200 MHz - Slider Open/10mm Device Back - 802.11a-n_U-NII-1_chan38_Amb_Temp_23.4C_Liquid_Temp_22.3C/Zoom Scan (36x36x61)/Cube 0: Interpolated grid: dx=0.800 mm, dy=0.800 mm, dz=0.400 mm Reference Value = 1.784 V/m; Power Drift = 0.00182 dB Averaged SAR: SAR(1g) = 0.133 W/kg; SAR(10g) = 0.0456 W/kg Maximum value of SAR (interpolated) = 0.473 W/kg
0 dB = 0.267 W/kg = ‐5.73 dBW/kg

Test report no.: 1-0042/15-01-15-A
Page 212 of 223
Date: 9/10/2015 Test Lab: BlackBerry RTS DUT Name: BlackBerry Smartphone, Type: Sample, Serial: 1161462755
Configuration: Body Worn MSL - 802.11a_n 5200 MHz Communication System: 802.11a/n (0); Communication System Band: UNII 1/2A/2C/3; Frequency: 5270 MHz, Communication System PAR: 0 dB; PMF: 1.12202e-005; Duty Cycle: 1:1 Medium Parameters used: f=5270 MHz; σ = 5.645 S/m; εr = 46.642; ρ = 1.000 g/cm3
Phantom section: Flat Section DASY Configuration:
Probe: EX3DV4 - SN3592; ConvF: (4.06,4.06,4.06); Calibrated: 11/10/2014; Sensor-Surface: 2 mm (Mechanical Surface Detection) Electronics: DAE4 Sn881; Calibrated: 1/13/2015 Phantom: SAM 2; Type: SAM 4.0; Serial: 1080 DASY52 52.8.8(1222); SEMCAD X Version 14.6.10 (7331)
Body Worn MSL - 802.11a_n 5200 MHz/15mm Device Back - 802.11a-n_U-NII-2A_chan62_Amb_Temp_23.6C_Liquid_Temp_22.2C/Area Scan (101x121x1): Interpolated grid: dx=1.000 mm, dy=1.000 mm Maximum value of SAR (interpolated) = 0.499 W/kg Body Worn MSL - 802.11a_n 5200 MHz/15mm Device Back - 802.11a-n_U-NII-2A_chan62_Amb_Temp_23.6C_Liquid_Temp_22.2C/Zoom Scan (41x41x61)/Cube 0: Interpolated grid: dx=0.800 mm, dy=0.800 mm, dz=0.400 mm Reference Value = 2.259 V/m; Power Drift = -0.050 dB Averaged SAR: SAR(1g) = 0.274 W/kg; SAR(10g) = 0.106 W/kg Maximum value of SAR (interpolated) = 0.999 W/kg
0 dB = 0.509 W/kg = ‐2.93 dBW/kg
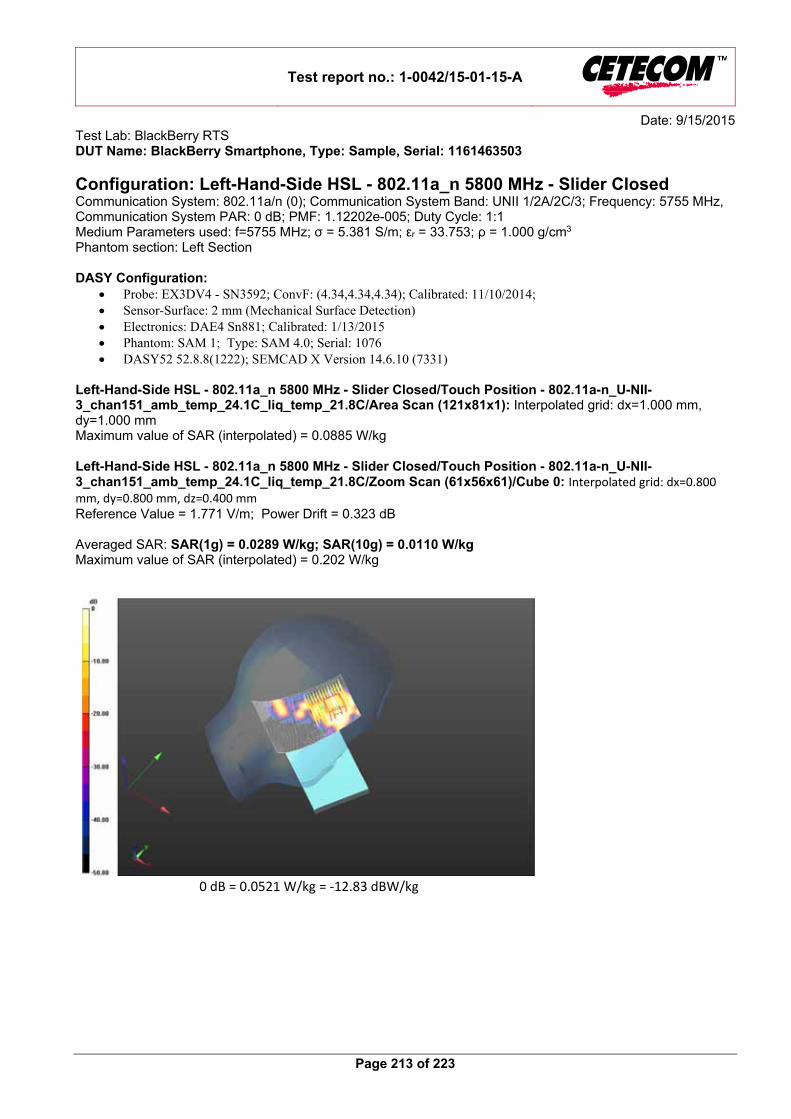
Test report no.: 1-0042/15-01-15-A
Page 213 of 223
Date: 9/15/2015 Test Lab: BlackBerry RTS DUT Name: BlackBerry Smartphone, Type: Sample, Serial: 1161463503
Configuration: Left-Hand-Side HSL - 802.11a_n 5800 MHz - Slider Closed Communication System: 802.11a/n (0); Communication System Band: UNII 1/2A/2C/3; Frequency: 5755 MHz, Communication System PAR: 0 dB; PMF: 1.12202e-005; Duty Cycle: 1:1 Medium Parameters used: f=5755 MHz; σ = 5.381 S/m; εr = 33.753; ρ = 1.000 g/cm3
Phantom section: Left Section DASY Configuration:
Probe: EX3DV4 - SN3592; ConvF: (4.34,4.34,4.34); Calibrated: 11/10/2014; Sensor-Surface: 2 mm (Mechanical Surface Detection) Electronics: DAE4 Sn881; Calibrated: 1/13/2015 Phantom: SAM 1; Type: SAM 4.0; Serial: 1076 DASY52 52.8.8(1222); SEMCAD X Version 14.6.10 (7331)
Left-Hand-Side HSL - 802.11a_n 5800 MHz - Slider Closed/Touch Position - 802.11a-n_U-NII-3_chan151_amb_temp_24.1C_liq_temp_21.8C/Area Scan (121x81x1): Interpolated grid: dx=1.000 mm, dy=1.000 mm Maximum value of SAR (interpolated) = 0.0885 W/kg Left-Hand-Side HSL - 802.11a_n 5800 MHz - Slider Closed/Touch Position - 802.11a-n_U-NII-3_chan151_amb_temp_24.1C_liq_temp_21.8C/Zoom Scan (61x56x61)/Cube 0: Interpolated grid: dx=0.800 mm, dy=0.800 mm, dz=0.400 mm Reference Value = 1.771 V/m; Power Drift = 0.323 dB Averaged SAR: SAR(1g) = 0.0289 W/kg; SAR(10g) = 0.0110 W/kg Maximum value of SAR (interpolated) = 0.202 W/kg
0 dB = 0.0521 W/kg = ‐12.83 dBW/kg

Test report no.: 1-0042/15-01-15-A
Page 214 of 223
Date: 9/11/2015 Test Lab: BlackBerry RTS DUT Name: BlackBerry Smartphone, Type: Sample, Serial: 1161462755
Configuration: Mobile Hot Spot MSL - 802.11a_n 5800 MHz - Slider Open Communication System: 802.11a/n (0); Communication System Band: UNII 1/2A/2C/3; Frequency: 5755 MHz, Communication System PAR: 0 dB; PMF: 1.12202e-005; Duty Cycle: 1:1 Medium Parameters used: f=5755 MHz; σ = 6.216 S/m; εr = 46.419; ρ = 1.000 g/cm3
Phantom section: Flat Section DASY Configuration:
Probe: EX3DV4 - SN3592; ConvF: (3.81,3.81,3.81); Calibrated: 11/10/2014; Sensor-Surface: 2 mm (Mechanical Surface Detection) Electronics: DAE4 Sn881; Calibrated: 1/13/2015 Phantom: SAM 2; Type: SAM 4.0; Serial: 1080 DASY52 52.8.8(1222); SEMCAD X Version 14.6.10 (7331)
Mobile Hot Spot MSL - 802.11a_n 5800 MHz - Slider Open/10mm Device Back - 802.11a-n_U-NII-3_chan159_Amb_Temp_23.7C_Liquid_Temp_22.5C/Area Scan (101x101x1): Interpolated grid: dx=1.000 mm, dy=1.000 mm Maximum value of SAR (interpolated) = 0.135 W/kg Mobile Hot Spot MSL - 802.11a_n 5800 MHz - Slider Open/10mm Device Back - 802.11a-n_U-NII-3_chan159_Amb_Temp_23.7C_Liquid_Temp_22.5C/Zoom Scan (41x41x61)/Cube 0: Interpolated grid: dx=0.800 mm, dy=0.800 mm, dz=0.400 mm Reference Value = 1.987 V/m; Power Drift = 0.288 dB Averaged SAR: SAR(1g) = 0.0752 W/kg; SAR(10g) = 0.0293 W/kg Maximum value of SAR (interpolated) = 0.285 W/kg
0 dB = 0.149 W/kg = ‐8.27 dBW/kg

Test report no.: 1-0042/15-01-15-A
Page 215 of 223
Date: 9/11/2015
Test Lab: BlackBerry RTS DUT Name: BlackBerry Smartphone, Type: Sample, Serial: 1161462755
Configuration: Body Worn MSL - 802.11a_n 5200 MHz Communication System: 802.11a/n (0); Communication System Band: UNII 1/2A/2C/3; Frequency: 5270 MHz, Communication System PAR: 0 dB; PMF: 1.12202e-005; Duty Cycle: 1:1 Medium Parameters used: f=5270 MHz; σ = 5.645 S/m; εr = 46.642; ρ = 1.000 g/cm3
Phantom section: Flat Section DASY Configuration:
Probe: EX3DV4 - SN3592; ConvF: (4.06,4.06,4.06); Calibrated: 11/10/2014; Sensor-Surface: 2 mm (Mechanical Surface Detection) Electronics: DAE4 Sn881; Calibrated: 1/13/2015 Phantom: SAM 2; Type: SAM 4.0; Serial: 1080 DASY52 52.8.8(1222); SEMCAD X Version 14.6.10 (7331)
Body Worn MSL - 802.11a_n 5200 MHz/15mm Device Back - 802.11a-n_U-NII-2A_chan54_Amb_Temp_23.5C_Liquid_Temp_21.0C/Area Scan (101x101x1): Interpolated grid: dx=1.000 mm, dy=1.000 mm Maximum value of SAR (interpolated) = 0.141 W/kg Body Worn MSL - 802.11a_n 5200 MHz/15mm Device Back - 802.11a-n_U-NII-2A_chan54_Amb_Temp_23.5C_Liquid_Temp_21.0C/Zoom Scan (41x41x61)/Cube 0: Interpolated grid: dx=0.800 mm, dy=0.800 mm, dz=0.400 mm Reference Value = 1.754 V/m; Power Drift = 0.225 dB Averaged SAR: SAR(1g) = 0.0874 W/kg; SAR(10g) = 0.0407 W/kg Maximum value of SAR (interpolated) = 0.359 W/kg
0 dB = 0.146 W/kg = ‐8.36 dBW/kg

Test report no.: 1-0042/15-01-15-A
Page 216 of 223
Annex B.14: Liquid depth
Photo 1: Liquid depth 750 MHz head simulating liquid
Photo 2: Liquid depth 750 MHz body simulating liquid

Test report no.: 1-0042/15-01-15-A
Page 217 of 223
Photo 3: Liquid depth 850 MHz head simulating liquid
Photo 4: Liquid depth 850 MHz body simulating liquid

Test report no.: 1-0042/15-01-15-A
Page 218 of 223
Photo 5: Liquid depth 1750MHz head simulating liquid
Photo 6: Liquid depth 1750 MHz body simulating liquid

Test report no.: 1-0042/15-01-15-A
Page 219 of 223
Photo 7: Liquid depth 1900MHz head simulating liquid
Photo 8: Liquid depth 1900 MHz body simulating liquid

Test report no.: 1-0042/15-01-15-A
Page 220 of 223
Photo 9: Liquid depth 2450MHz head simulating liquid
Photo 10: Liquid depth 2450 MHz body simulating liquid

Test report no.: 1-0042/15-01-15-A
Page 221 of 223
Photo 11: Liquid depth 5 GHz head simulating liquid
Photo 12: Liquid depth 5 GHz body simulating liquid

Test report no.: 1-0042/15-01-15-A
Page 222 of 223
Annex C: Photo documentation
Photo documentation is described in the additional document:
Appendix to test report no. 1-0042/15-01-15-A-A Photo documentation
Annex D: Calibration parameters
Calibration parameters are described in the additional document:
Appendix to test report no. 1-0042/15-01-15-A-A Calibration data, Phantom certificate and detail information of the DASY5 System

Test report no.: 1-0042/15-01-15-A
Page 223 of 223
Annex E: Document History
Version Applied Changes Date of Release
Initial Release 2015-09-29
-A Compressed file size to 6Mb 2015-10-16
Annex F: Further Information
Glossary BW - Bandwidth DTS - Distributed Transmission System DUT - Device under Test EUT - Equipment under Test FCC - Federal Communication Commission FCC ID - Company Identifier at FCC HW - Hardware IC - Industry Canada Inv. No. - Inventory number LTE - Long Term Evolution N/A - not applicable PCE - Personal Consumption Expenditure OET - Office of Engineering and Technology RB - resource block(s) SAR - Specific Absorption Rate S/N - Serial Number SPLSRi - SAR-to-(peak-locations spacing) ratio SW - Software UNII - Unlicensed National Information Infrastructure