test analysis report - questionmark · title: test analysis report author: brian mcnamara created...
TRANSCRIPT

Copyright © 1995-2007 Questionmark Corporation and/or Questionmark Computing Limited, known collectively as Questionmark. All rights reserved. Questionmark is a registered trademark of Questionmark Computing Limited. All other trademarks are acknowledged.
Test Analysis Report
Detailed information regarding the statistical performance of an test

Slide 2 Copyright © 1995-2007 Questionmark Corporation and/or Questionmark Computing Limited, known collectively as Questionmark. All rights reserved. Questionmark is a registered trademark of Questionmark Computing Limited. All other trademarks are acknowledged.
OverviewDetailed information regarding the statistical performance of an testReport Sections
First section presents information in a tabular formatStats including mean, standard deviation and reliability
Second section: Distribution of tests scores using a frequency distribution table
lists all scores obtained by examineeshistogram graphically displays the range of scores

Slide 3 Copyright © 1995-2007 Questionmark Corporation and/or Questionmark Computing Limited, known collectively as Questionmark. All rights reserved. Questionmark is a registered trademark of Questionmark Computing Limited. All other trademarks are acknowledged.
Test Analysis ReportFirst section presents information in a tabular format
Stats including mean, standard deviation and reliability

Slide 4 Copyright © 1995-2007 Questionmark Corporation and/or Questionmark Computing Limited, known collectively as Questionmark. All rights reserved. Questionmark is a registered trademark of Questionmark Computing Limited. All other trademarks are acknowledged.
Test Analysis ReportSecond section: Distribution of tests scores using a frequency distribution table
lists all scores obtained by examineeshistogram graphically displays the range of scores

Slide 5 Copyright © 1995-2007 Questionmark Corporation and/or Questionmark Computing Limited, known collectively as Questionmark. All rights reserved. Questionmark is a registered trademark of Questionmark Computing Limited. All other trademarks are acknowledged.
Report Management and Distribution
Distribute via Browser, PDF, Word, Excel, Email, or PrintMy Reports

Slide 6 Copyright © 1995-2007 Questionmark Corporation and/or Questionmark Computing Limited, known collectively as Questionmark. All rights reserved. Questionmark is a registered trademark of Questionmark Computing Limited. All other trademarks are acknowledged.
Internal Consistency
Questionmark uses Cronbach’s Alpha Test Reliability Reason it’s the gold standard:
Highly documented and very well researched (60+ years)Can be used with a wide variety of question types (partial credit and right/wrong)Most widely used method in high and medium stakes

Slide 7 Copyright © 1995-2007 Questionmark Corporation and/or Questionmark Computing Limited, known collectively as Questionmark. All rights reserved. Questionmark is a registered trademark of Questionmark Computing Limited. All other trademarks are acknowledged.
Cronbach’s AlphaInternal consistency test reliability: A measure of how well the assessment questions relate to one another to measure the same topicCrucial information for legal defensibility – is the test reliably measuring what is was designed to measure?Speaks to the quality of assessment questions: Are they of high statistical quality?
)(1 2
22
T
pT
SSS
kk ∑−−

Slide 8 Copyright © 1995-2007 Questionmark Corporation and/or Questionmark Computing Limited, known collectively as Questionmark. All rights reserved. Questionmark is a registered trademark of Questionmark Computing Limited. All other trademarks are acknowledged.
Other MeasuresSkewModeKurtosisMean (arithmetic)MedianModeStandard DeviationVarianceStandard Error of measurementStandard Error of the Mean

Slide 9 Copyright © 1995-2007 Questionmark Corporation and/or Questionmark Computing Limited, known collectively as Questionmark. All rights reserved. Questionmark is a registered trademark of Questionmark Computing Limited. All other trademarks are acknowledged.
Skew
A measure of the symmetry of the distribution of scores
are scores are “pushed” or skewed to one side or the other?Ranges from about -2 to +2
0
2
4
6
8
10
12
14
16
18
20
# of
participants
0% 10% 20% 30% 40% 50% 60% 70% 80% 90% 100%Participant scores
Positive skew
0
2
4
6
8
10
12
14
16
18
20
# of
participants
0% 10% 20% 30% 40% 50% 60% 70% 80% 90% 100%
Participant scores
Negative skew
0
2
4
6
8
10
12
14
16
18
20
# of
participants
0% 20% 40% 60% 80% 100%
Participant scores
Normal distribution (no skew)
Slide 10 Copyright © 1995-2007 Questionmark Corporation and/or Questionmark Computing Limited, known collectively as Questionmark. All rights reserved. Questionmark is a registered trademark of Questionmark Computing Limited. All other trademarks are acknowledged.
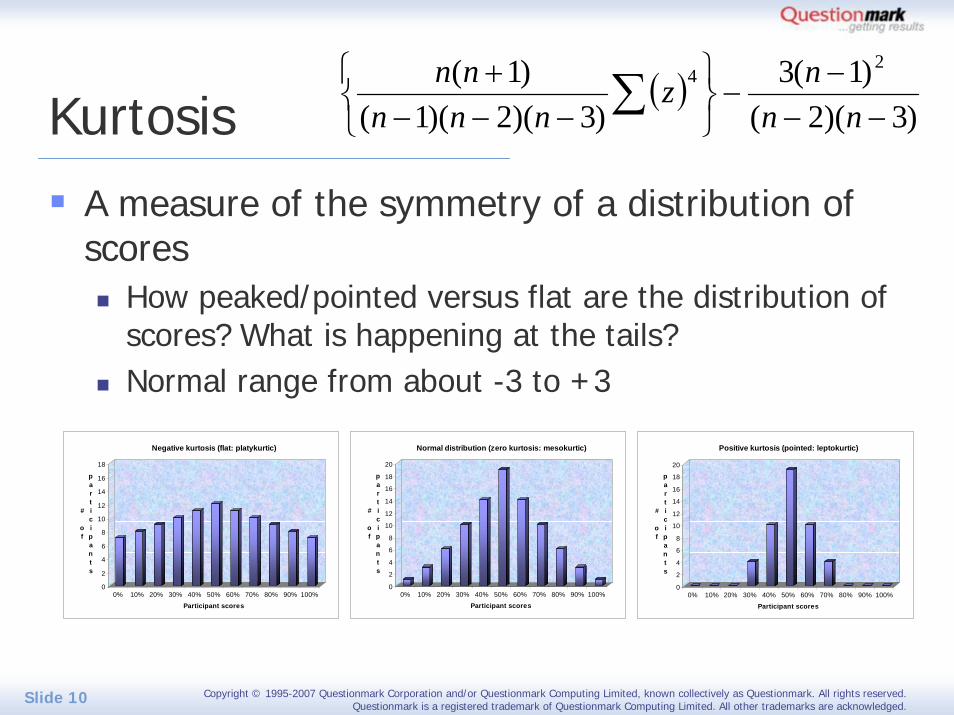
KurtosisA measure of the symmetry of a distribution of scores
How peaked/pointed versus flat are the distribution of scores? What is happening at the tails? Normal range from about -3 to +3
0
2
4
6
8
10
12
14
16
18
20
# of
participants
0% 10% 20% 30% 40% 50% 60% 70% 80% 90% 100%
Participant scores
Normal distribution (zero kurtosis: mesokurtic)
0
2
4
6
8
10
12
14
16
18
# of
participants
0% 10% 20% 30% 40% 50% 60% 70% 80% 90% 100%
Participant scores
Negative kurtosis (flat: platykurtic)
0
2
4
6
8
10
12
14
16
18
20
# of
participants
0% 10% 20% 30% 40% 50% 60% 70% 80% 90% 100%
Participant scores
Positive kurtosis (pointed: leptokurtic)
( ))3)(2(
)1(3)3)(2)(1(
)1( 24
−−−
−⎭⎬⎫
⎩⎨⎧
−−−+ ∑ nn
nznnn
nn
Slide 11 Copyright © 1995-2007 Questionmark Corporation and/or Questionmark Computing Limited, known collectively as Questionmark. All rights reserved. Questionmark is a registered trademark of Questionmark Computing Limited. All other trademarks are acknowledged.
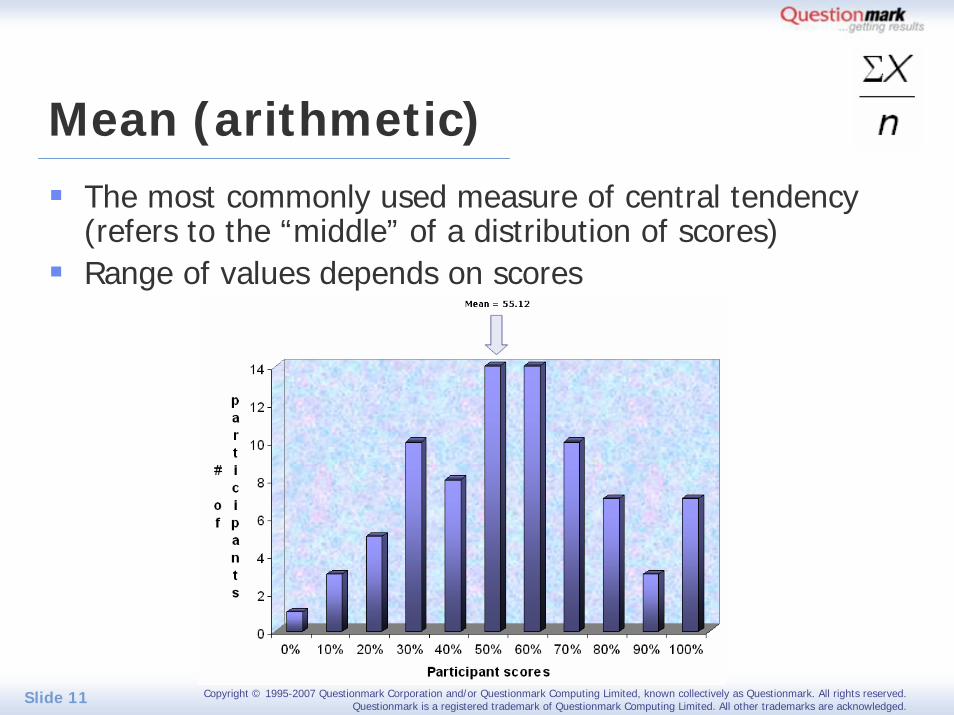
Mean (arithmetic)The most commonly used measure of central tendency (refers to the “middle” of a distribution of scores)Range of values depends on scores
Slide 12 Copyright © 1995-2007 Questionmark Corporation and/or Questionmark Computing Limited, known collectively as Questionmark. All rights reserved. Questionmark is a registered trademark of Questionmark Computing Limited. All other trademarks are acknowledged.
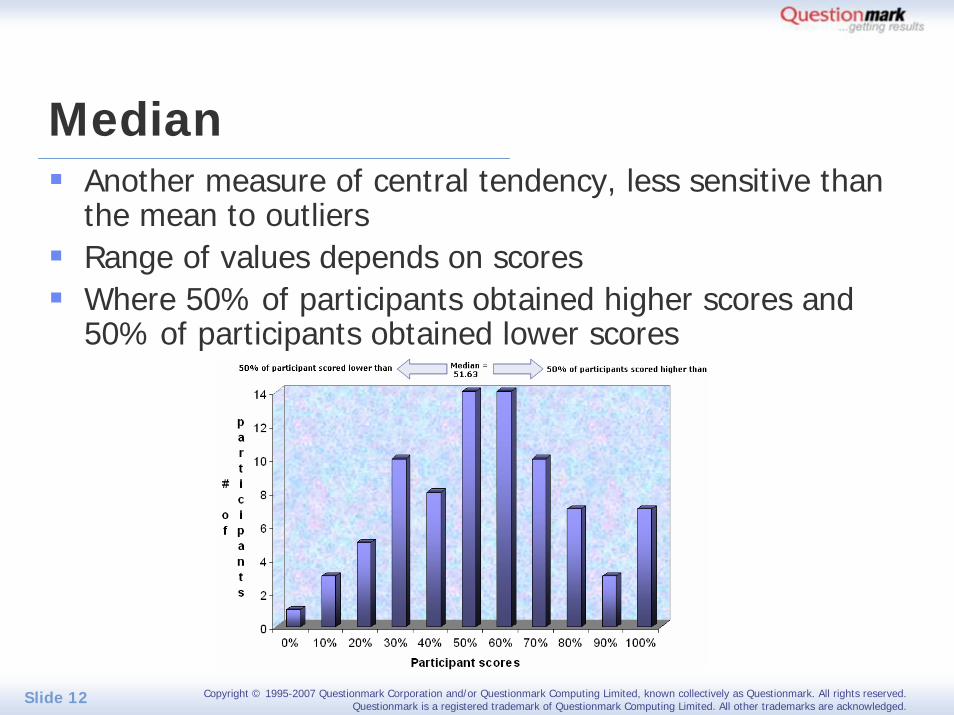
MedianAnother measure of central tendency, less sensitive than the mean to outliersRange of values depends on scoresWhere 50% of participants obtained higher scores and 50% of participants obtained lower scores

Slide 13 Copyright © 1995-2007 Questionmark Corporation and/or Questionmark Computing Limited, known collectively as Questionmark. All rights reserved. Questionmark is a registered trademark of Questionmark Computing Limited. All other trademarks are acknowledged.
ModeA third measure of central tendency, used a great deal in survey analysisThe most common score in a distribution of scoresRange of values depends on scores
34% 43% 56% 56% 56% 63% 67% 76% 88%
Mode = 56%
Slide 14 Copyright © 1995-2007 Questionmark Corporation and/or Questionmark Computing Limited, known collectively as Questionmark. All rights reserved. Questionmark is a registered trademark of Questionmark Computing Limited. All other trademarks are acknowledged.
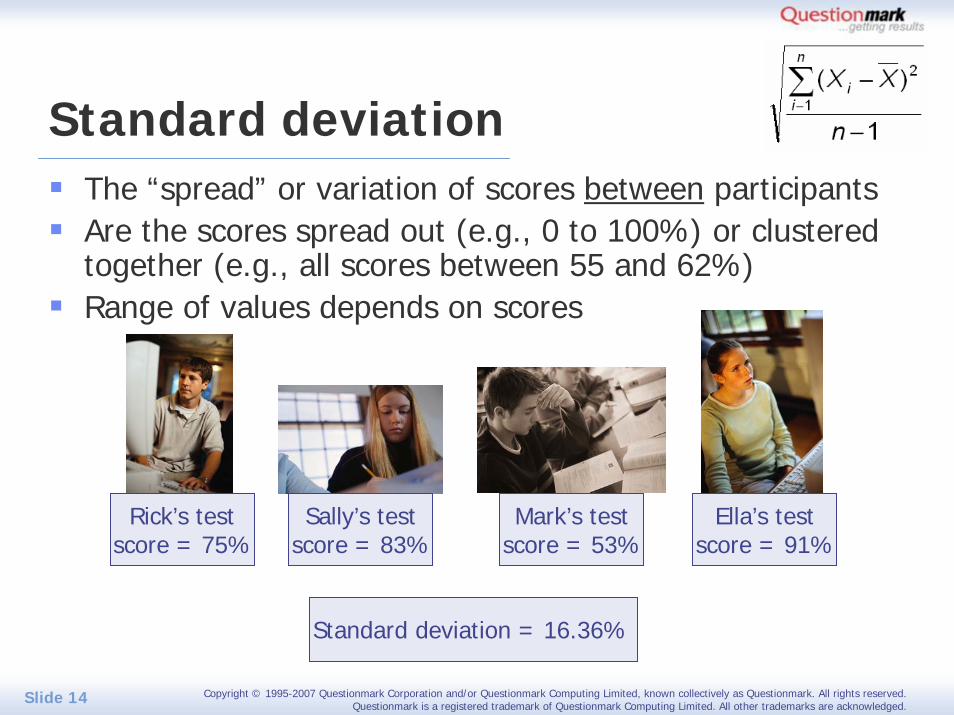
Standard deviationThe “spread” or variation of scores between participantsAre the scores spread out (e.g., 0 to 100%) or clustered together (e.g., all scores between 55 and 62%)Range of values depends on scores
Rick’s testscore = 75%
Sally’s testscore = 83%
Mark’s testscore = 53%
Ella’s testscore = 91%
Standard deviation = 16.36%

Slide 15 Copyright © 1995-2007 Questionmark Corporation and/or Questionmark Computing Limited, known collectively as Questionmark. All rights reserved. Questionmark is a registered trademark of Questionmark Computing Limited. All other trademarks are acknowledged.
Variance
Another measure of variationThe first step in calculating a standard deviation: The standard deviation is the square root of the varianceRange of values depends on scoresUsed in some advanced calculations (e.g., Analysis of variance: ANOVA, Multiple analysis of variance: MANOVA)

Slide 16 Copyright © 1995-2007 Questionmark Corporation and/or Questionmark Computing Limited, known collectively as Questionmark. All rights reserved. Questionmark is a registered trademark of Questionmark Computing Limited. All other trademarks are acknowledged.
Standard Error of measurement
Theoretical test score = 66.4%
Theoretical test score = 63.7%
Theoretical test score = 67.1%
Theoretical test score = 65.8%
Theoretical test score = 67.5%
Product knowledge test
Theoreticalstandard
deviation =1.26%
± 1.26% of error
surroundingRick’s observed
scoreRick’s observedscore = 66.1%
observed test score = theoretical true score + error

Slide 17 Copyright © 1995-2007 Questionmark Corporation and/or Questionmark Computing Limited, known collectively as Questionmark. All rights reserved. Questionmark is a registered trademark of Questionmark Computing Limited. All other trademarks are acknowledged.
Standard Error of the Mean
0
5
10
15
20
25
30
35
# of
participants
0% 10% 20% 30% 40% 50% 60% 70% 80% 90% 100%
Participant scores
Sample (153 participants)
0
2000
4000
6000
8000
10000
12000
14000
16000
18000
20000
# of
participants
0% 10% 20% 30% 40% 50% 60% 70% 80% 90% 100%
Participant scores
Population (87,000 participants)
Sample mean = 56.78%Sample standard deviation = 15.21%
Standard error of mean = 1.23%___________________________
within plus or minus 1 standard error of the mean value, 68 times out of 100,
the true population mean will reside
Typically the population informationis not known, but if you could see
the information…
Population “true” mean = 57. 81%

Copyright © 1995-2007 Questionmark Corporation and/or Questionmark Computing Limited, known collectively as Questionmark. All rights reserved. Questionmark is a registered trademark of Questionmark Computing Limited. All other trademarks are acknowledged.
More information:
www.questionmark.com