tesla motors, inc.(tsla) - jefferies · respondents considering alternative fuel vehicles and 7%...
TRANSCRIPT
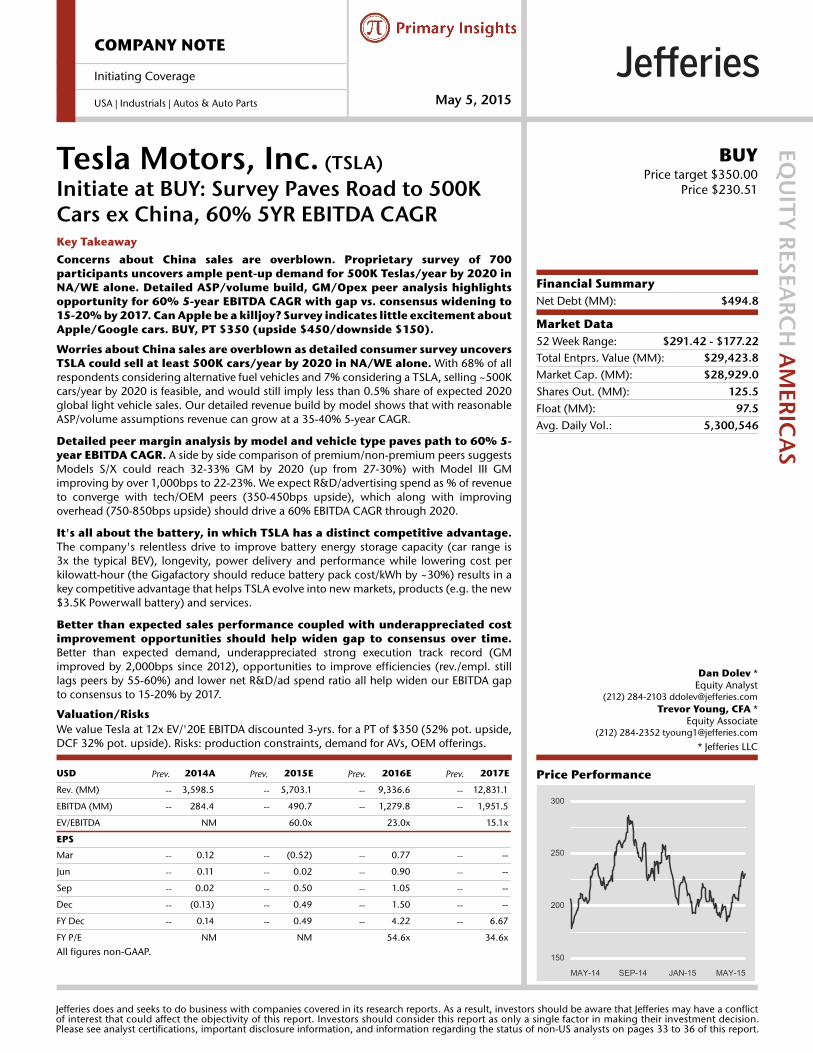
USD Prev. 2014A Prev. 2015E Prev. 2016E Prev. 2017E
Rev. (MM) -- 3,598.5 -- 5,703.1 -- 9,336.6 -- 12,831.1
EBITDA (MM) -- 284.4 -- 490.7 -- 1,279.8 -- 1,951.5
EV/EBITDA NM 60.0x 23.0x 15.1x
EPS
Mar -- 0.12 -- (0.52) -- 0.77 -- --
Jun -- 0.11 -- 0.02 -- 0.90 -- --
Sep -- 0.02 -- 0.50 -- 1.05 -- --
Dec -- (0.13) -- 0.49 -- 1.50 -- --
FY Dec -- 0.14 -- 0.49 -- 4.22 -- 6.67
FY P/E NM NM 54.6x 34.6x
All figures non-GAAP.
Price Performance
MAY-14 SEP-14 JAN-15 MAY-15
300
250
200
150
COMPANY NOTE
Initiating Coverage
USA | Industrials | Autos & Auto Parts May 5, 2015
Tesla Motors, Inc. (TSLA)Initiate at BUY: Survey Paves Road to 500KCars ex China, 60% 5YR EBITDA CAGR
EQU
ITY R
ESEARC
H A
MERIC
AS
BUYPrice target $350.00
Price $230.51
Financial SummaryNet Debt (MM): $494.8
Market Data52 Week Range: $291.42 - $177.22Total Entprs. Value (MM): $29,423.8Market Cap. (MM): $28,929.0Shares Out. (MM): 125.5Float (MM): 97.5Avg. Daily Vol.: 5,300,546
Dan Dolev *Equity Analyst
(212) 284-2103 [email protected] Young, CFA *
Equity Associate(212) 284-2352 [email protected]
* Jefferies LLC
Key TakeawayConcerns about China sales are overblown. Proprietary survey of 700participants uncovers ample pent-up demand for 500K Teslas/year by 2020 inNA/WE alone. Detailed ASP/volume build, GM/Opex peer analysis highlightsopportunity for 60% 5-year EBITDA CAGR with gap vs. consensus widening to15-20% by 2017. Can Apple be a killjoy? Survey indicates little excitement aboutApple/Google cars. BUY, PT $350 (upside $450/downside $150).
Worries about China sales are overblown as detailed consumer survey uncoversTSLA could sell at least 500K cars/year by 2020 in NA/WE alone. With 68% of allrespondents considering alternative fuel vehicles and 7% considering a TSLA, selling ~500Kcars/year by 2020 is feasible, and would still imply less than 0.5% share of expected 2020global light vehicle sales. Our detailed revenue build by model shows that with reasonableASP/volume assumptions revenue can grow at a 35-40% 5-year CAGR.
Detailed peer margin analysis by model and vehicle type paves path to 60% 5-year EBITDA CAGR. A side by side comparison of premium/non-premium peers suggestsModels S/X could reach 32-33% GM by 2020 (up from 27-30%) with Model III GMimproving by over 1,000bps to 22-23%. We expect R&D/advertising spend as % of revenueto converge with tech/OEM peers (350-450bps upside), which along with improvingoverhead (750-850bps upside) should drive a 60% EBITDA CAGR through 2020.
It's all about the battery, in which TSLA has a distinct competitive advantage.The company's relentless drive to improve battery energy storage capacity (car range is3x the typical BEV), longevity, power delivery and performance while lowering cost perkilowatt-hour (the Gigafactory should reduce battery pack cost/kWh by ~30%) results in akey competitive advantage that helps TSLA evolve into new markets, products (e.g. the new$3.5K Powerwall battery) and services.
Better than expected sales performance coupled with underappreciated costimprovement opportunities should help widen gap to consensus over time.Better than expected demand, underappreciated strong execution track record (GMimproved by 2,000bps since 2012), opportunities to improve efficiencies (rev./empl. stilllags peers by 55-60%) and lower net R&D/ad spend ratio all help widen our EBITDA gapto consensus to 15-20% by 2017.
Valuation/RisksWe value Tesla at 12x EV/'20E EBITDA discounted 3-yrs. for a PT of $350 (52% pot. upside,DCF 32% pot. upside). Risks: production constraints, demand for AVs, OEM offerings.
Jefferies does and seeks to do business with companies covered in its research reports. As a result, investors should be aware that Jefferies may have a conflictof interest that could affect the objectivity of this report. Investors should consider this report as only a single factor in making their investment decision.Please see analyst certifications, important disclosure information, and information regarding the status of non-US analysts on pages 33 to 36 of this report.
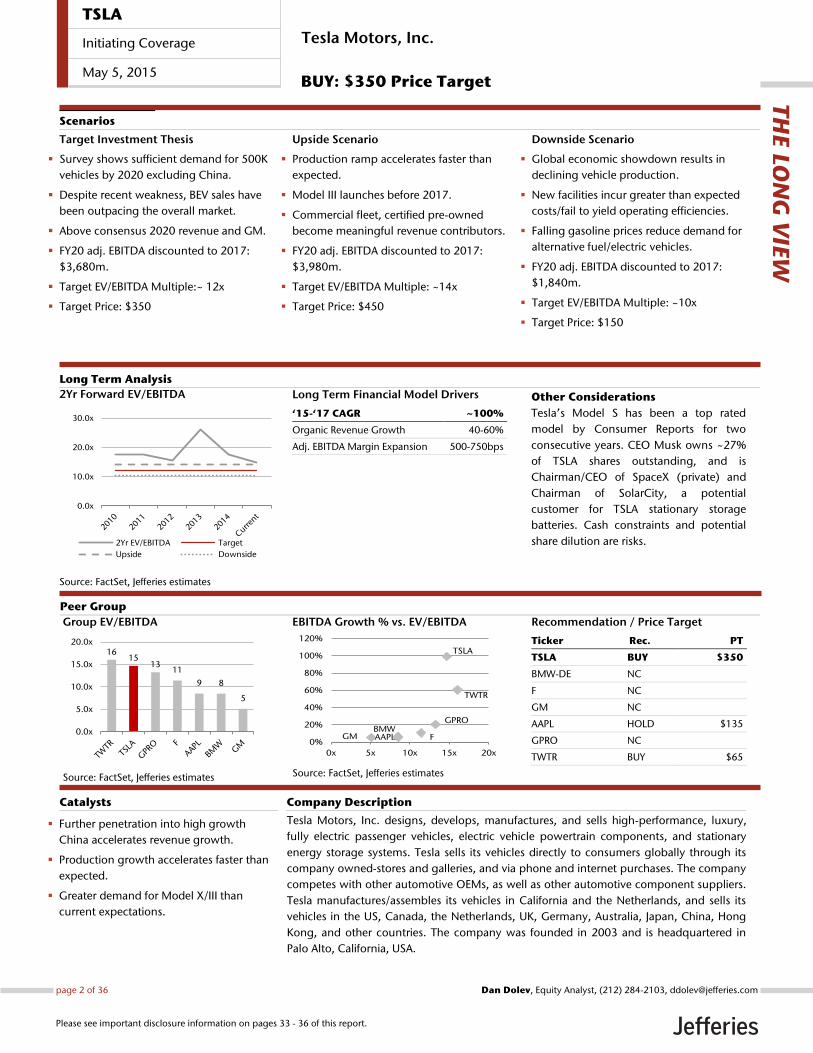
Long Term Financial Model Drivers
‘15-‘17 CAGR ~100%
Organic Revenue Growth 40-60%
Adj. EBITDA Margin Expansion 500-750bps
Other Considerations
Tesla’s Model S has been a top rated
model by Consumer Reports for two
consecutive years. CEO Musk owns ~27%
of TSLA shares outstanding, and is
Chairman/CEO of SpaceX (private) and
Chairman of SolarCity, a potential
customer for TSLA stationary storage
batteries. Cash constraints and potential
share dilution are risks.
2Yr Forward EV/EBITDA
Source: FactSet, Jefferies estimates
0.0x
10.0x
20.0x
30.0x
2Yr EV/EBITDA Target
Upside Downside
Tesla Motors, Inc. designs, develops, manufactures, and sells high-performance, luxury,
fully electric passenger vehicles, electric vehicle powertrain components, and stationary
energy storage systems. Tesla sells its vehicles directly to consumers globally through its
company owned-stores and galleries, and via phone and internet purchases. The company
competes with other automotive OEMs, as well as other automotive component suppliers.
Tesla manufactures/assembles its vehicles in California and the Netherlands, and sells its
vehicles in the US, Canada, the Netherlands, UK, Germany, Australia, Japan, China, Hong
Kong, and other countries. The company was founded in 2003 and is headquartered in
Palo Alto, California, USA.
Further penetration into high growth
China accelerates revenue growth.
Production growth accelerates faster than
expected.
Greater demand for Model X/III than
current expectations.
Catalysts
Target Investment Thesis
Survey shows sufficient demand for 500K
vehicles by 2020 excluding China.
Despite recent weakness, BEV sales have
been outpacing the overall market.
Above consensus 2020 revenue and GM.
FY20 adj. EBITDA discounted to 2017:
$3,680m.
Target EV/EBITDA Multiple:~ 12x
Target Price: $350
Upside Scenario
Production ramp accelerates faster than
expected.
Model III launches before 2017.
Commercial fleet, certified pre-owned
become meaningful revenue contributors.
FY20 adj. EBITDA discounted to 2017:
$3,980m.
Target EV/EBITDA Multiple: ~14x
Target Price: $450
Downside Scenario
Global economic showdown results in
declining vehicle production.
New facilities incur greater than expected
costs/fail to yield operating efficiencies.
Falling gasoline prices reduce demand for
alternative fuel/electric vehicles.
FY20 adj. EBITDA discounted to 2017:
$1,840m.
Target EV/EBITDA Multiple: ~10x
Target Price: $150
Long Term Analysis
Scenarios
Group EV/EBITDA
Source: FactSet, Jefferies estimates
1615
1311
9 8
5
0.0x
5.0x
10.0x
15.0x
20.0x
EBITDA Growth % vs. EV/EBITDA
Source: FactSet, Jefferies estimates
TWTR
TSLA
GPRO
FBMWAAPLGM
0%
20%
40%
60%
80%
100%
120%
0x 5x 10x 15x 20x
Recommendation / Price Target
Ticker Rec. PT
TSLA BUY $350
BMW-DE NC
F NC
GM NC
AAPL HOLD $135
GPRO NC
TWTR BUY $65
Company Description
TH
E LO
NG
VIE
W
Peer Group
Tesla Motors, Inc.
BUY: $350 Price Target
TSLA
Initiating Coverage
May 5, 2015
page 2 of 36 , Equity Analyst, (212) 284-2103, [email protected] Dolev
Please see important disclosure information on pages 33 - 36 of this report.
Executive Summary Worries about China sales are overblown as detailed consumer survey
uncovers TSLA could sell at least 500K cars/year by 2020 in NA/WE alone.
With 68% of all respondents considering alternative fuel vehicles and 7% considering a
TSLA, selling ~500K cars/year by 2020 is feasible and even conservative given an
aggressive ~80% haircut to NA/WE 2020E TAM of ~35m vehicles. Our detailed revenue
build by model shows that with reasonable ASP/volume assumptions revenue can grow
at a 35-40% 5-year CAGR.
Detailed peer margin analysis by model and vehicle type paves path to 60%
5-year EBITDA CAGR. A side by side comparison of premium/non-premium peers
suggests Models S/X could reach 32-33% GM by 2020 (up from 27-30%) with Model III
GM improving by over 1,000bps to 22-23%. We expect R&D/advertising spend as % of
revenue to converge with tech/OEM peers (350-450bps upside), which along with
improving overhead (750-850bps upside) should drive a 60% EBITDA CAGR through
2020.
It's all about the battery, in which TSLA has a distinct competitive advantage.
The company's relentless drive to improve battery energy storage capacity (car range is
3x the typical BEV), longevity, power delivery and performance while lowering cost per
kilowatt-hour (the Gigafactory should reduce battery pack cost/kWh by ~30%) results in a
key competitive advantage that helps TSLA evolve into new markets, products (e.g. the
new $3.5K Powerwall battery) and services.
Better than expected sales performance coupled with underappreciated cost
improvement opportunities should help widen gap to consensus over time.
Better than expected demand, underappreciated strong execution track record (GM
improved by 2,000bps since 2012), opportunities to improve efficiencies (rev./empl. still
lags peers by 55-60%) and lower net R&D/ad spend ratio all help widen our EBITDA gap
to consensus to 15-20% by 2017.
Growing BEV penetration suggests 500K/year is still conservative. TSLA
accounts for an estimated 25% of current US BEV sales (65K). Assuming the BEV category
slows to a 65% CAGR (vs. 85% between ’11-’14, ~4x faster than overall AVs), implies
~800K BEVs by 2020, so that simply maintaining TSLA’s current share implies ~215K
Teslas in North America, or over 430K including Western Europe. Plus, our estimate of
~500K Teslas by 2020 would still imply less than 0.5% share of expected global light
vehicle sales by 2020.
Valuation We value Tesla at ~12x EV/'20E EBITDA discounted three years for a PT of $350 (+52%
potential upside, DCF +32% potential upside).
Risks Key downside risks to our thesis include: 1) Tesla unable to ramp production/meet
timelines for new models, 2) legal issues selling cars directly in many US states persist, 3)
large OEM competitors develop comparable BEV vehicles with similar performance
attributes, 4) global economic slowdown results in declining vehicle demand, 5) falling
gasoline prices reduce demand for alternative fuel/electric vehicles, and 6) cash
constraints from sizeable CapEx demands result in potential share dilution.
TSLA
Initiating Coverage
May 5, 2015
page 3 of 36 , Equity Analyst, (212) 284-2103, [email protected] Dolev
Please see important disclosure information on pages 33 - 36 of this report.
TSLA Can Achieve Its 2020 Targets, even ex. China
Survey shows ample demand for 500K cars/year in NA and Western Europe
Tesla is a leader in the battery electric vehicle (BEV) automotive segment, having
demonstrated sizeable demand for luxury electric vehicles. For example, its Model S
deliveries grew from 2,636 in 2012 to 31,655 in 2014 (+247% CAGR). Nevertheless, with
an average selling price ~3x the national average (~$100K vs. ~$31K), “range anxiety”
concerns (with just ~380 Supercharger stations and a vehicle range of 240-270 miles,
owners have to plan trips carefully), and early challenges in China, many investors and
analysts have raised concerns about Tesla’s ability to produce (and sell) its target of 500K
cars per annum by 2020.
Selling 500K cars per year by 2020 is undoubtedly a lofty goal, as it would require
deliveries to grow nearly +1,500% (or a +58% CAGR) including the roll-out of its luxury
SUV (the Model X is slated for 2H15) as well as an even larger launch of a lower priced
sedan in 2017 (the Model III, with an estimated base price of $30-35K and an estimated
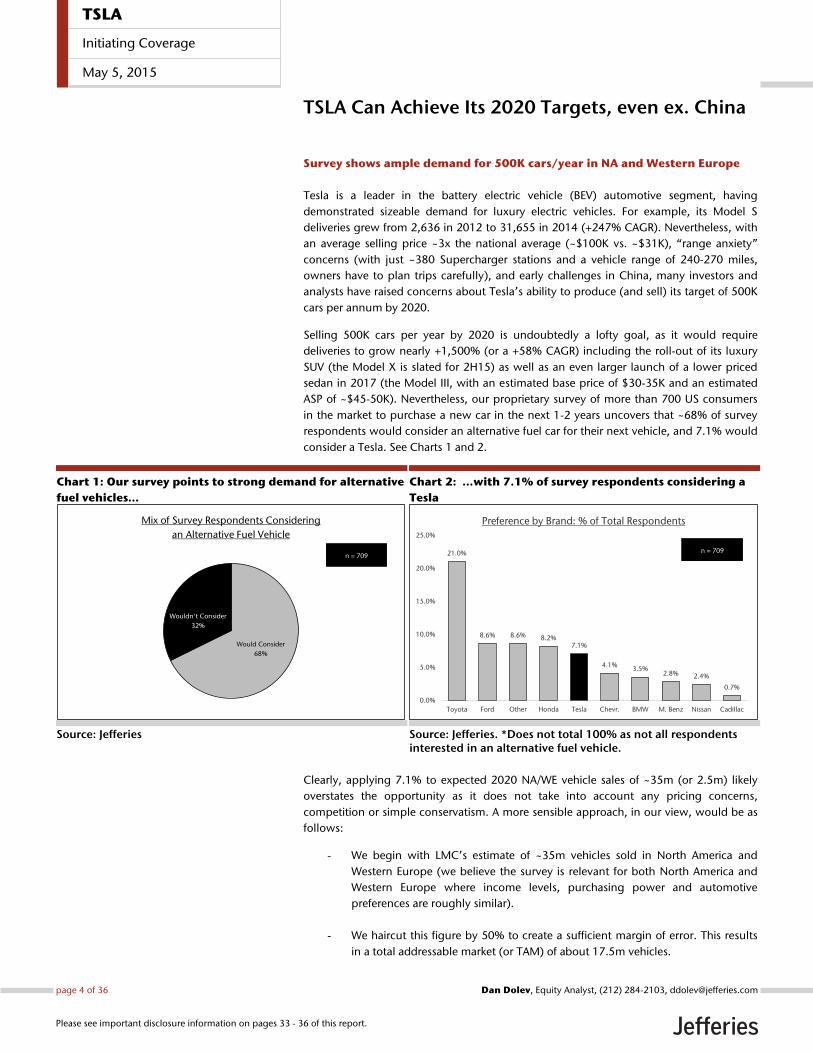
ASP of ~$45-50K). Nevertheless, our proprietary survey of more than 700 US consumers
in the market to purchase a new car in the next 1-2 years uncovers that ~68% of survey
respondents would consider an alternative fuel car for their next vehicle, and 7.1% would
consider a Tesla. See Charts 1 and 2.
Chart 1: Our survey points to strong demand for alternative
fuel vehicles…
Source: Jefferies
Chart 2: …with 7.1% of survey respondents considering a
Tesla
Source: Jefferies. *Does not total 100% as not all respondents interested in an alternative fuel vehicle.
Clearly, applying 7.1% to expected 2020 NA/WE vehicle sales of ~35m (or 2.5m) likely
overstates the opportunity as it does not take into account any pricing concerns,
competition or simple conservatism. A more sensible approach, in our view, would be as
follows:
- We begin with LMC’s estimate of ~35m vehicles sold in North America and
Western Europe (we believe the survey is relevant for both North America and
Western Europe where income levels, purchasing power and automotive
preferences are roughly similar).
- We haircut this figure by 50% to create a sufficient margin of error. This results
in a total addressable market (or TAM) of about 17.5m vehicles.
Would Consider
68%
Wouldn't Consider
32%
Mix of Survey Respondents Considering
an Alternative Fuel Vehicle
n = 709 21.0%
8.6% 8.6% 8.2%7.1%
4.1%3.5%
2.8% 2.4%
0.7%
0.0%
5.0%
10.0%
15.0%
20.0%
25.0%
Toyota Ford Other Honda Tesla Chevr. BMW M. Benz Nissan Cadillac
Preference by Brand: % of Total Respondents
n = 709
TSLA
Initiating Coverage
May 5, 2015
page 4 of 36 , Equity Analyst, (212) 284-2103, [email protected] Dolev
Please see important disclosure information on pages 33 - 36 of this report.
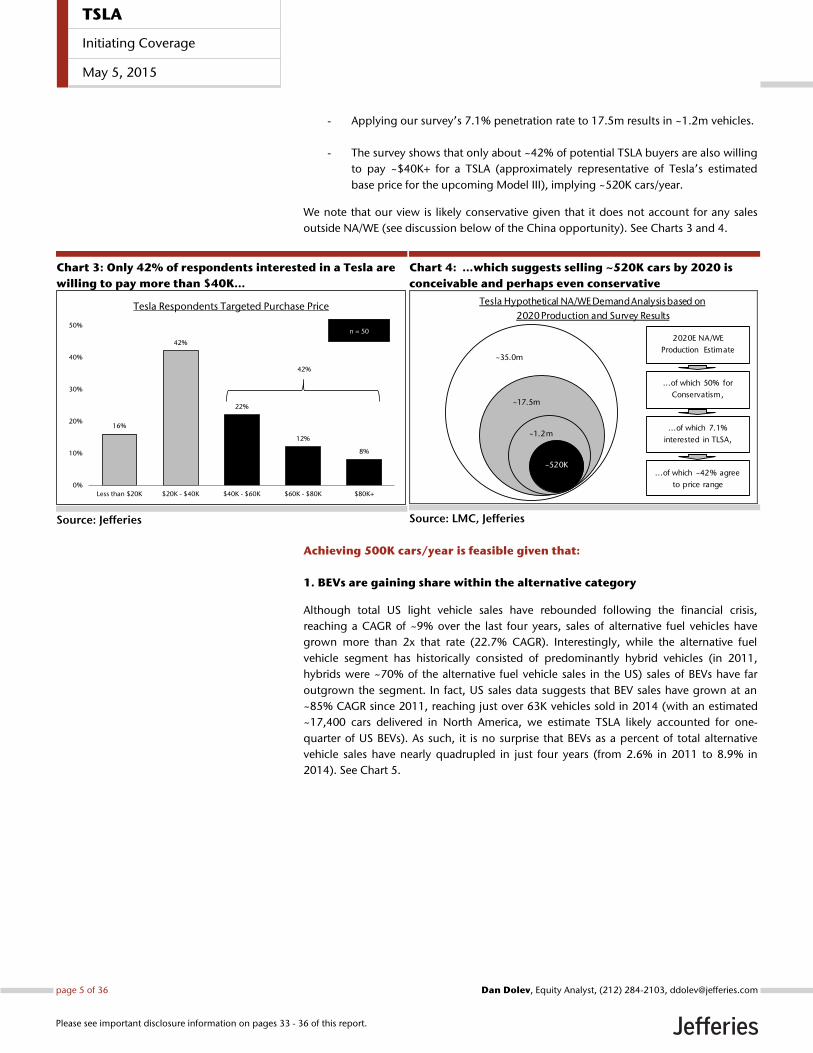
- Applying our survey’s 7.1% penetration rate to 17.5m results in ~1.2m vehicles.
- The survey shows that only about ~42% of potential TSLA buyers are also willing
to pay ~$40K+ for a TSLA (approximately representative of Tesla’s estimated
base price for the upcoming Model III), implying ~520K cars/year.
We note that our view is likely conservative given that it does not account for any sales
outside NA/WE (see discussion below of the China opportunity). See Charts 3 and 4.
Chart 3: Only 42% of respondents interested in a Tesla are
willing to pay more than $40K…
Source: Jefferies
Chart 4: …which suggests selling ~520K cars by 2020 is
conceivable and perhaps even conservative
Source: LMC, Jefferies
Achieving 500K cars/year is feasible given that:
1. BEVs are gaining share within the alternative category
Although total US light vehicle sales have rebounded following the financial crisis,
reaching a CAGR of ~9% over the last four years, sales of alternative fuel vehicles have
grown more than 2x that rate (22.7% CAGR). Interestingly, while the alternative fuel
vehicle segment has historically consisted of predominantly hybrid vehicles (in 2011,
hybrids were ~70% of the alternative fuel vehicle sales in the US) sales of BEVs have far
outgrown the segment. In fact, US sales data suggests that BEV sales have grown at an
~85% CAGR since 2011, reaching just over 63K vehicles sold in 2014 (with an estimated
~17,400 cars delivered in North America, we estimate TSLA likely accounted for one-
quarter of US BEVs). As such, it is no surprise that BEVs as a percent of total alternative
vehicle sales have nearly quadrupled in just four years (from 2.6% in 2011 to 8.9% in
2014). See Chart 5.
16%
42%
22%
12%
8%
0%
10%
20%
30%
40%
50%
Less than $20K $20K - $40K $40K - $60K $60K - $80K $80K+
Tesla Respondents Targeted Purchase Price
n = 50
42%
~35.0m
~17.5m
~1.2m
~520K
...of which 7.1%
interested in TLSA,
...of which ~42% agree
to price range
Tesla Hypothetical NA/WE Demand Analysis based on
2020 Production and Survey Results
...of which 50% for
Conservatism,
2020E NA/WE
Production Estimate
TSLA
Initiating Coverage
May 5, 2015
page 5 of 36 , Equity Analyst, (212) 284-2103, [email protected] Dolev
Please see important disclosure information on pages 33 - 36 of this report.
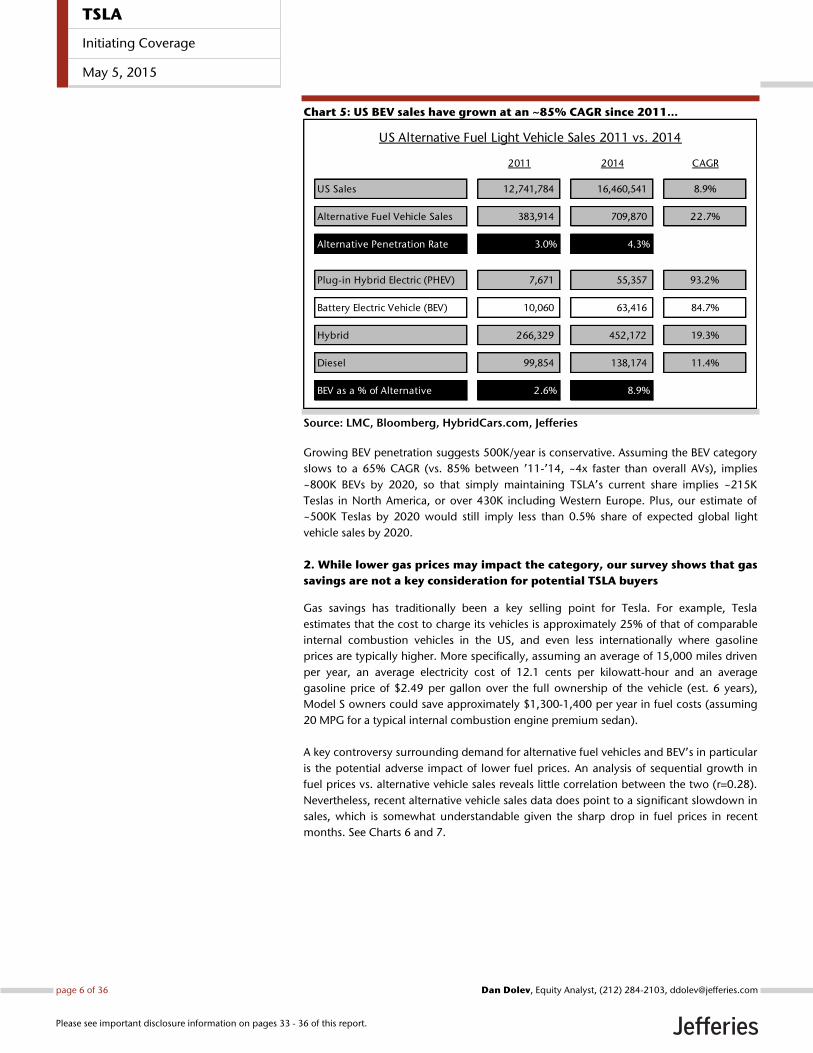
Chart 5: US BEV sales have grown at an ~85% CAGR since 2011…
Source: LMC, Bloomberg, HybridCars.com, Jefferies
Growing BEV penetration suggests 500K/year is conservative. Assuming the BEV category
slows to a 65% CAGR (vs. 85% between ’11-’14, ~4x faster than overall AVs), implies
~800K BEVs by 2020, so that simply maintaining TSLA’s current share implies ~215K
Teslas in North America, or over 430K including Western Europe. Plus, our estimate of
~500K Teslas by 2020 would still imply less than 0.5% share of expected global light
vehicle sales by 2020.
2. While lower gas prices may impact the category, our survey shows that gas
savings are not a key consideration for potential TSLA buyers
Gas savings has traditionally been a key selling point for Tesla. For example, Tesla
estimates that the cost to charge its vehicles is approximately 25% of that of comparable
internal combustion vehicles in the US, and even less internationally where gasoline
prices are typically higher. More specifically, assuming an average of 15,000 miles driven
per year, an average electricity cost of 12.1 cents per kilowatt-hour and an average
gasoline price of $2.49 per gallon over the full ownership of the vehicle (est. 6 years),
Model S owners could save approximately $1,300-1,400 per year in fuel costs (assuming
20 MPG for a typical internal combustion engine premium sedan).
A key controversy surrounding demand for alternative fuel vehicles and BEV’s in particular
is the potential adverse impact of lower fuel prices. An analysis of sequential growth in
fuel prices vs. alternative vehicle sales reveals little correlation between the two (r=0.28).
Nevertheless, recent alternative vehicle sales data does point to a significant slowdown in
sales, which is somewhat understandable given the sharp drop in fuel prices in recent
months. See Charts 6 and 7.
US Alternative Fuel Light Vehicle Sales 2011 vs. 2014
2011 2014 CAGR
US Sales 12,741,784 16,460,541 8.9%
Alternative Fuel Vehicle Sales 383,914 709,870 22.7%
Alternative Penetration Rate 3.0% 4.3%
Plug-in Hybrid Electric (PHEV) 7,671 55,357 93.2%
Battery Electric Vehicle (BEV) 10,060 63,416 84.7%
Hybrid 266,329 452,172 19.3%
Diesel 99,854 138,174 11.4%
BEV as a % of Alternative 2.6% 8.9%
TSLA
Initiating Coverage
May 5, 2015
page 6 of 36 , Equity Analyst, (212) 284-2103, [email protected] Dolev
Please see important disclosure information on pages 33 - 36 of this report.
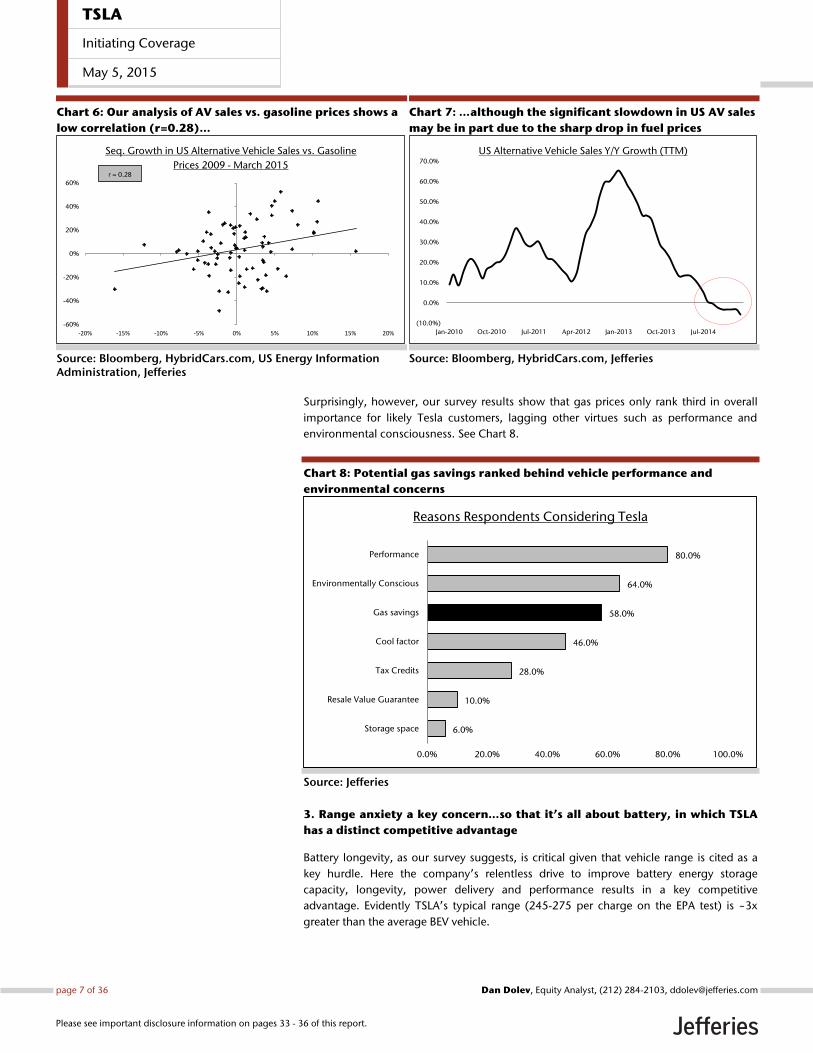
Chart 6: Our analysis of AV sales vs. gasoline prices shows a
low correlation (r=0.28)…
Source: Bloomberg, HybridCars.com, US Energy Information Administration, Jefferies
Chart 7: …although the significant slowdown in US AV sales
may be in part due to the sharp drop in fuel prices
Source: Bloomberg, HybridCars.com, Jefferies
Surprisingly, however, our survey results show that gas prices only rank third in overall
importance for likely Tesla customers, lagging other virtues such as performance and
environmental consciousness. See Chart 8.
Chart 8: Potential gas savings ranked behind vehicle performance and
environmental concerns
Source: Jefferies
3. Range anxiety a key concern…so that it’s all about battery, in which TSLA
has a distinct competitive advantage
Battery longevity, as our survey suggests, is critical given that vehicle range is cited as a
key hurdle. Here the company’s relentless drive to improve battery energy storage
capacity, longevity, power delivery and performance results in a key competitive
advantage. Evidently TSLA’s typical range (245-275 per charge on the EPA test) is ~3x
greater than the average BEV vehicle.
-60%
-40%
-20%
0%
20%
40%
60%
-20% -15% -10% -5% 0% 5% 10% 15% 20%
Seq. Growth in US Alternative Vehicle Sales vs. Gasoline
Prices 2009 - March 2015r = 0.28
(10.0%)
0.0%
10.0%
20.0%
30.0%
40.0%
50.0%
60.0%
70.0%
Jan-2010 Oct-2010 Jul-2011 Apr-2012 Jan-2013 Oct-2013 Jul-2014
US Alternative Vehicle Sales Y/Y Growth (TTM)
6.0%
10.0%
28.0%
46.0%
58.0%
64.0%
80.0%
0.0% 20.0% 40.0% 60.0% 80.0% 100.0%
Storage space
Resale Value Guarantee
Tax Credits
Cool factor
Gas savings
Environmentally Conscious
Performance
Reasons Respondents Considering Tesla
TSLA
Initiating Coverage
May 5, 2015
page 7 of 36 , Equity Analyst, (212) 284-2103, [email protected] Dolev
Please see important disclosure information on pages 33 - 36 of this report.
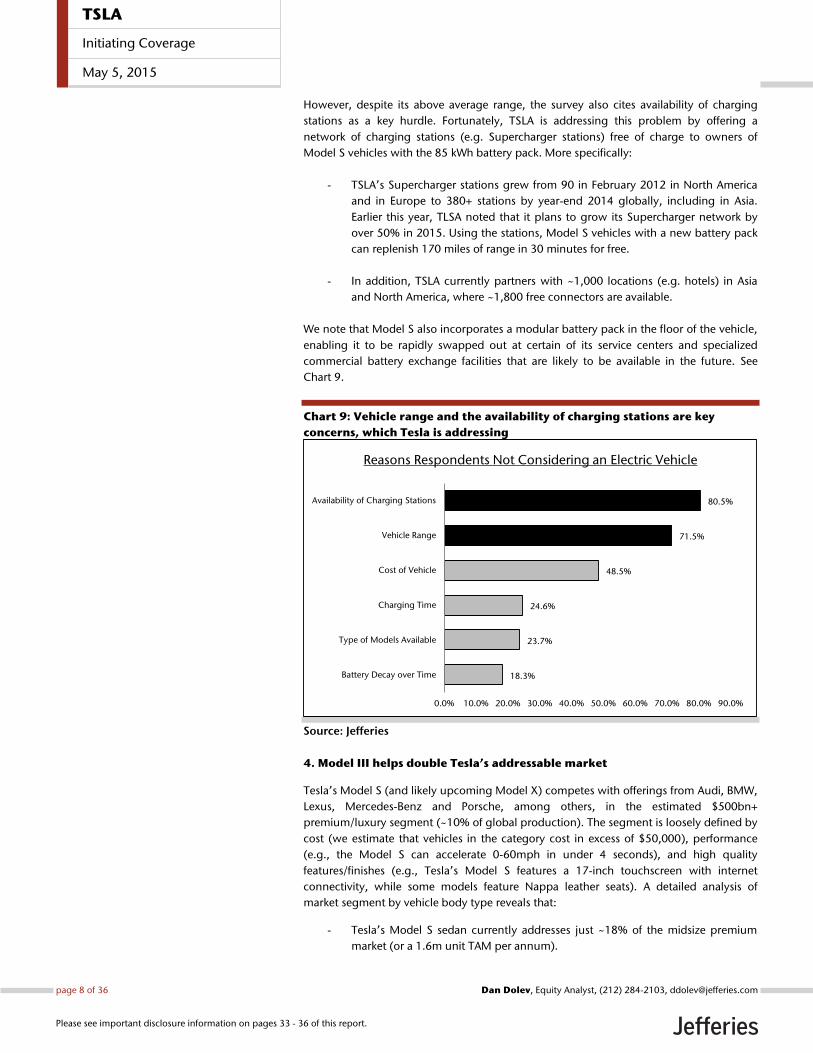
However, despite its above average range, the survey also cites availability of charging
stations as a key hurdle. Fortunately, TSLA is addressing this problem by offering a
network of charging stations (e.g. Supercharger stations) free of charge to owners of
Model S vehicles with the 85 kWh battery pack. More specifically:
- TSLA’s Supercharger stations grew from 90 in February 2012 in North America
and in Europe to 380+ stations by year-end 2014 globally, including in Asia.
Earlier this year, TLSA noted that it plans to grow its Supercharger network by
over 50% in 2015. Using the stations, Model S vehicles with a new battery pack
can replenish 170 miles of range in 30 minutes for free.
- In addition, TSLA currently partners with ~1,000 locations (e.g. hotels) in Asia
and North America, where ~1,800 free connectors are available.
We note that Model S also incorporates a modular battery pack in the floor of the vehicle,
enabling it to be rapidly swapped out at certain of its service centers and specialized
commercial battery exchange facilities that are likely to be available in the future. See
Chart 9.
Chart 9: Vehicle range and the availability of charging stations are key
concerns, which Tesla is addressing
Source: Jefferies
4. Model III helps double Tesla’s addressable market
Tesla’s Model S (and likely upcoming Model X) competes with offerings from Audi, BMW,
Lexus, Mercedes-Benz and Porsche, among others, in the estimated $500bn+
premium/luxury segment (~10% of global production). The segment is loosely defined by
cost (we estimate that vehicles in the category cost in excess of $50,000), performance
(e.g., the Model S can accelerate 0-60mph in under 4 seconds), and high quality
features/finishes (e.g., Tesla’s Model S features a 17-inch touchscreen with internet
connectivity, while some models feature Nappa leather seats). A detailed analysis of
market segment by vehicle body type reveals that:
- Tesla’s Model S sedan currently addresses just ~18% of the midsize premium
market (or a 1.6m unit TAM per annum).
18.3%
23.7%
24.6%
48.5%
71.5%
80.5%
0.0% 10.0% 20.0% 30.0% 40.0% 50.0% 60.0% 70.0% 80.0% 90.0%
Battery Decay over Time
Type of Models Available
Charging Time
Cost of Vehicle
Vehicle Range
Availability of Charging Stations
Reasons Respondents Not Considering an Electric Vehicle
TSLA
Initiating Coverage
May 5, 2015
page 8 of 36 , Equity Analyst, (212) 284-2103, [email protected] Dolev
Please see important disclosure information on pages 33 - 36 of this report.
- The Model X SUV, which is expected to be released in 2H15, should double
Tesla’s TAM, as SUVs comprise ~23% of the premium market (or ~2.1m units).
- Model III (D-midsize), which is expected to debut in 2017, should grow TSLA’s
expected TAM by nearly 4x (or 2x the combined premium SUV/midsize market).
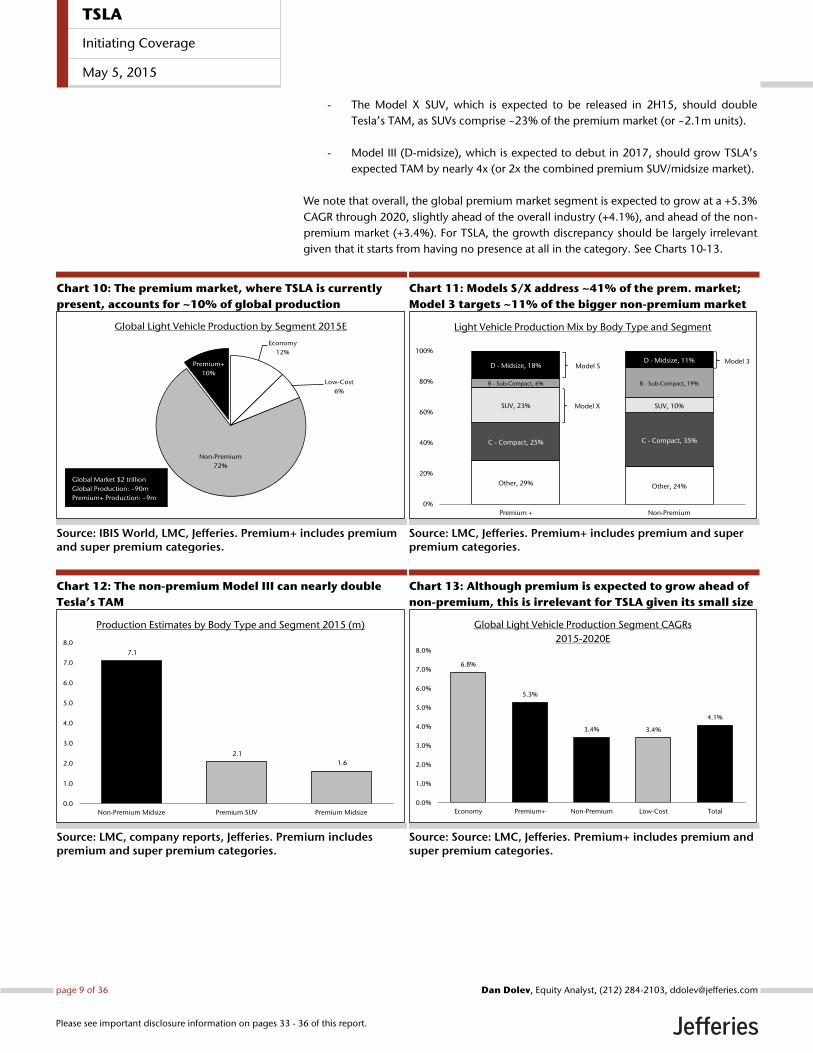
We note that overall, the global premium market segment is expected to grow at a +5.3%
CAGR through 2020, slightly ahead of the overall industry (+4.1%), and ahead of the non-
premium market (+3.4%). For TSLA, the growth discrepancy should be largely irrelevant
given that it starts from having no presence at all in the category. See Charts 10-13.
Chart 10: The premium market, where TSLA is currently
present, accounts for ~10% of global production
Source: IBIS World, LMC, Jefferies. Premium+ includes premium and super premium categories.
Chart 11: Models S/X address ~41% of the prem. market;
Model 3 targets ~11% of the bigger non-premium market
Source: LMC, Jefferies. Premium+ includes premium and super premium categories.
Chart 12: The non-premium Model III can nearly double
Tesla’s TAM
Source: LMC, company reports, Jefferies. Premium includes premium and super premium categories.
Chart 13: Although premium is expected to grow ahead of
non-premium, this is irrelevant for TSLA given its small size
Source: Source: LMC, Jefferies. Premium+ includes premium and super premium categories.
Economy
12%
Low-Cost
6%
Non-Premium
72%
Premium+
10%
Global Light Vehicle Production by Segment 2015E
Global Market $2 trillion
Global Production: ~90m
Premium+ Production: ~9m
Other, 29% Other, 24%
C - Compact, 25% C - Compact, 35%
SUV, 23% SUV, 10%
B - Sub-Compact, 6% B - Sub-Compact, 19%
D - Midsize, 18%D - Midsize, 11%
0%
20%
40%
60%
80%
100%
Premium + Non-Premium
Light Vehicle Production Mix by Body Type and Segment
Model X
Model SModel 3
7.1
2.1
1.6
0.0
1.0
2.0
3.0
4.0
5.0
6.0
7.0
8.0
Non-Premium Midsize Premium SUV Premium Midsize
Production Estimates by Body Type and Segment 2015 (m)
6.8%
5.3%
3.4% 3.4%
4.1%
0.0%
1.0%
2.0%
3.0%
4.0%
5.0%
6.0%
7.0%
8.0%
Economy Premium+ Non-Premium Low-Cost Total
Global Light Vehicle Production Segment CAGRs
2015-2020E
TSLA
Initiating Coverage
May 5, 2015
page 9 of 36 , Equity Analyst, (212) 284-2103, [email protected] Dolev
Please see important disclosure information on pages 33 - 36 of this report.
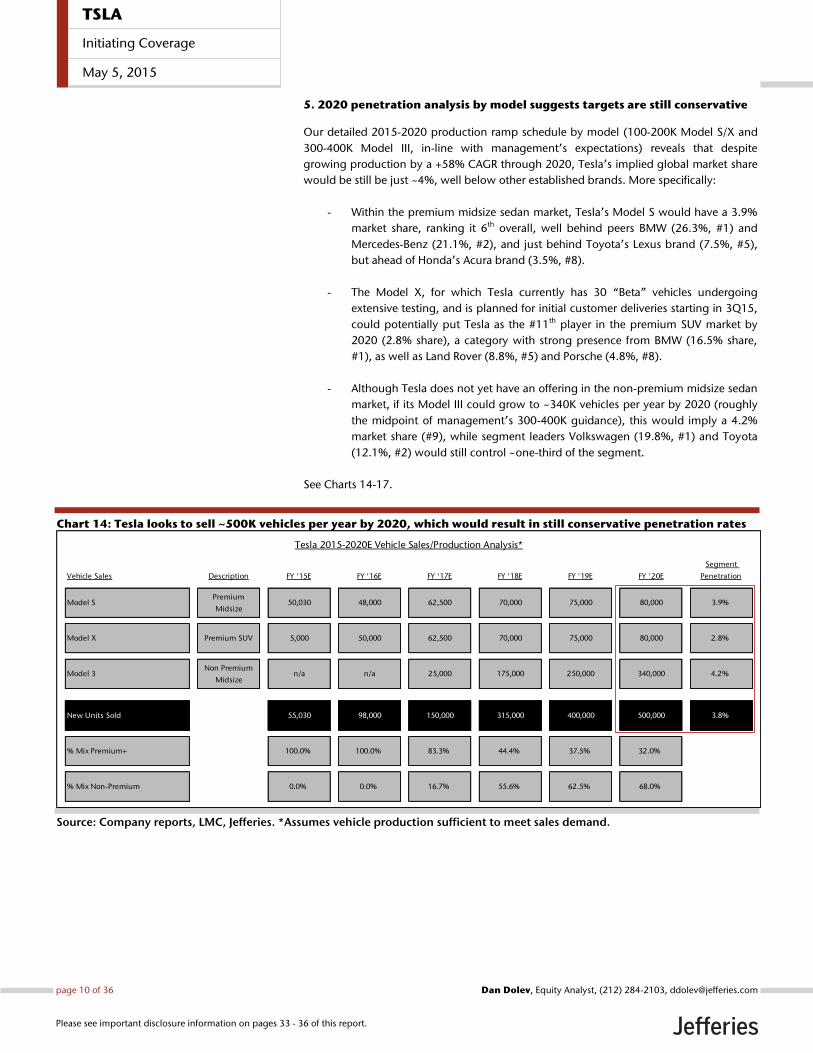
5. 2020 penetration analysis by model suggests targets are still conservative
Our detailed 2015-2020 production ramp schedule by model (100-200K Model S/X and
300-400K Model III, in-line with management’s expectations) reveals that despite
growing production by a +58% CAGR through 2020, Tesla’s implied global market share
would be still be just ~4%, well below other established brands. More specifically:
- Within the premium midsize sedan market, Tesla’s Model S would have a 3.9%
market share, ranking it 6th overall, well behind peers BMW (26.3%, #1) and
Mercedes-Benz (21.1%, #2), and just behind Toyota’s Lexus brand (7.5%, #5),
but ahead of Honda’s Acura brand (3.5%, #8).
- The Model X, for which Tesla currently has 30 “Beta” vehicles undergoing
extensive testing, and is planned for initial customer deliveries starting in 3Q15,
could potentially put Tesla as the #11th player in the premium SUV market by
2020 (2.8% share), a category with strong presence from BMW (16.5% share,
#1), as well as Land Rover (8.8%, #5) and Porsche (4.8%, #8).
- Although Tesla does not yet have an offering in the non-premium midsize sedan
market, if its Model III could grow to ~340K vehicles per year by 2020 (roughly
the midpoint of management’s 300-400K guidance), this would imply a 4.2%
market share (#9), while segment leaders Volkswagen (19.8%, #1) and Toyota
(12.1%, #2) would still control ~one-third of the segment.
See Charts 14-17.
Chart 14: Tesla looks to sell ~500K vehicles per year by 2020, which would result in still conservative penetration rates
Source: Company reports, LMC, Jefferies. *Assumes vehicle production sufficient to meet sales demand.
Tesla 2015-2020E Vehicle Sales/Production Analysis*
Vehicle Sales Description FY '15E FY '16E FY '17E FY '18E FY '19E FY '20E
Segment
Penetration
Model SPremium
Midsize50,030 48,000 62,500 70,000 75,000 80,000 3.9%
Model X Premium SUV 5,000 50,000 62,500 70,000 75,000 80,000 2.8%
Model 3Non Premium
Midsizen/a n/a 25,000 175,000 250,000 340,000 4.2%
New Units Sold 55,030 98,000 150,000 315,000 400,000 500,000 3.8%
% Mix Premium+ 100.0% 100.0% 83.3% 44.4% 37.5% 32.0%
% Mix Non-Premium 0.0% 0.0% 16.7% 55.6% 62.5% 68.0%
TSLA
Initiating Coverage
May 5, 2015
page 10 of 36 , Equity Analyst, (212) 284-2103, [email protected] Dolev
Please see important disclosure information on pages 33 - 36 of this report.
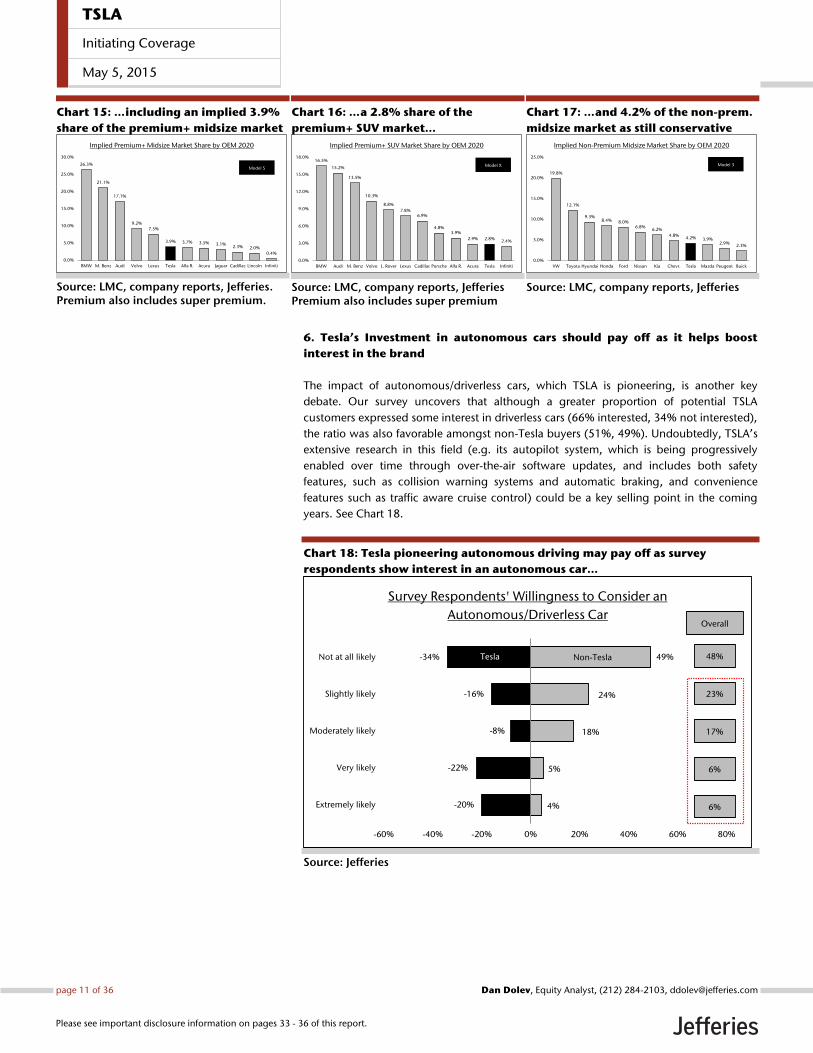
Chart 15: …including an implied 3.9%
share of the premium+ midsize market
Source: LMC, company reports, Jefferies. Premium also includes super premium.
Chart 16: …a 2.8% share of the
premium+ SUV market…
Source: LMC, company reports, Jefferies Premium also includes super premium
Chart 17: …and 4.2% of the non-prem.
midsize market as still conservative
Source: LMC, company reports, Jefferies
6. Tesla’s Investment in autonomous cars should pay off as it helps boost
interest in the brand
The impact of autonomous/driverless cars, which TSLA is pioneering, is another key
debate. Our survey uncovers that although a greater proportion of potential TSLA
customers expressed some interest in driverless cars (66% interested, 34% not interested),
the ratio was also favorable amongst non-Tesla buyers (51%, 49%). Undoubtedly, TSLA’s
extensive research in this field (e.g. its autopilot system, which is being progressively
enabled over time through over-the-air software updates, and includes both safety
features, such as collision warning systems and automatic braking, and convenience
features such as traffic aware cruise control) could be a key selling point in the coming
years. See Chart 18.
Chart 18: Tesla pioneering autonomous driving may pay off as survey
respondents show interest in an autonomous car…
Source: Jefferies
26.3%
21.1%
17.1%
9.2%
7.5%
3.9% 3.7% 3.5% 3.1% 2.3% 2.0%
0.4%
0.0%
5.0%
10.0%
15.0%
20.0%
25.0%
30.0%
BMW M. Benz Audi Volvo Lexus Tesla Alfa R. Acura Jaguar Cadillac Lincoln Infiniti
Implied Premium+ Midsize Market Share by OEM 2020
Model S
16.5%
15.2%
13.5%
10.3%
8.8%
7.8% 6.9%
4.8% 3.9%
2.9% 2.8% 2.4%
0.0%
3.0%
6.0%
9.0%
12.0%
15.0%
18.0%
BMW Audi M. Benz Volvo L. Rover Lexus Cadillac Porsche Alfa R. Acura Tesla Infiniti
Implied Premium+ SUV Market Share by OEM 2020
Model X
19.8%
12.1%
9.3% 8.4% 8.0%
6.8% 6.2%
4.8% 4.2% 3.9%
2.9% 2.3%
0.0%
5.0%
10.0%
15.0%
20.0%
25.0%
VW Toyota Hyundai Honda Ford Nissan Kia Chevr. Tesla Mazda Peugeot Buick
Implied Non-Premium Midsize Market Share by OEM 2020
Model 3
-20%
-22%
-8%
-16%
-34%
4%
5%
18%
24%
49%
-60% -40% -20% 0% 20% 40% 60% 80%
Extremely likely
Very likely
Moderately likely
Slightly likely
Not at all likely
Survey Respondents' Willingness to Consider an
Autonomous/Driverless Car
Tesla Non-Tesla 48%
Overall
23%
17%
6%
6%
TSLA
Initiating Coverage
May 5, 2015
page 11 of 36 , Equity Analyst, (212) 284-2103, [email protected] Dolev
Please see important disclosure information on pages 33 - 36 of this report.
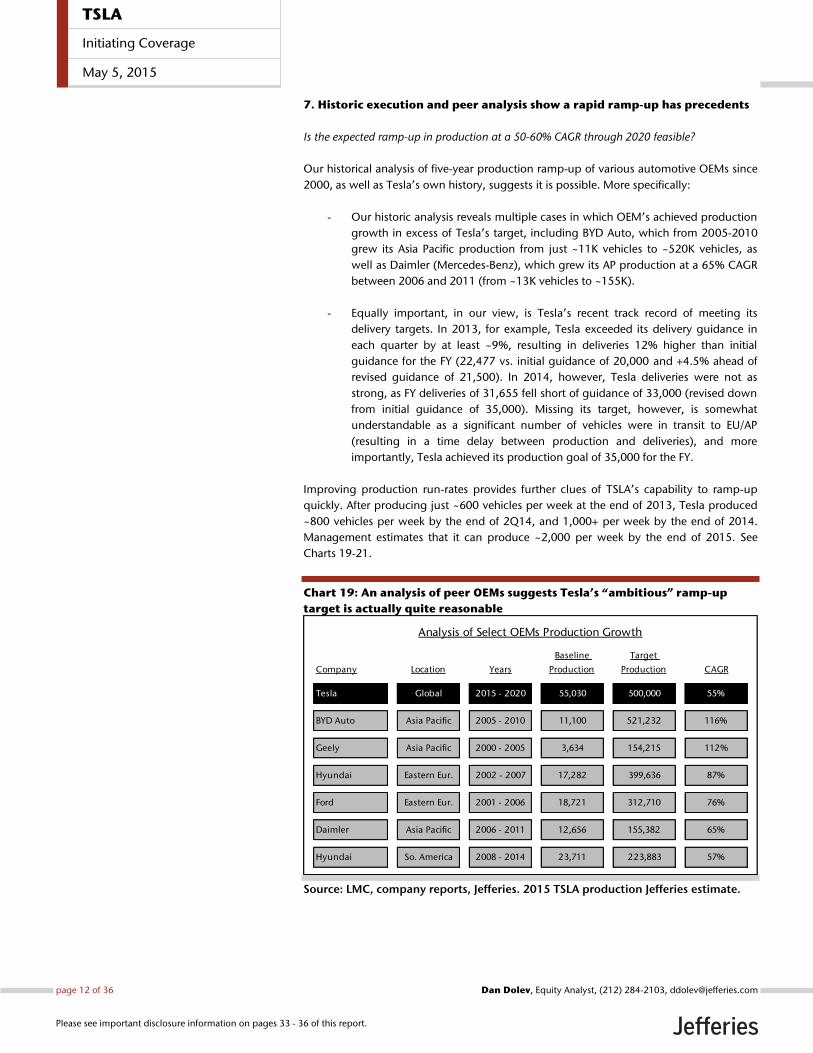
7. Historic execution and peer analysis show a rapid ramp-up has precedents
Is the expected ramp-up in production at a 50-60% CAGR through 2020 feasible?
Our historical analysis of five-year production ramp-up of various automotive OEMs since
2000, as well as Tesla’s own history, suggests it is possible. More specifically:
- Our historic analysis reveals multiple cases in which OEM’s achieved production
growth in excess of Tesla’s target, including BYD Auto, which from 2005-2010
grew its Asia Pacific production from just ~11K vehicles to ~520K vehicles, as
well as Daimler (Mercedes-Benz), which grew its AP production at a 65% CAGR
between 2006 and 2011 (from ~13K vehicles to ~155K).
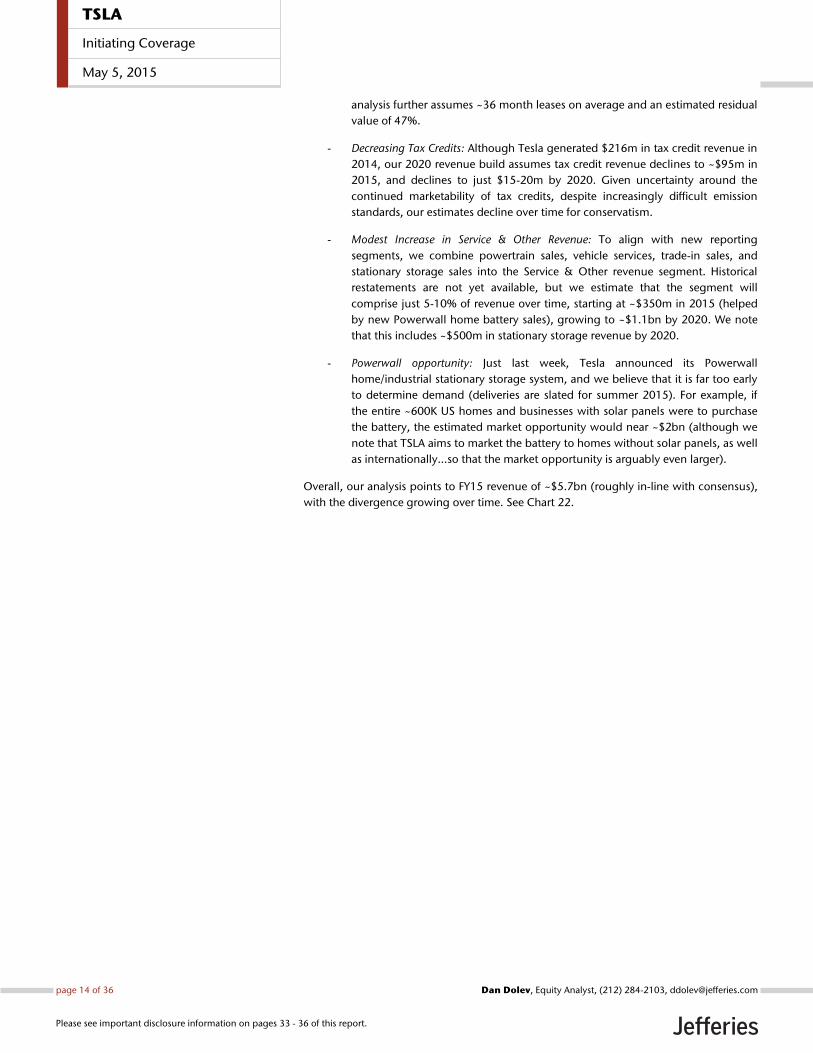
- Equally important, in our view, is Tesla’s recent track record of meeting its
delivery targets. In 2013, for example, Tesla exceeded its delivery guidance in
each quarter by at least ~9%, resulting in deliveries 12% higher than initial
guidance for the FY (22,477 vs. initial guidance of 20,000 and +4.5% ahead of
revised guidance of 21,500). In 2014, however, Tesla deliveries were not as
strong, as FY deliveries of 31,655 fell short of guidance of 33,000 (revised down
from initial guidance of 35,000). Missing its target, however, is somewhat
understandable as a significant number of vehicles were in transit to EU/AP
(resulting in a time delay between production and deliveries), and more
importantly, Tesla achieved its production goal of 35,000 for the FY.
Improving production run-rates provides further clues of TSLA’s capability to ramp-up
quickly. After producing just ~600 vehicles per week at the end of 2013, Tesla produced
~800 vehicles per week by the end of 2Q14, and 1,000+ per week by the end of 2014.
Management estimates that it can produce ~2,000 per week by the end of 2015. See
Charts 19-21.
Chart 19: An analysis of peer OEMs suggests Tesla’s “ambitious” ramp-up
target is actually quite reasonable
Source: LMC, company reports, Jefferies. 2015 TSLA production Jefferies estimate.
Analysis of Select OEMs Production Growth
Company Location Years
Baseline
Production
Target
Production CAGR
Tesla Global 2015 - 2020 55,030 500,000 55%
BYD Auto Asia Pacific 2005 - 2010 11,100 521,232 116%
Geely Asia Pacific 2000 - 2005 3,634 154,215 112%
Hyundai Eastern Eur. 2002 - 2007 17,282 399,636 87%
Ford Eastern Eur. 2001 - 2006 18,721 312,710 76%
Daimler Asia Pacific 2006 - 2011 12,656 155,382 65%
Hyundai So. America 2008 - 2014 23,711 223,883 57%
TSLA
Initiating Coverage
May 5, 2015
page 12 of 36 , Equity Analyst, (212) 284-2103, [email protected] Dolev
Please see important disclosure information on pages 33 - 36 of this report.
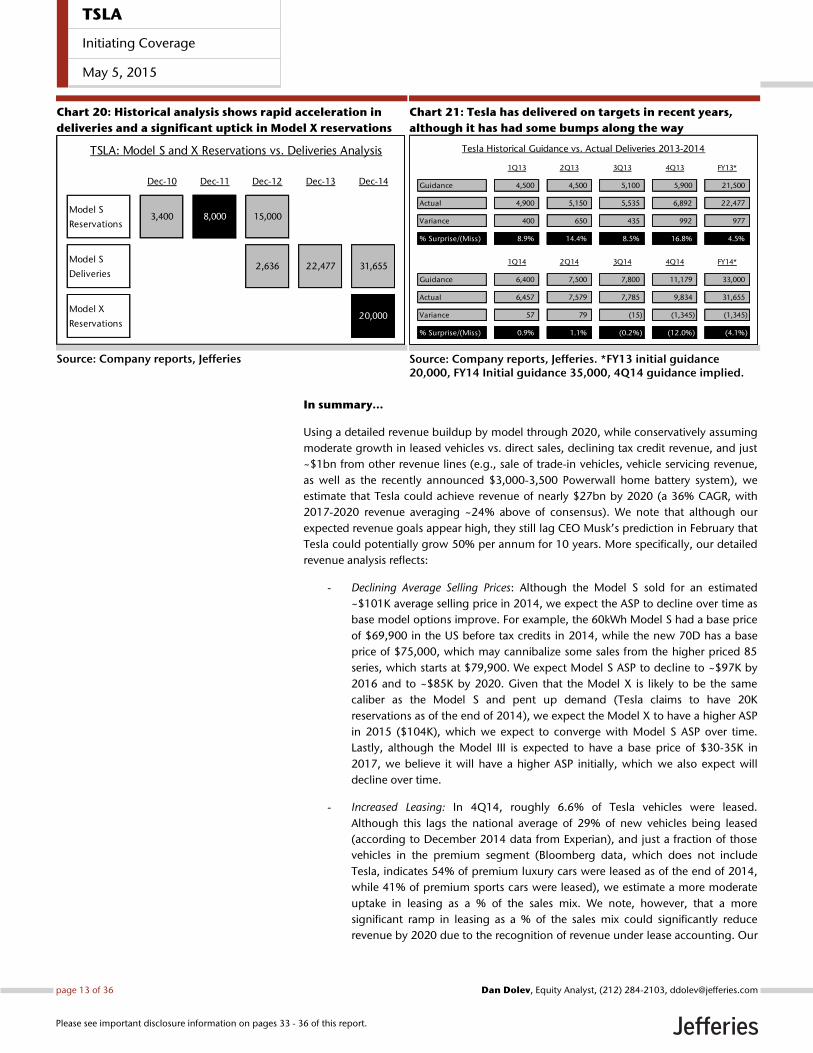
Chart 20: Historical analysis shows rapid acceleration in
deliveries and a significant uptick in Model X reservations
Source: Company reports, Jefferies
Chart 21: Tesla has delivered on targets in recent years,
although it has had some bumps along the way
Source: Company reports, Jefferies. *FY13 initial guidance 20,000, FY14 Initial guidance 35,000, 4Q14 guidance implied.
In summary…
Using a detailed revenue buildup by model through 2020, while conservatively assuming
moderate growth in leased vehicles vs. direct sales, declining tax credit revenue, and just
~$1bn from other revenue lines (e.g., sale of trade-in vehicles, vehicle servicing revenue,
as well as the recently announced $3,000-3,500 Powerwall home battery system), we
estimate that Tesla could achieve revenue of nearly $27bn by 2020 (a 36% CAGR, with
2017-2020 revenue averaging ~24% above of consensus). We note that although our
expected revenue goals appear high, they still lag CEO Musk’s prediction in February that
Tesla could potentially grow 50% per annum for 10 years. More specifically, our detailed
revenue analysis reflects:
- Declining Average Selling Prices: Although the Model S sold for an estimated
~$101K average selling price in 2014, we expect the ASP to decline over time as
base model options improve. For example, the 60kWh Model S had a base price
of $69,900 in the US before tax credits in 2014, while the new 70D has a base
price of $75,000, which may cannibalize some sales from the higher priced 85
series, which starts at $79,900. We expect Model S ASP to decline to ~$97K by
2016 and to ~$85K by 2020. Given that the Model X is likely to be the same
caliber as the Model S and pent up demand (Tesla claims to have 20K
reservations as of the end of 2014), we expect the Model X to have a higher ASP
in 2015 ($104K), which we expect to converge with Model S ASP over time.
Lastly, although the Model III is expected to have a base price of $30-35K in
2017, we believe it will have a higher ASP initially, which we also expect will
decline over time.
- Increased Leasing: In 4Q14, roughly 6.6% of Tesla vehicles were leased.
Although this lags the national average of 29% of new vehicles being leased
(according to December 2014 data from Experian), and just a fraction of those
vehicles in the premium segment (Bloomberg data, which does not include
Tesla, indicates 54% of premium luxury cars were leased as of the end of 2014,
while 41% of premium sports cars were leased), we estimate a more moderate
uptake in leasing as a % of the sales mix. We note, however, that a more
significant ramp in leasing as a % of the sales mix could significantly reduce
revenue by 2020 due to the recognition of revenue under lease accounting. Our
TSLA: Model S and X Reservations vs. Deliveries Analysis
Dec-10 Dec-11 Dec-12 Dec-13 Dec-14
Model S
Reservations3,400 8,000 15,000
Model S
Deliveries2,636 22,477 31,655
Model X
Reservations20,000
Tesla Historical Guidance vs. Actual Deliveries 2013-2014
1Q13 2Q13 3Q13 4Q13 FY13*
Guidance 4,500 4,500 5,100 5,900 21,500
Actual 4,900 5,150 5,535 6,892 22,477
Variance 400 650 435 992 977
% Surprise/(Miss) 8.9% 14.4% 8.5% 16.8% 4.5%
1Q14 2Q14 3Q14 4Q14 FY14*
Guidance 6,400 7,500 7,800 11,179 33,000
Actual 6,457 7,579 7,785 9,834 31,655
Variance 57 79 (15) (1,345) (1,345)
% Surprise/(Miss) 0.9% 1.1% (0.2%) (12.0%) (4.1%)
TSLA
Initiating Coverage
May 5, 2015
page 13 of 36 , Equity Analyst, (212) 284-2103, [email protected] Dolev
Please see important disclosure information on pages 33 - 36 of this report.
analysis further assumes ~36 month leases on average and an estimated residual
value of 47%.
- Decreasing Tax Credits: Although Tesla generated $216m in tax credit revenue in
2014, our 2020 revenue build assumes tax credit revenue declines to ~$95m in
2015, and declines to just $15-20m by 2020. Given uncertainty around the
continued marketability of tax credits, despite increasingly difficult emission
standards, our estimates decline over time for conservatism.
- Modest Increase in Service & Other Revenue: To align with new reporting
segments, we combine powertrain sales, vehicle services, trade-in sales, and
stationary storage sales into the Service & Other revenue segment. Historical
restatements are not yet available, but we estimate that the segment will
comprise just 5-10% of revenue over time, starting at ~$350m in 2015 (helped
by new Powerwall home battery sales), growing to ~$1.1bn by 2020. We note
that this includes ~$500m in stationary storage revenue by 2020.
- Powerwall opportunity: Just last week, Tesla announced its Powerwall
home/industrial stationary storage system, and we believe that it is far too early
to determine demand (deliveries are slated for summer 2015). For example, if
the entire ~600K US homes and businesses with solar panels were to purchase
the battery, the estimated market opportunity would near ~$2bn (although we
note that TSLA aims to market the battery to homes without solar panels, as well
as internationally…so that the market opportunity is arguably even larger).
Overall, our analysis points to FY15 revenue of ~$5.7bn (roughly in-line with consensus),
with the divergence growing over time. See Chart 22.
TSLA
Initiating Coverage
May 5, 2015
page 14 of 36 , Equity Analyst, (212) 284-2103, [email protected] Dolev
Please see important disclosure information on pages 33 - 36 of this report.
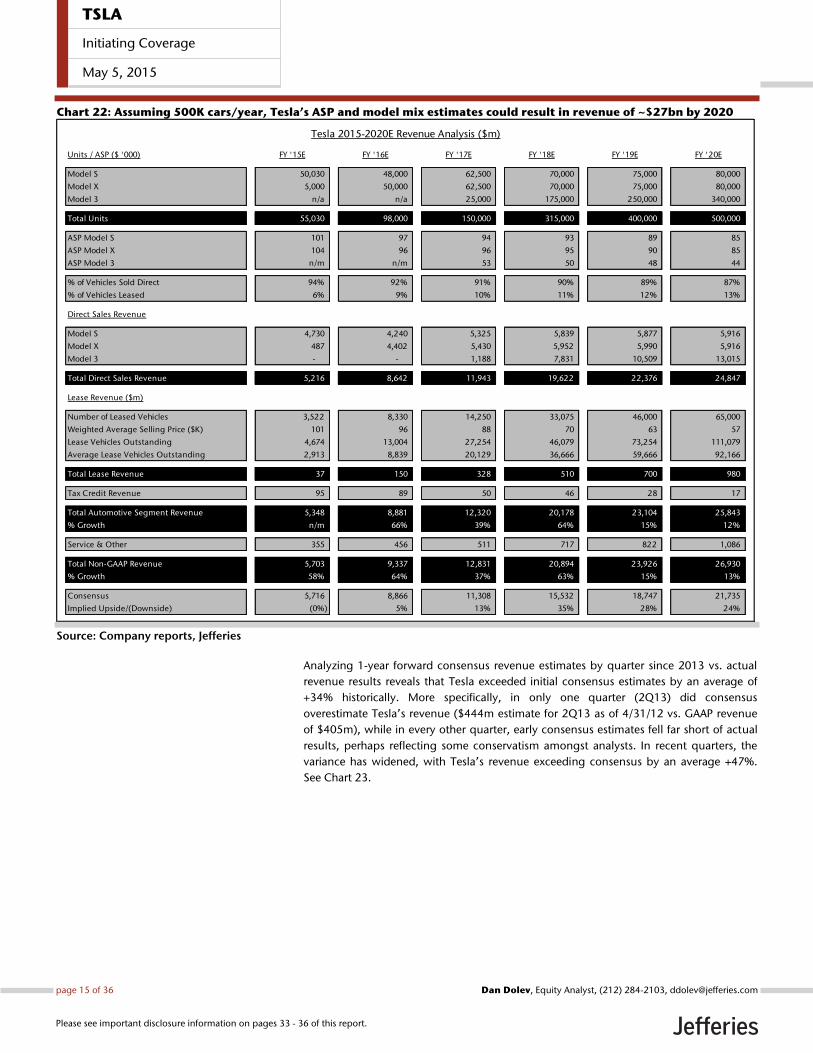
Chart 22: Assuming 500K cars/year, Tesla’s ASP and model mix estimates could result in revenue of ~$27bn by 2020
Source: Company reports, Jefferies
Analyzing 1-year forward consensus revenue estimates by quarter since 2013 vs. actual
revenue results reveals that Tesla exceeded initial consensus estimates by an average of
+34% historically. More specifically, in only one quarter (2Q13) did consensus
overestimate Tesla’s revenue ($444m estimate for 2Q13 as of 4/31/12 vs. GAAP revenue
of $405m), while in every other quarter, early consensus estimates fell far short of actual
results, perhaps reflecting some conservatism amongst analysts. In recent quarters, the
variance has widened, with Tesla’s revenue exceeding consensus by an average +47%.
See Chart 23.
Tesla 2015-2020E Revenue Analysis ($m)
Units / ASP ($ '000) FY '15E FY '16E FY '17E FY '18E FY '19E FY '20E
Model S 50,030 48,000 62,500 70,000 75,000 80,000
Model X 5,000 50,000 62,500 70,000 75,000 80,000
Model 3 n/a n/a 25,000 175,000 250,000 340,000
Total Units 55,030 98,000 150,000 315,000 400,000 500,000
ASP Model S 101 97 94 93 89 85
ASP Model X 104 96 96 95 90 85
ASP Model 3 n/m n/m 53 50 48 44
% of Vehicles Sold Direct 94% 92% 91% 90% 89% 87%
% of Vehicles Leased 6% 9% 10% 11% 12% 13%
Direct Sales Revenue
Model S 4,730 4,240 5,325 5,839 5,877 5,916
Model X 487 4,402 5,430 5,952 5,990 5,916
Model 3 - - 1,188 7,831 10,509 13,015
Total Direct Sales Revenue 5,216 8,642 11,943 19,622 22,376 24,847
Lease Revenue ($m)
Number of Leased Vehicles 3,522 8,330 14,250 33,075 46,000 65,000
Weighted Average Selling Price ($K) 101 96 88 70 63 57
Lease Vehicles Outstanding 4,674 13,004 27,254 46,079 73,254 111,079
Average Lease Vehicles Outstanding 2,913 8,839 20,129 36,666 59,666 92,166
Total Lease Revenue 37 150 328 510 700 980
Tax Credit Revenue 95 89 50 46 28 17
Total Automotive Segment Revenue 5,348 8,881 12,320 20,178 23,104 25,843
% Growth n/m 66% 39% 64% 15% 12%
Service & Other 355 456 511 717 822 1,086
Total Non-GAAP Revenue 5,703 9,337 12,831 20,894 23,926 26,930
% Growth 58% 64% 37% 63% 15% 13%
Consensus 5,716 8,866 11,308 15,532 18,747 21,735
Implied Upside/(Downside) (0%) 5% 13% 35% 28% 24%
TSLA
Initiating Coverage
May 5, 2015
page 15 of 36 , Equity Analyst, (212) 284-2103, [email protected] Dolev
Please see important disclosure information on pages 33 - 36 of this report.
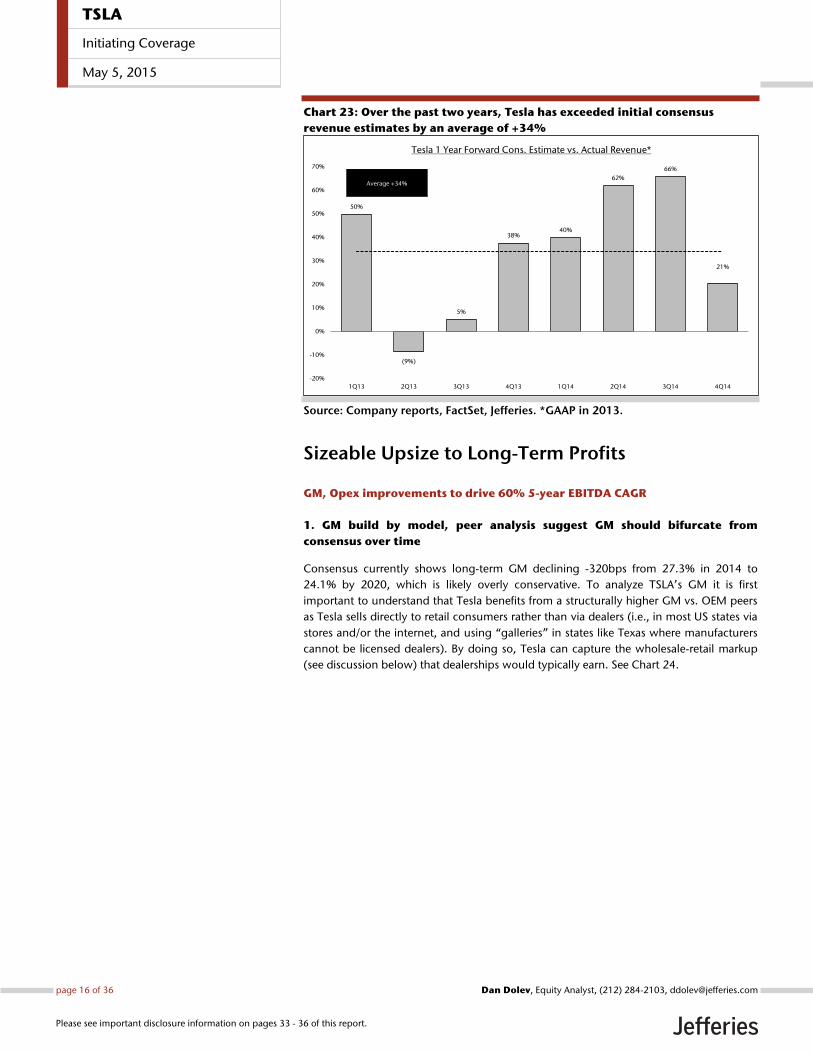
Chart 23: Over the past two years, Tesla has exceeded initial consensus
revenue estimates by an average of +34%
Source: Company reports, FactSet, Jefferies. *GAAP in 2013.
Sizeable Upsize to Long-Term Profits
GM, Opex improvements to drive 60% 5-year EBITDA CAGR
1. GM build by model, peer analysis suggest GM should bifurcate from
consensus over time
Consensus currently shows long-term GM declining -320bps from 27.3% in 2014 to
24.1% by 2020, which is likely overly conservative. To analyze TSLA’s GM it is first
important to understand that Tesla benefits from a structurally higher GM vs. OEM peers
as Tesla sells directly to retail consumers rather than via dealers (i.e., in most US states via
stores and/or the internet, and using “galleries” in states like Texas where manufacturers
cannot be licensed dealers). By doing so, Tesla can capture the wholesale-retail markup
(see discussion below) that dealerships would typically earn. See Chart 24.
50%
(9%)
5%
38% 40%
62%
66%
21%
-20%
-10%
0%
10%
20%
30%
40%
50%
60%
70%
1Q13 2Q13 3Q13 4Q13 1Q14 2Q14 3Q14 4Q14
Tesla 1 Year Forward Cons. Estimate vs. Actual Revenue*
Average +34%
TSLA
Initiating Coverage
May 5, 2015
page 16 of 36 , Equity Analyst, (212) 284-2103, [email protected] Dolev
Please see important disclosure information on pages 33 - 36 of this report.
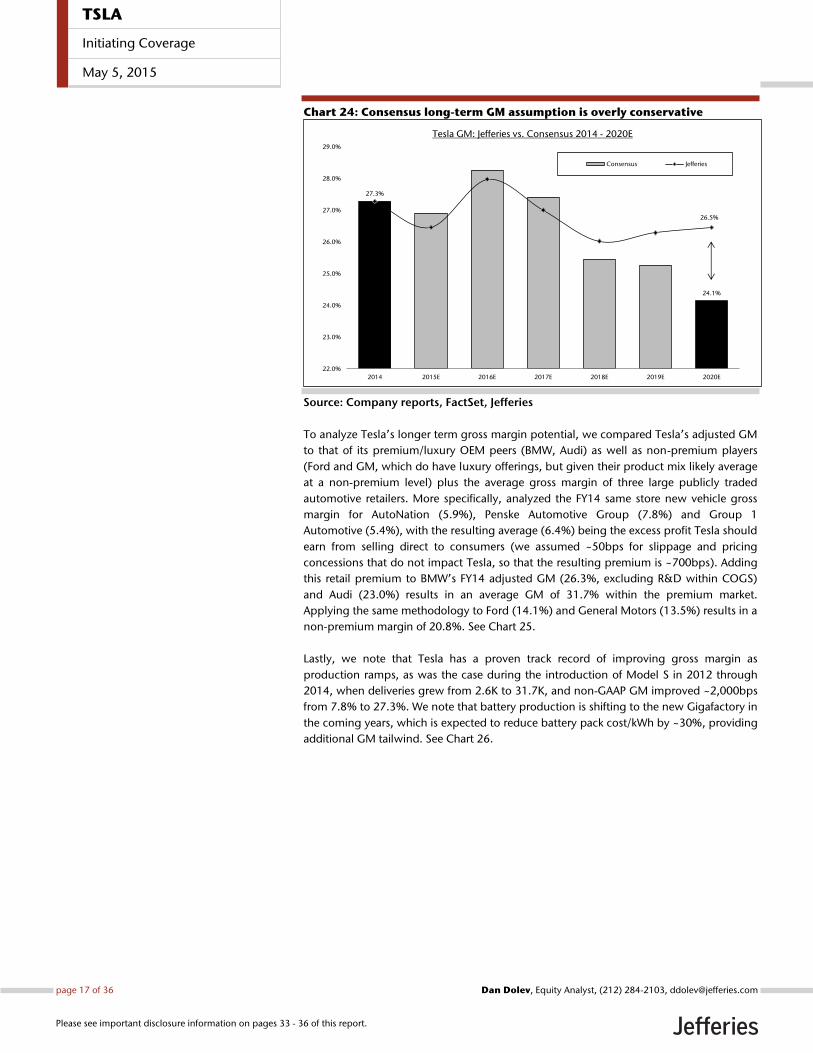
Chart 24: Consensus long-term GM assumption is overly conservative
Source: Company reports, FactSet, Jefferies
To analyze Tesla’s longer term gross margin potential, we compared Tesla’s adjusted GM
to that of its premium/luxury OEM peers (BMW, Audi) as well as non-premium players
(Ford and GM, which do have luxury offerings, but given their product mix likely average
at a non-premium level) plus the average gross margin of three large publicly traded
automotive retailers. More specifically, analyzed the FY14 same store new vehicle gross
margin for AutoNation (5.9%), Penske Automotive Group (7.8%) and Group 1
Automotive (5.4%), with the resulting average (6.4%) being the excess profit Tesla should
earn from selling direct to consumers (we assumed ~50bps for slippage and pricing
concessions that do not impact Tesla, so that the resulting premium is ~700bps). Adding
this retail premium to BMW’s FY14 adjusted GM (26.3%, excluding R&D within COGS)
and Audi (23.0%) results in an average GM of 31.7% within the premium market.
Applying the same methodology to Ford (14.1%) and General Motors (13.5%) results in a
non-premium margin of 20.8%. See Chart 25.
Lastly, we note that Tesla has a proven track record of improving gross margin as
production ramps, as was the case during the introduction of Model S in 2012 through
2014, when deliveries grew from 2.6K to 31.7K, and non-GAAP GM improved ~2,000bps
from 7.8% to 27.3%. We note that battery production is shifting to the new Gigafactory in
the coming years, which is expected to reduce battery pack cost/kWh by ~30%, providing
additional GM tailwind. See Chart 26.
27.3%
24.1%
26.5%
22.0%
23.0%
24.0%
25.0%
26.0%
27.0%
28.0%
29.0%
2014 2015E 2016E 2017E 2018E 2019E 2020E
Tesla GM: Jefferies vs. Consensus 2014 - 2020E
Consensus Jefferies
TSLA
Initiating Coverage
May 5, 2015
page 17 of 36 , Equity Analyst, (212) 284-2103, [email protected] Dolev
Please see important disclosure information on pages 33 - 36 of this report.
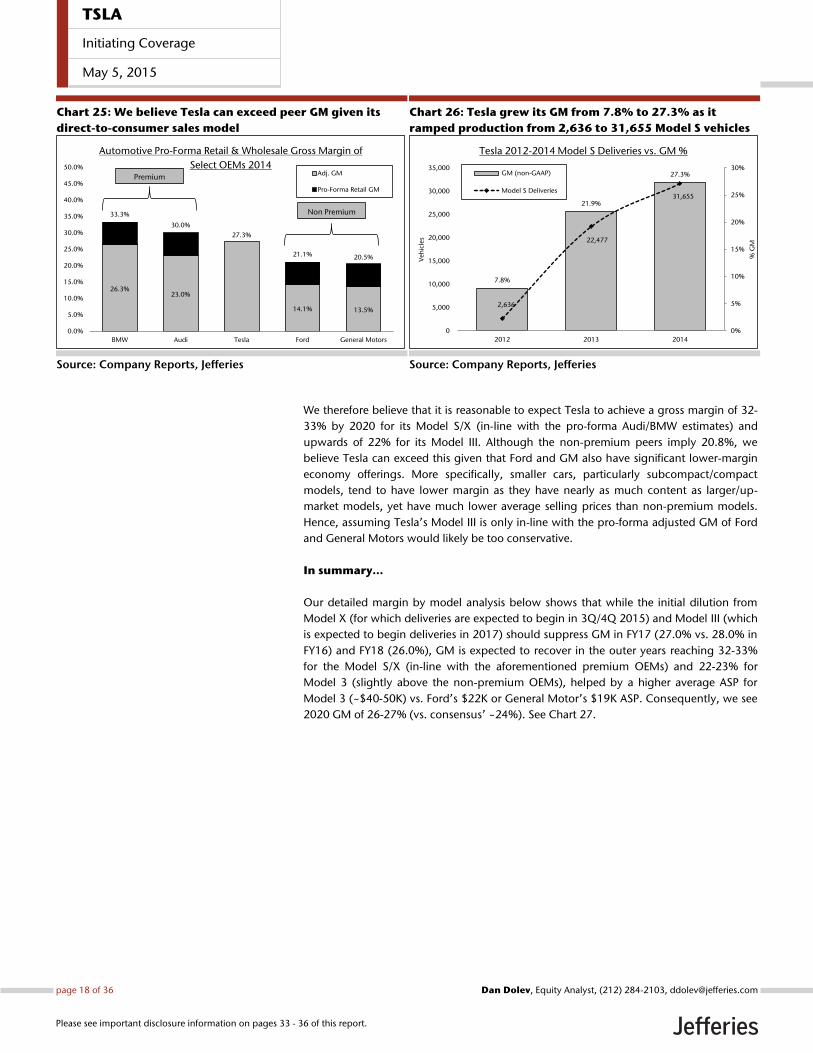
Chart 25: We believe Tesla can exceed peer GM given its
direct-to-consumer sales model
Source: Company Reports, Jefferies
Chart 26: Tesla grew its GM from 7.8% to 27.3% as it
ramped production from 2,636 to 31,655 Model S vehicles
Source: Company Reports, Jefferies
We therefore believe that it is reasonable to expect Tesla to achieve a gross margin of 32-
33% by 2020 for its Model S/X (in-line with the pro-forma Audi/BMW estimates) and
upwards of 22% for its Model III. Although the non-premium peers imply 20.8%, we
believe Tesla can exceed this given that Ford and GM also have significant lower-margin
economy offerings. More specifically, smaller cars, particularly subcompact/compact
models, tend to have lower margin as they have nearly as much content as larger/up-
market models, yet have much lower average selling prices than non-premium models.
Hence, assuming Tesla’s Model III is only in-line with the pro-forma adjusted GM of Ford
and General Motors would likely be too conservative.
In summary…
Our detailed margin by model analysis below shows that while the initial dilution from
Model X (for which deliveries are expected to begin in 3Q/4Q 2015) and Model III (which
is expected to begin deliveries in 2017) should suppress GM in FY17 (27.0% vs. 28.0% in
FY16) and FY18 (26.0%), GM is expected to recover in the outer years reaching 32-33%
for the Model S/X (in-line with the aforementioned premium OEMs) and 22-23% for
Model 3 (slightly above the non-premium OEMs), helped by a higher average ASP for
Model 3 (~$40-50K) vs. Ford’s $22K or General Motor’s $19K ASP. Consequently, we see
2020 GM of 26-27% (vs. consensus’ ~24%). See Chart 27.
26.3% 23.0%
14.1% 13.5%
33.3%
30.0%
27.3%
21.1% 20.5%
0.0%
5.0%
10.0%
15.0%
20.0%
25.0%
30.0%
35.0%
40.0%
45.0%
50.0%
BMW Audi Tesla Ford General Motors
Automotive Pro-Forma Retail & Wholesale Gross Margin of
Select OEMs 2014Adj. GM
Pro-Forma Retail GM
Premium
Non Premium
7.8%
21.9%
27.3%
2,636
22,477
31,655
0%
5%
10%
15%
20%
25%
30%
0
5,000
10,000
15,000
20,000
25,000
30,000
35,000
2012 2013 2014
% G
M
Veh
icle
s
Tesla 2012-2014 Model S Deliveries vs. GM %
GM (non-GAAP)
Model S Deliveries
TSLA
Initiating Coverage
May 5, 2015
page 18 of 36 , Equity Analyst, (212) 284-2103, [email protected] Dolev
Please see important disclosure information on pages 33 - 36 of this report.
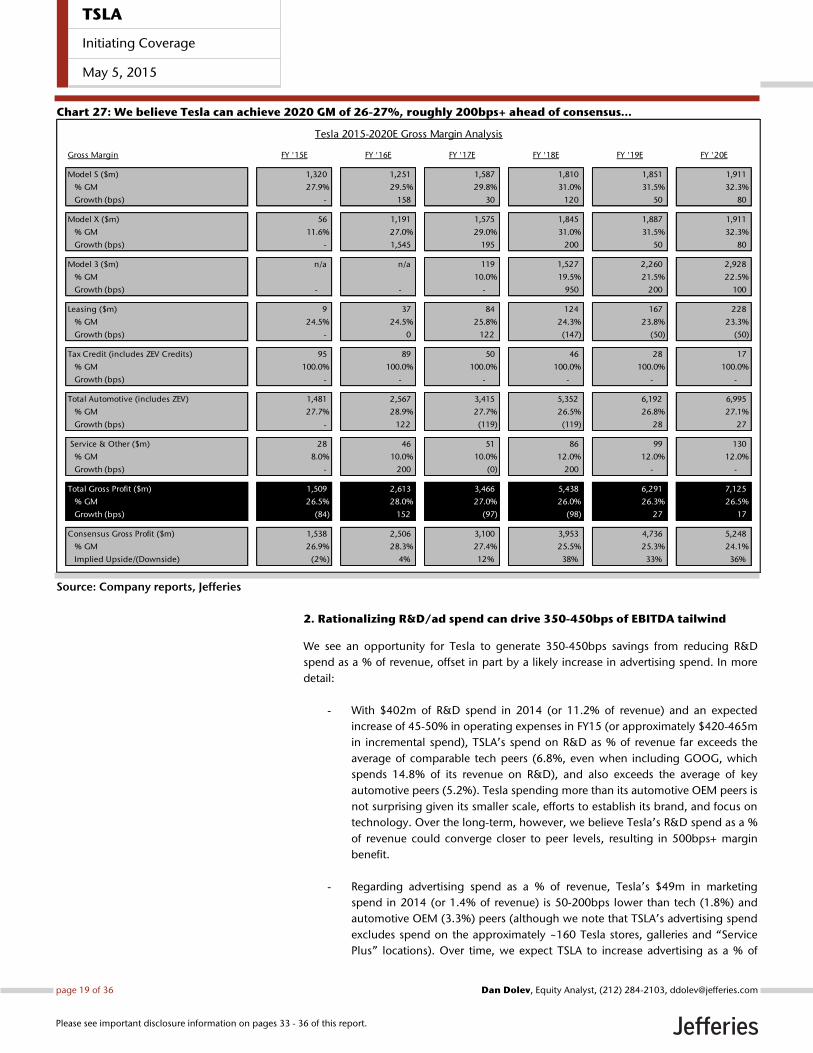
Chart 27: We believe Tesla can achieve 2020 GM of 26-27%, roughly 200bps+ ahead of consensus…
Source: Company reports, Jefferies
2. Rationalizing R&D/ad spend can drive 350-450bps of EBITDA tailwind
We see an opportunity for Tesla to generate 350-450bps savings from reducing R&D
spend as a % of revenue, offset in part by a likely increase in advertising spend. In more
detail:
- With $402m of R&D spend in 2014 (or 11.2% of revenue) and an expected
increase of 45-50% in operating expenses in FY15 (or approximately $420-465m
in incremental spend), TSLA’s spend on R&D as % of revenue far exceeds the
average of comparable tech peers (6.8%, even when including GOOG, which
spends 14.8% of its revenue on R&D), and also exceeds the average of key
automotive peers (5.2%). Tesla spending more than its automotive OEM peers is
not surprising given its smaller scale, efforts to establish its brand, and focus on
technology. Over the long-term, however, we believe Tesla’s R&D spend as a %
of revenue could converge closer to peer levels, resulting in 500bps+ margin
benefit.
- Regarding advertising spend as a % of revenue, Tesla’s $49m in marketing
spend in 2014 (or 1.4% of revenue) is 50-200bps lower than tech (1.8%) and
automotive OEM (3.3%) peers (although we note that TSLA’s advertising spend
excludes spend on the approximately ~160 Tesla stores, galleries and “Service
Plus” locations). Over time, we expect TSLA to increase advertising as a % of
Tesla 2015-2020E Gross Margin Analysis
Gross Margin FY '15E FY '16E FY '17E FY '18E FY '19E FY '20E
Model S ($m) 1,320 1,251 1,587 1,810 1,851 1,911
% GM 27.9% 29.5% 29.8% 31.0% 31.5% 32.3%
Growth (bps) - 158 30 120 50 80
Model X ($m) 56 1,191 1,575 1,845 1,887 1,911
% GM 11.6% 27.0% 29.0% 31.0% 31.5% 32.3%
Growth (bps) - 1,545 195 200 50 80
Model 3 ($m) n/a n/a 119 1,527 2,260 2,928
% GM 10.0% 19.5% 21.5% 22.5%
Growth (bps) - - - 950 200 100
Leasing ($m) 9 37 84 124 167 228
% GM 24.5% 24.5% 25.8% 24.3% 23.8% 23.3%
Growth (bps) - 0 122 (147) (50) (50)
Tax Credit (includes ZEV Credits) 95 89 50 46 28 17
% GM 100.0% 100.0% 100.0% 100.0% 100.0% 100.0%
Growth (bps) - - - - - -
Total Automotive (includes ZEV) 1,481 2,567 3,415 5,352 6,192 6,995
% GM 27.7% 28.9% 27.7% 26.5% 26.8% 27.1%
Growth (bps) - 122 (119) (119) 28 27
Service & Other ($m) 28 46 51 86 99 130
% GM 8.0% 10.0% 10.0% 12.0% 12.0% 12.0%
Growth (bps) - 200 (0) 200 - -
Total Gross Profit ($m) 1,509 2,613 3,466 5,438 6,291 7,125
% GM 26.5% 28.0% 27.0% 26.0% 26.3% 26.5%
Growth (bps) (84) 152 (97) (98) 27 17
Consensus Gross Profit ($m) 1,538 2,506 3,100 3,953 4,736 5,248
% GM 26.9% 28.3% 27.4% 25.5% 25.3% 24.1%
Implied Upside/(Downside) (2%) 4% 12% 38% 33% 36%
TSLA
Initiating Coverage
May 5, 2015
page 19 of 36 , Equity Analyst, (212) 284-2103, [email protected] Dolev
Please see important disclosure information on pages 33 - 36 of this report.
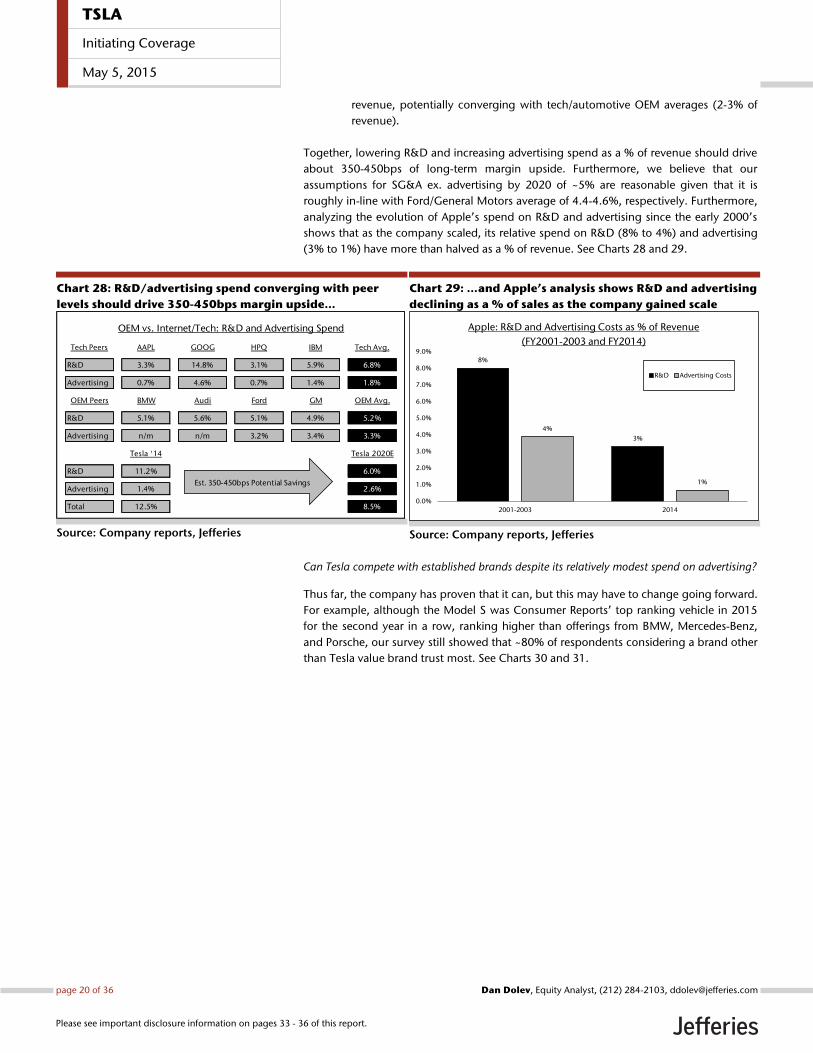
revenue, potentially converging with tech/automotive OEM averages (2-3% of
revenue).
Together, lowering R&D and increasing advertising spend as a % of revenue should drive
about 350-450bps of long-term margin upside. Furthermore, we believe that our
assumptions for SG&A ex. advertising by 2020 of ~5% are reasonable given that it is
roughly in-line with Ford/General Motors average of 4.4-4.6%, respectively. Furthermore,
analyzing the evolution of Apple’s spend on R&D and advertising since the early 2000’s
shows that as the company scaled, its relative spend on R&D (8% to 4%) and advertising
(3% to 1%) have more than halved as a % of revenue. See Charts 28 and 29.
Chart 28: R&D/advertising spend converging with peer
levels should drive 350-450bps margin upside…
Source: Company reports, Jefferies
Chart 29: …and Apple’s analysis shows R&D and advertising
declining as a % of sales as the company gained scale
Source: Company reports, Jefferies
Can Tesla compete with established brands despite its relatively modest spend on advertising?
Thus far, the company has proven that it can, but this may have to change going forward.
For example, although the Model S was Consumer Reports’ top ranking vehicle in 2015
for the second year in a row, ranking higher than offerings from BMW, Mercedes-Benz,
and Porsche, our survey still showed that ~80% of respondents considering a brand other
than Tesla value brand trust most. See Charts 30 and 31.
OEM vs. Internet/Tech: R&D and Advertising Spend
Tech Peers AAPL GOOG HPQ IBM Tech Avg.
R&D 3.3% 14.8% 3.1% 5.9% 6.8%
Advertising 0.7% 4.6% 0.7% 1.4% 1.8%
OEM Peers BMW Audi Ford GM OEM Avg.
R&D 5.1% 5.6% 5.1% 4.9% 5.2%
Advertising n/m n/m 3.2% 3.4% 3.3%
Tesla '14 Tesla 2020E
R&D 11.2% 6.0%
Advertising 1.4% 2.6%
Total 12.5% 8.5%
Est. 350-450bps Potential Savings
8%
3%
4%
1%
0.0%
1.0%
2.0%
3.0%
4.0%
5.0%
6.0%
7.0%
8.0%
9.0%
2001-2003 2014
Apple: R&D and Advertising Costs as % of Revenue
(FY2001-2003 and FY2014)
R&D Advertising Costs
TSLA
Initiating Coverage
May 5, 2015
page 20 of 36 , Equity Analyst, (212) 284-2103, [email protected] Dolev
Please see important disclosure information on pages 33 - 36 of this report.
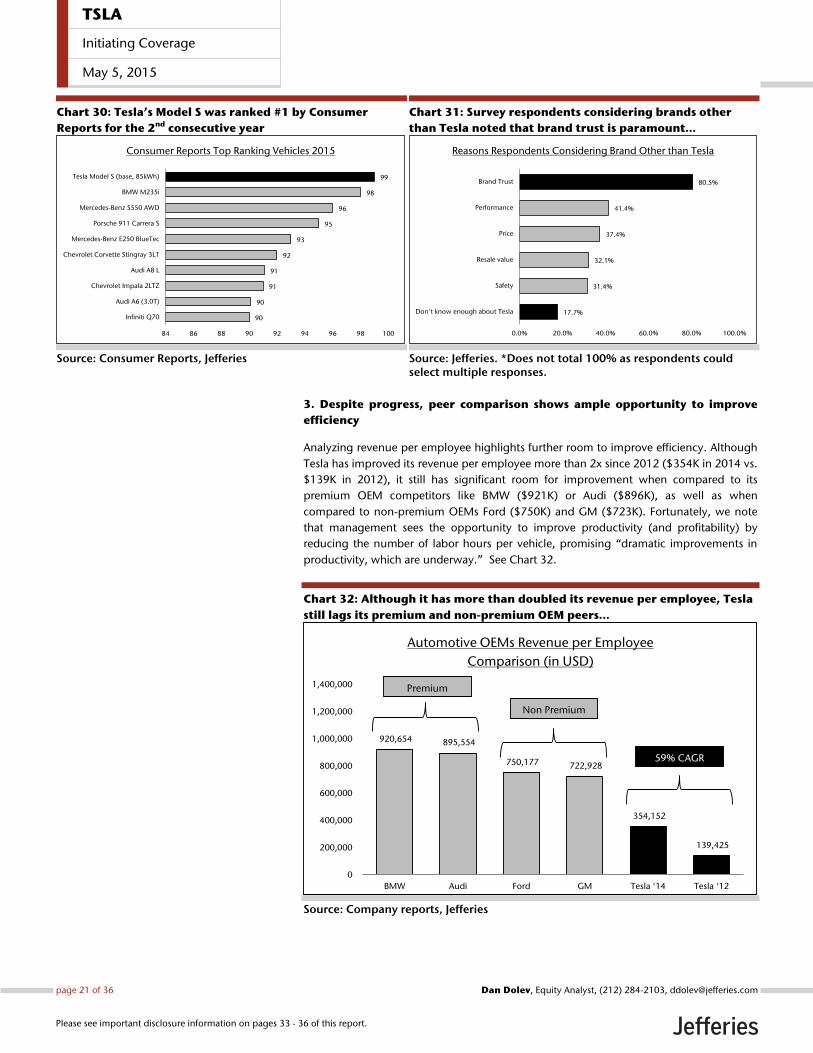
Chart 30: Tesla’s Model S was ranked #1 by Consumer
Reports for the 2nd consecutive year
Source: Consumer Reports, Jefferies
Chart 31: Survey respondents considering brands other
than Tesla noted that brand trust is paramount…
Source: Jefferies. *Does not total 100% as respondents could select multiple responses.
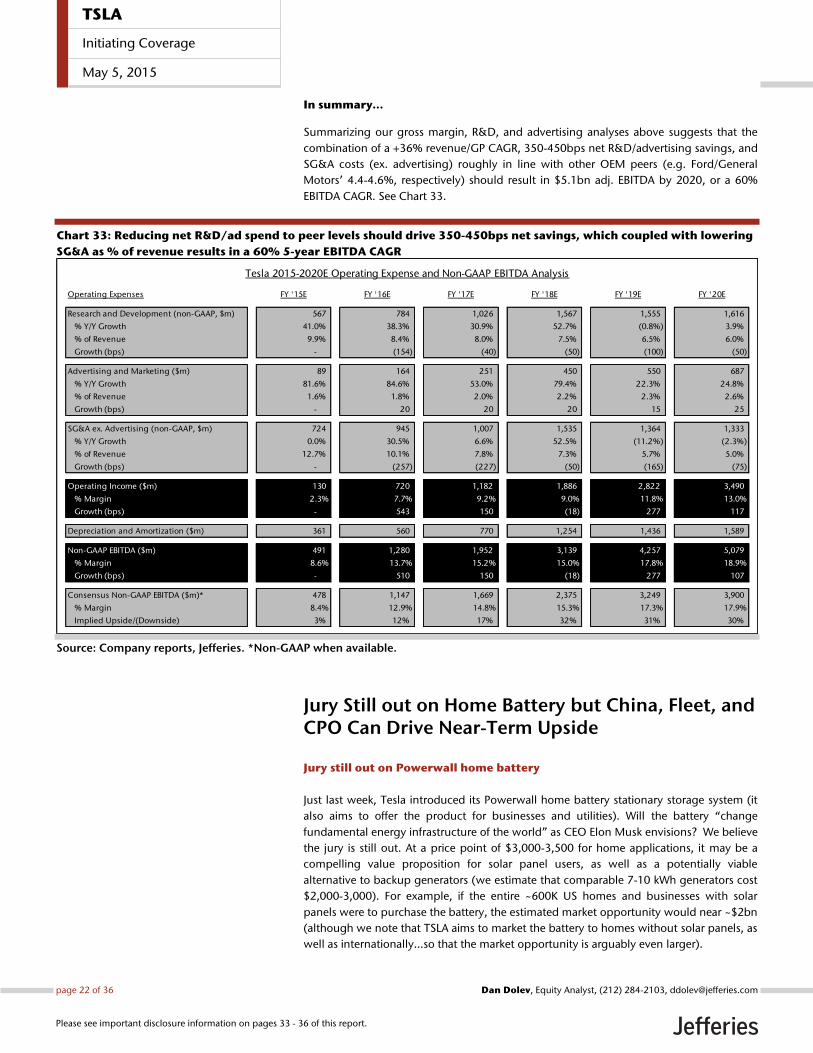
3. Despite progress, peer comparison shows ample opportunity to improve
efficiency
Analyzing revenue per employee highlights further room to improve efficiency. Although
Tesla has improved its revenue per employee more than 2x since 2012 ($354K in 2014 vs.
$139K in 2012), it still has significant room for improvement when compared to its
premium OEM competitors like BMW ($921K) or Audi ($896K), as well as when
compared to non-premium OEMs Ford ($750K) and GM ($723K). Fortunately, we note
that management sees the opportunity to improve productivity (and profitability) by
reducing the number of labor hours per vehicle, promising “dramatic improvements in
productivity, which are underway.” See Chart 32.
Chart 32: Although it has more than doubled its revenue per employee, Tesla
still lags its premium and non-premium OEM peers…
Source: Company reports, Jefferies
90
90
91
91
92
93
95
96
98
99
84 86 88 90 92 94 96 98 100
Infiniti Q70
Audi A6 (3.0T)
Chevrolet Impala 2LTZ
Audi A8 L
Chevrolet Corvette Stingray 3LT
Mercedes-Benz E250 BlueTec
Porsche 911 Carrera S
Mercedes-Benz S550 AWD
BMW M235i
Tesla Model S (base, 85kWh)
Consumer Reports Top Ranking Vehicles 2015
17.7%
31.4%
32.1%
37.4%
41.4%
80.5%
0.0% 20.0% 40.0% 60.0% 80.0% 100.0%
Don't know enough about Tesla
Safety
Resale value
Price
Performance
Brand Trust
Reasons Respondents Considering Brand Other than Tesla
920,654 895,554
750,177 722,928
354,152
139,425
0
200,000
400,000
600,000
800,000
1,000,000
1,200,000
1,400,000
BMW Audi Ford GM Tesla '14 Tesla '12
Automotive OEMs Revenue per Employee
Comparison (in USD)
Premium
Non Premium
59% CAGR
TSLA
Initiating Coverage
May 5, 2015
page 21 of 36 , Equity Analyst, (212) 284-2103, [email protected] Dolev
Please see important disclosure information on pages 33 - 36 of this report.
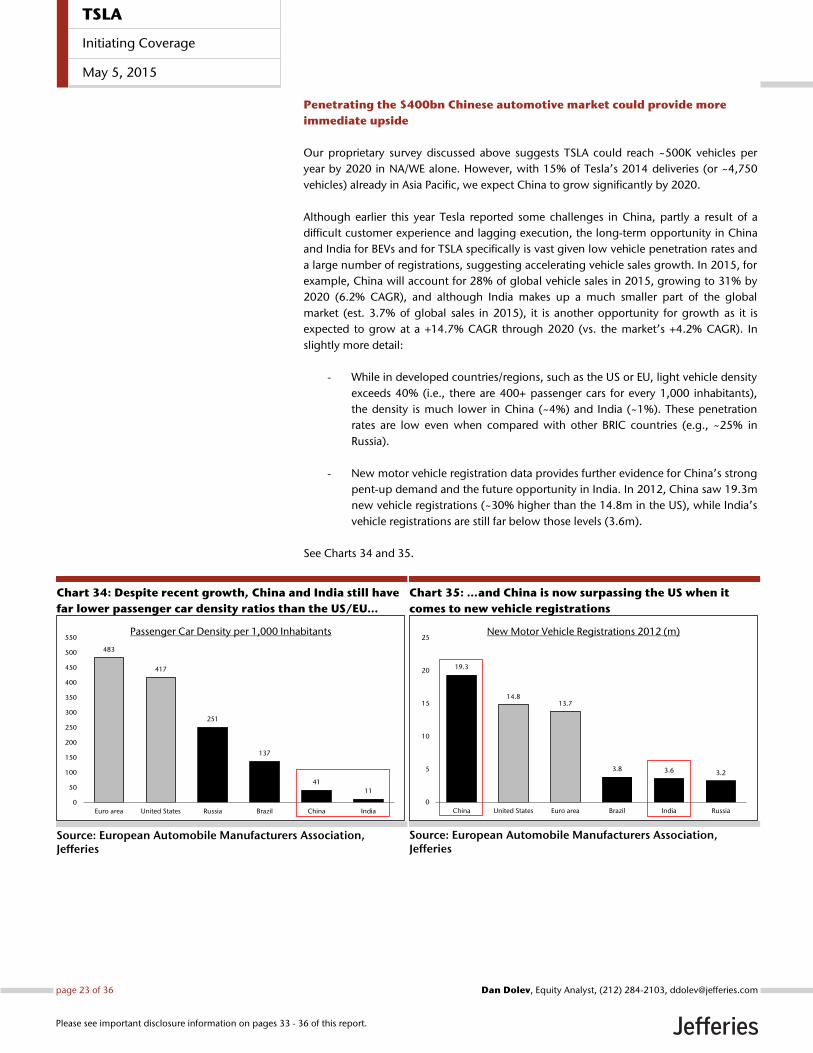
In summary…
Summarizing our gross margin, R&D, and advertising analyses above suggests that the
combination of a +36% revenue/GP CAGR, 350-450bps net R&D/advertising savings, and
SG&A costs (ex. advertising) roughly in line with other OEM peers (e.g. Ford/General
Motors’ 4.4-4.6%, respectively) should result in $5.1bn adj. EBITDA by 2020, or a 60%
EBITDA CAGR. See Chart 33.
Chart 33: Reducing net R&D/ad spend to peer levels should drive 350-450bps net savings, which coupled with lowering
SG&A as % of revenue results in a 60% 5-year EBITDA CAGR
Source: Company reports, Jefferies. *Non-GAAP when available.
Jury Still out on Home Battery but China, Fleet, and CPO Can Drive Near-Term Upside
Jury still out on Powerwall home battery
Just last week, Tesla introduced its Powerwall home battery stationary storage system (it
also aims to offer the product for businesses and utilities). Will the battery “change
fundamental energy infrastructure of the world” as CEO Elon Musk envisions? We believe
the jury is still out. At a price point of $3,000-3,500 for home applications, it may be a
compelling value proposition for solar panel users, as well as a potentially viable
alternative to backup generators (we estimate that comparable 7-10 kWh generators cost
$2,000-3,000). For example, if the entire ~600K US homes and businesses with solar
panels were to purchase the battery, the estimated market opportunity would near ~$2bn
(although we note that TSLA aims to market the battery to homes without solar panels, as
well as internationally…so that the market opportunity is arguably even larger).
Tesla 2015-2020E Operating Expense and Non-GAAP EBITDA Analysis
Operating Expenses FY '15E FY '16E FY '17E FY '18E FY '19E FY '20E
Research and Development (non-GAAP, $m) 567 784 1,026 1,567 1,555 1,616
% Y/Y Growth 41.0% 38.3% 30.9% 52.7% (0.8%) 3.9%
% of Revenue 9.9% 8.4% 8.0% 7.5% 6.5% 6.0%
Growth (bps) - (154) (40) (50) (100) (50)
Advertising and Marketing ($m) 89 164 251 450 550 687
% Y/Y Growth 81.6% 84.6% 53.0% 79.4% 22.3% 24.8%
% of Revenue 1.6% 1.8% 2.0% 2.2% 2.3% 2.6%
Growth (bps) - 20 20 20 15 25
SG&A ex. Advertising (non-GAAP, $m) 724 945 1,007 1,535 1,364 1,333
% Y/Y Growth 0.0% 30.5% 6.6% 52.5% (11.2%) (2.3%)
% of Revenue 12.7% 10.1% 7.8% 7.3% 5.7% 5.0%
Growth (bps) - (257) (227) (50) (165) (75)
Operating Income ($m) 130 720 1,182 1,886 2,822 3,490
% Margin 2.3% 7.7% 9.2% 9.0% 11.8% 13.0%
Growth (bps) - 543 150 (18) 277 117
Depreciation and Amortization ($m) 361 560 770 1,254 1,436 1,589
Non-GAAP EBITDA ($m) 491 1,280 1,952 3,139 4,257 5,079
% Margin 8.6% 13.7% 15.2% 15.0% 17.8% 18.9%
Growth (bps) - 510 150 (18) 277 107
Consensus Non-GAAP EBITDA ($m)* 478 1,147 1,669 2,375 3,249 3,900
% Margin 8.4% 12.9% 14.8% 15.3% 17.3% 17.9%
Implied Upside/(Downside) 3% 12% 17% 32% 31% 30%
TSLA
Initiating Coverage
May 5, 2015
page 22 of 36 , Equity Analyst, (212) 284-2103, [email protected] Dolev
Please see important disclosure information on pages 33 - 36 of this report.
Penetrating the $400bn Chinese automotive market could provide more
immediate upside
Our proprietary survey discussed above suggests TSLA could reach ~500K vehicles per
year by 2020 in NA/WE alone. However, with 15% of Tesla’s 2014 deliveries (or ~4,750
vehicles) already in Asia Pacific, we expect China to grow significantly by 2020.
Although earlier this year Tesla reported some challenges in China, partly a result of a
difficult customer experience and lagging execution, the long-term opportunity in China
and India for BEVs and for TSLA specifically is vast given low vehicle penetration rates and
a large number of registrations, suggesting accelerating vehicle sales growth. In 2015, for
example, China will account for 28% of global vehicle sales in 2015, growing to 31% by
2020 (6.2% CAGR), and although India makes up a much smaller part of the global
market (est. 3.7% of global sales in 2015), it is another opportunity for growth as it is
expected to grow at a +14.7% CAGR through 2020 (vs. the market’s +4.2% CAGR). In
slightly more detail:
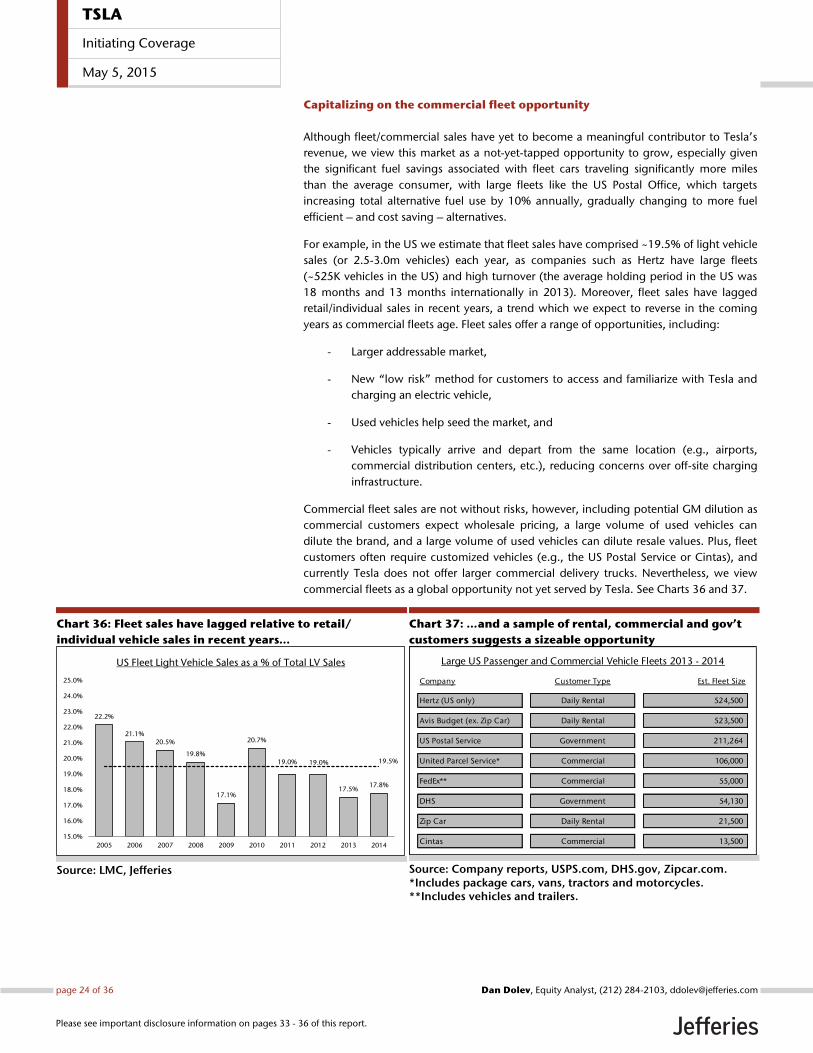
- While in developed countries/regions, such as the US or EU, light vehicle density
exceeds 40% (i.e., there are 400+ passenger cars for every 1,000 inhabitants),
the density is much lower in China (~4%) and India (~1%). These penetration
rates are low even when compared with other BRIC countries (e.g., ~25% in
Russia).
- New motor vehicle registration data provides further evidence for China’s strong
pent-up demand and the future opportunity in India. In 2012, China saw 19.3m
new vehicle registrations (~30% higher than the 14.8m in the US), while India’s
vehicle registrations are still far below those levels (3.6m).
See Charts 34 and 35.
Chart 34: Despite recent growth, China and India still have
far lower passenger car density ratios than the US/EU…
Source: European Automobile Manufacturers Association, Jefferies
Chart 35: …and China is now surpassing the US when it
comes to new vehicle registrations
Source: European Automobile Manufacturers Association, Jefferies
483
417
251
137
41
11
0
50
100
150
200
250
300
350
400
450
500
550
Euro area United States Russia Brazil China India
Passenger Car Density per 1,000 Inhabitants
19.3
14.813.7
3.8 3.6 3.2
0
5
10
15
20
25
China United States Euro area Brazil India Russia
New Motor Vehicle Registrations 2012 (m)
TSLA
Initiating Coverage
May 5, 2015
page 23 of 36 , Equity Analyst, (212) 284-2103, [email protected] Dolev
Please see important disclosure information on pages 33 - 36 of this report.
Capitalizing on the commercial fleet opportunity
Although fleet/commercial sales have yet to become a meaningful contributor to Tesla’s
revenue, we view this market as a not-yet-tapped opportunity to grow, especially given
the significant fuel savings associated with fleet cars traveling significantly more miles
than the average consumer, with large fleets like the US Postal Office, which targets
increasing total alternative fuel use by 10% annually, gradually changing to more fuel
efficient – and cost saving – alternatives.
For example, in the US we estimate that fleet sales have comprised ~19.5% of light vehicle
sales (or 2.5-3.0m vehicles) each year, as companies such as Hertz have large fleets
(~525K vehicles in the US) and high turnover (the average holding period in the US was
18 months and 13 months internationally in 2013). Moreover, fleet sales have lagged
retail/individual sales in recent years, a trend which we expect to reverse in the coming
years as commercial fleets age. Fleet sales offer a range of opportunities, including:
- Larger addressable market,
- New “low risk” method for customers to access and familiarize with Tesla and
charging an electric vehicle,
- Used vehicles help seed the market, and
- Vehicles typically arrive and depart from the same location (e.g., airports,
commercial distribution centers, etc.), reducing concerns over off-site charging
infrastructure.
Commercial fleet sales are not without risks, however, including potential GM dilution as
commercial customers expect wholesale pricing, a large volume of used vehicles can
dilute the brand, and a large volume of used vehicles can dilute resale values. Plus, fleet
customers often require customized vehicles (e.g., the US Postal Service or Cintas), and
currently Tesla does not offer larger commercial delivery trucks. Nevertheless, we view
commercial fleets as a global opportunity not yet served by Tesla. See Charts 36 and 37.
Chart 36: Fleet sales have lagged relative to retail/
individual vehicle sales in recent years…
Source: LMC, Jefferies
Chart 37: …and a sample of rental, commercial and gov’t
customers suggests a sizeable opportunity
Source: Company reports, USPS.com, DHS.gov, Zipcar.com. *Includes package cars, vans, tractors and motorcycles. **Includes vehicles and trailers.
22.2%
21.1% 20.5%
19.8%
17.1%
20.7%
19.0% 19.0%
17.5% 17.8%
19.5%
15.0%
16.0%
17.0%
18.0%
19.0%
20.0%
21.0%
22.0%
23.0%
24.0%
25.0%
2005 2006 2007 2008 2009 2010 2011 2012 2013 2014
US Fleet Light Vehicle Sales as a % of Total LV Sales Large US Passenger and Commercial Vehicle Fleets 2013 - 2014
Company Customer Type Est. Fleet Size
Hertz (US only) Daily Rental 524,500
Avis Budget (ex. Zip Car) Daily Rental 523,500
US Postal Service Government 211,264
United Parcel Service* Commercial 106,000
FedEx** Commercial 55,000
DHS Government 54,130
Zip Car Daily Rental 21,500
Cintas Commercial 13,500
TSLA
Initiating Coverage
May 5, 2015
page 24 of 36 , Equity Analyst, (212) 284-2103, [email protected] Dolev
Please see important disclosure information on pages 33 - 36 of this report.
Customers value the ability to trade-in their Tesla…which is an opportunity
for a Certified Pre-Owned program
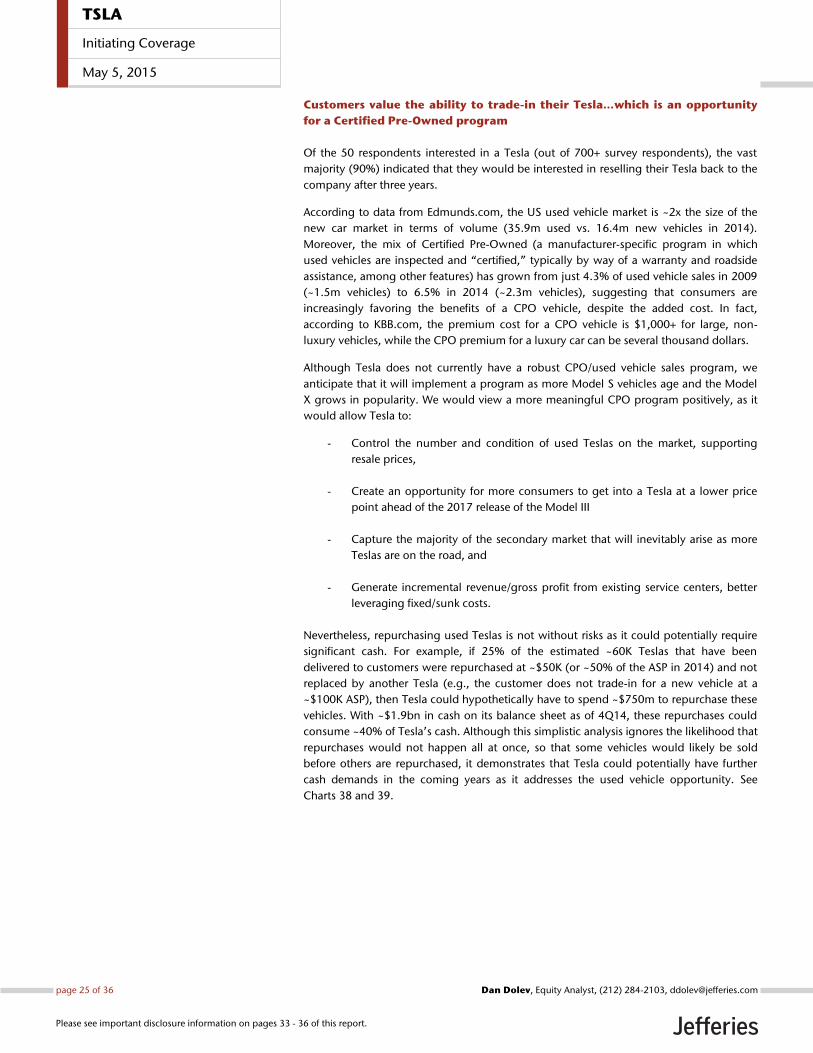
Of the 50 respondents interested in a Tesla (out of 700+ survey respondents), the vast
majority (90%) indicated that they would be interested in reselling their Tesla back to the
company after three years.
According to data from Edmunds.com, the US used vehicle market is ~2x the size of the
new car market in terms of volume (35.9m used vs. 16.4m new vehicles in 2014).
Moreover, the mix of Certified Pre-Owned (a manufacturer-specific program in which
used vehicles are inspected and “certified,” typically by way of a warranty and roadside
assistance, among other features) has grown from just 4.3% of used vehicle sales in 2009
(~1.5m vehicles) to 6.5% in 2014 (~2.3m vehicles), suggesting that consumers are
increasingly favoring the benefits of a CPO vehicle, despite the added cost. In fact,
according to KBB.com, the premium cost for a CPO vehicle is $1,000+ for large, non-
luxury vehicles, while the CPO premium for a luxury car can be several thousand dollars.
Although Tesla does not currently have a robust CPO/used vehicle sales program, we
anticipate that it will implement a program as more Model S vehicles age and the Model
X grows in popularity. We would view a more meaningful CPO program positively, as it
would allow Tesla to:
- Control the number and condition of used Teslas on the market, supporting
resale prices,
- Create an opportunity for more consumers to get into a Tesla at a lower price
point ahead of the 2017 release of the Model III
- Capture the majority of the secondary market that will inevitably arise as more
Teslas are on the road, and
- Generate incremental revenue/gross profit from existing service centers, better
leveraging fixed/sunk costs.
Nevertheless, repurchasing used Teslas is not without risks as it could potentially require
significant cash. For example, if 25% of the estimated ~60K Teslas that have been
delivered to customers were repurchased at ~$50K (or ~50% of the ASP in 2014) and not
replaced by another Tesla (e.g., the customer does not trade-in for a new vehicle at a
~$100K ASP), then Tesla could hypothetically have to spend ~$750m to repurchase these
vehicles. With ~$1.9bn in cash on its balance sheet as of 4Q14, these repurchases could
consume ~40% of Tesla’s cash. Although this simplistic analysis ignores the likelihood that
repurchases would not happen all at once, so that some vehicles would likely be sold
before others are repurchased, it demonstrates that Tesla could potentially have further
cash demands in the coming years as it addresses the used vehicle opportunity. See
Charts 38 and 39.
TSLA
Initiating Coverage
May 5, 2015
page 25 of 36 , Equity Analyst, (212) 284-2103, [email protected] Dolev
Please see important disclosure information on pages 33 - 36 of this report.
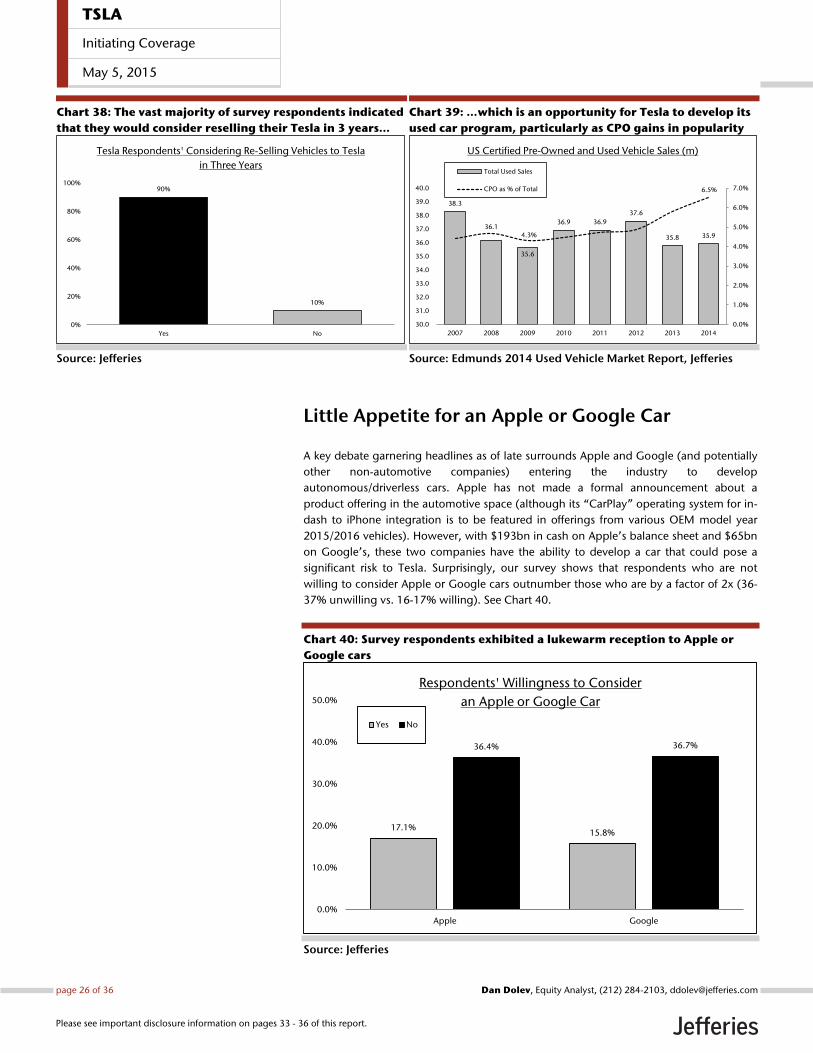
Chart 38: The vast majority of survey respondents indicated
that they would consider reselling their Tesla in 3 years…
Source: Jefferies
Chart 39: …which is an opportunity for Tesla to develop its
used car program, particularly as CPO gains in popularity
Source: Edmunds 2014 Used Vehicle Market Report, Jefferies
Little Appetite for an Apple or Google Car
A key debate garnering headlines as of late surrounds Apple and Google (and potentially
other non-automotive companies) entering the industry to develop
autonomous/driverless cars. Apple has not made a formal announcement about a
product offering in the automotive space (although its “CarPlay” operating system for in-
dash to iPhone integration is to be featured in offerings from various OEM model year
2015/2016 vehicles). However, with $193bn in cash on Apple’s balance sheet and $65bn
on Google’s, these two companies have the ability to develop a car that could pose a
significant risk to Tesla. Surprisingly, our survey shows that respondents who are not
willing to consider Apple or Google cars outnumber those who are by a factor of 2x (36-
37% unwilling vs. 16-17% willing). See Chart 40.
Chart 40: Survey respondents exhibited a lukewarm reception to Apple or
Google cars
Source: Jefferies
90%
10%
0%
20%
40%
60%
80%
100%
Yes No
Tesla Respondents' Considering Re-Selling Vehicles to Tesla
in Three Years
38.3
36.1
35.6
36.9 36.9
37.6
35.8 35.94.3%
6.5%
0.0%
1.0%
2.0%
3.0%
4.0%
5.0%
6.0%
7.0%
30.0
31.0
32.0
33.0
34.0
35.0
36.0
37.0
38.0
39.0
40.0
2007 2008 2009 2010 2011 2012 2013 2014
US Certified Pre-Owned and Used Vehicle Sales (m)
Total Used Sales
CPO as % of Total
17.1% 15.8%
36.4% 36.7%
0.0%
10.0%
20.0%
30.0%
40.0%
50.0%
Apple Google
Respondents' Willingness to Consider
an Apple or Google Car
Yes No
TSLA
Initiating Coverage
May 5, 2015
page 26 of 36 , Equity Analyst, (212) 284-2103, [email protected] Dolev
Please see important disclosure information on pages 33 - 36 of this report.
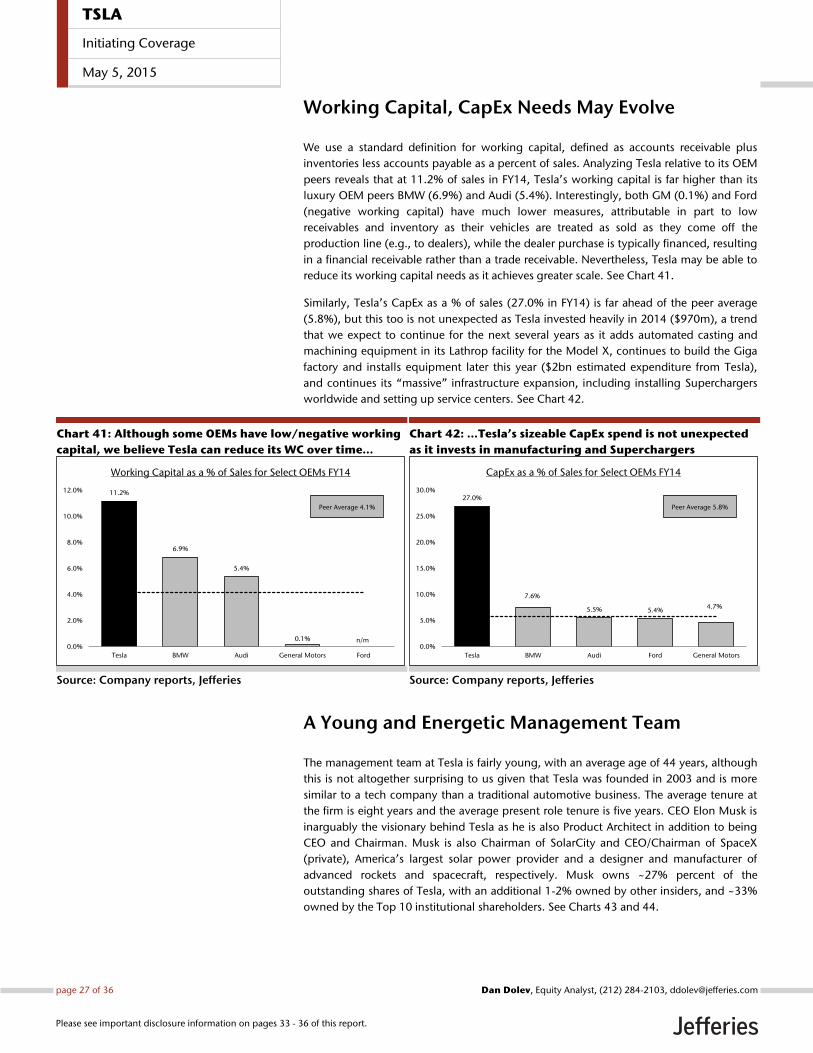
Working Capital, CapEx Needs May Evolve
We use a standard definition for working capital, defined as accounts receivable plus
inventories less accounts payable as a percent of sales. Analyzing Tesla relative to its OEM
peers reveals that at 11.2% of sales in FY14, Tesla’s working capital is far higher than its
luxury OEM peers BMW (6.9%) and Audi (5.4%). Interestingly, both GM (0.1%) and Ford
(negative working capital) have much lower measures, attributable in part to low
receivables and inventory as their vehicles are treated as sold as they come off the
production line (e.g., to dealers), while the dealer purchase is typically financed, resulting
in a financial receivable rather than a trade receivable. Nevertheless, Tesla may be able to
reduce its working capital needs as it achieves greater scale. See Chart 41.
Similarly, Tesla’s CapEx as a % of sales (27.0% in FY14) is far ahead of the peer average
(5.8%), but this too is not unexpected as Tesla invested heavily in 2014 ($970m), a trend
that we expect to continue for the next several years as it adds automated casting and
machining equipment in its Lathrop facility for the Model X, continues to build the Giga
factory and installs equipment later this year ($2bn estimated expenditure from Tesla),
and continues its “massive” infrastructure expansion, including installing Superchargers
worldwide and setting up service centers. See Chart 42.
Chart 41: Although some OEMs have low/negative working
capital, we believe Tesla can reduce its WC over time…
Source: Company reports, Jefferies
Chart 42: …Tesla’s sizeable CapEx spend is not unexpected
as it invests in manufacturing and Superchargers
Source: Company reports, Jefferies
A Young and Energetic Management Team
The management team at Tesla is fairly young, with an average age of 44 years, although
this is not altogether surprising to us given that Tesla was founded in 2003 and is more
similar to a tech company than a traditional automotive business. The average tenure at
the firm is eight years and the average present role tenure is five years. CEO Elon Musk is
inarguably the visionary behind Tesla as he is also Product Architect in addition to being
CEO and Chairman. Musk is also Chairman of SolarCity and CEO/Chairman of SpaceX
(private), America’s largest solar power provider and a designer and manufacturer of
advanced rockets and spacecraft, respectively. Musk owns ~27% percent of the
outstanding shares of Tesla, with an additional 1-2% owned by other insiders, and ~33%
owned by the Top 10 institutional shareholders. See Charts 43 and 44.
11.2%
6.9%
5.4%
0.1% n/m 0.0%
2.0%
4.0%
6.0%
8.0%
10.0%
12.0%
Tesla BMW Audi General Motors Ford
Working Capital as a % of Sales for Select OEMs FY14
Peer Average 4.1%
27.0%
7.6%
5.5% 5.4% 4.7%
0.0%
5.0%
10.0%
15.0%
20.0%
25.0%
30.0%
Tesla BMW Audi Ford General Motors
CapEx as a % of Sales for Select OEMs FY14
Peer Average 5.8%
TSLA
Initiating Coverage
May 5, 2015
page 27 of 36 , Equity Analyst, (212) 284-2103, [email protected] Dolev
Please see important disclosure information on pages 33 - 36 of this report.
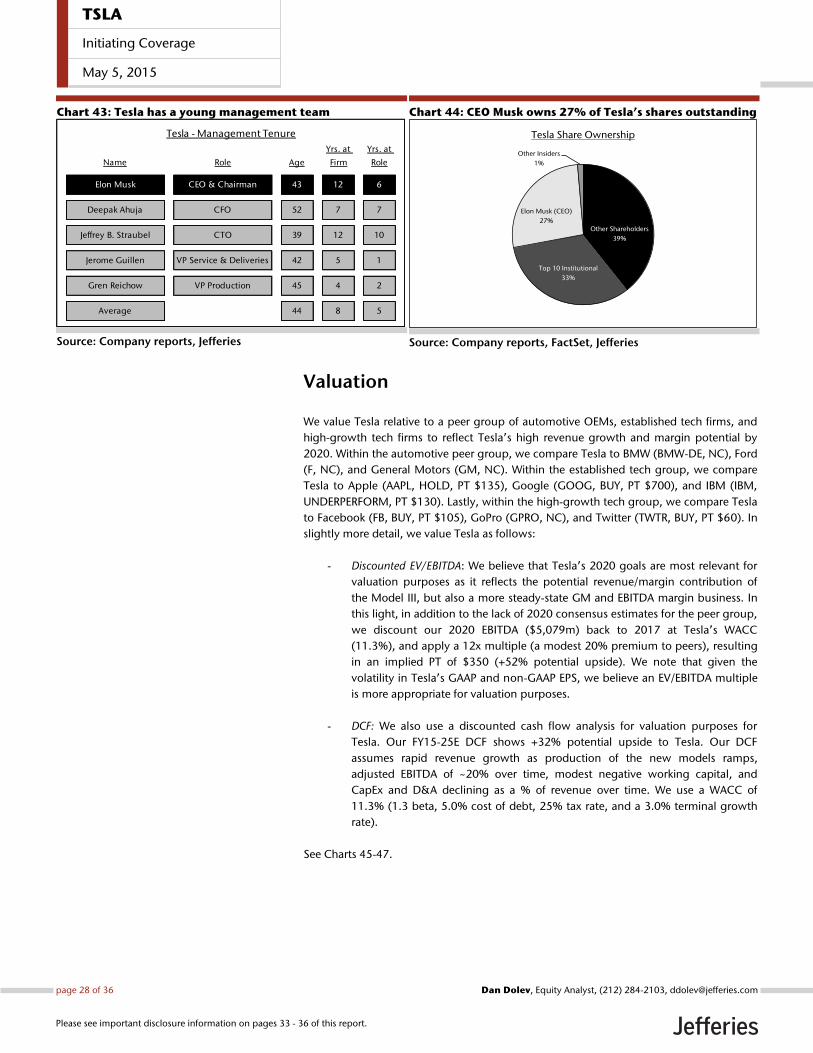
Chart 43: Tesla has a young management team
Source: Company reports, Jefferies
Chart 44: CEO Musk owns 27% of Tesla’s shares outstanding
Source: Company reports, FactSet, Jefferies
Valuation
We value Tesla relative to a peer group of automotive OEMs, established tech firms, and
high-growth tech firms to reflect Tesla’s high revenue growth and margin potential by
2020. Within the automotive peer group, we compare Tesla to BMW (BMW-DE, NC), Ford
(F, NC), and General Motors (GM, NC). Within the established tech group, we compare
Tesla to Apple (AAPL, HOLD, PT $135), Google (GOOG, BUY, PT $700), and IBM (IBM,
UNDERPERFORM, PT $130). Lastly, within the high-growth tech group, we compare Tesla
to Facebook (FB, BUY, PT $105), GoPro (GPRO, NC), and Twitter (TWTR, BUY, PT $60). In
slightly more detail, we value Tesla as follows:
- Discounted EV/EBITDA: We believe that Tesla’s 2020 goals are most relevant for
valuation purposes as it reflects the potential revenue/margin contribution of
the Model III, but also a more steady-state GM and EBITDA margin business. In
this light, in addition to the lack of 2020 consensus estimates for the peer group,
we discount our 2020 EBITDA ($5,079m) back to 2017 at Tesla’s WACC
(11.3%), and apply a 12x multiple (a modest 20% premium to peers), resulting
in an implied PT of $350 (+52% potential upside). We note that given the
volatility in Tesla’s GAAP and non-GAAP EPS, we believe an EV/EBITDA multiple
is more appropriate for valuation purposes.
- DCF: We also use a discounted cash flow analysis for valuation purposes for
Tesla. Our FY15-25E DCF shows +32% potential upside to Tesla. Our DCF
assumes rapid revenue growth as production of the new models ramps,
adjusted EBITDA of ~20% over time, modest negative working capital, and
CapEx and D&A declining as a % of revenue over time. We use a WACC of
11.3% (1.3 beta, 5.0% cost of debt, 25% tax rate, and a 3.0% terminal growth
rate).
See Charts 45-47.
Tesla - Management Tenure
Name Role Age
Yrs. at
Firm
Yrs. at
Role
Elon Musk CEO & Chairman 43 12 6
Deepak Ahuja CFO 52 7 7
Jeffrey B. Straubel CTO 39 12 10
Jerome Guillen VP Service & Deliveries 42 5 1
Gren Reichow VP Production 45 4 2
Average 44 8 5
Other Shareholders
39%
Top 10 Institutional
33%
Elon Musk (CEO)
27%
Other Insiders
1%
Tesla Share Ownership
TSLA
Initiating Coverage
May 5, 2015
page 28 of 36 , Equity Analyst, (212) 284-2103, [email protected] Dolev
Please see important disclosure information on pages 33 - 36 of this report.
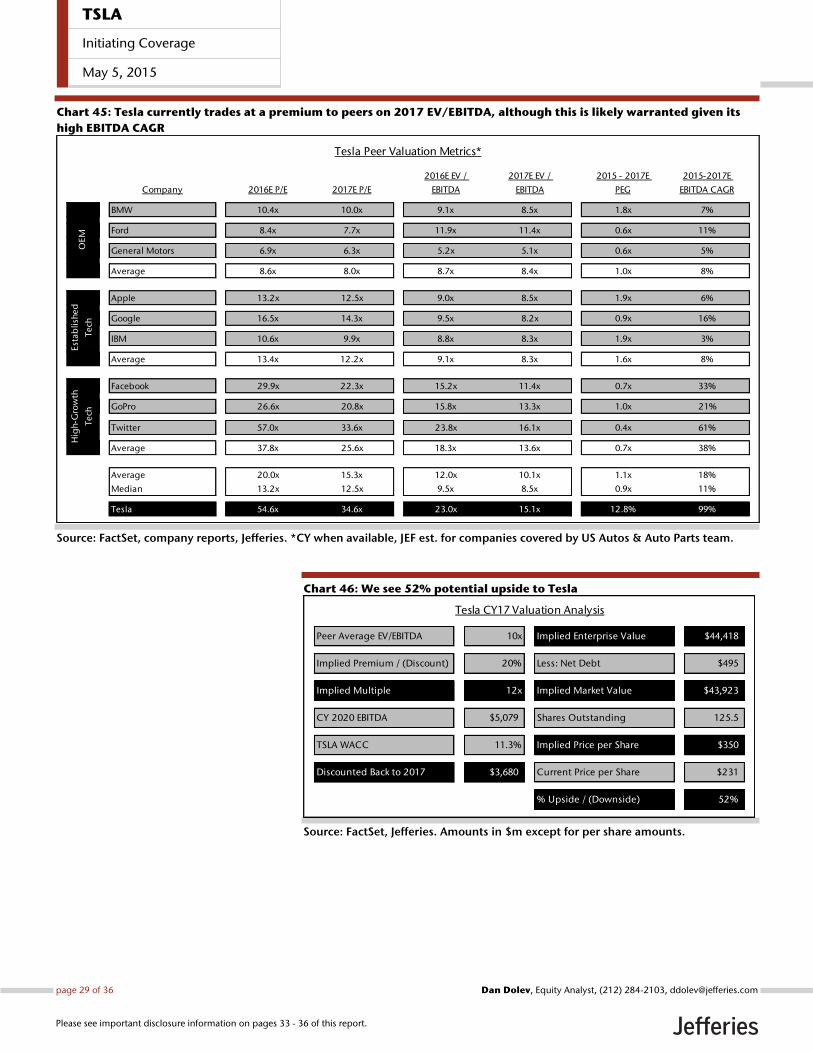
Chart 45: Tesla currently trades at a premium to peers on 2017 EV/EBITDA, although this is likely warranted given its
high EBITDA CAGR
Source: FactSet, company reports, Jefferies. *CY when available, JEF est. for companies covered by US Autos & Auto Parts team.
Chart 46: We see 52% potential upside to Tesla
Source: FactSet, Jefferies. Amounts in $m except for per share amounts.
Tesla Peer Valuation Metrics*
Company 2016E P/E 2017E P/E
2016E EV /
EBITDA
2017E EV /
EBITDA
2015 - 2017E
PEG
2015-2017E
EBITDA CAGR
BMW 10.4x 10.0x 9.1x 8.5x 1.8x 7%
Ford 8.4x 7.7x 11.9x 11.4x 0.6x 11%
General Motors 6.9x 6.3x 5.2x 5.1x 0.6x 5%
Average 8.6x 8.0x 8.7x 8.4x 1.0x 8%
Apple 13.2x 12.5x 9.0x 8.5x 1.9x 6%
Google 16.5x 14.3x 9.5x 8.2x 0.9x 16%
IBM 10.6x 9.9x 8.8x 8.3x 1.9x 3%
Average 13.4x 12.2x 9.1x 8.3x 1.6x 8%
Facebook 29.9x 22.3x 15.2x 11.4x 0.7x 33%
GoPro 26.6x 20.8x 15.8x 13.3x 1.0x 21%
Twitter 57.0x 33.6x 23.8x 16.1x 0.4x 61%
Average 37.8x 25.6x 18.3x 13.6x 0.7x 38%
Average 20.0x 15.3x 12.0x 10.1x 1.1x 18%
Median 13.2x 12.5x 9.5x 8.5x 0.9x 11%
Tesla 54.6x 34.6x 23.0x 15.1x 12.8% 99%
OE
ME
sta
bli
she
d
Te
ch
Hig
h-G
row
th
Te
ch
Tesla CY17 Valuation Analysis
Peer Average EV/EBITDA 10x Implied Enterprise Value $44,418
Implied Premium / (Discount) 20% Less: Net Debt $495
Implied Multiple 12x Implied Market Value $43,923
CY 2020 EBITDA $5,079 Shares Outstanding 125.5
WACC from DCF>> TSLA WACC 11.3% Implied Price per Share $350
Discounted Back to 2017 $3,680 Current Price per Share $231
% Upside / (Downside) 52%
TSLA
Initiating Coverage
May 5, 2015
page 29 of 36 , Equity Analyst, (212) 284-2103, [email protected] Dolev
Please see important disclosure information on pages 33 - 36 of this report.
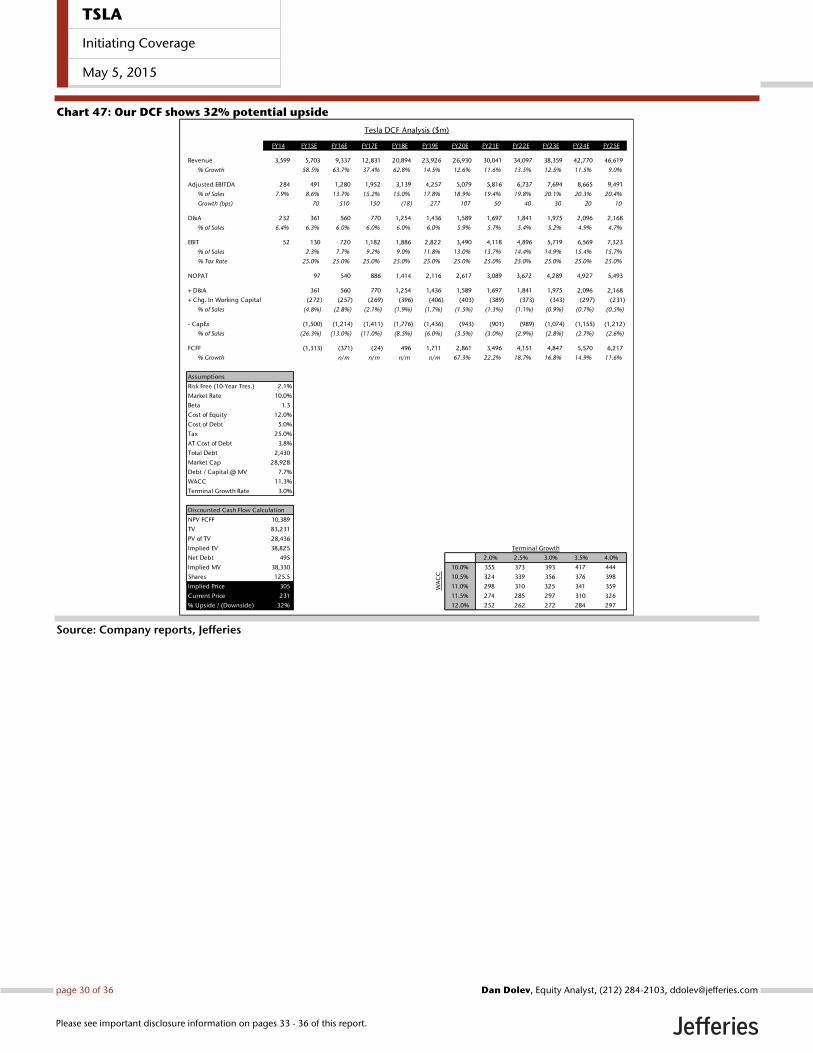
Chart 47: Our DCF shows 32% potential upside
Source: Company reports, Jefferies
Tesla DCF Analysis ($m)
FY14 FY15E FY16E FY17E FY18E FY19E FY20E FY21E FY22E FY23E FY24E FY25E
Revenue 3,599 5,703 9,337 12,831 20,894 23,926 26,930 30,041 34,097 38,359 42,770 46,619
% Growth 58.5% 63.7% 37.4% 62.8% 14.5% 12.6% 11.6% 13.5% 12.5% 11.5% 9.0%
Adjusted EBITDA 284 491 1,280 1,952 3,139 4,257 5,079 5,816 6,737 7,694 8,665 9,491
% of Sales 7.9% 8.6% 13.7% 15.2% 15.0% 17.8% 18.9% 19.4% 19.8% 20.1% 20.3% 20.4%
Growth (bps) 70 510 150 (18) 277 107 50 40 30 20 10
D&A 232 361 560 770 1,254 1,436 1,589 1,697 1,841 1,975 2,096 2,168
% of Sales 6.4% 6.3% 6.0% 6.0% 6.0% 6.0% 5.9% 5.7% 5.4% 5.2% 4.9% 4.7%
EBIT 52 130 720 1,182 1,886 2,822 3,490 4,118 4,896 5,719 6,569 7,323
% of Sales 2.3% 7.7% 9.2% 9.0% 11.8% 13.0% 13.7% 14.4% 14.9% 15.4% 15.7%
% Tax Rate 25.0% 25.0% 25.0% 25.0% 25.0% 25.0% 25.0% 25.0% 25.0% 25.0% 25.0%
NOPAT 97 540 886 1,414 2,116 2,617 3,089 3,672 4,289 4,927 5,493
+ D&A 361 560 770 1,254 1,436 1,589 1,697 1,841 1,975 2,096 2,168
+ Chg. In Working Capital (272) (257) (269) (396) (406) (403) (389) (373) (343) (297) (231)
% of Sales (4.8%) (2.8%) (2.1%) (1.9%) (1.7%) (1.5%) (1.3%) (1.1%) (0.9%) (0.7%) (0.5%)
- CapEx (1,500) (1,214) (1,411) (1,776) (1,436) (943) (901) (989) (1,074) (1,155) (1,212)
% of Sales (26.3%) (13.0%) (11.0%) (8.5%) (6.0%) (3.5%) (3.0%) (2.9%) (2.8%) (2.7%) (2.6%)
FCFF (1,313) (371) (24) 496 1,711 2,861 3,496 4,151 4,847 5,570 6,217
% Growth n/m n/m n/m n/m 67.3% 22.2% 18.7% 16.8% 14.9% 11.6%
Assumptions
Risk Free (10-Year Tres.) 2.1%
Market Rate 10.0%
Beta 1.3
Cost of Equity 12.0%
Cost of Debt 5.0%
Tax 25.0%
AT Cost of Debt 3.8%
Total Debt 2,430
Market Cap 28,928
Debt / Capital @ MV 7.7%
WACC 11.3%
Terminal Growth Rate 3.0%
Discounted Cash Flow Calculation
NPV FCFF 10,389
TV 83,231
PV of TV 28,436
Implied EV 38,825 Terminal Growth
Net Debt 495 2.0% 2.5% 3.0% 3.5% 4.0%
Implied MV 38,330 10.0% 355 373 393 417 444
Shares 125.5 10.5% 324 339 356 376 398
Implied Price 305 11.0% 298 310 325 341 359
Current Price 231 11.5% 274 285 297 310 326
% Upside / (Downside) 32% 12.0% 252 262 272 284 297
WA
CC
TSLA
Initiating Coverage
May 5, 2015
page 30 of 36 , Equity Analyst, (212) 284-2103, [email protected] Dolev
Please see important disclosure information on pages 33 - 36 of this report.
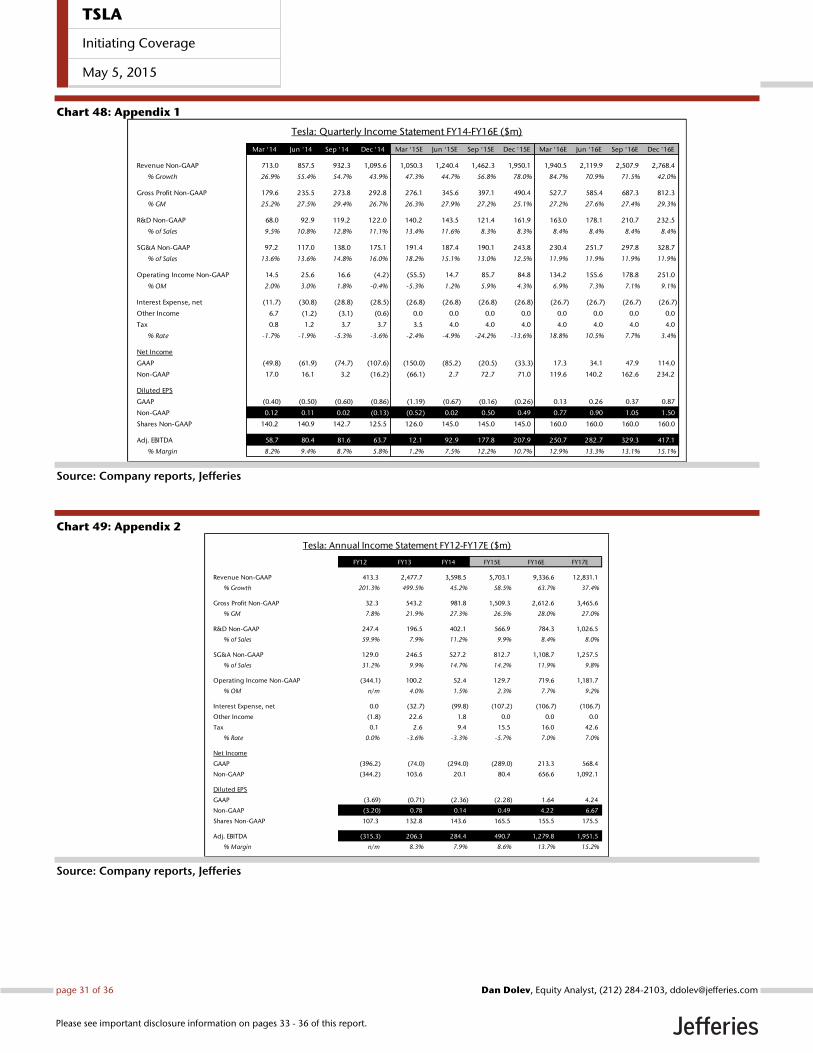
Chart 48: Appendix 1
Source: Company reports, Jefferies
Chart 49: Appendix 2
Source: Company reports, Jefferies
Tesla: Quarterly Income Statement FY14-FY16E ($m)
Mar '14 Jun '14 Sep '14 Dec '14 Mar '15E Jun '15E Sep '15E Dec '15E Mar '16E Jun '16E Sep '16E Dec '16E
Revenue Non-GAAP 713.0 857.5 932.3 1,095.6 1,050.3 1,240.4 1,462.3 1,950.1 1,940.5 2,119.9 2,507.9 2,768.4
% Growth 26.9% 55.4% 54.7% 43.9% 47.3% 44.7% 56.8% 78.0% 84.7% 70.9% 71.5% 42.0%
Gross Profit Non-GAAP 179.6 235.5 273.8 292.8 276.1 345.6 397.1 490.4 527.7 585.4 687.3 812.3
% GM 25.2% 27.5% 29.4% 26.7% 26.3% 27.9% 27.2% 25.1% 27.2% 27.6% 27.4% 29.3%
R&D Non-GAAP 68.0 92.9 119.2 122.0 140.2 143.5 121.4 161.9 163.0 178.1 210.7 232.5
% of Sales 9.5% 10.8% 12.8% 11.1% 13.4% 11.6% 8.3% 8.3% 8.4% 8.4% 8.4% 8.4%
SG&A Non-GAAP 97.2 117.0 138.0 175.1 191.4 187.4 190.1 243.8 230.4 251.7 297.8 328.7
% of Sales 13.6% 13.6% 14.8% 16.0% 18.2% 15.1% 13.0% 12.5% 11.9% 11.9% 11.9% 11.9%
Operating Income Non-GAAP 14.5 25.6 16.6 (4.2) (55.5) 14.7 85.7 84.8 134.2 155.6 178.8 251.0
% OM 2.0% 3.0% 1.8% -0.4% -5.3% 1.2% 5.9% 4.3% 6.9% 7.3% 7.1% 9.1%
Interest Expense, net (11.7) (30.8) (28.8) (28.5) (26.8) (26.8) (26.8) (26.8) (26.7) (26.7) (26.7) (26.7)
Other Income 6.7 (1.2) (3.1) (0.6) 0.0 0.0 0.0 0.0 0.0 0.0 0.0 0.0
Tax 0.8 1.2 3.7 3.7 3.5 4.0 4.0 4.0 4.0 4.0 4.0 4.0
% Rate -1.7% -1.9% -5.3% -3.6% -2.4% -4.9% -24.2% -13.6% 18.8% 10.5% 7.7% 3.4%
Net Income
GAAP (49.8) (61.9) (74.7) (107.6) (150.0) (85.2) (20.5) (33.3) 17.3 34.1 47.9 114.0
Non-GAAP 17.0 16.1 3.2 (16.2) (66.1) 2.7 72.7 71.0 119.6 140.2 162.6 234.2
Diluted EPS
GAAP (0.40) (0.50) (0.60) (0.86) (1.19) (0.67) (0.16) (0.26) 0.13 0.26 0.37 0.87
Non-GAAP 0.12 0.11 0.02 (0.13) (0.52) 0.02 0.50 0.49 0.77 0.90 1.05 1.50
Shares Non-GAAP 140.2 140.9 142.7 125.5 126.0 145.0 145.0 145.0 160.0 160.0 160.0 160.0
Adj. EBITDA 58.7 80.4 81.6 63.7 12.1 92.9 177.8 207.9 250.7 282.7 329.3 417.1
% Margin 8.2% 9.4% 8.7% 5.8% 1.2% 7.5% 12.2% 10.7% 12.9% 13.3% 13.1% 15.1%
Tesla: Annual Income Statement FY12-FY17E ($m) Tesla: Quarterly Income Statement FY14-FY16E ($m)
FY12 FY13 FY14 FY15E FY16E FY17E
Revenue Non-GAAP 413.3 2,477.7 3,598.5 5,703.1 9,336.6 12,831.1
% Growth 201.3% 499.5% 45.2% 58.5% 63.7% 37.4%
Gross Profit Non-GAAP 32.3 543.2 981.8 1,509.3 2,612.6 3,465.6
% GM 7.8% 21.9% 27.3% 26.5% 28.0% 27.0%
R&D Non-GAAP 247.4 196.5 402.1 566.9 784.3 1,026.5
% of Sales 59.9% 7.9% 11.2% 9.9% 8.4% 8.0%
SG&A Non-GAAP 129.0 246.5 527.2 812.7 1,108.7 1,257.5
% of Sales 31.2% 9.9% 14.7% 14.2% 11.9% 9.8%
Operating Income Non-GAAP (344.1) 100.2 52.4 129.7 719.6 1,181.7
% OM n/m 4.0% 1.5% 2.3% 7.7% 9.2%
Interest Expense, net 0.0 (32.7) (99.8) (107.2) (106.7) (106.7)
Other Income (1.8) 22.6 1.8 0.0 0.0 0.0
Tax 0.1 2.6 9.4 15.5 16.0 42.6
% Rate 0.0% -3.6% -3.3% -5.7% 7.0% 7.0%
Net Income
GAAP (396.2) (74.0) (294.0) (289.0) 213.3 568.4
Non-GAAP (344.2) 103.6 20.1 80.4 656.6 1,092.1
Diluted EPS
GAAP (3.69) (0.71) (2.36) (2.28) 1.64 4.24
Non-GAAP (3.20) 0.78 0.14 0.49 4.22 6.67
Shares Non-GAAP 107.3 132.8 143.6 165.5 155.5 175.5
Adj. EBITDA (315.3) 206.3 284.4 490.7 1,279.8 1,951.5
% Margin n/m 8.3% 7.9% 8.6% 13.7% 15.2%
TSLA
Initiating Coverage
May 5, 2015
page 31 of 36 , Equity Analyst, (212) 284-2103, [email protected] Dolev
Please see important disclosure information on pages 33 - 36 of this report.
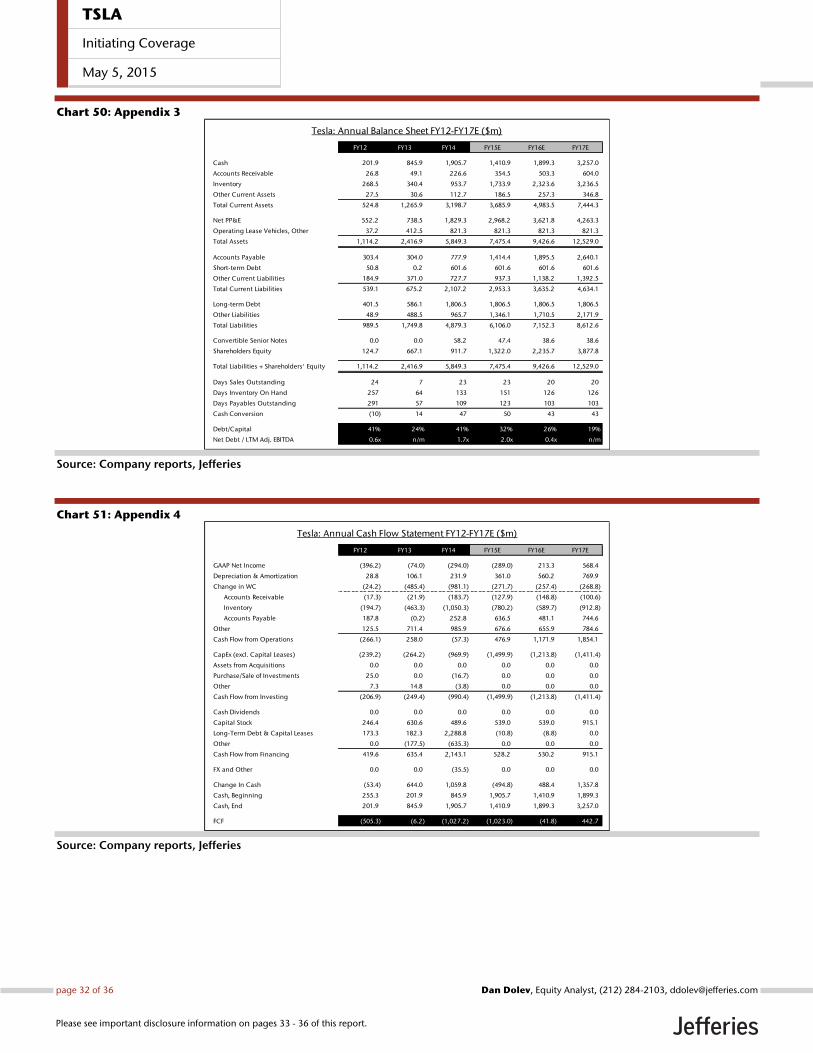
Chart 50: Appendix 3
Source: Company reports, Jefferies
Chart 51: Appendix 4
Source: Company reports, Jefferies
Tesla: Annual Balance Sheet FY12-FY17E ($m)
FY12 FY13 FY14 FY15E FY16E FY17E
Cash 201.9 845.9 1,905.7 1,410.9 1,899.3 3,257.0
Accounts Receivable 26.8 49.1 226.6 354.5 503.3 604.0
Inventory 268.5 340.4 953.7 1,733.9 2,323.6 3,236.5
Other Current Assets 27.5 30.6 112.7 186.5 257.3 346.8
Total Current Assets 524.8 1,265.9 3,198.7 3,685.9 4,983.5 7,444.3
Net PP&E 552.2 738.5 1,829.3 2,968.2 3,621.8 4,263.3
Operating Lease Vehicles, Other 37.2 412.5 821.3 821.3 821.3 821.3
Total Assets 1,114.2 2,416.9 5,849.3 7,475.4 9,426.6 12,529.0
Accounts Payable 303.4 304.0 777.9 1,414.4 1,895.5 2,640.1
Short-term Debt 50.8 0.2 601.6 601.6 601.6 601.6
Other Current Liabilities 184.9 371.0 727.7 937.3 1,138.2 1,392.5
Total Current Liabilities 539.1 675.2 2,107.2 2,953.3 3,635.2 4,634.1
Long-term Debt 401.5 586.1 1,806.5 1,806.5 1,806.5 1,806.5
Other Liabilities 48.9 488.5 965.7 1,346.1 1,710.5 2,171.9
Total Liabilities 989.5 1,749.8 4,879.3 6,106.0 7,152.3 8,612.6
Convertible Senior Notes 0.0 0.0 58.2 47.4 38.6 38.6
Shareholders Equity 124.7 667.1 911.7 1,322.0 2,235.7 3,877.8
Total Liabilities + Shareholders' Equity 1,114.2 2,416.9 5,849.3 7,475.4 9,426.6 12,529.0
Days Sales Outstanding 24 7 23 23 20 20
Days Inventory On Hand 257 64 133 151 126 126
Days Payables Outstanding 291 57 109 123 103 103
Cash Conversion (10) 14 47 50 43 43
Debt/Capital 41% 24% 41% 32% 26% 19%
Net Debt / LTM Adj. EBITDA 0.6x n/m 1.7x 2.0x 0.4x n/m
Tesla: Annual Cash Flow Statement FY12-FY17E ($m)
FY12 FY13 FY14 FY15E FY16E FY17E
GAAP Net Income (396.2) (74.0) (294.0) (289.0) 213.3 568.4
Depreciation & Amortization 28.8 106.1 231.9 361.0 560.2 769.9
Change in WC (24.2) (485.4) (981.1) (271.7) (257.4) (268.8)
Accounts Receivable (17.3) (21.9) (183.7) (127.9) (148.8) (100.6)
Inventory (194.7) (463.3) (1,050.3) (780.2) (589.7) (912.8)
Accounts Payable 187.8 (0.2) 252.8 636.5 481.1 744.6
Other 125.5 711.4 985.9 676.6 655.9 784.6
Cash Flow from Operations (266.1) 258.0 (57.3) 476.9 1,171.9 1,854.1
CapEx (excl. Capital Leases) (239.2) (264.2) (969.9) (1,499.9) (1,213.8) (1,411.4)
Assets from Acquisitions 0.0 0.0 0.0 0.0 0.0 0.0
Purchase/Sale of Investments 25.0 0.0 (16.7) 0.0 0.0 0.0
Other 7.3 14.8 (3.8) 0.0 0.0 0.0
Cash Flow from Investing (206.9) (249.4) (990.4) (1,499.9) (1,213.8) (1,411.4)
Cash Dividends 0.0 0.0 0.0 0.0 0.0 0.0
Capital Stock 246.4 630.6 489.6 539.0 539.0 915.1
Long-Term Debt & Capital Leases 173.3 182.3 2,288.8 (10.8) (8.8) 0.0
Other 0.0 (177.5) (635.3) 0.0 0.0 0.0
Cash Flow from Financing 419.6 635.4 2,143.1 528.2 530.2 915.1
FX and Other 0.0 0.0 (35.5) 0.0 0.0 0.0
Change In Cash (53.4) 644.0 1,059.8 (494.8) 488.4 1,357.8
Cash, Beginning 255.3 201.9 845.9 1,905.7 1,410.9 1,899.3
Cash, End 201.9 845.9 1,905.7 1,410.9 1,899.3 3,257.0
FCF (505.3) (6.2) (1,027.2) (1,023.0) (41.8) 442.7
TSLA
Initiating Coverage
May 5, 2015
page 32 of 36 , Equity Analyst, (212) 284-2103, [email protected] Dolev
Please see important disclosure information on pages 33 - 36 of this report.
Company DescriptionTesla Motors, Inc. designs, develops, manufactures, and sells high-performance, luxury, fully electric passenger vehicles, electric vehiclepowertrain components, and stationary energy storage systems. Tesla sells its vehicles directly to consumers globally through its companyowned-stores and galleries, and via phone and internet purchases. The company competes with other automotive original equipmentmanufacturers (OEMs) as well as other automotive component suppliers and stationary energy storage manufacturers. Tesla manufactures/assembles its vehicles in California and the Netherlands, and sells its vehicles in the US, Canada, the Netherlands, UK, Germany, Australia,Japan, China, Hong Kong, and other countries. The company was founded in 2003 and is headquartered in Palo Alto, California, USA.
Analyst Certification:I, Dan Dolev, certify that all of the views expressed in this research report accurately reflect my personal views about the subject security(ies) andsubject company(ies). I also certify that no part of my compensation was, is, or will be, directly or indirectly, related to the specific recommendationsor views expressed in this research report.I, Trevor Young, CFA, certify that all of the views expressed in this research report accurately reflect my personal views about the subject security(ies) andsubject company(ies). I also certify that no part of my compensation was, is, or will be, directly or indirectly, related to the specific recommendationsor views expressed in this research report.As is the case with all Jefferies employees, the analyst(s) responsible for the coverage of the financial instruments discussed in this report receivescompensation based in part on the overall performance of the firm, including investment banking income. We seek to update our research asappropriate, but various regulations may prevent us from doing so. Aside from certain industry reports published on a periodic basis, the large majorityof reports are published at irregular intervals as appropriate in the analyst's judgement.
Company Specific DisclosuresFor Important Disclosure information on companies recommended in this report, please visit our website at https://javatar.bluematrix.com/sellside/Disclosures.action or call 212.284.2300.
Meanings of Jefferies RatingsBuy - Describes stocks that we expect to provide a total return (price appreciation plus yield) of 15% or more within a 12-month period.Hold - Describes stocks that we expect to provide a total return (price appreciation plus yield) of plus 15% or minus 10% within a 12-month period.Underperform - Describes stocks that we expect to provide a total negative return (price appreciation plus yield) of 10% or more within a 12-monthperiod.The expected total return (price appreciation plus yield) for Buy rated stocks with an average stock price consistently below $10 is 20% or more withina 12-month period as these companies are typically more volatile than the overall stock market. For Hold rated stocks with an average stock priceconsistently below $10, the expected total return (price appreciation plus yield) is plus or minus 20% within a 12-month period. For Underperformrated stocks with an average stock price consistently below $10, the expected total return (price appreciation plus yield) is minus 20% within a 12-month period.NR - The investment rating and price target have been temporarily suspended. Such suspensions are in compliance with applicable regulations and/or Jefferies policies.CS - Coverage Suspended. Jefferies has suspended coverage of this company.NC - Not covered. Jefferies does not cover this company.Restricted - Describes issuers where, in conjunction with Jefferies engagement in certain transactions, company policy or applicable securitiesregulations prohibit certain types of communications, including investment recommendations.Monitor - Describes stocks whose company fundamentals and financials are being monitored, and for which no financial projections or opinions onthe investment merits of the company are provided.
Valuation MethodologyJefferies' methodology for assigning ratings may include the following: market capitalization, maturity, growth/value, volatility and expected totalreturn over the next 12 months. The price targets are based on several methodologies, which may include, but are not restricted to, analyses of marketrisk, growth rate, revenue stream, discounted cash flow (DCF), EBITDA, EPS, cash flow (CF), free cash flow (FCF), EV/EBITDA, P/E, PE/growth, P/CF,P/FCF, premium (discount)/average group EV/EBITDA, premium (discount)/average group P/E, sum of the parts, net asset value, dividend returns,and return on equity (ROE) over the next 12 months.
Jefferies Franchise PicksJefferies Franchise Picks include stock selections from among the best stock ideas from our equity analysts over a 12 month period. Stock selectionis based on fundamental analysis and may take into account other factors such as analyst conviction, differentiated analysis, a favorable risk/rewardratio and investment themes that Jefferies analysts are recommending. Jefferies Franchise Picks will include only Buy rated stocks and the numbercan vary depending on analyst recommendations for inclusion. Stocks will be added as new opportunities arise and removed when the reason forinclusion changes, the stock has met its desired return, if it is no longer rated Buy and/or if it triggers a stop loss. Stocks having 120 day volatility inthe bottom quartile of S&P stocks will continue to have a 15% stop loss, and the remainder will have a 20% stop. Franchise Picks are not intendedto represent a recommended portfolio of stocks and is not sector based, but we may note where we believe a Pick falls within an investment stylesuch as growth or value.
TSLA
Initiating Coverage
May 5, 2015
page 33 of 36 , Equity Analyst, (212) 284-2103, [email protected] Dolev
Please see important disclosure information on pages 33 - 36 of this report.
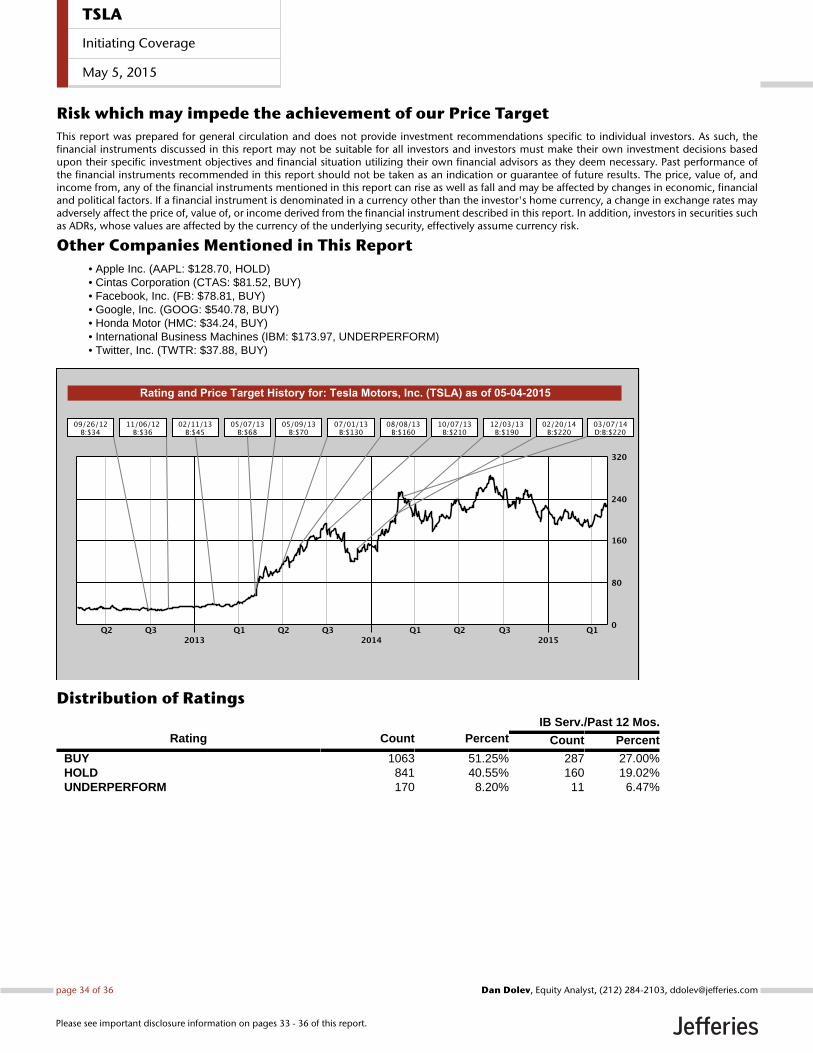
Risk which may impede the achievement of our Price TargetThis report was prepared for general circulation and does not provide investment recommendations specific to individual investors. As such, thefinancial instruments discussed in this report may not be suitable for all investors and investors must make their own investment decisions basedupon their specific investment objectives and financial situation utilizing their own financial advisors as they deem necessary. Past performance ofthe financial instruments recommended in this report should not be taken as an indication or guarantee of future results. The price, value of, andincome from, any of the financial instruments mentioned in this report can rise as well as fall and may be affected by changes in economic, financialand political factors. If a financial instrument is denominated in a currency other than the investor's home currency, a change in exchange rates mayadversely affect the price of, value of, or income derived from the financial instrument described in this report. In addition, investors in securities suchas ADRs, whose values are affected by the currency of the underlying security, effectively assume currency risk.
Other Companies Mentioned in This Report• Apple Inc. (AAPL: $128.70, HOLD)• Cintas Corporation (CTAS: $81.52, BUY)• Facebook, Inc. (FB: $78.81, BUY)• Google, Inc. (GOOG: $540.78, BUY)• Honda Motor (HMC: $34.24, BUY)• International Business Machines (IBM: $173.97, UNDERPERFORM)• Twitter, Inc. (TWTR: $37.88, BUY)
Distribution of RatingsIB Serv./Past 12 Mos.
Rating Count Percent Count Percent
BUY 1063 51.25% 287 27.00%HOLD 841 40.55% 160 19.02%UNDERPERFORM 170 8.20% 11 6.47%
TSLA
Initiating Coverage
May 5, 2015
page 34 of 36 , Equity Analyst, (212) 284-2103, [email protected] Dolev
Please see important disclosure information on pages 33 - 36 of this report.
Other Important Disclosures
Jefferies Equity Research refers to research reports produced by analysts employed by one of the following Jefferies Group LLC (“Jefferies”) groupcompanies:
United States: Jefferies LLC which is an SEC registered firm and a member of FINRA.
United Kingdom: Jefferies International Limited, which is authorized and regulated by the Financial Conduct Authority; registered in England andWales No. 1978621; registered office: Vintners Place, 68 Upper Thames Street, London EC4V 3BJ; telephone +44 (0)20 7029 8000; facsimile +44 (0)207029 8010.
Hong Kong: Jefferies Hong Kong Limited, which is licensed by the Securities and Futures Commission of Hong Kong with CE number ATS546; locatedat Suite 2201, 22nd Floor, Cheung Kong Center, 2 Queen’s Road Central, Hong Kong.
Singapore: Jefferies Singapore Limited, which is licensed by the Monetary Authority of Singapore; located at 80 Raffles Place #15-20, UOB Plaza 2,Singapore 048624, telephone: +65 6551 3950.
Japan: Jefferies (Japan) Limited, Tokyo Branch, which is a securities company registered by the Financial Services Agency of Japan and is a memberof the Japan Securities Dealers Association; located at Hibiya Marine Bldg, 3F, 1-5-1 Yuraku-cho, Chiyoda-ku, Tokyo 100-0006; telephone +813 52516100; facsimile +813 5251 6101.
India: Jefferies India Private Limited (CIN - U74140MH2007PTC200509), which is licensed by the Securities and Exchange Board of India as a MerchantBanker (INM000011443) and a Stock Broker with Bombay Stock Exchange Limited (INB011491033) and National Stock Exchange of India Limited(INB231491037) in the Capital Market Segment; located at 42/43, 2 North Avenue, Maker Maxity, Bandra-Kurla Complex, Bandra (East) Mumbai 400051, India; Tel +91 22 4356 6000.
This material has been prepared by Jefferies employing appropriate expertise, and in the belief that it is fair and not misleading. The information setforth herein was obtained from sources believed to be reliable, but has not been independently verified by Jefferies. Therefore, except for any obligationunder applicable rules we do not guarantee its accuracy. Additional and supporting information is available upon request. Unless prohibited by theprovisions of Regulation S of the U.S. Securities Act of 1933, this material is distributed in the United States ("US"), by Jefferies LLC, a US-registeredbroker-dealer, which accepts responsibility for its contents in accordance with the provisions of Rule 15a-6, under the US Securities Exchange Act of1934. Transactions by or on behalf of any US person may only be effected through Jefferies LLC. In the United Kingdom and European EconomicArea this report is issued and/or approved for distribution by Jefferies International Limited and is intended for use only by persons who have, or havebeen assessed as having, suitable professional experience and expertise, or by persons to whom it can be otherwise lawfully distributed. JefferiesInternational Limited has adopted a conflicts management policy in connection with the preparation and publication of research, the details of whichare available upon request in writing to the Compliance Officer. Jefferies International Limited may allow its analysts to undertake private consultancywork. Jefferies International Limited’s conflicts management policy sets out the arrangements Jefferies International Limited employs to manage anypotential conflicts of interest that may arise as a result of such consultancy work. For Canadian investors, this material is intended for use only byprofessional or institutional investors. None of the investments or investment services mentioned or described herein is available to other personsor to anyone in Canada who is not a "Designated Institution" as defined by the Securities Act (Ontario). In Singapore, Jefferies Singapore Limited isregulated by the Monetary Authority of Singapore. For investors in the Republic of Singapore, this material is provided by Jefferies Singapore Limitedpursuant to Regulation 32C of the Financial Advisers Regulations. The material contained in this document is intended solely for accredited, expert orinstitutional investors, as defined under the Securities and Futures Act (Cap. 289 of Singapore). If there are any matters arising from, or in connectionwith this material, please contact Jefferies Singapore Limited, located at 80 Raffles Place #15-20, UOB Plaza 2, Singapore 048624, telephone: +656551 3950. In Japan this material is issued and distributed by Jefferies (Japan) Limited to institutional investors only. In Hong Kong, this report isissued and approved by Jefferies Hong Kong Limited and is intended for use only by professional investors as defined in the Hong Kong Securities andFutures Ordinance and its subsidiary legislation. In the Republic of China (Taiwan), this report should not be distributed. The research in relation tothis report is conducted outside the PRC. This report does not constitute an offer to sell or the solicitation of an offer to buy any securities in the PRC.PRC investors shall have the relevant qualifications to invest in such securities and shall be responsible for obtaining all relevant approvals, licenses,verifications and/or registrations from the relevant governmental authorities themselves. In India this report is made available by Jefferies India PrivateLimited. In Australia this information is issued solely by Jefferies International Limited and is directed solely at wholesale clients within the meaning ofthe Corporations Act 2001 of Australia (the "Act") in connection with their consideration of any investment or investment service that is the subject ofthis document. Any offer or issue that is the subject of this document does not require, and this document is not, a disclosure document or productdisclosure statement within the meaning of the Act. Jefferies International Limited is authorised and regulated by the Financial Conduct Authorityunder the laws of the United Kingdom, which differ from Australian laws. Jefferies International Limited has obtained relief under Australian Securitiesand Investments Commission Class Order 03/1099, which conditionally exempts it from holding an Australian financial services licence under theAct in respect of the provision of certain financial services to wholesale clients. Recipients of this document in any other jurisdictions should informthemselves about and observe any applicable legal requirements in relation to the receipt of this document.
This report is not an offer or solicitation of an offer to buy or sell any security or derivative instrument, or to make any investment. Any opinion orestimate constitutes the preparer's best judgment as of the date of preparation, and is subject to change without notice. Jefferies assumes no obligationto maintain or update this report based on subsequent information and events. Jefferies, its associates or affiliates, and its respective officers, directors,and employees may have long or short positions in, or may buy or sell any of the securities, derivative instruments or other investments mentioned ordescribed herein, either as agent or as principal for their own account. Upon request Jefferies may provide specialized research products or servicesto certain customers focusing on the prospects for individual covered stocks as compared to other covered stocks over varying time horizons orunder differing market conditions. While the views expressed in these situations may not always be directionally consistent with the long-term viewsexpressed in the analyst's published research, the analyst has a reasonable basis and any inconsistencies can be reasonably explained. This materialdoes not constitute a personal recommendation or take into account the particular investment objectives, financial situations, or needs of individualclients. Clients should consider whether any advice or recommendation in this report is suitable for their particular circumstances and, if appropriate,seek professional advice, including tax advice. The price and value of the investments referred to herein and the income from them may fluctuate. Pastperformance is not a guide to future performance, future returns are not guaranteed, and a loss of original capital may occur. Fluctuations in exchange
TSLA
Initiating Coverage
May 5, 2015
page 35 of 36 , Equity Analyst, (212) 284-2103, [email protected] Dolev
Please see important disclosure information on pages 33 - 36 of this report.
rates could have adverse effects on the value or price of, or income derived from, certain investments. This report has been prepared independently ofany issuer of securities mentioned herein and not in connection with any proposed offering of securities or as agent of any issuer of securities. Noneof Jefferies, any of its affiliates or its research analysts has any authority whatsoever to make any representations or warranty on behalf of the issuer(s).Jefferies policy prohibits research personnel from disclosing a recommendation, investment rating, or investment thesis for review by an issuer priorto the publication of a research report containing such rating, recommendation or investment thesis. Any comments or statements made herein arethose of the author(s) and may differ from the views of Jefferies.
This report may contain information obtained from third parties, including ratings from credit ratings agencies such as Standard & Poor’s. Reproductionand distribution of third party content in any form is prohibited except with the prior written permission of the related third party. Third party contentproviders do not guarantee the accuracy, completeness, timeliness or availability of any information, including ratings, and are not responsible forany errors or omissions (negligent or otherwise), regardless of the cause, or for the results obtained from the use of such content. Third party contentproviders give no express or implied warranties, including, but not limited to, any warranties of merchantability or fitness for a particular purpose oruse. Third party content providers shall not be liable for any direct, indirect, incidental, exemplary, compensatory, punitive, special or consequentialdamages, costs, expenses, legal fees, or losses (including lost income or profits and opportunity costs) in connection with any use of their content,including ratings. Credit ratings are statements of opinions and are not statements of fact or recommendations to purchase, hold or sell securities. Theydo not address the suitability of securities or the suitability of securities for investment purposes, and should not be relied on as investment advice.
Jefferies research reports are disseminated and available primarily electronically, and, in some cases, in printed form. Electronic research issimultaneously available to all clients. This report or any portion hereof may not be reprinted, sold or redistributed without the written consent ofJefferies. Neither Jefferies nor any officer nor employee of Jefferies accepts any liability whatsoever for any direct, indirect or consequential damagesor losses arising from any use of this report or its contents.
For Important Disclosure information, please visit our website at https://javatar.bluematrix.com/sellside/Disclosures.action or call 1.888.JEFFERIES
© 2015 Jefferies Group LLC
TSLA
Initiating Coverage
May 5, 2015
page 36 of 36 , Equity Analyst, (212) 284-2103, [email protected] Dolev
Please see important disclosure information on pages 33 - 36 of this report.