territorial justice and governance: inequality in...
TRANSCRIPT

TEXTO PARA DISCUSSÃO Nº 004/2010
Territorial justice and governance: Inequality in Brazilian metropolitan regions
Marta Arretche

CENTRO DE ESTUDOS DA METRÓPOLE SÉRIE TEXTOS PARA DISCUSSÃO
ISSN: em tramitação
Expediente Centro de Estudos da Metrópole Diretora Marta Arretche Conselho Diretor do CEM Adrián Gurza Lavalle Alvaro Augusto Comin Antônio Sérgio Guimarães Eduardo Marques Fernando Limongi Nadya Araújo Guimarães Márcia Lima Marta Arretche Henri Gervaiseau Paula Montero Ronaldo de Almeida Vera Schattan Coelho Comissão Coordenadora do INCT Antônio Sérgio Guimarães Celi Scalon Eduardo Marques Elisa Reis Fernando Limongi Marta Arretche Nadya Araújo Guimarães Paula Montero
Publicação online cujo objetivo é divulgar resultados de estudos direta ou indiretamente desenvolvidos como parte da pesquisa do Centro de Estudos da Metrópole, de forma a favorecer a difusão de informações para pesquisadores, estudantes e profissionais especializados e estabelecer espaço para troca de idéias e sugestões. Os textos desta série estão disponíveis em: www.centrodametropole.org.br As opiniões emitidas nesta publicação são de inteira responsabilidade de seus autores, não exprimindo necessariamente o ponto de vista do Centro de Estudos da Metrópole. É permitida a reprodução dos textos e dados neles contidos, desde que citada a fonte e que não haja restrição expressa pelos autores. Reproduções para fins comerciais são proibidas.
www.centrodametropole.org.br Rua Morgado de Mateus 615
Vila Mariana 04015 902 São Paulo SP Brasil Fone 55 11 – 5574 0399 Fax 55 11 – 5574 5928
2
Territorial Justice and Governance:
Inequality in Brazilian Metropolitan Regions1
Marta Arretche2
The welfare state literature has demonstrated that national policies and institutions critically affect how poverty and income inequality translate into the citizen’s well-being. Less attention has been paid by this literature to the spatial distribution of social services, although it does indeed have impact on people’s access to public policies. Marshall’s classic concept of citizenship (Marshall, 1967) clearly distinguished equal access to state services from inequality of earnings obtained in the job market. Hence, the sources of income inequality are not the same as social services’.
Social service delivery and urban infrastructure policies may reproduce income inequality by providing less and worse services to the poor or, alternatively, they may diminish social disparities by means of policies that de-link patterns of public service provision from the spatial concentration of poverty.
Trends toward decentralization and metropolitanization can be powerful sources favouring the spatial inequality of public service provision. Decentralization reforms have concentrated on services whereas income policies tended to remain under central government responsibility. Under different arrangements, education, health, transport, and urban services have increasingly become a matter of local or regional government responsibility. The literature on decentralization has shown a number of potential sources of differentiation among jurisdictions raised by different decentralized models (Obinger et alii, 2005; Banting, 2006; Greer, 2006). Moreover, literature on metropolitanization has demonstrated that social deprivation tends to cluster in specific areas (Hoffmann-Martinot and Sellers, 2007) and so metropolitan governments may face greater challenges in guaranteeing adequate social services.
This paper addresses the problem of the relationship between policies and spatial inequality, by examining the Brazilian case, one worth examining for several reasons. It is a federal country described by the literature as highly decentralized (Shah, 2006). A deep divide between rich and poor regions is a salient political issue. Most public services are provided by means of decentralized schemes. Indeed, local governments are in charge of providing most of the social services the needy look for. Almost half of the population lives in metropolitan areas (Ojima, 2007). It is often described as a case where horizontal intergovernmental relations are highly competitive and predatory. Hence, ineffectiveness and inefficiency would be the most probable outcome of a polity whose central government lacks the tools to coordinate nationwide policies (Abrucio and Soares, 2001). In short, these
1. The research on which this paper was based is supported by the Fundação de Pesquisa do Estado
de São Paulo (FAPESP) and Conselho Nacional de Desenvolvimento Científico e Tecnológico (CNPq) to the Center for Metropolitan Studies. It is also part of Phase III of the International Metropolitan Observatory. The author thanks Daniel Vazquez and Edgard Fusaro for their indispensable collaboration in the collection and treatment of statistical data. Thanks also to Patrick Silva and Paulo Loyola for their helpful research assistance.
2.Associate Professor at the Department of Political Science (University of São Paulo) and Director of the Center for Metropolitan Studies (CMS).

3
conditions are expected to produce high levels of spatial inequality in social service provision.
Examining the relationship between policies and spatial inequality requires, first of
all, that we depart from the conventional measures commonly employed by the welfare state literature, which often draw from national-level aggregate data in making cross-country comparisons. Instead, spatial inequality in this case means intra-country inequality, and so it requires territorially-based units of analysis.
Second, when service provision is decentralized, implementation matters because the territorial distribution of public goods depends not only on welfare state regimes but also on decisions made by those with discretion to put policies in place. Therefore, the appropriate level of analysis in this case seems to be the level of government in charge of implementing service policies.
Third, local/regional governance is deeply affected by systems of central-local relations. Local government policy priorities may be strongly influenced by higher-level arrangements – either national/state-level policies or metropolitan arrangements (Sellers and Lidström, 2007; Razin, 2007). Analyzing lower-level government policies therefore requires a conceptual distinction between the assignment of policy responsibilities and the decision-making authority on these same policies (Stegarescu, 2005; Sellers and Lidström, 2007). Note that these concepts are distinct from those adopted by the conventional literature on types of states, which assumes that federal states are naturally more decentralized than unitary ones and that policy-making can be assumed as a reliable proxy of policy decision-making.
The concept of regimes of place equality (Sellers et alii, 2007), developed under the III IMO Project, intends to capture policies and institutions that affect local governance and their inequality-reduction goals as well. As such, it comprises two related dimensions. The first refers to central-local relations, meaning the range of impact that national or intermediate-level institutions have on local government choices. In other words, it refers to the autonomy local governments have to make decisions over the policies they are in charge of. The second dimension refers to the equalization goals of such policies; that is, the range of equalization outcomes these policies intend to achieve. No equalization at all, partial or full equalization, and compensation are four conceivable endeavours of such supra-local institutional arrangements. Different combinations of these two dimensions are supposed to have distinct impacts on the inequality of public service provision among jurisdictions.
The paper examines the effects of the Brazilian regime of place-equality on the revenue inequality between Brazilian municipalities. It assumes that revenues are a central component of local government’s capacity to provide services. Indeed, this becomes all the more critical in contexts like the Brazilian one, where subunits are fully in charge of social service provision. The paper also explores the impact of metropolitan contexts in revenue inequality patterns. The study is based on an extensive data set spanning 1996 to 2006, gathered from the CEM’s Municipality Information Database.
It demonstrates, in line with the welfare state literature, that poverty-level incomes and worse living conditions do not necessarily go together. Nevertheless, it contributes to this literature by demonstrating that regimes of place-equality critically affect intra-country differences in people’s access to social services. This paper provides evidence to support the proposition that there is a trade-off between place-equality and full decentralization of

4
tax-collection. Both the regulatory and redistributive roles of the federal government are central components of sub-national government revenue inequality. As a result, place-inequality is less a by-product of federalism than an outcome of the rules presiding over revenue collection and redistribution along with their notion of what ‘need’ means.
The paper is organised into four sections, besides this introduction and the conclusion. The first section briefly describes the expectations of existing theories about the impact of federalism on spatial inequality. The second maps spatial inequality in Brazilian municipalities, and pays special attention to metropolitan regions. The third section describes the national policies toward place-equality, by means of the description of the federal institutions that regulate and supervise government revenues and expenditures, and also examines their outcomes. The conclusion explores some of the theoretical implications of this evidence.
1. Expectations of existing theories
Mainstream theories predict distinct outcomes from federal polities regarding place-inequality.
The public choice literature has developed an ideal-type of federation, based on Tiebout’s (1956) proposition, according to which efficient and accountable local governments compete for a mobile citizenry. Based on the Tiebout model, Weingast (1995) and Buchanan (1995) have proposed an ideal model of the national state, one in which (1) policy decision-making authority should be highly decentralized and (2) the redistributive ro1e of the central government should be strongly limited. According to these authors, it is not realistic to expect central governments to efficiently perform redistributive tasks. Distributive policies do not achieve place-inequality reduction, because they inevitably tend to end up as pork-barrel to the clientelistic interests of powerful regionally-based coalitions.
The theoretical propositions of this school allow us to expect two possible outcomes from federal polities. The first concerns national distributive policies. In such contexts, transfers will be channeled into those districts which elect powerful regional politicians. These are not necessarily the neediest districts, and as a result, so-called redistributive policies will not achieve place-inequality reduction. A second possibility relates to polities where there is competition among jurisdictions for mobile citizens and firms. This context will lead to a “race to the bottom” in redistributive policies, because the local government’s dominant strategy will be to get rid of the poor in order to attract firms and wealthy tax payers (Peterson, 1995). Thus, in neither case will federalism lead to place-equality policies. Therefore, according to this theoretical reasoning, we should not expect either to find place-equality outcomes in the presence of distributive policies or to find place-equality policies in federations whose institutions decentralize decision-making authority.
Historical institutionalists, in turn, argue that place-equality is not antithetical to federalism, which means that federalism can produce place-equality. However, it requires the centralization of policy decision-making. “Substantial redistribution can be effectively achieved only at the national level” (Obinger, Leibfried, and Castles, 2005: p. 352), and so it is “the specificity of the central framework and the strength of the interregional redistribution [that] set the structural underpinnings of the balance between social citizenship and regional diversity” (Banting and Corbett, 2002: p. 22).

5
As a result, where policies are framed by the central government and where there is a national system of inter-regional transfers, we can expect to find equality of outcomes among jurisdictions. However, this commitment is only possible for federations with weak territorial cleavages, that is, those whose citizens share a common identity of belonging to a national community. So, according to this theory, the regulatory and redistributive role performed by the centre is the necessary mechanism through which place-equality can be achieved.
However, achieving this goal has a price. This tends to be a zero-sum game; that is, if the centre wins decision-making authority, and so is entitled to regulate lower-level government policies, local governments lose this authority and their decision-making power will be limited. Note that the expectations of these two last theories are compatible, given that they are based on the shared theoretical assumption that there is a trade-off between redistribution – and so, place-inequality reduction – and the centralization of authority. 2. Mapping socioeconomic spatial inequalities
Affluent and poor people are not separated by jurisdictional boundaries. Instead, income inequality and spatial segregation are mainly intra-city phenomena in Brazil. The number of needy citizens varies from one municipality to another. However, a comprehensive notion of need should go beyond income to also measure social conditions; that is, it requires including indicators about education, health, urban infrastructure, and housing conditions.
Based on this concept, a typology of Brazilian municipalities was elaborated, using data from the 2000 Census (see appendix 1). Six groups were obtained:
• Group 1: composed by 2,225 urban municipalities presenting the lowest poverty rates and the best social and urban infrastructure conditions. Families earning less than 1/4 of the national minimum wage account for only 7.4% of this population, although the poorest 20% retain only 2.8% of the total income. Urban infrastructure conditions are far better than those obtained for the remaining groups. • Group 2: composed by 1,011 municipalities whose income and social conditions are not as good as those of group 1. This group discriminates municipalities in which urban living conditions and the concentration of those below the poverty line are significantly worse than in group 1. Average values for poor people concentration is around 42% of the total population. Health and primary schooling performance is similar to those obtained for group 1, but urban living conditions fall far short. • Group 3: composed by 287 municipalities whose income and social values are above average for Brazilian municipalities. This group discriminates municipalities presenting very bad urban infrastructure conditions, particularly regarding household access to running water and sewage collection systems. • Group 4: composed by 1,063 municipalities whose urbanization rate is 57.5%. Their income and social indicators are slightly worse than those for group 3. This group discriminates cities where most households have no access to running water, or sewage and garbage collection systems.

6
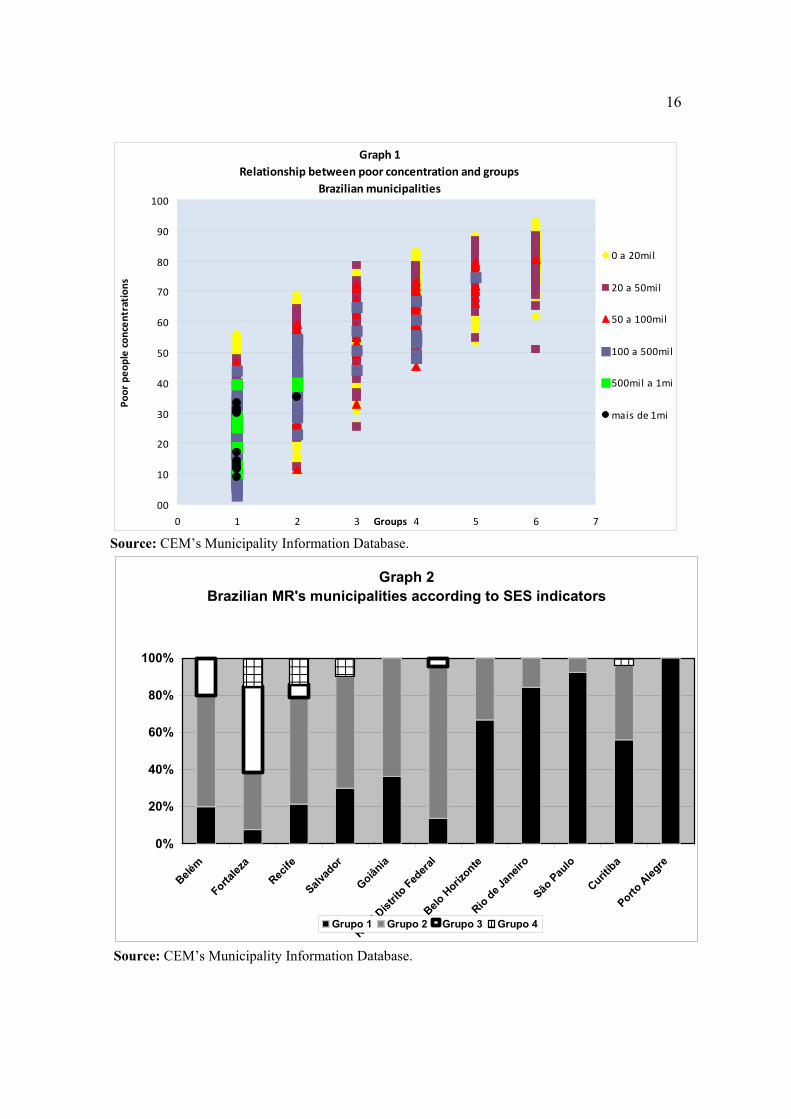
• Group 5: formed by 703 municipalities whose average urbanization rate was as low as 43.7%. Only municipalities of group 6 had worse income and social indicators than those obtained for this group. • Group 6: formed by 217 rural municipalities (urbanization rates of around 36.4%) presenting the worst income and social indicators among Brazilian municipalities. Graph 1 displays the relationship between the rate of poor people and group
classification controlling by population size for all Brazilian municipalities. It shows that there is some correlation between these 3 dimensions but it is far from linear. Cities displaying the worst social conditions are usually smaller and have poverty rates above 50% of the total population.
However, the latter does not necessarily imply the former. Poor people concentration in group 1 cities, for example, ranges from nearly “zero” to almost 60% of the total population. In spite of that, nearly all inhabitants of these cities have primary-level education, low child mortality rates and adequate access to urban infrastructure services. It means that very dissimilar rates of income poverty can be combined with better living conditions. Indeed, group 2 cities discriminate those whose urban living conditions are far worse than those of group 1. Nevertheless, observe that variation in poverty rates is not so dissimilar between these two groups. Therefore, if we assume that social conditions are by and large a by-product of service provision, we can infer that Brazilian municipalities treat their poor differently. Earning low incomes means different living conditions across jurisdictions. Income poverty and worse-off social conditions do not go hand-in-glove.
As for the relationship between city size and poverty rates, observe that the largest cities in group 1 and 2 show lower rates of poverty, which would suggest that some association can be made between city size and poverty rates. Yet, one can also note that their values range from 10% to 40%.
<Graph 1 here>
There seems to be some association between size and group type. Larger cities –
with populations above 500,000 – are concentrated in Groups 1 and 2. Medium size cities prevail in Groups 3 and 4 while smaller towns and villages tend to have a larger presence in Group 6. However, small towns – under 20,000 – are present in all Groups, while cities under 500,000 appear in all Groups except Group 6. It is therefore far from accurate to infer a city’s poverty rate from its size.
High rates of poor people concentration, along with the worst social and housing conditions, were mainly a rural phenomenon in 2000, given that the lowest average values on these indicators were displayed by Groups 5 and 6. Nevertheless, these cities were only 920 out of 5,507, home to less than 8% of the Brazilian population (Appendix 1).
All central cities of metropolitan areas belonged to Group 1, meaning that these cities sheltered a relatively smaller amount of poor people as well as enjoying better schooling, health, and urban conditions. Indeed, three surveys carried out at the Centre for Metropolitan Studies showed that the poorest 20% in São Paulo, Rio de Janeiro and Salvador saw their participation in the formal job market decline from the early 90s to mid-2000, but at the same time they had universal access to health and education (Figueiredo et alii, 2006a, 2006b; Torres et alii, 2007).

7
However, remember that the central cities of Metropolitan Regions (MRs) are the largest ones, and so lower relative figures still mean a lot in terms of absolute numbers of needy people relying on the public delivery of social support. São Paulo city, for example, had 10 million inhabitants in 2000, which means its poverty rate of 12% amounts to 1,200,000 citizens. Rio de Janeiro city, with its 5.6 million inhabitants, had around 728 thousand poor citizens, despite a poverty rate of only 13%.
A pattern of socioeconomic inequality within MRs can be seen in Graph 2, which provides data about group types for selected Brazilian metropolitan areas3.
In the Northern, Northeastern, and Mid-western MRs (the first 6 on the left side of Graph 2), few municipalities belonging to Group 1, including the central one, are surrounded by a large number of Group 2 and 3 cities. Central and core cities concentrate wealth (and so jobs) since they are poles of economic development. The neighbouring municipalities tend to house the larger portions of the poor. One will recall that in Group 2 and 3 cities, average poverty rates are nearly half the total population, not to mention the fact that living conditions fall far short of those obtained for Group 1. Of course, functional integration means a great deal of inter-city mobility. This inequality pattern therefore implies poor people in need of adequate means of public transport.
<Graph 2 here>
In Southern and Southeastern MRs, Group 1 municipalities are the majority, with
the exception of the Porto Alegre MR, where all municipalities belong to Group 1. In any case, the difference here regards the proportion of municipalities whose income and social indicators are as much as twice as bad as those for Group 1. As such, even in the most affluent areas, socioeconomic spatial inequality means inequality within and between MR cities. Remember that Group 1 cities here are the largest ones, and so relatively lower rates of poverty will still mean thousands of needy people.
Metropolitan areas are by no means the worst places to live in. All central metropolitan cities are in the more affluent Group 1, which concentrates jobs, higher incomes, and better social and living conditions. Group 2 and 3 municipalities, whose presence is much larger in less dynamic economic areas, surround central cities in metropolitan areas, show greater concentration of poor people and far less adequate urban infrastructure conditions. As a result, intra-city poverty and inadequate living conditions are important elements of cross-city inequality in metropolitan areas.
3 Like other countries, in Brazil, the metropolitan phenomenon does not fit institutional
metropolitan arrangements. For this reason, cases were selected according to the results of a number of studies carried out on Brazilian metropolises in 2000 (IPEA/IBGE/NESUR-IE-UNICAMP, 2001), as well as IBGE classification. On the other hand, the cities included in each metropolitan region were selected according to the prevailing metropolitan arrangements in 2000, due to this study research question, namely the impact of institutional arrangements on pubic policy provision. The Manaus MR was excluded because in 2000 it was classified by many studies as a metropolitan area, but it did not have an official metropolitan arrangement.
8
3. National policies towards revenue-equality Homogeneous nationwide rules define the way sub-national units exert their
taxation powers. Local governments are not allowed to introduce any tax their citizens are willing to pay. Far from a Tieboutian world, Brazilian municipalities are only authorised to tax urban real estate, services and property transfers. Moreover, their tax-raising powers are limited to the authority to set the rates of these taxes, whereas authority to define taxable bases is exclusive to the national legislature. In other words, local tax autonomy is limited to tax rates and does not include tax bases4.
Local government revenues in Brazil are also affected by a second layer of national legislation, namely upper-level transfers, which are constitutionally-based5. They are distributed according to two different goals: inequality-reduction and devolution.
The most important federal transfer is called the “Municipality Participation Fund” (MPF) and is based on a share of 23.5% of the total collection of two exclusive federal taxes: income tax and the tax on industrialised products. Ten per cent of this amount is earmarked for division among the state capitals, with each individual quota calculated as per a formula which is directly related to population and inversely related to the state’s per capita income. The remaining 90% is divided as per a formula that favours less populous municipalities6.
States are also obliged by the federal constitution to share amongst their municipalities at least 25% of the total proceeds from their value-added tax, as well as 50% of the sums raised through vehicle tax (Souza, 2003). According to the federal constitution, 75% of these transfers may take the form of rebates, that is, they must be calculated on the basis of the municipalities’ contributions to the receipts of each tax. Thus, this kind of constitutional transfer is not oriented toward reducing revenue inequality.
Universal earmarked transfers, in turn, were introduced throughout the 90s and constitute a third source of local government revenues. They are a very recent component of the Brazilian regime of place-equality and are policy-specific. In health, they have become universal because they have been addressed to all municipalities since 1998, when municipalities completed the long process of voluntarily adhering to the Unified National Health System (SUS – Sistema Único de Saúde), which started in 1990. Federal transfers are earmarked for local government primary health services and are calculated on a per capita basis. They are conditional on the adoption of pre-defined forms of spending and are only disbursed if and when these programmes are implemented7.
4.Accordingly, it is up to national legislation to define what is meant by “services”. In other words,
unless a certain “service” activity is clearly stated as such in the federal law, it cannot be taxed by any municipality. Moreover, should, for example, citizens want to pay a municipal fee to improve the quality of education services, they would not be authorized to do so.
5. Shared-revenues date to the 1946 Constitution, and so they have long been an important component of the Brazilian fiscal system. Yet, the 1988 FC introduced the highest rates of tax-sharing ever adopted in the country’s history (Arretche, 2005).
6. A number of other transfers from the federal government to local ones are also constitutionally-based. For a detailed account, see Afonso and Araújo (2006). They have a minor impact on local government revenue though, as can be seen from graph 3.
7.These programmes include: basic health care; hiring of doctors, nurses and health providers; provision of medicines, vaccination surveillance, and neonatal care.

9
In education policy, earmarked transfers are universal because all sub-national governments are bound to the same rules by the constitution, although they operate at the state level. As for the period covered by this study, 15% of state and municipal revenues were automatically retained and recorded on an annual basis in a state-level fund8. Within each state, revenues were redistributed among state and municipal governments, according to the number of school places offered per year. Unlike the policies described so far, these earmarked transfers are not calculated either on a population basis or in accordance with redistributive goals, but rather link education provision to transfers (Oliveira, 2001; Vazquez, 2003).
Inequality-reducing effects
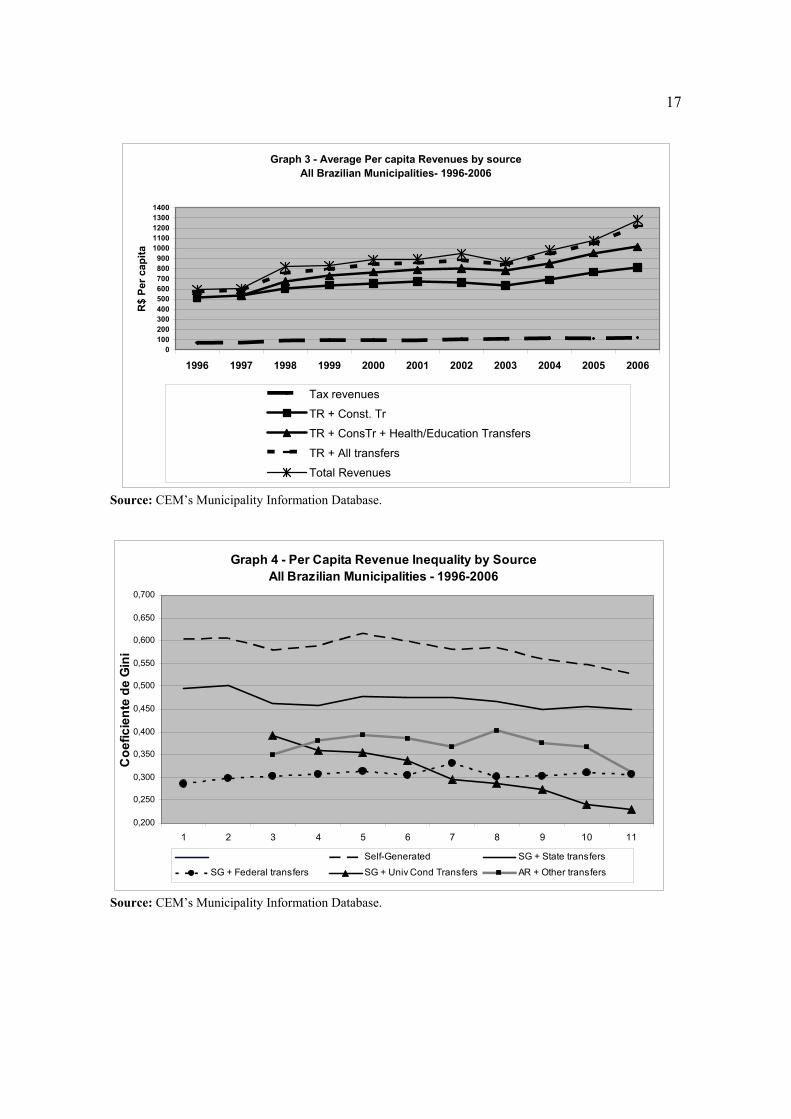
Available data allows us to measure the impact of these national policies. Graph 3 presents data on the sources of local government revenues from 1996 to 2006. As can be seen, shared-revenue transfers have a great impact on municipal revenues. Self-generated monies represent a small portion of their budget average whereas constitutional transfers add a substantial amount of income. In other words, if it were not for constitutional transfers – on the federal and state levels– Brazilian municipalities would not be able to accomplish their policy delivery tasks.
<graph 3 here>
Graph 4 presents the Gini coefficients on local per capita revenues by source from
1996 to 20069. It shows that revenue inequality among Brazilian municipalities would be much greater if they were to count solely on their self-generated tax receipts. Local self-generated taxes display by far and systematically the highest coefficient values: 0.527 in 2006, though with a slight downward curve from 2000 on.
State transfers reduce revenue inequality to around 0.450. The ratio between self-generated taxes and state-shared revenues can be taken as a reliable indicator of cross-city wealth inequality, since the latter operate as rebate, that is, the lion’s share of the state’s transfers are distributed according to the amount collected in each town.
Nevertheless, federal transfers have a great impact in reducing revenue inequality. There is a sharp reduction in inequality when revenues from the federal government are added to local self-generated proceeds. All Brazilian municipalities considered, the Gini coefficient for self-generated + federal constitutional transfer falls to around 0.300. Conditional transfers, for their part, have had an important inequality-reducing effect since they became universal. Indeed, their inequality-reducing effects turned out to be stronger from 2003 on.
<graph 4 here>
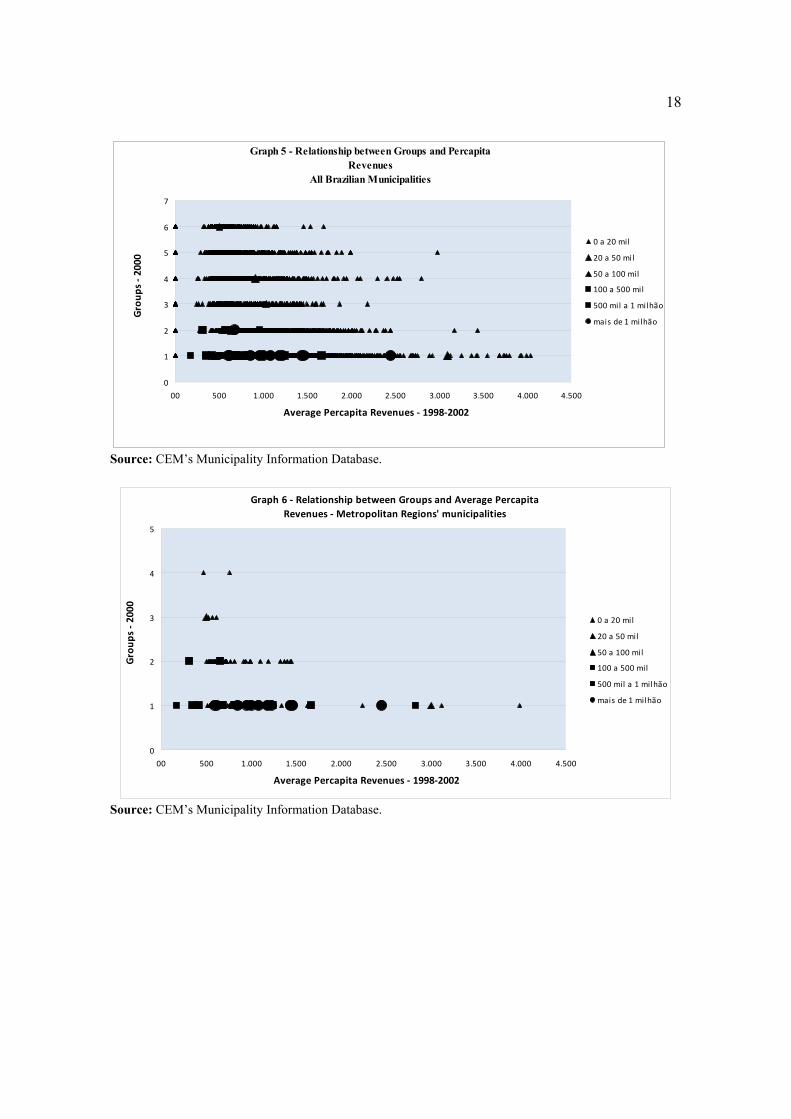
What are the outcomes of this redistributive pattern in terms of per capita revenues? Graph 5 displays information on the relationship between group types and per capita 8. In fact, there are 27 state-level funds. 9.N varied between a minimum of 4,257 municipalities in 1996 and a maximum of 5,285 in 2001,
out of 5,564 municipalities.

10
revenues, controlled by population size for each Brazilian municipality10. Six outliers, whose budgets were above R$ 4,500 (explained mainly by oil revenues) were excluded11.
The relationship between group type and per capita revenues is slightly curvilinear. This outcome is largely explained by Group 1 smaller cities which obtain the highest values. This outcome is explained by the fact that these cities’ revenues are obtained from all sources. They get higher per capita revenue from tax-collection and they get higher federal transfers because they are small and they get more revenues from transfer devolutions (usually from economic activity or oil revenues). In sum, they are benefited because they combine all the attributes entitling municipalities to get revenues. It is not, therefore, a single rule but the combination of all layers of legislation that makes them richer.
However, if we exclude these “best cities” (which combine the highest incomes with smallest size and best living conditions), per capita revenues vary, for all groups, from between R$ 170 and RS 2,500. Within this range, inequality in per capita revenues presents a rather similar distribution among groups; in other words, regardless of municipal needs. As a general pattern, similar socio-economic needs are associated with high variation in per capita revenues, while different socio-economic needs can be associated with a similar amount of municipal revenues.
Moreover, we should not ignore the values of this interval, that is, poorer municipalities get R$ 170 whereas the richer ones obtain R$ 2,500. Of course, this means a huge disparity in service provision capacities. Therefore, in spite of the inequality-reducing effects of federal transfers, a good deal of place-inequality remains. Given the redistributive effects described above, it means that revenue inequality would still be much higher were it not for federal transfers. On the other hand, they provide at best some compensation for absence or low rates of economic activity.
As for city size within each group, it seems that revenue inequality is really important for Groups 1 and 2. Within these groups, larger cities tend to get smaller budgets. However, this is not surprising, given that the majority of federal transfers are distributed according to a negative coefficient to population size and wealth.
Graph 6 presents the same data for MR cities. To begin with, a similar pattern is shown. A slightly curvilinear relationship means that a few better-off outliers, which also tend to be smaller towns, have larger budgets. Sources of inequality tend to be the same as the pattern obtained for all Brazilian municipalities, that is, the combination in some cities of all layers of legislation which combine redistribution and devolution. As redistribution is understood to compensate for both as small size and low economic activity, being small entitles a municipality to receive larger transfers regardless of city needs or even tax- 10. Axis “x’ of Graph 5 displays values of the net per capita revenue for each Brazilian
Municipality. This indicator is the average for the 1998, 1999, 2000, 2001, and 2002 per capita values. Axis “y” displays group classification based on socio-economic indicators for 2000.
11 They were: Itaipulândia (Group 2; out of MR; R$ 7,578 average per capita revenues, 5,000 inhabitants); Paulinas (Group 1; Campinas MR; R$ 6,846 average per capita revenues; 50,700 inhabitants); Quissamã (Group 2: out of MR; R$ 5,693 average per capita revenues; 14,000 inhabitants); Ilha Comprida (Group 1, out of MR; R$ 5,638 average per capita revenues; 4,000 inhabitants); Aguas de São Pedro (Group 1, out of MR; R$ 5,222 average per capita revenues; 5,200 inhabitants): Cachoeira Dourada (Group 1, out of MR; R$ 4,556 average per capita revenues; 2,200 inhabitants).

11
levying capacity. As a result, larger Group 1 cities tend to have lower budgets than smaller ones.
On the other hand, outliers excluded, larger better-off Group 1 cities can have a budget similar to their less well-off Group 2 neighbours. Cities presenting rather different needs, particularly regarding urban living conditions, have similar per capita budgets. Being a metropolitan city with a larger concentration of poor people and worse living conditions does not lead to more revenues. This is not surprising, as we already know, because transfer redistribution does not take social and urban conditions into account.
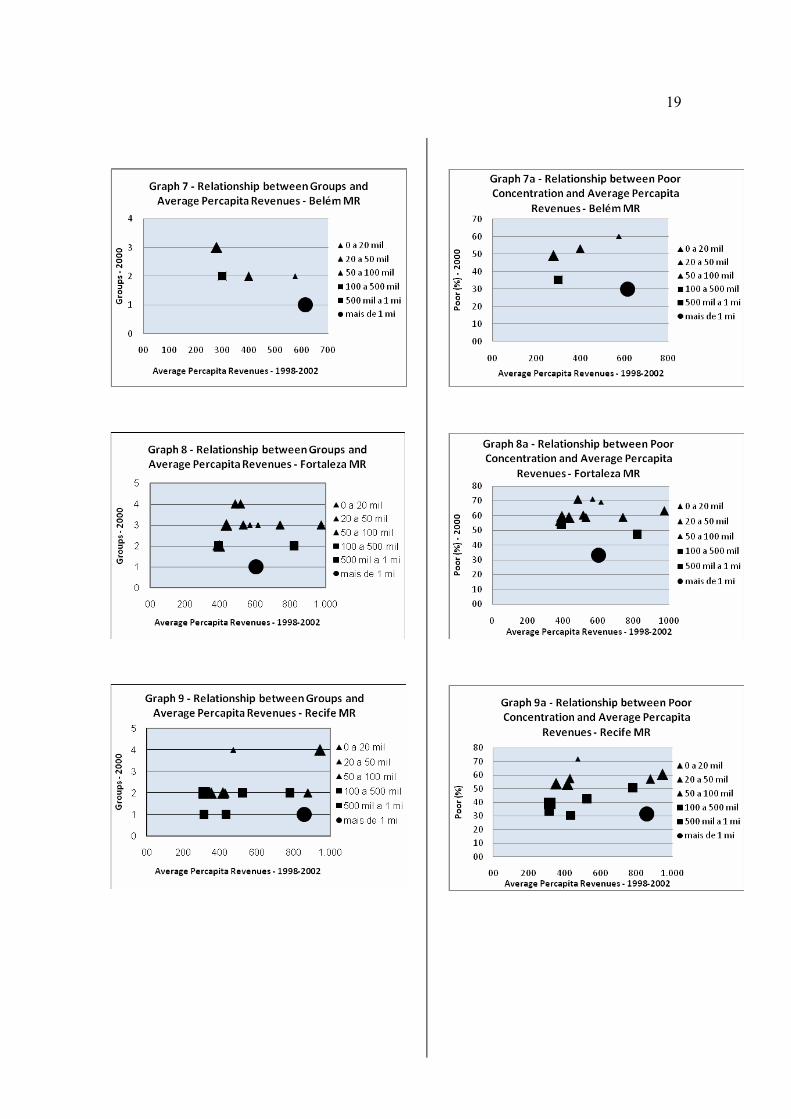
A closer observation of the same data within each metropolitan region shows a similar pattern (graphs 7 to 17). Larger cities tend to belong to Group 1, that is, they are better-off both in terms of income and living conditions. They also have lower poverty rates. Smaller neighbouring cities tend to be Group 2, which means they have larger proportions of poor people and worse living conditions.
However, no pattern emerges in relation to revenues. Instead, it may be more accurate to state that the general pattern is that there is no specific MR pattern at all. There is certainly no relationship between group and revenues, which is to be expected given the rules of revenue-inequality policies prevailing in Brazil. As for the relationship between concentrations of poor people and revenues, there seems to be a positive association in poorer regions along with a negative association in affluent ones. In Northern, Northeastern and Mid-western MRs, municipalities with higher poverty rates tend to have higher per capita revenues, whereas in the South and Southeast, poverty is associated with lower budgets. In both cases, population does not seem to matter at all, nor does this relationship seem to be particularly strong.
<graphs 7 to 17a here>
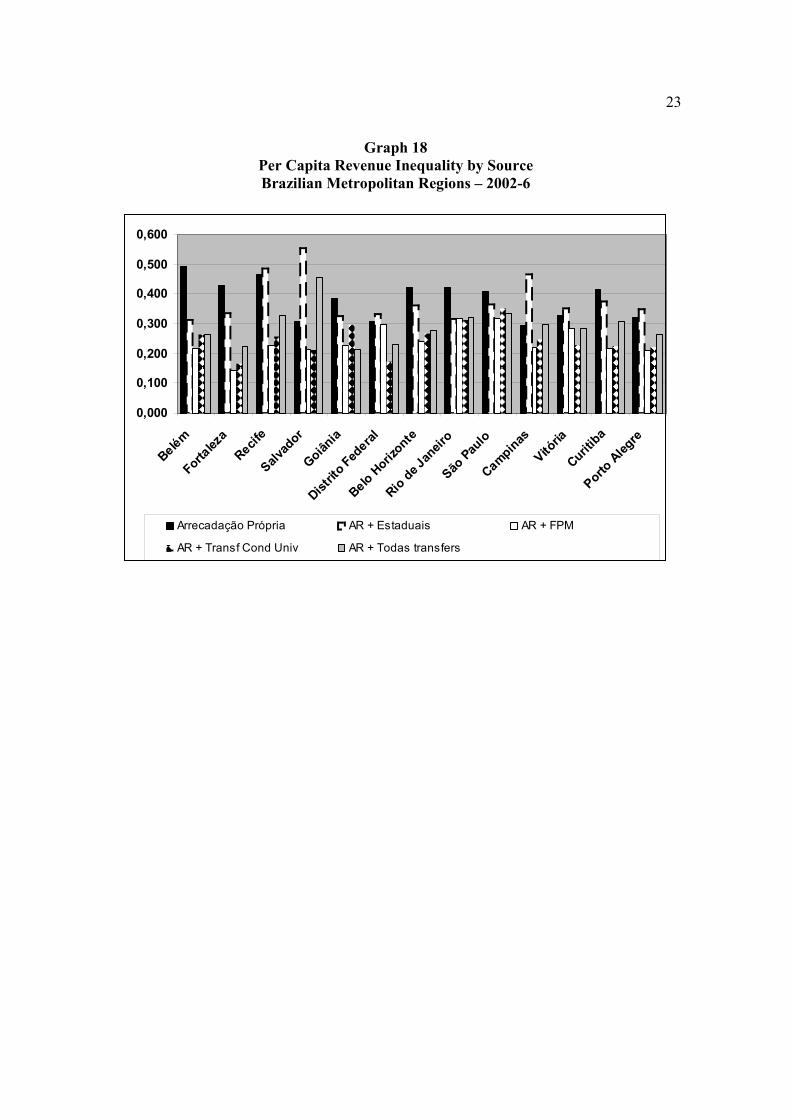
Graph 18 helps to understand the sources of revenue inequality within MRs. To
begin with, self-generated revenues mean inequality. For all MRs, collection of one’s own taxes presents the highest Gini coefficients. They are not as high as those obtained for all municipalities because MRs concentrate economic activity and wealth and so differences among these cities are not so important as those prevailing between these cities and all others.
However, state transfers can indeed increase revenue inequality in MRs. This is due to the fact that they reflect differences in economic activity. So, it is not a surprise that in most affluent areas they tend to have a stronger impact than those prevailing for the rest of the country.
Federal transfers are the most effective in reducing revenue inequality. In spite of that, great inequality in per capita revenues remains. The point is worth highlighting. At best, federal transfers promote some compensation for either low or no economic activity. Different types of transfers have rather different effects on revenue inequality. Therefore, outcomes are not explained by any single rule. Instead, they are the result of the combination in each town of the attributes that entitle them to benefit differently from all rules of tax collection and transfer distribution.
12
5. Conclusions
Social and living conditions cannot be a by-product of income since they are critically affected by state policies. Indeed, the welfare state literature has long demonstrated that cross-country differences in the rules of entitlement to social rights have a strong impact on the citizens’ living conditions.
However, less attention has been paid to the fact that there may be intra-country differences in people’s access to social services, even if a welfare regime is committed to equal social rights. Moreover, two not so recent trends can operate in favour of unequal access to public services: decentralization of service provision and metropolitanization.
The concept of regimes of place-equality intends to capture policies and institutions toward place-equality by examining central/local relations and their place-inequality reduction goals. It assumes that, in contexts where service provision is decentralized, these two dimensions greatly affect the citizens’ actual access to social services.
This paper provides evidence to support the proposition that there is a trade-off between place-equality and full decentralization of tax-collection. The regulatory role of the federal government critically affects sub-national governments’ net revenues. Moreover, the former’s redistributive role appears to be a condition for the reduction of revenue inequality among jurisdictions and the provision of the means to deliver public services. As we have seen, in the absence of federal transfers, Brazilian municipalities’ capacity to provide social services would be highly unequal.
However, redistribution of revenues in Brazil is oriented by different goals. In other words, they have both inequality-reduction and devolution purposes. Federal transfers, whose distribution formula aims at inequality-reduction, have a redistributive impact. On the other hand, state transfers and some federal ones are distributed as rebates. Hence, they can even reinforce revenue-inequality among municipalities.
Municipal revenue-inequality is the result of these rules. The richest municipalities are those whose characteristics entitle them to get money from all sources. They levy their own taxes because they shelter wealthy real estate owners. They get federal transfers because they are small. They also get state transfers because they are poles of economic activity. And, finally, if they are lucky enough to be located close to an oil source, they will receive additional resources. The more of these attributes a city or town has, the wealthier it will be.
These outliers excluded, federal transfers add an important amount of money to the budgets of small and poor inland cities/towns as well as providing a small compensation for capitals and large cities. Within MRs, revenue-inequality is largely explained by variations in economic wealth. When they are poles of economic activity, transfers based on devolution make a big difference to net revenues.
As a result, place-inequality is less a by-product of federalism and more an outcome of the rules presiding over revenue collection and redistribution. These are explained by the understanding of what ‘need’ means. In the Brazilian case, current rules of revenue compensation are based on the notion that the neediest populations are concentrated in small cities, whereas in fact they are unevenly distributed among cities/towns of all sizes.
Interpreting policies toward place-equality as pork, though, tends to undervalue their nature, origins, and outcomes. The lion’s share of the vertical transfers is not a by-product of permanent political negotiation aimed at putting together a supporting coalition for each Congressional vote. Instead, they are associated with the achievement of national

13
goals, be it economic development or social rights. Indeed, they are a core institution of Brazil’s state-building process, much like other federations such as Germany and Austria. In order to achieve national goals, place-inequality reduction policies have long been attached to constitutional rules aiming at binding current and future heads of governments. Instead of freeing them to please their constituencies at will, federal laws are aimed at limiting their room to spend their own revenues according to short-minded concerns.
14
References Abrucio, Fernando Luiz and Marcia M. Soares (2001). Redes Federativas no Brasil:
Cooperação Intermunicipal no Grande ABC. São Paulo: CEDEC/Fundação Konrad-Adenauer-Stiftung.
Afonso, José Roberto Rodrigues and Erika Amorim Araújo (2006). “Local Government Organization and Finance: Brazil”, in: Shah, Anwar (ed.) (2006). Local Governance in Developing Countries. Washington: The World Bank.
Arretche, Marta (2005). “Quem taxa e quem gasta: a barganha federativa na federação brasileira”, in: Revista de Sociologia e Política, no. 24: 69-86.
Banting, Keith and Stan Corbett (2002). “Health Policy and Federalism: an introduction”, in: Banting, Keith and Stan Corbett (ed.) (2002). Health Policy and Federalism: A Comparative Perspective on Multi-level Governance. Queen’s University: Institute of Intergovernmental relations.
Banting, Keith (2006). Social Citizenship and Federalism: Is a Federal State a contradiction in terms?”, in: Greer, Scott (ed.) (2006). Territory, Democracy, and Justice. Regionalism and Federalism in Western Democracies. London: Pallgrave Macmillan. P. 44-66.
Buchanan, James M. (1995) “Federalism as an Ideal Political Order and an Objective for Constitutional Reform” Publius, Vol. 25, No. 2 (Spring), pp. 19-27.
Figueiredo, Argelina, Harold Torres y Renata Bichir (2006ª). “Renda e votos: o democrático toma lá da cá”, en Insight-Inteligência, año IX, núm. 33, junio, pp. 40-48, Río de Janeiro.
Figueiredo, Argelina, Harold Torres y Renata Bichir (2006b). “A Conjuntura Social Brasileira Revisitada”, en Novos Estudos, núm. 75, pp. 173-83.
Greer, Scott (ed.) (2006). Territory, Democracy, and Justice. Regionalism and Federalism in Western Democracies. London: Pallgrave Macmillan.
Hoffmann-Martinot, Vincent and Jefferey Sellers (eds.) (2007). Politique et métropole. Une comparaison internationale. Paris: CNRS Editions.
Instituto Brasileiro de Geografia e Estatística (2005). Profile of Brazilian Municipalities. IPEA/IBGE/NESUR-IE-UNICAMP (2001). Caracterização e tendencies da rede urbana
brasileira. Brasília, IPEA. Marshall, T. H. (1967). “Cidadania e classe social”. In: Cidadania, classe social e status.
Rio de Janeiro. Zahar. Obinger, Herbert (2005). “Austria: strong parties in a weak federal polity“, in: Obinger,
Herbert; Stephan Leibfried and Francis Castles. (ed.) (2005). Federalism and the Welfare State. New World and European Experiences. Cambridge: Cambridge University Press.
Obinger, Herbert; Stephan Leibfried and Francis Castles. (ed.) (2005). Federalism and the Welfare State. New World and European Experiences. Cambridge: Cambridge University Press.
Ojima, Ricardo (2007). “Dimensoes da Urbanizacao dispersa e uma proposta metodologica para estudos comparativos”, Revista Brasileira de Estudos Populacionais, 24(2): 277-300.
Oliveira, Fabrício Augusto (2001). FUNDEF e Saúde: duas experiências (virtuosas?) de descentralização. Research report. Project: Fiscal Decentralization and Intergovernmental Financial Cooperation. EBAP/Konrad Adenauer Stiftung.
Peterson, Paul (1995). The Price of Federalism. Washington D.C.: Brookings Institution.

15
Razin, Eran (2007). “Introduction: Deconcentration of economic activities within metropolitan regions: A qualitative framework fro cross-national comparison, in: Razin, Eran et al. (eds.) (2007). Employment Deconcentration in European Metropolitan Areas.
Sellers, Jefferey; Kitayama, Toshiya; Hoffmann-Martinot, Vincent (2007). Phase III of IMO: Metropolitan Inequality and Governance.
Sellers, Jefferey M. and Anders Lidström (2007). “Decentralization, Local Government, and the Welfare State”, Governance, 20(4): 609-32.
Stegarescu, Dan (2005). “Public Sector Decentralisation: Measurement Concepts and Recent International Trends”, Fiscal Studies, 26(3): 301-33.8
Shah, Anwar (ed.) (2006). Local Governance in Developing Countries. Washington: The World Bank.
Souza, Celina (2003). Brazil’s System of Local Government, Local Finance, and Intergovernmental Relations. Paper prepared for the research project Building Municipal Capacity for Finance Budgeting. School of Public Policy, University of Birmingham, UK.
Tiebout, Charles (1956). «A Pure Theory of Local Expenditures», The Journal of Political Economy, Vol. 64, No. 5 (Oct., 1956), pp. 416-424.
Torres, Haroldo; Celina Souza, Renata Bichir; Argelina Figueiredo (2007). “Serviços básicos de saúde em Salvador: cobertura, acesso e avaliação da população pobre”, Bahia.Análise & Dados, 17(1): 721-37.
Vazquez, Daniel Arias (2003). Educação, Descentralização e Desequilíbrios Regionais: os impactos do FUNDEF. Master’s dissertation: Institute of Economics, UNICAMP (University of Campinas).
Weingast, Barry R. (1995). “The Economic Role of Political Institutions: Market-Preserving Federalism and Economic Development”, in: Journal of Law, Economics, & Organization, Vol. 11, No. 1 (April), pp. 1-31.
16
Graph 1 Relationship between poor concentration and groups
Brazilian municipalities
00
10
20
30
40
50
60
70
80
90
100
0 1 2 3 4 5 6 7Groups
Poor
peo
ple
conc
entr
atio
ns
0 a 20mil
20 a 50mil
50 a 100mil
100 a 500mil
500mil a 1mi
mais de 1mi
Source: CEM’s Municipality Information Database.
Graph 2 Brazilian MR's municipalities according to SES indicators
0%
20%
40%
60%
80%
100%
Belém
Fortalez
aRec
ife
Salvad
or
Goiânia
RIDE D
istrit
o Federa
l
Belo H
orizonte
Rio de Jan
eiro
São Pau
lo
Curitiba
Porto A
legre
Grupo 1 Grupo 2 Grupo 3 Grupo 4
Source: CEM’s Municipality Information Database.
17
Graph 3 - Average Per capita Revenues by source All Brazilian Municipalities- 1996-2006
0100200300400500600700800900
10001100120013001400
1996 1997 1998 1999 2000 2001 2002 2003 2004 2005 2006
R$
Per c
apita
Tax revenues
TR + Const. Tr
TR + ConsTr + Health/Education Transfers
TR + All transfers
Total Revenues
Source: CEM’s Municipality Information Database.
0,200
0,250
0,300
0,350
0,400
0,450
0,500
0,550
0,600
0,650
0,700
1 2 3 4 5 6 7 8 9 10 11
Coe
ficie
nte
de G
ini
Self-Generated SG + State transfersSG + Federal transfers SG + Univ Cond Transfers AR + Other transfers
Graph 4 - Per Capita Revenue Inequality by Source All Brazilian Municipalities - 1996-2006
Source: CEM’s Municipality Information Database.
18
Graph 5 - Relationship between Groups and PercapitaRevenues
All Brazilian Municipalities
0
1
2
3
4
5
6
7
00 500 1.000 1.500 2.000 2.500 3.000 3.500 4.000 4.500
Average Percapita Revenues ‐ 1998‐2002
Gro
ups ‐ 2
000
0 a 20 mil
20 a 50 mil
50 a 100 mil
100 a 500 mil
500 mil a 1 milhão
mais de 1 milhão
Source: CEM’s Municipality Information Database.
Graph 6 ‐ Relationship between Groups and Average Percapita
Revenues ‐ Metropolitan Regions' municipalities
0
1
2
3
4
5
00 500 1.000 1.500 2.000 2.500 3.000 3.500 4.000 4.500
Average Percapita Revenues ‐ 1998‐2002
Gro
ups ‐ 2
000
0 a 20 mil
20 a 50 mil
50 a 100 mil
100 a 500 mil
500 mil a 1 milhão
mais de 1 milhão
Source: CEM’s Municipality Information Database.
19

20

21

22
23
Graph 18 Per Capita Revenue Inequality by Source Brazilian Metropolitan Regions – 2002-6
0,000
0,100
0,200
0,300
0,400
0,500
0,600
Belém
Fortalez
aRecif
e
Salvad
or
Goiânia
Distrit
o Federal
Belo Horiz
onte
Rio de Jan
eiro
São Pau
lo
Campinas
Vitória
Curitiba
Porto A
legre
Arrecadação Própria AR + Estaduais AR + FPM
AR + Transf Cond Univ AR + Todas transfers

24
Appendix 1 – Socio-economic indexes
The six types of Brazilian municipalities were obtained by means of factor and grouping analysis based on indicators of poverty and income inequality as well as social and housing conditions, listed in Table 1. The data is based on the 2000 Census conducted by the Instituto Brasileiro de Geografia e Estatística (IBGE) and covers 5,507 municipalities.
Table 1 – Variables employed in the study
Dimension Variables % of Variance explained by
factor analysis
% of inhabitants with per capita income lower than 1/4 of the minimum wage (1) 91.5
% of inhabitants with per capita income lower than 1/2 of the minimum wage (1) 94.5
Poverty and Inequality
% of the income appropriated by the poorest 20% 71.1
% of children (between 7 and 14) out of primary school 50.1
% of teenagers (between 15 and 17) with less than 4 years’ schooling
89.8
% of young people (between 18 and 24) with less than 4 years’ schooling
91.0
Child mortality rate 81.7
Mortality rate of children under the age of 5 80.1
Social Conditions
Rate of fecundity 58.3
% of privately-owned and rented households 0.05
% of house-type and flat-type households 0.04
% of households built on privately-owned real estate 0.04
% of households connected to water provision systems 32.5
% of households connected to the sewage pipeline 42.8
% of households with garbage collection 68.1
% of households with restrooms 57.5
Number of per capita in-household restrooms 70.9
Housing Conditions
Number of inhabitants per household 47.4
(1) Minimum wage in July 2000 = R$ 151.

25
Factor analysis obtained three factors: (i) income poverty and inequality; (ii) social
conditions and (iii) housing conditions. Hence, the 15 original variables turned into 3
synthetic indicators. The explanation of total variability ranges from 53.2% for housing
conditions to 85.7% for income poverty and inequality.
Table 2 – Factorial Weights
Dimension Components Factorial Weights
% of inhabitants with per capita income lower than 1/4 of the minimum wage (1)
0.972
% of inhabitants with per capita income lower than 1/2 of the minimum wage (1) 0.957
Poverty and
Inequality % of the income appropriated by the poorest 20% 0.844
% of young people (between 18 and 24) with less than s 4 years’ schooling 0.954
% of teenagers (between 15 and 17) with less than 4 years’ schooling 0.947
Child mortality rate 0.904
Mortality rate of children under the age of 5 0.895
Rate of fecundity 0.763
Social Conditions
% of children (between 7 and 14) not receiving fundamental schooling 0.708
Number of per capita in-household restrooms 0.842
% of households with garbage collection 0.825
% of households with restrooms 0.758
Number of inhabitants per household -0.689
% of households connected to the sewage pipeline 0.654
Housing Conditions
% of households connected to water provision systems 0.570

26
Synthetic indicators have been derived the results of factor analysis. Value 0 (zero)
represents the worst situations, whereas value 1 (one) corresponds to the best. They are
expressed as: iji
ijj YI ∑= α
Where j corresponds to the number of dimensions, ijα to the coefficient of the standard
factor score related to the variable Yij of the dimension j and mínimoorignalmáximoorignal
mínimoorignaloriginalij YY
YYY
,,
,
−
−=
is the variable i standardized to the scale 0 to 1 of dimension j.
Six groups were obtained. Their characteristics are displayed in tables 3 to 6.
Table 3 – Number of Municipalities and Population per Group
Brazil, 2000
Group Number of Municipalities Population
Urban
Population % Total
Population
Urbanization Rate (%)
Total 5,506 169,796,447 138,888,154 100.0 81.8
1 2,225 109,674,762 101,404,853 64.6 92.5
2 1,011 22,809,959 18,012,543 13.4 79.0
3 287 4,585,122 2,671,429 2.7 58.3
4 1,063 19,604,153 11,281,381 11.5 57.5
5 703 10,189,801 4,451,681 6.0 43.7
6 217 2,932,650 1,066,267 1.7 36.4
Source: CMS Municipality Databank.

27
Table 4 – Income Poverty and Inequality Indicators per Group Average Values - Brazil, 2000
Group
% of inhabitants with per capita
income lower than 1/4 of the
minimum wage
% of inhabitants with per capita
income lower than 1/2 of the
minimum wage
% of the income appropriated by the poorest 20%
Total 16.5 33.0 2.5
1 7.4 19.3 2.8
2 19.2 41.8 2.3
3 29.9 56.7 2.2
4 37.8 65.0 1.8
5 49.8 75.1 1.3
6 56.4 80.4 1.3 Source: CMS Municipality Databank
Table 5 – Components of Social Conditions per Group Average Values - Brazil, 2000
Group
% of children
(between 7 and 14) out
of fundamental
school
% of teenagers (between
15 and 17) with less than 4 years’
schooling
% of young people
(between 18 and 24) with less than 4 years’
schooling
Rate of fecundity
(out of 1,000
women)
Mortality rate of
children under 5 years of
age
(out of 1,000)
Child mortality
rate
(out of 1,000)
Total 8.4 8.8 10.5 2.3 25.9 23.5
1 6.9 6.5 7.3 2.1 22.6 21.4
2 10.4 15.1 16.9 2.6 38.7 29.6
3 12.6 26.5 27.4 3.3 44.2 36.2
4 13.1 31.7 33.7 3.0 67.7 47.4
5 14.8 43.7 43.4 3.7 79.6 53.5
6 22.6 55.6 52.1 4.4 95.1 63.3
Source: CMS Municipality Databank
28
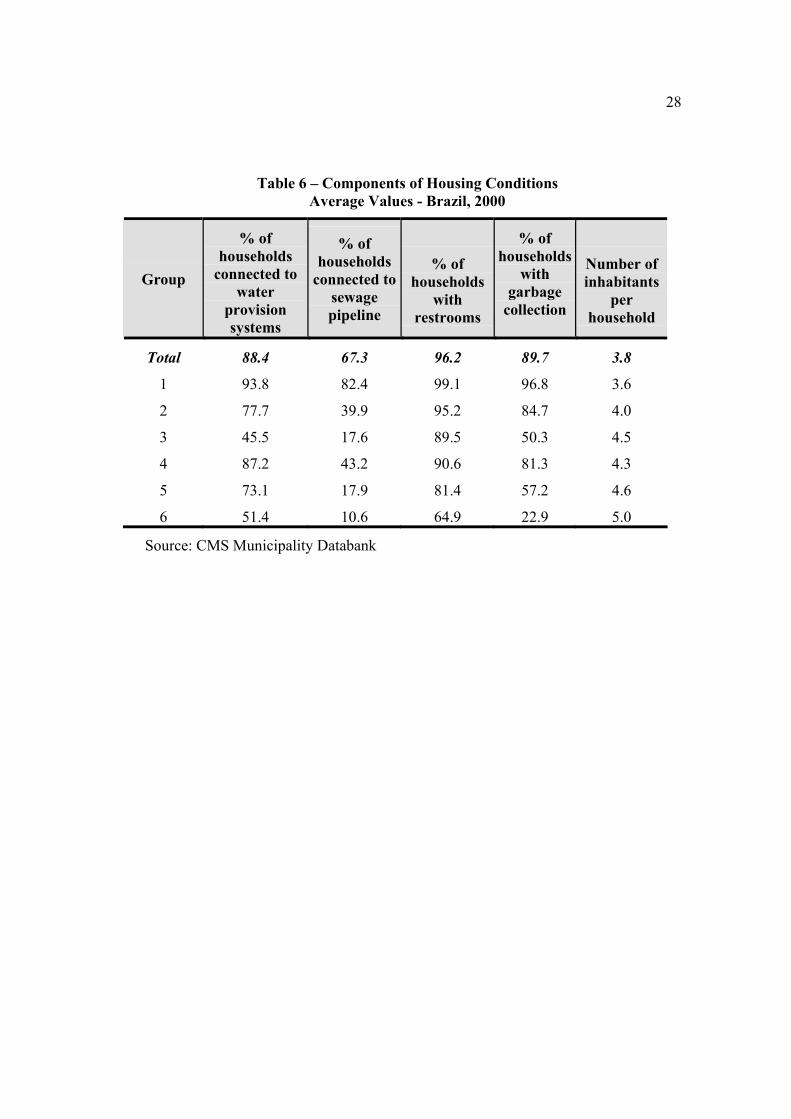
Table 6 – Components of Housing Conditions Average Values - Brazil, 2000
Group
% of households
connected to water
provision systems
% of households
connected to sewage pipeline
% of households
with restrooms
% of households
with garbage
collection
Number of inhabitants
per household
Total 88.4 67.3 96.2 89.7 3.8
1 93.8 82.4 99.1 96.8 3.6
2 77.7 39.9 95.2 84.7 4.0
3 45.5 17.6 89.5 50.3 4.5
4 87.2 43.2 90.6 81.3 4.3
5 73.1 17.9 81.4 57.2 4.6
6 51.4 10.6 64.9 22.9 5.0
Source: CMS Municipality Databank


www.centrodametropole.org.br