crime, the criminal justice system, and socioeconomic ...ftp.iza.org/dp9812.pdf · crime, the...
TRANSCRIPT

Forschungsinstitut zur Zukunft der ArbeitInstitute for the Study of Labor
DI
SC
US
SI
ON
P
AP
ER
S
ER
IE
S
Crime, the Criminal Justice System, andSocioeconomic Inequality
IZA DP No. 9812
March 2016
Magnus LofstromSteven Raphael
Crime, the Criminal Justice System, and Socioeconomic Inequality
Magnus Lofstrom Public Policy Institute of California
and IZA
Steven Raphael
University of California, Berkeley and IZA
Discussion Paper No. 9812 March 2016
IZA
P.O. Box 7240 53072 Bonn
Germany
Phone: +49-228-3894-0 Fax: +49-228-3894-180
E-mail: [email protected]
Any opinions expressed here are those of the author(s) and not those of IZA. Research published in this series may include views on policy, but the institute itself takes no institutional policy positions. The IZA research network is committed to the IZA Guiding Principles of Research Integrity. The Institute for the Study of Labor (IZA) in Bonn is a local and virtual international research center and a place of communication between science, politics and business. IZA is an independent nonprofit organization supported by Deutsche Post Foundation. The center is associated with the University of Bonn and offers a stimulating research environment through its international network, workshops and conferences, data service, project support, research visits and doctoral program. IZA engages in (i) original and internationally competitive research in all fields of labor economics, (ii) development of policy concepts, and (iii) dissemination of research results and concepts to the interested public. IZA Discussion Papers often represent preliminary work and are circulated to encourage discussion. Citation of such a paper should account for its provisional character. A revised version may be available directly from the author.

IZA Discussion Paper No. 9812 March 2016
ABSTRACT
Crime, the Criminal Justice System, and Socioeconomic Inequality*
Crime rates in the United States have declined to historical lows since the early 1990s. Prison and jail incarceration rates as well as community correctional populations have increased greatly since the mid-1970s. Both of these developments have disproportionately impacted poor and minority communities. In this paper, we document these trends. We then present an assessment of whether the crime declines can be attributed to the massive expansion of the U.S. criminal justice system. We argue that the crime is certainly lower as results of this expansion and the crime rate in the early 1990s was likely a third lower than what they would have been absent changes in sentencing practices in the 1980s. However, there is little evidence of an impact of the further stiffening of sentences during the 1990s, a period when prison and other correctional populations expanded rapidly. Hence, the growth in criminal justice populations since 1990s have exacerbated socioeconomic inequality in the U.S. without generating much benefit in terms of lower crime rates. JEL Classification: D3, D63, I3 Keywords: crime, criminal victimization, inequality, incarceration, prison Corresponding author: Magnus Lofstrom Public Policy Institute of California 500 Washington Street, Suite 600 San Francisco, CA 94111 USA E-mail: [email protected]
* Forthcoming in: Journal of Economic Perspectives.
1
Introduction
After peaking in the early 1990s, official measures of violent and property crime rates dropped
to levels not seen since the 1960s. Proportional declines in the most serious offenses have been
particularly pronounced. For example, murders/manslaughter per 100,000 declined by more than half,
from 9.8 in 1991 to 4.5 in 2014, the lowest recorded murder rate since 1960. The violent crime rate
overall fell by approximately half over this period while overall property crime rates fell by nearly 50
percent. Juxtaposed against this declining crime rate has been an enormous and unprecedented
expansion in U.S. correctional populations. Between 1980 and 2013, the prison incarceration rate
increased nearly 3.5 times, the jail incarceration rate increased by nearly three times, while the
community correction supervision rate (numbers of people on probation or parole per 100,000) increase
by 2.6 times. By 2013, roughly 3 percent of the adult population in the United States was under some
form of criminal justice supervision. Over this time period, the U.S. transitioned from a nation with an
incarceration rate slightly higher than that of western European nations to the nation with the highest
incarceration rate in the world.
These two coinciding trends present a provocative contrast illustrating the conflicting manner in
which changes in crime and punishment over the past few decades have impacted socioeconomic
inequality in the United States. As we will show, crime rates declined the most in poorer more minority
cities, and within cities, in the poorest neighborhoods. In other words, the benefits of the crime decline
have been progressively distributed. By contrast, the social costs created by the unprecedented
expansion in correctional populations have been regressively distributed, with poor disproportionately
minority males (African-American males in particular) being most directly impacted and poor minority
families (again African- American families in particular) disproportionately bearing the collateral social
costs of the stiffening of U.S. sentencing policy.
2
There is an ongoing debate on the extent to which the rise in incarceration and the extended
reach of the criminal justice system drove recent declines in crime. There is fairly strong evidence for
the U.S. and other nations of sizable effects of incarceration on crime operating largely through physical
incapacitation. These effects, however, diminish with scale as expanding the use of incarceration along
the intensive margin tends to incarcerated individuals into advanced ages when the propensity to offend
declines while expansions along the extensive margin tends to net less criminally active individuals.
There is less evidence that the more extensive use of probation and the increased propensity of courts
across the country to levy fines and fees on those convicted of serious and less serious criminal offenses
have contributed to crime declines.
In what follows we document both the disproportion incidence of the decline in crime as well
as the increase in criminal justice sanctioning and involvement born by poor and minority communities.
We argue that the coincidence of these two trends do not necessarily support the contention that one
has caused the other. In particular, the crime decline commencing in the early 1990s is observed in
other countries that have not greatly expanded the scope and reach of their criminal justice systems.
Moreover, while increases in incarceration during the 1980s likely suppressed peak crime rates in the
early 1990s, the crime decline corresponds to a period of rapid growth in incarceration levels for which
there is little evidence of an appreciable impact on crime. Finally, the recent experiences of several
states with reducing incarceration suggest that the contribution of higher incarceration rates to crime
abatement is limited at current levels. The experience of California where the state was forced by a
federal court to reduce its incarceration rate to 1990 levels is particularly instructive. In the conclusion,
we argue that public policy can and should pursue both ongoing reductions in crime and in the
inequality of crime victimization, as well as simultaneously seeking to reduce the inequality of criminal
justice sanctioning.

3
Inequality in criminal victimization
There are two principal sources of crime data in the United States. First, the Uniform Crime
Reports (UCR) provides counts of crimes known to the police by month and crime type. Second, the
National Crime Victimization Survey (NCVS) provide crime rate estimates based on an annual household
survey conducted by the U.S. Census Bureau. Crime rates tabulated from the NCVS tend to be higher
than those tabulated from the UCR due to under-reporting of crimes to the police. In addition, there are
notable differences in trend estimates from these two data sources. For example during the 1970s and
1980s, the NCVS shows overall decreases in crime while crime rates as measured by the UCR increase
substantially.2 In recent years trends in these two data sources tend to align. Both suggest increase in
serious violent crime during the 1980s. As we will soon see, both show very pronounced declines in
crime and victimization since the early 1990s. The simultaneous analysis of these two data sources
permits a more complete picture of how crime/victimization risk varies with socioeconomic
characteristics.
Figure 1 presents rates of violent and property crime, both expressed as the number of incidents
per 100,000 people, from the UCR for the period 1980 through 2013. The violent crime rate is the sum
of murders, rapes, robberies, and aggravated assaults per 100,000 residents. Property crime rates are
the number of burglaries, motor vehicle thefts, and larceny thefts per 100,000 residents. These seven
felony crimes (often referred to as the FBI’s “part 1” felony offenses) provide the standard
categorization of serious offenses in the United States. Both series show peaks in 1991. While there are
some doubts about whether UCR-measured increase in property crime during the late 1980s captures
an actual rise in crime or trends in crime reporting by both victims and agencies participating in the UCR
(Boggess and Bound 1997), the increase in serious violent crime— and homicide in particular—
beginning around 1985 is a well-documented fact (Blumstein and Rosenfeld 1998). Figure 1 also reveals 2 As participation of the nation’s thousands of police departments improves over the course of the 20th century and as victim reporting increases, aggregate crime rates rose (Boggess and Bound 1997).
4
very large declines in crime rates from 1991 on. Violent crime rates dropped by more than half over this
period, while property crime rates fell by nearly half. As we will see shortly, victimization statistics
reveal very similar overall patterns.
One cannot use the historical data from the Uniform Crime Reports to explore in a direct way
how crime rates as experienced by different socioeconomic groups have changed over time. For the
most part, the data are summarized at the law enforcement agency level with little micro-level
information on specific criminal incidents.3 However, police agencies tend to correspond geographically
with incorporated cities, and cities vary considerably with respect to average socioeconomic and
demographic characteristics. Hence, one can assess the incidence of the crime decline by examining the
relationship between changes in crime rates across cities with different socioeconomic characteristics.
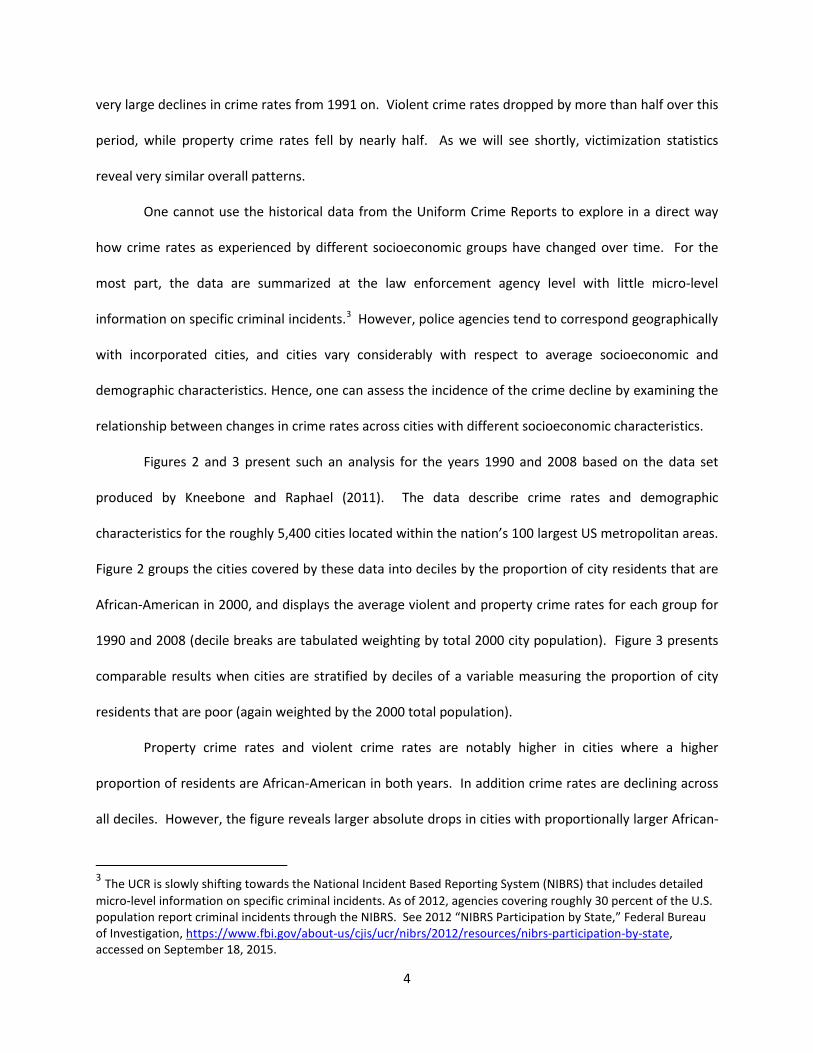
Figures 2 and 3 present such an analysis for the years 1990 and 2008 based on the data set
produced by Kneebone and Raphael (2011). The data describe crime rates and demographic
characteristics for the roughly 5,400 cities located within the nation’s 100 largest US metropolitan areas.
Figure 2 groups the cities covered by these data into deciles by the proportion of city residents that are
African-American in 2000, and displays the average violent and property crime rates for each group for
1990 and 2008 (decile breaks are tabulated weighting by total 2000 city population). Figure 3 presents
comparable results when cities are stratified by deciles of a variable measuring the proportion of city
residents that are poor (again weighted by the 2000 total population).
Property crime rates and violent crime rates are notably higher in cities where a higher
proportion of residents are African-American in both years. In addition crime rates are declining across
all deciles. However, the figure reveals larger absolute drops in cities with proportionally larger African-
3 The UCR is slowly shifting towards the National Incident Based Reporting System (NIBRS) that includes detailed micro-level information on specific criminal incidents. As of 2012, agencies covering roughly 30 percent of the U.S. population report criminal incidents through the NIBRS. See 2012 “NIBRS Participation by State,” Federal Bureau of Investigation, https://www.fbi.gov/about-us/cjis/ucr/nibrs/2012/resources/nibrs-participation-by-state, accessed on September 18, 2015.

5
American population. While the ratios of crime rates in decile 10 to decile 1 actually increase slightly
between 1990 and 2008, the absolute differences in crime rates narrow considerably. For example, the
average violent crime rate in tenth-decile cities in 1990 exceeded that of first-decile cities by 1,498 per
100,000. By 2008, this difference shrinks to 1,045 per 100,000. The comparable differences for
property crime rates are 5,179 per 100,000 in 1990 and 3,495 per 100,000 in 2008.
Figure 3 reveals comparable changes in the relationship between city-level poverty rates and
city-level crime rates. Again, in both years, crime rates are appreciably higher in cities in which a higher
share of the population was below the poverty line, and the drop in crime over time is apparent.
However, the inequality between cities with the highest and lower poverty rates narrows considerably
over this 18-year period. Here we observe a narrowing of both the ratio of crime rates as well as the
absolute difference. Expressed as a ratio, the 1990 violent crime rate among the cities in the top
poverty decile was 15.8 times the rate for the cities in the lowest poverty decile. By 2008, the ratio falls
to 11.9. When expressed in levels, in 1990 the violent crime rate in the cities in the upper decile for
poverty rates exceeds the violent crime rate in cities in the lowest decile for poverty rates by 1,860
incidents per 100,000. By 2008, the absolute difference in violent crime rates shrinks to 941 per
100,000. We see comparable narrowing in the differences between poorer and less poor cities in
property crime rates.
Within cities, crime tends to be geographically concentrated in poorer neighborhoods with
proportionally larger minority populations. In recent years, many police departments have begun to
make public geo-coded incident level data permitting analysis of more granular geographic inequality in
crime rates. However, official crimes and clearances collected under the UCR are only summarized at
the agency level. Moreover, we are not aware of a national data source that provides geographically

6
disaggregated crime data for the time period corresponding to the great crime decline.4 Cohen and Gorr
(2001), however, have assembled data on crime counts by census tract for the cities of Pittsburgh, PA
and Rochester NY, covering the period 1990 through 2001. Here we employ the data for Pittsburgh to
assess whether the cross-city difference in the crime declines observe in figures 2 and 3 are also evident
at a more geographically- disaggregated level. Over this time period total violent crimes reported to the
Pittsburgh police decline by 34 percent while total property crimes reported fall by 44 percent. Over
this time period, Pittsburgh’s population declines by roughly 10 percent. Hence, the period in time
corresponds to an appreciable decline in crime rates.
Table 1 summarizes our analysis. In panel A, We split census tracts in Pittsburgh into quintiles of
the distribution of the variable measuring the proportion of the census tract African-American in 2000.
For each census tract, we use the data from Cohen and Gorr (2001) to measure the absolute change in
part 1 violent and property offenses between 1990 and 2001. The first column present the ratio of the
change in violent crime summed across the census tracts in the given quintile to the overall change in
violent crime (negative values indicate that crime increased in the respective quintile). The next column
presents similar tabulations for property crime. The third column shows the proportion of the city’s
population in 2000 in each tract group while the final two columns show the proportion African-
American and the proportion poor in each group. Panel B produces a similar analysis where census
tracts are stratified according to quintiles of the variable measuring the proportion of tract residents
that are poor in the 2000 census.
The table reveals a very geographically concentrated crime decline within the city of Pittsburgh.
The decline in violent crime in the 20 percent of tracts with the highest proportion black amounts to 54
percent of the overall decline in violent crime citywide. These tracts account for 23 percent of the city’s
population, have an average proportion black among tract residents of 0.78 and an average proportion 4 The National Neighborhood Crime Study (ICPSR study #27501) does provide tract level information on crime rates merges to census demographic data for 91 cities located within 64 metropolitan areas for the year 2000.

7
poor of 0.32. Similarly, the decline in violent crime in the poorest quintile of tracts amounts to 60
percent of the citywide decline in violent crime incidents, despite these tracts being home to only 17
percent of the city’s population. The violent crime declines are considerably smaller in tracts with
smaller proportions African-American and smaller proportion poor. Interestingly, while the decline in
property crime is also skewed towards poorer more minority census tracts, the geographic incidence of
this decline is more even across the city’s neighborhoods.5
Ideally, we would like to analyze trends in individual or households level victimization rates for
different income groups, such as quintiles of the household income distribution. Unfortunately, the
income variable in the National Crime Victimization Statistics only reports household income ranges.
Moreover, the nominal values of this variable are coded similarly over time, making it quite difficult to
consistently subdivide the income distribution as nominal income increase with inflation. However, we
can use the NCVS data on race/ethnicity to assess whether the cross-city patterns that we have
documented (as well as the within city patterns for Pittsburgh) are consistent with inter-personal
victimization differentials.
Figure 4 presents the violent and property crime victimization rates by race/ethnicity for the
period 1993 through 2013. For property crime, rates are expressed per 1,000 households according to
the race of the household head. The serious violent victimization rate is measured per 1,000 residents
12 years of age and over and excludes homicide. The patterns in figure 4 confirm our cross-city and
limited within-city analysis. Victimization rates decline sharply for all race/ethnic groups. However, the
absolute and relative declines are largest for African-Americans and Hispanics. Given the average
income differentials and differences in poverty rates between whites, Hispanics, and African-Americans,
these results strongly indicate that lower income households experienced disproportionately large
reductions in criminal victimization since the beginning of the crime decline. 5 The crime decline since the early 1990s has also considerably narrowed the difference in crime rates between the national central cities and suburbs. See Kneebone and Raphael (2011).

8
The most pronounced disparities in criminal victimization in the United States are found in
homicide rates. There are enormous inter-racial disparities in homicide, with very strong interactions
between gender and age. While these disparities are evident in all years with recorded data (O’Flaherty
and Sethi 2010), they change drastically over time with shocks to drug markets and broader trends in
crime rates. In 2008, the black homicide rate of 19.6 per 100,000 was nearly six times the white
homicide rate (3.3 per 100,000). In 1991, at the peak of the run-up in black in homicide rates beginning
in 1986, the black homicide rate of 39.4 per 100,000 was over seven times that of the white homicide
rate of 5.6 per 100,000. Figure 5 shows homicide rates for white and black males for three age
groupings: 14 to 17 years of age, 18 to 24 years of age, and 25 and older. Several notable patterns
emerge. First, homicide rates for black males 18 to 24 years of age are extraordinarily high in all years,
reaching nearly 200 per 100,000 in the early 1990s and then declining to 91 per 100,000 in 2008.
Second, homicide rates in all ranges for black males exceed homicide rates for white males. Third,
since the early 1990s black male homicide rates have fallen dramatically, falling by half for males 18 and
over and by over 60 percent for 14 to 17 year-old black males. White male homicide rates also dropped
by roughly 40 to 50 percent, but from a much lower base.
Despite the decline in homicide rates since 1991, the homicide rates currently experienced by
black males in the United States remain stunningly high. Understanding and addressing the high
homicide rates for African-American males constitutes one of the most important criminal justice
problems faced by the United States.
Inequality in the incidence of the direct and indirect costs of punishment
The operation of the US criminal justice system is costly. For example, Anderson (2012)
estimates annual US criminal justice expenditures circa 2010 of roughly $113 billion on police, $81
billion on corrections, $76 billion in expenditure by various federal agencies, and $84 billion devoted to

9
combating drug trafficking. Beyond expenditures, criminal justice enforcement imposes costs on those
convicted of crimes, their family members, and their communities. Some of these social costs are the
direct and intended result of punishment, while others are indirect and unintended. For example, the
forced removal from non-institutionalized society associated with incarceration or the restrictions on
liberties associated with a probation term are the direct and intended consequences.6 The material
deprivation of family members associated with losing an adult earner represent costs that are indirect
and unintended. The prevalence and magnitude of these hard-to-measure direct and indirect social
costs have increased and in an unequal manner over the past four decades. This has disproportionately
affected poor minority communities, and in particular African-American men.
Before proceeding, a few institutional definitions regarding US corrections practices are in order.
“Prisons” generally house those who are convicted of felonies and sentenced to serve at least one year.
“Jails” house individuals awaiting arraignment and or trial or who are sentenced to relatively short
incarceration spells. Many who are convicted of both felonies and misdemeanors are sentenced to
probation in lieu of incarceration, or sometimes in combination with a short jail sentence. Individuals on
probation are monitored in the community with the degrees of stringency often depending on risk
assessments conducted by local probation departments. Probation may be revoked for non-compliance
with the conditions of probation, a legal action that can result in a jail or prison term. Finally, most
prison releases are conditional from prison to a parole term. Paroled individuals are technically still
under the custody of the state department of corrections and can have their conditional release revoked
for technical reasons (missing appointments, leaving the county, testing positive for drugs) or for
6To be sure, that consequences are intended does not imply that they are socially optimal. Assessing the optimality of a given set of sentencing practices requires the articulation of a set of normative principals governing sentencing policy. For example, the recent National Academies of Science study of U.S. incarceration rates articulated a normative framework for sentencing reform based on proportionality, procedural fairness, recognition of the possibilities for redemption and other deontological criteria stressing human rights and common citizenship (Travis and Western 2014). Alternatively, one may specify a more consequentialist position whereby the value of crime prevention net of enforcement costs defines the objective. In both frameworks, the direct effects of punishment associated with a given set of sentencing practices can be either too little or excessive.

10
committing new crimes (Petersilia 1998). Because each US state has its own penal code, sentencing
structure and department of corrections, sentencing and correctional practices vary appreciably across
states. Within states, each county has its own district attorney, sheriff’s department (in charge of
county jails), and probation departments, with practices varying widely across counties within states. In
addition, there is a federal prison system for those who commit federal felony offenses and a separate
system for processing federal cases.
Starting in the 1970s, federal and state jurisdictions across the United States toughened
sentencing practices. There are several stylized facts key to understanding the effects of these changes
in practice. First, for the most serious crimes, we do not observe an increase in arrest rates or the
number of arrests per crime. The one exception concerns drug arrests where there is a pronounced
increase in drug arrest rates starting in the mid-1980s that has been sustained through the present.
Second, conditional on being arrested for a crime the likelihood of being admitted to prison has
increased for all offenses, especially those offenses for which the likelihood of being admitted to prison
conditional on an arrest was low in years past (Neal and Rick 2015; Raphael and Stoll 2013; Travis and
Western 2014). Third, effective sentence lengths (i.e., ultimate time served) within crime categories
have gotten longer (Raphael and Stoll 2009, 2013; Neal and Rick 2015; Travis and Western 2014). This is
especially true for the most serious crimes with a high likelihood of being admitted to prison upon
conviction, such as murder robbery, or rape/sexual assault. However, this is also observed for less
serious crimes. Finally, nearly all of the growth since 1980 can be explained by tougher sentences
involving both more frequent use of prisons to punish felony offenses, as well as longer expected time
served either conditional on conviction (Neal and Rick 2015) or conditional on prison admission (Raphael
and Stoll 2013).
These changes have greatly expanded the reach of the criminal justice system, such that the
proportion of American residents involved with the criminal justice system has reached historic highs.

11
Figure 6 presents time series for various correctional populations, all expressed per 100,000 US
residents. Between 1980 and 2013, all rates increase dramatically. The probation caseload is the largest
in any given year, with roughly 500 per 100,000 on probation in 1980 expanding to over 1,200 per
100,000 in 2013. Between 1980 and 2007, the number of inmates in a state or federal prison increased
from 145 per 100,000 to 530 per 100,000. In recent years, the prison incarceration rate has receded
somewhat, in large part due to policy reforms in California, the state with the second largest prison
system in the country following the federal system. Jail incarceration rates have increased with prison
incarceration rates, increasing from 81 inmates per 100,000 in 1980 to a peak of 259 inmates in 2007
before receding slightly to a rate of 237 in 2013. Over the time period depicted in the figure, the
percent of the adult population under some form of active criminal justice supervision nearly tripled
from 1.1 to 3 percent.
The population of adults involved with the criminal justice system is highly skewed towards
specific demographic and socioeconomics groups (Raphael and Stoll 2013). For example, men account
for roughly 93 percent of state and federal prison inmates and 88 percent of local jail inmates. Prison
and jail inmates have very low levels of formal educational attainment, with 66 percent of state
prisoners, 56 percent of federal prisoners, and 55 percent of local jail inmates having less than a high
school degree. African Americans are heavily over-represented among the incarcerated, accounting for
43 percent of state prisoners, 46 percent of federal prisoners, approximately 50 percent of jail inmates,
in comparison with 13 percent of the US population as a whole. Hispanics are also overrepresented
relative to the proportion to the general population, though to a lesser degree. Finally, most of the
incarcerated are in prime working age ranges for men, ranging from their late 20s to their early 40s.
Whether measured at a point in time or as a cumulative life risk, incarceration, probation, and
parole are common experiences in many minority communities. Tabulations from the 2010 American
Community Survey indicate that roughly 11 percent of black men between 26 and 40 are residing in

12
institutionalized group quarters on any given day. Narrowing the focus on black male high school
dropouts in high incarceration age ranges yields institutionalization rates of nearly one-third (Raphael
2005). The Bureau of Justice Statistics estimates that nearly one-third of black males born in 2001 will
serve prison time at some point in their lives. The comparable figure for Hispanic men is 17 percent
(Bonczar 2003). Using data from the Panel Study of Income Dynamics, Petit and Western (2004)
estimate that for African-American men born between 1965 and 1969, 20.5 percent had been to prison
by 1999. The comparable figures were 30.2 percent for black men without a college degree and
approximately 59 percent for black men without a high school degree. We do not have comparable
estimates for the proportions who have ever served a jail spell, been convicted of a felony or
misdemeanor, been arrested, or been sentenced to probation, but such tabulations would undoubtedly
reveal additional racial and ethnic disparities.
A great deal of research effort has been devoted to exploring many of the “collateral
consequences” of the expansion of correctional populations; that is to say the unintended consequences
of punishment on convicted offenders, their families, and their communities more broadly. Collateral
consequence studies have addressed the effects of criminal justice involvement on employment
prospects (Grogger 1995, Holzer et. al 2006, Pager 2003, Western 2006, Mueller-Smith 2015), health
outcomes (Johnson and Raphael 2009, Schnittker et al 2011), family budgets (Johnson 2009, Comfort
2007, Braman 2004), problem behaviors and depression among children of the incarcerated (Wakefield
and Wildeman 2013), and political participation and civic engagement (Uggen and Manza 2002, Lerman
and Weaver 2014), to name a few areas of inquiry. Several studies find evidence of perverse effects of
incarceration spells on future criminal activity (Aizer and Doyle, forthcoming, Mueller-Smith 2015, Nagin,
Cullen and Johnson 2009) as well as adverse effects of harsher conditions of confinement (Lerman 2013)
and poor rehabilitation incentives for the incarcerated (Kuziemko 2012) on criminal recidivism.
13
The increasing prevalence of fines and fees imposed on those convicted of crimes raises an issue
of how an intended consequence of the criminal justice system—the fees and fines--can lead to an array
of unintended consequences. This issue recently received much attention with the release of an
investigative report by the US Department of Justice Civil Rights Division (2015) analyzing the practices
of the City of Ferguson, Missouri in the wake of the shooting death of Michael Brown by a Ferguson
police officer in August 2014. The report noted the excessive and aggressive use of fines and fees
imposed for minor crimes, with this revenue accounting for roughly one-fifth of the city’s general fund
sources. The city of Ferguson in is part of a broader trend. Courts and in some instances municipalities
may impose a series of legal financial obligations on those convicted of crimes. These charges take
many forms, including fees for the expense of jail incarceration, fees imposed on indigent defendants for
the provision of a public defender, fees and surcharges for court cost reimbursements as well as for
probation supervision, fines levied at sentencing for punishment, and restitution awards that
compensate specific victims or that contribute to specific victim compensation funds (Bannon,
Negrecha, and Diller 2010). Arrearages are common among individuals convicted of felony as well as
misdemeanor offenses, with substantial heterogeneity in practices across U.S. counties. While there is
little information on cumulative outstanding legal financial obligation, we estimate that in 2012 fine and
forfeiture revenue accruing to local, county, and state governments amounted to $15.3 billion.7
The use of fines and fees has increased in recent years. The best work on this topic is presented
in Harris, Evans, and Beckett (2010).8 In an analysis of nationally representative sentencing records and
inmate surveys, the authors document an increase between 1991 and 2004 in the proportion of
7 This estimate is based on our tabulations from the 2012 Census of Governments: State and Local Finances revenue category U30, “Fines and Forfeits”. 8 See also Beckett and Harris (2011) and Harris, Evans and Beckett (2011). Nagin (2008) provides a thoughtful discussion of the potential role of fines and fees in the US criminal justice system as an alternative sanction to incarceration, with attention to the implementation details, coordination requirements, and ethical tradeoffs. In addition, Ruback and Bergstrom (2006) provide a review of research on fines, fees, and restitutions and a discussion of the more systematic use of fines in western European countries.

14
convicted felons with fines imposed at sentencing from 0.11 to 0.34. In addition, the proportion with
outstanding restitution orders increases from 0.11 to 0.25. The authors also find that for convicted
felons sentenced to jail rather than prison, or probation rather than prison or jail, the incidence of fines
imposed at sentencing increases nearly threefold.
The authors also analyze administrative data on sentences imposed by Washington state
superior courts in the first two months of 2004, a period of time where roughly 3,000 felony sentences
were handed down. In addition to estimating mean and median monetary sanctions for these
sentences, the authors randomly selected 500 individuals and cumulated lifetime monetary sanctions
(including those imposed through juvenile courts) through the year 2008. The monetary sanctions
exhibit great variability within offense category, and tend to be largest for drug felonies. This analysis
revealed that many who are convicted of felony offenses carry substantial arrearages, and pay them off
very slowly. They estimate that the median outstanding debt amounts to roughly half the likely annual
earnings of the individuals impacted, while the mean balance is equal to a full year of potential earnings.
Money is fungible. When fines and fees are imposed as part of a criminal prosecution, at least
some of the financial burden will devolve on to the household of the person involved with the criminal
justice system. When someone who is involved in the criminal justice system has reduced employment
prospects, some of those financial costs will again be born by others in their household. We have said
nothing about the family resources devoted to replenishing inmate commissary accounts, the devotion
of household resources to prison phone calls, time devoted to visiting family members and the other
manners by which a family member’s involvement with the criminal justice system may tax a
household’s resources. To our knowledge, aggregate data on such costs do not exist.

15
The criminal justice expansion and the decline in crime
We have documented unprecedented shifts in both crime and punishment. Crime rates have
declined considerably since the early 1990s, and in a manner such that the benefits of this decline are
quite progressively distributed. On the other hand, criminal sanctioning has become considerably more
severe, with the direct and indirect impacts of this increased severity being regressively distributed. The
juxtaposition of these two trends begs questions concerning what is driving the decline in crime and
whether current punishment practices are necessary for maintaining currently low crime rates.
What caused the decline in US crime rates starting around 1991? There are a myriad of theories,
but no smoking-gun explanation for these phenomenal changes. One body of research has focused on
US time-series and cross-state evidence, both on changes in criminal justice policies and also on
demographic and other factors that could have affected crime rates. However, a complicating factor is
that many other western high-income countries with drastically different criminal justice systems have
experienced a fall in crime rates since the 1990s, which suggests that discussions of cause and effect
focused on distinctively American crime-enforcement policies and social events may be missing some
important causal factors.
In the US-focused literature on the decline of rates of crime, among the many explanations that
have been offered and evaluated by researchers are the general aging of the population (Levitt 2004;
Baumer and Wolff 2014), a delayed effect of the legalization of abortion (Donohue and Levitt 2001;
2003, Foot and Goetz 2005), lower blood-lead levels among successive birth cohorts associated with the
removal of lead from gasoline and paint (Rick 2000, 2007; Reyes 2012), technological innovations that
have made it more difficult to steal, especially locking systems in new cars (Farrell, Tilley. and Tseloni
2014), higher police staffing levels (Chalfin and McCrary forthcoming), innovative policing strategies
(Braga and Bond 2008; Weisburd et. al 2010, Zimring 2007), an increase in the deployment of private
security guards (Cook and MacDonald 2010, 2011) the waning of the crack cocaine epidemic (Fryer et. al

16
2013), and the enormous rise of US incarceration rates (Levitt 1996; Liedke, Piehl, and Useem 2006;
Raphael and Stoll 2013; Lofstrom and Raphael 2015). In an earlier assessment of the contribution of
these factors in this journal, Levitt (2004) argues that nearly all of the US crime decline since 1991 can be
explained by four factors: the legalization of abortion, the waning of the crack epidemic, the rise in the
US incarceration rate, and the increase in police staffing levels.
All of these hypothesized factors remain active areas of research. Here, we will focus in
particular on the possible linkage from incarceration to crime. As noted in the introduction, those who
benefit most from the reduction in crime and those who are most likely to be incarcerated both come
from the poorest communities in the country. Thus, the question arises as to the extent to which these
communities face a tradeoff between lower crime rates and higher incarceration rates.
Before discussing specific research on the relationship between incarceration and crime, it is
intriguing to note that other high-income countries have experienced a similar fall in crime rates without
much change in their criminal justice enforcement or incarceration patterns. Zimring (2006, 2007) has
noted the remarkable similarities between crime trends in the United States and Canada. Canada’s
property crime rate peaks in 1991 at 6,160 incidents per 100,000 before declining to 2,342 in 2013.
Canada’s violent crime rate peaked at 1,084 incidents per 100,000 before declining to a rate of 766 in
2013.9 However, Canada’s overall incarceration rate exhibits comparatively little variation. The
incarceration rate inclusive of pre-trial detainees (referred to as those on remand) in 2013 stood at 139
per 100,000,10 slightly higher than years past, but slightly less than one-fifth the comparable rate for the
United States in 2013.
9 See Statistics Canada, http://www.statcan.gc.ca/pub/11-630-x/11-630-x2015001-eng.htm, accessed on February 22, 2016. The similarities between US and Canadian homicide trends figure prominently in interpretation of some time series research pertaining to the deterrent effect of capital punishment, as in Donohue and Wolfers (2005) 10 See Statistics Canada, http://www.statcan.gc.ca/pub/85-002-x/2015001/article/14163/c-g/desc/desc01-eng.htm, accessed on February 22, 2016.
17
Tonry (2014) and Farrell, Tilly, and Tseloni (2014) provide further comparisons to mostly
western European nations. While the timing of crime peaks and declines differ somewhat across
countries, they observe substantial declines in violent crime, and lethal violence in particular,
throughout Western Europe, with the timing of the declines in the United Kingdom most similar to
crime trends in the United States. Taking a longer historical view, Eisner (2001, 2008, 2014) argues that
criminal violence and lethal violence in particular have declined considerably and almost continuously
since the thirteenth century AD. From this long-run perspective, the increase in violent crime
throughout the western world beginning in the mid-1960s appears to be an aberration from a longer-
term historical trend, with the downward trend resuming in the 1990s (Eisner 2008). Note,
incarceration rates in Western European countries are more in line with Canadian rates and a fraction of
the incarceration rates in the United States.
The comparable declines in crime in other nations raise questions regarding deeper forces in
western societies that are tending towards lower offending levels and casts some doubt on the claims
that the specific criminal justice policy choices made in the United States are the key in explaining the
crime declines. That being said, there is considerable heterogeneity across US states and cities in
criminal justice practices and changes therein as well as ample and sometimes discrete policy variation
in many national settings that permit well-identified study of the determinants of crime rates within
nations. Moreover, there are important differences in either timing and/or magnitude of the US crime
decline compared with the declines observed in other countries, suggesting that while the US
experience may reflect broader trends in criminality worldwide, there are factors that are specific to
United States or to other specific countries that certainly merit consideration.
Levitt’s 2004 review of the crime decline attributes one-third of the decline to increases in
incarceration during the 1990s. This assessment was based largely on research studying the
incarceration-crime relationship using data spanning the late 1970s, 1980s, and very early 1990s

18
(specifically, the estimates in Levitt 1996). Since the publication of Levitt’s (2004) assessment, there
have been several quasi-experimental studies of the prison crime relationship exploiting large, discrete,
and policy-induced changes in incarceration rates in the U.S. and elsewhere. There have also been
advances in panel data estimates that explore the possibility of diminishing marginal effectiveness of
incarceration as a crime-fighting tool. This research indeed demonstrates that at relatively low
incarceration rates, exogenous shocks to incarceration levels tend to have fairly large effects on crime,
mostly through criminal incapacitation. However, this research also shows very small effects of changes
in incarceration rates on crime when the incarceration rate is high—and evidence of diminishing
effectiveness sets in at relatively low levels of incarceration.
For example, recent studies of policy shocks in European countries (Barbarino and Mastrobuoni
2014, Buonanno and Raphael 2013, Vollard 2012) show fairly large incapacitation effects in national
settings with incarceration rates roughly one-sixth that of the United States. However, even in these
very low-incarceration national settings evidence of diminishing effectiveness is apparent. Buonanno
and Raphael (2013) find large reverse incapacitation effects of a mass Italian prison release in 2006 on
felony offending, on the order of 13 to 18 reported felony offenses for each prison year not served.
However, the effects are much smaller in Italian provinces with high pre-shock incarceration rates and
larger in provinces with lower rates, with “high” incarceration provinces in Italy having combined post-
and pre-trial incarceration rates that are generally below 200 per 100,000s. Vollard (2012) finds that the
application of a Dutch sentence enhancement for habitual offenders (those convicted of a new crime
with 10 or more prior felony convictions) netted considerably less active offenders in Dutch
municipalities that dipped further into the pool of local suspects in applying the sentencing
enhancements.
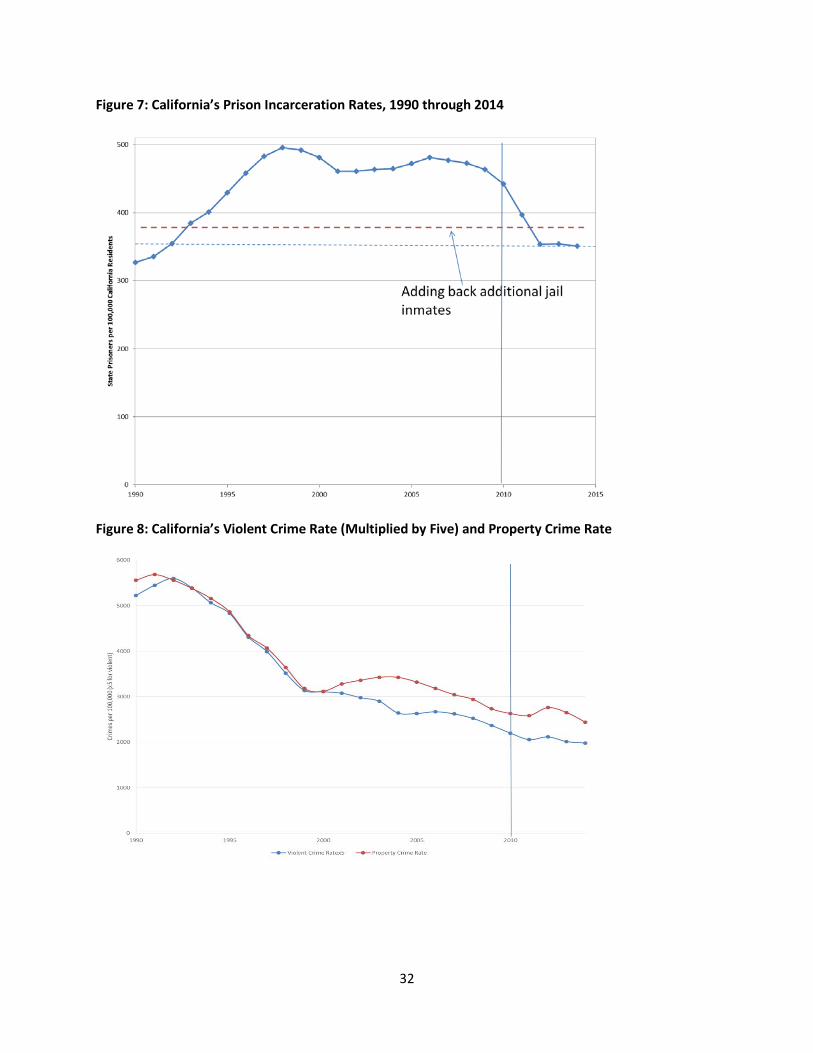
In Lofstrom and Raphael (2016), we look at a recent policy shock to California. In October 2011,
the state implemented sentencing reforms under pressure from a federal court order that greatly

19
limited the use of prison for technical parole violations and defined a class of less serious offenders to be
diverted from prison sentences to locally imposed sanctions. In a relatively short time period (within
one year), the state’s prison population declined by nearly 28,000 inmates (roughly 13 percent), with an
offsetting increase in the jail population of approximately 8,000 inmates. The reform reduced the
state’s incarceration rate (combining prison and jail together) to levels not seen since the early 1990s,
effectively wiping away most of the prison growth coinciding with state’s decline in crime (see Figure 7).
The sharp decline in incarceration in 2011/2012 had very small effects on the state’s crime rates.
Crime trends in California have been comparable to those of the nation, with reported property crime
rates peaking in 1991 and violent crime rates peaking in 1992. California crime rates decline
considerably through 2010—the last full year before the sentencing reforms. There is a slight uptick in
violent crime 2012, though this small uptick also occurred in states with comparable crime trends to
California. Moreover, counties that experienced a larger reduction in their county-specific incarceration
rates as a result of this reform did not experience relative increases in violent crime. In contrast, there is
a more notable uptick in property crime above and beyond what is observed for a comparison group of
states and also is larger in counties disproportionately impacted by the reform. However, the effect is
small. We estimate that California sentencing reform lead to 1.2 additional property felonies per prison
year not served, with the effect almost entirely concentrated on auto theft. Notably, both property and
violent crime rates in California remain at historical lows (see figure 8), far below the crime rates of the
early 1990s, despite complete reversal of the state’s incarceration growth since the early 1990s.
These findings for California are in line with recent panel data studies of the prison-crime effect.
Liedke, Piehl, and Useem (2006) provide the earliest explicit attempt to assess whether the crime
prevention effect of incarceration diminishes with scale. Using data from 1972-2000, in state-level panel
data regressions that allow for interaction effects of changes in incarceration rates with the
incarceration level, the authors find that the effect of incarceration on crime diminishes rapidly with

20
scale, approaches zero somewhere between an incarceration level of 300 and 400 per 100,000, and
possibly even turns positive at incarceration rates above that level.11
Johnson and Raphael (2012) provide further evidence of diminishing marginal effectiveness of
incarceration. The authors use an instrument for incarceration based on the difference between a
state’s current incarceration rate and the state’s steady-state incarceration rate implied by observable
admissions and release rates. The authors derive an empirical prediction regarding the impact of this
difference on next-year’s change in incarceration based on a theoretical model of the relationship
between crime and incarceration, and derive the conditions under which the transitory disparity
between the actual and steady state incarceration rate provides a valid instrument for one-year lead
changes in the actual incarceration rate. The authors then analyze state-level panel data for two time
periods: 1978 to 1990 and 1991 to 2004. The former period is characterized by a relatively low
incarceration rate (186 per 100,000) while the latter period is characterized by a much a higher
incarceration rate (396 per 100,000). For the early period, an additional prison year served is estimated
to prevent roughly 2.5 felony violent offenses and 11.4 felony property offenses, figures consistent with
the crime-prison elasticities reported in Levitt’s seminal study of the effect of prisoner over-crowding
lawsuits (Levitt 1996). However, the comparable figures for crimes prevented per prison year served for
the period 1991 through 2004 are 0.3 violent felony offenses and 2.7 felony property offenses. Raphael
and Stoll (2013) reproduce this analysis with updated data for three time periods: 1977 through 1988,
1989 through 1999, and 2000 through 2010, with corresponding weighted-average state incarceration
11 Theoretically, the use of incarceration can increase crime rates to the extent that the experience of incarceration is “criminogenic,” or criminality enhancing. This outcome could occur if incarcerated individuals acculturate to criminal norms, learn how to be a better criminal while serving time, experience erosion of human capital valued in legitimate employment, or become accustomed and perhaps undeterred by the prospect of future prison spells. Mueller-Smith (2015) and Aizer and Doyle (forthcoming) both find evidence of net criminogenic effects of incarceration for adults sentenced in Harris County, Texas and juvenile sentenced in Cook county Illinois, respectively. Both identify exogenous variation in detention exploiting random assignment to judges and inter-judge variation in sentencing severity. Nagin, Cullen, and Lero-Johnson (2009) offer a literature review of research assessing the effects of prior prison time on future offending.

21
rates of 171, 349, and 449. This reanalysis find very small prison-crime effects for the latter two time
periods (effectively zero for violent crime), but fairly large effects for the earliest time period, strongly
suggestive of diminishing returns to scale.
These state-level panel data studies can be used to tabulate the contribution of expanded
prison populations to declines in crime since the early 1990s. The estimates in Raphael and Stoll (2013)
suggest that at most 7 percent of the decline in property crime since 1990 can be attributed to
incarceration growth and none of the decline in violent crime. The larger estimates for the 1980s,
however, suggest that had the prison population not expanding between 1975 and 1989, the property
and violent crime peaks in the early 1990s would have been roughly one-third higher.
These studies suggest that drawing conclusions about how changes in incarceration rates will
affect crime must keep the context of the study in mind. The collective clemency in Italy is obviously
different from California’s sentencing reforms, which were focused on limiting the use of prison for
technical parole violations and less serious crimes, which in turn were different from the policy change
of enhancing sentences for career criminals in Netherlands. It can’t be assumed that levels or changes
incarceration rates or sentencing practices in one country will have similar effects in other countries
with different institutions and history. In addition, changes in incarceration seems to have diminishing
returns on crime, and thus it seems reasonable to argue that the rise in incarceration through the 1970s
and into the 1980s may have had a substantial effect in reducing US crime rates, while simultaneously
arguing that much of the growth in US incarceration rates since 1990 appears to have had little impact
on crime.
Conclusion
The burdens of criminal victimization and criminal justice enforcement have changed drastically
in the United States over the past three decades. Crime rates have fallen to historical lows since the

22
early 1990s with much larger absolute declines in relatively poor and minority communities. At the
same time, the reach of the criminal justice system has greatly expanded. This predates the decline in
crime by nearly a decade and a half, with prison incarceration rates and other correctional population
departing from historical levels in the mid-1970s. However, this expansion accelerates in the early
1990s. In recent years, correctional populations have receded somewhat, due to selective reforms in a
handful of states. However, incarceration rates, probation and parole populations, and the population
of former prisoners and convicted felons among the non-institutionalized remains at historical highs.
Similar to the incidence of victimization, the distribution across demographic groups of criminal justice
involvement is highly skewed towards low-income households, less educated men, and African
Americans. The great expansion in the scope and intensity of criminal sanctions has been born
disproportionately by these groups.
It is certainly the case that on average criminal justice supervision of various severities deters
and incapacitates and that the increases in incarceration through the early 1990s suppressed crime rates
at the peak, perhaps considerably. However, the vast expansions occurring during the 1990s and during
the first few years of the new century have bought little in terms of crime reduction but imposed
substantial costs on the sanctioned, their families, and their communities.
Many of the same low-income predominantly African American communities have
disproportionately experienced both the welcome reduction in inequality for crime victims and the less-
welcome rise in inequality due to changes in criminal justice sanctioning. While it is tempting to consider
whether these two changes in inequality can be weighed and balanced against each other, it seems to
us that this temptation should be resisted on both theoretical and practical ground. On theoretical
grounds, the case for reducing inequality of any type is always rooted in claims about fairness and
justice. In some situations, several different claims about inequality can be combined into a single
scale—for example, when such claims can be monetized or measured in terms of income. But the
23
inequality of the suffering of crime victims is fundamentally different from the inequality of
disproportionate criminal justice sanctioning, and cannot be compared on the same scale. In practical
terms, while higher rates of incarceration and other criminal justice sanctions may have had some effect
in reducing crime back in the 1970s and through the 1980s, there is little evidence to believe that the
higher rates have caused the reduction in crime in the last two decades. Thus, it is reasonable to pursue
multiple policy goals, both seeking additional reductions in crime and in the continuing inequality of
crime victimization and simultaneously seeking to reduce inequality of criminal justice sanctioning. If
such policies are carried out sensibly, both kinds of inequality can be reduced without a meaningful
tradeoff arising between them.

24
References
Aizer, Anna and Joe Doyle forthcoming, “Juvenile Incarceration, Human Capital, and Future Crime: Evidence from Randomly Assigned Judges,” Quarterly Journal of Economics.
Anderson, David A. (2012), “The Costs of Crime,” Foundations and Trends in Microeconomics, 7(3): 209-265. Bannon, Alicia; Diller, Rebekah and Mitali Negrecha (2010), Criminal Justice Debt: a Barrier to Reentry, Brennan Center for Justice, New York University School of Law. Barbarino, Alessandro and Giovanni Mastrobuoni (2014), “The Incapacitation Effect of Incarceration: Evidence from Several Italian Collective Pardons,” American Economic Journal: Economic Policy, 6(1): 1-37.
Baumer, Eric P. and Kevin T. Wolff (2014), “The Breadth and Causes of Contemporary Cross-National Homicide Trends,” in Tonry, Michael (editor), Crime and Justice, 43: 231-288. Beckett, Katherine and Alexes Harris (2011), “On Cash and Conviction: Monetary Sanctions as Misguided Policy,” Criminology and Public Policy, 10(3): 505-537. Blumstein, Alfred and Richard Rosenfeld (1998), “Explaining Recent Trends in Homicide Rate,” Journal of Criminal Law and Criminology, 88(4): 1175-1216. Bonczar, Thomas P. 2003. Prevalence of Imprisonment in the U.S. Population, 1974-2001. Washington, D.C.: Bureau of Justice Statistics Special Report, NCJ 197976. Boggess, Scott and John Bound (1997), “Did Criminal Activity Increase During the 1980s? Comparisons Across Data Sources,” Social Science Quarterly, 78(3): 725-739. Braga, Anthony A. and Brenda J. Bond (2008), “Policing Crime and Disorder Hot Spots: A Randomized Controlled Trial,” Criminology 46(3): 577-606.
Braman, Donald (2004), Doing Time on the Outside: Incarceration and Family Life in Urban America, University of Michigan Press, Ann Arbor, MI. Buonanno, Paolo and Steven Raphael (2013), “Incarceration and Incapacitation: Evidence from the 2006 Italian Collective Pardon,” forthcoming, American Economic Review. Chalfin, Aaron and Justin McCrary forthcoming, “Are U.S. Cities Underpoliced? Theory and Evidence,” Review of Economics and Statistics. Cohen, Jacqueline and Wilpen L. Gorr (2006), Development of Crime Forecasting and Mapping Systems for Use by Police in Pittsburgh, Pennsylvania and Rochester New York, 1990-2001. ICPSR 4545. Comfort, Megan (2007), “Punishment Beyond the Legal Offender,” Annual Review of Law and Social Science¸ 3: 271-296.

25
Cook, Philip J. and John Mac Donald (2010), “The Role of Private Action in Controlling Crime,” in Cook, Philip J.; Ludwig, Jens and Justin McCrary (eds.), Controlling Crime: Strategies and Payoffs, University of Chicago Press, Chicago, IL: pp 331-363. Cook, Philip J. and John Mac Donald (2011), “Public Safety Through Private Action: An Economic Assessment of BIDS,” Economic Journal 121: 445-462.
Donohue, John J. III and Steven D. Levitt (2001), “The Impact of Legalized Abortion on Crime,” Quarterly Journal of Economics, 116(2): 379-420. Donohue, John J. III and Steven D. Levitt (2003), “Further Evidence that Legalized Abortion Lowered Crime,” Journal of Human Resources, 39(1): 29-49.
Donohue, John J. and Justin Wolfers (2005), “Uses and Abuses of Empirical Evidence in the Death Penalty Debate,” Stanford Law Review, 58: 791 – 845.
Eisner, Manuel (2001), “Modernization, Self-Control, and Lethal Violence: The Long-Term Dynamics of European Homicide Rates in Theoretical Perspective,” British Journal of Criminology, 41(4): 618-648. Eisner, Manuel (2008), “Modernity Strikes Back? A Historical Perspective on the Latest Increase in Interpersonal Violence (1960-1990),” International Journal of Conflict and Violence, 2(2): 289-316. Eisner, Manuel (2014), “From Swords to Words: Does Macro-Level Change in Self-Control Predict Long-Term Variation in Homicide Trends,” in Tonry, Michael (editor), Crime and Justice, 43: 65-134. Farrell, Graham; Tilly, Nick and Andromachi Tseloni (2014), “Why the Crime Drop?” in Tonry, Michael (editor), Crime and Justice, 43: 421-490. Foot, Christopher L. and Christopher F. Goetz (2008), “The Impact of Legalized Abortion on Crime: Comment,” Quarterly Journal of Economics, 123(1): 407-423. Fryer, Roland G.; Heaton, Paul S.; Levitt, Steven D. and Kevin M. Murphy (2013), “Measuring Crack Cocaine and Its Impact,” Economic Inquiry, 51(3): 1651-1681. Grogger, Jeffrey (1995), “The Effect of Arrests on the Employment and Earnings of Young Men,” Quarterly Journal of Economics, 110(1): 51-71.
Harris, Alexes; Evans, Heather and Katherine Beckett (2010), “Drawing Blood from Stones: Monetary Sanctions, Punishment, and Inequality in the Contemporary United States,” American Journal of Sociology, 115(6): 1753-1799. Harris, Alexes; Evans, Heather and Katherine Beckett (2011), “Courtesy Stigma and Monetary Sanctions: Toward a Socio-Cultural Theory of Punishment,” American Sociological Review, 76(2): 234-264. Johnson, Rucker, (2009), “Ever-Increasing Levels of Parental Incarceration and the Consequences for Children, “In Do Prisons Make Us Safer? The Benefits and Costs of the Prison Boom, edited by Steven Raphael and Michael Stoll, 177-206, New York, NY: Russell Sage Foundation.

26
Johnson, Rucker and Steven Raphael (2009), “The Effect of Male Incarceration Dynamics on AIDS Infection Rates Among African-American Women and Men,” Journal of Law and Economics, 52(2):251-293. Johnson, Rucker and Steven Raphael (2012), “How Much Crime Reduction Does the Marginal Prisoner Buy?” Journal of Law and Economics, 55(2): 275-310. Kneebone, Elizabeth and Steven Raphael (2011), City and Suburban Crime Trends in Metropolitan America, The Brookings Institution, Washington, D.C. Lerman, Amy E. (2013), The Modern Prison Paradox: Politics, Punishment, and Social Community, New York: Cambridge University Press. Lerman, Amy E. and Vesla M. Weaver (2014), Arresting Citizenship: The Democratic Consequences of American Crime Control, Chicago: University of Chicago Press. Levitt, Steven D. (2004), “Understanding Why Crime Fell in the 1990s: Four Factors that Explain the Decline and Six that Do Not,” Journal of Economic Perspectives, 18(1): 163-190. Liedke, Raymond; Piehl, Anne Morrison and Bert Useem (2006), “The Crime Control Effect of Incarceration: Does Scale Matter?” Criminology and Public Policy, 5: 245-275. Lofstrom, Magnus and Steven Raphael (2016), “Incarceration and Crime: Evidence from California’s Realignment Sentencing Reform,” The ANNALS of the American Academy of Political and Social Sciences, 664(1): 196-220. Nagin, Daniel S. (2008), “Thoughts on the Broader Implications of ‘The Miracle of the Cells’,” Criminology and Public Policy, 7(1): 37-42. Nagin, Daniel S.; Cullen, Francis T. and Cheryl Leor Jonson (2009), “Imprisonment and Reoffending,” Crime and Justice, 38: 115-200. Neal and Rick forthcoming, “The Prison Boom and Sentencing Policy,” Journal of Legal Studies. Nevin, Rick (2000), “How Lead Exposure Relates to Temporal Changes in IQ, Violent Crime, and Unwed Pregnancy,” Environmental Research Section A, 83: 1-22. Nevin, Rick (2007), “Understanding International Crime Trends: The Legacy of Preschool Lead Exposure,” Environmental Research, 104: 315-336. O’Flaherty, Brendan and Rajiv Sethi (2010), “Homicide in Black and White,” Working Paper, Columbia University. Petersilia, Joan (1998), Community Corrections: Probation, Parole, and Intermediate Sanctions, Oxford University Press.

27
Pettit, Becky and Bruce Western (2004), “Mass Imprisonment and the Life Course: Race and Class Inequality in U.S. Incarceration,” American Sociological Review 69: 151-169.
Raphael, Steven (2005), The Socioeconomic Status of Black Males: The Increasing Importance of Incarceration. In Poverty, the Distribution of Income, and Public Policy edited by Auerbach, Alan; Card, David, and John Quigley, 319-358, New York, NY: Russell Sage Foundation. Raphael, Steven (2011), “Improving Employment Prospects for Former Prison Inmates: Challenges and Policy,” in Cook, Phillip J.; Ludwig, Jens and Justin McCrary (eds.) Controlling Crime: Strategies and Tradeoffs, University of Chicago Press, Chicago, Il: pp 521-572.
Raphael, Steven and Michael Stoll. 2009. Why Are So Many Americans in Prison? In Do Prisons Make Us Safer? The Benefits and Costs of the Prison Boom, edited by Steven Raphael and Michael Stoll, 27-72, New York, NY: Russell Sage Foundation. Raphael, Steven and Michael A. Stoll (2013), Why Are So Many Americans in Prison? Russell Sage Foundation: New York, NY. Ruback, R. Barry and Mark H. Bergstrom (2006), “Economic Sanctions in Criminal Justice: Purposes, Effects, and Implications,” Criminal Justice and Behavior, 33(2): 242-273. Tonry, Michael (2014), “Why Crime Rates are Falling Throughout the Western World,” in Tonry, Michael (editor), Crime and Justice, 43: 1-65. Travis, Jeremy and Bruce Western (2014), The Growth of Incarceration in the United States: Exploring Causes and Consequences, National Academies Press, Washington, D.C. Truman, Jennifer L. and Lynn Langton (2014),Criminal Victimization, 2013, Bureau of Justice Statistics, U.S. Department of Justice, NCJ 247648. Uggen, Christopher and Jeff Manza (2002), “Democratic Contraction? The Political Consequences of Felon Disenfranchisement in the United States,” American Sociological Review, 67: 777-803. U.S. Department of Justice (2015), Investigation of the Ferguson Police Department, U.S. Department of Justice Civil Rights Division, Washington, D.C. Vollard, Ben (2012), “Preventing Crime through Selective Incapacitation,” The Economic Journal, 123: 262-284. Wakefield, Sara and Christopher Wildeman (2013), Children of the Prison Boom: Mass Incarceration and the Future of American Inequality, Oxford University Press. Weisburd, David; Telep, Cody W.; Hinkle, Joshua C. and John E. Eck (2010), “Is Problem-Oriented Policing Effective in Reducing Crime and Disorder? Findings from a Campbell Review,” Criminology and Public Policy, 9(1): 139-172.

28
Western, Bruce (2006), Punishment and Inequality in America, Russell Sage Foundation: New York, NY. Wolpaw-Reyes, Jessica (2012), “Lead Exposure and Behavior: Effects on Anti-social and Risky Behavior Among Children and Adolescents,” Working Paper, Amherst College. Zimring, Franklin E. (2006), “The Necessity and Value of Transnational Comparative Study: Some Preaching from a Recent Convert,” Criminology and Public Policy, 5(4): 615-622. Zimring, Franklin E. (2007), The Great American Crime Decline, Oxford University Press.

29
Figure 1: Trends in U.S. Violent and Property Crime Rates, 1980 through 2012
Figure 2: Relationship Between Violent and Property Crime and Deciles of the Distribution of the Proportion of City Residents African-American in 2000 (Decile breaks weighted by 2000 population)
400
500
600
700
800
Viol
ent C
rimes
per
100
,000
1980 1990 2000 2010Year
3000
3500
4000
4500
5000
5500
Prop
erty
Crim
es p
er 1
00,0
00
1980 1990 2000 2010Year
1990
2008
050
010
0015
0020
00Av
erag
e vi
olen
t crim
e ra
te
0 2 4 6 8 10Decile, proportion African American
1990
2008
2000
4000
6000
8000
Aver
age
prop
erty
crim
e ra
te
0 2 4 6 8 10Decile, proportion African American

30
Figure 3: Relationship Between Violent and Property Crime and Deciles of the Distribution of the 2000 Proportion of City Residents in Poverty (Decile breaks weighted by 2000 population)
Figure 4: Violent Victimization per 1,000 U.S. Residents 12 and Over and Property Victimizations per 1,000 Households by Race/Ethnicity from the NCVS, 1993 through 2013
1990
2008
050
010
0015
0020
00Av
erag
e viol
ent c
rime r
ate
0 2 4 6 8 10Decile, proportion poor
1990
2008
2000
4000
6000
8000
1000
0Av
erag
e pro
perty
crim
e rate
0 2 4 6 8 10Decile, proportion poor
1020
3040
50Vio
lent v
ictim
izatio
n per
1,000
indiv
iduals
1995 2000 2005 2010 2015Year
Non-Hispanic Black HispanicNon-Hispanic White
100
200
300
400
500
Prop
erty v
ictim
izatio
n per
1,000
hous
ehold
s
1995 2000 2005 2010 2015Year
Non-Hispanic Black hispanicpropertyNon-Hispanic White

31
Figure 5: Male Homicide Rates by Race and Broad Age Group
Figure 6: Correctional Populations per 100,000 Residents, 1980 to 2013
0
50
100
150
200
250
1970 1980 1990 2000 2010
Hom
icid
es p
er 1
00,0
00
Black Males 18 to 24
Black Males 25 and Older
Black Males 14 to 17
White Males 18 to 24
White Males 25 and older
White males 14 to 17
0
200
400
600
800
1,000
1,200
1,400
1,600
0 10 20 30 40
Corr
retio
nal p
opul
atio
n pe
r 100
,000
reis
dent
s
Probation
State or federal prison
Jail
Parole
32
Figure 7: California’s Prison Incarceration Rates, 1990 through 2014
Figure 8: California’s Violent Crime Rate (Multiplied by Five) and Property Crime Rate

33
Table 1 Distribution of the Decline in Crime in the Pittsburgh, Pennsylvania between 1990 and 2001 by Census Tract Racial Composition and Poverty Rates Panel A: Distribution by tracts stratified by quintiles of the variable measuring the proportion of neighborhood residents that are African American in 2000 Quintile of proportion black
Ratio of total violent crime decline in quintile to overall decline in the city
Ratio of total property crime decline in quintile to overall decline in the city
Proportion of 2000 resident population
Proportion black Proportion poor
Q1 -0.01 0.07 0.17 0.05 0.15 Q2 0.03 0.17 0.18 0.10 0.16 Q3 0.12 0.18 0.24 0.17 0.19 Q4 0.31 0.23 0.19 0.47 0.29 Q5 0.54 0.34 0.23 0.78 0.32 Panel B: Distribution by tracts stratified by quintiles of the variable measuring the proportion of neighborhood residents that are poor in 2000 Quintile of proportion poor
Ratio of total violent crime decline in quintile to overall decline in the city
Ratio of total property crime decline in quintile to overall decline in the city
Proportion of 2000 resident population
Proportion black Proportion poor
Q1 0.07 0.14 0.21 0.08 0.06 Q2 -0.01 0.12 0.23 0.17 0.12 Q3 0.04 0.14 0.20 0.23 0.18 Q4 0.30 0.29 0.19 0.42 0.27 Q5 0.60 0.31 0.17 0.67 0.47 Population data from the 2000 Census summary tape files 1 and 3A. Crime data from Cohen and Gorr (2006).