tenured teachers: retaining the good ones - international journal
TRANSCRIPT

International Journal of Humanities and Social Science Vol. 1 No. 17 [Special Issue – November 2011]
11
Retaining the Good Ones: Factors Associated with Teacher Job Satisfaction
Kevin J. Walsh, Ed.D.
Assistant Professor
Educational Leadership Program Director William Paterson University
College of Education, 1600 Valley Road
Wayne, NJ 07470 United States of America
Jolene Battitori, Ed.D.
Principal Benedict A. Cucinella School
470 Naughright Road
Long Valley, NJ 07853 United States of America
Abstract
A study of teachers’ attitude and school cllimate was completed in an effort to identify the motivational factors
potentially affecting teachers’ decisions to remain in the profession. The study was conducted using data
collected by the National Center for Education Statistics (NCES) obtained through a survey administered during
the 2003-2004 school year to teachers across the nation. A statistical analysis was completed on responses of approximatley 500 New Jersey teachers with at least five years K-12 experience in public schools. The treatment
of data included: (a) item analysis, (b) correltation and factor analysis, (c) multiple linear regression and (d)
analysis of variance. Examination of the responses to 21selected survey questions helped to identify the variables that influence teacher motivation and whether these variables differ in importance when examined by the main
effects of gender, general/special education, or elementary/secondary grade level assignment.
Findings of the study indicate that staff recognition is important to teachers’ overall satisfaction. Despite the persistance of several areas of frustration, teachers are able to maintain overall job satisfaction. With respect to
gender, the study indicated that females perceived principal communication and consistent enforcement of rules
more positively than their male counterparts. In contrast, males perceived student misbehavior as interfering with teaching more strongly than their female counterparts. Special education effects were limited with teachers
reporting consistent behavior enforcement more positively than their general education counterparts. Elementary
teachers reported significant differences in responses across the spectrum of many items as compared to their
secondary counterparts.
Introduction
“Two out of five of America‟s 4 million K-12 teachers appear disheartened and disappointed about their jobs”
(Yarrow, 2009, p.1). With growing teacher attrition rates that result in 21% of teachers with more than ten years experience leaving the profession, increased attention is being paid to the area of job satisfaction of veteran
teachers (Johnson, Berg, & Donaldson (2005). The importance of this emphasis is reflected by Williams (2003)
who wrote, “In a time of public disillusionment with education, and increasing demands on teachers, discourse among educators and policymakers about the emotional and spiritual needs of teachers is an urgent necessity (p.
74). The important relationship between job satisfaction and teacher retention is reflected in Shann (1998) who
stated, “Teacher job satisfaction has been shown to be a predictor of teacher retention, a determinant of teacher commitment and in turn a contributor of school effectiveness. Job satisfaction is important to teacher retention”
(p. 67).
Reviewing the issues related to this emerging problem raises myriad concerns over the policies and procedures associated with teacher employment and retention. Additionally, increased accountability for student
performance combined with a trend of decreased employment benefits has made it increasingly difficult to retain
quality tenured teachers. “The ability to create and maintain a quality teaching and learning environment is limited not by teacher supply, but by high turnover among teachers who are already there” (National Commission
on Teaching and America‟s Future, 2003).
The Special Issue on Humanities and Behavioral Science © Centre for Promoting Ideas, USA
12
There exists a growing desire not only to identify the reasons why teachers leave the classroom but also to
identify the reasons why successful tenure teachers choose to remain in the classroom. There is an increased need to better understand the job satisfaction and motivational factors affecting teachers‟ decisions to remain in the
profession. This understanding may provide important insights to policy makers involved in changing practices
concerning teacher employment developed by the federal and state governments at a time when educational issues
are prominent in the minds of the public.
Statement of the Problem and Conceptual Framework
Considerable research in the past years has focused on the reasons why teachers leave the profession (Ingersoll, 2007). However, it is equally important to understand the job satisfaction and motivational factors associated with
those teachers who have chosen to remain in their profession. Understanding these motivators will be important
for school leaders who need to gain additional insight into teacher job satisfaction into in order support policy development and practices that will help to retain experienced teachers.
Extrinsic factors such as salary, benefits, pension and summer vacations have long been recognized as benefits for
those teachers who remain in the profession. Due to increase demands for teacher accountability, a decline in the
benefit packages offered to teachers and the increasing percentage of teachers nearing retirement age, there is a need to examine these motivational factors that potentially influence veteran teachers‟ decisions to remain in the
profession. “There is considerable evidence that teachers are sustained and successful in their work and thus more
likely to remain in teaching, when their schools provide an array of support” (Johnson, 2006, p. 18).
This perspective is echoed by Curran & Goldrick (2002).
“As shortages of teachers – particularly in certain subjects and geographic regions – are becoming
increasingly problematic and the importance of quality teaching for student achievement is
increasingly demonstrated, schools cannot afford the continued loss of good teachers. In
addition, standards-based reforms and high-stake accountability systems at the federal and state levels demand that all schools and classrooms be staffed with a stable supply of highly qualified
teachers” (Curran & Goldrick, 2002, p. 2).
Identification of the factors contributing to overall teacher job satisfaction and the analysis of these factors
through the use of disaggregated groups can provide additional insight into the issue. For example, it is generally
understood that teacher retention rates in urban and socioeconomic disadvantaged areas is increasingly becoming problematic while the retention rates in affluent, suburban areas are considerably higher and much less
problematic. “The rate of attrition is roughly 50 percent higher in poor schools than in wealthier ones” (Alliance
for Education, 2005, p.2).
There are a number of issues that are receiving increased attention by educators throughout the country. These
factors include: (a) increased demands associated with the federal No Child Left Behind (NCLB) legislation, (b) a
reduction in local support for teachers‟ concerns, (c) unsatisfactory school academic achievement, (d) the growing tendency to reduce or eliminate local and state benefits packages due to economic budget constraints, (e) larger
class sizes, and (f) increased numbers of early retirements. These factors and others raise concern over the
extrinsic and intrinsic motivators associated with teachers‟ decisions to remain in the profession. School districts
that aren‟t accustomed to identifying and supporting the issues surrounding teacher job satisfaction of veteran teachers may need to examine their current practices. They may need to pay closer attention to the potential
impact on teachers‟ career decisions their policies and practices might have at all levels.
Although there is substantial research focused on the reasons why teachers leave the profession early in their careers, relatively little research has focused on the motivational factors of teachers who have remained in the
profession after their initial probationary years. Scherer (2003) wrote about a personal account of the decision to
leave the field of education. She stated “preparation, support, adequate teaching conditions and respect and the lack of these things is the reason good teachers leave the profession” ( p. 5). If the research focused only on the
personal accounts such as this, it could be assumed that the work environment rather than the actual teaching is an
important factor in teachers leaving the profession. Some researchers have studied the attrition and retention rates
of general and special education teachers and revealed interesting results. White (1999) found that attrition among special education teachers is considered to be one of the most pressing issues in the field, with some districts
reporting annual attrition rates as high as 50 percent.
International Journal of Humanities and Social Science Vol. 1 No. 17 [Special Issue – November 2011]
13
There appears to be several factors that may have contributed to the high level of attrition in the area of special
education teachers. Some of these factors were summarized by Kozleski, Mainzer & Deshler (2000) when they wrote:
“Special educators identify their burgeoning caseloads (the number of students for which a
special educator is responsible) as a critical concern. Demands for communication with
caregivers, collaboration with general educators, adaptations for accessing curriculum, and preparations for high-stakes tests all have increased” (p. 3).
The role of a classroom teacher has become increasingly stressful. As a result, many teachers, general and special
education have cited the lack of support, preparation and the working environment as reasons for leaving the field.
Reflected in the research of Johnson, Berg and Donaldson (2005), Huberman‟s research (1993) suggests that there is “a „danger zone‟ from seven to fifteen years of experience in which teachers are most likely to consider leaving
the profession (p. 140). Respondents cited fatigue, routine, frustration and nervous tensions as the motives to
leave in 43% of the cases (p. 145). As noted earlier, Johnson, Berg and Donaldson (2005) reported that
approximately 21 percent of teachers with ten or more years experience leave the profession. If this number is going to be reduced, it becomes critically important to focus on the remaining 79 percent of the population who
choose to remain.
Teacher Motivation
Much of the research that focuses on teacher retention due to extrinsic motivators is based on Maslow‟s Hierarchy
of Needs Theory for job related satisfaction as the basis for measuring the qualitative and quantitative body of knowledge. Maslow groups the basic human requirements into five categories; (a) physiological, (b) safety, (c)
sense of belonging, (d) self esteem, and (e) self-actualization. The theory operates on the premise of moving from
one stage of development to the next by satisfying the basic human needs of extrinsic desires such as food and
shelter before one is able to reach intrinsic stages of self-actualization. “The common feature of the needs for self-actualization is that their emergence usually rests upon some prior satisfaction of the psychological, safety,
love and esteem needs (Maslow, 1970, p. 22).
If there is a good fit i.e. congruence of the needs satisfied for both individuals and organization, then individuals
find meaningful and satisfying work and organizations get the talent and energy they need to succeed (Bolman &
Deal, 2003, p. 117).
In order for people to feel satisfied with the work itself, there is a need for both personal and institutional needs to be met. “New teachers, however naïve and idealistic, often know before they enter the profession that the salaries
are paltry, the class sizes large, and the supplies scant. What they don‟t know is how little support there is from
parents, school administration and colleagues once the door is closed and the textbooks are open” (Graziano, 2005, p. 41).
Other extrinsic influences are part of the motivation of many teachers to remain long term in the classroom.
Some cite compensation – pay, benefits and pension – being important reasons to continue the teaching career path until retirement. Bobek (2002) suggested that a well-articulated promotion ladder using pay, position and
level of responsibility denoting progress through various stages of their career would give teachers a broader and
more visible range of opportunities that may aid retention.
Personal finances impact a teacher‟s decision to remain in the classroom. Many teachers augment their salaries by working a second job outside of the classroom. As the cost of living rises and financial burdens expand, some
teachers feel they cannot afford to remain in the teaching profession. Denney (2007) found through interview
research that although teachers may feel that teaching is a good profession for them, they financially cannot afford to remain in the classroom for 20 or more years (p. 2).
Other related monetary incentives have been long-standing extrinsic factors in a teacher‟s decision to remain in
the profession. Concerns such as medical benefits and pensions continue to impact and influence career decisions
in education. Luekens et al. (2004) suggest that early retirement incentives may a play role in this large-scale departure from the profession. Other motivational theories center more on the concept of the intrinsic rewards of
career decisions. Many teachers choose their profession because they want to experience the feeling of personal
satisfaction associated with influencing student growth and development. Berg et al. (2005) addressed this issue:
The Special Issue on Humanities and Behavioral Science © Centre for Promoting Ideas, USA
14
Teachers in our sample listed many reasons for taking on their roles, ranging from a search for
more training or the desire to teach or coach adults, to the need for greater pay or job flexibility. Notably, however, each participant spoke of the desire to make a difference in education through
their work in the role. This desire superseded all other goals in importance” (p. 11).
Many teachers are interested in a career in education because they want to make a difference in the lives of children. This is echoed by Johnson, Berg and Donaldson (2005) when they wrote, “…considerable evidence
exists that teachers are largely drawn to teaching by the intrinsic or psychic rewards they hope to attain.” ( p. 46).
Much of the research on job satisfaction reflects a belief that “job enrichment is central to motivation but
distinguished it from adding more dull tasks to a tedious job. Enrichment meant giving workers more freedom
and authority, more feedback, and greater challenges” (Bolman & Deal, 2003, p.148). On occasion, as teachers
move through their careers, changes and external forces might affect the purist goal of being a teacher i.e., making a difference in a child‟s life. But there are several influences that may continue to support the intrinsic desire to
remain in the teaching profession. For instance, teachers who develop resiliency may have a better chance of
keeping in touch with their altruistic motives and perhaps remain in the profession. “To become resilient, individuals must learn to adjust to negative conditions with the aid of their resources, which can inform their
perspectives and decision-making. Learning from past experiences increases available resources and thus
improves one‟s resilience for dealing with future circumstances” (Bobek, 2002).
Herzberg‟s (1966) Hygiene Theory is based on the belief that a worker‟s extrinsic needs only allow the individual
to be satisfied to a point during one‟s career. His research suggested that a worker is ultimately satisfied by
responding positively to the work itself and by being intrinsically rewarded by a job well done.
Employees who wish to make themselves look good are much more prone to say that they are unhappy because they do not have responsibility, are not getting ahead, have uninteresting work,
see no possibility for growth and do not receive recognition than to say that their supervisor is
unfriendly, the administration is poor, the working conditions are bad, their fellow workers are unsociable, etc.” (Herzberg, 1966, p. 130-31).
Bobek (2002) argued that teacher satisfaction is contingent on levels of autonomy, perceived and recognized
accomplishments and successful collegial relationships (2002). Relationships with students and colleagues are social needs that many teachers experience. When fostered over time, these relationships may lead to greater self-
efficacy in the teacher.
Another theorist, McGregor, researched and developed Theory X and Theory Y on employee motivation based on his observations during the 1950s-60s in the American workplace. According to McGregor, the two theories
operate from opposite points of view. Theory X is based on employee behavior controlled and directed by
management. Theory Y is founded on Maslow‟s Hierarchy of Needs and suggests that self-directed employee
behavior is the prescription to self fulfillment (Bolman and Deal, 2003, pp.118-119). “McGregor‟s key point was if you treat people as if they‟re lazy and need to be directed, they conform to your expectations” (Bolman and
Deal, 2003, p.118). However, Theory Y supports the concept that employees are able to self direct. “The more
managers align organizational requirements with employee self interest, the more they can rely on Theory Y‟s principle of self direction,” (Bolman and Deal, 2003, 119). Therefore, if Theory Y is the managerial framework
in the workplace, then the worker should work toward self actualization thus a potential for greater job
satisfaction.
Social needs of the worker seem to be a common element in all three motivational theories - thus supporting the
need for leaders to encourage management practices that sustain and support these needs.
Analysis of Current Knowledge and Theory Relative to Teacher Retention
Research suggests that there are several factors influencing teacher retention. A recent study by Johnson, Berg
and Donaldson (2005) cited several reasons for retention of veteran teachers. The study outlined specific working conditions associated with teacher job satisfaction. For instance, facilities, equipment and supplies were found to
be factors associated with teacher retention. Also, teaching assignment was identified as a factor influencing
retention as well as curriculum, standards and accountability. The study revealed that roughly 21 percent of teachers age 30 or over left the profession for a variety of reasons including those teachers choosing to retire.
International Journal of Humanities and Social Science Vol. 1 No. 17 [Special Issue – November 2011]
15
Among the reasons teachers noted for leaving were working conditions, physical conditions and different career
challenges. Additionally, the school community was a factor influencing teachers‟ career decisions. Relationships with other teachers, administrators, students and parents were associated with the desire to stay or
leave the field of education.
Given this array of factors, school officials and policymakers cannot choose what they believe to
be an essential lever – for example increasing salaries or repairing a facility – and expect to substantially influence teachers‟ career decisions. From the perspective of the teacher, these
factors are all important.” (Johnson, Berg, & Donaldson, 2005, p. 2)
In fact, Johnson, Berg and Donaldson (2005) consistently repeated throughout the study that there is a need for further research on the topic of reasons influencing teachers to stay in the classroom. They stated, “Our goal here
is not to claim that we have all the answers or even all the questions, but to encourage further study and analysis
that will ultimately lead to a deeper understanding and better policy and practice in support of student learning” (p. 3). “She has been teaching for three years. Her students really like her. She‟s dedicated. She‟s energetic.
She‟s creative….She‟s quitting” (Michigan Education Association, 2000).
As teachers exit education, so does the wealth of experience and reflection. The curriculum that was developed by the veteran teacher now becomes new for the next educator. If that cycle remains in place from year to year,
the establishment of modifying and revising the curriculum is no longer a possibility. Teachers learn from one
another. As new teachers learn the business of instruction from senior members, the continuity of education is
also achieved. “Similarly, human beings thrive best when we grow in the presence of those that have gone before” (Zachary, 2000, p. xiii). If teachers do not have the time to learn and pass on knowledge from senior staff
members, some of the educational culture is lost. In a time when teachers are encouraged to become leaders in
the classroom and make decisions in the area of curriculum, continuity of personnel is a key factor to successful curriculum implementation and thus the education of children.
Teacher Retention: Teacher Assignment, Gender and School Level
Identification of the factors contributing to overall teacher job satisfaction and the analysis of these factors
through the use of disaggregated groups can provide additional insight into the issue. When it comes to
veteran teacher job satisfaction and retention, there is limited research focused on the issue of whether teaching assignment plays a role in teachers remaining in the classroom. The work of Billingsley (2004) reported that
“recent evidence suggests that special education, math and science are the fields with the highest turnover” (p.
39). Special education assignments could be at any grade level, elementary, middle and high school. Science and
math content teachers are most likely going to be found in the middle and high schools. That might suggest that there are some differences why teachers remain in the classroom when it comes to teaching assignment by
elementary school, middle school and high school.
With respect to gender influences and veteran teacher job satisfaction and retention, the research is limited and findings are mixed. Johnson et al. (2005) in the Project Next Generation of Teachers noted that 92.6 percent of
both the male and female population in the sample chose to remain in the profession. Billingsley (2004) “did not
find a relationship between gender and attrition for a national sample of general and special education teachers. Moreover, no relationship between gender and turnover was found in states‟ studies of attrition” (p. 43).
Researchers Gritz & Theobald suggest that “In general, personal characteristics influence the retention behavior
of female teachers more than they do male teachers” (1995, p. 494). “Male teachers remain in their initial
teaching positions longer when teaching salaries increase relative to potential earnings outside the public school system.” (Gritz & Theobald, 1995, p. 498).
Why New Jersey?
New Jersey, although small in land area is still the most densely populated state according to the New Jersey State
Department‟s website (NJDOE). It is also a diverse state with urban, suburban and rural areas. According to
recent census data there are 130 different languages spoken in the state. Unlike other states which organize their schools by county or large independent school districts, New Jersey is still locally controlled by town
municipalities which total over 600 distinct districts. According to the 2007 National Assessment of Educational
Progress (NAEP) exam results, New Jersey ranked #1 in the nation on the eighth grade writing section of the exam even with the English writing portion being given to students in homes with many diverse cultures and
languages.
The Special Issue on Humanities and Behavioral Science © Centre for Promoting Ideas, USA
16
In fact, the New Jersey students performed the highest average writing score of 175 for public school students out
of the 45 states represented in the exam (Salahu, D., Persky, H., & J. Miller, 2008). For as tightly packed and diverse it is, New Jersey educators deliver an exceptional product with a first place ranking on this high stakes
test. Even with all the NCLB standards and high stakes tests, government officials at the state and federal level
continue to tighten the budget to squeeze more and more out of the educators.
Ironically, however, as the NAEP results were published in spring 2008, New Jersey passed legislation which
made it illegal to use taxpayer money for many things which were previously viewed as teacher incentives.
Motivating strategies such as providing water and pretzels at faculty meetings are no longer allowable. Motivational strategies such as “teacher of the month” certificates are no longer allowed to be purchased
according to the new public legislation.
In the book entitled, If You Don’t Feed the Teachers, They Will Eat the Students, Connors (2000) outlines various ways to help motivate and sustain teachers as they work to strengthen the human potential in their students. Why
New Jersey? Because it is the state that has teachers producing excellent quality work from their students and it is
the state whose legislative body told the teachers we will not “feed” you using tax payer money. It appears to be a
very negative reward for an exceptional job completed. In light of the legislation, it is necessary for educational leaders to analyze the extrinsic and intrinsic needs of job satisfaction of teachers in order to sustain and continue
to motivate them past the novice and into the veteran stages of their careers.
Purpose of the Study
Given the complexity and inter relatedness of the possible motivational factors affecting teacher retention
decisions, school officials and policy makers are faced with confusing and complicated judgments about what they believe to be the important issues. This research project sought to identify the intrinsic and extrinsic
motivational factors associated with teacher job satisfaction. With the current changes associated with the
teaching career, identifying factors that motivate teachers to remain in the profession is important to educational leaders. As practices and policies change at the local, state and federal levels, the ever-expanding body of
research should influence the decisions made by educational leaders to further encourage teacher retention.
The following research questions were used to guide the study and investigation of the factors associated with
veteran teachers‟ job satisfaction.
1. What are the extrinsic and intrinsic factors that influence veteran teacher job satisfaction?
2. How do the extrinsic and intrinsic factors associated with veteran teacher job satisfaction differ between
male and female teachers?
3. How do the extrinsic and intrinsic factors associated with veteran teacher job satisfaction differ for
teachers who work as special education versus general education teachers?
4. How do the extrinsic and intrinsic factors associated with veteran teacher job satisfaction differ for
teachers based on school level assignment i.e. elementary and secondary?
Methodology
The purpose of this study was to analyze teacher job satisfaction patterns of New Jersey veteran public school
teachers with five years or more experience. The study utilized data obtained from the National Center of Educational Statistics School and Staffing Survey (NCES, 2003). The Schools and Staffing Survey (SASS) is the
nation‟s most extensive survey of elementary and secondary schools and the teachers and administrators who staff
them. The SASS was conducted by the United States Census Bureau to collect data on American public and
private elementary and secondary schools (Strizek, Pittsonberger, Riordan, Lyter & Orlofsky, 2006).
In order to examine the teacher job satisfaction levels of public school teachers, a survey was developed by the National Center of Educational Statistics (NCES) and administered to a national population of 62,000 teachers in
2003-2004. Twenty-one items were selected from the total survey for inclusion in this study because of their
apparent relation to factors identified through a review of the literature as related to teacher job satisfaction. Specifically, the responses to question #63 items A through U were selected from Section IX Teacher Attitudes
and School Climate. In addition, responses to several demographic questions including gender, school level and
teaching assignment were included.
International Journal of Humanities and Social Science Vol. 1 No. 17 [Special Issue – November 2011]
17
The 21 items contained statements to which teachers responded using a four point Likert-type response scale of:
1-strongly agree; 2–somewhat agree, 3–somewhat disagree, and 4–strongly disagree.
Sampling and Data Collection
For this research, all weighted sample sizes have been rounded to the nearest 10 and all percentages were rounded
to the nearest whole number as required by the NCES data licensure agreement. As a consequence column and row totals may not appear to add accurately. Additionally, although it is generally not acceptable to consider data
associated with Likert type responses as continuous data, for purposes of this data analysis, statistical techniques
were used based on the assumption of data continuity. It may be advisable to analyze the data with an assumption
of it being discrete for additional and more accurate conclusions.
This study was conducted of a subset of a national data collected by The National Center of Education Statistics.
The Schools and Staffing Survey (SASS) was administered during the 2003-04 school year to school employees throughout the United States. A subset of the data was delimited from the national dataset and included only New
Jersey teachers with at least five years experience in K- 12 public school settings. The resulting subset included
approximately 500 respondents. Twenty-one items (#63 A-U) were selected from the dataset were part of the
section of the survey entitled, “Teacher Attitudes and School Climate.” The overall New Jersey teacher response rate was 67%. The three independent variables included in the analysis of disaggregated data included: gender,
special/general education teaching assignment, and school/grade level assignment.
Statistical Analysis
The data consisted responses to the 21 teachers‟ attitudes and school climate statements. Statistical analysis was completed on the data set using five statistical tools. These included:
Statistical Tool Dependent Variable(s) Independent Variable(s)
Item Response Frequency Distribution
Responses to 21 statements
Correlation Analysis
Responses to 21 statements
Multiple Regression Analysis Response to question #351: overall satisfaction
Responses to 21 statements
Factor Analysis
Responses to 21 statements
Analysis of Variance Responses to 21 statements Gender, special/general education, school/grade level
Frequency distributions were completed for each of the item from #63 A-U. The purpose of the frequency distribution analysis was to identify items which reflected a skewed response rather than a more evenly dispersed
distribution.
Research Question #1: What are the extrinsic and intrinsic factors that influence veteran teacher job
satisfaction?
As indicated in Table 1, the strongest response to any of the 21 statements was 73% of teachers who responded “strongly disagree” to Item T, “I sometimes feel it is a waste of time to try to do my best as a teacher. “ In fact,
only 2% responded that they strongly agreed with that statement.
Item U had the second highest percentage response with 63% of teachers strongly agreeing to the question, “I am generally satisfied with being a teacher at this school.” In addition, another 30% responded that they agreed with
the statement. Therefore, approximately 93% of the teachers responded in a positive manner to the statement
indicating overall satisfaction with their teaching job. Overall this item had the largest number of positive responses to any statement when combining agree and strongly agree categories.
When the items are clustered by combining the “strongly agree” and “somewhat agree” as well as “strongly
disagree” and “somewhat disagree” a very interesting pattern emerges. The following represents the frequency summary clustered by “agreement” and “disagreement.”

The Special Issue on Humanities and Behavioral Science © Centre for Promoting Ideas, USA
18
Table 1 : Item Response Relative Frequency Table for Question #63 A-U
Question 63 To what extent do you agree or disagree with each of
the following statements?
Strongly
Agree
Somewhat
Agree
Somewhat
Disagree
Strongly
Disagree
Item A: The principal lets staff members know what is expected of
them.
60% 31% 5% 3%
Item B: The school administration’s behavior toward the staff is
supportive and encouraging.
44% 40% 11% 5%
Item C: I am satisfied with my teaching salary. 19% 39% 23% 20%
Item D: The level of student misbehavior is this school interferes
with my teaching.
10% 28% 27% 36%
Item E: I receive a great deal of support from parents for the work
I do.
14% 46% 27% 14%
Item F: Necessary materials such as textbooks, supplies, and copy
machines are available as needed by the staff.
38% 36% 19% 7%
Item G: Routine duties and paperwork interfere with my job of
teaching.
23% 44% 22% 12%
Item H: My principal enforces school rules for student conduct and
backs me up when I need it.
50% 37% 10% 4%
Item I: Rules for student behavior are consistently enforced by
teachers in this school, even for student who are not in their classes
20% 39% 29% 11%
Item J: Most of my colleagues share my beliefs and values about
what the central mission of the school should be.
31% 52% 15% 2%
Item K: The principal knows what kind of school he/she wants and
has communicated it to the staff.
51% 36% 8% 4%
Item L: There is a great deal of cooperative effort among the staff
members.
37% 49% 11% 3%
Item M: In this school, staff members are recognized for a job well
done.
24% 47% 20% 9%
Item N: I worry about the security of my job because of the
performance of my students on state and /or local tests.
5% 13% 27% 56%
Item O: State or district content standards have had a positive
influence on my satisfaction with teaching.
6% 35% 36% 23%
Item P: I am satisfied with my class size. 30% 38% 19% 13%
Item Q: I am given the support I need to teach students with
special needs.
24% 38% 22% 16%
Item R: I make a conscious effort to coordinate the content of my
courses with that of other teachers.
35% 51% 10% 4%
Item S: The amount of student tardiness and class cutting in this
school interferes with my teaching.
8% 19% 24% 49%
Item T: I sometimes feel it is a waste of time to try to do my best as
a teacher.
2% 13% 12% 73%
Item U: I am generally satisfied with being a teacher at this school. 63% 30% 5% 3%
The following statements are derived from this analysis and reflect the percentage of respondents.
Item C - 43% are not satisfied with their teaching salaries
Item D - 38% feel that student misbehavior interferes with their teaching
Item E - 41% feel they do not receive a great deal of parental support
Item F - 26% report that teaching materials are not supplied as necessary
Item G - 67% indicate that duties and paperwork interfere with teaching
Item I - 40% reported student behavior not consistently enforced by other teachers
Item M - 29% indicate that they are not recognized for a job well done
Item O - 59% indicate disagreement that standards influence job satisfaction
Item P - 32% report dissatisfaction with class size
Item Q - 38% indicate inadequate support for teaching children with special needs
Item S - 27% report that tardiness and class cutting interfere with teaching
International Journal of Humanities and Social Science Vol. 1 No. 17 [Special Issue – November 2011]
19
Table 2: Frequency Distribution Table Statements #63 A-U
Question 63 To what extent do you agree or disagree with each of the following
statements?
Agreement Disagreement
Item A: The principal lets staff members know what is expected of them. 91% 8%
Item B: The school administration’s behavior toward the staff is supportive and
encouraging.
84% 16%
Item C: I am satisfied with my teaching salary. 58% 43%
Item D: The level of student misbehavior is this school interferes with my teaching. 38% 63%
Item E: I receive a great deal of support from parents for the work I do. 60% 41%
Item F: Necessary materials such as textbooks, supplies, and copy machines are
available as needed by the staff.
74% 26%
Item G: Routine duties and paperwork interfere with my job of teaching. 67% 34%
Item H: My principal enforces school rules for student conduct and backs me up
when I need it.
87% 14%
Item I: Rules for student behavior are consistently enforced by teachers in this
school, even for student who are not in their classes
59% 40%
Item J: Most of my colleagues share my beliefs and values about what the central
mission of the school should be.
83% 17%
Item K: The principal knows what kind of school he/she wants and has
communicated it to the staff.
87% 12%
Item L: There is a great deal of cooperative effort among the staff members. 86% 14%
Item M: In this school, staff members are recognized for a job well done. 71% 29%
Item N: I worry about the security of my job because of the performance of my
students on state and /or local tests.
18% 83%
Item O: State or district content standards have had a positive influence on my
satisfaction with teaching.
41% 59%
Item P: I am satisfied with my class size. 68% 32%
Item Q: I am given the support I need to teach students with special needs. 62% 38%
Item R: I make a conscious effort to coordinate the content of my courses with that
of other teachers.
86% 14%
Item S: The amount of student tardiness and class cutting in this school interferes
with my teaching.
27% 73%
Item T: I sometimes feel it is a waste of time to try to do my best as a teacher. 15% 85%
Item U: I am generally satisfied with being a teacher at this school. 93% 8%
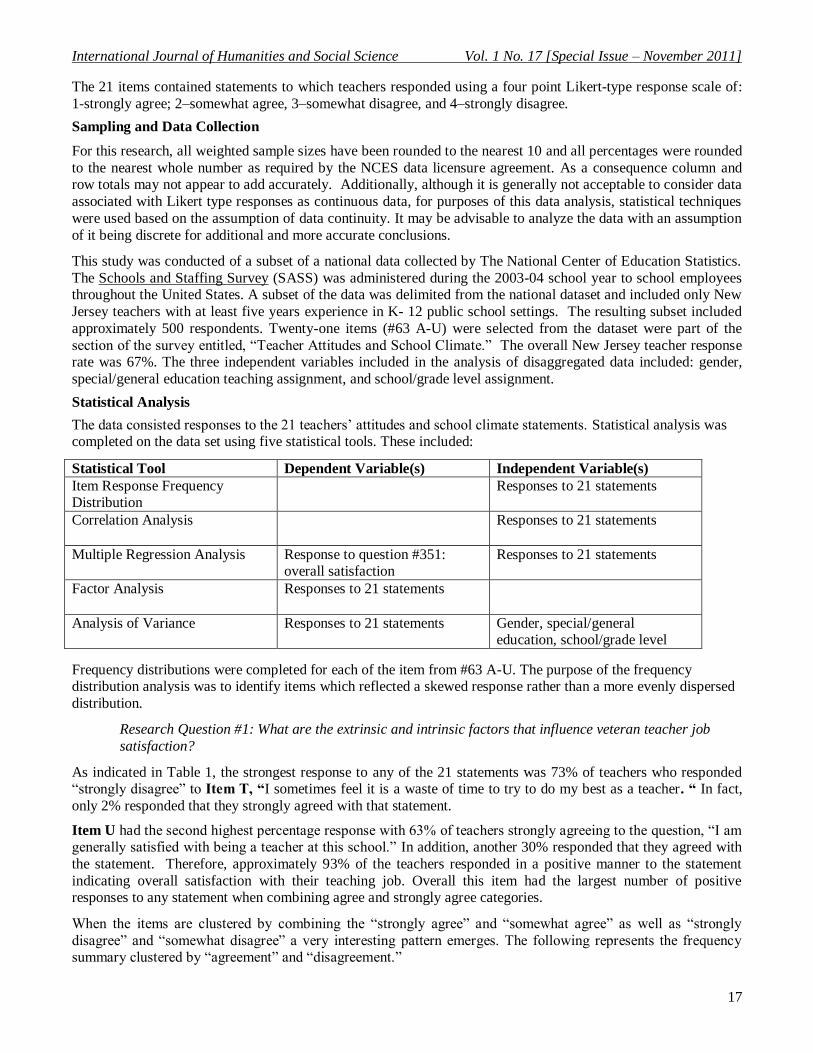
When this data is reviewed from the perspective of extrinsic and intrinsic needs, it‟s clear that a substantial percentage of teachers do not have their needs satisfied. Despite this frustration, the overwhelming percentage of
teachers (93%) reported overall satisfaction with being teachers at their schools. Pearson product moment
correlations were computed to convey a sense of the amount of variability in one independent variable which can be explained by the knowledge of the variability of the other independent variable. The range of values for r is + 1
with an r value closer to either extreme indicating the more precisely predictable one variable is from the other
variable (George & Mallory, 2001).
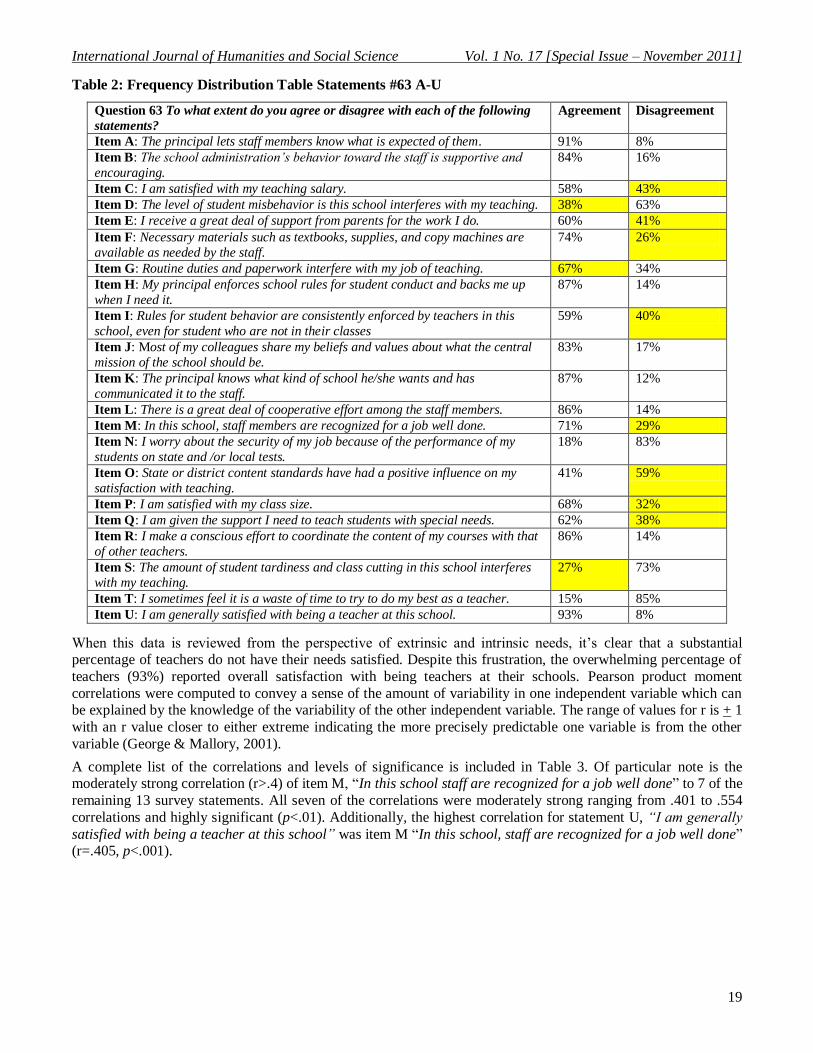
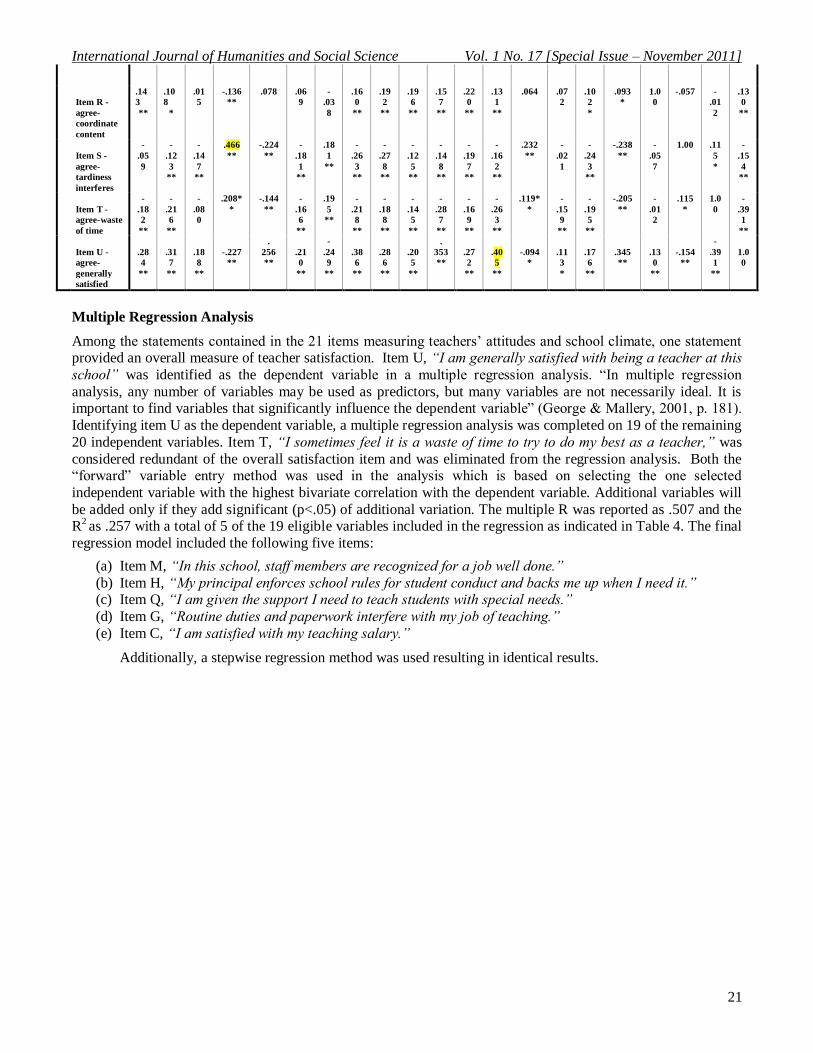
A complete list of the correlations and levels of significance is included in Table 3. Of particular note is the moderately strong correlation (r>.4) of item M, “In this school staff are recognized for a job well done” to 7 of the
remaining 13 survey statements. All seven of the correlations were moderately strong ranging from .401 to .554
correlations and highly significant (p<.01). Additionally, the highest correlation for statement U, “I am generally
satisfied with being a teacher at this school” was item M “In this school, staff are recognized for a job well done” (r=.405, p<.001).
The Special Issue on Humanities and Behavioral Science © Centre for Promoting Ideas, USA
20
Table 3: Correlation Matrix
Item
A
Item
B
Item
C
Item
D
D
Item
E
Item
F
Item
G
Item
H
Item
I
Item
J
Item
K
Item
L
Item
M
Item
N
Item
O
Item
P
Item
Q
Item
R
Item
S
Item
T
Item
U
Item A -
agree-princ
com expec
1.0
0
.53
4 **
.07
0
-.131
**
.134
**
.25
5
**
-
.17
6
**
.58
6
**
.30
7
**
.25
3
**
.67
7
**
.35
5
**
.44
6
**
-.021
.04
3
.10
9
*
.239
**
.14
3
**
-.059
-
.18
2
**
.28
4
**
Item B -
agree-
admin
supportive
.53
4
**
1.0
0
.10
6
*
-.143
**
.196
**
.26
7
**
-
.17
6
**
.56
7
**
.30
3
**
.28
2
**
.58
0
**
.36
5
**
.55
4
**
-.120
**
.08
0
.05
9
.277
**
.10
8
*
-.123
**
-
.21
6
**
.31
7
**
Item C -
agree-
satisfied
w/salary
.07
0
.10
6
*
1.0
0
-.127
**
.274
**
.17
0
**
-
.11
1
*
.08
9
*
.10
1
*
.03
6
.08
0
.10
0
*
.13
9
**
-.054
.05
9
.14
4
**
.189
**
.01
5
-.147
**
-
.08
0
.18
8
**
Item D -
agree-
misbehavio
r interferes
-
.13
1
**
-
.14
3
**
-
.12
7
**
1.00 -.250
**
-
.22
7
**
.18
4
**
-
.30
6
**
-
.31
8
**
-
.21
1
**
-
.20
4
**
-
.17
8
**
-
.22
0
**
.244
**
.02
6
-
.24
4
**
-.250
**
-
.13
6
**
.466
**
.20
8
**
-
.22
7
**
Item E -
agree-
parent
support
.13
4
**
.19
6
**
.27
4
**
-.250
**
1.00 .26
3
**
-
.17
7
**
.24
7
**
.28
8
**
.17
9
**
.19
2
**
.23
1
**
.30
2
**
-.111
*
.13
9
**
.17
3
**
.274
**
.07
8
-.224
**
-
.14
4
**
.25
6
**
Item F -
agree-
adequate
materials
.25
5
**
.26
7
**
.17
0
**
-.227
**
.263
**
1.0
0
-
.21
7
**
.30
0
**
.25
5
**
.09
6
*
.27
2
**
.21
8
**
.30
1
**
-.178
**
.05
7
.19
5
**
.319
**
.06
9
-.181
**
-
.16
6
**
.21
0
**
Item G -
agree-other
duties
interfere
-
.17
6
**
-
.17
6
**
-
.11
1
*
.184
**
-.177
**
-
.21
7
**
1.0
0
-
.16
7
**
-
.18
7
**
-
.08
2
-
.25
4
**
-
.18
3
**
-
.24
8
**
.191
**
-
.18
3
**
-
.24
0
**
-.297
**
-
.03
8
.181
**
.19
5
**
-
.24
9
**
Item H -
agree-princ
enforces
discipline
.58
6
**
.56
7
**
.08
9
*
-.306
**
.247
**
.30
0
**
-
.16
7
**
1.0
0
.46
2
**
.32
5
**
.62
5
**
.33
3
**
.52
6
**
-.021 .04
6
.16
4
**
.316
**
.16
0
**
-.263
**
-
.21
8
**
.38
6
**
Item I -
agree-tchrs
enf rules
.30
7
**
.30
3
**
.10
1
*
-.318
**
.288
**
.25
5
**
-
.18
7
**
.46
2
**
1.0
0
.54
6
**
.36
0
**
.44
9
**
.41
1
**
-.043 .11
0
*
.26
6
**
.307
**
.19
2
**
-.278
**
-
.18
8
**
.28
6
**
Item J -
agree-coll
share
values
.25
3
**
.28
2
**
.03
6
-.211
**
.179
**
.09
6
*
-
.08
2
*
.32
5
**
.54
6
**
1.0
0
.38
2
**
.47
9
**
.31
0
**
.021 .13
7
**
.08
6
.102
*
.19
6
**
-.125
**
-
.14
5
**
.20
5
**
Item K -
agree-
princ-sch
kind
.67
7
**
.58
0
**
.08
0
-.204
**
.192
**
.27
2
**
-
.25
4
**
.62
5
**
.36
0
**
.38
2
**
1.0
0
.38
6
**
.51
5
**
-.046 .12
1
**
.14
9
**
.289
**
.15
7
**
-.148
**
-
.28
7
**
.35
3
**
Item L -
agree-staff
cooperation
.35
5
**
.36
5
**
.10
0
*
-.178
**
.231
**
.21
8
***
-
.18
3
**
.33
3
**
.44
9
**
.47
9
**
.38
6
**
1.0
0
.43
3
**
-.132
**
.07
7
.16
4
**
.293
**
.22
0
**
-.197
**
-
.16
9
**
.27
2
**
Item M -
agree-staff
recognized
.44
6
**
.55
4
**
.13
9
**
-.220
**
.302
**
.30
1
**
-
.24
8
**
.52
6
**
.41
1
**
.31
0
**
.51
5
**
.43
3
**
1.0
0
-.071 .16
8
**
.15
2
**
.401
**
.13
1
**
-.162
**
-
.26
3
**
.40
5
**
Item N -
agree-job
security
-
.02
1
-
.12
0
**
-
.05
4
.244
**
-.111
*
-
.17
8
**
.19
1
**
-
.02
1
-
.04
3
-
.02
1
-
.04
6
-
.13
2
**
-
.07
1
1.00 .02
4
-
.07
7
-.143
**
.06
4
.232
**
.11
9
**
-
.09
4
*
Item O -
agree-
stndrds
positive
.04
3
.08
0
.05
9
.026 .139
**
.05
7
-
.18
3
**
.04
6
.11
0
*
.13
7
**
.12
1
**
.07
7
.16
8
**
.024 1.0
0
.03
2
.200
**
.07
2
-.021 -
.15
9
**
.11
3
*
Item P -
agree-
satisfied
class sz
.10
9
*
.05
9
.14
4
**
-.244
**
.173*
*
.19
5
**
-
.24
0
**
.16
4
**
.26
6
**
.08
6
.14
9
**
.16
4
**
.15
2
**
-.077 .03
2
1.0
0
.359*
*
.10
2
*
-.243
**
-
.19
5
**
.17
6
**
Item Q -
agree-spec
needs stu
.23
9
**
.27
7
**
.18
9
**
-.250
**
.274
**
.31
9
**
-
.29
7
**
.31
6
**
.30
7
**
.10
2
*
.28
9
**
.29
3
**
.40
1
**
-.143
**
.20
0
**
.35
9
**
1.00 .09
3
*
-.238
**
-
.20
5
**
.34
5
**
International Journal of Humanities and Social Science Vol. 1 No. 17 [Special Issue – November 2011]
21
Item R -
agree-
coordinate
content
.14
3
**
.10
8
*
.01
5
-.136
**
.078 .06
9
-
.03
8
.16
0
**
.19
2
**
.19
6
**
.15
7
**
.22
0
**
.13
1
**
.064 .07
2
.10
2
*
.093
*
1.0
0
-.057 -
.01
2
.13
0
**
Item S -
agree-
tardiness
interferes
-
.05
9
-
.12
3
**
-
.14
7
**
.466
**
-.224
**
-
.18
1
**
.18
1
**
-
.26
3
**
-
.27
8
**
-
.12
5
**
-
.14
8
**
-
.19
7
**
-
.16
2
**
.232
**
-
.02
1
-
.24
3
**
-.238
**
-
.05
7
1.00 .11
5
*
-
.15
4
**
Item T -
agree-waste
of time
-
.18
2
**
-
.21
6
**
-
.08
0
.208*
*
-.144
**
-
.16
6
**
.19
5
**
-
.21
8
**
-
.18
8
**
-
.14
5
**
-
.28
7
**
-
.16
9
**
-
.26
3
**
.119*
*
-
.15
9
**
-
.19
5
**
-.205
**
-
.01
2
.115
*
1.0
0
-
.39
1
**
Item U -
agree-
generally
satisfied
.28
4
**
.31
7
**
.18
8
**
-.227
**
.
256
**
.21
0
**
-
.24
9
**
.38
6
**
.28
6
**
.20
5
**
.
353
**
.27
2
**
.40
5
**
-.094
*
.11
3
*
.17
6
**
.345
**
.13
0
**
-.154
**
-
.39
1
**
1.0
0
Multiple Regression Analysis
Among the statements contained in the 21 items measuring teachers‟ attitudes and school climate, one statement provided an overall measure of teacher satisfaction. Item U, “I am generally satisfied with being a teacher at this
school” was identified as the dependent variable in a multiple regression analysis. “In multiple regression
analysis, any number of variables may be used as predictors, but many variables are not necessarily ideal. It is important to find variables that significantly influence the dependent variable” (George & Mallery, 2001, p. 181).
Identifying item U as the dependent variable, a multiple regression analysis was completed on 19 of the remaining
20 independent variables. Item T, “I sometimes feel it is a waste of time to try to do my best as a teacher,” was
considered redundant of the overall satisfaction item and was eliminated from the regression analysis. Both the “forward” variable entry method was used in the analysis which is based on selecting the one selected
independent variable with the highest bivariate correlation with the dependent variable. Additional variables will
be added only if they add significant (p<.05) of additional variation. The multiple R was reported as .507 and the R
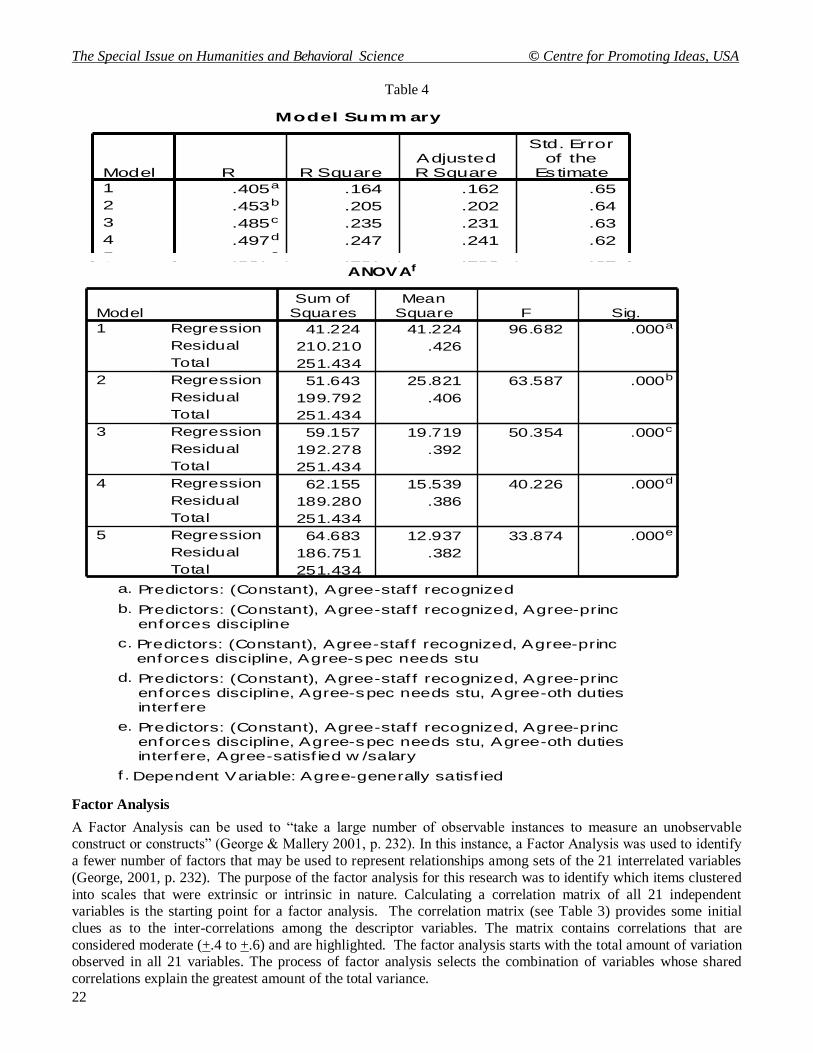
2 as .257 with a total of 5 of the 19 eligible variables included in the regression as indicated in Table 4. The final
regression model included the following five items:
(a) Item M, “In this school, staff members are recognized for a job well done.”
(b) Item H, “My principal enforces school rules for student conduct and backs me up when I need it.” (c) Item Q, “I am given the support I need to teach students with special needs.”
(d) Item G, “Routine duties and paperwork interfere with my job of teaching.”
(e) Item C, “I am satisfied with my teaching salary.”
Additionally, a stepwise regression method was used resulting in identical results.
The Special Issue on Humanities and Behavioral Science © Centre for Promoting Ideas, USA
22
Table 4
Factor Analysis
A Factor Analysis can be used to “take a large number of observable instances to measure an unobservable construct or constructs” (George & Mallery 2001, p. 232). In this instance, a Factor Analysis was used to identify
a fewer number of factors that may be used to represent relationships among sets of the 21 interrelated variables
(George, 2001, p. 232). The purpose of the factor analysis for this research was to identify which items clustered
into scales that were extrinsic or intrinsic in nature. Calculating a correlation matrix of all 21 independent variables is the starting point for a factor analysis. The correlation matrix (see Table 3) provides some initial
clues as to the inter-correlations among the descriptor variables. The matrix contains correlations that are
considered moderate (+.4 to +.6) and are highlighted. The factor analysis starts with the total amount of variation observed in all 21 variables. The process of factor analysis selects the combination of variables whose shared
correlations explain the greatest amount of the total variance.
Model Summ ary
.405a .164 .162 .65
.453b .205 .202 .64
.485c .235 .231 .63
.497d .247 .241 .62
.507e .257 .250 .62
Model
1
2
3
4
5
R R SquareAdjustedR Square
Std. Errorof the
Estimate
Predictors: (Constant), Agree-staf f recognizeda.
Predictors: (Constant), Agree-staf f recognized,Agree-princ enforces disc ipline
b.
Predictors: (Constant), Agree-staf f recognized,Agree-princ enforces disc ipline, Agree-spec needs s tu
c.
Predictors: (Constant), Agree-staf f recognized,Agree-princ enforces disc ipline, Agree-spec needs s tu,Agree-oth duties interfere
d.
Predictors: (Constant), Agree-staf f recognized,Agree-princ enforces disc ipline, Agree-spec needs s tu,Agree-oth duties interfere, Agree-satisf ied w /salary
e.
ANOVAf
41.224 41.224 96.682 .000a
210.210 .426
251.434
51.643 25.821 63.587 .000b
199.792 .406
251.434
59.157 19.719 50.354 .000c
192.278 .392
251.434
62.155 15.539 40.226 .000d
189.280 .386
251.434
64.683 12.937 33.874 .000e
186.751 .382
251.434
Regression
Residual
Total
Regression
Residual
Total
Regression
Residual
Total
Regression
Residual
Total
Regression
Residual
Total
Model
1
2
3
4
5
Sum ofSquares
MeanSquare F Sig.
Predictors: (Constant), Agree-staf f recognizeda.
Predictors: (Constant), Agree-staf f recognized, Agree-princenforces discipline
b.
Predictors: (Constant), Agree-staf f recognized, Agree-princenforces discipline, Agree-spec needs stu
c.
Predictors: (Constant), Agree-staf f recognized, Agree-princenforces discipline, Agree-spec needs stu, Agree-oth dutiesinterfere
d.
Predictors: (Constant), Agree-staf f recognized, Agree-princenforces discipline, Agree-spec needs stu, Agree-oth dutiesinterfere, Agree-satisf ied w /salary
e.
Dependent Variable: Agree-generally satisf iedf .
The Special Issue on Humanities and Behavioral Science © Centre for Promoting Ideas, USA
23
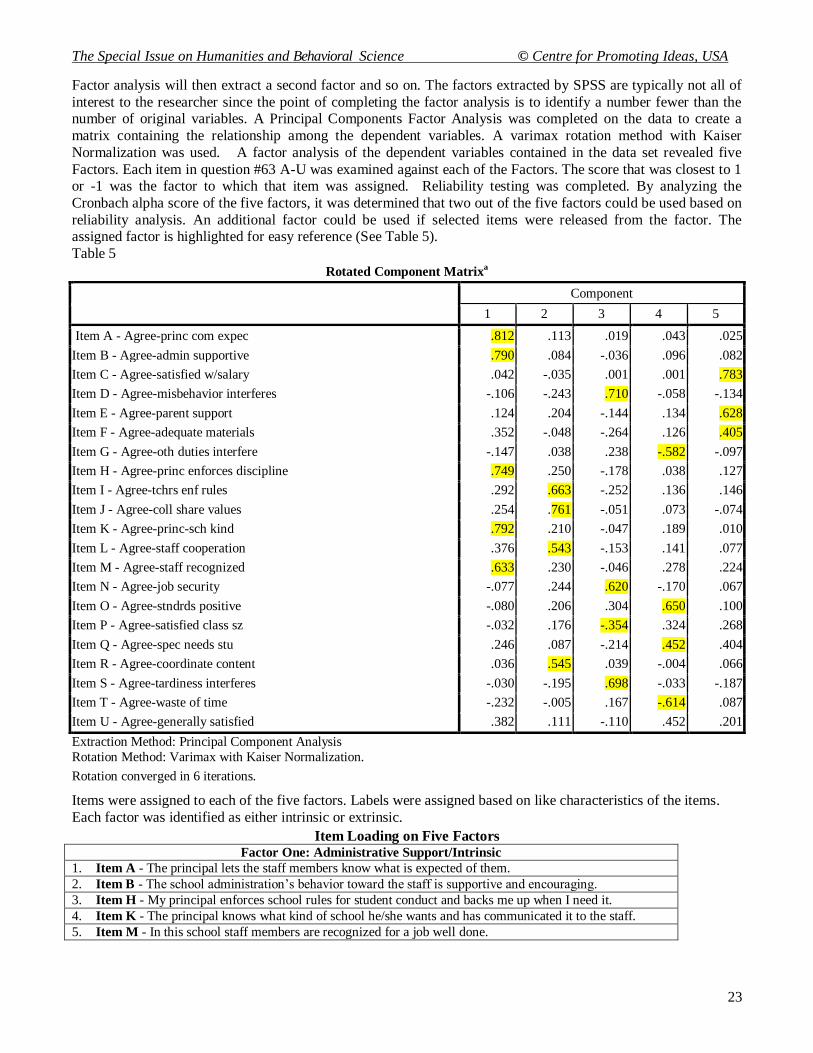
Factor analysis will then extract a second factor and so on. The factors extracted by SPSS are typically not all of
interest to the researcher since the point of completing the factor analysis is to identify a number fewer than the number of original variables. A Principal Components Factor Analysis was completed on the data to create a
matrix containing the relationship among the dependent variables. A varimax rotation method with Kaiser
Normalization was used. A factor analysis of the dependent variables contained in the data set revealed five
Factors. Each item in question #63 A-U was examined against each of the Factors. The score that was closest to 1 or -1 was the factor to which that item was assigned. Reliability testing was completed. By analyzing the
Cronbach alpha score of the five factors, it was determined that two out of the five factors could be used based on
reliability analysis. An additional factor could be used if selected items were released from the factor. The assigned factor is highlighted for easy reference (See Table 5).
Table 5
Rotated Component Matrixa
Component
1 2 3 4 5
Item A - Agree-princ com expec .812 .113 .019 .043 .025
Item B - Agree-admin supportive .790 .084 -.036 .096 .082
Item C - Agree-satisfied w/salary .042 -.035 .001 .001 .783
Item D - Agree-misbehavior interferes -.106 -.243 .710 -.058 -.134
Item E - Agree-parent support .124 .204 -.144 .134 .628
Item F - Agree-adequate materials .352 -.048 -.264 .126 .405
Item G - Agree-oth duties interfere -.147 .038 .238 -.582 -.097
Item H - Agree-princ enforces discipline .749 .250 -.178 .038 .127
Item I - Agree-tchrs enf rules .292 .663 -.252 .136 .146
Item J - Agree-coll share values .254 .761 -.051 .073 -.074
Item K - Agree-princ-sch kind .792 .210 -.047 .189 .010
Item L - Agree-staff cooperation .376 .543 -.153 .141 .077
Item M - Agree-staff recognized .633 .230 -.046 .278 .224
Item N - Agree-job security -.077 .244 .620 -.170 .067
Item O - Agree-stndrds positive -.080 .206 .304 .650 .100
Item P - Agree-satisfied class sz -.032 .176 -.354 .324 .268
Item Q - Agree-spec needs stu .246 .087 -.214 .452 .404
Item R - Agree-coordinate content .036 .545 .039 -.004 .066
Item S - Agree-tardiness interferes -.030 -.195 .698 -.033 -.187
Item T - Agree-waste of time -.232 -.005 .167 -.614 .087
Item U - Agree-generally satisfied .382 .111 -.110 .452 .201
Extraction Method: Principal Component Analysis
Rotation Method: Varimax with Kaiser Normalization.
Rotation converged in 6 iterations.
Items were assigned to each of the five factors. Labels were assigned based on like characteristics of the items.
Each factor was identified as either intrinsic or extrinsic.
Item Loading on Five Factors Factor One: Administrative Support/Intrinsic
1. Item A - The principal lets the staff members know what is expected of them.
2. Item B - The school administration‟s behavior toward the staff is supportive and encouraging.
3. Item H - My principal enforces school rules for student conduct and backs me up when I need it.
4. Item K - The principal knows what kind of school he/she wants and has communicated it to the staff.
5. Item M - In this school staff members are recognized for a job well done.
The Special Issue on Humanities and Behavioral Science © Centre for Promoting Ideas, USA
24
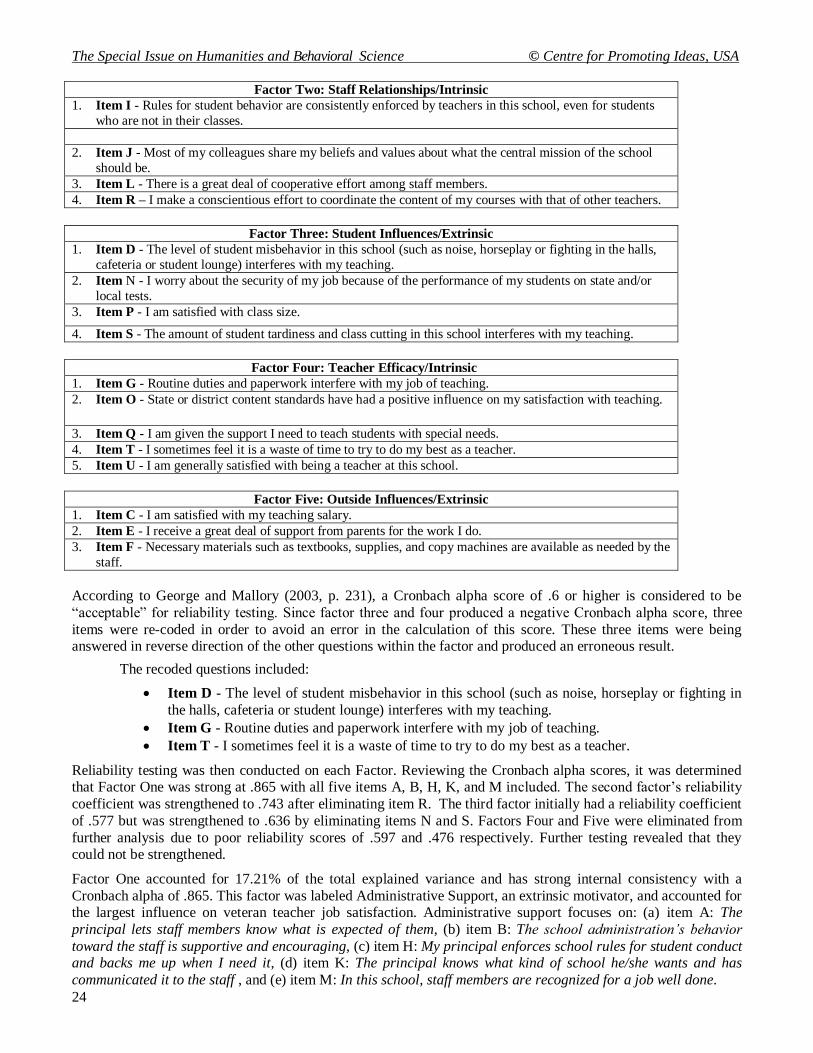
Factor Two: Staff Relationships/Intrinsic
1. Item I - Rules for student behavior are consistently enforced by teachers in this school, even for students
who are not in their classes.
2. Item J - Most of my colleagues share my beliefs and values about what the central mission of the school
should be.
3. Item L - There is a great deal of cooperative effort among staff members.
4. Item R – I make a conscientious effort to coordinate the content of my courses with that of other teachers.
Factor Three: Student Influences/Extrinsic
1. Item D - The level of student misbehavior in this school (such as noise, horseplay or fighting in the halls,
cafeteria or student lounge) interferes with my teaching.
2. Item N - I worry about the security of my job because of the performance of my students on state and/or
local tests.
3. Item P - I am satisfied with class size.
4. Item S - The amount of student tardiness and class cutting in this school interferes with my teaching.
Factor Four: Teacher Efficacy/Intrinsic
1. Item G - Routine duties and paperwork interfere with my job of teaching.
2. Item O - State or district content standards have had a positive influence on my satisfaction with teaching.
3. Item Q - I am given the support I need to teach students with special needs.
4. Item T - I sometimes feel it is a waste of time to try to do my best as a teacher.
5. Item U - I am generally satisfied with being a teacher at this school.
Factor Five: Outside Influences/Extrinsic
1. Item C - I am satisfied with my teaching salary.
2. Item E - I receive a great deal of support from parents for the work I do.
3. Item F - Necessary materials such as textbooks, supplies, and copy machines are available as needed by the
staff.
According to George and Mallory (2003, p. 231), a Cronbach alpha score of .6 or higher is considered to be
“acceptable” for reliability testing. Since factor three and four produced a negative Cronbach alpha score, three
items were re-coded in order to avoid an error in the calculation of this score. These three items were being answered in reverse direction of the other questions within the factor and produced an erroneous result.
The recoded questions included:
Item D - The level of student misbehavior in this school (such as noise, horseplay or fighting in
the halls, cafeteria or student lounge) interferes with my teaching.
Item G - Routine duties and paperwork interfere with my job of teaching.
Item T - I sometimes feel it is a waste of time to try to do my best as a teacher.
Reliability testing was then conducted on each Factor. Reviewing the Cronbach alpha scores, it was determined that Factor One was strong at .865 with all five items A, B, H, K, and M included. The second factor‟s reliability
coefficient was strengthened to .743 after eliminating item R. The third factor initially had a reliability coefficient
of .577 but was strengthened to .636 by eliminating items N and S. Factors Four and Five were eliminated from
further analysis due to poor reliability scores of .597 and .476 respectively. Further testing revealed that they could not be strengthened.
Factor One accounted for 17.21% of the total explained variance and has strong internal consistency with a
Cronbach alpha of .865. This factor was labeled Administrative Support, an extrinsic motivator, and accounted for the largest influence on veteran teacher job satisfaction. Administrative support focuses on: (a) item A: The
principal lets staff members know what is expected of them, (b) item B: The school administration’s behavior
toward the staff is supportive and encouraging, (c) item H: My principal enforces school rules for student conduct and backs me up when I need it, (d) item K: The principal knows what kind of school he/she wants and has
communicated it to the staff , and (e) item M: In this school, staff members are recognized for a job well done.
The Special Issue on Humanities and Behavioral Science © Centre for Promoting Ideas, USA
25
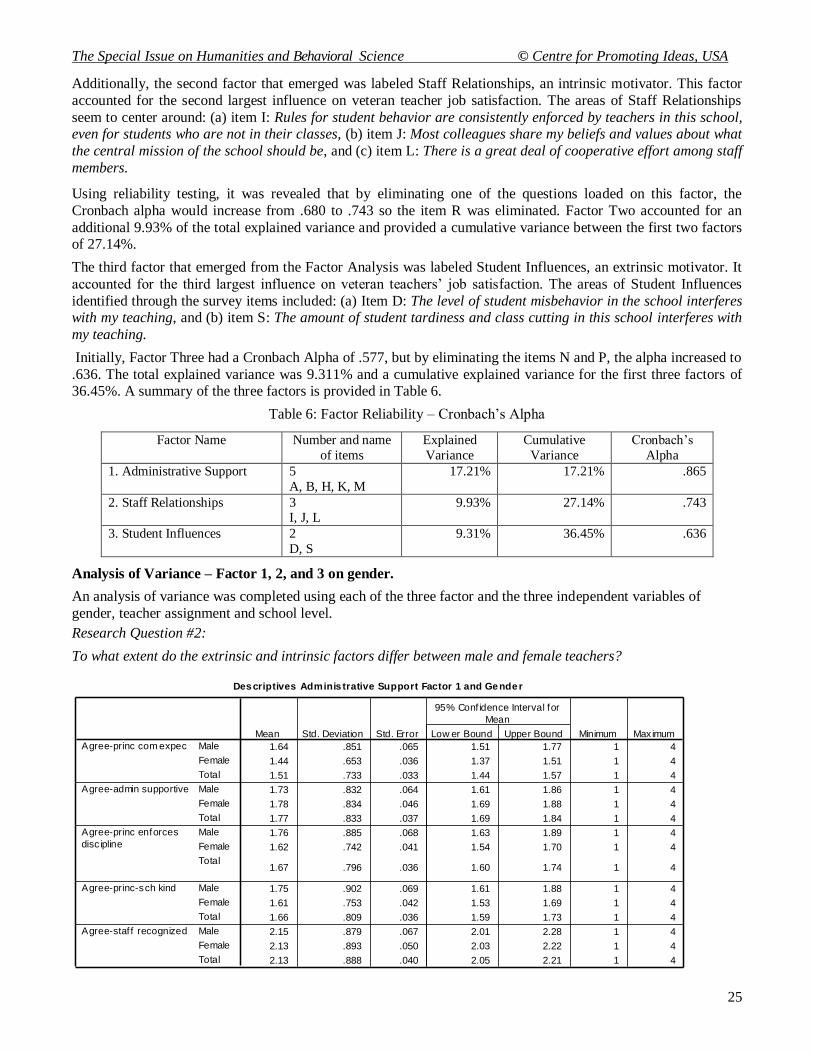
Additionally, the second factor that emerged was labeled Staff Relationships, an intrinsic motivator. This factor
accounted for the second largest influence on veteran teacher job satisfaction. The areas of Staff Relationships
seem to center around: (a) item I: Rules for student behavior are consistently enforced by teachers in this school, even for students who are not in their classes, (b) item J: Most colleagues share my beliefs and values about what
the central mission of the school should be, and (c) item L: There is a great deal of cooperative effort among staff
members.
Using reliability testing, it was revealed that by eliminating one of the questions loaded on this factor, the
Cronbach alpha would increase from .680 to .743 so the item R was eliminated. Factor Two accounted for an
additional 9.93% of the total explained variance and provided a cumulative variance between the first two factors of 27.14%.
The third factor that emerged from the Factor Analysis was labeled Student Influences, an extrinsic motivator. It
accounted for the third largest influence on veteran teachers‟ job satisfaction. The areas of Student Influences
identified through the survey items included: (a) Item D: The level of student misbehavior in the school interferes with my teaching, and (b) item S: The amount of student tardiness and class cutting in this school interferes with
my teaching.
Initially, Factor Three had a Cronbach Alpha of .577, but by eliminating the items N and P, the alpha increased to
.636. The total explained variance was 9.311% and a cumulative explained variance for the first three factors of 36.45%. A summary of the three factors is provided in Table 6.
Table 6: Factor Reliability – Cronbach‟s Alpha
Factor Name Number and name
of items
Explained
Variance
Cumulative
Variance
Cronbach‟s
Alpha
1. Administrative Support 5
A, B, H, K, M
17.21% 17.21% .865
2. Staff Relationships 3 I, J, L
9.93% 27.14% .743
3. Student Influences 2
D, S
9.31% 36.45% .636
Analysis of Variance – Factor 1, 2, and 3 on gender.
An analysis of variance was completed using each of the three factor and the three independent variables of
gender, teacher assignment and school level.
Research Question #2:
To what extent do the extrinsic and intrinsic factors differ between male and female teachers?
Descriptives Adminis trative Support Factor 1 and Gender
1.64 .851 .065 1.51 1.77 1 4
1.44 .653 .036 1.37 1.51 1 4
1.51 .733 .033 1.44 1.57 1 4
1.73 .832 .064 1.61 1.86 1 4
1.78 .834 .046 1.69 1.88 1 4
1.77 .833 .037 1.69 1.84 1 4
1.76 .885 .068 1.63 1.89 1 4
1.62 .742 .041 1.54 1.70 1 4
1.67 .796 .036 1.60 1.74 1 4
1.75 .902 .069 1.61 1.88 1 4
1.61 .753 .042 1.53 1.69 1 4
1.66 .809 .036 1.59 1.73 1 4
2.15 .879 .067 2.01 2.28 1 4
2.13 .893 .050 2.03 2.22 1 4
2.13 .888 .040 2.05 2.21 1 4
Male
Female
Total
Male
Female
Total
Male
Female
Total
Male
Female
Total
Male
Female
Total
Agree-princ com expec
Agree-admin supportive
Agree-princ enforces
disc ipline
Agree-princ-sch kind
Agree-staf f recognized
Mean Std. Deviation Std. Error Low er Bound Upper Bound
95% Conf idence Interval for
Mean
Minimum Maximum

The Special Issue on Humanities and Behavioral Science © Centre for Promoting Ideas, USA
26
ANOVA-Factor 1 - Adm inis tr ative Support and Gender
4.704 4.704 8.885 .003
261.005 .529
265.709
.314 .314 .452 .502
342.502 .695
342.816
2.094 2.094 3.317 .069
311.231 .631
313.325
2.210 2.210 3.390 .066
321.406 .652
323.616
.043 .043 .055 .815
389.157 .789
389.200
Betw een Groups
Within Groups
Total
Betw een Groups
Within Groups
Total
Betw een Groups
Within Groups
Total
Betw een Groups
Within Groups
Total
Betw een Groups
Within Groups
Total
Agree-princ com expec
Agree-admin supportive
Agree-princ enforces
disc ipline
Agree-princ-sch kind
Agree-staf f recognized
Sum of
Squares Mean Square F Sig.
In Factor One: Administrative Support, Item A, a one way ANOVA indicated significant differences in the
perceptions of how the principal communicates expectations by gender. The main effect of gender was found to have a significant impact on the perceptions of how the principal communicates expectations using a critical α of
.05, F =8.885, and p = .003. This indicated that females (M =1.44, SD = .653) expressed a higher level of
satisfaction with how the principal communicated his/her expectations than their male counterparts (M =1.64, SD
= .851). The mean response to the other four items in Factor 1 did not differ significantly with p values of .502, .069, .066 and .815 respectively. Therefore, only the first extrinsic motivator in the first Factor, The principal lets
the staff members know what is expected of them, is answered on average significantly differently between male
and female teachers.
ANOVA Factor Tw o - Staff Re lationships and Gender
4.915 4.915 5.888 .016
411.550 .835
416.465
2.020 2.020 3.842 .051
259.184 .526
261.204
1.169 1.169 2.007 .157
287.102 .582
288.271
Betw een Groups
Within Groups
Total
Betw een Groups
Within Groups
Total
Betw een Groups
Within Groups
Total
Agree-tchrs enf rules
Agree-coll share values
Agree-staf f cooperation
Sum of
Squares Mean Square F Sig.
Descriptives Scale Tw o - Staff Relationships and Gender
2.45 .882 .067 2.32 2.58 1 4
2.24 .930 .052 2.14 2.34 1 4
2.31 .918 .041 2.23 2.39 1 4
1.97 .706 .054 1.86 2.08 1 4
1.84 .735 .041 1.76 1.92 1 4
1.88 .727 .033 1.82 1.95 1 4
1.88 .810 .062 1.76 2.01 1 4
1.78 .737 .041 1.70 1.86 1 4
1.82 .764 .034 1.75 1.88 1 4
Male
Female
Total
Male
Female
Total
Male
Female
Total
Agree-tchrs enf rules
Agree-coll share values
Agree-staf f cooperation
Mean Std. Deviation Std. Error Low er Bound Upper Bound
95% Conf idence Interval for
Mean
Minimum Maximum
The Special Issue on Humanities and Behavioral Science © Centre for Promoting Ideas, USA
27
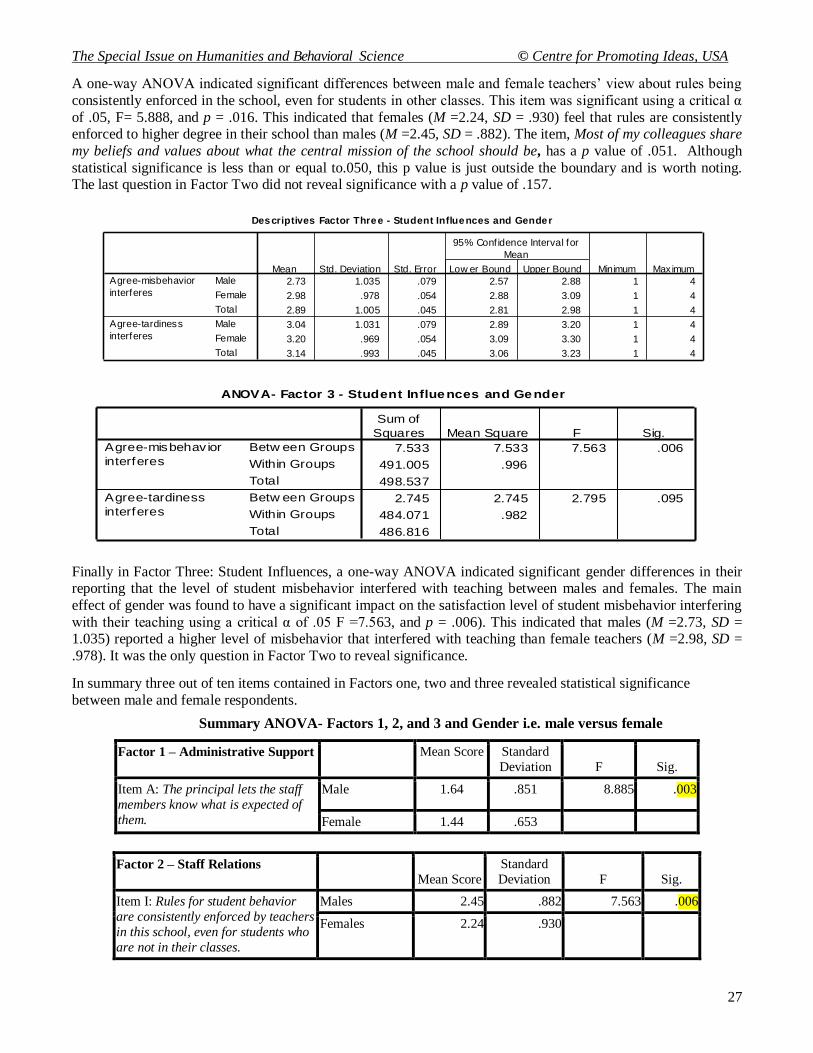
A one-way ANOVA indicated significant differences between male and female teachers‟ view about rules being
consistently enforced in the school, even for students in other classes. This item was significant using a critical α
of .05, F= 5.888, and p = .016. This indicated that females (M =2.24, SD = .930) feel that rules are consistently enforced to higher degree in their school than males (M =2.45, SD = .882). The item, Most of my colleagues share
my beliefs and values about what the central mission of the school should be, has a p value of .051. Although
statistical significance is less than or equal to.050, this p value is just outside the boundary and is worth noting. The last question in Factor Two did not reveal significance with a p value of .157.
Finally in Factor Three: Student Influences, a one-way ANOVA indicated significant gender differences in their reporting that the level of student misbehavior interfered with teaching between males and females. The main
effect of gender was found to have a significant impact on the satisfaction level of student misbehavior interfering
with their teaching using a critical α of .05 F =7.563, and p = .006). This indicated that males (M =2.73, SD = 1.035) reported a higher level of misbehavior that interfered with teaching than female teachers (M =2.98, SD =
.978). It was the only question in Factor Two to reveal significance.
In summary three out of ten items contained in Factors one, two and three revealed statistical significance
between male and female respondents.
Summary ANOVA- Factors 1, 2, and 3 and Gender i.e. male versus female
Factor 1 – Administrative Support Mean Score Standard
Deviation F Sig.
Item A: The principal lets the staff
members know what is expected of
them.
Male 1.64 .851 8.885 .003
Female 1.44 .653
Factor 2 – Staff Relations
Mean Score
Standard
Deviation F Sig.
Item I: Rules for student behavior
are consistently enforced by teachers
in this school, even for students who
are not in their classes.
Males 2.45 .882 7.563 .006
Females 2.24 .930
Descriptives Factor Three - Student Influences and Gender
2.73 1.035 .079 2.57 2.88 1 4
2.98 .978 .054 2.88 3.09 1 4
2.89 1.005 .045 2.81 2.98 1 4
3.04 1.031 .079 2.89 3.20 1 4
3.20 .969 .054 3.09 3.30 1 4
3.14 .993 .045 3.06 3.23 1 4
Male
Female
Total
Male
Female
Total
Agree-misbehavior
interferes
Agree-tardiness
interferes
Mean Std. Deviation Std. Error Low er Bound Upper Bound
95% Conf idence Interval for
Mean
Minimum Maximum
ANOVA- Factor 3 - Student Influences and Gender
7.533 7.533 7.563 .006
491.005 .996
498.537
2.745 2.745 2.795 .095
484.071 .982
486.816
Betw een Groups
Within Groups
Total
Betw een Groups
Within Groups
Total
Agree-misbehav ior
interferes
Agree-tardiness
interferes
Sum of
Squares Mean Square F Sig.
The Special Issue on Humanities and Behavioral Science © Centre for Promoting Ideas, USA
28
Factor 3 – Student Influence
Mean Score
Standard
Deviation F Sig.
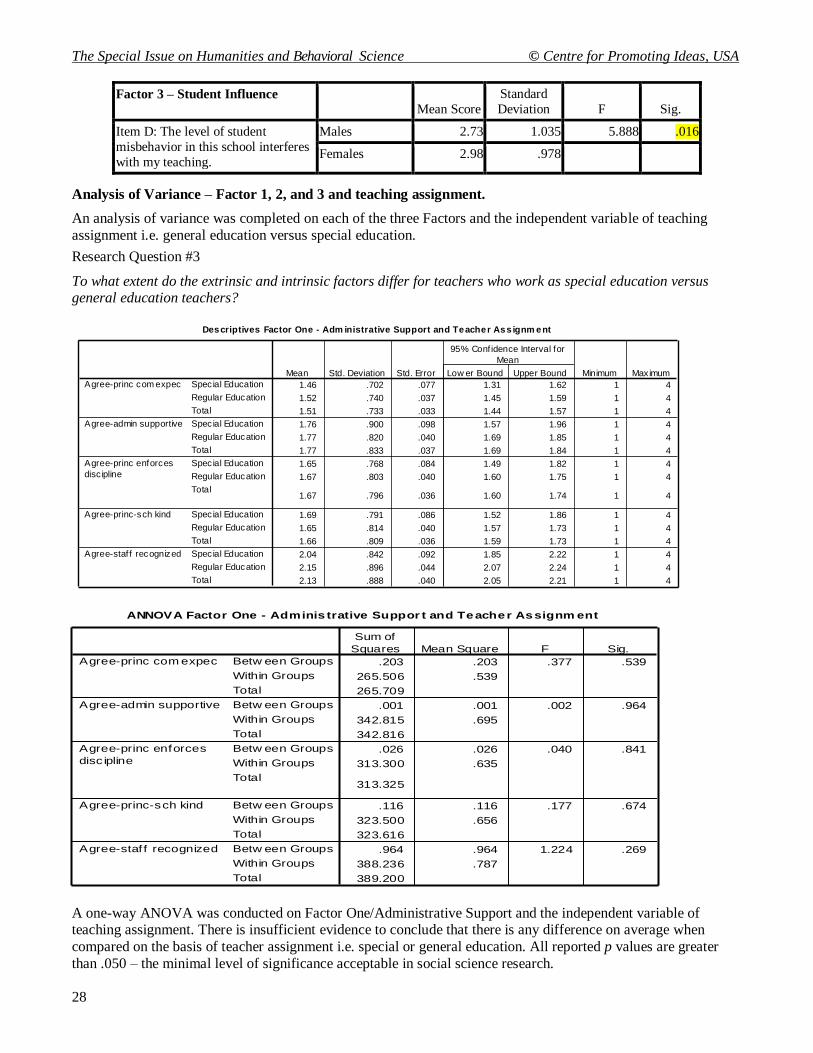
Item D: The level of student
misbehavior in this school interferes
with my teaching.
Males 2.73 1.035 5.888 .016
Females 2.98 .978
Analysis of Variance – Factor 1, 2, and 3 and teaching assignment.
An analysis of variance was completed on each of the three Factors and the independent variable of teaching
assignment i.e. general education versus special education.
Research Question #3
To what extent do the extrinsic and intrinsic factors differ for teachers who work as special education versus general education teachers?
A one-way ANOVA was conducted on Factor One/Administrative Support and the independent variable of teaching assignment. There is insufficient evidence to conclude that there is any difference on average when
compared on the basis of teacher assignment i.e. special or general education. All reported p values are greater
than .050 – the minimal level of significance acceptable in social science research.
Descriptives Factor One - Adm inistrative Support and Teacher Ass ignm ent
1.46 .702 .077 1.31 1.62 1 4
1.52 .740 .037 1.45 1.59 1 4
1.51 .733 .033 1.44 1.57 1 4
1.76 .900 .098 1.57 1.96 1 4
1.77 .820 .040 1.69 1.85 1 4
1.77 .833 .037 1.69 1.84 1 4
1.65 .768 .084 1.49 1.82 1 4
1.67 .803 .040 1.60 1.75 1 4
1.67 .796 .036 1.60 1.74 1 4
1.69 .791 .086 1.52 1.86 1 4
1.65 .814 .040 1.57 1.73 1 4
1.66 .809 .036 1.59 1.73 1 4
2.04 .842 .092 1.85 2.22 1 4
2.15 .896 .044 2.07 2.24 1 4
2.13 .888 .040 2.05 2.21 1 4
Special Education
Regular Education
Total
Spec ial Education
Regular Education
Total
Spec ial Education
Regular Education
Total
Spec ial Education
Regular Education
Total
Spec ial Education
Regular Education
Total
Agree-princ com expec
Agree-admin supportive
Agree-princ enforces
disc ipline
Agree-princ-sch kind
Agree-staf f recognized
Mean Std. Deviation Std. Error Low er Bound Upper Bound
95% Conf idence Interval for
Mean
Minimum Maximum
ANNOVA Factor One - Adminis trative Suppor t and Teacher Assignm ent
.203 .203 .377 .539
265.506 .539
265.709
.001 .001 .002 .964
342.815 .695
342.816
.026 .026 .040 .841
313.300 .635
313.325
.116 .116 .177 .674
323.500 .656
323.616
.964 .964 1.224 .269
388.236 .787
389.200
Betw een Groups
Within Groups
Total
Betw een Groups
Within Groups
Total
Betw een Groups
Within Groups
Total
Betw een Groups
Within Groups
Total
Betw een Groups
Within Groups
Total
Agree-princ com expec
Agree-admin supportive
Agree-princ enforces
disc ipline
Agree-princ-sch kind
Agree-staf f recognized
Sum of
Squares Mean Square F Sig.
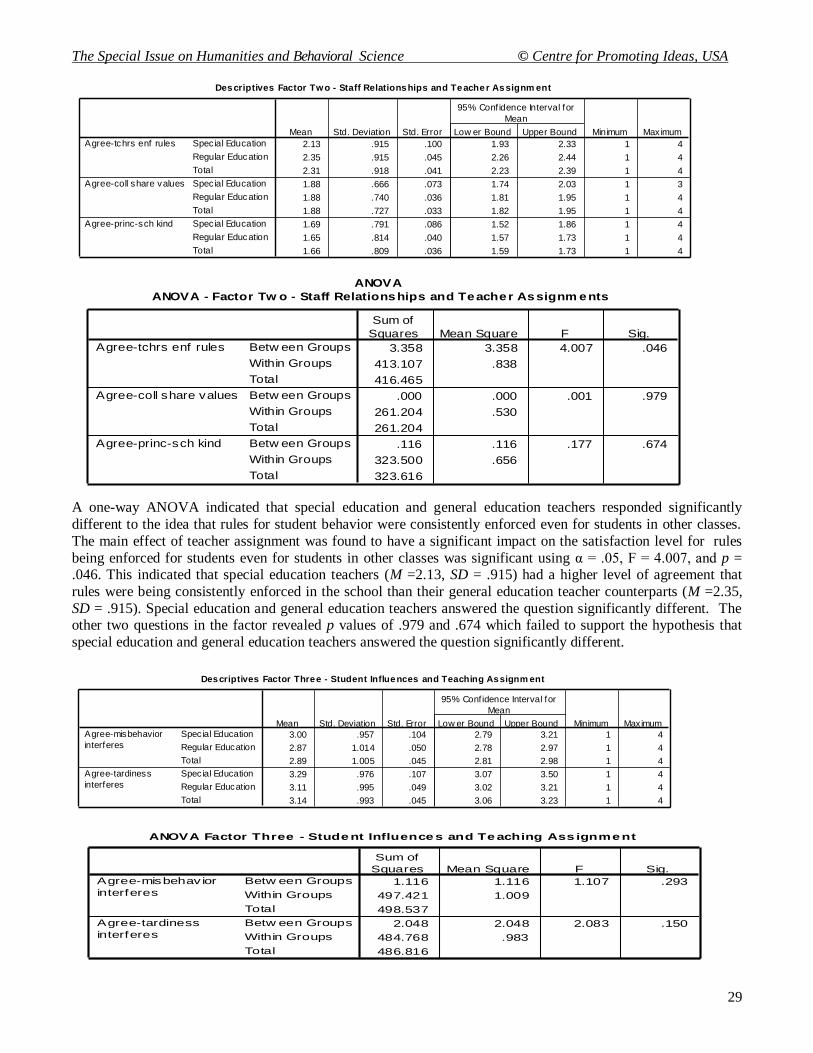
The Special Issue on Humanities and Behavioral Science © Centre for Promoting Ideas, USA
29
A one-way ANOVA indicated that special education and general education teachers responded significantly
different to the idea that rules for student behavior were consistently enforced even for students in other classes.
The main effect of teacher assignment was found to have a significant impact on the satisfaction level for rules
being enforced for students even for students in other classes was significant using α = .05, F = 4.007, and p = .046. This indicated that special education teachers (M =2.13, SD = .915) had a higher level of agreement that
rules were being consistently enforced in the school than their general education teacher counterparts (M =2.35,
SD = .915). Special education and general education teachers answered the question significantly different. The other two questions in the factor revealed p values of .979 and .674 which failed to support the hypothesis that
special education and general education teachers answered the question significantly different.
ANOVA
ANOVA - Factor Tw o - Staff Relationships and Teacher Assignm ents
3.358 3.358 4.007 .046
413.107 .838
416.465
.000 .000 .001 .979
261.204 .530
261.204
.116 .116 .177 .674
323.500 .656
323.616
Betw een Groups
Within Groups
Total
Betw een Groups
Within Groups
Total
Betw een Groups
Within Groups
Total
Agree-tchrs enf rules
Agree-coll share values
Agree-princ-sch kind
Sum of
Squares Mean Square F Sig.
Descriptives Factor Three - Student Influences and Teaching Assignm ent
3.00 .957 .104 2.79 3.21 1 4
2.87 1.014 .050 2.78 2.97 1 4
2.89 1.005 .045 2.81 2.98 1 4
3.29 .976 .107 3.07 3.50 1 4
3.11 .995 .049 3.02 3.21 1 4
3.14 .993 .045 3.06 3.23 1 4
Special Education
Regular Education
Total
Special Education
Regular Education
Total
Agree-misbehavior
interferes
Agree-tardiness
interferes
Mean Std. Deviation Std. Error Low er Bound Upper Bound
95% Conf idence Interval for
Mean
Minimum Maximum
ANOVA Factor Three - Student Influences and Teaching Ass ignment
1.116 1.116 1.107 .293
497.421 1.009
498.537
2.048 2.048 2.083 .150
484.768 .983
486.816
Betw een Groups
Within Groups
Total
Betw een Groups
Within Groups
Total
Agree-misbehav ior
interferes
Agree-tardiness
interferes
Sum of
Squares Mean Square F Sig.
Descriptives Factor Tw o - Staff Relationships and Teacher Assignm ent
2.13 .915 .100 1.93 2.33 1 4
2.35 .915 .045 2.26 2.44 1 4
2.31 .918 .041 2.23 2.39 1 4
1.88 .666 .073 1.74 2.03 1 3
1.88 .740 .036 1.81 1.95 1 4
1.88 .727 .033 1.82 1.95 1 4
1.69 .791 .086 1.52 1.86 1 4
1.65 .814 .040 1.57 1.73 1 4
1.66 .809 .036 1.59 1.73 1 4
Spec ial Education
Regular Education
Total
Spec ial Education
Regular Education
Total
Spec ial Education
Regular Education
Total
Agree-tchrs enf rules
Agree-coll share values
Agree-princ-sch kind
Mean Std. Deviation Std. Error Low er Bound Upper Bound
95% Conf idence Interval for
Mean
Minimum Maximum
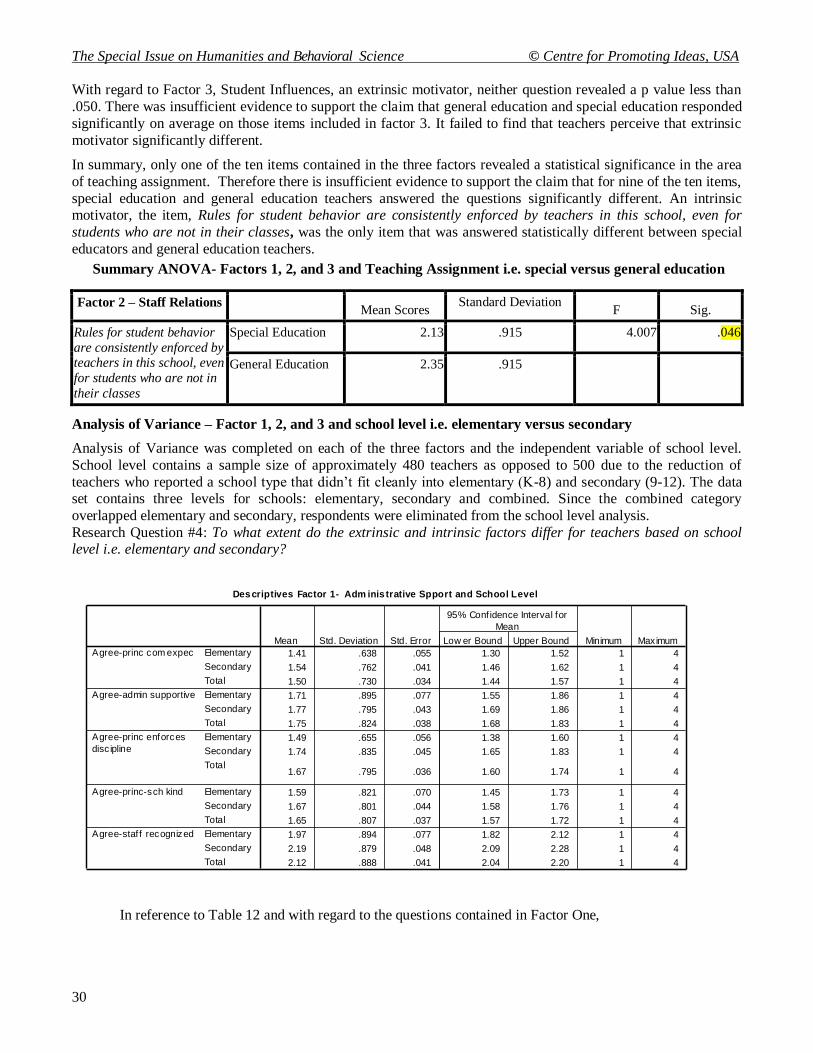
The Special Issue on Humanities and Behavioral Science © Centre for Promoting Ideas, USA
30
With regard to Factor 3, Student Influences, an extrinsic motivator, neither question revealed a p value less than
.050. There was insufficient evidence to support the claim that general education and special education responded
significantly on average on those items included in factor 3. It failed to find that teachers perceive that extrinsic
motivator significantly different.
In summary, only one of the ten items contained in the three factors revealed a statistical significance in the area
of teaching assignment. Therefore there is insufficient evidence to support the claim that for nine of the ten items,
special education and general education teachers answered the questions significantly different. An intrinsic motivator, the item, Rules for student behavior are consistently enforced by teachers in this school, even for
students who are not in their classes, was the only item that was answered statistically different between special
educators and general education teachers.
Summary ANOVA- Factors 1, 2, and 3 and Teaching Assignment i.e. special versus general education
Factor 2 – Staff Relations Mean Scores
Standard Deviation F Sig.
Rules for student behavior
are consistently enforced by teachers in this school, even
for students who are not in
their classes
Special Education 2.13 .915 4.007 .046
General Education 2.35 .915
Analysis of Variance – Factor 1, 2, and 3 and school level i.e. elementary versus secondary
Analysis of Variance was completed on each of the three factors and the independent variable of school level.
School level contains a sample size of approximately 480 teachers as opposed to 500 due to the reduction of
teachers who reported a school type that didn‟t fit cleanly into elementary (K-8) and secondary (9-12). The data set contains three levels for schools: elementary, secondary and combined. Since the combined category
overlapped elementary and secondary, respondents were eliminated from the school level analysis.
Research Question #4: To what extent do the extrinsic and intrinsic factors differ for teachers based on school level i.e. elementary and secondary?
In reference to Table 12 and with regard to the questions contained in Factor One,
Descriptives Factor 1- Adm inis trative Spport and School Level
1.41 .638 .055 1.30 1.52 1 4
1.54 .762 .041 1.46 1.62 1 4
1.50 .730 .034 1.44 1.57 1 4
1.71 .895 .077 1.55 1.86 1 4
1.77 .795 .043 1.69 1.86 1 4
1.75 .824 .038 1.68 1.83 1 4
1.49 .655 .056 1.38 1.60 1 4
1.74 .835 .045 1.65 1.83 1 4
1.67 .795 .036 1.60 1.74 1 4
1.59 .821 .070 1.45 1.73 1 4
1.67 .801 .044 1.58 1.76 1 4
1.65 .807 .037 1.57 1.72 1 4
1.97 .894 .077 1.82 2.12 1 4
2.19 .879 .048 2.09 2.28 1 4
2.12 .888 .041 2.04 2.20 1 4
Elementary
Secondary
Total
Elementary
Secondary
Total
Elementary
Secondary
Total
Elementary
Secondary
Total
Elementary
Secondary
Total
Agree-princ com expec
Agree-admin supportive
Agree-princ enforces
disc ipline
Agree-princ-sch kind
Agree-staf f recognized
Mean Std. Deviation Std. Error Low er Bound Upper Bound
95% Conf idence Interval for
Mean
Minimum Maximum
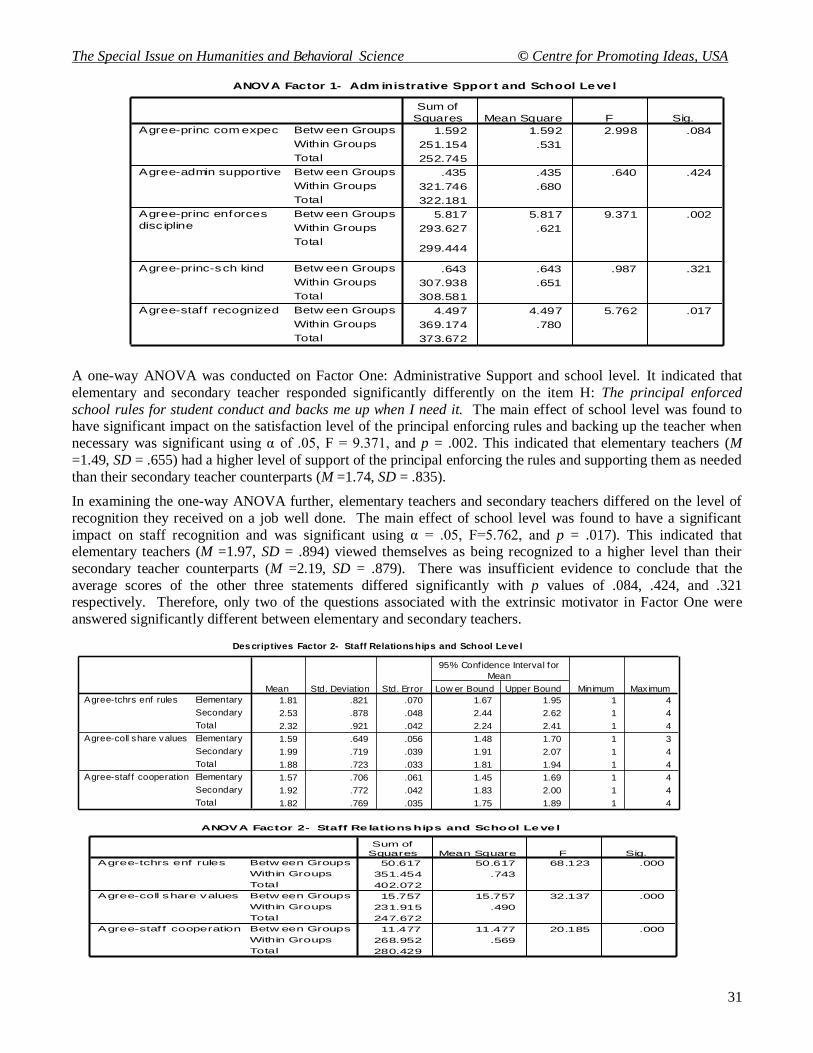
The Special Issue on Humanities and Behavioral Science © Centre for Promoting Ideas, USA
31
A one-way ANOVA was conducted on Factor One: Administrative Support and school level. It indicated that
elementary and secondary teacher responded significantly differently on the item H: The principal enforced
school rules for student conduct and backs me up when I need it. The main effect of school level was found to have significant impact on the satisfaction level of the principal enforcing rules and backing up the teacher when
necessary was significant using α of .05, F = 9.371, and p = .002. This indicated that elementary teachers (M
=1.49, SD = .655) had a higher level of support of the principal enforcing the rules and supporting them as needed
than their secondary teacher counterparts (M =1.74, SD = .835).
In examining the one-way ANOVA further, elementary teachers and secondary teachers differed on the level of
recognition they received on a job well done. The main effect of school level was found to have a significant
impact on staff recognition and was significant using α = .05, F=5.762, and p = .017). This indicated that elementary teachers (M =1.97, SD = .894) viewed themselves as being recognized to a higher level than their
secondary teacher counterparts (M =2.19, SD = .879). There was insufficient evidence to conclude that the
average scores of the other three statements differed significantly with p values of .084, .424, and .321 respectively. Therefore, only two of the questions associated with the extrinsic motivator in Factor One were
answered significantly different between elementary and secondary teachers.
ANOVA Factor 1- Adm inistrative Sppor t and School Leve l
1.592 1.592 2.998 .084
251.154 .531
252.745
.435 .435 .640 .424
321.746 .680
322.181
5.817 5.817 9.371 .002
293.627 .621
299.444
.643 .643 .987 .321
307.938 .651
308.581
4.497 4.497 5.762 .017
369.174 .780
373.672
Betw een Groups
Within Groups
Total
Betw een Groups
Within Groups
Total
Betw een Groups
Within Groups
Total
Betw een Groups
Within Groups
Total
Betw een Groups
Within Groups
Total
Agree-princ com expec
Agree-admin supportive
Agree-princ enforces
disc ipline
Agree-princ-sch kind
Agree-staf f recognized
Sum of
Squares Mean Square F Sig.
Descriptives Factor 2- Staff Relationships and School Leve l
1.81 .821 .070 1.67 1.95 1 4
2.53 .878 .048 2.44 2.62 1 4
2.32 .921 .042 2.24 2.41 1 4
1.59 .649 .056 1.48 1.70 1 3
1.99 .719 .039 1.91 2.07 1 4
1.88 .723 .033 1.81 1.94 1 4
1.57 .706 .061 1.45 1.69 1 4
1.92 .772 .042 1.83 2.00 1 4
1.82 .769 .035 1.75 1.89 1 4
Elementary
Secondary
Total
Elementary
Secondary
Total
Elementary
Secondary
Total
Agree-tchrs enf rules
Agree-coll share values
Agree-staf f cooperation
Mean Std. Deviation Std. Error Low er Bound Upper Bound
95% Conf idence Interval for
Mean
Minimum Maximum
ANOVA Factor 2- Staff Re lationships and School Leve l
50.617 50.617 68.123 .000
351.454 .743
402.072
15.757 15.757 32.137 .000
231.915 .490
247.672
11.477 11.477 20.185 .000
268.952 .569
280.429
Betw een Groups
Within Groups
Total
Betw een Groups
Within Groups
Total
Betw een Groups
Within Groups
Total
Agree-tchrs enf rules
Agree-coll share values
Agree-staf f cooperation
Sum of
Squares Mean Square F Sig.
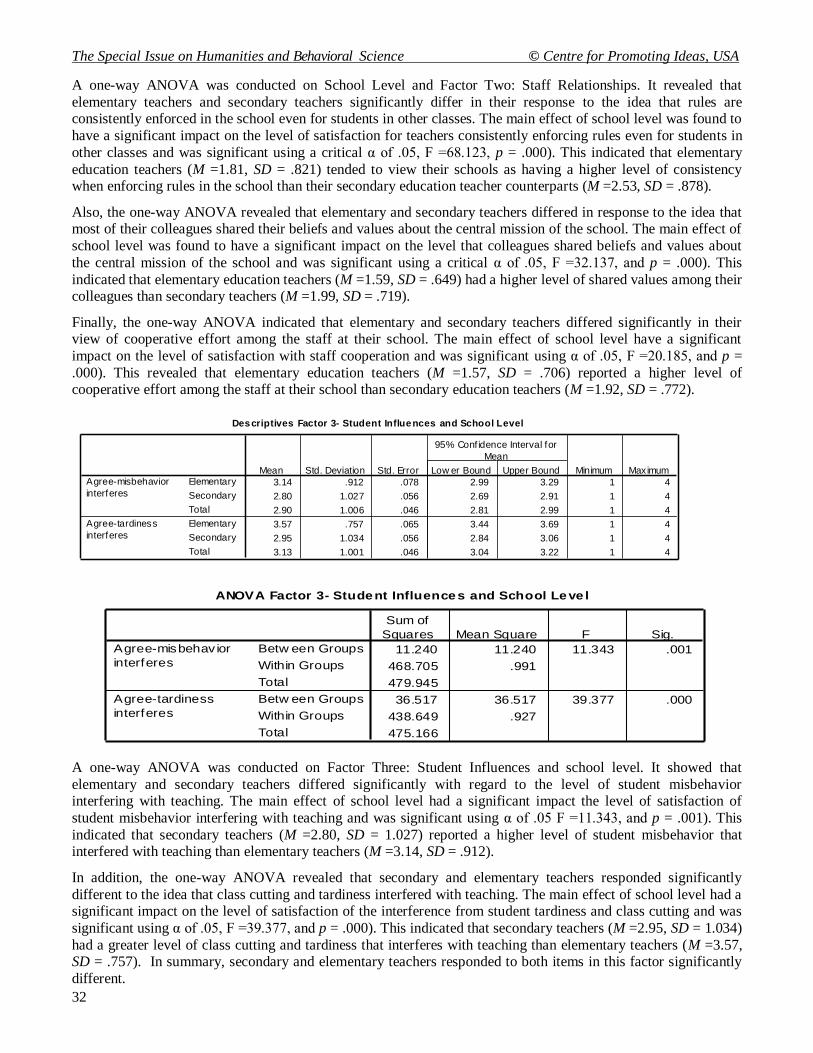
The Special Issue on Humanities and Behavioral Science © Centre for Promoting Ideas, USA
32
A one-way ANOVA was conducted on School Level and Factor Two: Staff Relationships. It revealed that
elementary teachers and secondary teachers significantly differ in their response to the idea that rules are consistently enforced in the school even for students in other classes. The main effect of school level was found to
have a significant impact on the level of satisfaction for teachers consistently enforcing rules even for students in
other classes and was significant using a critical α of .05, F =68.123, p = .000). This indicated that elementary
education teachers (M =1.81, SD = .821) tended to view their schools as having a higher level of consistency when enforcing rules in the school than their secondary education teacher counterparts (M =2.53, SD = .878).
Also, the one-way ANOVA revealed that elementary and secondary teachers differed in response to the idea that most of their colleagues shared their beliefs and values about the central mission of the school. The main effect of
school level was found to have a significant impact on the level that colleagues shared beliefs and values about
the central mission of the school and was significant using a critical α of .05, F =32.137, and p = .000). This
indicated that elementary education teachers (M =1.59, SD = .649) had a higher level of shared values among their colleagues than secondary teachers (M =1.99, SD = .719).
Finally, the one-way ANOVA indicated that elementary and secondary teachers differed significantly in their view of cooperative effort among the staff at their school. The main effect of school level have a significant
impact on the level of satisfaction with staff cooperation and was significant using α of .05, F =20.185, and p =
.000). This revealed that elementary education teachers (M =1.57, SD = .706) reported a higher level of cooperative effort among the staff at their school than secondary education teachers (M =1.92, SD = .772).
A one-way ANOVA was conducted on Factor Three: Student Influences and school level. It showed that
elementary and secondary teachers differed significantly with regard to the level of student misbehavior interfering with teaching. The main effect of school level had a significant impact the level of satisfaction of
student misbehavior interfering with teaching and was significant using α of .05 F =11.343, and p = .001). This
indicated that secondary teachers (M =2.80, SD = 1.027) reported a higher level of student misbehavior that interfered with teaching than elementary teachers (M =3.14, SD = .912).
In addition, the one-way ANOVA revealed that secondary and elementary teachers responded significantly
different to the idea that class cutting and tardiness interfered with teaching. The main effect of school level had a significant impact on the level of satisfaction of the interference from student tardiness and class cutting and was
significant using α of .05, F =39.377, and p = .000). This indicated that secondary teachers (M =2.95, SD = 1.034)
had a greater level of class cutting and tardiness that interferes with teaching than elementary teachers (M =3.57, SD = .757). In summary, secondary and elementary teachers responded to both items in this factor significantly
different.
Descriptives Factor 3- Student Influences and School Level
3.14 .912 .078 2.99 3.29 1 4
2.80 1.027 .056 2.69 2.91 1 4
2.90 1.006 .046 2.81 2.99 1 4
3.57 .757 .065 3.44 3.69 1 4
2.95 1.034 .056 2.84 3.06 1 4
3.13 1.001 .046 3.04 3.22 1 4
Elementary
Secondary
Total
Elementary
Secondary
Total
Agree-misbehavior
interferes
Agree-tardiness
interferes
Mean Std. Deviation Std. Error Low er Bound Upper Bound
95% Conf idence Interval for
Mean
Minimum Maximum
ANOVA Factor 3- Student Influences and School Leve l
11.240 11.240 11.343 .001
468.705 .991
479.945
36.517 36.517 39.377 .000
438.649 .927
475.166
Betw een Groups
Within Groups
Total
Betw een Groups
Within Groups
Total
Agree-misbehav ior
interferes
Agree-tardiness
interferes
Sum of
Squares Mean Square F Sig.
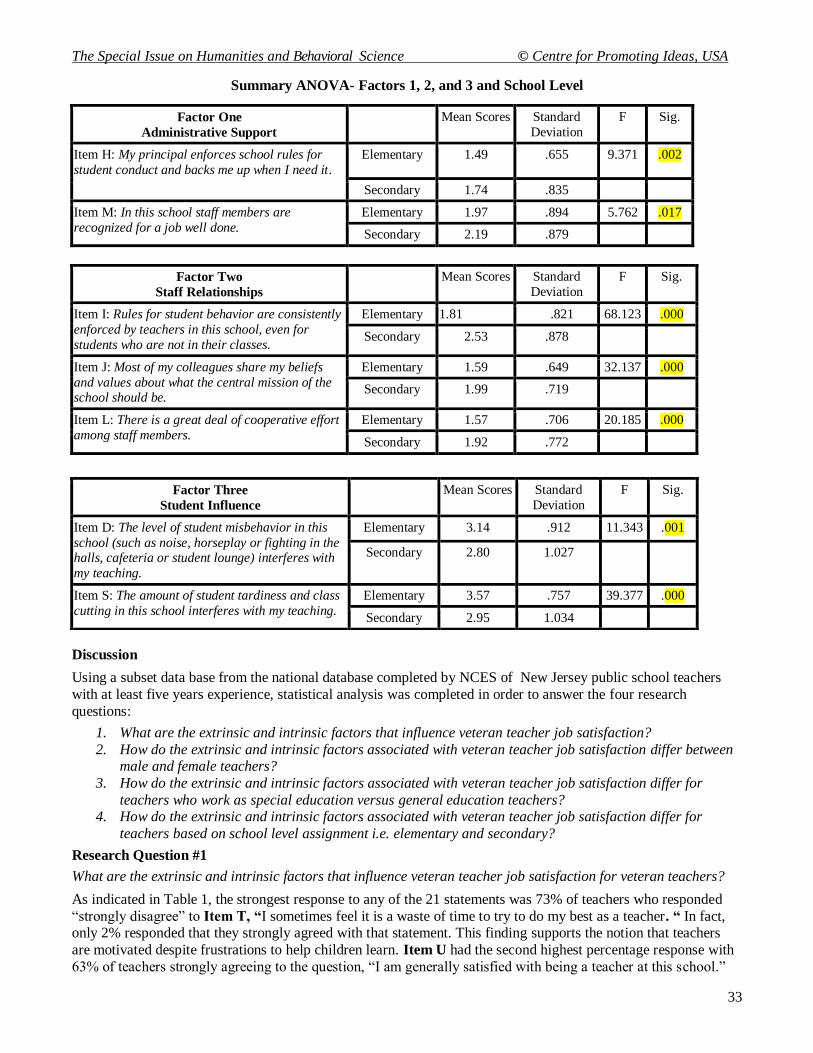
The Special Issue on Humanities and Behavioral Science © Centre for Promoting Ideas, USA
33
Summary ANOVA- Factors 1, 2, and 3 and School Level
Factor One
Administrative Support
Mean Scores Standard
Deviation
F Sig.
Item H: My principal enforces school rules for
student conduct and backs me up when I need it.
Elementary 1.49 .655 9.371 .002
Secondary 1.74 .835
Item M: In this school staff members are
recognized for a job well done.
Elementary 1.97 .894 5.762 .017
Secondary 2.19 .879
Factor Two
Staff Relationships
Mean Scores Standard
Deviation
F Sig.
Item I: Rules for student behavior are consistently
enforced by teachers in this school, even for
students who are not in their classes.
Elementary 1.81 .821 68.123 .000
Secondary 2.53 .878
Item J: Most of my colleagues share my beliefs
and values about what the central mission of the school should be.
Elementary 1.59 .649 32.137 .000
Secondary 1.99 .719
Item L: There is a great deal of cooperative effort
among staff members.
Elementary 1.57 .706 20.185 .000
Secondary 1.92 .772
Discussion
Using a subset data base from the national database completed by NCES of New Jersey public school teachers
with at least five years experience, statistical analysis was completed in order to answer the four research
questions:
1. What are the extrinsic and intrinsic factors that influence veteran teacher job satisfaction?
2. How do the extrinsic and intrinsic factors associated with veteran teacher job satisfaction differ between male and female teachers?
3. How do the extrinsic and intrinsic factors associated with veteran teacher job satisfaction differ for
teachers who work as special education versus general education teachers? 4. How do the extrinsic and intrinsic factors associated with veteran teacher job satisfaction differ for
teachers based on school level assignment i.e. elementary and secondary?
Research Question #1
What are the extrinsic and intrinsic factors that influence veteran teacher job satisfaction for veteran teachers?
As indicated in Table 1, the strongest response to any of the 21 statements was 73% of teachers who responded
“strongly disagree” to Item T, “I sometimes feel it is a waste of time to try to do my best as a teacher. “ In fact, only 2% responded that they strongly agreed with that statement. This finding supports the notion that teachers
are motivated despite frustrations to help children learn. Item U had the second highest percentage response with
63% of teachers strongly agreeing to the question, “I am generally satisfied with being a teacher at this school.”
Factor Three
Student Influence
Mean Scores Standard
Deviation
F Sig.
Item D: The level of student misbehavior in this
school (such as noise, horseplay or fighting in the halls, cafeteria or student lounge) interferes with
my teaching.
Elementary 3.14 .912 11.343 .001
Secondary 2.80 1.027
Item S: The amount of student tardiness and class
cutting in this school interferes with my teaching.
Elementary 3.57 .757 39.377 .000
Secondary 2.95 1.034
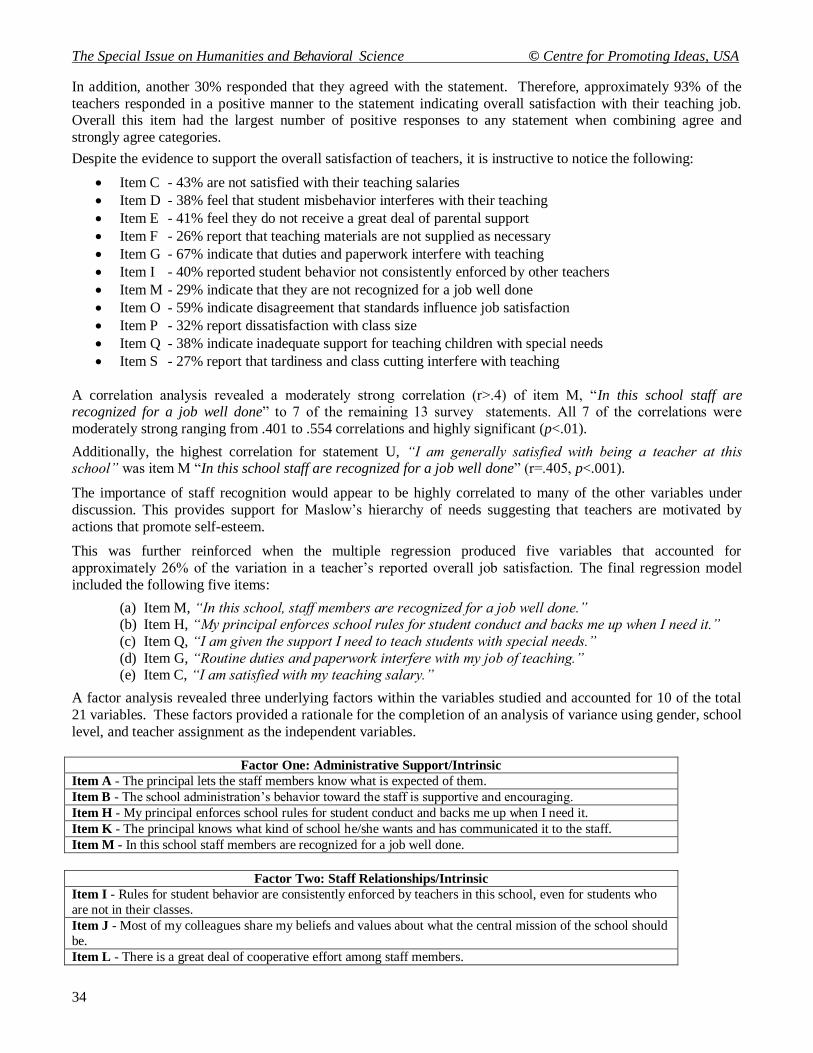
The Special Issue on Humanities and Behavioral Science © Centre for Promoting Ideas, USA
34
In addition, another 30% responded that they agreed with the statement. Therefore, approximately 93% of the
teachers responded in a positive manner to the statement indicating overall satisfaction with their teaching job. Overall this item had the largest number of positive responses to any statement when combining agree and
strongly agree categories.
Despite the evidence to support the overall satisfaction of teachers, it is instructive to notice the following:
Item C - 43% are not satisfied with their teaching salaries
Item D - 38% feel that student misbehavior interferes with their teaching
Item E - 41% feel they do not receive a great deal of parental support
Item F - 26% report that teaching materials are not supplied as necessary
Item G - 67% indicate that duties and paperwork interfere with teaching
Item I - 40% reported student behavior not consistently enforced by other teachers
Item M - 29% indicate that they are not recognized for a job well done
Item O - 59% indicate disagreement that standards influence job satisfaction
Item P - 32% report dissatisfaction with class size
Item Q - 38% indicate inadequate support for teaching children with special needs
Item S - 27% report that tardiness and class cutting interfere with teaching
A correlation analysis revealed a moderately strong correlation (r>.4) of item M, “In this school staff are recognized for a job well done” to 7 of the remaining 13 survey statements. All 7 of the correlations were
moderately strong ranging from .401 to .554 correlations and highly significant (p<.01).
Additionally, the highest correlation for statement U, “I am generally satisfied with being a teacher at this school” was item M “In this school staff are recognized for a job well done” (r=.405, p<.001).
The importance of staff recognition would appear to be highly correlated to many of the other variables under
discussion. This provides support for Maslow‟s hierarchy of needs suggesting that teachers are motivated by
actions that promote self-esteem.
This was further reinforced when the multiple regression produced five variables that accounted for
approximately 26% of the variation in a teacher‟s reported overall job satisfaction. The final regression model
included the following five items:
(a) Item M, “In this school, staff members are recognized for a job well done.” (b) Item H, “My principal enforces school rules for student conduct and backs me up when I need it.”
(c) Item Q, “I am given the support I need to teach students with special needs.”
(d) Item G, “Routine duties and paperwork interfere with my job of teaching.” (e) Item C, “I am satisfied with my teaching salary.”
A factor analysis revealed three underlying factors within the variables studied and accounted for 10 of the total
21 variables. These factors provided a rationale for the completion of an analysis of variance using gender, school
level, and teacher assignment as the independent variables.
Factor One: Administrative Support/Intrinsic
Item A - The principal lets the staff members know what is expected of them.
Item B - The school administration‟s behavior toward the staff is supportive and encouraging.
Item H - My principal enforces school rules for student conduct and backs me up when I need it.
Item K - The principal knows what kind of school he/she wants and has communicated it to the staff.
Item M - In this school staff members are recognized for a job well done.
Factor Two: Staff Relationships/Intrinsic
Item I - Rules for student behavior are consistently enforced by teachers in this school, even for students who
are not in their classes.
Item J - Most of my colleagues share my beliefs and values about what the central mission of the school should
be.
Item L - There is a great deal of cooperative effort among staff members.
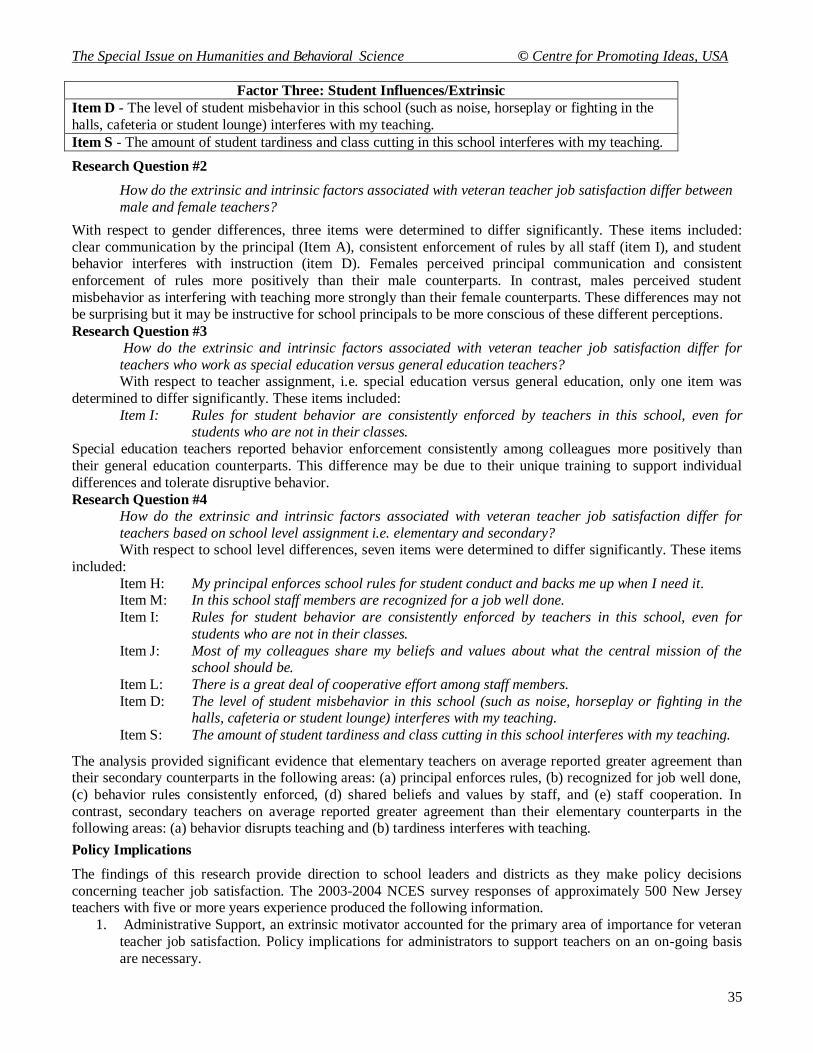
The Special Issue on Humanities and Behavioral Science © Centre for Promoting Ideas, USA
35
Factor Three: Student Influences/Extrinsic
Item D - The level of student misbehavior in this school (such as noise, horseplay or fighting in the
halls, cafeteria or student lounge) interferes with my teaching.
Item S - The amount of student tardiness and class cutting in this school interferes with my teaching.
Research Question #2
How do the extrinsic and intrinsic factors associated with veteran teacher job satisfaction differ between
male and female teachers?
With respect to gender differences, three items were determined to differ significantly. These items included:
clear communication by the principal (Item A), consistent enforcement of rules by all staff (item I), and student behavior interferes with instruction (item D). Females perceived principal communication and consistent
enforcement of rules more positively than their male counterparts. In contrast, males perceived student
misbehavior as interfering with teaching more strongly than their female counterparts. These differences may not be surprising but it may be instructive for school principals to be more conscious of these different perceptions.
Research Question #3 How do the extrinsic and intrinsic factors associated with veteran teacher job satisfaction differ for
teachers who work as special education versus general education teachers? With respect to teacher assignment, i.e. special education versus general education, only one item was
determined to differ significantly. These items included:
Item I: Rules for student behavior are consistently enforced by teachers in this school, even for students who are not in their classes.
Special education teachers reported behavior enforcement consistently among colleagues more positively than
their general education counterparts. This difference may be due to their unique training to support individual
differences and tolerate disruptive behavior.
Research Question #4 How do the extrinsic and intrinsic factors associated with veteran teacher job satisfaction differ for
teachers based on school level assignment i.e. elementary and secondary? With respect to school level differences, seven items were determined to differ significantly. These items
included:
Item H: My principal enforces school rules for student conduct and backs me up when I need it. Item M: In this school staff members are recognized for a job well done.
Item I: Rules for student behavior are consistently enforced by teachers in this school, even for
students who are not in their classes.
Item J: Most of my colleagues share my beliefs and values about what the central mission of the school should be.
Item L: There is a great deal of cooperative effort among staff members.
Item D: The level of student misbehavior in this school (such as noise, horseplay or fighting in the halls, cafeteria or student lounge) interferes with my teaching.
Item S: The amount of student tardiness and class cutting in this school interferes with my teaching.
The analysis provided significant evidence that elementary teachers on average reported greater agreement than their secondary counterparts in the following areas: (a) principal enforces rules, (b) recognized for job well done,
(c) behavior rules consistently enforced, (d) shared beliefs and values by staff, and (e) staff cooperation. In
contrast, secondary teachers on average reported greater agreement than their elementary counterparts in the following areas: (a) behavior disrupts teaching and (b) tardiness interferes with teaching.
Policy Implications
The findings of this research provide direction to school leaders and districts as they make policy decisions
concerning teacher job satisfaction. The 2003-2004 NCES survey responses of approximately 500 New Jersey teachers with five or more years experience produced the following information.
1. Administrative Support, an extrinsic motivator accounted for the primary area of importance for veteran
teacher job satisfaction. Policy implications for administrators to support teachers on an on-going basis
are necessary.
The Special Issue on Humanities and Behavioral Science © Centre for Promoting Ideas, USA
36
2. Staff Relationships, and intrinsic motivator, accounted for the second most important area of concern for
veteran teachers‟ job satisfaction. Policy implications that encourage opportunities for teachers to share positive interactions, goals and opportunities to strengthen relationships is important for school leaders to
incorporate
3. Regression analysis clearly delineated five variables that accounted for a substantial amount of the variance in overall job satisfaction. At the top of the list of the five variables was teacher recognition. The
need for teachers to become empowered and recognized for their contributions is significant and
significantly related to an individual‟s overall satisfaction. 4. Student Influences, an extrinsic motivator, accounted for the third most important area of concern for
veteran New Jersey teachers‟ job satisfaction. This category evolved to student behavior with regard to
misbehavior and tardiness patterns. Policy efforts to minimize tardiness and on-going efforts to support
teachers enforce positive school climate and promote positive student behavior is necessary for overall teacher job satisfaction. This is a particularly important issue for secondary school leaders.
Practice Implication
School leaders have many demands and much to be aware as they attempt to promote positive climates of
teaching and learning. There are practice implications that are recommended for school leaders based on this
research project.
1. Needs may differ based on gender with regard to the principal enforcing discipline in the school.
Understanding that this possibility exists, helps to support teachers.
2. School level differences exist between secondary and elementary teacher with regard to staff relationships. Identifying the areas of staff relationships that are important to foster at the individual
school levels and avoiding a one size fits all practice shift would be prudent for school leaders to explore.
3. Establishing consistent and enforceable rules for schools whereby many of the teachers shared in the
philosophy and support seems valuable at any school level to both genders and teachers with different teaching assignments. Efforts in this area are necessary to promote positive job satisfaction and retention
levels of teachers.
4. School leaders need to continue to review the career stages and the research associated in order to support and encourage teachers at every stage not just the beginning years. Constant reflection on the professional
growth necessary of teachers is recommended.
5. Due to recent legislation in New Jersey, School leaders have a challenge. They need to seek alternate ways to provide for teachers needs in the area of motivation. School wide recognition and celebration to
support a job well done as in teacher of the month certificates and teacher appreciation rewards are no
longer allowable purchases when using tax payer money. Teacher unions and donations are possible ways
to pool resources in order to continue to “feed the teachers so they don‟t eat the students” (Connor, 2000, p. 1).
Future Research
The research on teacher job satisfaction and retention patterns continues. Much of the research has been focused
on non tenured teachers or teachers in general. Although the data for this research project was collected in 2003-04 school year and analyzed for veteran New Jersey public school teachers, there is valuable information gained
that can direct future research.
1. There are a number of other variables for which data was collected by the NCES. Further refining the research focus may provide insight into more specific needs and practice reforms to improve job
satisfaction.
2. Research should be focused in New Jersey in the future around the specific needs of job satisfaction and
retention patterns based on the loss of the public funding and legislative support for several extrinsic and intrinsic needs. Follow up research to analyze the implications of the legislative changes to the New
Jersey funding laws needs to be examined. The information will serve to be of value to New Jersey as
well as other states in the process of reforming their funding policies. 3. An examination if the Schools and Staffing Survey results of the 2007-2008 NCES data as it pertains to
this research project would be a valuable means of analyzing the findings over time. Consistency of the
data would strengthen and further support the policy and practice implications outlined in this research.
The Special Issue on Humanities and Behavioral Science © Centre for Promoting Ideas, USA
37
4. Yet the differences may serve as a form of update. The data recently became available. The data obtained
using the Restricted Licensing Agreement is recommended in order to implement consistent statistical
procedures.
5. Further research in the area of a comparative study between veteran teacher nationwide and New Jersey teachers is also recommended to further explore the satisfaction level in New Jersey and the areas where
New Jersey policy and practices are working to support and sustain quality veteran teachers.
6. Research that focuses on specific and proven practices of school leaders that provide Administrative Support, fostered Staff Relationships and support teachers as Student Influences negatively affect their
teaching would be a benefit to many school leaders.
References
Alliance for Excellent Education (August 2005). Teacher attrition: a costly loss to the nation and the states,
Washington, DC: Alliance for Excellent Education: Issue Brief.
Berg, J.M, Charner-Laird, M., Fiarman, S.E., Jones, A., Qazilbash, E.K., and Moore, J. (2005). Cracking the
mold: how second-stage teachers experience their differentiated roles. Paper presented at the American
Educational Research Association Annual Conference MA: Harvard Graduate School of Education.
Billingsley, B. (2004). Special education teacher retention and attrition: a critical analysis of the research
literature. The Journal of special education, 38, (1), 39-55.
Bobek, B. (2002). Teacher Resiliency: A Key to career longevity. Clearing House, 75(4), 202. Retrieved March
12, 2007 from the ERIC database.
Bolman, L. & T. Deal (2003). Reframing Organizations, San Francisco, CA: Jossey-Bass.
Curran, B. & Goldrick L., (January 2002). Mentoring and supporting new teachers. Education Policy Studies
Division, National Governors Association Center for Best Practices, Issue Brief.
Denney, H. (February 2007). Ready or not: Paths in the Woods, http://blogs.edweek.org/hdenney/ Retrieved on
February 8, 2007.
George, D., & Mallery, P. (2001). SPSS for windows: Step by step, a simple guide and reference. Needham
Heights, MA: Allyn & Bacon,
Graziano, C. (February/March 2005). “School‟s Out,” Edutopia, 38-44.
Gritz, M. & Theobald, N.D. (1995). The effects of school district spending priorities on length of stay in
teaching. The Journal of Human Resources, 33(3), 477-512.
Haviland, S.B. (August 2004). “Job satisfaction and the gender paradox: an international perspective,” Paper
presented at the annual meeting of the American Sociological Association, Hilton San Francisco and
Renaissance Parc 55 Hotel, San Francisco, CA, retrieved July 19, 2008 from
http://www.allacademic.com/meta/p110014_index.html
Herzberg, F. (1966). Work and the nature of man, Cleveland,OH: The World Publishing Company, 130-31.
Huberman, M. (1993). The lives of teachers, New York: Teachers College Press.
Heller, D. (2004). Teachers wanted, attracting and retaining good teachers, Alexandria, VA: Association for
Supervision and Curriculum Development.
Ingersoll, R. (2007). NASSP National Convention. Houston, TX.
Johnson, S. M. & J. H. Berg, M. L. Donaldson (2005) Who stays in teaching and why: a Review of the literature
on teacher retention, MA: Harvard Graduate School of Education. Retrieved on February 7, 2007 from
http://www.gse.harvard.edu/~ngt
Johnson, S. M. (July 2006). The workplace matters, teacher quality, retention and effectiveness. Washington D.C. National Education Association Research Department. (ERIC Document Reproduction Service No. ED
495822).
Kozleski, E., Mainzer, R., & D. Deshler (August 2000). “Bright Futures For Exceptional Learners,” Teaching
Exceptional Children, 32(6), 56-69.
Lambert, L. (2003). Leadership Capacity For Lasting School Improvement, Alexandria, VA: Association for
Supervision and Curriculum Development.
Luekens, M.T., Lyter, D. M., Fox, E.E. and Chandler, K. (2004). Teacher attrition and mobility: Results from the
teacher follow up survey, 2000-01. Washington, DC: National Center for Education Statistics.
The Special Issue on Humanities and Behavioral Science © Centre for Promoting Ideas, USA
38
Maslow, A.H. (1970). Motivation and Personality, (2nd
edition), NY: Harper and Row.
McGregor, D. The human side of enterprise. New York: McGraw Hill Book Company, 1960.
Michigan Education Association. (2000). Michigan Education Association‟s Professional Development Institute:
The Educational Testing Service PATHWISE(tm) Teacher Induction Program [Brochure]. East Lansing,
MI: Author.
Minarik, M, Thorton, B & G. Perreault (2003). Systems thinking can improve teacher retention. The Clearing
House, 76, (5), 230-234.
National Commission on Teaching and America‟s Future (2003). No dream denied: the Imperative for
educational reform. A report to the Nation and the Secretary of Education, United States Department of
Education. Washington, DC: Author; distributed by U.S. GPO.
NCES (2003-04). Schools and Staffing Survey. National Center of Education Statistics. Washington DC: U.S.
Department of Education. Web site: http://nces.ed.gov/
NJDOE http://www.state.nj.us/education/index.html
Renard, L. (2003). Setting new teachers up for failure…or success. Educational Leadership, 60, (8), 62-64.
Salahu-Din, D., Persky, H., & J. Miller (2008). The Nations Report Card: Writing 2007: US Department of
Education, Institute of Education Sciences, National Center for Education Statistics. Retrieved on May
23, 2009
Scherer, M. (May 2003) Perspectives, the ex-teacher. Alexandria, VA: Association for Supervision and
Curriculum Development, 60, (8), 5.
Shann, M. (1998) “Professional commitment and satisfaction among teachers in urban Middle schools,” Journal
of Educational Research, vol. 92(2), 67-73.
Strizek, G.A., Pittsonberger, J.L., Riordan, K.E., Lyter, D.M., and Orlofsky, G. F. (2006). Characteristics of
school districts, teachers, principals, and school libraries in the United States: 2003-04 schools and
staffing survey (NCES 2006-313 revised) U.S. Department of Education, National Center for Education
Statistics. Washington, DC, U.S. Government Printing Office.
Wang, M.& J. Finn, Eds. (2000). How Small Classes Help Teachers Do Their Best, Philadelphia, PA: Temple
University Center for Research in Human Development and Education, 377.
Wilds, S. (2002). Retaining teachers: Pulaski county school system addressing national crisis. Kentucky: Pulaski
County Schools Central Office, http://www.pulaski.net Retrieved (August 2, 2004)
Williams, J. (May 2003). Why great teachers stay. Educational Leadership, 60(8), 71-74.
White, M. (October 27, 1999). Project to examine effects of mentors on teacher attrition.
Special Education Report, 5.
Yarrow, A. (2009, October). State of mind. Educational Week. Retrieved from http://www.edweek.org/ew/articles/2009/10/21/08publicagenda_ep.h29.html?tkn=USQFYSuW986Pkq50
rs9sscrkuIyIQmiOe4sD&print=1
Zachary, L. (2000). The Mentor‟s Guide, San Francisco, CA: Jossey-Bass.