tenderness, flavor, and yield assessments of … flavor, and yield assessments of dry aged beef:...
TRANSCRIPT

Tenderness, flavor, and yield assessments of dry aged beef
Principal Investigators: J. W. Savell, K. B. Harris, R. K. Miller, D. B.
Griffin, M. A. Laster, and K. L. Voges
Texas A&M University
Study Completed
May 2007
® Funded by The Beef Checkoff
Project Summary

Tenderness, flavor, and yield assessments of dry aged beef:
Project Summary
Background
Aging of fresh beef for retail and foodservice has become essential in today’s industry to meet the high demands and expectations of an exceptional eating experience by consumers each time they consume beef. The aging process involves storing meat at refrigerated temperatures to maximize palatability characteristics such as tenderness, juiciness, and flavor. With tenderness being the most important palatability attribute desired by consumers, it is apparent that aging of beef products is essential to maximize the tenderness of certain beef cuts.
Two types of aging, dry and wet, give retailers and purveyors options when deciding which aging process can most effectively benefit their individual operation. Dry aging refers to beef carcasses or wholesale cuts held at refrigerated temperatures without any type of protective packaging. On the contrary, wet aging is storing vacuum packaged beef cuts at refrigerated temperatures for an extended period of time. Beginning with the introduction of vacuum packaged boxed beef, wet aging has been used for numerous years. With great ease, boxes can be held in storage rooms and distribution warehouses in a strategic manner for any number of days, giving processors more flexibility to age meat and produce more tender, more consistent product. Although wet aging of beef represents the majority of aging systems, there are meat purveyors producing dry aged product for upscale restaurants and hotels. They must have facilities that control temperature, relative humidity, and air flow for proper dry aging to occur. Also, a greater amount of space is required for dry aging of beef products versus boxed, wet aged products.
Controlled factors are imperative for a successful dry aging establishment. As a result, there are a very small number of meat purveyors who actually participate in this type of aging process. However, there recently has been an increased interest in this process by a wider array of purveyors and retailers in the United States. There is limited scientific information in this area due to the nature of dry aging and its referral as “art” rather than “science.” Five studies – Parrish et al. (1991), Warren and Kastner (1992), Campbell et al. (2001), Sitz et al. (2006), and Smith (2007) – have investigated dry aging’s impact on flavor, tenderness, and yield assessments. However, a variety of temperatures, humidities, grades, and subprimals were used in these studies and has made it difficult to provide clear answers to questions from retailers and purveyors about this process. With the help of these five studies and the present study, a detailed fact sheet on dry aging can be prepared by the America’s Beef Producers to help educate meat purveyors and retailers on the facts associated with dry aging. Methodology Product Selection
Trained Texas A&M personnel randomly selected USDA Top Choice (n=27) and USDA Select (n=27) carcasses (2 d postmortem) from a major packing facility (USDA, 1997). Paired beef subprimals – Beef Rib, Ribeye Roll, Lip-On, Bone In (Export Style) (similar to IMPS #109E) (n=108), Beef Loin, Strip Loin, Bone In (similar to IMPS #175) (n=108), and Beef Loin, Top Sirloin Butt, Boneless (similar to IMPS #184) (n=108) as defined by Institutional Meat Purchasing Specifications (IMPS) and described by USDA (1996) and NAMP (2003) were followed through the fabrication process, vacuum packaged,

and shipped via refrigerated truck to the Rosenthal Meat Science and Technology Center at Texas A&M University. Aging Treatments
Subprimals were received (9 d postmortem) at the Rosenthal Meat Science and Technology Center and a set of six subprimals of each type and grade group (n=36) were cut into 2.54 cm steaks, vacuum packaged, and immediately frozen. These steaks served as the baseline for tenderness and flavor assessments. The remaining subprimals (n=288) (6 replications x 2 grade groups x 3 subprimals x 4 aging periods x 2 aging treatments) were randomly assigned to one of two treatments, dry or wet aging, and to one of four aging periods, 14, 21, 28, or 35 days. Each carcass side (right and left) were represented equally among the aging treatments. Subprimals assigned to the dry aging treatment were weighed initially in the bag and weighed after bag removal to determine the amount of purge in the bag. The recorded weights would later be used to calculate the amount of shrink caused by the dry aging process. The subprimals then were placed on a stainless steel rack in the aging cooler. The subprimals assigned to the wet aging treatment were weighed in the vacuum package bag and placed back in the shipping boxes for the duration of the specified aging period. All subprimals were stored in a -0.6 ± 1.8°C, 78 ± 9.3% relative humidity cooler for the allotted aging period. Cutting Tests At the end of each specific aging period, cutting tests were performed in a retail cutting room at the Rosenthal Meat Science and Technology Center at Texas A&M University. Subprimals were fabricated by experienced meat cutters employed by Texas A&M University. Retail cutting tests consisted of three phases: opening (removal of subprimal from vacuum package bag), precut trimming (any trimming necessary before retail cuts could be made, i.e. removal of dried surfaces, removal of tails on strips and ribs if necessary, chining of strip loins, etc.), and cutting (producing tray-ready retail cuts, as described by Voges et al. (2006), and removal of external and seam fat as deemed necessary on certain cuts). After each cutting test, trained Texas A&M personnel recorded weights of all fabricated components: steaks, lean trim, stew meat, stir fry, fat trim, bone, bone dust, and waste. Weights were summed to ensure that at least 99% of the initial subprimal weight was recovered. For ribs and strip loins, band saws were cleaned of bone dust after every sixth subprimal. The bone dust was weighed and averaged across the six previous subprimals that were cut on that particular saw. Boneless top sirloin butts were cut on a band saw equipped with a boneless saw blade. No bone dust was recorded for the sirloins. Using handheld stopwatches, personnel were trained to record the time (s) necessary to complete each phase of the cutting test. Total time to complete each cutting test was calculated by combining times recorded for each phase of the cutting test. Wet Aged Cutting Tests Beef Rib, Ribeye Roll, Lip-On, Bone In (Export Style) (similar to IMPS #109E) Vacuum packaged ribs were weighed in the bag (in bag weight), then taken out of the bag and reweighed (out of bag weight). In order for a purge loss value to be calculated, vacuum package bags then were washed, dried, and weighed. Using the band saw, ribs were cut into 2.54 cm-thick Beef Ribeye Steaks Lip-On BI (U.P.C. #1197). Universal Product Codes (U.P.C.), established by the Industry-Wide Cooperative Meat Identification Standards

Committee (2003), were used to identify retail cuts. If necessary, steaks were trimmed to an external fat level of 0.3 cm. Beginning from the posterior end of the rib, steak one was designated for Warner-Bratzler shear (WBS) force determination, steaks two and three selected for consumer sensory evaluation, and steaks four and five reserved as extra steaks. For the 35 day cutting only, steaks six and seven were selected for use in a preference question for sensory evaluation. Beef Loin, Strip Loin, Bone In (similar to IMPS #175) Vacuum packaged strip loins were weighed in the bag (in bag weight), then taken out of the bag and reweighed (out of bag weight). In order for a purge loss value to be calculated, vacuum package bags then were washed, dried, and weighed. Using the band saw, strip loins were chined (body of vertebra removed to a point, deleting the spinal groove) and if necessary, the tail was removed. This operation was included in the waste trimming time. The trimmed strip loin was reweighed and its weight recorded as the subprimal ready to cut weight. The chine was weighed as pre-cut trimming bone weight. Trimmed strip loins then were cut into 2.54 cm-thick Beef Top Loin Steaks (U.P.C. #1398). If necessary, steaks were trimmed to an external fat level of 0.3 cm and a tail length of no longer than 1.27 cm. Beginning from the anterior end of the strip loin, steak one was designated for Warner-Bratzler shear (WBS) force determination, steaks two and three selected for consumer sensory evaluation, and steaks four and five reserved as extra steaks. For the 35 day cutting only, steaks six and seven were selected for use in a preference question for sensory evaluation. Beef Loin, Top Sirloin Butt, Boneless (similar to IMPS #184) Vacuum packaged sirloins were weighed in the bag (in bag weight), then taken out of the bag and reweighed (out of bag weight). For a purge loss value to be calculated, vacuum package bags were washed, dried, and weighed. No pre-trimming was required and subprimals were immediately cut into 2.54 cm-thick Beef Loin Top Sirloin Steaks Bnls (U.P.C. #1422). If necessary, steaks were trimmed to an external fat level of 0.3 cm. One total cutting time was recorded for wet aged sirloins. Beginning from the posterior end of the sirloin, steak one was designated for Warner-Bratzler shear (WBS) force determination, steaks two and three selected for consumer sensory evaluation, and steaks four and five reserved as extra steaks. For the 35 day cutting only, steaks four and five were selected for use in a preference question for sensory evaluation. Steaks six and seven, if available, were reserved for extra steaks. Dry Aged Cutting Tests Beef Rib, Ribeye Roll, Lip-On, Bone In (Export Style) (similar to IMPS #109E) Dry aged ribs were weighed prior to cutting to determine an initial cut weight. Both anterior and posterior ends were faced on the band saw to remove the dried out surface tissue sometimes referred to as the “scab” and a time was recorded. The faced rib was then reweighed to get a subprimal ready-to-cut weight. The waste weight was recorded as pre-cut trimming (scab) weight. Steaks were cut in the same manner as the wet aged steaks. After steaks were cut, they were individually trimmed of dried surface tissue along the rib bone and the external surface. All dried surface tissue was classified as “waste.” Steak designation for shear force determination and sensory evaluation was the same as stated above for the wet aged steaks.

Beef Loin, Strip Loin, Bone In (similar to IMPS #175) Dry aged strip loins were weighed prior to cutting to determine an initial cut weight. Both anterior and posterior ends were faced on the band saw to remove the dried surface tissue and the chine was removed. The faces were weighed as the pre-cut trimming (scab) weight and the chine was weighed as pre-cut trimming bone weight and the time was recorded. The trimmed strip loin was reweighed and the weight was recorded as the subprimal ready-to-cut weight. Steaks were cut in the same manner as the wet aged steaks. After steaks were cut, they were individually trimmed of dried surface tissue along the external surface. All dried surface tissue was classified as “waste.” All steaks were trimmed to an external fat level of 0.3 cm and a tail length of no longer than 1.27 cm. Steak designation for shear force determination and sensory evaluation was the same as stated above for wet aged steaks. Beef Loin, Top Sirloin Butt, Boneless (similar to IMPS #184) Dry aged sirloins were weighed prior to cutting to determine an initial cut weight. Steaks were cut in the same manner as the wet aged steaks. Steaks were individually trimmed of any dried surface tissue and external fat was trimmed to 0.3 cm. Only one total cutting time was recorded for dry aged sirloins. Steak designation for shear force determination and sensory evaluation was the same as stated above for wet aged steaks. Consumer Panels Consumer panelists for rib steaks (n=80), strip loin steaks (n=91), and sirloin steaks (n=90) were recruited from the Bryan/College Station area using an existing consumer database. Upon arrival at the sensory facility, panelists were asked to fill out a demographic survey. Tables 1-3 show the demographics by individual subprimal. Steaks selected for sensory evaluation were removed from the freezer 48 hours prior to cooking and allowed to thaw in the cooler (2°C). Steaks were cooked on indoor electric grills (Hamilton Beach Indoor/Outdoor Grill, Hamilton Beach/Proctor Silex, Inc., Southern Pines, NC) and temperature was continuously monitored by the use of Omega trendicators (Omega Engineering, Inc., Stamford, CT) fitted with type-T thermocouples. Steaks were cooked to an internal temperature of 35°C, flipped, and cooked to a final temperature of 70°C. The M. longissimus thoracis from the ribeye steaks, the M. longissimus lumborum from the strip loin steaks, and the M. gluteus medius from the sirloin steaks were used for evaluation. Two 1.27 cm cube samples from steaks representing individual subprimals randomly were served to panelists while seated in individual sensory booths. Consumers first were submitted to a two-sided directional difference test in which they were given a paired sample and were asked which sample they preferred (Meilgaard, Civille, & Carr, 2007). These paired samples consisted of one thirty-five day, dry aged and one thirty-five day, wet aged sample of USDA Choice or USDA Select grade. Panelists were asked to evaluate the remaining twelve samples using 10-point scales for overall like (OLIKE)(1=dislike extremely; 10=like extremely), flavor like (FLAV)(1=dislike extremely; 10=like extremely); level of beef flavor (FLVBF)(1=extremely bland or no flavor; 10=extremely flavorful or intense), tenderness like (TEND)(1=dislike extremely; 10=like extremely), level of tenderness (LEVTEND)(1=extremely tough; 10=extremely tender), juiciness like (JUIC)(1= dislike extremely; 10=like extremely), and level of juiciness (LEVJUIC)(1=extremely dry; 10=extremely juicy). Purchase appeal (PURCH)(1=definitely would not buy; 5=definitely would buy), the last question, used a 5-point scale. After the panelists finished their evaluations of all the samples, they were asked

to complete a questionnaire to identify their individual perception of dry aged beef (Tables 4-6). Consumers were given a monetary award of $25 for their participation in this study. Warner-Bratzler Shear Force Determination Steaks designated for WBS force determination were removed from the freezer 48 hours prior to cooking and allowed to thaw in the cooler (2°C). Shear steaks were cooked and monitored in the same manner as the sensory steaks. Cooking yield percentages were determined from weights recorded before and after cooking. Total cooking time also was recorded for individual steaks. Steaks were covered and held overnight in a refrigerated cooler (2°C). Steaks were removed from the cooler and allowed to equilibrate to room temperature before coring. Six 1.27 cm cores were removed parallel to the muscle fibers from the M. longissimus thoracis from ribeye steaks, the M. longissimus lumborum from strip loin steaks, and the M. gluteus medius from sirloin steaks. Each core was sheared perpendicular to the muscle fibers using the Universal Testing System Machine (United 5STM-500, Huntington Beach, CA), equipped with a 25 lb (11.3 kg) load cell with a Warner-Bratzler shear attachment. The average of six cores was used to determine WBS force values. Statistical Analysis
The effects of aging treatment, aging period, USDA quality grade, aging treatment x aging period, aging treatment x USDA quality grade, aging period x USDA quality grade were analyzed by analysis of variance programs using SAS PROC GLM (SAS Institute, Cary, NC). Interactions that were not significant were removed from the model. The p-diff option at P < 0.05 was used to separate means when significant differences occurred. Box-Cox transformation was used to ensure normal distribution for analysis of consumer data. Strip loin consumer data was analyzed using internal temperature endpoint as a covariate. Findings Consumer Panels
Table 4 shows the exit interview for those panelists who evaluated ribeye steaks. Out of 80 panelists, 37.50% (30) of them stated they had eaten dry aged beef, 13.75% (11) had never eaten dry aged beef, and 48.75% (39) were not sure if they had eaten dry aged beef before. Twenty percent (16) of the panelists perceived dry aged beef to be better than other beef and 65.00% (52) were not sure if dry aged was better or the same as other beef. Furthermore, only 31.65% (25) of the panelists said they would spend $1.00 more per pound for dry aged beef.
Table 5 presents the exit interview for those panelists (n = 91) who evaluated the strip loin steaks and 32.22% (29) of the panelists had eaten dry aged beef before, 15.56% (14) had never eaten dry aged beef, and 52.22% (47) were not sure. Similar to the ribeye panelists, 25.56% (23) perceived dry aged beef to be better than other beef and 62.22% (56) were not sure if dry aged beef was better or the same as other beef. When asked if they would pay $1.00 more per pound for dry aged beef, 62.92% (56) of the panelists said they would not.
The exit interview for the panelists (n = 90) who participated in evaluating sirloin steaks is presented in Table 6 and 21.35% (19) of the panelists perceived dry aged beef to be better than other beef and 17.78% (16) of them thought that dry aged beef was safer to eat than other beef. Only 32.58% (29) indicated they would pay $1.00 more per pound for dry aged beef compared to other beef.

The effects of aging treatment on palatability characteristics of beef ribeye steaks are shown in Table 7. Wet aged ribeye steaks received higher (P = 0.0361) ratings than their dry aged counterparts for TEND. This is similar to Parrish et al. (1991) who found wet aged steaks had higher (P < 0.01) scores for tenderness. In the present study, no significant differences were found for OLIKE, FLAV, FLVBF, LEVTEND, JUIC, LEVJUIC, or PURCH between dry and wet aged ribeyes teaks. These results agree with studies done by Smith (2007), Sitz et al. (2006), and Parrish et al. (1991). In Smith (2007), overall like, flavor like, level of beef flavor, level of tenderness, juiciness like, level of juiciness, and purchase appeal attributes displayed no significant differences between dry and wet aged short loins. Sitz et al. (2006) found no significant differences between dry and wet aged strip loins for flavor, juiciness, or overall acceptability, Parrish et al. (1991) detected no significant differences in juiciness, flavor intensity, flavor desirability, or overall palatability between dry and wet aged ribs and loins. In the present study, the effect of aging period on palatability characteristics of beef ribeye steaks had no significant (P > 0.05) impact on any of the palatability attributes. However, TEND and LEVTEND ratings tended to increase with increased aging time. The effects of USDA quality grade on palatability characteristics of USDA Choice and USDA Select ribeye steaks are also shown in Table 7. For OLIKE, JUIC, and LEVJUIC, USDA Choice ribeye steaks were rated higher (P < 0.05) than USDA Select ribeye steaks. This is also similar to Smith (2007) where USDA Choice steaks rated significantly higher for overall like, juiciness, and level of juiciness when compared to USDA Select steaks.
Parrish et al. (1991) also found significant differences between USDA Choice and USDA Select ribeye steaks for juiciness and overall palatability. In this study, one significant interaction, aging day x aging treatment, was found for OLIKE and is presented in Figure 1. Consumers rated 14 d wet aged ribeye steaks and 35 d dry aged ribeye steaks higher (P = 0.0478) than 14 d dry aged ribeye steaks.
Table 8 shows the effect of aging treatment, aging period, and USDA quality grade on the palatability characteristics of beef steaks from strip loins. Although there were no significant differences between aging treatments for any of the attributes, wet aged strip loin steaks had higher ratings for FLVBF, TEND, LEVTEND, JUIC, and LEVJUIC when compared to dry aged strip loin steaks. Aging period also had no significant effect on the attributes; however, TEND and LEVTEND ratings tended to increase with increased aging time. USDA quality grade had a significant impact on the ratings of many attributes. USDA Choice strip loin steaks rated higher (P < 0.05) for OLIKE, FLAV, FLVBF, JUIC, and LEVJUIC than USDA Select strip loin steaks. As stated earlier, these data are similar to Smith (2007) and Parrish et al. (1991) who found significantly higher ratings for USDA Choice steaks when compared to USDA Select steaks for many sensory attributes. Contrarily, PURCH ratings for USDA Select strip loin steaks were higher (P = 0.0106) than USDA Choice steaks.
Effects of aging treatment, aging period, and USDA quality grade on the palatability characteristics of beef sirloin steaks from sirloins are shown in Table 9. No main effects significantly impacted palatability characteristics evaluated by the panelists. Although not significant, USDA Choice sirloin steaks had higher ratings than USDA Select sirloin steaks for the following attributes: OLIKE, FLAV, TEND, LEVTEND, JUIC, and LEVJUIC. Table 10 contains frequencies portraying consumers’ preference of aging treatment using a 2-sided directional difference test. Although there were no significant differences, consumers tended to prefer the wet aged ribeye and sirloin steaks to the dry aged steaks. Conversely, dry aged strip loin steaks tended to be preferred over the wet aged steaks.

Table 11 presents least squares means for cooking temperatures, cooking times, and cooking yields from consumer evaluations of beef ribeye, strip loin, and sirloin steaks. No main effects were significant for beef ribeye steaks. For strip loin steaks, the effects of aging period were significant on cooking time of steaks. 35 d aged strip loin steaks had the shortest (P = 0.0183) cooking time when compared to other aging days. One significant interaction, aging day x USDA quality grade, was found for total cooking time (Figure 2) in strip loin steaks. 35 d USDA Select strip loin steaks had significantly shorter cooking times when compared to the other grade and aging day combinations. Aging treatment had significantly affected total cooking time and cooking yield in sirloin steaks. Dry aged sirloin steaks had higher (P = 0.0005) cooking yield percentages and shorter (P < 0.0001) cooking times when compared to wet aged sirloin steaks. Likewise, Warren and Kastner (1992) found, although not significantly different, cooking time and cooking loss percentage were lowest for dry aged samples when compared to vacuum aged strip loin samples. Figure 3 presents a significant interaction between aging treatment and USDA quality grade for total cooking time for sirloin steaks. Similarly to the strip loins, dry aged USDA Choice and dry aged USDA Select sirloin steaks had shorter (P = 0.0285) cooking times than their wet aged counterparts. Warner-Bratzler shear force determination Least squares means for cooking temperatures, cooking times, cooking yields, and WBS values for beef steaks assigned to shear force determination are presented in Table 12. Aging treatment significantly impacted WBS values of ribeye steaks. Wet aged ribeye steaks had lower (P = 0.0064) WBS values than dry aged ribeye steaks. Furthermore, USDA quality grade significantly affected total cooking time for ribeye steaks. USDA Choice ribeye steaks had longer (P = 0.0133) cooking times than USDA Select ribeye steaks.
Cooking yield percentages of strip loin steaks were significantly impacted by aging treatment. Dry aged strip loin steaks had higher (P = 0.0009) cooking yield percentages compared to wet aged strip loin steaks. Figure 4 shows the least squares means for total cooking time of strip loin steaks. 35 d USDA Select strip loin steaks had shorter (P = 0.0311) cooking times than other grade and aging day combinations. Also, 14 d USDA Select strip loin steaks had the longest cooking time when compared to other combinations.
Aging treatment and aging period for sirloin steaks significantly affected total cooking time, cooking yield, and WBS values. Wet aged sirloin steaks had longer (P = 0.0003) cooking times, higher (P = 0.0145) WBS values, and lower (P = 0.0235) cooking yield percentages when compared to dry aged sirloin steaks. The longer cooking times and lower cooking yield percentages for wet aged sirloin steaks mimics results from sirloin steaks cooked for consumer evaluation stated earlier. Moreover, 14 d sirloin steaks had higher (P = 0.0012) WBS values than any other aging day. One significant interaction, aging day x USDA quality grade, was found for WBS values in sirloin steaks and is presented in Figure 5. 14 d USDA Select steaks had the highest (P = 0.0020) WBS values and 28 d USDA Choice steaks had the lowest WBS values compared to other aging day and USDA grade combinations. Aging 21 and 35 d had similar effects on WBS values in sirloins, therefore aging a minimum of 21 days would be beneficial to increase tenderness of sirloin steaks. Least squares means of palatability characteristics for baseline ribeye steaks evaluated by consumers is shown in Table 13. USDA Choice ribeye steaks received higher (P < 0.05) ratings for LEVTEND, JUIC, and LEVJUIC compared to USDA Select ribeye steaks. However, PURCH ratings were higher (P = 0.0163) for USDA Select ribeye steaks than USDA Choice ribeye steaks. This is similar to information presented earlier on aged ribeye
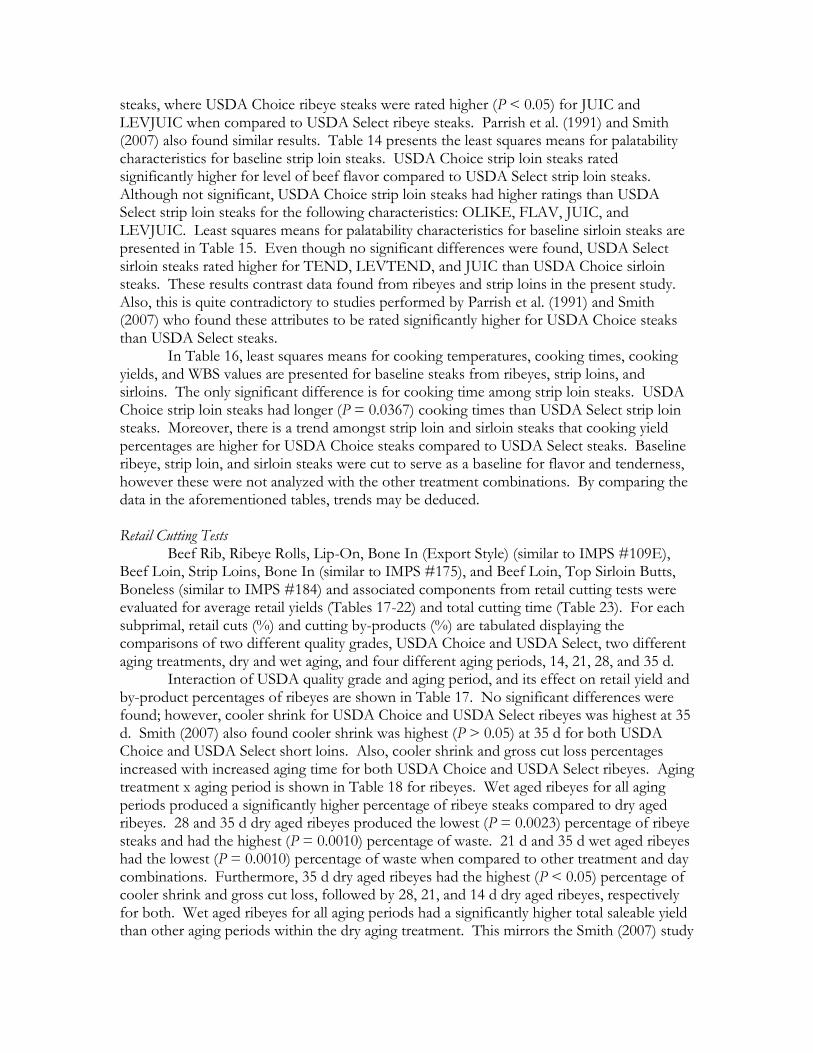
steaks, where USDA Choice ribeye steaks were rated higher (P < 0.05) for JUIC and LEVJUIC when compared to USDA Select ribeye steaks. Parrish et al. (1991) and Smith (2007) also found similar results. Table 14 presents the least squares means for palatability characteristics for baseline strip loin steaks. USDA Choice strip loin steaks rated significantly higher for level of beef flavor compared to USDA Select strip loin steaks. Although not significant, USDA Choice strip loin steaks had higher ratings than USDA Select strip loin steaks for the following characteristics: OLIKE, FLAV, JUIC, and LEVJUIC. Least squares means for palatability characteristics for baseline sirloin steaks are presented in Table 15. Even though no significant differences were found, USDA Select sirloin steaks rated higher for TEND, LEVTEND, and JUIC than USDA Choice sirloin steaks. These results contrast data found from ribeyes and strip loins in the present study. Also, this is quite contradictory to studies performed by Parrish et al. (1991) and Smith (2007) who found these attributes to be rated significantly higher for USDA Choice steaks than USDA Select steaks.
In Table 16, least squares means for cooking temperatures, cooking times, cooking yields, and WBS values are presented for baseline steaks from ribeyes, strip loins, and sirloins. The only significant difference is for cooking time among strip loin steaks. USDA Choice strip loin steaks had longer (P = 0.0367) cooking times than USDA Select strip loin steaks. Moreover, there is a trend amongst strip loin and sirloin steaks that cooking yield percentages are higher for USDA Choice steaks compared to USDA Select steaks. Baseline ribeye, strip loin, and sirloin steaks were cut to serve as a baseline for flavor and tenderness, however these were not analyzed with the other treatment combinations. By comparing the data in the aforementioned tables, trends may be deduced. Retail Cutting Tests Beef Rib, Ribeye Rolls, Lip-On, Bone In (Export Style) (similar to IMPS #109E), Beef Loin, Strip Loins, Bone In (similar to IMPS #175), and Beef Loin, Top Sirloin Butts, Boneless (similar to IMPS #184) and associated components from retail cutting tests were evaluated for average retail yields (Tables 17-22) and total cutting time (Table 23). For each subprimal, retail cuts (%) and cutting by-products (%) are tabulated displaying the comparisons of two different quality grades, USDA Choice and USDA Select, two different aging treatments, dry and wet aging, and four different aging periods, 14, 21, 28, and 35 d. Interaction of USDA quality grade and aging period, and its effect on retail yield and by-product percentages of ribeyes are shown in Table 17. No significant differences were found; however, cooler shrink for USDA Choice and USDA Select ribeyes was highest at 35 d. Smith (2007) also found cooler shrink was highest (P > 0.05) at 35 d for both USDA Choice and USDA Select short loins. Also, cooler shrink and gross cut loss percentages increased with increased aging time for both USDA Choice and USDA Select ribeyes. Aging treatment x aging period is shown in Table 18 for ribeyes. Wet aged ribeyes for all aging periods produced a significantly higher percentage of ribeye steaks compared to dry aged ribeyes. 28 and 35 d dry aged ribeyes produced the lowest (P = 0.0023) percentage of ribeye steaks and had the highest (P = 0.0010) percentage of waste. 21 d and 35 d wet aged ribeyes had the lowest (P = 0.0010) percentage of waste when compared to other treatment and day combinations. Furthermore, 35 d dry aged ribeyes had the highest (P < 0.05) percentage of cooler shrink and gross cut loss, followed by 28, 21, and 14 d dry aged ribeyes, respectively for both. Wet aged ribeyes for all aging periods had a significantly higher total saleable yield than other aging periods within the dry aging treatment. This mirrors the Smith (2007) study

in that the wet aged short loins for all four aging periods had significantly higher total saleable yield than their dry aged counterparts.
Least squares means of retail yield percentages for fabrication of strip loins stratified by USDA quality grade x aging period is shown in Table 19. USDA Choice, 14 d strip loins had the lowest (P = 0.0468) gross cut loss compared to other grade and aging day combinations. Although not significant, cooler shrink increased with each aging period for both USDA Choice and USDA Select strip loins, supporting the previous ribeye results. Table 20 presents aging treatment x aging period for strip loins. Interestingly, 28 d, dry aged strip loins displayed the highest (P = 0.0345) percentage of waste. Also, 28 and 35 d, dry aged strip loins possessed the highest (P < 0.0001) percentage of cooler shrink. All dry aged products had a greater (P < 0.05) amount of cooler shrink compared to their wet aged counterparts. This also supports ribeye results found in this study, as well as the study by Smith (2007). Furthermore, 28 and 35 d, dry aged strip loins had the highest (P < 0.0001) gross cut loss compared to other day and aging treatment combinations.
The interaction of USDA quality grade and aging period and its effect on retail yield and by-product percentages of sirloins is shown in Table 21. Although not significant, gross cut loss and cooler shrink percentages increased with increased aging times for both USDA Choice and USDA Select sirloins. This follows the same trend shown in the ribeye results. Also, the percentage of steaks from USDA Choice sirloins decreased as aging time increased. In Table 22, aging treatment x aging period is presented for sirloins. Similarly to the strip loin results, waste percentage is highest (P = 0.0212) for 28 d, dry aged sirloins. Furthermore, 35 d dry aged sirloins had the highest (P < 0.05) percentage of cooler shrink and gross cut loss, followed by 28, 21, and 14 d dry aged sirloins, respectively for both. These results mimic the aging treatment x aging period presented for ribeyes (Table 18). Moreover, 14 and 21 d, wet aged sirloins had the highest (P = 0.0011) percentage of total saleable yield. On the other hand, 28 and 35 d, dry aged sirloins had the significantly lowest percentage of total saleable yield. All wet aged product for ribeyes, strip loins, and sirloins resulted in higher (P < 0.05) percentages of total saleable yield when compared to their dry aged counterparts, which is identical to Smith (2007). Effects of aging treatment, aging period, and USDA quality grade on total cutting times of ribeyes, strip loins, and sirloins are shown in Table 23. As expected, total processing time for dry aged products was greater (P < 0.0001) compared to wet aged products for all three subprimals. These results are supported through the research of Smith (2007). Dry aging will inevitably cause the surface tissue to dry out, creating what is referred to as waste or “scab.” This is undesirable and is trimmed away, causing increased fabrication times, and this excess time associated with processing dry aged product must be expected when producing dry aged product. Furthermore, aging period had a significant effect on the total cutting time for ribeyes and sirloins. 14 and 21 d ribeyes had a greater (P = 0.0005) amount of processing time compared to 28 and 35 d product. These results contradict research of Smith (2007), which found 28 and 35 d short loins to have greater processing times than 14 or 21d short loins. In the present study, 28 d sirloins required the shortest (P = 0.0199) processing time compared to other sirloin aging days. One significant interaction, aging day x USDA quality grade, was found for total cutting time of strip loins and is shown in Figure 6. 14 d USDA Choice strip loins took the greatest (P = 0.0021) amount of time to process. 14 and 28 d, USDA Select and 28 and 35 d USDA Choice strip loins had the shortest (P < 0.05) total cutting time when compared to other aging day and quality grade combinations.

Implications WBS values and consumer ratings show wet aged ribeye steaks to be more tender
than their dry aged counterparts. WBS values for ribeyes and sirloins decreased with increased aging time. Consumer ratings for tenderness like increased with increased aging time for all three subprimals. No significant differences were found for consumer evaluation of sirloins. Choice ribeye and strip steaks received higher consumer ratings for overall like and juiciness attributes when compared to Select steaks. Cutting tests were performed at the end of each aging period to determine retail yields and processing times. Retail cutting tests showed dry aged subprimals had lower total saleable yield percentages and increased processing times compared to wet aged subprimals. Cooler shrink and gross cut loss percentages increased with increased aging time for both Choice and Select subprimals.

Table 1
Demographic information of panelists for ribeye evaluation Age
% (n)
≤21 5.00% (4)
22-29 33.75% (27)
30-39 10.00% (8)
40-49 21.25% (17)
50-59 18.75% (15)
≥60 11.25% (9)
Income
% (n)
<$20,000 30.38% (24)
$20,000-29,000 2.53% (2)
$30,000-39,000 10.13% (8)
$40,000-49,000 5.06% (4)
$50,000-59,000 5.06% (4)
≥$60,000 46.84% (37)
Household size
% (n)
1
21.25% (17)
2
46.25% (37)
3
15.00% (12)
4
11.25% (9)
5
2.50% (2)
≥6
3.75% (3)
Work status
% (n)
Not employed
15.00% (12)
Part-time
60.00% (48)
Full-time
11.25% (9)
Student 13.75% (11)
Gender
% (n)
Male
51.25% (41)
Female 48.75% (39)
Nationality
% (n)
White
85.00% (68)
African American
1.25% (1)
Hispanic
7.50% (6)
American Indian
2.50% (2)
Asian 3.75% (3)
In-home beef consumptiona
% (n)
Never
−
1
6.25% (5)
2
10.00% (8)
3
13.75% (11)
4
20.00% (16)
≥5
50.00% (40)
Away from home beef consumptiona
% (n)
Never
3.75% (3)
1
27.50% (22)
2
28.75% (23)
3
20.00% (16)
4
6.25% (5)
≥5
13.75% (11)
Preferred degree of doneness
% (n)
Rare
5.00% (4)
Medium Rare
26.25% (21)
Medium
32.50% (26)
Medium Well 23.75% (19)
Well Done
12.50% (10)
a Consumption was reported as the number of times consumed per week.
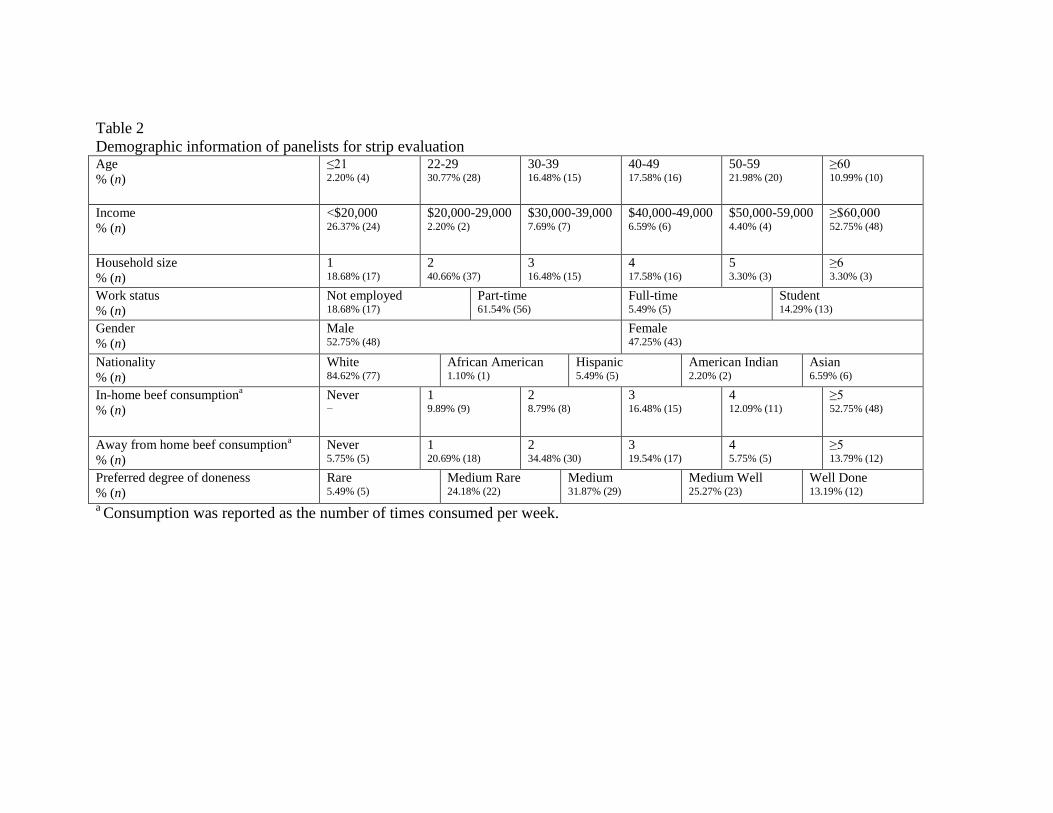
Table 2
Demographic information of panelists for strip evaluation Age
% (n)
≤21 2.20% (4)
22-29 30.77% (28)
30-39 16.48% (15)
40-49 17.58% (16)
50-59 21.98% (20)
≥60 10.99% (10)
Income
% (n)
<$20,000 26.37% (24)
$20,000-29,000 2.20% (2)
$30,000-39,000 7.69% (7)
$40,000-49,000 6.59% (6)
$50,000-59,000 4.40% (4)
≥$60,000 52.75% (48)
Household size
% (n)
1
18.68% (17)
2
40.66% (37)
3
16.48% (15)
4
17.58% (16)
5
3.30% (3)
≥6
3.30% (3)
Work status
% (n)
Not employed
18.68% (17)
Part-time
61.54% (56)
Full-time
5.49% (5)
Student 14.29% (13)
Gender
% (n)
Male
52.75% (48)
Female 47.25% (43)
Nationality
% (n)
White
84.62% (77)
African American
1.10% (1)
Hispanic
5.49% (5)
American Indian
2.20% (2)
Asian 6.59% (6)
In-home beef consumptiona
% (n)
Never
−
1
9.89% (9)
2
8.79% (8)
3
16.48% (15)
4
12.09% (11)
≥5
52.75% (48)
Away from home beef consumptiona
% (n)
Never
5.75% (5)
1
20.69% (18)
2
34.48% (30)
3
19.54% (17)
4 5.75% (5)
≥5
13.79% (12)
Preferred degree of doneness
% (n)
Rare
5.49% (5)
Medium Rare
24.18% (22)
Medium
31.87% (29)
Medium Well 25.27% (23)
Well Done
13.19% (12)
a Consumption was reported as the number of times consumed per week.

Table 3
Demographic information of panelists for sirloin evaluation Age
% (n)
≤21 5.56% (5)
22-29 28.89% (26)
30-39 17.78% (16)
40-49 16.67% (15)
50-59 21.11% (19)
≥60 10.00% (9)
Income
% (n)
<$20,000 25.84% (23)
$20,000-29,000 3.37% (3)
$30,000-39,000 7.87% (7)
$40,000-49,000 5.62% (5)
$50,000-59,000 4.49% (4)
≥$60,000 52.81% (47)
Household size
% (n)
1
14.61% (13)
2
40.45% (36)
3
21.35% (19)
4
16.85% (15)
5
2.25% (2)
≥6
4.49% (4)
Work status
% (n)
Not employed
14.44% (13)
Part-time
60.00% (54)
Full-time
8.89% (8)
Student 16.67% (15)
Gender
% (n)
Male
53.33% (48)
Female 46.67% (42)
Nationality
% (n)
White
83.33% (75)
African American
1.11% (1)
Hispanic
6.67% (6)
American Indian
2.22% (2)
Asian 6.67% (6)
In-home beef consumptiona
% (n)
Never
−
1
6.67% (6)
2
13.33% (12)
3
13.33% (12)
4
15.56% (14)
≥5
51.11% (46)
Away from home beef consumptiona
% (n)
Never
3.53% (3)
1
25.88% (22)
2
31.76% (27)
3
16.47% (14)
4 9.41% (8)
≥5
12.94% (11)
Preferred degree of doneness
% (n)
Rare
5.62% (5)
Medium Rare
21.35% (19)
Medium
34.83% (31)
Medium Well 26.97% (24)
Well Done
11.24% (10)
a Consumption was reported as the number of times consumed per week.

Table 4
Exit interview of panelists for ribeye evaluation Are you familiar with the term aging?
% (n)
Yes
80.00% (64)
No
20.00% (16)
Is aging a positive/negative term?
% (n)
Positive
83.54% (66)
Negative
16.46% (13)
Have you ever eaten dry aged beef?
% (n)
Yes
37.50% (30)
No
13.75% (11)
Not Sure
48.75% (39)
Perceptions of dry aged beef.
% (n)
Better Than Other Beef
20.00% (16)
Same as Other Beef
8.75% (7)
Not Sure
65.00% (52)
Other
6.25% (5)
Meat/Food safety of dry aged beef.
% (n)
Safer
7.50% (6)
Less Safe
6.25% (5)
Same as Other Beef
40.00% (32)
Not Sure
46.25% (37)
Would you spend a $1.00 more per
pound for dry aged beef?
% (n)
Yes
31.65% (25)
No
68.35% (54)
Table 5
Exit interview of panelists for strip evaluation Are you familiar with the term aging?
% (n)
Yes
80.00% (72)
No
20.00% (18)
Is aging a positive/negative term?
% (n)
Positive
88.37% (76)
Negative
11.63% (10)
Have you ever eaten dry aged beef?
% (n)
Yes
32.22% (29)
No
15.56% (14)
Not Sure
52.22% (47)
Perceptions of dry aged beef.
% (n)
Better Than Other Beef
25.56% (23)
Same as Other Beef
8.89% (8)
Not Sure
62.22% (56)
Other
3.33% (3)
Meat/Food safety of dry aged beef.
% (n)
Safer
8.99% (8)
Less Safe
11.24% (10)
Same as Other Beef
30.34% (27)
Not Sure
49.44% (44)
Would you spend a $1.00 more per
pound for dry aged beef?
% (n)
Yes
37.08% (33)
No
62.92% (56)


Table 6
Exit interview of panelists for sirloin evaluation Are you familiar with the term aging?
% (n)
Yes
82.22% (74)
No
17.78% (16)
Is aging a positive/negative term?
% (n)
Positive
86.36% (76)
Negative
13.64% (12)
Have you ever eaten dry aged beef?
% (n)
Yes
34.44% (31)
No
12.22% (11)
Not Sure
53.33% (48)
Perceptions of dry aged beef.
% (n)
Better Than Other Beef
21.35% (19)
Same as Other Beef
7.87% (7)
Not Sure
68.54% (61)
Other
2.25% (2)
Meat/Food safety of dry aged beef.
% (n)
Safer
17.78% (16)
Less Safe
8.89% (8)
Same as Other Beef
28.89% (26)
Not Sure
43.33% (39)
Would you spend a $1.00 more per
pound for dry aged beef?
% (n)
Yes
32.58% (29)
No
67.42% (60)

Table 7
Least squares means of palatability characteristics of beef steaks from ribeyes for consumer evaluation stratified
by aging treatment, aging period, and USDA quality grade
Main effects
Overall
Liked
Flavor
Liked
Level of
Beef
Flavore
Tenderness
Liked
Level of
Tendernessf
Juiciness
Liked
Level of
Juicinessg Purchase
h
Aging treatment
Dry 6.7 6.6 6.6 7.0b 7.0 6.3 4.2 2.6
Wet 6.9 6.7 6.7 7.3a 7.3 6.4 4.2 2.5
P > F 0.1963 0.6365 0.5108 0.0361 0.0682 0.4509 0.9737 0.2199
Aging period
14 6.8 6.8 6.9 7.0 7.0 6.4 4.3 2.6
21 6.7 6.6 6.5 7.0 7.0 6.2 4.1 2.5
28 6.8 6.6 6.6 7.1 7.1 6.4 4.3 2.5
35 6.9 6.6 6.7 7.5 7.5 6.6 4.3 2.4
P > F 0.8748 0.8852 0.5265 0.3363 0.3766 0.6574 0.7287 0.8238
Quality grade
Choice 7.0a 6.8 6.8 7.3 7.3 6.6a 4.4a 2.4
Select 6.7b 6.6 6.6 7.1 7.0 6.2b 4.1b 2.6
P > F 0.0474 0.3372 0.3030 0.2785 0.2627 0.0426 0.0499 0.1819
RMSEc 3.44 3.32 3.65 3.79 3.76 2.68 1.30 0.12
Means within the same column lacking a common letter (a-b) differ (P < 0.05). c RMSE = Root Mean Square Error from Analysis of Variance.
d 10=Like extremely; 1=dislike extremely.
e 10=Extremely flavorful or intense; 1=extremely bland or no flavor.
f 10=Extremely tender; 1=extremely tough.
g10=Extremely juicy; 1=extremely dry.
h 5=Definitely would buy; 1=definitely would not buy.

Table 8
Least squares means of palatability characteristics of beef steaks from strip loins for consumer evaluation
stratified by aging treatment, aging period, and USDA quality grade Main effects
Overall
Liked
Flavor
Liked
Level of
Beef
Flavore
Tenderness
Liked
Level of
Tendernessf
Juiciness
Liked
Level of
Juicinessg Purchase
h
Aging treatment
Dry 7.0 6.9 6.8 7.3 7.3 6.6 6.6 2.3
Wet 7.0 6.9 6.9 7.5 7.5 6.8 6.7 2.3
P > F 0.6520 0.7649 0.6197 0.0727 0.0945 0.2706 0.4252 0.4734
Aging period
14 6.8 6.9 6.8 7.2 7.2 6.6 6.5 2.4
21 7.2 7.1 6.9 7.4 7.4 6.7 6.6 2.2
28 7.1 6.9 6.9 7.4 7.4 6.8 6.7 2.4
35 7.0 6.8 6.7 7.5 7.6 6.8 6.7 2.3
P > F 0.5839 0.3790 0.6096 0.5201 0.4210 0.8613 0.7627 0.5488
Quality grade
Choice 7.2a 7.1a 7.0a 7.5 7.5 6.9a 6.9a 2.2b
Select 6.8b 6.7b 6.7b 7.2 7.2 6.5b 6.4b 2.4a
P > F 0.0365 0.0311 0.0434 0.1665 0.1150 0.0100 0.0124 0.0106
RMSEc 3.70 3.82 3.80 3.99 4.01 3.29 3.25 0.03
Means within the same column lacking a common letter (a-b) differ (P < 0.05). cRMSE = Root Mean Square Error from Analysis of Variance.
d 10=Like extremely; 1=dislike extremely.
e 10=Extremely flavorful or intense; 1=extremely bland or no flavor.
f 10=Extremely tender; 1=extremely tough.
g10=Extremely juicy; 1=extremely dry.
h 5=Definitely would buy; 1=definitely would not buy.

Table 9
Least squares means of palatability characteristics of beef steaks from sirloins for consumer evaluation stratified
by aging treatment, aging period, and USDA quality grade
Main effects Overall
Likeb
Flavor
Likeb
Level of
Beef
Flavorc
Tenderness
Likeb
Level of
Tendernessd
Juiciness
Likeb
Level of
Juicinesse Purchase
f
Aging treatment
Dry 6.1 6.2 6.3 6.0 5.9 5.5 5.2 2.8
Wet 6.1 6.2 6.3 6.0 6.0 5.6 5.3 2.8
P > F 0.7013 0.7793 0.7434 0.6625 0.5583 0.7888 0.4022 0.8766
Aging period
14 5.9 6.1 6.1 5.5 5.4 5.5 5.2 2.9
21 6.0 6.1 6.2 6.0 5.9 5.5 5.2 2.8
28 6.3 6.4 6.5 6.3 6.2 5.5 5.2 2.7
35 6.2 6.3 6.3 6.3 6.2 5.6 5.3 2.7
P > F 0.3942 0.4165 0.3246 0.0540 0.0780 0.9123 0.9211 0.4037
Quality grade
Choice 6.2 6.3 6.3 6.1 6.0 5.7 5.3 2.7
Select 6.0 6.2 6.3 5.9 5.8 5.4 5.1 2.9
P > F 0.3555 0.5097 0.9851 0.3540 0.5775 0.2299 0.2923 0.1263
RMSEa 2.85 2.84 2.84 2.51 2.15 1.83 1.39 0.27
aRMSE = Root Mean Square Error from Analysis of Variance.
b 10=Like extremely; 1=dislike extremely.
c 10=Extremely flavorful or intense; 1=extremely bland or no flavor.
d 10=Extremely tender; 1=extremely tough.
e 10=Extremely juicy; 1=extremely dry.
f 5=Definitely would buy; 1=definitely would not buy

Table 10
Frequency of consumer preference of aging treatment when submitted to
a 2-sided directional difference test. Samples evaluated were 35 day aged,
USDA Choice or USDA Select beef steaks from ribeyes, strip
loins, and sirloins
Aging Treatment Ribeye Strip
Loin
Sirloin
Dry 45.00%
(36)
53.85%
(49)
44.44%
(40)
Wet 55.00%
(44)
46.15%
(42)
55.56%
(50)
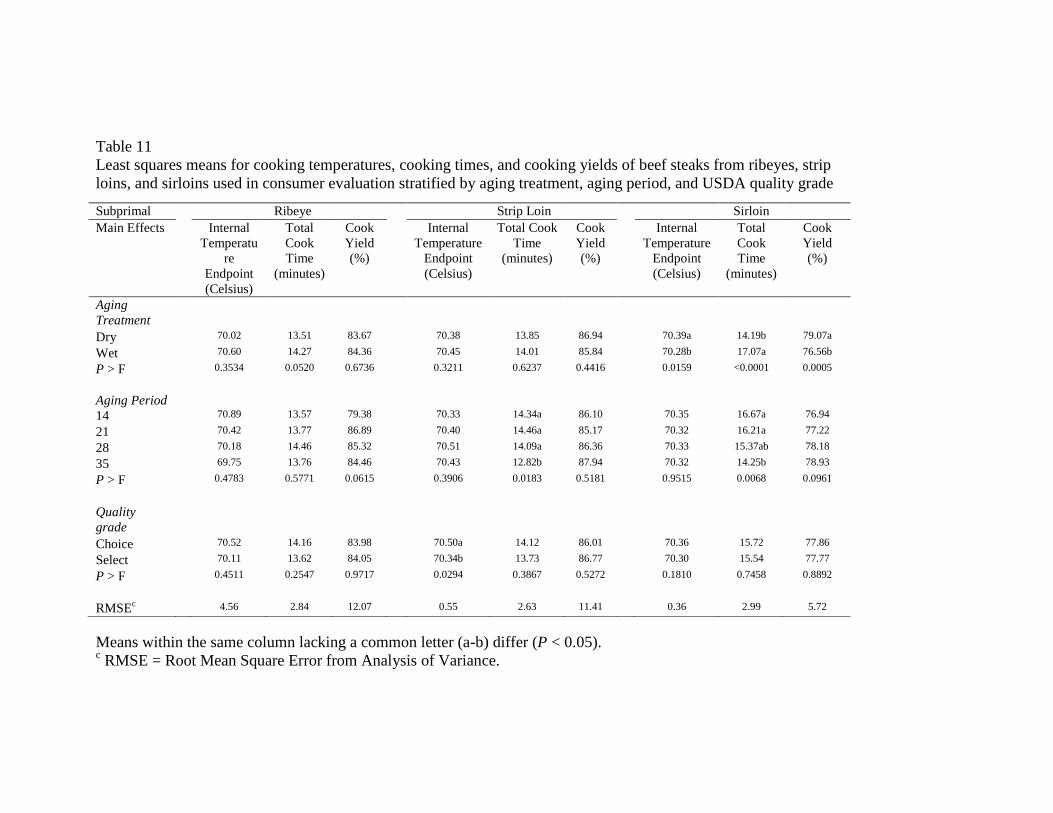
Table 11
Least squares means for cooking temperatures, cooking times, and cooking yields of beef steaks from ribeyes, strip
loins, and sirloins used in consumer evaluation stratified by aging treatment, aging period, and USDA quality grade
Means within the same column lacking a common letter (a-b) differ (P < 0.05). c RMSE = Root Mean Square Error from Analysis of Variance.
Subprimal Ribeye Strip Loin Sirloin
Main Effects Internal
Temperatu
re
Endpoint
(Celsius)
Total
Cook
Time
(minutes)
Cook
Yield
(%)
Internal
Temperature
Endpoint
(Celsius)
Total Cook
Time
(minutes)
Cook
Yield
(%)
Internal
Temperature
Endpoint
(Celsius)
Total
Cook
Time
(minutes)
Cook
Yield
(%)
Aging
Treatment
Dry 70.02 13.51 83.67 70.38 13.85 86.94 70.39a 14.19b 79.07a
Wet 70.60 14.27 84.36 70.45 14.01 85.84 70.28b 17.07a 76.56b
P > F 0.3534 0.0520 0.6736 0.3211 0.6237 0.4416 0.0159 <0.0001 0.0005
Aging Period
14 70.89 13.57 79.38 70.33 14.34a 86.10 70.35 16.67a 76.94
21 70.42 13.77 86.89 70.40 14.46a 85.17 70.32 16.21a 77.22
28 70.18 14.46 85.32 70.51 14.09a 86.36 70.33 15.37ab 78.18
35 69.75 13.76 84.46 70.43 12.82b 87.94 70.32 14.25b 78.93
P > F 0.4783 0.5771 0.0615 0.3906 0.0183 0.5181 0.9515 0.0068 0.0961
Quality
grade
Choice 70.52 14.16 83.98 70.50a 14.12 86.01 70.36 15.72 77.86
Select 70.11 13.62 84.05 70.34b 13.73 86.77 70.30 15.54 77.77
P > F 0.4511 0.2547 0.9717 0.0294 0.3867 0.5272 0.1810 0.7458 0.8892
RMSEc 4.56 2.84 12.07 0.55 2.63 11.41 0.36 2.99 5.72

Table 12
Least squares means for cooking temperatures, cooking times, cooking yields, and WBS values of beef steaks from
ribeyes, strip loins, and sirloins used for Warner-Bratzler shear (WBS) evaluation stratified by aging treatment, aging
period, and USDA quality grade
Means within the same column lacking a common letter (a-b) differ (P < 0.05). c RMSE = Root Mean Square Error from Analysis of Variance.
Subprimal Ribeye Strip
Loin
Sirloin
Main Effects Internal
Temperature
Endpoint
(Celsius)
Total
Cook
Time
(minutes)
Cook
Yield
(%)
WBS
(N)
Internal
Temperature
Endpoint
(Celsius)
Total
Cook
Time
(minutes)
Cook
Yield
(%)
WBS
(N)
Internal
Temperature
Endpoint
(Celsius)
Total
Cook
Time
(minutes)
Cook
Yield
(%)
WBS
(N)
Aging
Treatment
Dry 70.50 12.57 89.37 18.32a 70.44 12.06 91.78a 17.46 70.28 12.56b 84.69a 20.38b
Wet 70.44 12.37 90.23 16.35b 70.43 12.75 88.96b 18.04 70.29 15.19a 80.57b 22.27a
P > F 0.6641 0.7504 0.4952 0.0064 0.9016 0.2924 0.0009 0.2998 0.9525 0.0003 0.0235 0.0145
Aging Period
14 70.70 12.00 88.95 18.33 70.40 13.71a 89.61 18.72 70.35 14.92 82.99 25.59a
21 70.51 12.96 89.39 17.19 70.34 12.21ab 90.19 17.79 70.22 14.73 80.96 20.65b
28 70.24 12.25 91.66 17.71 70.62 12.88a 90.47 17.03 70.23 12.50 84.77 19.61b
35 70.43 12.67 89.20 16.11 70.39 10.83b 91.20 17.46 70.34 13.36 81.81 19.44b
P > F 0.0852 0.6378 0.2623 0.1724 0.5175 0.0117 0.3803 0.3618 0.5354 0.1669 0.2118 0.0012
Quality grade
Choice 70.49 13.19a 89.56 16.80 70.34 12.73 90.34 17.69 70.32 13.38 83.06 20.82
Select 70.45 11.75b 90.04 17.87 70.53 12.08 90.40 17.81 70.25 14.38 82.21 21.83
P > F 0.7488 0.0133 0.6538 0.1410 0.1840 0.2884 0.9283 0.8688 0.4410 0.2622 0.5249 0.3855
RMSEc 0.72 2.93 6.15 3.38 0.57 3.16 3.89 2.72 0.51 3.23 8.60 3.64

Table 13
Least squares means for palatability characteristics of baseline steaks from ribeyes for consumer evaluation Main effects
Overall
Liked
Flavor
Liked
Level of
Beef
Flavore
Tenderness
Liked
Level of
Tendernessf
Juiciness
Liked
Level of
Juicinessg Purchase
h
Quality Grade
Choice 6.3 6.5 6.7 6.2 6.3a 6.8a 6.5a 2.6b
Select 5.4 5.6 5.8 5.1 5.1b 5.1b 4.6b 3.4a
P > F 0.1145 0.1446 0.1377 0.0520 0.0288 0.0063 0.0025 0.0163
RMSEc 3.66 3.60 3.90 3.80 3.81 2.77 1.38 0.11
Means within the same column lacking a common letter (a-b) differ (P < 0.05). c RMSE = Root Mean Square Error from Analysis of Variance.
d 10=Like extremely; 1=dislike extremely.
e 10=Extremely flavorful or intense; 1=extremely bland or no flavor.
f 10=Extremely tender; 1=extremely tough.
g 10=Extremely juicy; 1=extremely dry.
h 5=Definitely would buy; 1=definitely would not buy.

Table 14
Least squares means for palatability characteristics of baseline steaks from strip loins for consumer evaluation Main effects
Overall
Liked
Flavor
Liked
Level of
Beef
Flavore
Tenderness
Liked
Level of
Tendernessf
Juiciness
Liked
Level of
Juicinessg Purchase
h
Quality Grade
Choice 6.2 6.8 6.8a 5.7 5.7 6.1 6.1 3.0
Select 5.8 6.0 5.9b 5.7 5.7 5.7 5.4 3.0
P > F 0.4810 0.0809 0.0441 0.9731 0.9345 0.4631 0.1540 0.8393
RMSEc 3.72 3.89 3.90 4.07 4.06 3.38 3.24 0.03
Means within the same column lacking a common letter (a-b) differ (P < 0.05). c RMSE = Root Mean Square Error from Analysis of Variance.
d 10=Like extremely; 1=dislike extremely.
e 10=Extremely flavorful or intense; 1=extremely bland or no flavor.
f 10=Extremely tender; 1=extremely tough.
g 10=Extremely juicy; 1=extremely dry.
h 5=Definitely would buy; 1=definitely would not buy.

Table 15
Least squares means for palatability characteristics of baseline steaks from sirloins for consumer evaluation Main effects
Overall
Likeb
Flavor
Likeb
Level of
Beef
Flavorc
Tenderness
Likeb
Level of
Tendernessd
Juiciness
Likeb
Level of
Juicinesse Purchase
f
Quality Grade
Choice 5.7 6.2 3.6 4.8 4.8 5.1 4.9 3.2
Select 5.8 6.2 3.6 5.6 5.4 5.4 5.1 2.8
P > F 0.9230 0.9972 0.9676 0.0844 0.1924 0.4614 0.6867 0.1770
RMSE a 2.77 3.00 2.91 2.58 2.19 1.83 1.38 0.27
a RMSE = Root Mean Square Error from Analysis of Variance.
b 10=Like extremely; 1=dislike extremely.
c 10=Extremely flavorful or intense; 1=extremely bland or no flavor.
d 10=Extremely tender; 1=extremely tough.
e 10=Extremely juicy; 1=extremely dry.
f 5=Definitely would buy; 1=definitely would not buy.

Table 16
Least squares means for cooking temperatures, cooking times, cooking yields, and WBS values of baseline steaks from ribeyes, strip
loins, and sirloins used for WBS evaluation
Means within the same column lacking a common letter (a-b) differ (P < 0.05). c RMSE = Root Mean Square Error from Analysis of Variance.
Subprimal Ribeye Strip
Loin
Sirloin
Main
Effects
Internal
Temperature
Endpoint
(Celsius)
Total
Cook
Time
(minutes)
Cook
Yield
(%)
WBS
(N)
Internal
Temperature
Endpoint
(Celsius)
Total
Cook
Time
(minutes)
Cook
Yield
(%)
WBS
(N)
Internal
Temperature
Endpoint
(Celsius)
Total
Cook
Time
(minutes)
Cook
Yield
(%)
WBS
(N)
Quality
Grade
Choice 70.17 15.17 87.16 23.99 71.02 14.33a 93.95 23.28 70.27 13.00 85.52 25.49
Select 70.85 12.50 87.69 25.82 70.15 12.33b 89.70 22.87 70.77 14.33 81.28 29.79
P > F 0.1855 0.1299 0.7686 0.6572 0.1399 0.0367 0.4915 0.9090 0.3819 0.4475 0.2141 0.2611
RMSEc 0.83 2.80 3.04 6.91 0.94 1.44 10.32 6.05 0.95 2.92 5.53 6.26

Table 17
Least squares means ± SEMa of retail yields (%) for fabrication of ribeyes stratified by USDA quality grade x aging period
a SEM = Standard error of the least squares means.
b UPC = Universal product code.
c Cut loss calculated by comparing recovered weight to initial cut weight taken on specific fabrication day.
d Cut loss calculated by comparing recovered weight to weight recorded on the day product was received.
Item UPCb Choice Select
14 21 28 35 14 21 28 35 P > F
%
Retail yield
Ribeye steaks 1197 77.5 ± 1.0 73.8 ± 1.0 72.2 ± 1.0 72.6 ± 1.0 77.7 ± 1.0 76.7 ± 1.0 74.3 ± 1.0 72.3 ± 1.0 0.3424
Beef for stew 1727 0.9 ± 0.6 3.3 ± 0.6 1.4 ± 0.6 2.5 ± 0.6 1.2 ± 0.6 1.3 ± 0.6 1.1 ± 0.6 2.7 ± 0.6 0.1634
Lean trimmings
(90% lean)
1653 1.83 ± 0.47 0.86 ± 0.47 0.97 ± 0.51 0.36 ± 0.47 1.49 ± 0.47 1.81 ± 0.47 1.09 ± 0.47 1.03 ± 0.47 0.5450
Fat 4.4 ± 0.9 5.3 ± 0.9 3.1 ± 0.9 3.1 ± 0.9 3.2 ± 0.9 2.1 ± 0.9 2.5 ± 0.9 2.5 ± 0.9 0.4419
Waste
(scab included)
10.0 ± 0.9 8.7 ± 0.9 15.5 ± 0.9 12.6 ± 0.9 10.7 ± 0.9 9.6 ± 0.9 13.9 ± 0.9 12.6 ± 0.9 0.5407
Bone 0.46 ± 0.50 2.28 ± 0.50 0.02 ± 0.50 0.96 ± 0.50 0.65 ± 0.50 2.47 ± 0.50 0.06 ± 0.50 0.92 ± 0.50 0.9942
Cooler shrink 3.4 ± 0.3 4.1 ± 0.3 4.7 ± 0.3 6.2 ± 0.3 3.7 ± 0.3 4.7 ± 0.3 6.0 ± 0.3 6.6 ± 0.3 0.3092
Purge 0.10 ± 0.03 0.10 ± 0.03 0.08 ± 0.03 0.08 ± 0.03 0.09 ± 0.03 0.12 ± 0.03 0.09 ± 0.03 0.10 ± 0.03 0.9712
Fab Cut lossc
0.3 ± 0.1 0.5 ± 0.1 0.4 ± 0.1 0.8 ± 0.1 0.2 ± 0.1 0.3 ± 0.1 0.4 ± 0.1 0.2 ± 0.1 0.0675
Gross Cut lossd
3.7 ± 0.3 4.6 ± 0.3 5.2 ± 0.3 7.0 ± 0.3 3.9 ± 0.3 5.0 ± 0.3 6.0 ± 0.3 6.8 ± 0.3 0.3522
Total saleable yield 80.2 ± 1.1 78.0 ± 1.1 74.9 ± 1.2 75.5 ± 1.1 80.4 ± 1.1 79.7 ± 1.1 76.6 ± 1.2 76.0 ± 1.1 0.8575

Table 18
Least squares means ± SEMf of retail yields (%) for fabrication of ribeyes stratified by aging treatment x aging period
Means within the same row lacking a common letter (a-e) differ (P < 0.05).
f SEM = Standard error of the least squares means.
g UPC = Universal product code.
h Cut loss calculated by comparing recovered weight to initial cut weight taken on specific fabrication day.
i Cut loss calculated by comparing recovered weight to weight recorded on the day product was received.
Item UPCg Dry Wet
14 21 28 35 14 21 28 35 P > F
Ribeye steaks 1197 70.5b ± 0.9 66.7c ± 0.9 63.6d ± 1.0 61.7d ± 0.9 84.7a ± 0.9 83.7a ± 0.9 82.9a ± 0.9 83.3a ± 0.9 0.0023
Beef for stew 1727 0.34c ± 0.61 2.18ab ± 0.61 0.30c ± 0.61 1.59bc ± 0.61 1.76bc ± 0.61 2.40ab ± 0.61 2.19ab ± 0.61 3.60a ± 0.61 0.4480
Lean
trimmings
(90% lean)
1653 1.33 ± 0.41 0.38 ± 0.41 0.18 ± 0.45 0.22 ± 0.41 1.99 ± 0.41 2.29 ± 0.41 1.86 ± 0.41 1.18 ± 0.41 0.3902
Fat 2.5 ± 0.6 1.7 ± 0.6 0.0 ± 0.6 0.0 ± 0.6 5.1 ± 0.6 5.7 ± 0.65 5.5 ± 0.6 5.6 ± 0.6 0.0508
Waste
(scab included) 16.8b ± 0.9 17.3b ± 0.9 24.2a ± 1.0 22.8a ± 0.9 4.0cd ± 0.9 1.0e ± 0.9 5.4c ± 0.9 2.5de ± 0.9 0.0010
Bone 0.5 ± 0.3 1.9 ± 0.3 0.0 ± 0.3 0.3 ± 0.3 0.6 ± 0.3 2.8 ± 0.3 0.1 ± 0.3 1.5 ± 0.3 0.1434
Cooler shrink 6.8d ± 0.3 8.4c ± 0.3 10.0b ± 0.4 12.3a ± 0.3 0.2e ± 0.3 0.3e ± 0.3 0.7e ± 0.3 0.5e ± 0.3 <0.0001
Purge 0.14 ± 0.03 0.15 ± 0.03 0.08 ± 0.03 0.09 ± 0.03 0.05 ± 0.03 0.08 ± 0.03 0.08 ± 0.03 0.09 ± 0.03 0.3386
Fab Cut lossh
0.2 ± 0.1 0.4 ± 0.1 0.3 ± 0.1 0.3 ± 0.1 0.3 ± 0.1 0.4 ± 0.1 0.5 ± 0.1 0.8 ± 0.1 0.1051
Gross Cut lossi
7.0d ± 0.3 8.8c ± 0.3 10.4b ± 0.3 12.5a ± 0.3 0.6e ± 0.3 0.7e ± 0.3 0.8e ± 0.3 1.2e ± 0.3 <0.0001
Total saleable
yield 72.2b ± 1.0 69.3c ± 1.0 64.3d ± 1.1 63.5d ± 1.0 88.4a ± 1.0 88.4a ± 1.0 86.9a ± 1.0 88.1a ± 1.0 0.0005

Table 19
Least squares means ± SEMd
of retail yields (%) for fabrication of strip loins stratified by USDA quality grade x aging period
Means within the same row lacking a common letter (a-c) differ (P < 0.05).
d SEM = Standard error of the least squares means.
e UPC = Universal product code.
f Cut loss calculated by comparing recovered weight to initial cut weight taken on specific fabrication day.
g Cut loss calculated by comparing recovered weight to weight recorded on the day product was received.
i Identified as vein steak only if M. gluteus medius present on both sides of steak.
Item UPCe Choice Select
14 21 28 35 14 21 28 35 P > F
%
Retail yield
Strip Steaks 1398 49.7 ± 2.0 51.6 ± 2.0 46.3 ± 2.0 46.3 ± 2.0 53.3 ± 2.0 48.9 ± 2.0 51.0 ± 2.0 48.1 ± 2.0 0.2669
Vein steaksi
12.2 ± 1.0 13.2 ± 1.0 10.7 ± 1.0 11.5 ± 1.0 13.4 ± 1.0 13.2 ± 1.0 10.6 ± 1.0 12.0 ± 1.0 0.9078
Beef for stew 1727 2.1 ± 0.6 2.6 ± 0.6 0.8 ± 0.6 1.4 ± 0.6 3.0 ± 0.6 3.0 ± 0.6 2.0 ± 0.6 1.6 ± 0.6 0.8120
Lean trimmings
(90% lean)
1653 0.43 ± 0.56 1.08 ± 0.56 2.55 ± 0.56 1.50 ± 0.56 0.24 ± 0.56 0.19 ± 0.56 1.70 ± 0.56 1.65 ± 0.56 0.7432
Fat 21.4 ± 2.9 9.4 ± 2.9 14.2 ± 2.9 19.4 ± 2.9 15.5 ± 2.9 15.4 ± 2.9 11.2 ± 2.9 13.0 ± 2.9 0.1383
Waste
(scab included)
1.9 ± 1.8 9.2 ± 1.8 11.0 ± 1.8 5.5 ± 1.8 2.1 ± 1.8 4.7 ± 1.8 9.6 ± 1.8 8.0 ± 1.8 0.2555
Bone 2.9 ± 0.6 2.6 ± 0.6 1.0 ± 0.6 1.0 ± 0.6 2.7 ± 0.6 1.1 ± 0.6 0.8 ± 0.6 0.7 ± 0.6 0.5709
Cooler shrink 3.9 ± 0.4 5.1 ± 0.4 6.2 ± 0.4 6.3 ± 0.4 5.2 ± 0.4 5.6 ± 0.4 5.9 ± 0.4 6.6 ± 0.4 0.2175
Purge 0.11 ± 0.05 0.20 ± 0.06 0.18 ± 0.05 0.15 ± 0.05 0.07 ± 0.05 0.13 ± 0.05 0.19 ± 0.05 0.11 ± 0.05 0.3553
Fab Cut lossf
0.6 ± 0.2 0.5 ± 0.2 0.9 ± 0.2 0.7 ± 0.2 0.7 ± 0.2 0.7 ± 0.2 0.3 ± 0.2 0.2 ± 0.1 0.3141
Gross Cut lossg
4.5c ± 0.4 5.6b ± 0.4 7.0a ± 0.4 6.9a ± 0.4 5.9ab ± 0.4 6.2ab ± 0.4 6.2ab ± 0.4 6.8a ± 0.4 0.0468
Total saleable
yield
64.5 ± 2.0 68.4 ± 2.0 60.4 ± 2.0 60.8 ± 2.0 70.0 ± 2.0 65.2 ± 2.0 65.3 ± 2.0 63.4 ± 2.0 0.1427

Table 20
Least squares means ± SEMe of retail yields (%) for fabrication of strip loins stratified by aging treatment x aging period
Means within the same row lacking a common letter (a-d) differ (P < 0.05). e SEM = Standard error of the least squares means.
f UPC = Universal product code.
g Cut loss calculated by comparing recovered weight to initial cut weight taken on specific fabrication day.
h Cut loss calculated by comparing recovered weight to weight recorded on the day product was received.
i Identified as vein steak only if M. gluteus medius present on both sides of steak.
Item UPCf Dry Wet
14 21 28 35 14 21 28 35 P > F
%
Retail yield
Strip Steaks 1398 48.4 ± 0.9 47.0 ± 0.9 45.0 ± 0.9 43.4 ± 0.9 54.6 ± 0.9 53.6 ± 0.9 52.2 ± 0.9 51.0 ± 0.9 0.8968
Vein steaksi
11.7 ± 0.9 11.6 ± 0.9 8.6 ± 0.9 9.1 ± 0.9 14.0 ± 0.9 14.7 ± 0.9 12.7 ± 0.9 14.4 ± 0.9 0.3592
Beef for stew 1727 1.9 ± 0.4 1.9 ± 0.4 0.8 ± 0.4 1.2 ± 0.4 3.2 ± 0.4 3.7 ± 0.4 2.0 ± 0.4 1.8 ± 0.4 0.5928
Lean trimmings
(90% lean)
1653 0.10 ± 0.39 0.35 ± 0.39 1.38 ± 0.39 0.93 ± 0.39 0.57 ± 0.39 0.91 ± 0.39 2.86 ± 0.39 2.22 ± 0.39 0.4601
Fat 16.6ab ± 1.6 10.1c ± 1.6 6.3c ± 1.6 14.6b ± 1.6 20.3a ± 1.6 14.7b ± 1.6 19.1ab ± 1.6 17.7ab ± 1.6 0.0116
Waste
(scab included)
3.2cd ± 1.8 9.0b ± 1.8 16.0a ± 1.8 7.6bc ± 1.8 0.7d ± 1.8 4.9bcd ± 1.8 4.6bcd ± 1.8 5.9bc ± 1.8 0.0345
Bone 2.6 ± 0.4 1.4 ± 0.4 0.6 ± 0.4 0.8 ± 0.4 3.0 ± 0.4 2.3 ± 0.4 1.1 ± 0.4 0.9 ± 0.4 0.7098
Cooler shrink 8.2c ± 0.3 9.5b ± 0.3 11.2a ± 0.3 11.9a ± 0.3 1.0d ± 0.3 1.2d ± 0.3 0.8d ± 0.3 0.9d ± 0.3 <0.0001
Purge 0.15 0.04 0.12 ± 0.04 0.08 ± 0.04 0.14 ± 0.04 0.16 ± 0.04 0.21 ± 0.03 0.13 ± 0.04 0.16 ± 0.04 0.7246
Fab Cut lossg
0.7 ± 0.2 0.6 ± 0.2 0.9 ± 0.2 0.2 ± 0.2 0.6 ± 0.2 0.5 ± 0.2 0.3 ± 0.2 0.7 ± 0.2 0.0588
Gross Cut lossh
8.9c ± 0.3 10.1b ± 0.3 12.0a ± 0.3 12.1a ± 0.3 1.5d ± 0.3 1.7d ± 0.3 1.1d ± 0.3 1.6d ± 0.3 <0.0001
Total saleable
yield
62.1 ± 1.0 60.8 ± 1.0 55.9 ± 1.0 54.7 ± 1.0 72.4 ± 1.0 72.9 ± 1.0 69.8 ± 1.0 69.5 ± 1.0 0.1115

Table 21
Least squares means ± SEMd of retail yields (%) for fabrication of sirloins stratified by USDA quality grade x aging period
Means within the same row lacking a common letter (a-c) differ (P < 0.05).
d SEM = Standard error of the least squares means.
e UPC = Universal product code.
f Cut loss calculated by comparing recovered weight to initial cut weight taken on specific fabrication day.
g Cut loss calculated by comparing recovered weight to weight recorded on the day product was received.
Item UPCe Choice Select
14 21 28 35 14 21 28 35 P > F
%
Retail yield
Top Sirloin Steaks 1422 64.9 ± 1.7 64.9 ± 1.7 56.6 ± 1.7 57.9 ± 1.7 68.2 ± 1.7 64.4 ± 1.9 61.7 ± 1.7 61.0 ± 1.7 0.4550
Beef for stew 1727 0.5 ± 0.6 0.0 ± 0.6 4.7 ± 0.6 0.0 ± 0.6 0.6 ± 0.6 0.0 ± 0.6 4.6 ± 0.6 0.2 ± 0.6 0.9959
Lean trimmings
(90% lean)
1653 0.73 ± 0.30 0.80 ± 0.30 0.00 ± 0.30 0.70 ± 0.30 0.83 ± 0.30 0.02 ± 0.32 0.00 ± 0.30 0.65 ± 0.30 0.4687
Beef for stir fry 3.6 ± 0.6 4.8 ± 0.6 0.0 ± 0.6 4.8 ± 0.6 4.0 ± 0.6 4.0 ± 0.6 0.0 ± 0.6 5.3 ± 0.6 0.7342
Fat 16.0 ± 2.2 12.1 ± 2.2 18.5 ± 2.2 17.9 ± 2.2 11.2 ± 2.2 14.3 ± 2.4 13.8 ± 2.2 14.0 ± 2.2 0.3789
Waste
(scab included)
8.8 ± 0.9 10.4 ± 0.9 12.7 ± 0.9 9.9 ± 0.9 9.1 ± 0.9 10.5 ± 1.0 10.9 ± 0.9 9.1 ± 0.9 0.6912
Bone 0.23 ± 0.06 0.05 ± 0.06 0.00 ± 0.06 0.00 ± 0.06 0.02 ± 0.06 0.04 ± 0.06 0.00 ± 0.06 0.00 ± 0.06 0.2535
Cooler shrink 5.1 ± 0.4 6.7 ± 0.4 7.5 ± 0.4 8.5 ± 0.4 6.0 ± 0.4 6.7 ± 0.4 8.7 ± 0.4 9.5 ± 0.4 0.4390
Purge 0.11c ± 0.03 0.18b ± 0.03 0.17bc ± 0.03 0.18bc ± 0.03 0.20b ± 0.03 0.11c ± 0.03 0.31a ± 0.03 0.22ab ± 0.03 0.0196
Fab Cut lossf
0.11 ± 0.08 0.31 ± 0.08 0.16 ± 0.08 0.23 ± 0.08 0.14 ± 0.08 0.31 ± 0.08 0.21 ± 0.08 0.27 ± 0.08 0.9948
Gross Cut lossg
5.2 ± 0.4 7.0 ± 0.4 7.6 ± 0.4 8.8 ± 0.4 6.1 ± 0.4 6.7 ± 0.4 8.9 ± 0.4 9.8 ± 0.4 0.2427
Total saleable yield 69.8 ± 1.5 70.4 ± 1.5 61.3 ± 1.5 63.4 ± 1.5 73.6 ± 1.5 68.4 ± 1.7 66.3 ± 1.5 67.1 ± 1.5 0.1300

Table 22
Least squares means ± SEMg of retail yields (%) for fabrication of sirloins stratified by aging treatment x aging period
Means within the same row lacking a common letter (a-f) differ (P < 0.05).
g SEM = Standard error of the least squares means.
h UPC = Universal product code.
i Cut loss calculated by comparing recovered weight to initial cut weight taken on specific fabrication day.
j Cut loss calculated by comparing recovered weight to weight recorded on the day product was received.
Item UPCh Dry Wet
14 21 28 35 14 21 28 35 P > F
% Retail yield Top Sirloin
Steaks
1422 57.3 ± 1.1 54.1 ± 1.2 50.4 ± 1.1 48.7 ± 1.1
75.8 ± 1.1 75.0 ± 1.1 67.9 ± 1.1 70.2 ± 1.1 0.2516
Beef for stew 1727 0.36b ± 0.53 0.00b ± 0.53 1.23b ± 0.53 0.16b ± 0.53 0.72b ± 0.53 0.00b ± 0.53 8.02 ± 0.53 0.00b ± 0.53 <0.0001
Lean trimmings
(90% lean)
1653 0.10 ± 0.31 0.07 ± 0.34 0.00 ± 0.31 0.09 ± 0.31 1.47 ± 0.31 0.76 ± 0.31 0.00 ± 0.31 1.26 ± 0.31 0.1352
Beef for stir fry 3.6b ± 0.6 2.4b ± 0.6 0.0c ± 0.6 3.0b ± 0.6 4.0b ± 0.6 6.4a ± 0.6 0.0c ± 0.6 7.1a ± 0.6 0.0007
Fat 11.3 ± 0.9 10.5 ± 1.0 11.8 ± 0.9 13.3 ± 0.9 15.9 ± 0.9 15.9 ± 0.9 20.5 ± 0.9 18.6 ± 0.9 0.1208
Waste
(scab included) 17.9c± 0.9 20.9ab ± 1.0 23.6a ± 0.9 19.0bc ± 0.9 0.0d ± 0.9 0.0d ± 0.9 0.0d ± 0.9 0.0d ± 0.9 0.0212
Bone 0.07 ± 0.07 0.0 ± 0.07 0.0 ± 0.07 0.0 ± 0.07 0.18 ± 0.07 0.09 ± 0.07 0.0 ± 0.07 0.0 ± 0.07 0.7906
Cooler shrink 9.3c ± 0.4 11.9b ± 0.4 13.0b ± 0.4 15.6a ± 0.4 1.7e ± 0.4 1.5e ± 0.4 3.2d ± 0.4 2.4de ± 0.4 <0.0001
Purge 0.06e ± 0.04 0.08de ± 0.04 0.04e ± 0.04 0.08d ± 0.04 0.24bc ± 0.04 0.19cd ± 0.04 0.44a ± 0.04 0.32b ± 0.04 0.0070
Fab Cut lossi
0.047 ± 0.069 0.291 ± 0.075 0.003 ± 0.069 0.088 ± 0.069 0.204 ± 0.069 0.351 ± 0.075 0.373 ± 0.069 0.417 ± 0.069 0.1194
Gross Cut lossj
9.4c ± 0.4 12.0b ± 0.4 13.0b ± 0.4 15.7a ± 0.4 1.9e ± 0.4 1.8e ± 0.4 3.6d ± 0.4 2.8de ± 0.4 <0.0001
Total saleable
yield 61.4d ± 0.7 56.6e ± 0.8 51.6f ± 0.7 52.0f ± 0.7 81.9a ± 0.7 82.2a ± 0.7 75.9c ± 0.7 78.6b ± 0.7 0.0011

Table 23
Least squares means for total cutting time for fabrication of ribeyes, strip loins, and sirloins
stratified by aging treatment, aging period, and USDA Quality grade
Means within the same column lacking a common letter (a-b) differ (P < 0.05). cRMSE = Root Mean Square Error from Analysis of Variance.
Main effects Total Cutting Time
(s)
Ribeye Strip Loin Sirloin
Aging treatment
Dry 384.1a 441.0a 266.7a
Wet 304.3b 372.6b 194.7b
P > F <0.0001 <0.0001 <0.0001
Aging period
14 369.3a 417.3 246.3a
21 371.1a 403.3 244.5a
28 307.4b 383.1 197.1b
35 329.0b 423.6 234.8a
P > F 0.0005 0.2062 0.0199
Quality grade
Choice 346.5 409.1 231.9
Select 342.0 404.5 229.5
P > F 0.6994 0.7460 0.8410
RMSEc 32.88 39.82 41.91

6
6.5
7
7.5
14 21 28 35
Aging Day (days)
Ov
era
ll L
ike
c
dry
wet
a
b
ab
ab
ab
ab
a
ab
p = 0.0478
Fig 1. Least squares means for Overall Like for beef steaks from ribeyes for consumer
evaluation stratified by aging day x aging treatment.
Means lacking a common letter (a-b) differ (P < 0.05). c10 = Like extremely; 1 = Dislike extremely.
10
11
12
13
14
15
16
14 21 28 35
Aging day (days)
To
ta
l C
oo
kin
g T
ime
(m
inu
te
s)
Choice
Select
p = 0.0176
a
a
a
a
a
a
a
b
Fig. 2. Least squares means for total cooking time of beef steaks from strip loins for consumer
evaluation stratified by aging day x USDA Quality grade.
Means lacking a common letter differ (P < 0.05).

12
13
14
15
16
17
18
DRY WET
Aging Treatment
To
ta
l C
oo
kin
g T
ime
(m
inu
te
s)
Choice
Select
b
b
a
a
p = 0.0285
Fig. 3. Least squares means for total cooking time of beef steaks from sirloins for consumer
evaluation stratified by aging treatment x USDA quality grade.
Means lacking a common letter differ (P < 0.05).
8
9
10
11
12
13
14
15
16
14 21 28 35
Aging Day (days)
To
ta
l C
oo
kin
g T
ime
(m
inu
te
s)
Choice
Select
a
ab
b
b
b
ab
c
b
p = 0.0311
Fig. 4. Least squares means for total cooking time of beef steaks from strip loins designated for
Warner Bratzler shear evaluation. Aging day x USDA Quality grade is shown.
Means lacking a common letter differ (P < 0.05).

16
18
20
22
24
26
28
30
14 21 28 35
Aging Day (days)
WB
S (
N) Choice
Select
a
b bc
bc
c
bc
bc
bc
p = 0.0020
Fig. 5. Least squares means for Warner-Bratzler shear force values of beef steaks from sirloins
stratified by aging day x USDA Quality grade.
Means lacking a common letter differ (P < 0.05).
300
325
350
375
400
425
450
475
500
14 21 28 35
Aging Day (days)
To
tal C
utt
ing
Tim
e(s
) Choice
Select
a
c
bc
bc
c
c
ab
c
p =0.0021
Fig. 6. Least squares means for total cutting time of strip loins stratified by aging day x USDA
Quality grade.
Means lacking a common letter differ (P < 0.05).
_______________________________
For more information contact:
National Cattlemen's Beef Association
9110 East Nichols Avenue
Centennial, Colorado 80112-3450
(303) 694-0305