temporal causality and the dynamics of exports, human ... 1/ijae sept 2004 a2 narayan... ·...
TRANSCRIPT

Narayan and Smyth, International Journal of Applied Economics, 1(1), September 2004, 24-45 24
Temporal Causality and the Dynamics of Exports, Human Capital and Real Income in China
Paresh Kumar Narayan and Russell Smyth
Griffith University and Monash University, Australia
Abstract This article employs cointegration and error-correction modelling to test the causal relationship between real income, exports and human capital stock using data for China over the period 1960 to 1999. We find that real exports, human capital and real income are cointegrated when real exports is the dependent variable, but are not cointegrated when human capital or real income are the dependent variable. In the short-run we find evidence of bi-directional Granger causality between human capital and real exports, unidirectional Granger causality running from real income to human capital and neutrality between real exports and real income. Keywords: China, exports, human capital, causality JEL Classification: C12, C22 Introduction There is a large literature which examines the export-growth nexus within a bivariate framework (see Ahmad 2001 for a recent review). There is also a substantial literature which considers the relationship between economic growth and human capital. However, with the exception of a study by Chuang (2000) for Taiwan, little attention has been given to examining the causal relationship between economic growth, exports and human capital within a multivariate framework. This is in spite of the fact that there is a clear conceptual link between the three given that endogenous growth theory has argued that either human capital or trade is the primary engine of growth (see eg. Lucas,1988; Romer,1990; Grossman and Helpman,1991). The objective of this article is to employ cointegration and error-correction modelling to test the causal relationship between real income, exports and human capital stock using data for China over the period 1960 to 1999. The article makes five contributions to the existing literature on the relationship between real income, exports and human capital stock. The first contribution is that it is the first study to examine the human capital-based endogenous growth theory and export-led growth hypotheses using causality testing within a multivariate cointegration and error-correction framework for a large developing country such as China. Second, we use data sets for Gross Domestic Product (GDP) constructed by Hsueh and Li (1999) and human capital stock, constructed by Wang and Yao (2003), which represent new and improved estimates compared with what was previously available. Third, we use a relatively new, and as yet little used, estimation technique, which is the bounds testing approach to cointegration, within an autoregressive distributive lag (ARDL) framework, developed by Pesaran and others (Pesaran and Pesaran,1997; Pesaran and Shin,1999; Pesaran et al., 2001). Because our sample size is relatively small we calculate exact critical

Narayan and Smyth, International Journal of Applied Economics, 1(1), September 2004, 24-45 25
values, which are tailored to our sample size. Fourth, in contrast to existing studies, which find cointegration, we also examine whether the parameter estimates are stable over time. To test for parameter stability we use a test developed by Pesaran and Pesaran (1997) and the Hansen (1992) suite of tests. Fifth, we go further than testing for Granger causality. Through the application of variance decomposition analysis and impulse response functions we attempt to explain the total forecast error variance of each of the variables beyond the sample period, in terms of the proportions attributable to innovations or shocks in each variable. We focus on China, because it is a particularly interesting case study of the human capital-trade-growth nexus. Since the late 1970s when China commenced market reforms it has had one of the highest growth rates of any country in the world and, at the same time, it has experienced a large increase in trade. Between 1980 and 2000 China’s trade volume increased from US$38 billion to US$474 billion, doubling more than three times in two decades, far faster than growth in world trade over the same period (Wang, 2002). In the mid-1990s China was already ranked as the eleventh largest exporting and fourteenth largest importing country (WTO, 1996). China has climbed the world trade ladder further since its accession to the World Trade Organisation and it is expected to move even higher with the increasing prominence of “Greater China” (China, Hong Kong, Macao and Taiwan) as a major trading region. Lardy (2002) suggests that China “seems almost certain in the next few years to overtake Canada, France and the United Kingdom to become the fourth largest trading country in the world. Within a decade, China’s trade is likely to surpass that of Japan and Germany, making China the world’s second largest trader”. The accumulation of basic human capital in China since the Cultural Revolution has also been rapid. The estimated enrollment ratio in primary schools was 25 per cent in 1949. This figure increased to 84.3 per cent in 1980 and 100 per cent in 1996. In 1949 the estimated enrollment ratio in secondary schools was only 2 per cent, but this figure had increased to 46 per cent by 1977 and was 70 per cent in 1996 (World Bank, 1985; Wang and Yao, 2003). There has been a commensurate large decline in the rate of adult illiteracy. The rate of adult illiteracy has declined from 52 per cent in 1964 to 17 per cent in 1999, although a large gender gap remains with 9 per cent of males and 25 per cent of females illiterate (World Bank 2001). At the tertiary level, progress is not as impressive as at the lower levels. While China has a wide base of primary and secondary education, as Wang and Yao (2003) emphasise, the apex of the education pyramid is much narrower than in other low income Asian countries with the enrollment ratio in tertiary education just 8 per cent at the end of the 1990s. The balance of the article is set out as follows. The next section provides an overview of the conceptual arguments about the relationship between economic growth, exports and human capital and reviews the existing empirical evidence. The data and timeframe is considered in section three. The econometric methodology and results are set out and discussed in section four. Foreshadowing the main results, we find that exports, human capital and real income are cointegrated when exports is the dependent variable, but are not cointegrated when human capital or real income are the dependent variable. In the short-run we find evidence of bi-directional Granger causality between human capital and real exports, unidirectional Granger causality running from real income to human capital and neutrality between real exports and real income. The variance decomposition analysis and impulse response functions are reported in section five and the final section contains some concluding comments.

Narayan and Smyth, International Journal of Applied Economics, 1(1), September 2004, 24-45 26
Literature Review The Relationship between Economic Growth and Human Capital Accumulation
Most studies which have examined the relationship between economic growth and human
capital accumulation have used either a growth accounting framework (Baumol, 1986; Barro, 1991; Barro and Lee, 1993) or endogenous growth model (Lucas, 1988; Romer, 1990; Grossman and Helpman, 1991). The growth accounting framework posits that education, through increasing the human capital stock of individuals, improves their productivity and therefore contributes to growth. The endogenous growth models of Romer et al. (1990) assume that the creation of new ideas is a direct function of human capital, which is manifest in the form of scientific knowledge. Therefore investment in human capital causes growth in physical capital and this, in turn, results in economic growth. Human capital accumulation might promote growth through facilitating technology adaption (Welch, 1970; Foster and Rosenzweig, 1996) or human capital might be necessary for technology use (Easterly et al., 1994; Caseli, 1999). Several studies suggest that human capital and technology use are complementary (eg Doms et al., 1997; Berman et al., 1998).
Several studies purport to find that human capital accumulation promotes economic growth (Barro, 1991; Barro and Lee, 1993; Benhabib and Spiegel, 1994). However, Bils and Klenow (2000) question whether studies such as these which have found that levels of schooling are positively correlated with growth rates reflect the effects of increased schooling on economic growth or vice-versa. Schooling involves sacrificing current earnings for higher future earnings and economic growth, even when skill neutral, increases the wage gains from schooling. Thus, Bils and Klenow (2000) argue that an alternative explanation for the finding of Barro (1991) et al. that schooling promotes growth is that growth promotes schooling. Consistent with Bils and Klenow’s (2000) argument, Foster and Rosenzweig (1996) find evidence for a channel from growth to schooling that involves skill-bias of the technological change. These authors document that provinces in India, which benefited from the Green Revolution in the 1970s, saw increases in returns to, and enrollments in, schooling.
However, relatively few studies have tested for causality between human capital formation and economic growth. Studies which test for causality between human capital and growth within a bivariate framework are De Meulemeester and Rochat (1995), In and Doucouliagos (1997) and Asteriou and Agiomirgianakis (2001). De Meulemeester and Rochat (1995) test for Granger causality between higher education enrollments and economic growth in six countries: Sweden (1910-1986), United Kingdom (1919-1987), Japan (1885-1975), France (1899-1986), Italy (1885-1986) and Australia (1906-1986). Their findings suggest unidirectional short-run Granger causality running from higher education enrollments to economic growth in Sweden, the United Kingdom, Japan and France and neutrality between higher education enrollments and economic growth in Australia and Italy. In and Doucouliagos (1997) examine the causal relationship between economic growth and human capital formation using U.S. annual data for 1949 to 1984 and find string evidence of bi-directional causality. Asteriou and Agiomirgianakis (2001) consider the causal relationship between economic growth and human capital formation using annual data for Greece from 1960 to 1994 and generally reach the same conclusions as In and Doucouliagos (1997). There are no bivariate causality studies of this sort for developing countries, although on a related topic Khan et al. (1991) examine causality

Narayan and Smyth, International Journal of Applied Economics, 1(1), September 2004, 24-45 27
between literacy and labour productivity in Pakistan. Their main finding is that there is unidirectional Granger causality running from literacy to productivity. The Relationship between Human Capital Accumulation and Trade
There are several channels through which exports can promote the accumulation of
human capital in developing countries. First, trade facilitates technological transfer from developed to developing countries. Technological transfers are biased in favour of skilled labour and hence stimulate investment in human capital (Pissarides 1997). Second, exports promote learning by doing (Azariades and Drazen, 1990; Chuang, 1998, 2000). Third, exports facilitate the diffusion of soft and hard technologies including management, marketing and production expertise, which promote the productivity of capital and labour (Grossman and Helpman, 1991; Kim, 1998).
At the same time, causation can conceptually run in the other direction and improvements in the stock of human capital can also promote exports. Human capital accumulation increases the quality (embodied and disembodied) of labour, which in turn, enhances the productivity of the workforce and stimulates further exports and economic growth (Chuang 2000). Empirical studies for a range of different countries and time periods suggest that trade promotes human capital accumulation and vice-versa (see eg. Gould and Ruffin, 1995; Hanson and Harrison, 1995; Stokey, 1996). The Relationship between Economic Growth and Trade
Conceptually, there are a variety of channels through which an increase in exports can
increase growth. The export-led hypothesis postulates that export expansion leads to better resource allocation and production efficiency through capital formation, technological development and employment creation and hence economic growth (Chenery, 1980; Feder, 1983; Balassa, 1985; Ahmad, 2001). Growth can also conceptually cause exports (see Ahmad 2001 for an overview). First, variants of “handmaiden” theories of trade have long proffered that economic growth leads to trade (eg. Kanamori,1968; Findlay, 1984). Second, Jung and Marshall (1985) argue that growth mechanisms which are “internally generated” better explain growth of exports. Third, new trade theories where economies of scale are path dependent as in Helpman and Krugman (1990, chapter 3) are consistent with growth causing exports.
There are a multitude of empirical studies which examine the relationship between exports and growth using either correlation or causality techniques. The empirical evidence on the export-growth nexus is mixed with no clear consensus. However, Ahmad (2001) who reviews approximately 40 studies from the 1970s to the 1990s concludes that empirical support for the export-led growth in developing and developed countries is considerably weaker in more recent studies which have used cointegration and causality testing, compared with earlier correlation based studies.
There have, however, been relatively few studies which have considered the causal relationship between exports and economic growth in China. Kwan and Cotsomitis (1991) apply Granger causality tests to examine the relationship between real income and real exports between 1952 and 1985 and find no causality between 1952 and 1978, but bi-directional causality between 1952 and 1985. Liu et al. (1997) test the direction of causality between external trade (exports and imports) and real income and also find bi-directional causality. Shan and Tian

Narayan and Smyth, International Journal of Applied Economics, 1(1), September 2004, 24-45 28
(1998) employ a six variable vector autoregression (VAR) model to examine short-run Granger causality between real income, exports, imports, capital expenditure, foreign direct investment and labour inputs using monthly data for Shanghai over the period 1990.M1-1996.M12. Their finding was that there is unilateral causality running from real income to exports. In related research Liu et al. (2001, 2002) examine the causal links between real income, exports, imports and foreign direct investment since the market reforms. Their findings suggest that these variables are cointegrated with bi-directional Granger causality between real income, exports and foreign direct investment.
Caruso (2002) examines the propagation mechanisms of macroeconomic shocks to output in China from 1957-1992 employing a seven variable VAR system. The finding is that the growing openness of the Chinese economy in the market reform period has contributed to sustaining long run productivity increases and increased spatial inequality. Another study which applies temporal causality and dynamic modelling in China’s context is Shan (2002), who estimates a VAR model to examine the causal linkages between macro-factors and income disparity in China. His results suggest that fiscal spending and unemployment are the major sources of changes in income dispersion. Ahearne et al. (2003) examine whether increases in China’s exports reduce exports of other emerging Asian economies. They examine the relative importance of foreign imports and exchange rates in determining Asian export growth using a VAR estimation of aggregate trade equations, finding that while exchange rates affect export performance, trading partners’ income growth is more important. Data
The data used in this article are real exports (Et), real (GDP) (Yt) and an index of human
capital (HCt) for the period 1960-1999. The series on real exports is from Comprehensive Statistical Data and Materials on 50 Years of the New China. The series on real GDP for 1960-1995 is from Hsueh and Li (1999) and updated for the period 1996 to 1999 from the China Statistical Yearbooks. The Hsueh and Li (1999) data set is regarded as more reliable than the official estimates of GDP up to the 1990s. The human capital index was constructed by Wang and Yao (2003) and is available in an appendix to their article. Wang and Yao (2003) constructed the series on human capital using the perpetual inventory method in a similar fashion to Barro and Lee (2000). The flow variable Wang and Yao (2003) use is the number of graduates completing different schooling levels rather than enrollments at five-year intervals as used in other recent estimates of China’s human capital stock such as that constructed by Young (2000). The result is a weighted index of educational attainment from five levels of schooling: primary, junior secondary, senior secondary, special secondary and tertiary (see Wang and Yao, 2003, for full details). Unit Roots, Cointegration and Granger Causality Unit Root Tests
A three-stage procedure was followed to test the direction of causality. In the first stage
the order of integration was tested using the Augmented Dickey-Fuller (ADF) and Phillips

Narayan and Smyth, International Journal of Applied Economics, 1(1), September 2004, 24-45 29
Perron (PP) unit root tests. Table 1 reports the results of the unit root tests. The ADF and PP statistics for the levels of real income, real exports and human capital [ ] do not exceed the critical values (in absolute terms). However, when we take the first difference of each of the variables, the ADF and PP statistics are higher than their respective critical values (in absolute terms). Therefore, we conclude that
HC,E,Y tt
[ ]HC,E,Y tt are each integrated of order one or . ( )1I Cointegration
The second stage involves testing for the existence of a long-run equilibrium relationship
between real exports, real income and human capital within a multivariate framework. As discussed in the introduction, in order to test for the existence of any long-run relation among the variables we employ the bounds testing approach to cointegration. This involves investigating the existence of a long-run relationship using the following unrestricted error-correction model (UECM):
[ HC,E,Y tt ]
ttYtYtY
n
iitiY
n
iitiY
n
iitiYoYt
HCEY
HCdEcYbaY
1131211
111
lnlnln
lnlnlnln
εσσσ ++++
∆+∆+∆+=∆
−−−
=−
=−
=− ∑∑∑ (1)
ttEtEtE
n
iitiE
n
iitiE
n
iitiEoEt
HCYE
HCdYcEbaE
1131211
111
lnlnln
lnlnlnln
εσσσ ++++
∆+∆+∆+=∆
−−−
=−
=−
=− ∑∑∑ (2)
ttHCtHCtHC
n
iitiHC
n
iitiHC
n
iitiHCoHCt
EYHC
EdYcHCbaHC
1131211
111
lnlnln
lnlnlnln
εσσσ ++++
∆+∆+∆+=∆
−−−
=−
=−
=− ∑∑∑ (3)
Here ∆ is the first difference operator, Yln is the log of real GDP, Eln is the log of
real exports and HCln is the log of human capital. The F test is used to determine whether a long-run relationship exists between the variables through testing the significance of the lagged levels of the variables. When a long-run relationship exists between the variables, the F test indicates which variable should be normalised.
In equation 1, where real GDP is the dependent variable, the null hypothesis of no cointegration amongst the variables is ( )03210 === YYY:H σσσ against the alternative
hypothesis ( )03211 ≠≠≠ YYY:H σσσ . This is denoted as ( )HC,EYFY . In equation 2, where real exports is the dependent variable, the null hypothesis for cointegration is ( )03210 === EEE:H ϖϖϖ against the alternative ( )03211 ≠≠≠= EEEH ϖϖϖ . This is
denoted as )( HC,YEFE . In equation 3, where human capital stock is the dependent variable,

Narayan and Smyth, International Journal of Applied Economics, 1(1), September 2004, 24-45 30
the null hypothesis for cointegration is ( )03210 === HCHCHC:H θθθ against the
alternative ( )03211 ≠≠≠ HCHCHC:H θθθ . This is denoted as )( E,YHCFHC . These hypotheses can be examined using the standard F statistic. The F test has a non-
standard distribution which depends upon: (i) whether variables included in the ARDL model are ( )1I or , (ii) the number of regressors and (iii) whether the ARDL model contains an ( )0I
intercept and/or a trend. Pesaran et al. (2001) report two sets of critical values based on 40,000 replications of a stochastic stimulation, which provide critical value bounds for all classifications of the regressors into purely , purely ( )1I ( )0I or mutually cointegrated for a sample size of 1000 observations.
However, in this study, we have a relatively small sample size of 40 observations. With small sample sizes the relevant critical values potentially deviate substantially from the critical values reported in Pesaran et al. (2001). Therefore, we calculate exact critical value bounds tailored to our sample sizes. We calculate exact critical value bounds using stochastic simulations for with two regressors, based on 40,000 replications for the F-statistic. We 40=Temploy a model with an intercept, but no trend, which is case II in Pesaran et al.’s (2001) terminology (see Pesaran et al., 2001 for details). If the computed F statistics falls outside the critical bounds, a conclusive decision can be made regarding cointegration without knowing the order of integration of the regressors. If the estimated F statistic is higher than the upper bound of the critical values then the null hypothesis of no cointegration is rejected. Alternatively, if the estimated F statistic is lower than the lower bound of critical values, the null hypothesis of no cointegration cannot be rejected. We tested for the presence of long-run relationships in equations (1) to (3). As we use annual data, the maximum number of lags in the ARDL was set equal to 2. The calculated F-statistics are reported in Table 2. For equation (1) ( )=.FY 1.5646; for equation (2)
( ).FE =4.5939; and for equation (3) ( ).FHC =2.0196. From these results, it is clear that there is a long run relationship amongst the variables when E is the dependent variable because its F-statistic (4.5939) is higher than the upper bound critical value 4.260 at the 5 per cent level. This implies that the null hypothesis of no cointegration among the variables in equation (2) cannot be accepted. However, for equation (1) and equation (3), the null hypothesis of no cointegration is accepted.
Granger Causality
The third stage involves constructing standard Granger-type causality tests augmented
with a lagged error-correction term where the series are cointegrated. The equations where Y and HC are dependent variables are estimated without an error-correction term because we failed to find evidence of cointegration for these equations. However, given that the bounds test suggest that [ are cointegrated when ]HC,E,Y tt E is the dependent variable, we augment the Granger-type causality test when E is the dependent variable with a lagged error-correction term. Thus, the Granger causality test involves specifying a multivariate pth order VECM as follows:

Narayan and Smyth, International Journal of Applied Economics, 1(1), September 2004, 24-45 31
( ) ( )
[ ]⎥⎥⎥
⎦
⎤
⎢⎢⎢
⎣
⎡+
⎥⎥⎥
⎦
⎤
⎢⎢⎢
⎣
⎡+
⎥⎥⎥
⎦
⎤
⎢⎢⎢
⎣
⎡
⎥⎥⎥
⎦
⎤
⎢⎢⎢
⎣
⎡−+
⎥⎥⎥
⎦
⎤
⎢⎢⎢
⎣
⎡=
⎥⎥⎥
⎦
⎤
⎢⎢⎢
⎣
⎡−
−
−
−
−
=∑
t
t
t
t
it
it
it
iii
iii
iiip
it
t
t
ECT
HCEY
LHCEY
L
3
2
1
1
333231
232221
131211
13
2
1
0
0
lnlnln
1lnlnln
1
εεε
ϑ
βββββββββ
ααα
(4)
In addition to the variables defined above, ( )L−1 is the lag operator, is the
lagged error-correction term derived from the long-run cointegrating relationship (this term is not included if the variables are not cointegrated) and
1−tECT
t1ε , t2ε and t3ε are serially independent random errors with mean zero and finite covariance matrix. In each case the dependent variable is regressed against past values of itself and other variables. The optimal lag length p is based on the Schwarz Bayesian Criterion. The existence of a cointegrating relationship among [ ]HC,E,Y tt suggests that there must be Granger causality in at least one direction, but it does not indicate the direction of temporal causality between the variables. Table 3 examines short run and long run Granger causality within the Error-Correction Mechanism (ECM). The F statistics on the explanatory variables in each of the three equations indicates the statistical significance of the short-run causal effects. In the equation when real exports is the dependent variable, the t-statistic on the coefficient of the lagged error-correction term indicates the statistical significance of the long-run causal effect. Beginning with the results for the long-run, the coefficient on the lagged error-correction term is significant with the expected sign in the real exports equation at 1 per cent, which confirms the result of the bounds test for cointegration. In the long run both human capital and real income Granger cause real exports, meaning that causality runs interactively through the error-correction term from human capital and real income to real exports. The coefficient on the lagged error-correction term (-0.518) suggests when once shocked convergence to equilibrium is rapid. The coefficient on the error-correction term implies that a deviation from the equilibrium level of real exports during the current period will be corrected by 52 per cent in the next period. In the short-run, the F statistics on the explanatory variables suggest that at the 5 per cent level or better there is bi-directional Granger causality between human capital and real exports, unidirectional Granger causality running from real income to human capital and neutrality between real exports and real income. Parameter Stability Hansen (1992) cautions that estimated parameters of a time series may vary over time. Parameter tests are important since unstable parameters can result in model misspecification, which have the potential to bias the results. To test for parameter stability we use the Pesaran and Pesaran (1997) test and Hanson (1992) suite of tests. According to Pesaran and Pesaran (1997), the short-run dynamics are essential in testing for the stability of the long-run coefficients. The Pesaran and Pesaran (1997) test involves estimating the following ECM for the equation where

Narayan and Smyth, International Journal of Applied Economics, 1(1), September 2004, 24-45 32
real exports is the dependent variable for this is the only equation which has a long-run relationship.
tt
p
iitit
n
i
m
iitt ECMHCYEE εκαααα ++∆+∆+∆+=∆ −
=−−
==− ∑∑∑ 1
03
02
110 lnlnlnln (5)
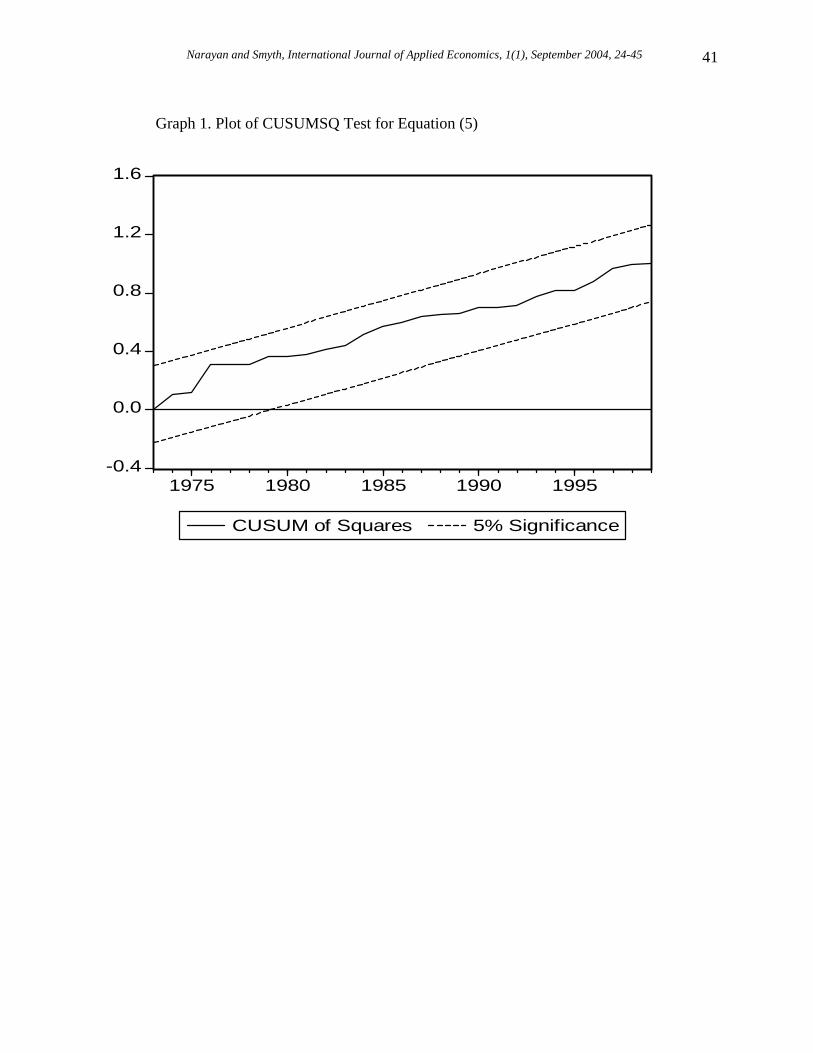
Here all variables are as previously defined and the error-correction term is calculated from the long run cointegrating vector. Once the model has been estimated, Pesaran and Pesaran (1997) suggest applying the cumulative sum of recursive residuals (CUSUM) and the CUSUM of square (CUSUMSQ) tests proposed by Brown et al. (1975) to assess the parameter constancy. The models were estimated by ordinary least squares and the residuals were subjected to the CUSUSM and CUSUMSQ tests. Graphs 1 and 2 plot the result for equation (5). The results indicate the absence of any instability of the coefficients because the plot of the CUSUMSQ and CUSUM statistic are confined within the 5 per cent critical bounds of parameter stability. Hansen (1992) recommends three tests for parameter stability: ,SupF MeanF , and . These tests vary in terms of the alternative hypothesis, but all have the same null hypothesis that the parameters are stable. When calculated probability values are greater than 0.05 then the null hypothesis is accepted. The results of the Hansen (1992) tests for the long-run equation where real exports is the dependent variable are presented in Table 4. There is strong evidence in favour of parameter stability.
CL
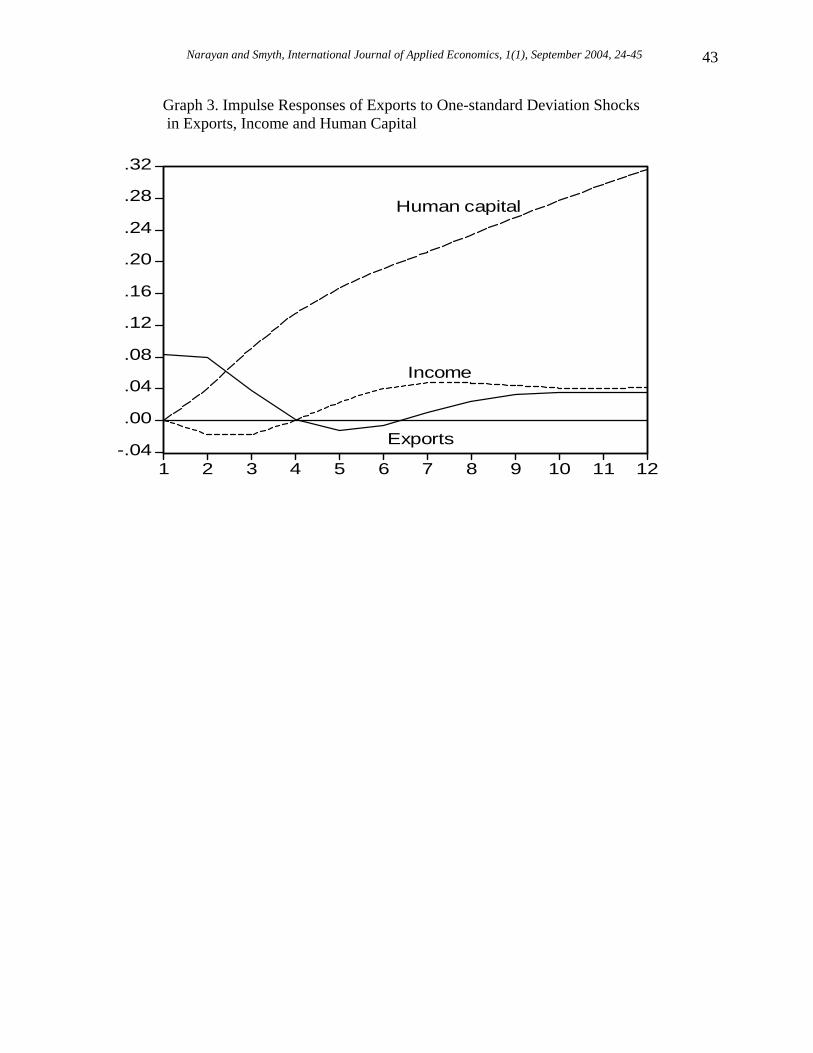
Variance Decompositions and Impulse Response Functions Detecting Granger causality is restricted to essentially within-sample tests, which are useful in discerning the plausible Granger exogeneity or endogeneity of the dependent variable in the sample period, but are unable to deduce the degree of exogeneity of the variables beyond the sample period. To examine this issue we consider the decomposition of variance, which measures the percentage of a variable’s forecast error variance that occurs as the result of a shock from a variable in the system. Sims (1980) notes that if a variable is truly exogenous with respect to the other variables in the system, own innovations will explain all of the variable’s forecast error variance. he variance decomposition results are summarised in table 5 over a 12-year period. Consistent with the findings from the cointegration and causality testing, the variance decomposition analysis indicates that human capital and real income are the most exogenous variables. A high proportion of their shocks are explained by their own innovations compared to the contributions of own shocks to innovations for real exports. At the end of 12 years, the forecast error variance for human capital and real income explained by their own innovations are 98.90 per cent and 45.74 per cent respectively, while the forecast error variance for real exports explained by its own innovations is 3.69 per cent. Interestingly, at the end of 12 years very little of the forecast error in human capital and real exports is explained by real income. An alternative method of obtaining information regarding the relationships among the variables included in the variance decomposition analysis is via generalized impulse response functions. Graphs 3-5 present impulse response functions. Graph 3 plots the response of real exports to shocks in real exports, real income and human capital. A shock in human capital has a positive and increasing effect on real exports over the 12-year period. A shock to real income

Narayan and Smyth, International Journal of Applied Economics, 1(1), September 2004, 24-45 33
initially has a negative effect on real exports and then has a positive effect after the fourth year. The response of real income to shocks in real income, real exports and human capital is plotted in graph 4. As in graph 3, shocks to human capital have the largest effect on real income. Consistent with the results of the decomposition of variance results, a large proportion of the variance in real income is explained by its own innovations. Graph 5 plots the response of human capital to shocks in real exports, real income and human capital. Most of the variance in human capital is explained by shocks to human capital with real exports having a small positive effect on human capital after the third year. Concluding Remarks This article has considered the relationship between exports, human capital and real income in China using cointegration and causality testing and extended this analysis to examine the degree of exogeneity of the variables beyond the sample period by employing variance decomposition analysis and impulse response functions. The results of the cointegration and causality testing suggest that (1) real exports, human capital and real income are cointegrated when real exports is the dependent variable, but are not cointegrated when human capital or real income are the dependent variable. (2) In the long run both human capital and real income Granger cause real exports. (3) In the short-run there is bi-directional Granger causality between human capital and real exports, unidirectional Granger causality running from real income to human capital and neutrality between real exports and real income. Our results do not support the export-led hypothesis. The results suggest that in the long-run China’s exceptional economic performance over the last 25 years was not propelled by export expansion with, instead, causality running from human capital stock and real income to real exports. This result is consistent with Shan and Tian’s (1998) findings for Shanghai, but differ from Kwan and Cotsomitis (1991) and Liu et al. (1997, 2001) who find evidence in favour of bi-directional causality between real exports and real income. While Chuang (2000) also found that real exports had no direct effect on real income in Taiwan, he found that real exports had an indirect effect on promoting real income through causing human capital accumulation. Our short-run results are consistent with the hypothesis that real exports have contributed to human capital formation and vice-versa, but because there is no causation running from human capital to real income, unlike Chuang (2000), we cannot conclude that real exports have contributed to real income via human capital formation.
References
Ahearne, A. G., J. G. Fernald, P. Lougani, and J. W. Schindler. 2003. “China and Emerging Asia: Comrades or Competitors?” Unpublished Paper, Board of Governors of the Federal Reserve System, Washington DC. Ahmad, J. 2001. “Causality Between Exports and Economic Growth: What Do the Econometric Studies Tell Us?” Pacific Economic Review, 6(1), 147-167. Asteriou, D. and G. M. Agiomirgianakis. 2001. “Human Capital and Economic Growth: Time Series Evidence from Greece,” Journal of Policy Modeling, 23(5), 481-489.

Narayan and Smyth, International Journal of Applied Economics, 1(1), September 2004, 24-45 34
Azariadis C. and A. Drazen. 1990. “Threshold Externalities in Economic Development,” Quarterly Journal of Economics, 105(2), 501-526. Balassa, B. 1985. “Exports, Policy Choices and Economic Growth in Developing Countries After the 1973 Oil Crisis,” Journal of Development Economics, 18(1), 23-35. Barro, R. 1991. “Economic Growth in a Cross Section of Countries,” Quarterly Journal of Economics, 106(2), 407-433. Barro, R. and J. W. Lee. 1993. “International Comparisons of Educational Attainment,” Journal of Monetary Economics, 32(3), 363-394. Baumol, W. 1986. “Productivity Growth, Convergence and Welfare: What the Long-run Data Shows,” American Economic Review, 76(5), 1072-1085. Benhabib, J. and M. Spiegel. 1994. “The Role of Human Capital in Economic Development: Evidence from Cross-Country Data,” Journal of Monetary Economics, 34(2), 143-173. Berman, E., J. Bound and S. Machin. 1998. “Implications of Skill-Biased Technical Change: International Evidence,” Quarterly Journal of Economics 113(4), 1245-1279. Bils, M. and P. Klenow. 2000, “Does Schooling Cause Growth?” American Economic Review, 90(5), 1160-1183. Brown, R. L, J. Durbin, and J. M. Evans. 1975. “Techniques for Testing the Constancy of Regression Relationships over Time,” Journal of the Royal Statistical Society, Series B, 37, 149-192. Caruso, M. 2002. “Procyclical Productivity and Output Growth in China: An Econometric Analysis,” Open Economies Review, 13(3), 251-274. Chenery, H. B. 1980. “Interactions between Industrialization and Exports,” American Economic Review 70(2), 281-287. Chuang, Y. C. 1998. “Learning By Doing, the Technology Gap and Growth,” International Economic Review, 39(3), 697-721. Chuang, Y. C. 2000. “Human Capital, Exports and Economic Growth: A Causality Analysis for Taiwan, 1952-1995,” Review of International Economics, 8(4), 712-720. De Meulemeester J. L. and D. Rochat. 1995. “A Causality Analysis of the Link between Higher Education and Development,” Economics of Education Review, 14(4), 351-361. Doms, M., T. Dunne, and K. Troske. 1997. “Workers, Wages and Technology,” Quarterly Journal of Economics, 112(1), 253-290.
Narayan and Smyth, International Journal of Applied Economics, 1(1), September 2004, 24-45 35
Easterly, W., R. King, R. Levine, and S. Rebelo. 1994. “Policy, Technology Adoption and Growth,” in L. Pasinetti and R. Solow (eds.) Economic Growth and the Structure of Long-term Developmen. New York, NY: St. Martins Press. Feder, G. 1983. “On Exports and Economic Growth,” Journal of Development Economics, 12(1-2), 59-73. Findlay, R. 1984. “Growth and Development in Trade Models,” in R. W. Jones and P. B. Kenen (eds.) Handbook of International Economics. Amsterdam: North Holland. Foster, A. and M. Rosenzweig. 1996. “Technical Change and Human Capital Returns and Investments: Evidence from the Green Revolution,” American Economic Review, 86(4), 931-953. Gould, D. and R. Ruffin. 1995. “Human Capital, Trade and Economic Growth,” Weltwirtschaftliches Archiv, 131(3), 425-445. Grossman, G. and E. Helpman. 1991. Innovation and Growth in the Global Economy, Cambridge MA: MIT Press. Hansen, B. E. 1992. “Tests for Parameter Stability in Regressions with I(1) Processes,” Journal of Business and Economic Statistics, 10(3), 321-335. Hanson, G. and A. Harrison. 1995. “Trade, Technology and Wage Inequality,” NBER Working Paper 5110. Helpman, E. and P. Krugman. 1990. Market Structure and Foreign Trade, Cambridge MA: MIT Press. Hsueh, T. T. and Q. Li. 1999. China’s National Income, Boulder, CO: Westview Press. In, F. and C. Doucouliagos. 1997. “Human Capital Formation and US Economic Growth: A Causality Analysis,” Applied Economics Letters, 4(5), 329-331. Jung, W. S. and P. J. Marshall. 1985. “Exports, Growth and Causality in Developing Countries,” Journal of Development Economics, 18(1), 1-12. Kanamori, M. 1968. “Economic Growth and Exports,” in L. R. Klein and K. Ohkawa (eds) Economic Growth, New York: Richard D. Irwin. Khan, S., W. D. Shaw, and F. Hussain. 1991. “Causality between Literacy and Labour Productivity in Pakistan,” Economics of Education Review, 10(3), 245-251. Kim, J. 1998. “Economic Analysis of Foreign Education and Students Abroad,” Journal of Development Economics, 56(2), 337-356.

Narayan and Smyth, International Journal of Applied Economics, 1(1), September 2004, 24-45 36
Kwan, A. C. C. and J. Cotsomitis. 1991. “Economic Growth and the Expanding Export Sector; China 1952-1985,” International Economic Journal, 5(1), 105-117. Lardy, N. 2002. Integrating China into the Global Economy, Washington DC: Brookings Institute Press. Liu, X., H. Song and P. Romilly. 1997. “An Empirical Investigation of the Causal Relationship Between Openness and Economic Growth in China,” Applied Economics, 29(12), 1679-1686. Liu, X., C. Wang and Y. Wei. 2001. “Causal Links between Foreign Direct Investment and Trade in China,” China Economic Review, 12(2-3), 190-202. Liu, X., P. Burridge and P. J. N. Sinclair. 2002. “Relationships between Economic Growth, Foreign Direct Investment and Trade: Evidence From China,” Applied Economics, 34(11), 1433-1440. Lucas, R. 1998. “On the Mechanics of Economic Development,” Journal of Monetary Economics, 22(11), 3-42. Pesaran, M. H. and B. Pesaran. 1997. Working with Microfit 4.0: Interactive Econometric Analysis, Oxford: Oxford University Press. Pesaran, M. H. and Y. Shin. 1999. “An Autoregressive Distributed Lag Modelling Approach to Cointegration Analysis,” in S. Strom, (ed) Econometrics and Economic Theory in the 20th Century: The Ragnar Frisch Centennial Symposium, Cambridge: Cambridge University Press. Pesaran, M. H., Y. Shin, and R. Smith. 2001. “Bounds Testing Approaches to the Analysis of Level Relationships,” Journal of Applied Econometrics, 16(3), 289-326. Pissarides, C. 1997. “Learning by Trading and the Returns to Human Capital in Developing Countries,” World Bank Economic Review, 11(1), 17-32. Romer, P. 1990. “Human Capital and Growth: Theory and Evidence,” Carnegie-Rochester Conference Series on Public Policy, 32, 251-285. Shan, J. 2002. “A Macroeconometric Model of Income Disparity in China,” International Economic Journal, 16(2), 47-63. Shan, J. and G. G. Tian. 1998. “Causality between Exports and Economic Growth: The Empirical Evidence From Shanghai,” Australian Economic Papers, 37(2), 195-202. Sims, C. 1980. “Macroeconomics and Reality,” Econometrica, 48(1), 1-49. Stokey, N. 1996. “Free Trade, Factor Returns and Factor Accumulation,” Journal of Economic Growth, 1(4), 255-271.

Narayan and Smyth, International Journal of Applied Economics, 1(1), September 2004, 24-45 37
Wang, Y. and Y. Yao. 2003. “Sources of China’s Economic Growth 1952-1999: Incorporating Human Capital Accumulation,” China Economic Review, 14(1), 32-52. Wang, Z. 2002. “WTO Accession, ‘Greater China’, Free Trade Area and Economic Relations Across the Taiwan Strait,” Unpublished Manuscript, United States Department of Agriculture, Washington DC. World Bank. 1985. Country Study: 1985 China. Washington DC: World Bank. World Bank. 2001. World Development Indicators, 2001. Washington DC: World Bank. Young, A. 2000. Gold into Base Metals: Productivity Growth in the People’s Republic of China during the Reform Period NBER Working Paper 7856.

Narayan and Smyth, International Journal of Applied Economics, 1(1), September 2004, 24-45 38
Table 1. Unit Root Tests (ADF and Phillips Perron) Variables ADF statistic [LL} CV PP statistic [BW] CV
tYln -2.3449 [0] -3.5297 2.4279 [13] -2.9389
tYln∆ -7.1037 [0] -2.9411 -15.9656 [37] -2.9411
tEln -1.8093 [0] -3.5297 -1.8093 [0] -3.5297
tEln∆ -5.2081 [0] -2.9411 -5.3169 [5] -2.9411
tHCln -1.3423 [7] -3.5577 -0.4467 [4] -3.5297
tHCln∆ -3.4019 [9] -3.2217* -1.8172 [6] -1.6115*
LL is Lag Length; CV is Critical values at 5% level; * CV at the 10% level; and BW is the Bandwidth.
Table 2. F-tests for Cointegration F -statistics 90% critical value bounds 95% critical value
bounds ( )0I ( )1I ( )0I ( )1I
( )=HC,EYFY 1.5646 2.835 3.585 3.435 4.260
( )=HC,YEFE 4.5939
( )=E,YHCFHC 2.0196
Critical values are calculated using stochastic simulations specific to the sample size of 40, based on 40,000 replications, as outlined in the text.

Narayan and Smyth, International Journal of Applied Economics, 1(1), September 2004, 24-45 39
Table 3. Results of Granger Causality
F statistics [probability] Dependent variable
tYln∆ tEln∆ tHCln∆ 1−tECT [t-statistics]
tYln∆ - 0.0383 [0.9625]
0.5281 [0.5948]
-
tEln∆ 0.3879 [0.6816]
- 8.2149*** [0.0069]
-0.5175 *** [-5.0728]
tHCln∆ 4.6062** [0.0174]
5.5813*** [0.0073]
- -
**(***) denotes statistical significance at the 5% and 1% levels respectively.
Table 4. Hansen Test for Parameter Stability in the Model where Exports is the Dependent Variable
Tests Test statistic Probability value
CL 0.0729 >0.20
MeanF 1.0849 >0.20
SupF 1.9865 >0.20
The test program is available from http//www.ssc.wisc.edu/bhansen/.

Narayan and Smyth, International Journal of Applied Economics, 1(1), September 2004, 24-45 40
Table 5. Decomposition of Variance (percentage of forecast variance explained by innovations) Variance Decomposition of exports
Period Exports Income Human capital 1 100.00 0.00 0.00 2 87.22 2.11 10.67 3 58.30 2.57 39.12 4 33.96 1.50 64.54 5 20.71 1.65 77.64 6 13.56 2.54 83.89 7 9.55 3.20 87.24 8 7.29 3.37 89.34 9 5.91 3.23 90.85 10 4.96 2.98 92.05 11 4.24 2.74 93.01 12 3.69 2.55 93.76
Variance Decomposition of income Period Exports Income Human capital
1 4.89 95.11 0.00 2 2.28 94.46 3.26 3 1.08 89.38 9.55 4 0.61 83.11 16.28 5 0.39 77.12 22.49 6 0.31 71.54 28.14 7 0.36 66.27 33.37 8 0.46 61.30 38.23 9 0.57 56.72 42.71 10 0.66 52.59 46.75 11 0.73 48.94 50.34 12 0.78 45.74 53.48
Variance Decomposition of human capital Period Exports Income Human capital
1 0.22 3.99 95.78 2 0.09 2.34 97.56 3 0.08 1.40 98.51 4 0.15 0.88 98.98 5 0.28 0.58 99.14 6 0.44 0.42 99.15 7 0.59 0.31 99.10 8 0.71 0.24 99.05 9 0.80 0.20 98.99 10 0.88 0.16 98.96 11 0.93 0.14 98.93 12 0.98 0.11 98.90
Narayan and Smyth, International Journal of Applied Economics, 1(1), September 2004, 24-45 41
Graph 1. Plot of CUSUMSQ Test for Equation (5)
-0.4
0.0
0.4
0.8
1.2
1.6
1975 1980 1985 1990 1995
CUSUM of Squares 5% Significance

Narayan and Smyth, International Journal of Applied Economics, 1(1), September 2004, 24-45 42
Graph 2. Plot of CUSUM Test for Equation (5)
-16
-12
-8
-4
0
4
8
12
16
1975 1980 1985 1990 1995
CUSUM 5% Significance
Narayan and Smyth, International Journal of Applied Economics, 1(1), September 2004, 24-45 43
Graph 3. Impulse Responses of Exports to One-standard Deviation Shocks in Exports, Income and Human Capital
-.04
.00
.04
.08
.12
.16
.20
.24
.28
.32
1 2 3 4 5 6 7 8 9 10 11 12
Human capital
Income
Exports

Narayan and Smyth, International Journal of Applied Economics, 1(1), September 2004, 24-45 44
Graph 4. Impulse Responses of Income to One-standard Deviation Shocks in Income, Exports and Human Capital
-.04
.00
.04
.08
.12
.16
.20
.24
1 2 3 4 5 6 7 8 9 10 11 12
Human capital
Income
Exports

Narayan and Smyth, International Journal of Applied Economics, 1(1), September 2004, 24-45 45
Graph 5. Impulse Responses of Human Capital to One-standard Deviation Shocks in Human Capital, Income and Exports
-.02
.00
.02
.04
.06
.08
.10
.12
.14
1 2 3 4 5 6 7 8 9 10 11 12
Income
Human capital
Exports