tembang project for personal use onlyactivities at its flagship tembang gold-silver project located...
TRANSCRIPT
Tembang Project Mineral Resource UpdateNew Mineral Resource Estimates Completed for Berenai, Siamang and Bujang
deposits
Sumatra Copper & Gold plc (“Sumatra” or “the Company”) is pleased to provide an update on activities at its flagship Tembang Gold-Silver Project located in Southern Sumatra, Indonesia (“Tembang” or “the Project”). Following completion of the 4,380m drilling program during the March 2015 quarter (ASX Announcement 30 April 2015), updated Mineral Resources estimates were completed for the Berenai, Siamang and Bujang deposits. The new resource models will form the basis of the final open pit designs in the lead-up to the commencement of mining activities scheduled for mid-2015.
Key Points
• Infill drilling at Siamang within the DFS Ore Reserve pit intersected wider zones of lower gradegold-silver mineralisation resulting in an overall increase in the Mineral Resource.
March 2015 Mineral Resource Estimate for Siamang
• Infill and extensional drilling completed at Berenai confirmed the 2014 Mineral Resource estimateand outlined an additional small mineralized lode in the footwall to the Berenai main lode.
March 2015 Mineral Resource Estimate for Berenai
• Extensional drilling at Bujang outside of the DFS pit design demonstrated continuity of the highgrade mineralisation down plunge towards the south-west. Hole RDD14445 intersected 2.2m at11.1g/t Au and 18g/t Ag from 100.9m.
Category Tonnage Au (g/t) Ag (g/t) Au (oz) Ag (oz) Measured 60,000 2.5 48.3 5,000 94,000 Indicated 178,000 2.1 28.0 12,000 160,000 Inferred 190,000 1.8 22.0 11,000 134,000
2015 Total 428,000 2.0 28.0 28,000 388,000 2014 Total 181,202 3.7 55.0 21,500 319,000
Category Tonnage Au (g/t) Ag (g/t) Au (oz) Ag (oz) Indicated 1,628,000 2.1 34.3 112,000 1,797,000
Inferred 669,000 1.7 31.8 36,000 685,000
2015 Total 2,297,000 2.0 33.6 148,000 2,482,000 2014 Total 1,869,000 2.0 33.3 123,000 2,001,000
For
per
sona
l use
onl
y

March 2015 Mineral Resource Estimate for Bujang Category Tonnage Au (g/t) Ag (g/t) Au (oz) Ag (oz)
Indicated 217,000 2.8 37.0 19,500 261,000
Inferred 69,000 1.9 20.0 4,000 44,000
2015 Total 286,000 2.6 33.0 24,000 305,000
2014 Total 272,000 2.6 34.0 23,000 298,000
• Two exploration drill holes were completed at the adjoining Racambai prospect. Hole RDD15480intersected 5.3m at 0.46g/t Au and 27g/t Ag from 103.5m confirming the presence of a significantmineralized structure coincident with a +1km long gold-in-soil geochemical anomaly.
Overview The phase 4 drilling program concluded in late March was mainly focused on infill and extensional drilling at the deposits scheduled for open pit development in the second half of 2015. A total of 52 holes were completed as summarised in the following table.
Table 1: Phase 4 drilling program physicals
Prospect
Drill Holes Samples QAQC
Type Hole (#)
DDH (m)
RC (m)
Total (m)
Avg (m) Primary(#) Avg /
hole Duplicate Blank Standard
Siamang Grade Control 15 368.0 787.6 1,155.6 77.0 293 20 11 11 11
Berenai Grade Control 18 188.6 968.0 1,156.6 64.3 885 49 83 35 47
Nuri Resource Ext 4 365.7 39.0 404.7 101.2 141 35 7 4 5
Bujang Resource Ext 6 193.8 343.0 536.8 89.5 147 25 5 7 5
Belinau Resource Def 2 310.0 0.0 310.0 155.0 87 44 3 4 3
Racambai Exploration 2 161.0 124.0 285.0 142.5 73 37 3 2 3
Plantsite-NW Exploration 2 97.0 93.0 190.0 95.0 25 13 0 1 1
Jenih Exploration 2 241.5 0.0 241.5 120.8 50 25 2 2 1
Guntur Exploration 1 66.0 34.0 100.0 100.0 56 56 1 3 1
Total 52 1,991.6 2,388.6 4,380.2 84.2 1,757 34 115 69 77
Sumatra’s Tembang project encompasses an extensive, low-sulphidation epithermal system comprising gold-silver bearing quartz-sulphide veins hosted in Miocene volcanic and volcaniclastic rocks (Figure 1). The Tembang project area lies within the back-arc environment of the Barisan Mountain range and Trans-Sumatra Fault Zone (TSFZ) with epithermal mineralization related to the intersection of arc parallel and arc normal faults and fractures.
2
For
per
sona
l use
onl
y

Gold-silver mineralization at Tembang is associated with a series of narrow quartz-chalcedony veins, vein breccias and vein stockworks with a low sulphide content. The veins and lodes display typical epithermal characteristics including crustiform-colloform banding, silica pseudomorphs after bladed calcite, rhombic adularia, amethyst and bands of fine grained dark sulphides (ginguro).
Figure 1: Schematic geology map with drill holes from the phase 3 and 4 programs (Dec 2014 - Mar 2015)
Siamang Mineral Resource Estimate A 15 hole infill (grade control) drilling program was completed at Siamang for a total of 1,156m. Significant drill hole intersections (+0.5g/t Au) are summarised in Table 7. A total of 76 drill holes for 6,523m were used for the March 2015 Siamang Mineral Resource estimate. The majority of the drill holes were spaced between 12.5m x 12.5m to 25m x25m, with some minor areas at a spacing of up to 50m. The Siamang deposit is a composite of 3 discrete lodes; Main, North and East. The Main and North lodes are hosted along a single NW to WNW oriented structure while Siamang East is a sub-parallel lode located approximately 50m east of Main lode. The interpreted Siamang mineralised domains have a combined strike length of approximately 460m orientated N-S to NNW-SSE, dipping steeply to moderately to the west. Individual interpreted vein systems / domains
3
For
per
sona
l use
onl
y
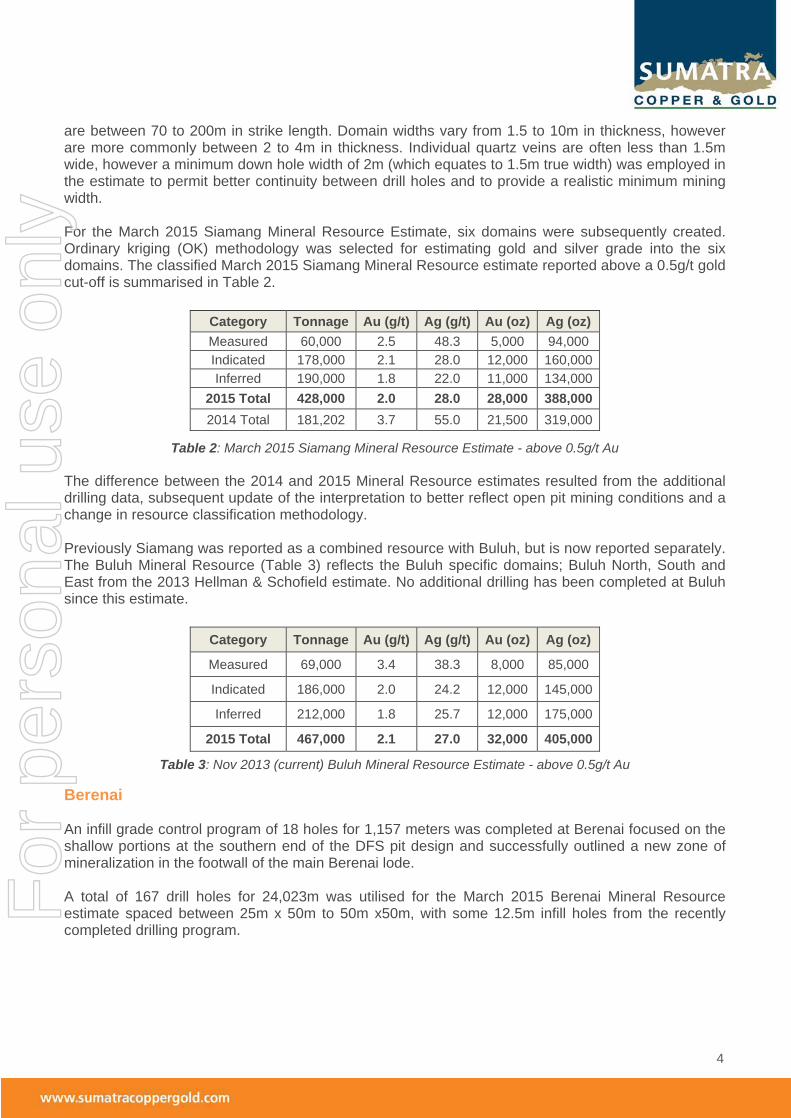
are between 70 to 200m in strike length. Domain widths vary from 1.5 to 10m in thickness, however are more commonly between 2 to 4m in thickness. Individual quartz veins are often less than 1.5m wide, however a minimum down hole width of 2m (which equates to 1.5m true width) was employed in the estimate to permit better continuity between drill holes and to provide a realistic minimum mining width. For the March 2015 Siamang Mineral Resource Estimate, six domains were subsequently created. Ordinary kriging (OK) methodology was selected for estimating gold and silver grade into the six domains. The classified March 2015 Siamang Mineral Resource estimate reported above a 0.5g/t gold cut-off is summarised in Table 2.
Table 2: March 2015 Siamang Mineral Resource Estimate - above 0.5g/t Au The difference between the 2014 and 2015 Mineral Resource estimates resulted from the additional drilling data, subsequent update of the interpretation to better reflect open pit mining conditions and a change in resource classification methodology. Previously Siamang was reported as a combined resource with Buluh, but is now reported separately. The Buluh Mineral Resource (Table 3) reflects the Buluh specific domains; Buluh North, South and East from the 2013 Hellman & Schofield estimate. No additional drilling has been completed at Buluh since this estimate.
Table 3: Nov 2013 (current) Buluh Mineral Resource Estimate - above 0.5g/t Au
Berenai An infill grade control program of 18 holes for 1,157 meters was completed at Berenai focused on the shallow portions at the southern end of the DFS pit design and successfully outlined a new zone of mineralization in the footwall of the main Berenai lode. A total of 167 drill holes for 24,023m was utilised for the March 2015 Berenai Mineral Resource estimate spaced between 25m x 50m to 50m x50m, with some 12.5m infill holes from the recently completed drilling program.
Category Tonnage Au (g/t) Ag (g/t) Au (oz) Ag (oz) Measured 60,000 2.5 48.3 5,000 94,000 Indicated 178,000 2.1 28.0 12,000 160,000 Inferred 190,000 1.8 22.0 11,000 134,000
2015 Total 428,000 2.0 28.0 28,000 388,000 2014 Total 181,202 3.7 55.0 21,500 319,000
Category Tonnage Au (g/t) Ag (g/t) Au (oz) Ag (oz)
Measured 69,000 3.4 38.3 8,000 85,000
Indicated 186,000 2.0 24.2 12,000 145,000
Inferred 212,000 1.8 25.7 12,000 175,000
2015 Total 467,000 2.1 27.0 32,000 405,000
4
For
per
sona
l use
onl
y
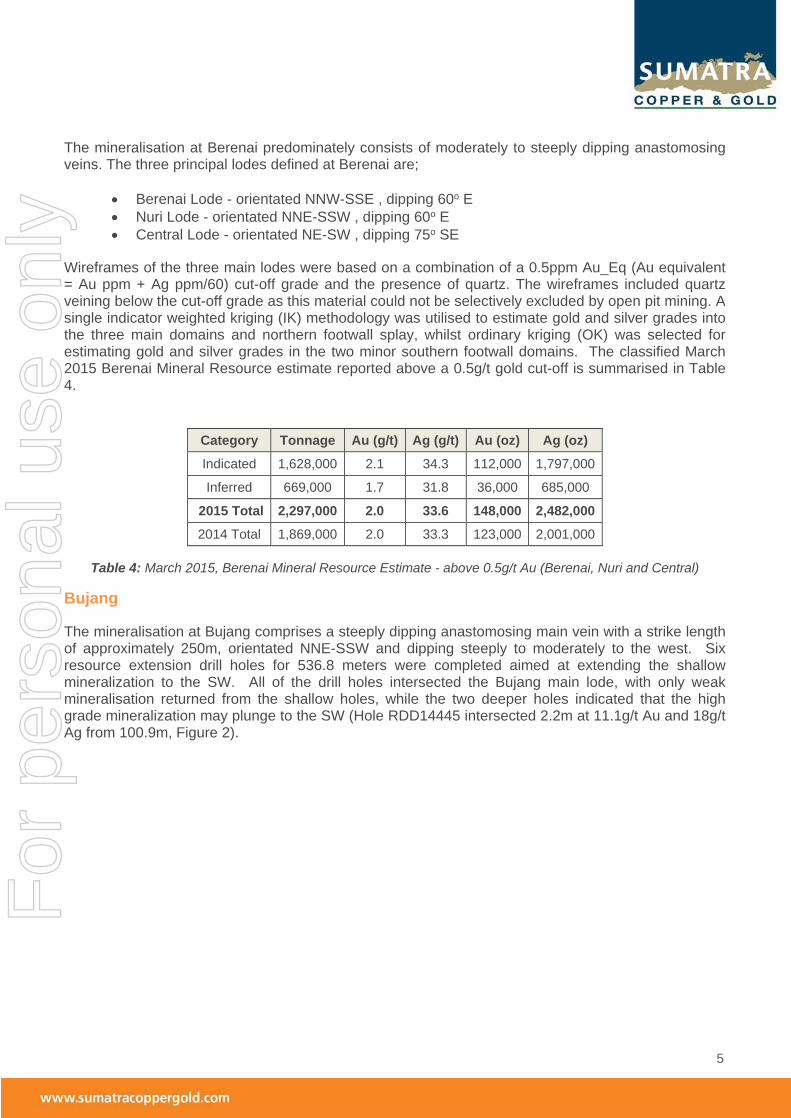
The mineralisation at Berenai predominately consists of moderately to steeply dipping anastomosing veins. The three principal lodes defined at Berenai are;
• Berenai Lode - orientated NNW-SSE , dipping 60o E • Nuri Lode - orientated NNE-SSW , dipping 60o E • Central Lode - orientated NE-SW , dipping 75o SE
Wireframes of the three main lodes were based on a combination of a 0.5ppm Au_Eq (Au equivalent = Au ppm + Ag ppm/60) cut-off grade and the presence of quartz. The wireframes included quartz veining below the cut-off grade as this material could not be selectively excluded by open pit mining. A single indicator weighted kriging (IK) methodology was utilised to estimate gold and silver grades into the three main domains and northern footwall splay, whilst ordinary kriging (OK) was selected for estimating gold and silver grades in the two minor southern footwall domains. The classified March 2015 Berenai Mineral Resource estimate reported above a 0.5g/t gold cut-off is summarised in Table 4.
Table 4: March 2015, Berenai Mineral Resource Estimate - above 0.5g/t Au (Berenai, Nuri and Central)
Bujang
The mineralisation at Bujang comprises a steeply dipping anastomosing main vein with a strike length of approximately 250m, orientated NNE-SSW and dipping steeply to moderately to the west. Six resource extension drill holes for 536.8 meters were completed aimed at extending the shallow mineralization to the SW. All of the drill holes intersected the Bujang main lode, with only weak mineralisation returned from the shallow holes, while the two deeper holes indicated that the high grade mineralization may plunge to the SW (Hole RDD14445 intersected 2.2m at 11.1g/t Au and 18g/t Ag from 100.9m, Figure 2).
Category Tonnage Au (g/t) Ag (g/t) Au (oz) Ag (oz) Indicated 1,628,000 2.1 34.3 112,000 1,797,000
Inferred 669,000 1.7 31.8 36,000 685,000
2015 Total 2,297,000 2.0 33.6 148,000 2,482,000 2014 Total 1,869,000 2.0 33.3 123,000 2,001,000
5
For
per
sona
l use
onl
y

Figure 2: Schematic long section of Bujang with interpreted gold grade contours
A total of 28 drill holes for 4,027m was utilised for the Mineral Resource estimate which comprise two domains;
• Bujang Main Lode • Bujang Footwall Lode
Ordinary kriging (OK) methodology was selected to estimate gold and silver grades into the domains. The classified March 2015 Bujang Mineral Resource estimate reported above a 0.5g/t gold cut-off is summarised in Table 5.
Category Tonnage Au (g/t) Ag (g/t) Au (oz) Ag (oz)
Indicated 217,000 2.8 37.0 19,500 261,000
Inferred 69,000 1.9 20.0 4,000 44,000
2015 Total 286,000 2.6 33.0 24,000 305,000
2014 Total 272,000 2.6 34.0 23,000 298,000
Table 5: March 2015 Mineral Resource estimate - above 0.5g/t Au
6
For
per
sona
l use
onl
y

For further information please contact: David Fowler Phil Retter Managing Director Investor Relations Sumatra Copper & Gold plc NWR Communications +61 8 6298 6200 M: +61 407 440 882 [email protected] [email protected] About Sumatra Copper & Gold Sumatra Copper & Gold plc (ASX: SUM) is an emerging gold and silver producer and the pre-eminent precious metals explorer in southern Sumatra, Indonesia. The Company has a significant project portfolio encompassing projects ranging from greenfields exploration projects to brownfields, near-production opportunities. Competent Person’s Statement – Exploration Results The information in this report that relates to Exploration Results is based on information compiled by Mr Devin den Boer, who is a full time employee of the company and a Member of the Association of Professional Engineers and Geoscientists of British Columbia (APEGBC). Mr den Boer has sufficient experience, which is relevant to the style of mineralisation and type of deposit under consideration and to the activity, which he is undertaking to qualify as a Competent Person as defined in the 2012 Edition of the 'Australasian Code for Reporting of Exploration Results, Mineral Resources and Ore Reserves'. Mr den Boer consents to the inclusion in this report of the matters based on his information in the form and context in which it appears. Competent Person’s Statement – Mineral Resources Asmar, Berenai, Siamang, Tembang-Anang and Bujang The information in the report to which this statement is attached that relates to the Mineral Resource estimates for Asmar, Berenai, Tembang-Anang, Siamang and Bujang is based on information compiled by Mr Chris Black who is a member of AIG and a full time employee of Cube Consulting. Mr Chris Black has sufficient experience that is relevant to the style of mineralisation and type of deposit under consideration and to the activity being undertaken to qualify as a Competent Person as defined in the 2012 Edition of the Australian code for reporting of Exploration Results, Mineral Resource and Ore Reserves'. Mr Chris Black consents to the inclusion in the report of the matter based on his information in the form and context in which it appears. Competent Person’s Statement – Mineral Resources Buluh and Belinau The information in the report to which this statement is attached that relates to the Mineral Resource estimate for Buluh and Belinau, is based on information compiled by Mr Robert Spiers who is a member of AIG and a full time employee of H & S Consultants Pty Ltd. Mr Robert Spiers has sufficient experience that is relevant to the style of mineralisation and type of deposit under consideration and to the activity being undertaken to qualify as a Competent Person as defined in the 2012 Edition of the 'Australian code for reporting of Exploration Results, Mineral Resource and Ore Reserves'. Mr Robert Spiers consents to the inclusion in the report of the matter based on his information in the form and context in which it appears.
7
For
per
sona
l use
onl
y
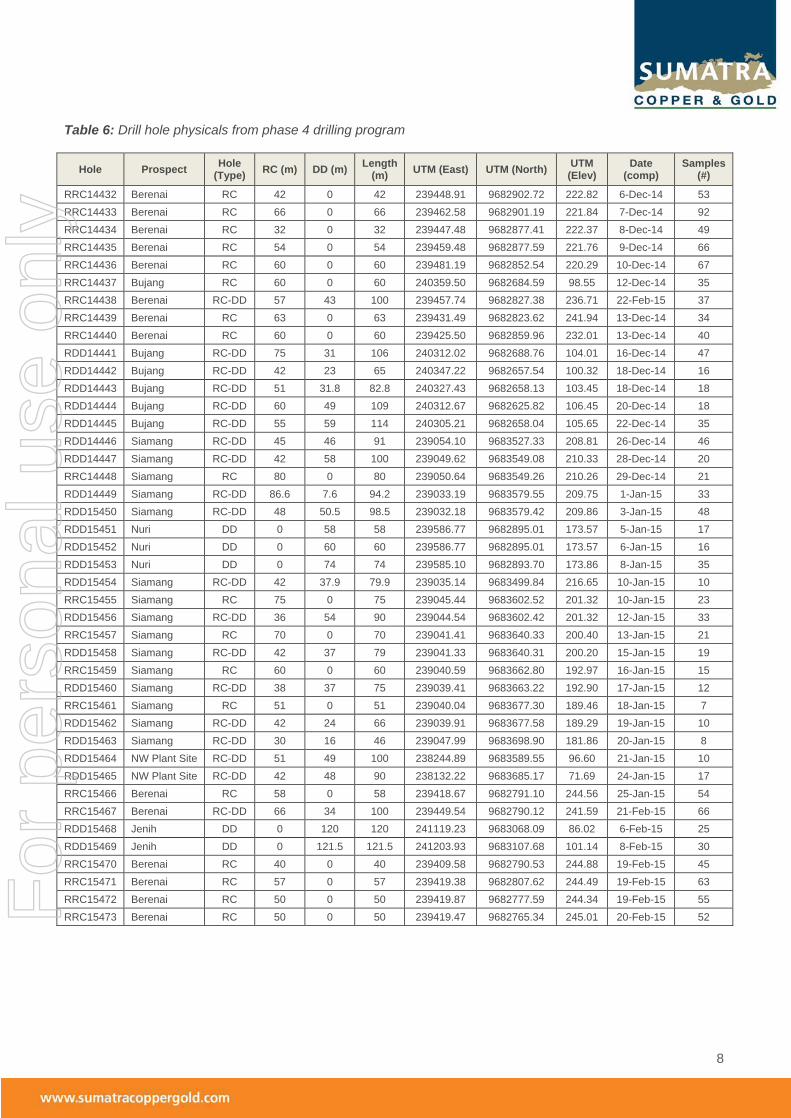
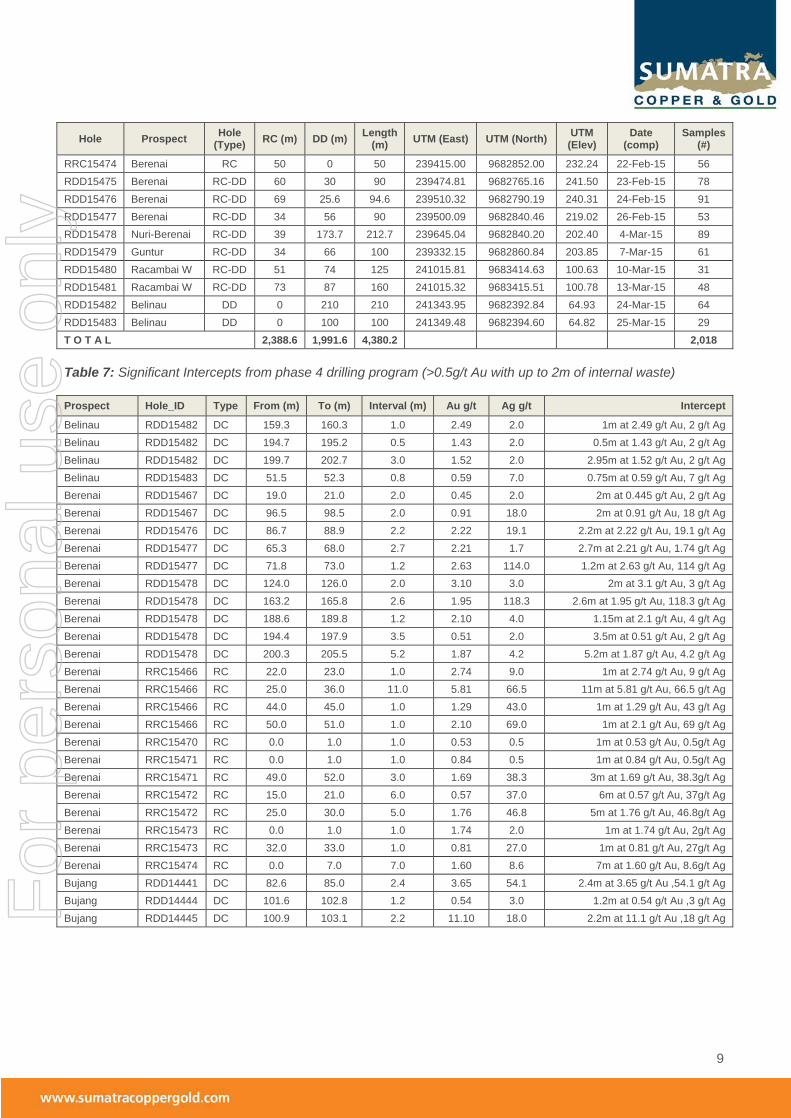
Table 6: Drill hole physicals from phase 4 drilling program
Hole Prospect Hole (Type) RC (m) DD (m) Length
(m) UTM (East) UTM (North) UTM (Elev)
Date (comp)
Samples (#)
RRC14432 Berenai RC 42 0 42 239448.91 9682902.72 222.82 6-Dec-14 53 RRC14433 Berenai RC 66 0 66 239462.58 9682901.19 221.84 7-Dec-14 92 RRC14434 Berenai RC 32 0 32 239447.48 9682877.41 222.37 8-Dec-14 49 RRC14435 Berenai RC 54 0 54 239459.48 9682877.59 221.76 9-Dec-14 66 RRC14436 Berenai RC 60 0 60 239481.19 9682852.54 220.29 10-Dec-14 67 RRC14437 Bujang RC 60 0 60 240359.50 9682684.59 98.55 12-Dec-14 35 RRC14438 Berenai RC-DD 57 43 100 239457.74 9682827.38 236.71 22-Feb-15 37 RRC14439 Berenai RC 63 0 63 239431.49 9682823.62 241.94 13-Dec-14 34 RRC14440 Berenai RC 60 0 60 239425.50 9682859.96 232.01 13-Dec-14 40 RDD14441 Bujang RC-DD 75 31 106 240312.02 9682688.76 104.01 16-Dec-14 47 RDD14442 Bujang RC-DD 42 23 65 240347.22 9682657.54 100.32 18-Dec-14 16 RDD14443 Bujang RC-DD 51 31.8 82.8 240327.43 9682658.13 103.45 18-Dec-14 18 RDD14444 Bujang RC-DD 60 49 109 240312.67 9682625.82 106.45 20-Dec-14 18 RDD14445 Bujang RC-DD 55 59 114 240305.21 9682658.04 105.65 22-Dec-14 35 RDD14446 Siamang RC-DD 45 46 91 239054.10 9683527.33 208.81 26-Dec-14 46 RDD14447 Siamang RC-DD 42 58 100 239049.62 9683549.08 210.33 28-Dec-14 20 RRC14448 Siamang RC 80 0 80 239050.64 9683549.26 210.26 29-Dec-14 21 RDD14449 Siamang RC-DD 86.6 7.6 94.2 239033.19 9683579.55 209.75 1-Jan-15 33 RDD15450 Siamang RC-DD 48 50.5 98.5 239032.18 9683579.42 209.86 3-Jan-15 48 RDD15451 Nuri DD 0 58 58 239586.77 9682895.01 173.57 5-Jan-15 17 RDD15452 Nuri DD 0 60 60 239586.77 9682895.01 173.57 6-Jan-15 16 RDD15453 Nuri DD 0 74 74 239585.10 9682893.70 173.86 8-Jan-15 35 RDD15454 Siamang RC-DD 42 37.9 79.9 239035.14 9683499.84 216.65 10-Jan-15 10 RRC15455 Siamang RC 75 0 75 239045.44 9683602.52 201.32 10-Jan-15 23 RDD15456 Siamang RC-DD 36 54 90 239044.54 9683602.42 201.32 12-Jan-15 33 RRC15457 Siamang RC 70 0 70 239041.41 9683640.33 200.40 13-Jan-15 21 RDD15458 Siamang RC-DD 42 37 79 239041.33 9683640.31 200.20 15-Jan-15 19 RRC15459 Siamang RC 60 0 60 239040.59 9683662.80 192.97 16-Jan-15 15 RDD15460 Siamang RC-DD 38 37 75 239039.41 9683663.22 192.90 17-Jan-15 12 RRC15461 Siamang RC 51 0 51 239040.04 9683677.30 189.46 18-Jan-15 7 RDD15462 Siamang RC-DD 42 24 66 239039.91 9683677.58 189.29 19-Jan-15 10 RDD15463 Siamang RC-DD 30 16 46 239047.99 9683698.90 181.86 20-Jan-15 8 RDD15464 NW Plant Site RC-DD 51 49 100 238244.89 9683589.55 96.60 21-Jan-15 10 RDD15465 NW Plant Site RC-DD 42 48 90 238132.22 9683685.17 71.69 24-Jan-15 17 RRC15466 Berenai RC 58 0 58 239418.67 9682791.10 244.56 25-Jan-15 54 RRC15467 Berenai RC-DD 66 34 100 239449.54 9682790.12 241.59 21-Feb-15 66 RDD15468 Jenih DD 0 120 120 241119.23 9683068.09 86.02 6-Feb-15 25 RDD15469 Jenih DD 0 121.5 121.5 241203.93 9683107.68 101.14 8-Feb-15 30 RRC15470 Berenai RC 40 0 40 239409.58 9682790.53 244.88 19-Feb-15 45 RRC15471 Berenai RC 57 0 57 239419.38 9682807.62 244.49 19-Feb-15 63 RRC15472 Berenai RC 50 0 50 239419.87 9682777.59 244.34 19-Feb-15 55 RRC15473 Berenai RC 50 0 50 239419.47 9682765.34 245.01 20-Feb-15 52
8
For
per
sona
l use
onl
y
Hole Prospect Hole (Type) RC (m) DD (m) Length
(m) UTM (East) UTM (North) UTM (Elev)
Date (comp)
Samples (#)
RRC15474 Berenai RC 50 0 50 239415.00 9682852.00 232.24 22-Feb-15 56 RDD15475 Berenai RC-DD 60 30 90 239474.81 9682765.16 241.50 23-Feb-15 78 RDD15476 Berenai RC-DD 69 25.6 94.6 239510.32 9682790.19 240.31 24-Feb-15 91 RDD15477 Berenai RC-DD 34 56 90 239500.09 9682840.46 219.02 26-Feb-15 53 RDD15478 Nuri-Berenai RC-DD 39 173.7 212.7 239645.04 9682840.20 202.40 4-Mar-15 89 RDD15479 Guntur RC-DD 34 66 100 239332.15 9682860.84 203.85 7-Mar-15 61 RDD15480 Racambai W RC-DD 51 74 125 241015.81 9683414.63 100.63 10-Mar-15 31 RDD15481 Racambai W RC-DD 73 87 160 241015.32 9683415.51 100.78 13-Mar-15 48 RDD15482 Belinau DD 0 210 210 241343.95 9682392.84 64.93 24-Mar-15 64 RDD15483 Belinau DD 0 100 100 241349.48 9682394.60 64.82 25-Mar-15 29 T O T A L 2,388.6 1,991.6 4,380.2 2,018 Table 7: Significant Intercepts from phase 4 drilling program (>0.5g/t Au with up to 2m of internal waste) Prospect Hole_ID Type From (m) To (m) Interval (m) Au g/t Ag g/t Intercept
Belinau RDD15482 DC 159.3 160.3 1.0 2.49 2.0 1m at 2.49 g/t Au, 2 g/t Ag Belinau RDD15482 DC 194.7 195.2 0.5 1.43 2.0 0.5m at 1.43 g/t Au, 2 g/t Ag Belinau RDD15482 DC 199.7 202.7 3.0 1.52 2.0 2.95m at 1.52 g/t Au, 2 g/t Ag Belinau RDD15483 DC 51.5 52.3 0.8 0.59 7.0 0.75m at 0.59 g/t Au, 7 g/t Ag Berenai RDD15467 DC 19.0 21.0 2.0 0.45 2.0 2m at 0.445 g/t Au, 2 g/t Ag Berenai RDD15467 DC 96.5 98.5 2.0 0.91 18.0 2m at 0.91 g/t Au, 18 g/t Ag Berenai RDD15476 DC 86.7 88.9 2.2 2.22 19.1 2.2m at 2.22 g/t Au, 19.1 g/t Ag Berenai RDD15477 DC 65.3 68.0 2.7 2.21 1.7 2.7m at 2.21 g/t Au, 1.74 g/t Ag Berenai RDD15477 DC 71.8 73.0 1.2 2.63 114.0 1.2m at 2.63 g/t Au, 114 g/t Ag Berenai RDD15478 DC 124.0 126.0 2.0 3.10 3.0 2m at 3.1 g/t Au, 3 g/t Ag Berenai RDD15478 DC 163.2 165.8 2.6 1.95 118.3 2.6m at 1.95 g/t Au, 118.3 g/t Ag Berenai RDD15478 DC 188.6 189.8 1.2 2.10 4.0 1.15m at 2.1 g/t Au, 4 g/t Ag Berenai RDD15478 DC 194.4 197.9 3.5 0.51 2.0 3.5m at 0.51 g/t Au, 2 g/t Ag Berenai RDD15478 DC 200.3 205.5 5.2 1.87 4.2 5.2m at 1.87 g/t Au, 4.2 g/t Ag Berenai RRC15466 RC 22.0 23.0 1.0 2.74 9.0 1m at 2.74 g/t Au, 9 g/t Ag Berenai RRC15466 RC 25.0 36.0 11.0 5.81 66.5 11m at 5.81 g/t Au, 66.5 g/t Ag Berenai RRC15466 RC 44.0 45.0 1.0 1.29 43.0 1m at 1.29 g/t Au, 43 g/t Ag Berenai RRC15466 RC 50.0 51.0 1.0 2.10 69.0 1m at 2.1 g/t Au, 69 g/t Ag Berenai RRC15470 RC 0.0 1.0 1.0 0.53 0.5 1m at 0.53 g/t Au, 0.5g/t Ag Berenai RRC15471 RC 0.0 1.0 1.0 0.84 0.5 1m at 0.84 g/t Au, 0.5g/t Ag Berenai RRC15471 RC 49.0 52.0 3.0 1.69 38.3 3m at 1.69 g/t Au, 38.3g/t Ag Berenai RRC15472 RC 15.0 21.0 6.0 0.57 37.0 6m at 0.57 g/t Au, 37g/t Ag Berenai RRC15472 RC 25.0 30.0 5.0 1.76 46.8 5m at 1.76 g/t Au, 46.8g/t Ag Berenai RRC15473 RC 0.0 1.0 1.0 1.74 2.0 1m at 1.74 g/t Au, 2g/t Ag Berenai RRC15473 RC 32.0 33.0 1.0 0.81 27.0 1m at 0.81 g/t Au, 27g/t Ag Berenai RRC15474 RC 0.0 7.0 7.0 1.60 8.6 7m at 1.60 g/t Au, 8.6g/t Ag Bujang RDD14441 DC 82.6 85.0 2.4 3.65 54.1 2.4m at 3.65 g/t Au ,54.1 g/t Ag Bujang RDD14444 DC 101.6 102.8 1.2 0.54 3.0 1.2m at 0.54 g/t Au ,3 g/t Ag Bujang RDD14445 DC 100.9 103.1 2.2 11.10 18.0 2.2m at 11.1 g/t Au ,18 g/t Ag
9
For
per
sona
l use
onl
y

Prospect Hole_ID Type From (m) To (m) Interval (m) Au g/t Ag g/t Intercept
Guntur RDD15479 RC 23.0 26.0 3.0 1.28 34.0 3m at 1.28 g/t Au, 34 g/t Ag Guntur RDD15479 RC 30.0 34.0 4.0 0.87 16.5 4m at 0.87 g/t Au, 16.5 g/t Ag Guntur RDD15479 DC 48.7 49.2 0.5 2.01 45.0 0.5m at 2.01 g/t Au, 45 g/t Ag Guntur RDD15479 DC 72.3 72.8 0.5 1.85 64.0 0.5m at 1.85 g/t Au, 64 g/t Ag Jenih RDD15468 DC 74.8 75.8 1.0 0.55 16.0 1m at 0.55 g/t Au, 16 g/t Ag Jenih RDD15469 DC 49.9 51.2 1.3 0.61 52.0 1.3m at 0.61 g/t Au, 52 g/t Ag Jenih RDD15469 DC 58.7 59.3 0.6 0.76 3.0 0.6m at 0.76 g/t Au, 3 g/t Ag Nuri RDD15451 DD 32.5 33.5 1.0 4.47 5.0 0.95m at 4.47 g/t Au,5 g/t Ag Nuri RDD15452 DD 29.0 30.0 1.0 7.10 12.0 1m at 7.1 g/t Au,12 g/t Ag Nuri RDD15453 DC 45.4 46.7 1.3 7.48 7.0 1.3m at 7.48 g/t Au, 7 g/t Ag Nuri RDD15453 DC 56.0 57.7 1.7 4.66 387.2 1.7m at 4.66 g/t Au, 387.2 g/t Ag Nuri RDD15453 DC 66.4 68.2 1.8 1.81 62.4 1.8m at 1.81 g/t Au, 62.4 g/t Ag NW Plant Site RDD15465 RC 34.0 35.0 1.0 0.57 2.0 1m at 0.57 g/t Au, 2 g/t Ag NW Plant Site RDD15465 DC 68.7 69.3 0.6 0.46 3.0 0.6m at 0.46 g/t Au, 3 g/t Ag Racambai RDD15480 DC 103.5 108.8 5.3 0.46 27.0 5.3m at 0.46 g/t Au, 27 g/t Ag Racambai RDD15481 DC 136.9 137.9 1.0 0.56 10.0 1m at 0.56 g/t Au, 10 g/t Ag Siamang RDD14446 DD 52.3 53.7 1.4 7.59 405.0 1.4m at 7.59 g/t Au,405 g/t Ag Siamang RDD14446 DD 76.4 83.6 7.2 2.10 98.6 7.2m at 2.1 g/t Au,98.6 g/t Ag Siamang RDD14447 DD 66.0 75.1 9.1 1.45 70.9 9.1m at 1.45 g/t Au,70.9 g/t Ag Siamang RDD14449 DD 92.0 93.0 1.0 2.54 101.0 1m at 2.54 g/t Au,101 g/t Ag Siamang RDD15450 DD 84.4 87.9 3.6 6.79 211.3 3.55m at 6.79 g/t Au,211.3 g/t Ag Siamang RDD15454 DC 60.4 61.9 1.5 6.78 11.9 1.5m at 6.783 g/t Au, 11.9 g/t Ag Siamang RDD15456 DC 50.4 52.8 2.4 2.88 14.8 2.4m at 2.877 g/t Au, 14.8 g/t Ag Siamang RDD15456 DC 61.0 67.6 6.6 1.02 20.2 6.6m at 1.021 g/t Au, 20.2 g/t Ag Siamang RDD15458 DC 58.9 61.0 2.1 1.10 75.7 2.1m at 1.101 g/t Au, 75.7 g/t Ag Siamang RDD15458 DC 65.9 69.2 3.3 0.54 9.4 3.3m at 0.535 g/t Au, 9.4 g/t Ag Siamang RDD15460 DC 58.5 67.5 9.0 1.39 28.6 9m at 1.39 g/t Au, 28.6 g/t Ag Siamang RDD15462 DC 57.6 58.8 1.2 0.45 6.0 1.2m at 0.45 g/t Au, 6 g/t Ag Siamang RDD15463 DC 32.0 38.2 6.2 1.36 41.9 6.2m at 1.36 g/t Au, 41.9 g/t Ag Siamang RRC15455 RC 41.0 45.0 4.0 1.33 38.0 4m at 1.33 g/t Au, 38 g/t Ag Siamang RRC15457 RC 45.0 55.0 10.0 1.80 59.5 10m at 1.8 g/t Au, 59.5 g/t Ag Siamang RRC15457 RC 61.0 62.0 1.0 2.35 21.0 1m at 2.35 g/t Au, 21 g/t Ag Siamang RRC15459 RC 42.0 48.0 6.0 1.73 27.2 6m at 1.73 g/t Au, 27.2 g/t Ag Siamang RRC15459 RC 50.0 51.0 1.0 1.28 20.0 1m at 1.28 g/t Au, 20 g/t Ag Siamang RRC15461 RC 45.0 47.0 2.0 2.01 11.0 2m at 2.01 g/t Au, 11 g/t Ag Siamang RRC15461 RC 50.0 51.0 1.0 2.89 82.0 1m at 2.89 g/t Au, 82 g/t Ag
10
For
per
sona
l use
onl
y

Table 8: Tembang Project Mineral Resource Statement as at March 2015
Mineral Deposit OPEN PIT (>0.5g/t Au)
Category Tonnes Au (g/t) Ag (g/t) Au (oz) Ag (oz)
Asmar (2)
Measured - - - - -
Indicated 1,636,000 1.2 20.6 64,000 1,082,000
Inferred 1,509,000 1.4 11.9 68,000 577,000
Total 3,145,000 1.3 16.4 132,000 1,659,000
Berenai (4)
Measured - - - - -
Indicated 1,628,000 2.1 34.3 112,000 1,797,000
Inferred 669,000 1.7 31.8 36,000 685,000
Total 2,297,000 2.0 33.6 148,000 2,482,000
Buluh (1)
Measured 69,000 3.4 38.3 8,000 85,000
Indicated 186,000 2.0 24.2 12,000 145,000
Inferred 212,000 1.8 25.7 12,000 175,000
Total 467,000 2.1 27.0 32,000 405,000
Siamang (4)
Measured 60,000 2.5 48.3 5,000 94,000
Indicated 178,000 2.1 28.0 12,000 160,000
Inferred 190,000 1.8 22.0 11,000 134,000
Total 428,000 2.0 28.0 28,000 388,000
Bujang (4)
Measured - - - - -
Indicated 217,000 2.8 37.0 19,500 261,000
Inferred 69,000 1.9 20.0 4,000 44,000
Total 286,000 2.6 33.0 24,000 305,000
Tembang / Anang (3)
Measured - - - - -
Indicated 170,000 2.5 29.3 13,500 160,000
Inferred 55,000 2.1 29.9 4,000 53,000
Total 226,000 2.4 29.4 17,500 214,000
Total (OP)
Measured 129,000 3.1 43.2 13,000 179,000
Indicated 4,015,000 1.8 27.9 234,000 3,606,000
Inferred 2,704,000 1.6 19.2 135,000 1,669,000
Total 6,850,000 1.7 25.0 381,000 5,453,000
11
For
per
sona
l use
onl
y

Mineral Deposit UNDERGROUND (>2.78g/t Au)
Category Tonnes Au (g/t) Ag (g/t) Au (oz) Ag (oz)
Belinau (1)
Measured 132,000 9.7 70.0 41,000 298,000
Indicated 139,000 9.0 77.0 40,000 346,000
Inferred 67,000 7.3 65.0 16,000 141,000
Total 338,000 8.9 72.0 97,000 785,000
Grand Total (OP + UG)
Measured 261,000 6.4 56.7 54,000 477,000
Indicated 4,172,000 2.1 29.7 274,000 3,952,000
Inferred 2,771,000 1.7 20.2 151,000 1,810,000
Total 7,204,000 2.1 27.0 478,000 6,257,000
Notes: 1: updated Nov, 2013 by Rob Spiers, Hellman & Schofield in compliance with JORC 2012 2: updated Nov, 2013 by Chris Black, Cube Consulting, in compliance with JORC 2012 3: updated March, 2014 by Chris Black, Cube Consulting in compliance with JORC 2012 4: updated March, 2015 by Chris Black, Cube Consulting in compliance with JORC 2012 Estimates have been rounded to the nearest 1,000 t, 0.1 g/t grade and 1,000 oz metal
12
For
per
sona
l use
onl
y

Appendix JORC Code, 2012 Edition JORC TABLE 1: THE INFORMATION IN THIS TABLE REFERS TO THE FOLLOWING PROJECTS: BERENAI, BUJANG AND SIAMANG Section 1: Sampling Techniques and Data (Criteria in this section apply to all succeeding sections) Criteria JORC Code explanation Commentary
Sampling techniques
Nature and quality of sampling (e.g. cut channels, random chips, or specific specialised industry standard measurement tools appropriate to the minerals under investigation, such as down hole gamma sondes, or handheld XRF instruments, etc). These examples should not be taken as limiting the broad meaning of sampling.
• Drill hole samples of Reverse Circulation (RC), Diamond Core (DC) and surfac rock chip samples have been collected
• Recently, magnetic susceptibility measurements have been collected with a hand held KT-6 Portable Kappameter
Include reference to measures taken to ensure sample representivity and the appropriate calibration of any measurement tools or systems used.
• Diamond core samples are split with diamond saw and 50% collected for sampling • Reverse Circulation samples are collected and split at the drill with triple tiered sample splitter
resulting in a 12.5% or 1/8 split with an approximate sample weight of 2-3 kg • Drilling samples are collected continuously with minimum/maximum sample size of 0.5m and 2.0m
respectively • All visual mineralization is sampled including sampling past the perceived zone of mineralization
and into fresh rock • Surface samples are collected to best represent the trend of perceived mineralization ie. across the
vein Aspects of the determination of mineralisation that are Material to the Public Report. In cases where ‘industry standard’ work has been done this would be relatively simple (e.g. ‘reverse
• Industry Standard Work where diamond core and reverse circulation drilling is carried out and sampled on selective, regular intervals based on observed geological parameter
• Mineralization is associated to quartz vein lodes and 1m average sample size is collected for both diamond core and RC drilling methods (min/max sample sizes are 0.5m/2.0m)
13
For
per
sona
l use
onl
y

Criteria JORC Code explanation Commentary
circulation drilling was used to obtain 1 m samples from which 3 kg was pulverised to produce a 30 g charge for fire assay’). In other cases more explanation may be required, such as where there is coarse gold that has inherent sampling problems. Unusual commodities or mineralisation types (e.g. submarine nodules) may warrant disclosure of detailed information.
• Drill samples are analysed for gold (Au) and silver (Ag) with industry standard 50g fire assay for Au and 2-acid digestion of a 0.5gtam sample with AAS finish for Ag
• Gold samples >50g/t Au are reanalysed with gravimetric method • Silver samples >100g/t Ag are reanalysed with 4-acid digestion with AAS finish • Surface samples are being collected for Au and a standard multi-element ICP OES package that
includes silver and common pathfinder minerals in epithermal systems
Drilling techniques
Drill type (e.g. core, reverse circulation, open-hole hammer, rotary air blast, auger, Bangka, sonic, etc) and details (e.g. core diameter, triple or standard tube, depth of diamond tails, face-sampling bit or other type, whether core is oriented and if so, by what method, etc).
• A Hanjin S&B POWER6000DD-RC multipurpose drill rig was used for the recent drilling program capable of drilling HQ diamond core to 500 meter depths
• HQ / HQ-3 sized diamond drill core is used • Standard wireline triple-tube (split sets) are used. • Core is oriented where ever possible using a digital core orientation tool ORIFINDER® Core
Orientation System • Reverse Circulation drilling uses standard double walled drill pipe and face sampling hammer
Drill sample recovery
Method of recording and assessing core and chip sample recoveries and results assessed.
• A geo-technicican is present at each drill 24/7. • All diamond drill core is laid out at the rig in ½ PVC pipe for inspection. • Geotechnicican records recovery and RQD at the drill befoe core is moved. • Dry, complete RC samples are weighed at the drill rig (~30kg)
Measures taken to maximise sample recovery and ensure representative nature of the samples.
• HQ3 triple tube (split sets) are usedto maximize core recovery. • Drillers are informed prior to start of hole where zones of interest are expected. • Once quartz vein lodes are intersected, drillers use short (1.5m) core runs. • Drilling mud and additives professionals have been to site to plan suitable mud mixes and
recommend techniques and materials to improve recoveries in low recovery zones Whether a relationship exists between sample recovery and grade and whether sample bias may have occurred due to preferential loss/gain of fine/coarse material.
• Core recoveries for mineralized material >0.4g/t Au averages >85% (all project data) • It is likely that sample repesentativity is poor in rare zones with sample recoveries <50% • Considering that Mineral Resource estimates are based on 100% diamond drilling and core
recoveries <50% are rare it is concluded that there is no appreciable sample bias
Logging Whether core and chip samples have been geologically and geotechnically logged to a level of detail to support appropriate Mineral Resource estimation, mining studies and metallurgical studies.
• Geotechnical and recovery data is collected at the drill with whole core and prior to transporting core to logging facility
• Drill core is logged for geotechncial and structural geology, lithology, alteration, mineralization and mineralogy, presence and type of quartz veining, and presence/intensity of Fe-oxides.
• Structural data including veins, shears, fractures are recorded relative to the core axis
14
For
per
sona
l use
onl
y

Criteria JORC Code explanation Commentary
• Where core has been oriented measurements are collected using alpha/beta method • Reverse circulation chips samples are collected and logged at the drill by a geologist • Logging is of a suitable standard to allow for detailed geological and resource modelling
Whether logging is qualitative or quantitative in nature. Core (or costean, channel, etc) photography.
• Core logging is both qualitative and quantitative. • Core logging is completed at a suitable facility (on waist high inclined benches, in dry conditions
and with sufficient natural light) • Drill core is logged for Lithology, alteration, oxide, structure, veining and mineralization • Core is logged descriptively and codes are used to describe all alteration type/ intensity, quartz
type and intensity as well as various percentages of minerals. • Standard nomenclature is used for logging and codes or abbreviations are used to input into a
database • Historically, core logging has been collected manually on A3 paper sheets and is currently
transitioning to digital data collection with a commercially available software, GeoSpark • Whole drill core is photographed at the drill rig and halfcore is photographed again after sampling.
The total length and percentage of the relevant intersections logged.
• 100% of all drill holes are logged for geotechnical and geological infomation. • Selective sampling is utilized based on geological descriptions and presence or lack of visual
mineralization • All mineralized intervals are sampled • Complete mineralized / hydrothermally altered zone is sampled both before and after (start and
finish sample run in "fresh" rock) Sub-sampling techniques and sample preparation
If core, whether cut or sawn and whether quarter, half or all core taken.
• Diamond drill core is sawn lengthwise in two equal parts (halves) • Samples of half core are taken on approximately one-meter intervals. • The remaining 50% is stored on site in a core storage facility • Efforts are made to ensure samples are greater than 0.5m and no more than 2.0m • Continuous sampling is completed through mineralized vein lodes and selectively outside of the
these mineralised intervals If non-core, whether riffled, tube sampled, rotary split, etc and whether sampled wet or dry.
• RC drilling was completed in dry sample conditions, when water was encountered the drilling method was switched (reduced) to diamond core
• RC samples are split at the drill rig with a triple-tier splitter which gives a 12.5% sample split (for example: for a 30kg original sample the triple tier splitter produces a 1.5 - 2.0 kg sample)
For all sample types, the nature, quality and appropriateness of the sample preparation technique.
• Diamond core sample size is considered to be appropriate for this style of deposit. • Sampling of half core is minerals industry standard practice. • RC samples are considered standard industry practice for infill and grade control drilling, for use as
pre-collars in resource definition and/or exploration drilling and for first-pass exploration drilling
15
For
per
sona
l use
onl
y

Criteria JORC Code explanation Commentary
typically looking at shallow (<100m depth) targets. • Sample preparation involves drying, weighing, crushing (95% <5mm), Pulverising (95%<75um)
entire sample using a LM2 pulveriser Quality control procedures adopted for all
sub-sampling stages to maximise representivity of samples.
• Standard industry practice Quality Assurance-Quality Control procedure include; • field duplicate samples are collected: half core for diamond core samples and a 2nd split for RC
samples (1/30) • Blank samples are inserted into the sample stream (1/30) • certified reference material or "standards" are inserted into the sample stream (1/30)
Measures taken to ensure that the sampling is representative of the in situ material collected, including for instance results for field duplicate/second-half sampling.
• Field duplicates (half-core or 2nd RC split) have been taken and demonstrate expected variabilty from samples of narrow vein, high grade gold deposits. No reason to suspect bias as a result of sample methodology
• Lab results include analyses for replicates and duplicates • Historically, procedure included re-analysis of sample pulps at primary Lab (~5%) • Future procedure will include re-analysis of sample pulps at an Umpire Lab (~5%)
Whether sample sizes are appropriate to the grain size of the material being sampled.
• Gold mineralization in low sulfidation deposits is typically erratic (high grade - narrow vein) • Tembang mineralization is not considered to have a high nugget effect Samples of half diamond
drill core is appropriate for the grain size of mineralization being sampled. • RC samples are also approriate as a larger sample is attained • Both diamond and RC sample are appropriate if and when collected correctly
Quality of assay data and laboratory tests
The nature, quality and appropriateness of the assaying and laboratory procedures used and whether the technique is considered partial or total.
• All samples preparation and analysis has been completed at Intertek Testing Services, Jakarta • Industry standard 50 gram Fire Assay for Au and gravimetric for +50g/t Au samples • 0.5 gram sample with a 2-acid digestion and AAS finish for Ag and 4-acid digestion for +100g/t Ag
For geophysical tools, spectrometers, handheld XRF instruments, etc, the parameters used in determining the analysis including instrument make and model, reading times, calibrations factors applied and their derivation, etc.
• Not Applicable
Nature of quality control procedures adopted (e.g. standards, blanks, duplicates, external laboratory checks) and whether acceptable levels of accuracy (i.e. lack of bias) and precision have been established.
• field duplicate samples are collected: half core for diamond core samples and a 2nd split for RC samples (1/30)
• Blank samples are inserted into the sample stream (1/30) • certified reference material or "standards" are inserted into the sample stream (1/30) • Umpire Lab analysis of pulps and coarse rejects have been completed in the past with with results
16
For
per
sona
l use
onl
y

Criteria JORC Code explanation Commentary
demonstrating that the primary Lab (Intertek) shows no bias
Verification of sampling and assaying
The verification of significant intersections by either independent or alternative company personnel.
• Calculations of significant intersections are carried out by Competent Devin den Boer, PGeo (APEGBC), Geology Manager and full time employee of Sumatra Copper and Gold plc.
The use of twinned holes. • Twin holes have been completed in the past (18 twin holes completed in 2008) • Historical RC drilling (1997-2000) demonstrated down hole contamination (Smearing) and those
holes were removed from Mineral Resource Estimations • No specific twin holes have been drilled however based on the generally close spaced drilling good
coorelation of vein lode widths and grades is observed across distances of <25m Documentation of primary data, data entry procedures, data verification, data storage (physical and electronic) protocols.
• Historically, data has been collected via MS excel tables and MS Access database • More recently, a commercially available data collection and management software; GeoSpark has
been implemented on site and included digital capture of field data (example; core logging) with ruggedized notebooks
• A Server has been installed on site and now houses all project data • Data is backed-up on hard discs at the project and the Jakarta head office • Physical Drill Logs and Assay Certificates are stored on site
Discuss any adjustment to assay data. • No adjustments have been made to assay data, all assays in database are based on original assay results.
• Exploration results are published as weighted averages, typically >0/5g/t Au and with up to 2m of internal waste
• Resource Estimation process uses computer generated sample composites (standard pactice) Location of data points
Accuracy and quality of surveys used to locate drill holes (collar and down-hole surveys), trenches, mine workings and other locations used in Mineral Resource estimation.
• In 2007 SCG commissioned PT GeoServices to complete a topographic survey of the Tembang post-mining surface. A set of survey beacons was established tied to the Indonesian UTM national grid. From the pick-up of old drill collar markers and infrastructure a correction factor was established to adjust the existing BTM data to true UTM coordinates.
• All drill collars are surveyed by company surveyors using Theodolite equipment and tied in to the independently verified system of triangulation benchmarks as outlined above.
• All drill holes were surveyed at 25m down-hole intervals with a single shot magnetic survey camera Specification of the grid system used. • All coordinates are quoted in UTM-UTS Zone 48 South. Quality and adequacy of topographic control.
• Since 2007 the surface topography has been improved with more detailed survey work, approximate depths to the flooded pits have been established from raft borne plumb-line surveys. The topographic data used in the reported data was updated in 2014 and includes more than
17
For
per
sona
l use
onl
y
Criteria JORC Code explanation Commentary
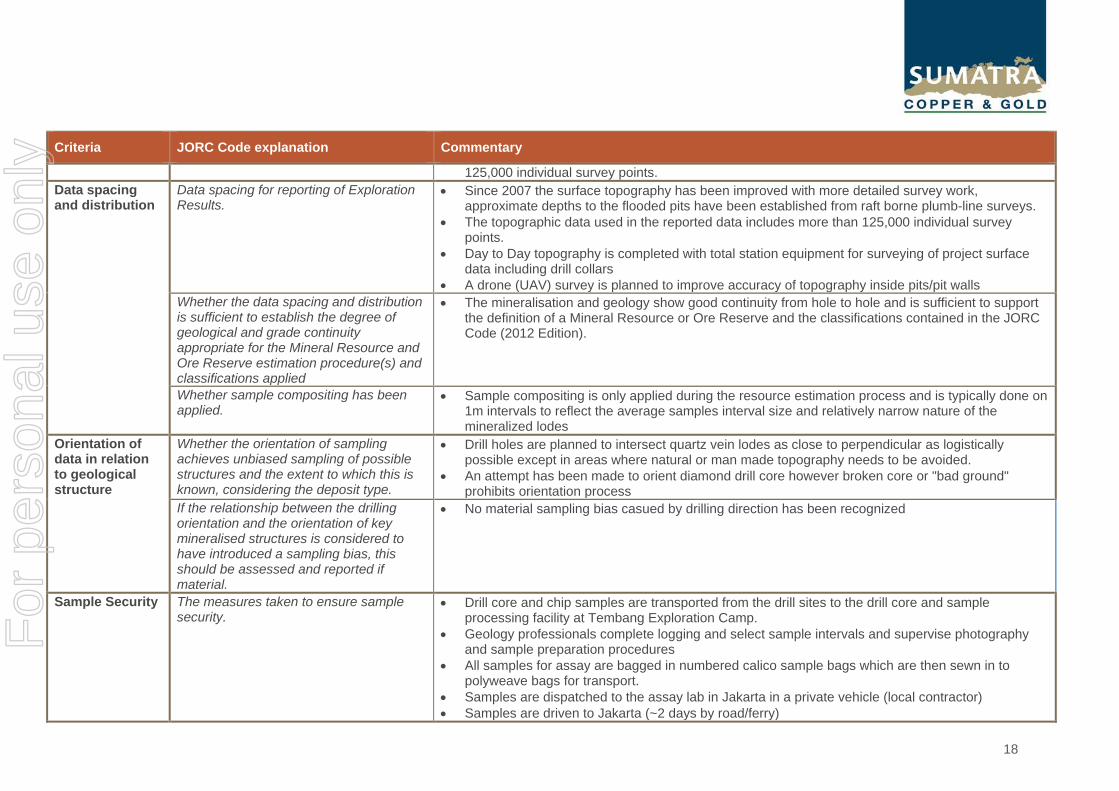
125,000 individual survey points. Data spacing and distribution
Data spacing for reporting of Exploration Results.
• Since 2007 the surface topography has been improved with more detailed survey work, approximate depths to the flooded pits have been established from raft borne plumb-line surveys.
• The topographic data used in the reported data includes more than 125,000 individual survey points.
• Day to Day topography is completed with total station equipment for surveying of project surface data including drill collars
• A drone (UAV) survey is planned to improve accuracy of topography inside pits/pit walls Whether the data spacing and distribution is sufficient to establish the degree of geological and grade continuity appropriate for the Mineral Resource and Ore Reserve estimation procedure(s) and classifications applied
• The mineralisation and geology show good continuity from hole to hole and is sufficient to support the definition of a Mineral Resource or Ore Reserve and the classifications contained in the JORC Code (2012 Edition).
Whether sample compositing has been applied.
• Sample compositing is only applied during the resource estimation process and is typically done on 1m intervals to reflect the average samples interval size and relatively narrow nature of the mineralized lodes
Orientation of data in relation to geological structure
Whether the orientation of sampling achieves unbiased sampling of possible structures and the extent to which this is known, considering the deposit type.
• Drill holes are planned to intersect quartz vein lodes as close to perpendicular as logistically possible except in areas where natural or man made topography needs to be avoided.
• An attempt has been made to orient diamond drill core however broken core or "bad ground" prohibits orientation process
If the relationship between the drilling orientation and the orientation of key mineralised structures is considered to have introduced a sampling bias, this should be assessed and reported if material.
• No material sampling bias casued by drilling direction has been recognized
Sample Security The measures taken to ensure sample security.
• Drill core and chip samples are transported from the drill sites to the drill core and sample processing facility at Tembang Exploration Camp.
• Geology professionals complete logging and select sample intervals and supervise photography and sample preparation procedures
• All samples for assay are bagged in numbered calico sample bags which are then sewn in to polyweave bags for transport.
• Samples are dispatched to the assay lab in Jakarta in a private vehicle (local contractor) • Samples are driven to Jakarta (~2 days by road/ferry)
18
For
per
sona
l use
onl
y

Criteria JORC Code explanation Commentary
• Samples are received by Intertek personnel and custody of samples is handed over by signing and a sample receipt form
• Intertek advises by electronic mail that the samples have been delivered/received and a physical copy of receipt is returned to project for filing
Audits or reviews
The results of any audits or reviews of sampling techniques and data.
• Both representatives of H&S Consultants and Cube Consulting visited the project site in 2013, reviewed core handling and sampling procedures and found these procedures to be on par with industry best practices.
• Behre Dolbear Australia (BDA) audited the drilling data and resource estimates in 2012, 2013 and 2014
19
For
per
sona
l use
onl
y
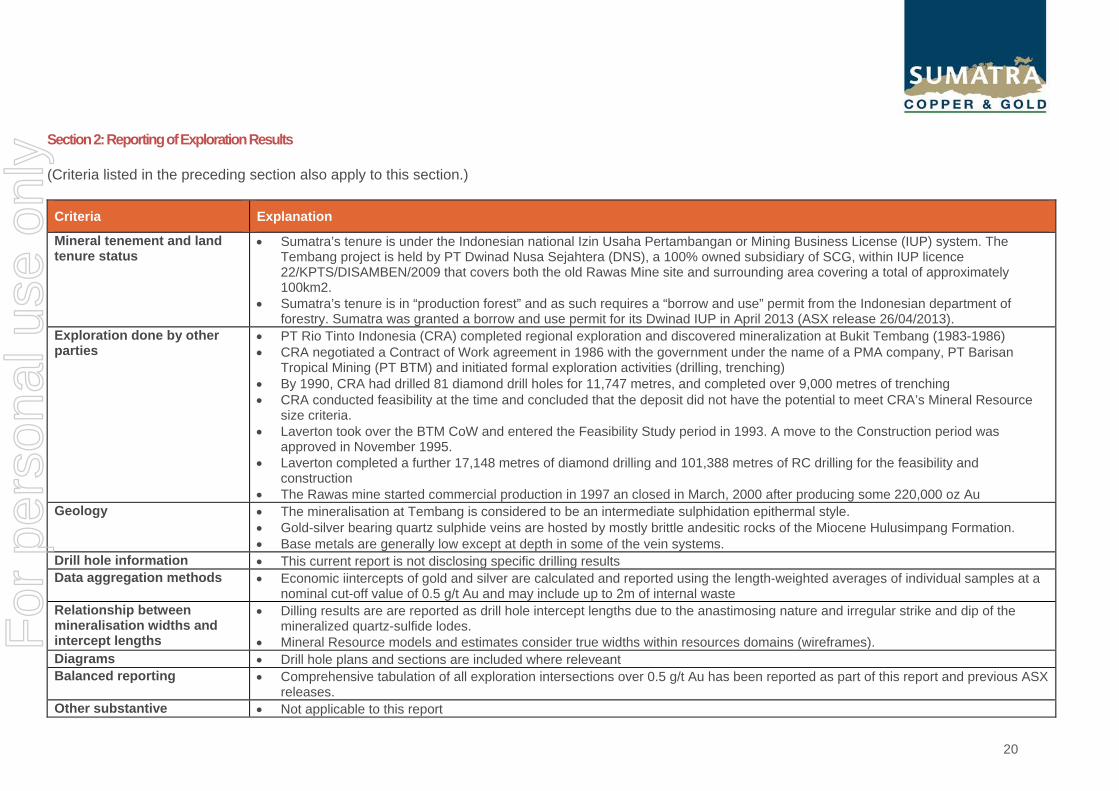
Section 2: Reporting of Exploration Results (Criteria listed in the preceding section also apply to this section.) Criteria Explanation
Mineral tenement and land tenure status
• Sumatra’s tenure is under the Indonesian national Izin Usaha Pertambangan or Mining Business License (IUP) system. The Tembang project is held by PT Dwinad Nusa Sejahtera (DNS), a 100% owned subsidiary of SCG, within IUP licence 22/KPTS/DISAMBEN/2009 that covers both the old Rawas Mine site and surrounding area covering a total of approximately 100km2.
• Sumatra’s tenure is in “production forest” and as such requires a “borrow and use” permit from the Indonesian department of forestry. Sumatra was granted a borrow and use permit for its Dwinad IUP in April 2013 (ASX release 26/04/2013).
Exploration done by other parties
• PT Rio Tinto Indonesia (CRA) completed regional exploration and discovered mineralization at Bukit Tembang (1983-1986) • CRA negotiated a Contract of Work agreement in 1986 with the government under the name of a PMA company, PT Barisan
Tropical Mining (PT BTM) and initiated formal exploration activities (drilling, trenching) • By 1990, CRA had drilled 81 diamond drill holes for 11,747 metres, and completed over 9,000 metres of trenching • CRA conducted feasibility at the time and concluded that the deposit did not have the potential to meet CRA’s Mineral Resource
size criteria. • Laverton took over the BTM CoW and entered the Feasibility Study period in 1993. A move to the Construction period was
approved in November 1995. • Laverton completed a further 17,148 metres of diamond drilling and 101,388 metres of RC drilling for the feasibility and
construction • The Rawas mine started commercial production in 1997 an closed in March, 2000 after producing some 220,000 oz Au
Geology • The mineralisation at Tembang is considered to be an intermediate sulphidation epithermal style. • Gold-silver bearing quartz sulphide veins are hosted by mostly brittle andesitic rocks of the Miocene Hulusimpang Formation. • Base metals are generally low except at depth in some of the vein systems.
Drill hole information • This current report is not disclosing specific drilling results Data aggregation methods • Economic iintercepts of gold and silver are calculated and reported using the length-weighted averages of individual samples at a
nominal cut-off value of 0.5 g/t Au and may include up to 2m of internal waste Relationship between mineralisation widths and intercept lengths
• Dilling results are are reported as drill hole intercept lengths due to the anastimosing nature and irregular strike and dip of the mineralized quartz-sulfide lodes.
• Mineral Resource models and estimates consider true widths within resources domains (wireframes). Diagrams • Drill hole plans and sections are included where releveant Balanced reporting • Comprehensive tabulation of all exploration intersections over 0.5 g/t Au has been reported as part of this report and previous ASX
releases. Other substantive • Not applicable to this report
20
For
per
sona
l use
onl
y

Criteria Explanation
exploration data • Project database currently includes >180km of drilling (RC and DD), >85km of trenching and 35,000 surface samples (all types) Further work • Resource definition and extension drilling will continue to be completed as part of the company's resource growth strategy
• Exploration activities will continue at both near-mine and adjacent prospects within the DNS and MRG IUP's, as part of the company's resource growth strategy
21
For
per
sona
l use
onl
y

Section 3: Estimation and Reporting of Mineral Resources (Criteria listed in section 1 also apply to this section) Criteria JORC Code explanation Commentary Database integrity
Measures taken to ensure that data has not been corrupted by, for example, transcription or keying errors, between its initial collection and its use for Mineral Resource estimation purposes.
• A selection of the database (~10%) was compared back to original laboratory records to assess for transcription error and data entry accuracy.
Data validation procedures used. • Cube completed validation checks on the database including checks for overlapping sample intervals, checks on minimum and maximum assays, depths, azimuths, dips and co-ordinates for consistency. No material errors were identified. Cube undertook site based checks of the raw assay data to verify grade intersections were consistent with a visual inspection of mineralisation in the core.
Site visits
Comment on any site visits undertaken by the Competent Person and the outcome of those visits.
• A site visit has been made to Tembang by Cube Consulting in September 2013. The site visit reviewed and was satisfied with the company’s logging, sampling and data collection procedures.
If no site visits have been undertaken indicate why this is the case
• N/A
Geological interpretation
Confidence in (or conversely, the uncertainty of) the geological interpretation of the mineral deposit.
• The mineralisation at Tembang is considered to be low Sulphidation epithermal style. Gold-silver bearing quartz sulphide veins are hosted by mostly brittle andesitic rocks of the Miocene Hulusimpang Formation. Base metal values are generally low.
• The confidence in the geological interpretations at Tembang is moderate and has improved from the earlier 2011 interpretation as a result of additional diamond core & RC drilling programs & removal of the majority of potentially smeared historical RC data. Uncertainty lies with the complicated vein geometries associated with the anastomosing & undulating nature of the veining system.
Nature of the data used and of any assumptions made.
• All data used was obtained from core & RC logging and core measurements together with secondary information obtained from trench field logging and rock chip sampling to support the near surface projections of the main mineralised zones.
• A combination of geological logging to define the key geological and weathering surfaces and a nominal lower cut-off grade of 0.5g/t Au was used to define the Berenai, Siamang and Bujang domains.
The effect, if any, of alternative • Alternative interpretations are possible and likely however the competent persons do not expect
22
For
per
sona
l use
onl
y

Criteria JORC Code explanation Commentary interpretations on Mineral Resource estimation.
that these potential alternatives will materially affect the estimated Mineral Resources for the Berenai, Siamang and Bujang deposits.
The use of geology in guiding and controlling Mineral Resource estimation.
• The vein systems at Tembang are constrained by lithologies which are conducive to the style of brittle vein formation noted over the main mineralized zones being predominantly Andesitic volcanics.
• Lithological logging data of the main vein systems was used in conjunction with the cut-off grades for interpreting the mineralised domains for the Berenai, Siamang and Bujang deposits. These criteria acted as a hard boundary to control the Mineral Resource estimates. The orientations of the vein systems were also used to guide the estimation search orientations.
The factors affecting continuity both of grade and geology.
• Grade continuity was both highly variable as was vein thickness. The factors affecting continuity both of grade and geology at Tembang is most likely to be associated with structural controls and local complexity, the knowledge of which is limited with the current spacing of information. For the Berenai, Siamang and Bujang deposits, the continuity of mineralisation improved using the vein lithologies in conjunction with cut-off grade, rather than just a grade based cut-off alone.
Dimensions The extent and variability of the Mineral Resource expressed as length (along strike or otherwise), plan width, and depth below surface to the upper and lower limits of the Mineral Resource.
Berenai • The mineralised domains estimated for the Berenai Mineral Resource, consist of 2 sub-parallel
NNW-SSE to NNE-SSW trending lodes dipping moderately to the east. These lodes have a strike length of 500 to 800m, with widths varying from 1 to 20m, averaging 5m thick. A third lode which forms a link structure between the 2 lodes trends NE-SW, has a 200m strike length with widths varying between 2 to 10m. Mineralisation extends from surface, where it was previously mined by open pit, to approximately 100-200 metres below surface.
Siamang • The mineralised domains estimated for the Siamang Mineral Resource, consist of 6 sub-parallel
NNW-SSE to N-S trending lodes dipping steep to moderately to the west. These lodes have a strike length of 70 to 200m, with widths varying from 1.5 to 10m, averaging 2 to 4m thick. Mineralisation extends from the surface to 150m below the surface.
Bujang • The Bujang mineralised domain has a strike length of approximately 250m orientated NNE-
SSW, dipping steep to moderately to the west. Widths vary from 1 to 7m in thickness. mineralisation extends from the surface to 140m below the surface.
23
For
per
sona
l use
onl
y

Criteria JORC Code explanation Commentary
Estimation and modelling techniques
The nature and appropriateness of the estimation technique(s) applied and key assumptions, including treatment of extreme grade values, domaining, interpolation parameters and maximum distance of extrapolation from data points. If a computer assisted estimation method was chosen include a description of computer software and parameters used.
• Surpac version 6.3.2 and Isatis version 14 were used for all estimations. • The estimation techniques adopted below are considered by Cube to be the appropriate
methods taking into account the varying styles and nature of the mineralisation lodes that were estimated.
Berenai • Cube selected a single grade weighted Indicator Kriging (IK) methodology to estimate gold and
silver grade from 1m composite data into the 3 Berenai mineralisation domains. • Top cutting was applied to the data prior to estimation where necessary, taking into account the
influence of higher grade spatial outliers. • An Ordinary Kriging (OK) estimate was also made to check the IK estimates with comparisons
mad via grade tonnage curves. The resultant mean grade differences was comparable between the 2 estimates.
• Estimation was constrained to within the modeled mineralisation outlines. Estimates were generally based on minimum number of composites set at 4 and maximum number of composite set at 30. A dynamic search orientation was utilised to control the estimates internally where there are orientation adjustments to the mineralisation trend. Maximum search ellipse was 110x110x30 metres.
Siamang • Cube selected Ordinary Kriging (OK) to estimate gold and silver grade from 1m composite data
into the mineralisation domains. • Top cutting was applied to the data prior to estimation where necessary, taking into account the
influence of higher grade spatial outliers. The interpolation of gold & silver, also utilised a grade / distance restriction function, whereby grades above certain threshold were not utilised in the block interpolation beyond a nominated distance from their location.
• Estimation was constrained to within the modeled mineralisation outlines. Estimates were generally based on minimum number of composites set at 4 and maximum number of composite set at 12. The majority of block estimates utilised the full 12 composites. Average domain search orientations were utilised to control the estimates in line with the mineralisation trends. Minor variations in orientation were utilised for the Bujang domains. Maximum search ellipse was 50x50x17 metres.
Bujang
24
For
per
sona
l use
onl
y

Criteria JORC Code explanation Commentary • Cube selected Ordinary Kriging (OK) to estimate gold and silver grade from 1m composite data
into the mineralisation domains. • Top cutting was applied to the data prior to estimation where necessary, taking into account the
influence of higher grade spatial outliers. The interpolation of gold south of 9,682,725mN, also utilised a grade / distance restriction function, whereby grades above a threshold of 10 g/t Au were not utilised in the block interpolation beyond 15m from their location
• Estimation was constrained to within the modeled mineralisation outlines. Estimates were generally based on minimum number of composites set at 3 and maximum number of composite set at 12. The majority of block estimates utilised the full 12 composites. Average domain search orientations were utilised to control the estimates in line with the mineralisation trends. Minor variations in orientation were utilised for the Bujang domains. Maximum search ellipse was 80x80x20 metres.
The availability of check estimates, previous estimates and/or mine production records and whether the Mineral Resource estimate takes appropriate account of such data.
• Previous estimates were undertaken by Cube in 2013 for the Berenai & Bujang deposits. Differences between these previous estimates are explainable by the additional drilling, and re-interpretation.
• This Siamang Mineral Resource estimate is an update from the H & S consultants Pty Ltd estimate (as a component of the Buluh estimate) in 2013. Differences between this previous estimate is explainable by the additional drilling and re-interpretation of data.
• Previous mining data is not available in a format to adequately check against these current 2014 estimates.
• Ordinary Kriging (OK) estimates for Berenai were made to check the IK estimates using moderately cut data. The resultant mean grade differences were comparable between the estimates.
The assumptions made regarding recovery of by-products.
• No by-product recoveries were considered.
Estimation of deleterious elements or other non-grade variables of economic significance (eg sulphur for acid mine drainage characterisation).
• No deleterious elements were estimated in the Berenai, Siamang and Bujang Mineral Resource estimates.
In the case of block model interpolation, the block size in relation to the average sample spacing and the search employed.
Siamang • Block sizes for the Siamang OK estimate utilised 12.5mN, 3.125mE and 3m RL sized parent
blocks, sub-celling down to 1.5625mN, 1.5625mE and 1.5m RL The bulk of the drilling data was spaced 12.5 to 25m. Maximum search ellipse was 50x50x17 metres.
Berenai & Bujang
25
For
per
sona
l use
onl
y

Criteria JORC Code explanation Commentary • Block sizes for the Berenai IK and Bujang OK estimate utilised 25mN, 6.25mE and 3m RL sized
parent blocks, sub-celling down to 3.125mN, 3.125mE and 1.5m RL. The bulk of the drilling data was spaced 25 to 50m. Maximum search ellipse was 110x110x30 metres for Berenai and 80x80x20m for Bujang.
Any assumptions behind modelling of selective mining units.
• SMU's were not employed during the modelling of the Berenai, Siamang & Bujang models as they were ordinary kriged and not recoverable. The capacity to mine the vein systems was however taken into account in the form of minimum mining widths generally not less than 2m.
Any assumptions about correlation between variables.
• No correlation between elements was investigated by Cube, however both gold and silver are the result of the same mineralisation process and are spatially related. This aspect was not required to be used in the estimate as both elements were equally represented in the data set.
• Both gold and silver were estimated separately within the same mineralisation domains. Description of how the geological interpretation was used to control the Mineral Resource estimates.
• For the Berenai, Siamang and Bujang models, the geological framework was used to establish local vein geometries upon which the vein models were based within which the estimates were undertaken and constrained as hard boundaries.
Discussion of basis for using or not using grade cutting or capping.
• Cube used histograms, log-transformed probability plots and percentile analysis for each individual domain to identify population outliers. Spatial location of the outliers was taken into consideration for the application of high grade cuts. High grade cuts were applied where necessary to the composites for estimation of the Berenai, Siamang & Bujang deposits.
• The interpolation of gold & silver for some domains, also utilised a grade / distance restriction function, whereby grades above certain threshold were not utilised in the block interpolation beyond a nominated distance from their location.
The process of validation, the checking process used, the comparison of model data to drill hole data, and use of reconciliation data if available.
• Block model validation of the Berenai, Siamang, and Bujang Mineral Resource Estimates were undertaken using the comparison of model data to drill hole data, utilising swath plots, tonnage grade curves and visual/graphical inspection of block grades against the drill hole data.
• Validation of the IK estimates for Berenai also employed check OK estimates for comparison. Moisture Whether the tonnages are estimated on a
dry basis or with natural moisture, and the method of determination of the moisture content.
• Moisture was not considered in the density assignment.
Cut-off parameters
The basis of the adopted cut-off grade(s) or quality parameters applied.
• Economic factors and consideration were undertaken and supplied to Cube by the client. Cut-off grades for reporting the Mineral Resource estimates above 0.5 g/t gold were used in line with the previously reported Mineral Resource estimates and the mineralisation domain interpretation
26
For
per
sona
l use
onl
y

Criteria JORC Code explanation Commentary cut-off criteria.
Mining factors or assumptions
Assumptions made regarding possible mining methods, minimum mining dimensions and internal (or, if applicable, external) mining dilution. It is always necessary as part of the process of determining reasonable prospects for eventual economic extraction to consider potential mining methods, but the assumptions made regarding mining methods and parameters when estimating Mineral Resources may not always be rigorous. Where this is the case, this should be reported with an explanation of the basis of the mining assumptions made.
• The previous Mineral Resource estimates for the Berenai, Siamang, and Bujang deposits have all been subjected to economically favourable pit optimisations. These deposits have been previously mined using open pit methods, consequently open pit mining is assumed.
• The main vein estimates for Berenai, Siamang, and Bujang, do not contain dilution other than the incorporation of low grade material into the interpreted domains to maintain continuity if the logged vein lithology is present.
Metallurgical factors or assumptions
The basis for assumptions or predictions regarding metallurgical amenability. It is always necessary as part of the process of determining reasonable prospects for eventual economic extraction to consider potential metallurgical methods, but the assumptions regarding metallurgical treatment processes and parameters made when reporting Mineral Resources may not always be rigorous. Where this is the case, this should be reported with an explanation of the basis of the metallurgical assumptions made.
• Metallurgical factors were determined based on historical processing results from the Laverton Gold N.L. mining operation at the Tembang site and detailed metallurgical testwork undertaken for the Pre-Feasibility and Definitive Feasibility Studies of the Tembang Project. Testwork has been focused on mineralised resources contained within multiple epithermal quartz veins from within the Tembang Project (Asmar, Belinau, Berenai, Bujang, Buluh and Nuri). Testing performed includes comminution, cyanide leach, gravity and detoxification tests as well as engineering design testwork (viscosity testing and tailings design testwork).
Environmental factors or assumptions
Assumptions made regarding possible waste and process residue disposal options. It is always necessary as part of the process of determining reasonable prospects for eventual economic extraction to consider the potential
• No assumptions have been made regarding waste or process reside disposal. No issues are anticipated from an environmental perspective in the exploitation of the Mineral Resource.
27
For
per
sona
l use
onl
y

Criteria JORC Code explanation Commentary environmental impacts of the mining and processing operation. While at this stage the determination of potential environmental impacts, particularly for a greenfields project, may not always be well advanced, the status of early consideration of these potential environmental impacts should be reported. Where these aspects have not been considered this should be reported with an explanation of the environmental assumptions made.
Bulk density Whether assumed or determined. If assumed, the basis for the assumptions. If determined, the method used, whether wet or dry, the frequency of the measurements, the nature, size and representativeness of the samples.
• This aspect is dealt with in the next section of the table by the client.
The bulk density for bulk material must have been measured by methods that adequately account for void spaces (vugs, porosity, etc), moisture and differences between rock and alteration zones within the deposit.
• Tonnages are estimated on a dry basis. • All bulk density measurements have been carried out by Intertek and have done on a range of
half drill core mostly HQ3 and PQ3. The procedure involves waxing the samples to account for any void spaces within the sample. The method is outlined below:
• Record the water temperature. • Dry the sample for 8 hours at 105oC. • Weight a random 5 % of the samples and record weight Wp (preliminary dry weight). • Dry the sample to get the constant weight and record weight the samples –Wd. • Quickly dip the samples into the molten wax and remove. The aim is to lightly coat the sample in
wax so it is water tight, but not add more wax to the sample necessary. If any part of the sample is not coated properly complete the waxing with a brush.
• Allow the sample and wax to dry. • Weight the wax coated samples in air Wca. • Place the coated sample in the basket and record the coated submerged weight Wcs. • Leave the sample in the basket for 2 minutes. If any bubbles appear the wax coating was not
sealed properly. Recoat the sample and repeat.
28
For
per
sona
l use
onl
y

Criteria JORC Code explanation Commentary • Calculations • DBD = Wd X Dw • Wca (1 – Dw/Dc) – Wcs + Wd (Dw/Dc) • Where • Wd = Weight of dry core measured in air • Wca = Weight of wax coated core measured in air • Wcs = Weight of coated core submerged in water • Dw = Density of water • Dc = density of coating
Discuss assumptions for bulk density estimates used in the evaluation process of the different materials.
• Due to the variable nature of the oxidation profiles over the Tembang project areas, density was modeled as an attribute of the model such that each block was assigned an estimate density value according to the oxidation profile & mineralization domain.
Classification The basis for the classification of the Mineral Resources into varying confidence categories.
• The Measured, Indicated and Inferred Mineral Resources classification for the Berenai, Siamang, and Bujang estimates is based on the data spacing, quality of assay data and bulk density data, confidence in the continuity of geology and mineralisation and confidence in the estimation.
Whether appropriate account has been taken of all relevant factors (ie relative confidence in tonnage/grade estimations, reliability of input data, confidence in continuity of geology and metal values, quality, quantity and distribution of the data).
• All relevant factors have been taken into account into the classification criteria of the Berenai, Siamang, and Bujang Mineral Resource estimates. These include data spacing, quality of assay data and bulk density data, confidence in the continuity of geology and mineralisation and confidence in the estimation.
Whether the result appropriately reflects the Competent Person’s view of the deposit.
• The Berenai, Siamang, and Bujang Mineral Resource estimates appropriately reflect the Competent Person’s view of these deposits.
• It should be noted that geological variations on a local scale not defined by the current drill spacing, will occur resulting from geological complexity and the likely anatomising nature of the mineralised systems. Variations at this scale are not represented in the current Mineral Resource models. Infill drilling to a closer spacing will allow the mineralisation to be interpreted at a more local scale potentially leading to a better understanding of the continuity of higher grade zones.
Audits or reviews
The results of any audits or reviews of Mineral Resource estimates.
• The Mineral Resources have been estimated by Independent Consultants, Cube Consulting • No independent reviews of these Mineral Resources have been completed.
29
For
per
sona
l use
onl
y

Criteria JORC Code explanation Commentary Discussion of relative accuracy/ confidence
Where appropriate a statement of the relative accuracy and confidence level in the Mineral Resource estimate using an approach or procedure deemed appropriate by the Competent Person. For example, the application of statistical or geostatistical procedures to quantify the relative accuracy of the Mineral Resource within stated confidence limits, or, if such an approach is not deemed appropriate, a qualitative discussion of the factors that could affect the relative accuracy and confidence of the estimate.
• The relative accuracy of the Berenai, Siamang, and Bujang Mineral Resource estimates is reflected in the classification in accordance with the guidelines set out in the 2012 JORC code.
• Descriptions of drilling techniques, survey, sampling/sample preparation, analytical techniques and database management/validation provided by SCG would indicate that assay data collection, quality control and management is well within industry standards. It is Cube’s assessment that on balance the database represents an accurate record of the drilling undertaken at the project.
The statement should specify whether it relates to global or local estimates, and, if local, state the relevant tonnages, which should be relevant to technical and economic evaluation. Documentation should include assumptions made and the procedures used.
• The Berenai, Siamang, and Bujang Mineral Resource estimates are considered to be global grade and tonnage estimates given the quality and density of the informing data. Infill drilling will improve confidence at a local scale.
These statements of relative accuracy and confidence of the estimate should be compared with production data, where available.
• No accurate production records were kept on a deposit basis by the previous miners so there are no records against which to compare against.
30
For
per
sona
l use
onl
y