teletraffic engineering of multi-band w … · imply buffering and queueing at each node of the...
TRANSCRIPT

TELETRAFFIC ENGINEERING OF MULTI-BAND W-CDMA SYSTEMS
Villy B. Iversen and Eustachio Epifania COM, Technical University o.f Denmark DK-2800 Kgs. Lyngby
Abstract Multi-band Wide- Band Code Division Multiple Access (W-CDMA) systems are considered tobe among the bestalternatives for Universal Mobile Telecommunications System (UMTS). To evaluate the performance of multi-band W-CDMA systems many parameters have tobe taken into account In this paper we present a,method to evaluate the state space of multi-band oveilaid W-CDMA system, and we present a very powerful algorithm, the Convolution Algorithm, to evaluate time, call and traffic blocking probabilities for each service. A service is modelled as BPP (Binomial- Poisson- Pascal) multi-rate traffic.
Keywords: UMTS, W-CDMA, multi-band overlaid W-CDMA system capacity, convolution algorithm, blocking probabilities
lntroduction Wireless telecommunication services and Internet are playing a key role in
our daily life. This is the reason why it is important to integrate these services into the same reality. There are wireless telecommunication systems which guarantee access to Internet from a mobile terminal, for example the platforms Wireless Application Protocol (WAP) and General Packet Radio Service (GPRS). Even if these services allow Internetinformation tobe available on radio mobile terminals, they have strict physicallimits. For this reason, a new wireless cellular telecommunication system has been introduced: UMTS. UMTS a the third generation mobile telecommunications system scheduled to start operation in Europe around 2003-2005. It will provide audio, video, data and multimedia services. The main difference between UMTS and previous mobile telecommunication generations is the radio access technique. UMTS uses the W-CDMA technique which allows many users to transmit simultaneously in the same frequency band. The users are separated by using orthogonal spreading codes. The core network will evolve from the traditional circuit switched network to an all IP packet switching network. Communication via
©
The original version of this chapter was revised: The copyright line was incorrect. This has beencorrected. The Erratum to this chapter is available at DOI: 10.1007/978-0-387-35703-4_21D. Gaïti et al. (eds.), Network Control and Engineering for QoS, Security and Mobility II
IFIP International Federation for Information Processing 2003

Teletraffic Engineering of Multi-Band W-CDMA Systems 91
circuit switching implies that there is a dedicated communication path between two stations. This path is established at the beginning of the communication and it is the maintained during all the communication. This kind of switching technology is reasonable for real time services for which it is important to control the information transfer delay. There are two kinds of communications via packet switching: the datagram packet switching and the virtual circuit packet switching. The main difference between these is that the datagram switching technology does not provide any dedicated path, whereas the virtual circuit switching technology provides a virtual path before any information packets are sent. As these two techniques imply buffering and queueing at each node of the network, they are more reasonable for delay tolerant services. Because UMfS uses the packet switching technology, and because it has to provide both real-time and non-real time services, it is important to implement a mechanism to manage the QoS of a specific communication. The parameters which are mainly taken into account to evaluate the QoS of a specific communication are the Bit energy to Inteiference density Ratio (BIR) and the information transfer delay. Four classes of service have been identified for UMfS: conversational, streaming, interactive and background service classes. The conversational service class is the most transmission delay sensitive. It is not only important to minimize the transmission delay but also to keep it constant. This service is intended for real time services as voice and video conferences. The streaming service class is less sensitive to a constant transmission delay. It is intended for real time video and audio stream down-loading. Unlike conversational service class, the streaming service class is unidirectional, therefore transmission delay can be larger but it still has to be kept constant. For the interactive service class it is more important to preserve the integrity of the information than the transfer delay. Applications using this kind of service are web-browsing, access to network servers and database query. For the background service class the integrity of the transferred information is the most important parameter. The information has to be correct, it does not matter if the transfer delay is very large. Applications using this kind of service are e-mailing and Short Message Service (SMS). As UMfS has to provide services with high data rate, it will require wide spectra. As it is not possible to allocate wide spectra continuously, because UMfS provides channels with different capacity and because it has to coexist with the Global Systemfor Mobile communication (GSM), the service providers have to manage the available spectrum. Multi-band overlaid W-CDMA systems seem to be a good choice for solving these problems. Giving a specific overlaid W-CDMA system, and considering the most important radio and teletraffic aspects of a specific communication, it is possible to evaluate the QoS of such a system, also in terms of blocking probabilities.

92 Villy B. Iversen and Eustachio Epifania
1. W-CDMA and UMTS The W-CDMA is a wide-band access technique that allows many users to
transmit in the same bandwidth at the same time. A user can be distinguished from the others by assigning different codes. Each information signal is directly multiplied by a code sequence with a very high chip rate. This is called the spreading process. The code signals have to be orthogonal and consequently uncorrelated, so that by de-spreading the received signals it is possible to distinguish one user from the others.
1.1 Interference and Power Control Mechanism In ideal W-CDMA systems, different signals have different chipping codes
which are perfectly orthogonal. Due to the orthogonality of the codes, there will not be any signal interference although users transmit in the same bandwidth at the same time. In real systems, the propagation conditions limit the orthogonality of the code sequences. Radio waves are partially reflected and absorbed by objects between the receiver and the transmitter. The loss of orthogonality of the codes involves the increase of interference. This means that the number of simultaneous calls will be limited by interference. The larger the number of active users, the larger the interference will be. A further complication is that a base station not only receives interference from the users inside its own cell, but also from the users in other cells. In the complexity of this scenario, two problems have to be solved:
• Every time a new call is accepted, the QoS of all the users in the systems is degraded. This means that the Signal to Noise Ratio (SNR) of all connections will decrease.
• It may happen that a user is very close to the base station. The signal power of this user will be much stronger that those of the other signal coming from more distaut mobile terminals which, consequently, will not be received correctly.
These two problems can be solved by aPower Contra! Mechanism [1] that has to control the transmission levels of all signals. Power control mechanism is based on two loops as described by figure 1 . In the Inner Loop the Base Station (BS) receives the signal from the Mobile Station (MS) and keeps the Signal to Inteiference Ratio (SIR) at the SIRtarget value. In the Out er Loop data packets received from the MS are forwarded to the Radio network Controller (RNC) which measures the Frame Error Rate (FER) of the connection and compares it to PERtarget value. Consequently RNC will update the SIRtarget to keep the quality of a specific service.

Teletraffic Engineering of Multi-Band W-CDMA Systems 93
SIR SIR'target
G 0 FERtarget
SIRtarget SIRtarget
Figure 1. Inner and outer loops for the power control mechanism.
1.2 W-CDMA System Capacity In W-CDMA systems the capacity is limited by the interference level. The
maximum capacity is reached when adding one more user causes the system QoS to drop below the threshold. The most important QoS estimator is the BIR. If we consider a mono-cellular system with apower control mechanism as described in Sec. 1.1.1, then the W-CDMA system capacity can be calculated as follows [3]:
W1
RBIR' (1)
where N is the total number of users, W is the bandwidth and R is the information data rate. Note that we may assume that all user transmitted signals have the same power, assuming perfect power control mechanism. If we also consider the interference from other cells, and the fact that a source is not always active, then we also include the other cells intetference factor f, and the activity factor a. Formula (1) then becomes:
W_1_ 1 R BIR (1 + f) a '
(2)
1.3 Multi-Band Overlaid W-CDMA Systems Due to the fact that the spectra are wide, up to 20 MHz, it can happen that,
in geographic areas with large population, W-CDMA service providers have to share the same spectrum, unless there is one W-CDMA monopoly. In fact, it is very hard to allocate multiple continuous wide-band spectra for W-CDMA in any country. Furthermore, W-CDMA systems supports channels with different bandwidths and consequently, each service provider has to choose the right deployment of different kinds of channels in order to accommodate different kinds of traffies with different characteristics. To deal with those matters, a wide multi-band system seems tobe an appropriate way to implement an open and flexible radio interface [4].

94 Villy B. lversen and Eustachio Epifania
In the article "Reverse Link Capacity of Multi-band Overlaid DS-CDMA Systems" [5], the authors explain a simple algorithm for the decomposition and the calculation of the capacity of multi-band W-CDMA systems. They focused their attention on two basic scenarios: the vertical and the horizontal pattern.
Vertical Pattern Merging Process. We consider a vertical pattem as shown in figure 2 (a), where the L bandwidths are placed one upon the other. Due to the special structure of the system, it is possible to petform a "top-down" merging process. At first, bandwidths WL and WL-l are merged in Wl_1,
then Wl_1 and WL-2 are merged into Wl_2 and so on until and W1 are left in the system. The procedure is explained in figure 2(b) and 2(c). Note that at each step, merging bandwidths Wk and Wk_ 1, the resultant will have the same bandwidth as Wk-1·
I W'L-1
I W2 W2 Wt WI
(a)
J W'2 Wt
(c)
Figure 2. Decomposition method for vertical overlapping.
Horizontal Pattern Merging Process. We consider a horizontal pattern scenario as shown in figure 3 (a), where bandwidths W2 to WL are disjoint and overlap W1. Due to the special structure of the system, we can perform the following merging process. At first, bandwidths W L and W L-1 are merged into Wl_1, then Wl_1 and WL-2 aremergedinto WL2 andsoon until and W1
are left in the system. The procedure is explained in figure 3 (b ), 3 ( c) and 3 ( d). Note that at each step, merging bandwidths Wi and Wj (2 ::; i, j ::; L), the resultant Wf will be equal to Wi + Wj.
Vertical and Horizontal Patterns Combination. Once we have only two bands overlapping then we can start computing the capacity for general over-

Teletraffic Engineering of Multi-Band W-CDMA Systems
I W2 I W3 I .. ·I WL-11 WL I W1
(a)
W'2 W1
I W2 I W3 I .. ·I W'L-1 W1
I wzl W'3 W1
(d) (c)
Figure 3. Decomposition method for horizontal overlapping.
95
lapping systems. The decomposition can be made as described in figure 4, following the algorithm below [5].
• First Step. We find the maximum number of users ß1 in W1 as if it is alone in the system by using formula (1) or (2). We choose a value for N1 between 0 and ß1 for the number ofusers in band W 1.
• Second Step. We find the maximum number of users using the following formula (3):
1 -lßi" < 1 ( W.')
lf2- 1-ii{ (3)
Note that we have to replace ß2 with ß2 = ifwe want to consider a horizontal pattern. We choose a value for N2 between 0 and for the number of user in band w2.
• Third Step. If we consider a vertical pattern, we find the value of the maximum number of user N3 using formula (4). If we consider a horizontal pattern, we find the value of the maximum number of user N3 using formula (5):
N' _ ßk (Nk-1 - Nk-1)
k- w ( w ) ' ßk-1 - (Nk_1 - Nk-1) - 1 k = 3, ... ,L;
(4)
2 :S i, j :S L . (5)

96 Villy B. Iversen and Eustachio Epifania
• Next Steps. We continue to repeat this procedure until we have derived the limits of number of users inside each bandwidth that satisfies the chosen QoS.
Wl
W'2
Wl
Vertical pattern Horizontal Pattern
lwzl W'3 W!
Vertical pattern Horizontal Pattern Vertical pattern Horizontal Pattern
Figure 4. The decomposition method for general overlapping scenarios.
The previous analysis is valid for all the kinds of overlapping. also for partially overlapping cases. Of course it will be necessary to split the bandwidths in the right way.
2. Traffic Model The traffic model considered in this paper is a general state-dependent Pois
son arrival process. including the classical Binomial (Engset), Poisson (Erlang), and Pascalmodels (BPP traffic). The capacity of the system is measured in some bandwidth unit, called a channel. Each service is described by an arrival process, characterized by offered traffic (mean value) and peakedness (variance/mean ratio ), both measured in number of channels. For each service we may reserve a minimum bandwidth (guaranteed quality-of-service, QoS) and put an upper limit to the number of channels used by this service (to protect other services). We may consider a system with v channels offered k Different traffic streams. Calls of the s 'th stream can be blocked for two reasons: ( 1) if n8
channels have already been occupied by calls from the s-th stream or (2) if all v

Teletraffic Engineering of Multi-Band W-CDMA Systems 97
channels are busy. Without loss of generality we may assume that the holding times are exponentially distributed with the same mean value chosen to one, but it is known [7] that the model considered is insensitive to the distribution of the service time.
Let us by is ( t) denote the number of busy channels at time t servicing calls of the s-th stream. The model is described by a k-dimensional Markovian process ofthe type r(t) = (i1(t), i2(t), ... , ik(t)) with state space S, which is defined as follows: (i1, ... , ik) E S, 0 is n 8 , s = 1, ... , k, i8 v. Let us denote by P(i11 ... , ik) the stationary probabilities of r(t). The values of P(i11 ... , ik) are related by product form formula:
(6)
If we for example consider k incoming Poisson flows of calls with intensities >. 8 , s = 1, ... , k, then we get the multi-dimensional Erlang-B formula:
Stream number s, s = 1, ... , k, is characterized by the individual blocking probability Ps and by the carried traffic ! 8 • Due to the product form we can aggregate the state space by using convolution. The state space may be restricted in any way.
2.1 Convolution Algorithm Fortwovectorsx = (x(O), x(1), · · ·, x(ax)) andy = (y(O), y(1), · · ·, y(ay))
we define the convolution operator that being applied to x, y gives vector z with
components z(i) = x(i- j) · y(j), i = 0, 1, ... , az, where functions u(i), l(i) are defined as:
{ i, u(i) = ay, ay i az,
{ 0, 0 i < ax l( i) =
i- ax, ax i az.
In the following text the term convolution means the usage of the convolution operator defined in the above way. Because it is known that the solution of the system of state equations has a product form it can be found by means of an algorithm that we refer to as the convolution algorithm [2]. lt consists of making the following three steps.

98 Villy B. Iversen and Eustachio Epifania
For m'th stream m = 1, ... , k calculate its individual normalized state probabilities {Pm(O), Pm(1), ... , Pm(nm)} as if it was the only traffic stream offered to the nm channels.
2 In any fix order make successive convolution of all k individual state distributions. Let p(r) be the vector obtained after convolving of the first r individual distributions.
3 During the performance of the last convolution we obtain after normalization the system state distribution P( i), i = 0, 1, ... , v and individual performance measures of the last stream having number k
v-1
Pk P(v) + Pk(nk) L p(k-l)(i- nk), i=nk
v u(i)
h = L L p(k-l)(i- j). jPk(j). i=l j=l(i)
During the last convolution we can calculate time, call and traffic congestion. Time congestion E of the stream is defined as the proportion of time the service is blocked. Call congestion B is defined as the proportion of call attempts which are blocked. Traffic congestion C is defined as the proportion of offered traffic which is carried. The offered traffic is defined as the traffic carried when the capacity is unlimited. More details are given in the Teletraffic Engineering Handbook [7]. The performance measures for all streams can be found after performing the above mentioned steps for each stream by putting it at the end of the convolution procedure. By storing some of the intermediate results in total only Ne = 4k - 6 convolutions are needed, i.e a linear function in number of traffic streams.
3. Multi-band Overlaid CDMA Blocking Probabilities Previously we have described a modeland we studied the capacity, in terms of
number of users, of multi-band W-CDMA systems. Once we have calculated the state space of the system, it is possible to calculate time, call and traffic congestion, using the convolution algorithm [6]. To find the capacity and the blocking probabilities of such systems we need to take account of the following parameters:
1 The bandwidth W used by each kind of traffic stream and the kind of overlapping scenario.
2 The BIR requirements for each service.

Teletraffic Engineering of Multi-Band W-CDMA Systems 99
3 The transmission rate R for each traffic stream.
4 The other cell interference factor f 2': 0. lf we not consider the interference from the other cells then f = 0.
5 The offered traffic A for each stream.
6 The peakedness Z of each traffic stream. We can apply BPP-traffic models.
7 The activity factor a. It is also called the Average Source Active Time.
3.1 Vertical Pattern
Figure 5. Vertical overlapping scenario.
For our analysis we consider a vertical pattem as described in figure 5. We consider three bandwidths, wl, w2 and w3.
• The bandwidth W1 in the first layer is 15 MHz large. The user data rate R1 is 300 kbps and BIR1 is 9 dB, 8 in linear scale. The peakedness Z1 is 2, which means that this traffic is bursty. Therefore, the traffic can be classified as a Pascal traffic. The offered traffic A1 is 6 erlang.
• The bandwidth W2 in the second layer is 9 MHz large. The user data rate R2 is 150 kbps and the BIR2 is 7 dB, 6 in linear scale. The peakedness Z2 is 1, which means that this traffic is random traffic. Therefore, the traffic is equivalent to Poisson traffic. The offered traffic A2 is 5 erlang.
• The bandwidth w3 in the third layer is 4 MHz large. The user data rate R 3 is 100 kbps and the BIR3 is 4 dB, 3.9 in linear scale. The peakedness Z3 is 0.5, which means that this traffic is smooth traffic. Therefore, the traffic can be classified as an Engset traffic. The offered traffic A3 is 4 erlang.
We consider a single cell environment and therefore we choose the other cell interference factor f = 0. Furthermore we consider an activity factor a = 1. In the following Tables 1 and 2 the most important results are shown. Table 1 shows the nurober of users of each stream (N1, N2, N3) for each border state

100 Villy B. Iversen and Eustachio Epifania
Table 1. Part of the border states and the blocking conditions of the vertical overlapping pattern in figure 5.
State 0 2 3 4 5 6 21 76 N1 OB OB OB OB OB OB OB lB SB N2 ON lN 2N 2B 3N 3B 4B ON lB N3 lOB 9B SN 9B 7N SB 7B 9B 2B
(state 0, ... , 76). The letter "B" means that the traffic stream is in blocking state, whereas letter "N" means that the traffic stream is not blocked. As we can see from the Table 1, The number of users in each band depends on the number of users in the other ones. This is reasonable because increasing Ni, for example, means more resource allocated to sub-band Wi, and therefore less N{+l (maximum number of users in bandwidth i + 1) is allowed. The maximum number of users allowed in the third bandwidth W3 is I 0, when we have zero users in the firstandin the second one (state 0). If another connection is established'in W3, then the QoS requirements will drop and consequently the 11 'th userwill be blocked. If we increase the number of users in W2 , then the maximum number of users in W3 will decrease. We can see that comparing state 0 (0, 0, 10) with state 1 (0, 1, 9). If another connection is established in W1 then the maximum number of users allowed in W3 will decrease. This can seen by comparing state 0 (0, 0, 10) with state 21 (1, 0, 9). In Table 2 the time, call and traffic congestion of each traffic stream are shown. We see these parameters are equa1 for stream number 2. This is expected because the chosen peakedness Z for this stream is 1 and consequently, the PASTAproperty mentioned is valid [7]. For stream 3 we also notice that C < B < E, which is a property of Engset Traffic (Te letraffte Engineering Handbook [7]). C is traffic congestion, B call congestion and E time congestion. For Pascal traffic we always have E < B < C.
Table 2. Time, call and traffic congestion of each stream in the vertical overlapping pattern in figure 5.
Stream I 2 3
Time Congestion 0.469S139526 0.3494733990 0.2932240S16
Traffic Congestion 0.6669007S5S 0.3494733990 0.15S7021330
Call Congestion 0.5002634302 0.3494733990 0.273930S550
Teletraffic Engineering of Multi-Band W-CDMA Systems 101
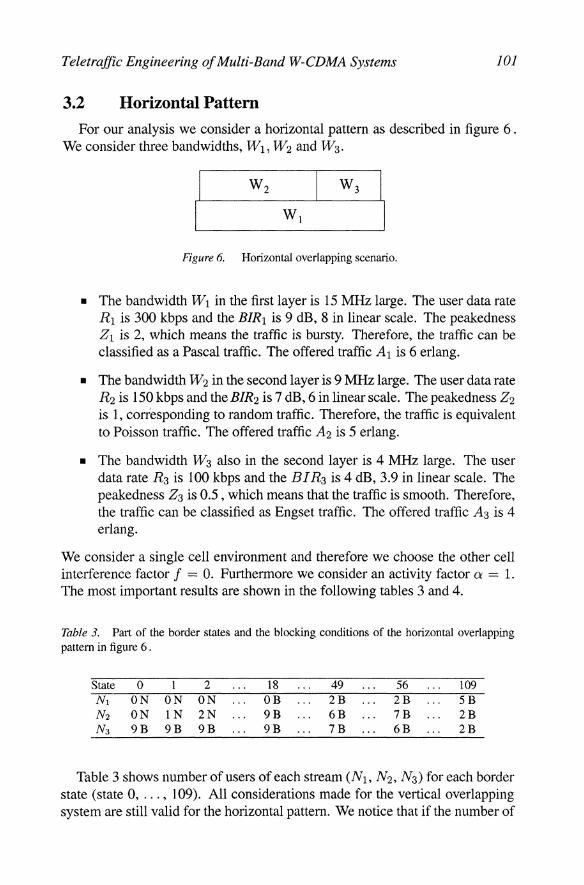
3.2 Horizontal Pattern For our analysis we consider a horizontal pattern as described in figure 6 .
We consider three bandwidths, W1, W2 and W3.
Figure 6. Horizontal overlapping scenario.
• The bandwidth W1 in the first layer is 15 MHz large. The user data rate R 1 is 300 kbps and the BIR1 is 9 dB, 8 in linear scale. The peakedness Z1 is 2, which means the traffic is bursty. Therefore, the traffic can be classified as a Pascal traffic. The offered traffic A1 is 6 erlang.
• The bandwidth W2 in the second layer is 9 MHz large. The user data rate R2 is 150 kbps and the BIR2 is 7 dB, 6 in linear scale. The peakedness Z2 is 1, coriesponding to random traffic. Therefore, the traffic is equivalent to Poisson traffic. The offered traffic A2 is 5 erlang.
• The bandwidth W3 also in the second layer is 4 MHz large. The user data rate R3 is 100 kbps and the BI R3 is 4 dB, 3.9 in linear scale. The peakedness Z3 is 0.5 , which means that the traffic is smooth. Therefore, the traffic can be classified as Engset traffic. The offered traffic A3 is 4 erlang.
We consider a single cell environment and therefore we choose the other cell interference factor f = 0. Furthermore we consider an activity factor a = 1. The most important results are shown in the following tables 3 and 4.
Table 3. Part of the border states and the blocking conditions of the horizontal overlapping pattem in figure 6 .
State 0 1 2 ON ON 1N 2N 9B 9B
18 OB 9B 9B
49 2B 6B 7B
56 2B 7B 6B
109 SB 2B 2B
Table 3 shows number ofusers of each stream (N1, N2, N3) for each border state (state 0, ... , 109). All considerations made for the vertical overlapping system are still valid for the horizontal pattern. We notice that if the nurnber of

102 Villy B. Iversen and Eustachio Epifania
users in the first bandwidth wl is low, then the capacity of w3 depends much more upon the Capacity of wl than Oll that of w2. We notice this when looking at the first states 0, 1 and 2. There is no change in the capacity of W3 varying the capacity of W2 • If the number of users in W1 is larger (2, for example ), then the capacity of the third band will become more sensitive to the increasing of number of users in W2, which is seen by observing state 49 (2, 6, 7) and state 56 (2, 7, 6). Increasing the capacity of W2 by one user, the capacity of W3 decreases. In Table 4 time, call, and traffic congestion of each traffic stream are shown. We notice that for stream number 2 all blocking probabilities are equal due to the PASTA. We can also see for stream 3 that it is verified the property of Engset traffies C < B < E, according to Teletraffic Engineering Handbook [7]. For Pascal traffic we have the opposite order: E < B < C.
Table 4. Time, call and traffic congestion of each stream in the horizontal overlapping pattem offigure 6.
Stream 1 2 3
Tnne Congestion 0.4142059732 0.2015000711 0.0847902929
Traffic Congestion 0.6240442322 0.2015000711 0.0385144233
4. Conclusions and further work
Call Congestion 0.4535350966 0.2015000711 0.0741721490
We have combined teletraffic models and radio models for UMTS, studying multi-band overlaid W--CDMA systems. UMTS has to co-exist with previous wireless cellular system, and overlapping of bandwidths will be unavoidable. We have combined the results in the paper "Reverse-Link Capacity of a Multiband Overlaid DS-CDMA System" [5] with the theory of multi-dimensional traffic models. We first calculate the border states of multi-band W--CDMA systems taking account of the radio parameters. Then we calculate blocking probabilities of each traffic stream offered to the system by using the convolution algorithm. The traffic model includes smooth, random and bursty traffic and allows for multi-rate traffic and service protection by minimum and maximum allocation for each traffic stream. In this way it is possible, starting from radio parameters, such as the BIR, to evaluate the QoS of a specific system in terms of time, call and traffic blocking probabilities. So far we have only dealt with hard blocking, so that blocking only occurs in border states. As noise is a random variable we may have also soft blocking,

Teletraffic Engineering of Multi-Band W-CDMA Systems 103
meaning that connections may be blocked also in lower states. This problern will be dealt with a future publication
References
[1] Heck, K., Staehle, D. and Leibnitz, K.: 2002, 'Diversity Effects on the Soft Hand-over Gain in UMTS networks', Report No. 295, University of Würzburg.
[2] Iversen, V.B.: 1987, 'The Exact Evaluation of Multi-Service Loss System with Access Control'. Teleteknik, English ed. Vol. 31 no. 2, pp. 56-61.
[3] Gilhousen, K.S., Jacobs, I.M., Padovani, R., Viterbi, A.J., Weaver, L.A., Jr. and Wheatley, C.E.: 1991, 'On the Capacity of a Cellu1ar CDMA System', IEEE Transactions on Vehicular Technologies Vol. 40 no. 2, pp. 303-312.
[4] Baier A., Fiebig U.-C., Granzow W., Koch W., Teder P. and Thielecke J.: 1994, 'Design study for a CDMA-based third-generation mobile radio system'. IEEE J. Select. Areas Commun. Vol. 12 no. 4, pp. 733-743.
[5] Zhuge, L. and Li, V.O.K.: 2002, 'Reverse-Link Capacity ofMulti-band Overlaid DS-CDMA Systems', Mobile Networks and Applications Vol. 7 pp 101-113.
( 6] Epifania, E.: May 2003, 'Teletraffic Engineering and Quality of Service in UMTS', Master' s thesis, COM, DTU-Technical University of Denmark, in collaboration with Politecnico di Milano. Iversen, V.B. and Capone, A.
(7] Iversen, V. B.: 2002, 'Teletraffic Engineering Handbook', ITU-D SG 2/16 & ITC 2002/09/06. 324 pp.