telefónica o2 czech republic cautionary statement any forward-looking statements concerning future...
TRANSCRIPT

Telefónica O2 Czech Republic
Quarterly Results
January – June 2007
26th July, 2007

2
CAUTIONARY STATEMENTCAUTIONARY STATEMENT
Any forward-looking statements concerning future economic and financial
performance of Telefónica O2 Czech Republic, a.s. contained in this Presentation are
based on assumptions and expectations of the future development of factors having
material influence on the future economic and financial performance of Telefónica O2
Czech Republic, a.s. These factors include, but are not limited to, public regulation in
the telecommunications sector, future macroeconomic situation, development of
market competition and related demand for telecommunications and other services.
The actual development of these factors, however, may be different. Consequently,
the actual future results of economic and financial performance of Telefónica O2
Czech Republic, a.s. could materially differ from those expressed in the forward-
looking statements contained in this Presentation.
Although Telefónica O2 Czech Republic, a.s. makes every effort to provide accurate
information, we cannot accept liability for any misprints or other errors.

1H 2007 Business Highlights & Outlook

4
11HH 2007 Highlights 2007 Highlights
• Solid financial performance
• Continued strong mobile performance
• Reversing trend in fixed revenues driven by broadband and ICT
• Fixed line proposition enhancement via bundles and convergent offer
• Customer oriented organization
• 2007 full year financial guidance supported

5
+23.4%9,6417,813Free Cash Flow
+10.7%6,7106,062Operating income
+14.2%4,8914,282Net Income
Change
1H07/1H06
14,505
30,102
Jan - Jun
2006
-2.2%14,181Operating Income before
D&A (OIBDA)
+3.2%31,070Revenues
Jan - Jun
2007
(CZK Millions)
Solid set of results in 1H07Solid set of results in 1H07……

6
Business solutions
focus on 3 growth areas focus on 3 growth areas in 2007in 2007……
……that deliveredthat delivered tangible tangible resultsresults
Broadband• ADSL• Bundles/Convergence
Mobile
• Postpaid
• Consumption
• Confirmed leadership in Corporate
and Government segments
• Impact on financials
• Speed upgrade completed (+90%)
• ADSL Start – New product
• Family of new bundles launched
• 24k net adds in 2Q / +37% y-o-y growth
• Significant migrations
• 42% share of postpaid (36%in 1H06)
• 19% y-o-y growth in traffic
Business solutions
• Projects

7
The main challenges for 2007 are around the customerThe main challenges for 2007 are around the customer……
Customer experience enhancement is key targetCustomer experience enhancement is key target
Service delivery
Customer care
Branding
Culture
• Service provisioning (new installations)
• Service assurance (fault repairs)
• First call resolution
• Integration (POS, corporate customer care,
corporate and business systems)
• Very high recognition and consideration levels
• Spontaneous brand awareness
• New headquarters
• Positive evidence of aligning cultures
8
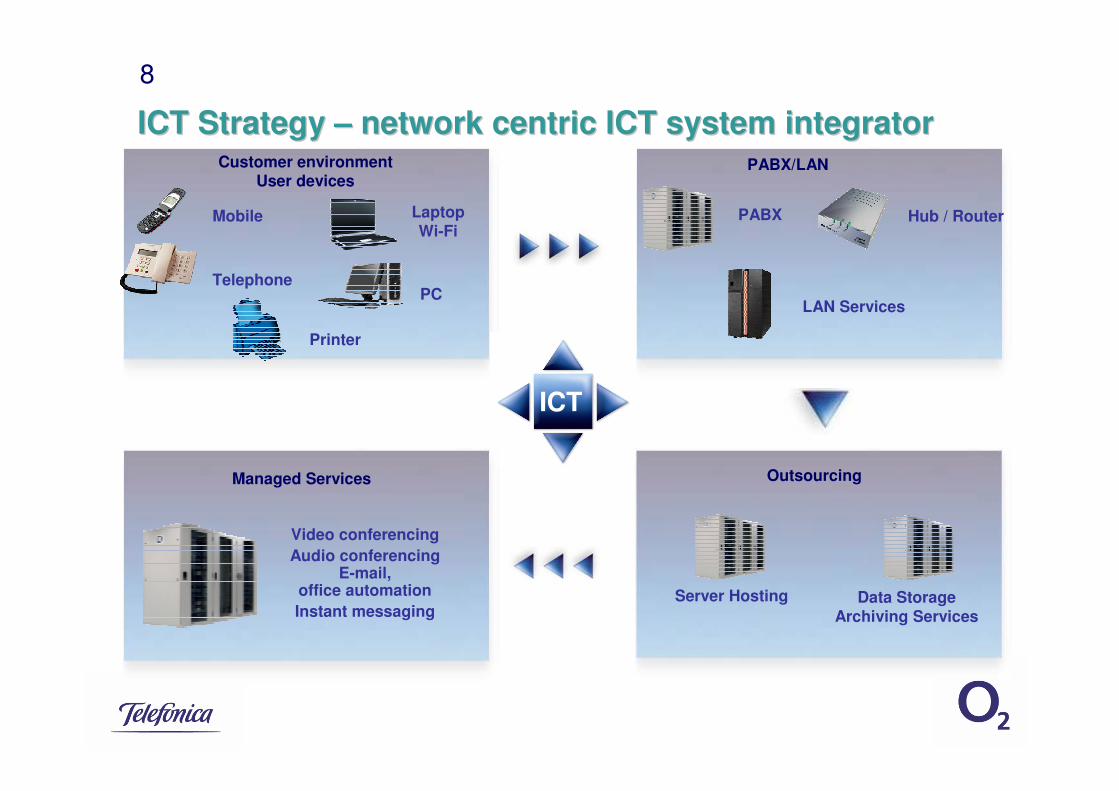
ICT Strategy ICT Strategy –– network centric ICT system integratornetwork centric ICT system integrator
ICT
Mobile
Telephone
Laptop Wi-Fi
PC
Printer
Customer environmentUser devices
Hub / Router
LAN Services
PABX/LAN
PABX
Managed Services
Video conferencing
Audio conferencingE-mail,
office automation
Instant messaging
Outsourcing
Server Hosting Data StorageArchiving Services

9
Key fixed line operational indicatorsKey fixed line operational indicators
+22 k
-19%• Improvement in fixed line cancellation
• Gross adds improvement
• Focus on Bundles and Value proposition upgrade
• Primarily Corporate and Government
• Unified SME solutions in pipe line
• Gain control over more customers
• Sustaining broadband market share
• 57k net adds in 1H07
• Fundamental part of 2-Play and 3-Play offer
+265%
Leadingbroadbandgrowth
Containingline loss
Gainingshare inIPTV
ICT/BusinessSolution
+37%
• Unique content proposition
• 38k customers @ 2Q06
• 3% market share on Pay TV market
ADSL
IPTV
Fixed lines net losses
ICT Services
2Q07
4Q06 2Q07
1H06 1H07
2Q06 2Q07
2Q06

10
• 20.3% y-o-y growth driven by contract
• Improving customer mix
• Positive impact on usage and ARPU
• Improving blended ARPU
• Contract ARPU diluted by migrations
• Data ARPU growth driven by CDMA and UMTS
Total DataContract
Drivingcustomerretention
Fosteringusage
Focusingvalue
• Traffic stimulation activities
• Improving customer mix
• Outgoing traffic +22.2% y-o-y
Customer base
Mobile traffic
ARPU
+20%
2Q06 2Q07
Contract
+19%
2Q06 2Q07
+2.4%-8.7%
+3.9%
Key mobile operational indicatorsKey mobile operational indicators
11
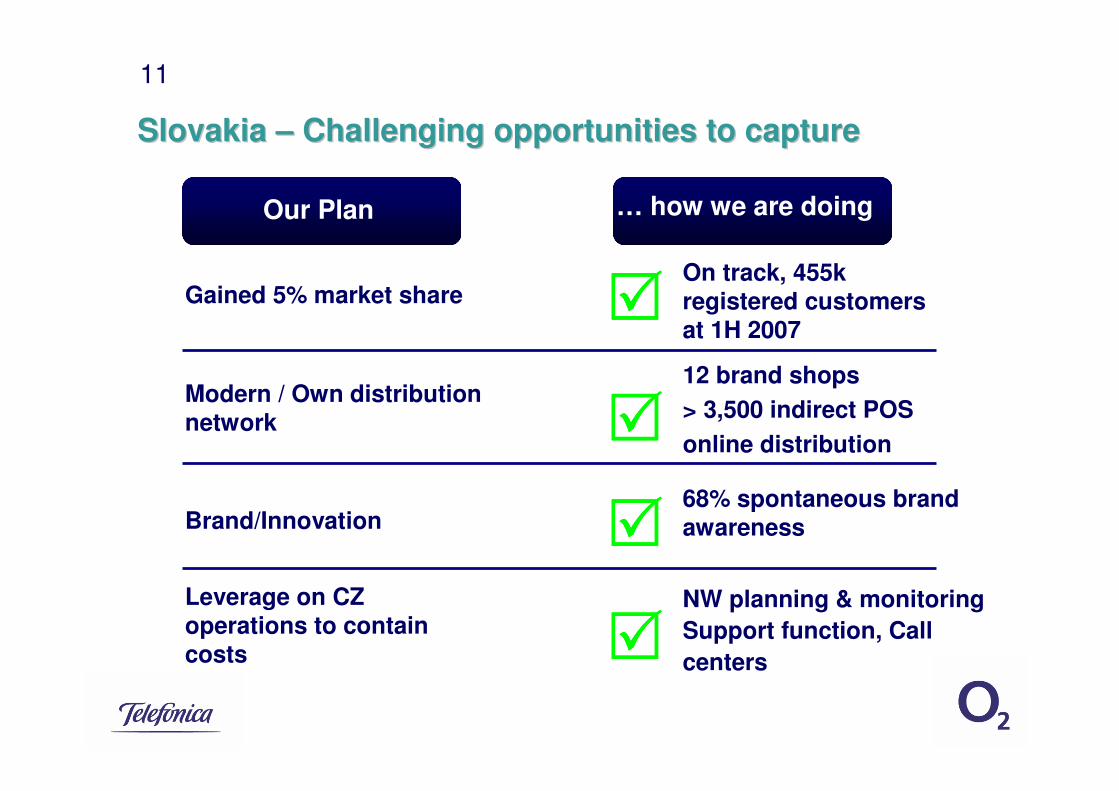
Slovakia Slovakia –– Challenging opportunities to captureChallenging opportunities to capture
Our Plan … how we are doing
Gained 5% market share
Modern / Own distributionnetwork
Brand/Innovation
Leverage on CZ operations to contain costs
����
����
����
����
On track, 455k registered customers at 1H 2007
12 brand shops
> 3,500 indirect POS
online distribution
68% spontaneous brand awareness
NW planning & monitoring
Support function, Call
centers

12
Guidance & OutlookGuidance & Outlook
• Full year financial guidance maintained
• Revenues: 1 - 3%,
• OIBDA: -1 - 0%,
• CAPEX: CZK 9 billion
• 2H 2007 focus
• Broadband & ICT
• Mobile performance
• Customer experience improvements
• Slovak business
In terms of guidance calculation, OIBDA excludes other exceptional revenues/expenses not foreseeable in 2007. For
comparison purpose, the impairment charge registered in 2006 was also deducted from reported figures
Basis for guidance: revenues of CZK 61,311 mil. and OIBDA of CZK 28,159
Guidance assumes constant exchange rates as of 2006

1H 2007 Financial Results

14
Revenue and OIBDA growthRevenue and OIBDA growth
F&M Revenue y-o-y growth(CZK in billion)
Group OIBDA evolution(CZK in billion)
Group Revenue evolution(CZK in billion)
Fixed
Mobile
+3.2%
1H06
30.1 31.1
1H07
+5.5%
1H06
14.9 15.7
1H07
+0.2%
1H06
15.2 15.2
1H07
-2.2%
1H06
14.5 14.2
1H07

15
Group Financial PerformanceGroup Financial Performance
9.0%(1,763)(1,618)Income taxes
(65.4%)(56)(162)Net financial expense
(11.5%)(7,471)(8,443)Depreciation and amortization
7.4%(17,143)(15,956)Operating Costs
125.7%(79)(35)Other operating expense
10.3%3229Gain on sale of fixed assets
(27.8%)291403Internal expenses capitalized in fixed assets
n.m.10(38)Impairment of fixed assets
Change 1H07/1H06
4,282
5,900
6,062
48.5%
14,505
30,102
Jan - Jun 2006
12.8%6,654Income before taxes
14.2%4,891Net income
10.7%6,710Operating Income
45.9%OIBDA margin 2)
(2.2%)14,181OIBDA 1)
3.2%31,070Revenues
Jan – Jun 2007(CZK millions)
Note: Unaudited, according to IFRS
1) OIBDA = Revenues + internal expenses capitalized in FA – OPEX – other expenses + gain on sale of FA - impairment 2) OIBDA margin = OIBDA/ Business revenues

16
1) PSTN (including payphones) x1; ISDN Basic x 1; ISDN Primary Access x 302) Leased lines3) Wholesale circuits
CZ Fixed Operational PerformanceCZ Fixed Operational Performance
n.m.380Pay TV
7.0%6460Wholesale ADSL
(68.5%)242767Dial-up outgoing traffic (mil. minutes)(19.6%)1,4351,785Voice outgoing traffic (mil. minutes)
(13.2%)2,8043,229Final Client Accesses
(15.4%)1113- Other 2)
41.8%462326- Broadband (ADSL)
(61.8%)86224- Narrowband
(0.7%)559563Internet and Data Accesses
(19.1%)67Other 3)
36
106
2,207
2,909
30 June 2007
n.m.12Unbundled loops
33.5%79Wholesale Accesses
(17.2%)2,666Fixed Telephony Accesses 1)
(12.1%)3,308Accesses
change
Jun07/Jun06
30 June 2006(thousands)

17
CZ Fixed Business Revenues CZ Fixed Business Revenues –– sources of variationsources of variation
Access Traffic
(CZK billions)
Data Other 1) 1H 2007
1] Other – incl. equipment sales and value added services
Figures excluding inter-segment charges between fixed and mobile segment; subsidiaries and related inter-company transactions and adjustments are not included
IT Services
Interconnect1H 2006 Internet
& BB
15,009 (273)
(629)
176
297
588 (25) (85)
15,058

18
1) GPRS flat fee and CDMA (mobile broadband Internet) customers
CZ Mobile Operational PerformanceCZ Mobile Operational Performance
(7.4%)2,8173,043- prepaid
20.3%2,0771,727- contract
2.9%108105data ARPU blended (CZK)
3.9%241232prepaid ARPU (CZK)
(8.7%)906992contract ARPU (CZK)
2.4%510498ARPU blended (CZK)
8.6%1,5011,382Total no. of SMS (millions)
115
42%
177
4,894
30 June 2007
16.2%99Average MOU blended (in & outbound)
6.7%39%non-SMS data ARPU as % of data ARPU
14.2%155Data customers 1)
2,6%4,770No. of registered customers
change
Jun07/Jun06
30 June 2006(thousands)

19
CZCZ Mobile Business Revenues Mobile Business Revenues –– sources of variationsources of variation
(CZK billions)
Monthly Fees
Traffic Interconnect VAS Internet & Data
Other revenues
1] Other – incl. equipment sales and IT services
Figures do not include inter-segment charges between fixed and mobile segment; subsidiaries and related inter-company transactions and adjustments are not included
14,893
315
304 (5) 59
141 0 15,707
1H 2006 1H 2007

20
Group OPEX Group OPEX –– sources of variationsources of variation(CZK billions)
Interconnect Other Supplies
Personnel Expenses
Marketing & Sales
Network & IT repair and
maintenance
Other Subcontracts 1]
Taxes 1H 2007
1] Other Subcontracts – incl. Rentals, Buildings, Vehicles and Utilities
Figures do not include inter-segment charges between fixed and mobile segment
1H 2006
15,956
363
392
99
293
115
95 (170)
17,143

21
CAPEXCAPEX
Jan - Jun 06 Jan - Jun 07
(CZK millions)
• Overall Group CAPEX growing
due to due to Slovak operations
launch
• CAPEX in Czech Republic
slower in 1H07 as most of the
network capacities dedicated
on Slovak project deployment
• Investments into UMTS, CDMA
and ADSL based on actual
consumption
2,690 2,756+2.5%
22
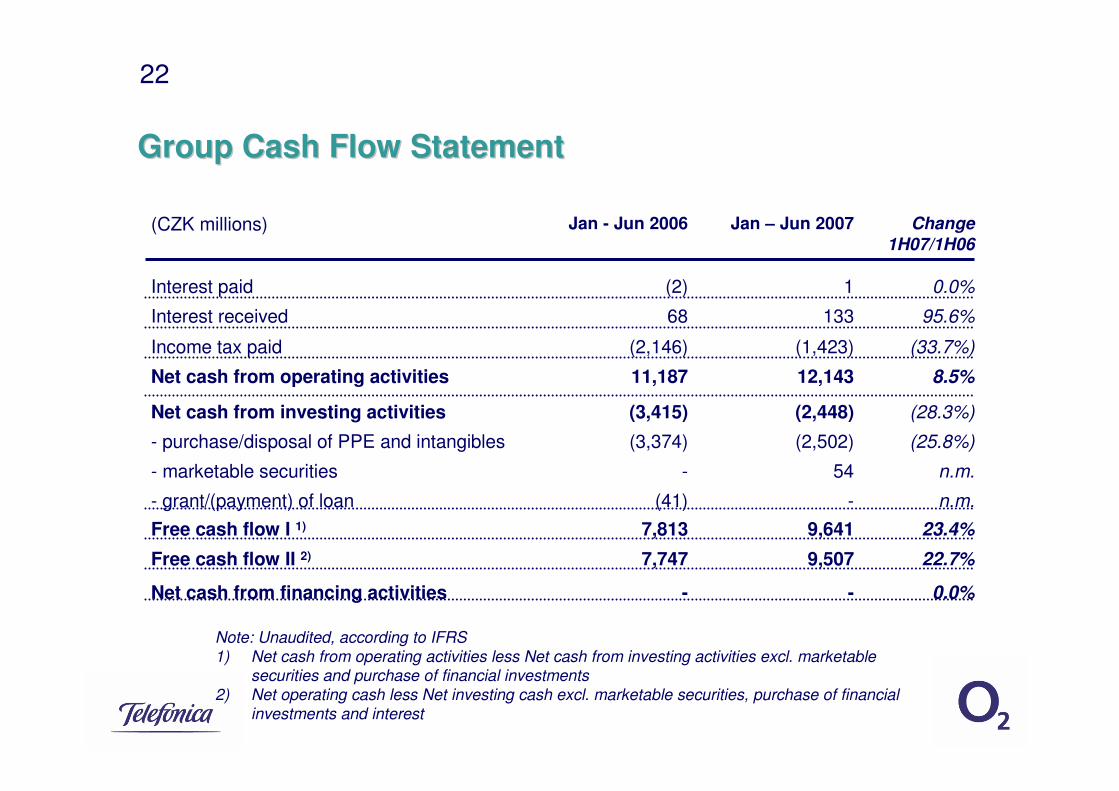
GroupGroup Cash Flow StatementCash Flow Statement
95.6%13368Interest received
-
9,507
9,641
-
54
(2,502)
(2,448)
12,143
(1,423)
1
Jan – Jun 2007
0.0%
22.7%
23.4%
n.m.
n.m.
(25.8%)
(28.3%)
8.5%
(33.7%)
0.0%
Change
1H07/1H06
-
7,747
7,813
(41)
-
(3,374)
(3,415)
11,187
(2,146)
(2)
Jan - Jun 2006
Free cash flow II 2)
Interest paid
Income tax paid
- grant/(payment) of loan
(CZK millions)
Free cash flow I 1)
Net cash from financing activities
- marketable securities
- purchase/disposal of PPE and intangibles
Net cash from investing activities
Net cash from operating activities
Note: Unaudited, according to IFRS
1) Net cash from operating activities less Net cash from investing activities excl. marketable securities and purchase of financial investments
2) Net operating cash less Net investing cash excl. marketable securities, purchase of financial
investments and interest
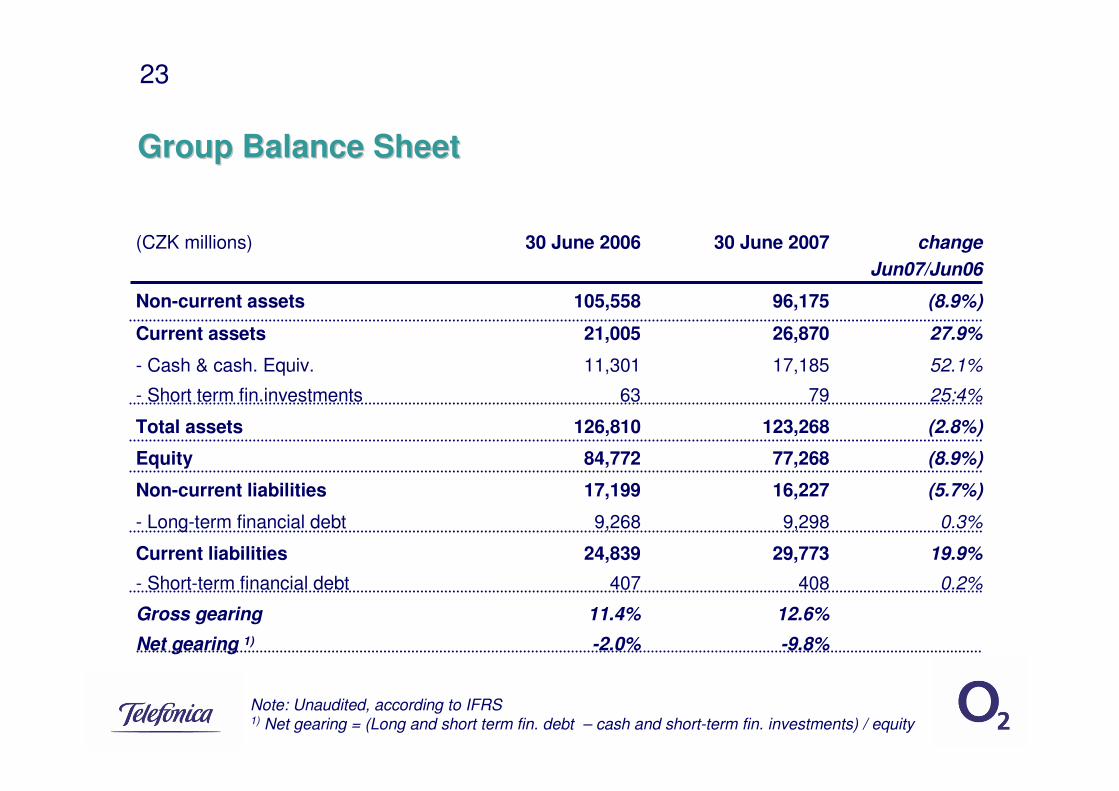
23
GroupGroup BalanceBalance SheetSheet
25:4%7963- Short term fin.investments
-9.8%
12.6%
408
29,773
9,298
16,227
77,268
123,268
17,185
26,870
96,175
30 June 2007
11.4%Gross gearing
0.2%407- Short-term financial debt
19.9%24,839Current liabilities
-2.0%Net gearing 1)
0.3%9,268- Long-term financial debt
(5.7%)17,199Non-current liabilities
(8.9%)84,772Equity
(2.8%)126,810Total assets
52.1%11,301- Cash & cash. Equiv.
27.9%21,005Current assets
(8.9%)105,558Non-current assets
change
Jun07/Jun06
30 June 2006(CZK millions)
Note: Unaudited, according to IFRS1) Net gearing = (Long and short term fin. debt – cash and short-term fin. investments) / equity