telecommunications project management quality management pert
Post on 20-Dec-2015
219 views
TRANSCRIPT

Telecommunications Project Management
Quality Management
PERT

QualityISO 9000
“Totality of feature and characteristics of a product or service that bears on its ability to satisfy stated or implied needs”
Figure 20-1

Quality Control
Equipment designProject quality ≠ Management of operationsTelecom: Service = Product
Project quality and Operations quality boundary unclear
Quality controlVerify project deliverables comply with
standards setTake action if needed

Telecom Quality Control
Overlapping requirements
1. Network operations and maintenance
2. End-user experience Include internal workers
If well executed and follow best practices may still lead to failure

Quality and Innovation
Identify demographics Identify needs →Project specs
Sustaining innovations Oral transmission of knowledge Social interactions
Service platform innovations More involved due to technology leap More uncertainty
Disruptive innovations Customer profile fuzzy & expectations tentative Reinvent the “wheel” Quality decisions pass from engineers to lawyers and accountants

Quality and Cost
Prevention cost – Cost of all activities to prevent known defects from affecting agreed service levels
Appraisal cost – Cost during evaluation of equipment due to inspections, tests, etc.
Failure cost – Cost of experiencing a failure during operation

Quality Examples
PSTNLasts 30 or more minutes & disrupts 1000
subscribersCauses loss of service to a government
response agencyMust report to the Network Reliability
Council any outage that affects 30,000 subscribers >30 minutes

Quality Examples
Enhanced services (data, VoIP)Defined by service level agreements (SLA)More than 5% of active ports unusable for
>30 minutesMore than 10% of active ports unusableQoS agreementsTable 8.1

Service Release Management
Total Quality cost = Prevention cost + appraisal cost + failure cost
<Upper bound cost of qualityAppraisal cost < Prevention cost +
failure costTable 8.2
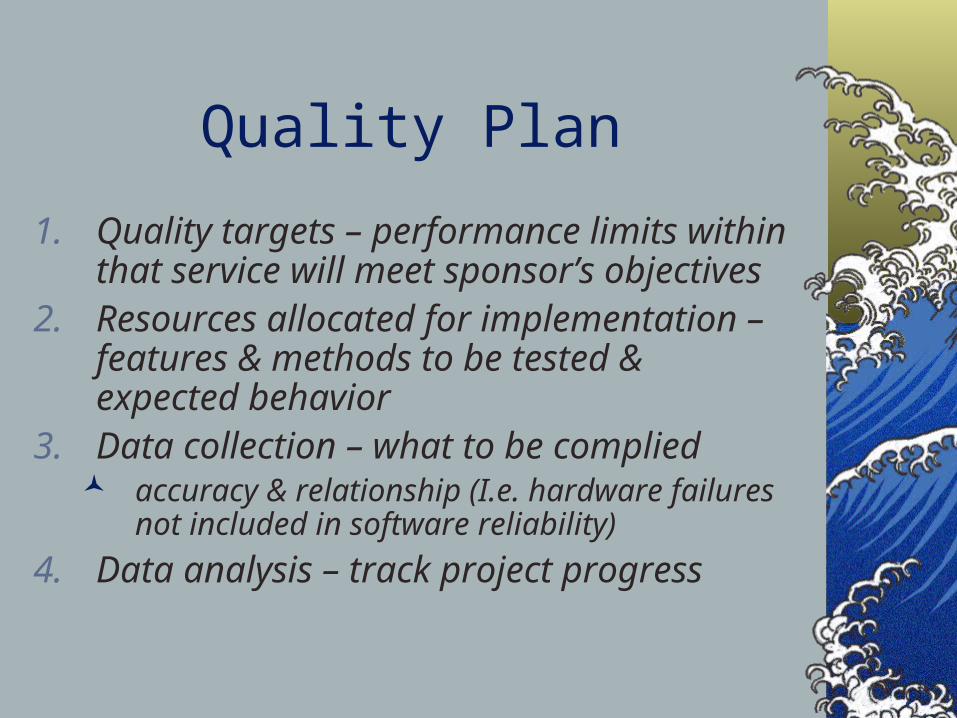
Quality Plan
1. Quality targets – performance limits within that service will meet sponsor’s objectives
2. Resources allocated for implementation – features & methods to be tested & expected behavior
3. Data collection – what to be complied accuracy & relationship (I.e. hardware failures
not included in software reliability)
4. Data analysis – track project progress
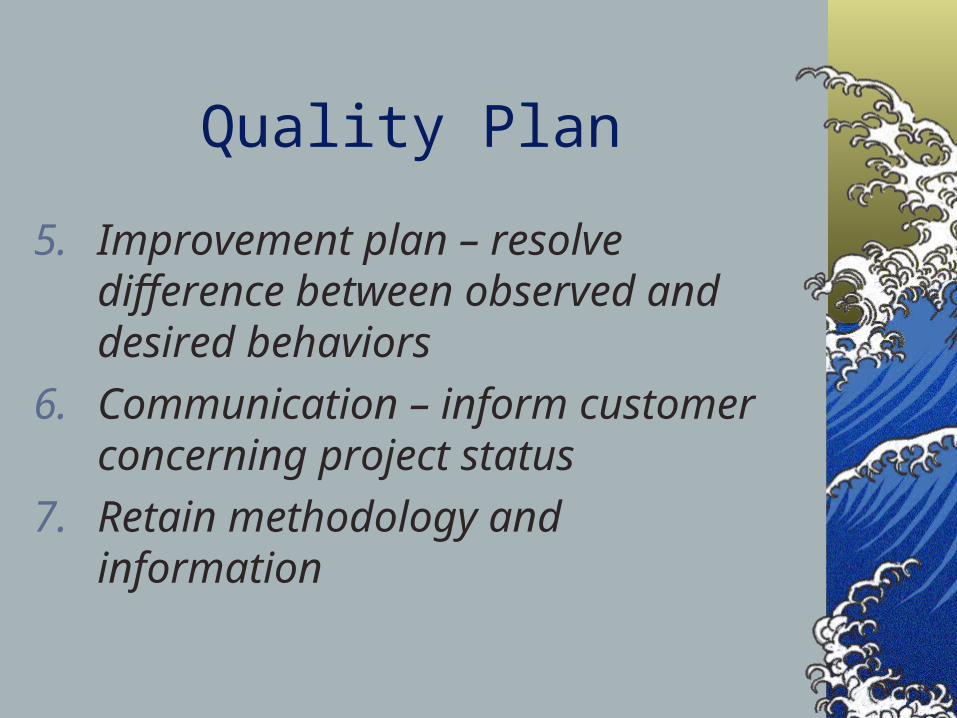
Quality Plan
5. Improvement plan – resolve difference between observed and desired behaviors
6. Communication – inform customer concerning project status
7. Retain methodology and information

Categorization of Defects: Urgency and Criticality
Figure 8.1
Table 8.4

Appraisal
1. Unit/Module Tests
2. Functional Tests
3. Integration Tests
4. Systems/Software Quality Assurance test (SQA)
5. Customer Acceptance Testing

Telecom Non-Incremental Innovation
Figure 8.3

Evaluation of Testing Progress
1. Number of test cases executed, passed, failed and blocked
2. Progress3. Percentage and number of tests passed4. Number of unresolved critical or major defects5. Number of defects without root cause analysis:
could not be solved with available resources6. Turnaround time for defect resolution
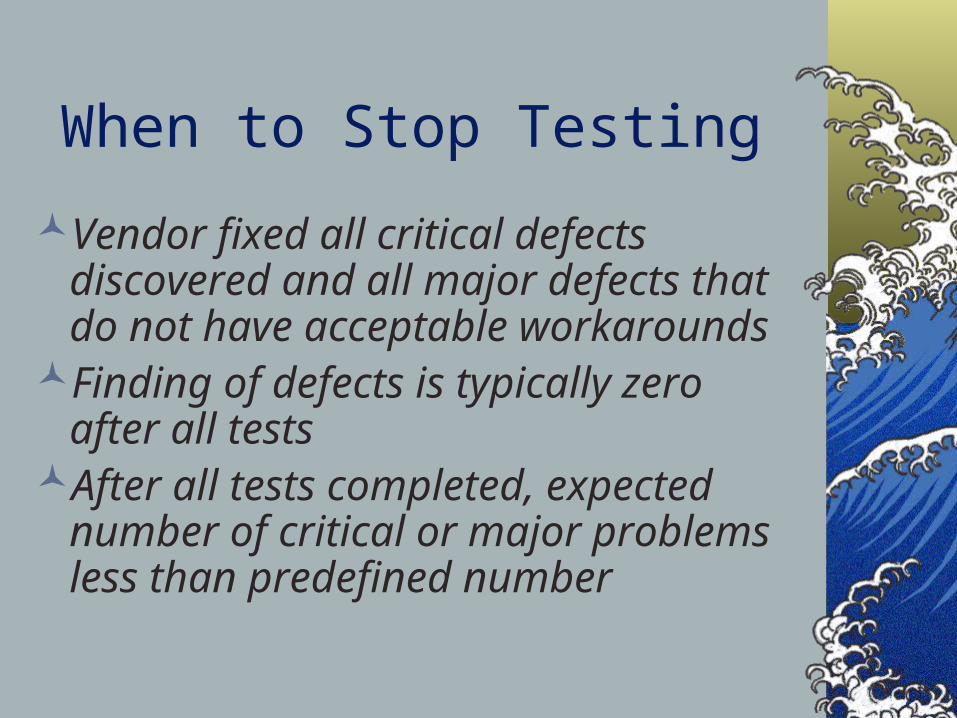
When to Stop Testing
Vendor fixed all critical defects discovered and all major defects that do not have acceptable workarounds
Finding of defects is typically zero after all tests
After all tests completed, expected number of critical or major problems less than predefined number

Vendor Management During Testing
Figure 8.10

Total Quality Management (TQM)
System for integrating organizational elements into:DesignDevelopmentManufacturing effortsCost-effective products/services to customer
Externally – Customer oriented & provides customer satisfaction
Internally – Reduces production line bottlenecks and operating costs – improves product quality and organizational morale

Program Evaluation and Review Technique (PERT)
Similar to Critical Path Method (CPM)Requirements:
Individual tasks must be clear enough to put in a network (WBS)
Events and activities must be sequenced that allow critical and sub-critical paths (10 - >100)
Time estimates made on a three way basisOptimistic, most likely, pessimistic
Critical path and slack times computed
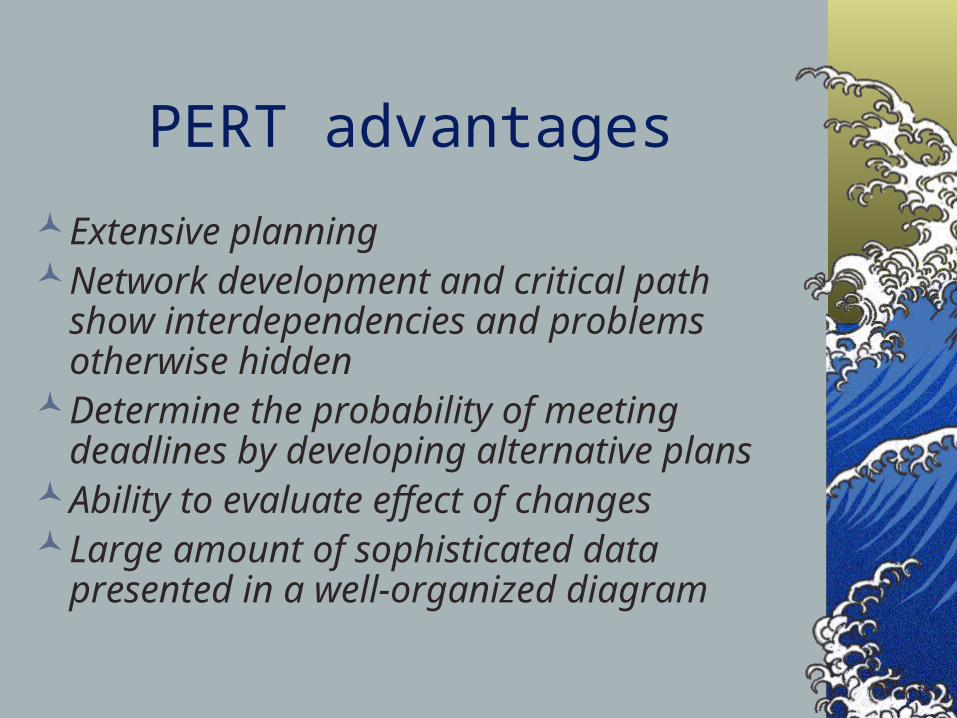
PERT advantages
Extensive planningNetwork development and critical path show
interdependencies and problems otherwise hidden
Determine the probability of meeting deadlines by developing alternative plans
Ability to evaluate effect of changesLarge amount of sophisticated data presented
in a well-organized diagram

PERT Disadvantages
Complexity adds to implementation problems
More data requirementsExpensive to maintainUtilized most often on large, complex
programs

Network Events and Activities
Event – milestoneActivity – Element of work that must be
accomplishedDuration – Total time required to complete
activityEffort – Amount of work actually performed
during durationCritical Path – Longest path through the
network and determines the duration of the project

Standard PERT terms
Figure 12-1

Gantt vs. PERT Chart
Figure 12-3

Series vs. Parallel PERT Chart
Figure 12-13

Expected Time Between Events
te = a + 4m + b
---------------
6
te = expected time
a = most optimistic time
b = most pessimistic time
m = most likely time

Estimate Total Project Time
σte = b – a
------
6
σte = standard deviation of the expected
time
Figure 12-15

PERT Disadvantages
End-item oriented – removes ability to make decisions
Unless repetitive project – little historical information to base cost estimates of most optimistic, most pessimistic, and most likely
Each division of organization may use its own method for estimating costs