teenagers’ usage of social networking media in a …€™ usage of social networking media in a...
TRANSCRIPT
International Journal of Scientific & Engineering Research, Volume 4, Issue 12, December-2013 622 ISSN 2229-5518
IJSER © 2013 http://www.ijser.org
Teenagers’ Usage of Social Networking Media
in a South Indian State
Titto Varghese, Dr D Nivedhitha, Dr. Pradeep Krishnatray
Department of Mass Communication, Pondicherry University, Kalapet, Puducherry
Abstract
Teenagers are becoming more and more media dependent as years pass by. If it was radio or
television in the past, it is the time for internet and social networking media today. This study is an
attempt to analyze the media (including the traditional media) habits of teenagers in terms of the
time spent for it, place and medium of accessing internet and the motivations for the usage of these
media. The study was conducted in the city of Trivandrum, the capital of Kerala. The respondents
were high school and higher secondary students of class 8th to class 12th. A structured questionnaire
was used to obtain data from 556 students from Government and Private schools. 292 boys and 264
girls participated in the survey. Results show that the favourite activity for the Kerala teenagers even
today in the Social Networking Era is watching television when they are alone at home. More time
in internet is spent on Social Networking sites compared to the time they spend for educational
needs. The gratifications obtained from the usage of social networking sites are factor analyzed to a
four factor structure, namely Communication, Connectivity, Relaxation and User friendliness.
Key Words: Teenage, Internet, Social Networking Media, Gratification Structure
I. INTRODUCTION & REVIEW OF LITERATURE
The usage of Internet among teenagers is on an upward direction these days in India. Teenagers
use it for different purposes. Like other age groups, today’s teenagers have been affected by the
multimedia technology to a greater extent. Teens are spending increasing amounts of time, using
internet and cell phones. Teenagers and youth today are unable to think about a day in their life
without any of these media (Diamanduros, Jenkins, & Downs, 2007). In 1999, an average American
child lived in a house hold with more than 2 TVs, 3 cassette players, 3 radios, 2 VCRs, 2 CD players,
1 video game player and 1 computer with internet connection (Roberts, Foehr, Rideout & Brodie,
1999). In 2004, an American survey found out that 73% of teenagers owned a computer and 44
percent owned a mobile phone. By 2006 this number was found to be increasing with more internet
IJSER
International Journal of Scientific & Engineering Research, Volume 4, Issue 12, December-2013 623 ISSN 2229-5518
IJSER © 2013 http://www.ijser.org
connections, and by 2009, 75% of American teenagers earned cell phones. It was also found out that
the most (almost four hours a day) out of the teenagers’ media time is taken by mobile phones for
teenagers (Pew Internet and American Life Project, 2010).
Now the scenario is different, at least in Indian context, where teenagers are more and more
getting addicted to internet. Social Networking sites are now becoming more and more popular
among them. The advancement in science and technology are beginning to alter even the way we
communicate with each other. Any one of the media devices can easily be blamed for, not only
reducing a child’s sense of imagination and lack of physical exercise, but also the lack of
communicating with others (Peetz-Ballweg, 2010). If it was the advent of the mobile phone which
caused greater concern in this regard in the past, now it’s the turn of internet and social networking
media. There were interview studies and focus group discussions which reported youth and
teenagers remember and type facebook id and password almost unknowingly whenever they sit in
front of a computer (Young, 2012).
Teens join social networking sites basically to connect with people they already knew. In a 2006
survey by Pew found that 91% of the facebook users keep in touch with friends they see every day
and 82% use these sites to connect with friends whom they meet rarely (Lenhart and Madden,
2007). When asked by danah boyd why they are using a particular social media site, many of the
teenagers said: “That’s where my friends are.” Boyd would opine that teens adopt the tools that their
friends use and in doing so they influence the people around them (boyd, 2008). Facebook is
arguably the most popular social networking site at least among the Indian teenagers because of its
user friendly interface, opportunity for relaxation and the chance of maintaining relationships. There
are students who log into facebook as their first activity of a day (Varghese & Nivedhitha, 2012).
Many of the practicing Psychologists now opine that teenagers who are heavy users of social
networking sites seem to be more depressed. They are reported to have interrupted sleep patterns
and missed schools and meals. The trend has gone to the extreme that Psychologists now have
started asking for the online behaviour of the patients of any sort before they do a full assessment
(Shastri, 2011).
The popular ways for the youth of the 20th century for interpersonal communication were either
face-to-face communication or telephone. In the 21st century, youth and even teenagers with their
ready access to the Internet are generally using computer mediated communication methods. They
find these new media technologies as more convenient in terms of time, money and convenience.
(Tidwell & Walther, 2002). This popularity explosion of the Social Networking Sites have redefined
IJSER
International Journal of Scientific & Engineering Research, Volume 4, Issue 12, December-2013 624 ISSN 2229-5518
IJSER © 2013 http://www.ijser.org
interpersonal communication and restructured relationships (Romm, Pliskin, & Clarke, 1997). Boyd
defines Social Networking sites as the sites which allow users to present personal information like
age, gender, location and interests to the known and like-minded people whose profiles exist in
those sites (boyd & Ellison, 2007). This feature encourages people to join these sites and to find
their old friends and to get acquainted with new friends. A recent study revealed that the interface
and the userfriendliness of these sites appeal more to the youth. In Europe and North America, 54%
of those aged 16-24 had social networking profiles. But, the percentage was going lower as the age
increased (Zheng, 2008).
The Pew Internet and American Life Project study in 2007 reported that 91% Social Networking
teenagers use the sites to be in touch with their regular friends whom they meet very often. 82% use
these sites to get the news from their distant friends whom they meet very rarely and 72% make use
of these sites to arrange holiday plans with their friends. Only 49% use these social networking sites
to make new friends (Lenhart & Madden, 2007). Another study in UK found out that though
teenagers have lots of friends in social networking sites, the actual number of close friends was
almost the same as their real life friends. Teenagers in this study reported that 90% of their contacts
in social networking sites are people whom they have already met and only 10% will be strangers
(Smith, 2007).
Around 3000 customers in the age group of 18 – 54 from more than 14 countries were surveyed
online in 2010. More than 90% of them were aware of the social networking sites and at least 72%
were members in any of the social networking sites. The average Number of friends was 195 and
generally they log in to social networking sites more than once a day (Tay, 2010). Social networking
sites were found more popular among the young women in the age group 18 – 29 and 69% of them
log in to these sites at least once a day (Madden & Zickuhr, 2011). Facebook is regarded as the
second most often visited website and 38.4% of the internet users were found to have accessed
facebook in the three months period from 19 October 2010 to 19 January 2011 (Fuchs, 2011).
Internet causes time displacement in people’s television viewing reports the earlier studies on
Displacement Effects of Internet (Kaye, 1998). Later there were many studies done on this regard
and many of the studies confirmed the position of the earlier studies underlining the fact that the
more time people spend on internet the less they watched television (Nie & Erbring, 2000).
IJSER
International Journal of Scientific & Engineering Research, Volume 4, Issue 12, December-2013 625 ISSN 2229-5518
IJSER © 2013 http://www.ijser.org
II. OBJECTIVES OF THE STUDY
The present research was conducted to find out the time spend by teenagers for different media,
where they use it and what do they like to do online etc. The more precise objectives are the
following.
1. What do the teenagers generally do when they are alone at home?
2. What are their media and internet habits?
3. What are their social media habits?
4. What are the reasons/motivations behind their social networking media usage?
III. METHODOLOGY
The study was conducted in the capital city of a southern Indian state.
Selection of Schools
The city was first divided into three zones; south, north and central. Schools, public
(government) and private, were selected from each of the three zones. Three government schools
(out of 6) and three private schools (out of 6) were randomly selected from the north zone. Four
government schools (out of 8) and four private schools (out of 9) were selected randomly from the
central zone. Similarly, three government schools (out of 5) and three private schools (out of 7)
were randomly selected from the south zone. Permission to administer questionnaire to school
students was obtained from the school managements prior to the study. During the course of the
study 2 more government schools were added in order to increase the number of respondents from
government schools. Overall, 12 government and nine private schools were selected from the city.
Selection of Respondents
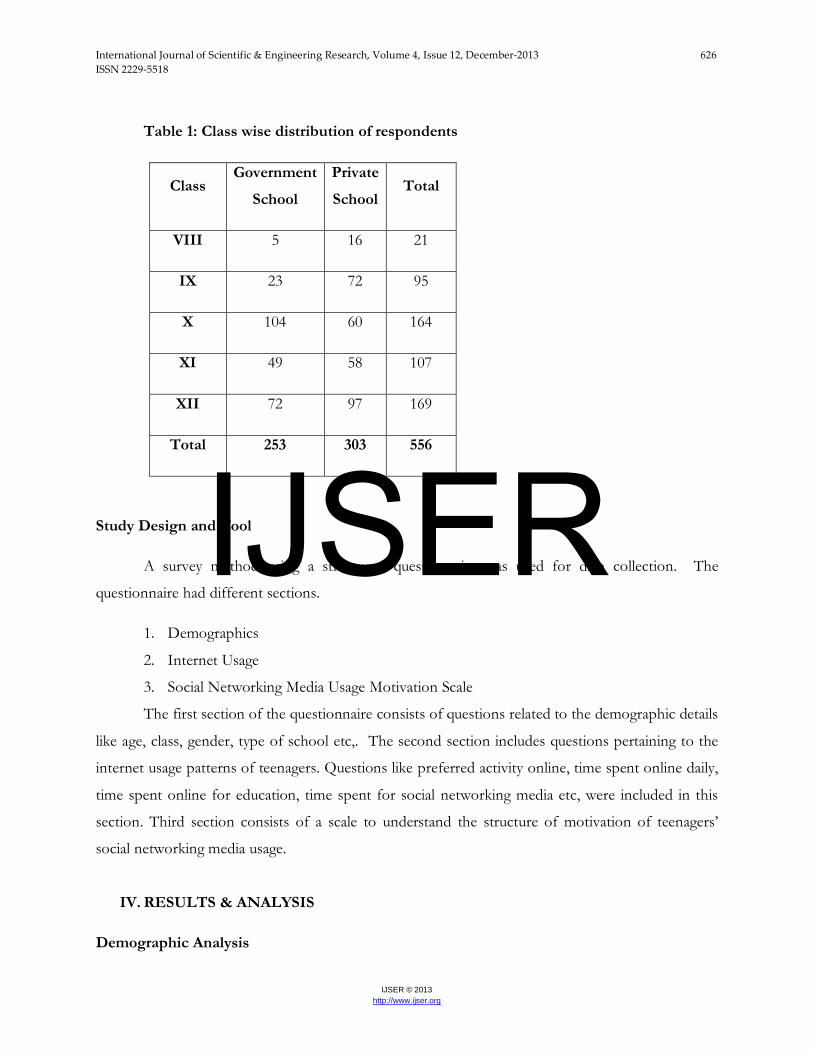
556 teenagers (292 male & 264 female) from classes 8th to 12th were the participants in the
study. The questionnaire was administered to all the students in a class who use Social Networking
Media. Table 1 shows the number of students selected from two types of schools and classes (VIII
to XII) for the study.
IJSER
International Journal of Scientific & Engineering Research, Volume 4, Issue 12, December-2013 626 ISSN 2229-5518
IJSER © 2013 http://www.ijser.org
Table 1: Class wise distribution of respondents
Class Government
School
Private
School Total
VIII 5 16 21
IX 23 72 95
X 104 60 164
XI 49 58 107
XII 72 97 169
Total 253 303 556
Study Design and Tool
A survey method using a structured questionnaire was used for data collection. The
questionnaire had different sections.
1. Demographics
2. Internet Usage
3. Social Networking Media Usage Motivation Scale
The first section of the questionnaire consists of questions related to the demographic details
like age, class, gender, type of school etc,. The second section includes questions pertaining to the
internet usage patterns of teenagers. Questions like preferred activity online, time spent online daily,
time spent online for education, time spent for social networking media etc, were included in this
section. Third section consists of a scale to understand the structure of motivation of teenagers’
social networking media usage.
IV. RESULTS & ANALYSIS
Demographic Analysis
IJSER
International Journal of Scientific & Engineering Research, Volume 4, Issue 12, December-2013 627 ISSN 2229-5518
IJSER © 2013 http://www.ijser.org
1. About their Parents
27% of the fathers of the respondents are well educated. Their education level is PG or above.
34.4% are graduates. 36% are below class 12 and 2% are not educated. 23.6% of mothers are well
educated (PG or above). 38.7% are graduates. 34.5% are having class 12 education and 2.7% are not
educated. Although the education levels of both fathers and mothers are almost the same there was
a huge difference seen in the case of their work status. 93.9% of the fathers of the respondents are
working whereas only 44.4% of the mothers are working.
2. Places of going Online
More than 66% of the students go online from home. 12 % go online from internet cafes.
Almost 8% each check internet either from school or from friends’ house. 6% go online elsewhere.
3. Medium through which they go online
Almost 71% of the teenagers go online through the Desktop, just above 40% use mobile phones
to go online, 24% use laptops for going online and 7% use other gadgets to go online. More female
students are found to be using laptop to go online compared to the boys. A comparatively larger
amount of boys uses mobile to access internet.
4. About their free time Activity
For 37.4% of the teenagers even today the most preferred activity when they are alone at home
is to watch TV. 32.7% of the teenagers have moved to Facebook as their favourite time-pass. 18%
prefer to play games. Almost 6% each will go doing their home work or talk to friends on phone.
Time spent by Teenagers for Media
1. Mobile Phone
51% of the teenagers in Trivandrum City own a mobile phone. 12% of the students do not use
mobile phone at all whereas 39.4% use mobile for 15 minutes or less. 22.7% use it up to 30 minutes
and 20.3% use it from half an hour to 2 hours. 5.6% spend more than 2 hours on mobile every day.
There are students who use mobile phone for more than 5 or 6 hours daily. Among the 283 students
with mobile phones 64% are boys. Among those who use mobile phones for more than two hours
71% are boys.
2. Television
Only 6% of the teenagers are not using TV at all. 24% use it for less than 30 minutes a day. 32%
use it for 30 minutes to 1 hour. 25% use it for 1 to 2 hours. 13.3 % use it for more than 2 hours.
There are students who use it for more than 4 hours daily.
IJSER

International Journal of Scientific & Engineering Research, Volume 4, Issue 12, December-2013 628 ISSN 2229-5518
IJSER © 2013 http://www.ijser.org
3. Newspaper
12.2 % of the teenagers of the city are not reading newspapers at all. 32 % spend 10 minutes for
Newspaper. 25.4 % spend up to 20 minutes. 19% spend maximum half an hour and only 10% spend
more than 30 minutes for Newspaper.
4. Radio
41.5% of the teenagers in the city do not use radio. Only 25% spend 15 minutes or less for
Radio. 20% spend up to 30 minutes and 8.8% spend 1 hour and only 5% spend more than 1 hour
for Radio daily. Among those who are not using Radio at all, more than 60% are boys.
Time spent by Teenagers for Internet
1. Internet in General
38.3% spend less than 1 hour for internet daily. 20% spend 1 to 2 hours. 15.6% spend 2 to 3
hours. 10% each spend 3 to 4 hours and 4 to 5 hours daily. Almost 4.5% spend more than 5 hours
for internet daily.
2. Internet for Education Purpose
67% of the teenagers spend less than an hour per day in internet for education purpose. 25%
spend 1 to 2 hours on internet daily for education. Less than 8% of the teenagers only spend more
than 2 hours daily on internet for education purpose.
3. Preferred Online Activity
For almost half of the respondents (46.4%) Social Networking Media is the most preferred
activity online. For 23 % Education is the most preferred activity while 20% use internet mainly for
entertainment purpose. 8.3% use internet to play games. Again in the second most preferred activity
too, 31.8% rated Social Networking Media as the top priority whereas a close second position is
entertainment with 31.1%. Education went down to the third position with just 21.9%. There is a
considerable change in the third most preferred activity as entertainment gets the first position with
34% and Social Networking Media second with 29.3 and education is third again at 20.3%. A very
significant difference is seen between boys and girls in their preferred online activities. 32% of girls
prefer Education online compared to the 15% of boys and 56% of boys prefer social networking
compared to the 36% of girls.
4. Social Networking Media
Around 35% of the students use more than 2 hours on internet for Social Networking Sites.
46.6% spend less than an hour for Social Networking Sites. 18.2% use it for 1 to 2 hours. 13.3%
IJSER
International Journal of Scientific & Engineering Research, Volume 4, Issue 12, December-2013 629 ISSN 2229-5518
IJSER © 2013 http://www.ijser.org
spend 2 to 3 hours. 9.2% spend 3 to 4 hours. 9.5% use social networking sites for 4 to 5 hours and
3% for more than 5 hours. There is a significant difference seen between boys and girls in their
social networking site usage. 15.5% of Girls spend more than 4 hours daily for Social Networking
sites whereas only 10.6% of Boys spend more than 4 hours in these sites. Almost 40% of the
teenagers are very new to the Social Networking world as they have been using these sites for less
than a year. 21.6% use it for 1 to 2 years. 14.6% for 2 to 3 years. 9.2 % for 3 to 4 years. 7% each are
using it for either 4 to 5 years or more than 5 years. Around 31% of the teenagers log into their
favourite social media sites more than once a day (32.3% of Girls & 29.6 % of Boys).
Activities in Social Networking Media
Facebook is rated as the most preferred Social Networking Media almost unanimously with
81.5% preferring it over the other social networking sites. YouTube is at a distant second position
with just 7% of teenagers preferring it. Google + is preferred by 4% of the teenagers. 67 % of the
teenagers have less than 400 friends in Social Networking Media. 20% have 400 to 800 friends. 7%
have 800 to 1200 friends. 6% have more than 1200 friends.
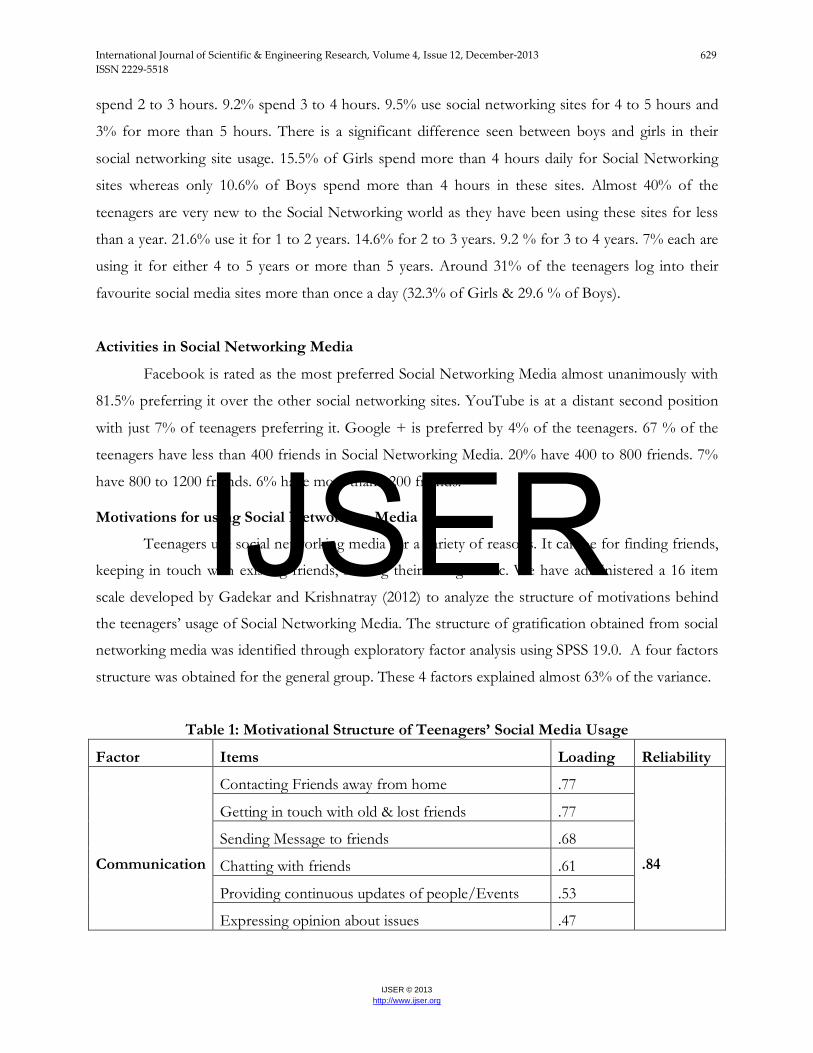
Motivations for using Social Networking Media
Teenagers use social networking media for a variety of reasons. It can be for finding friends,
keeping in touch with existing friends, sharing their thoughts etc. We have administered a 16 item
scale developed by Gadekar and Krishnatray (2012) to analyze the structure of motivations behind
the teenagers’ usage of Social Networking Media. The structure of gratification obtained from social
networking media was identified through exploratory factor analysis using SPSS 19.0. A four factors
structure was obtained for the general group. These 4 factors explained almost 63% of the variance.
Table 1: Motivational Structure of Teenagers’ Social Media Usage
Factor Items Loading Reliability
Communication
Contacting Friends away from home .77
.84
Getting in touch with old & lost friends .77
Sending Message to friends .68
Chatting with friends .61
Providing continuous updates of people/Events .53
Expressing opinion about issues .47
IJSER
International Journal of Scientific & Engineering Research, Volume 4, Issue 12, December-2013 630 ISSN 2229-5518
IJSER © 2013 http://www.ijser.org
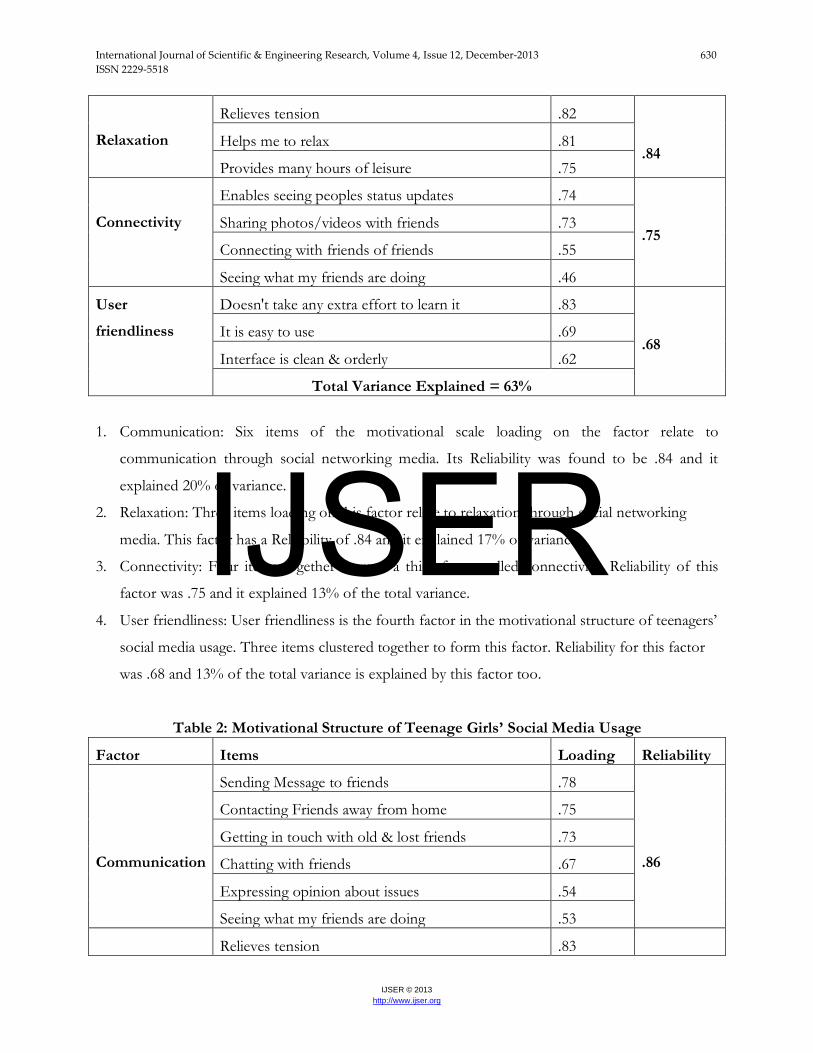
Relaxation
Relieves tension .82
.84 Helps me to relax .81
Provides many hours of leisure .75
Connectivity
Enables seeing peoples status updates .74
.75 Sharing photos/videos with friends .73
Connecting with friends of friends .55
Seeing what my friends are doing .46
User
friendliness
Doesn't take any extra effort to learn it .83
.68 It is easy to use .69
Interface is clean & orderly .62
Total Variance Explained = 63%
1. Communication: Six items of the motivational scale loading on the factor relate to
communication through social networking media. Its Reliability was found to be .84 and it
explained 20% of variance.
2. Relaxation: Three items loading on this factor relate to relaxation through social networking
media. This factor has a Reliability of .84 and it explained 17% of variance.
3. Connectivity: Four items together formed a third factor called connectivity. Reliability of this
factor was .75 and it explained 13% of the total variance.
4. User friendliness: User friendliness is the fourth factor in the motivational structure of teenagers’
social media usage. Three items clustered together to form this factor. Reliability for this factor
was .68 and 13% of the total variance is explained by this factor too.
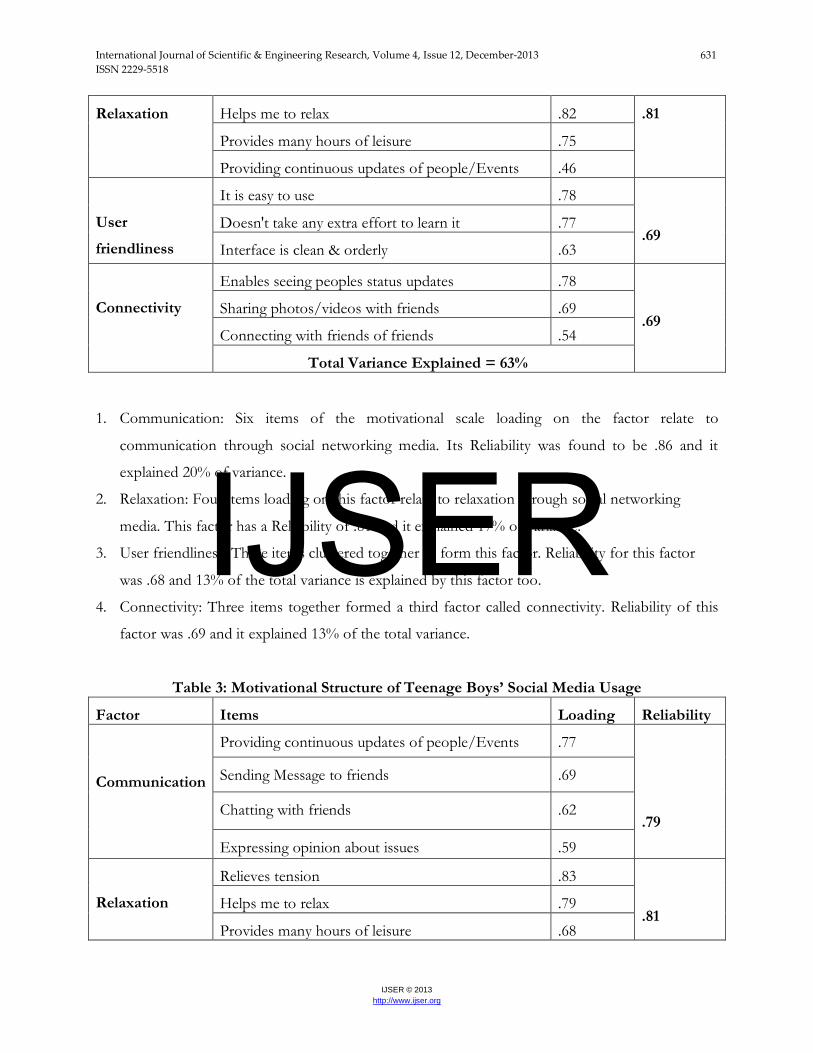
Table 2: Motivational Structure of Teenage Girls’ Social Media Usage
Factor Items Loading Reliability
Communication
Sending Message to friends .78
.86
Contacting Friends away from home .75
Getting in touch with old & lost friends .73
Chatting with friends .67
Expressing opinion about issues .54
Seeing what my friends are doing .53
Relieves tension .83
IJSER
International Journal of Scientific & Engineering Research, Volume 4, Issue 12, December-2013 631 ISSN 2229-5518
IJSER © 2013 http://www.ijser.org
Relaxation Helps me to relax .82 .81
Provides many hours of leisure .75
Providing continuous updates of people/Events .46
User
friendliness
It is easy to use .78
.69 Doesn't take any extra effort to learn it .77
Interface is clean & orderly .63
Connectivity
Enables seeing peoples status updates .78
.69 Sharing photos/videos with friends .69
Connecting with friends of friends .54
Total Variance Explained = 63% 1. Communication: Six items of the motivational scale loading on the factor relate to
communication through social networking media. Its Reliability was found to be .86 and it
explained 20% of variance.
2. Relaxation: Four items loading on this factor relate to relaxation through social networking
media. This factor has a Reliability of .81 and it explained 17% of variance.
3. User friendliness: Three items clustered together to form this factor. Reliability for this factor
was .68 and 13% of the total variance is explained by this factor too.
4. Connectivity: Three items together formed a third factor called connectivity. Reliability of this
factor was .69 and it explained 13% of the total variance.
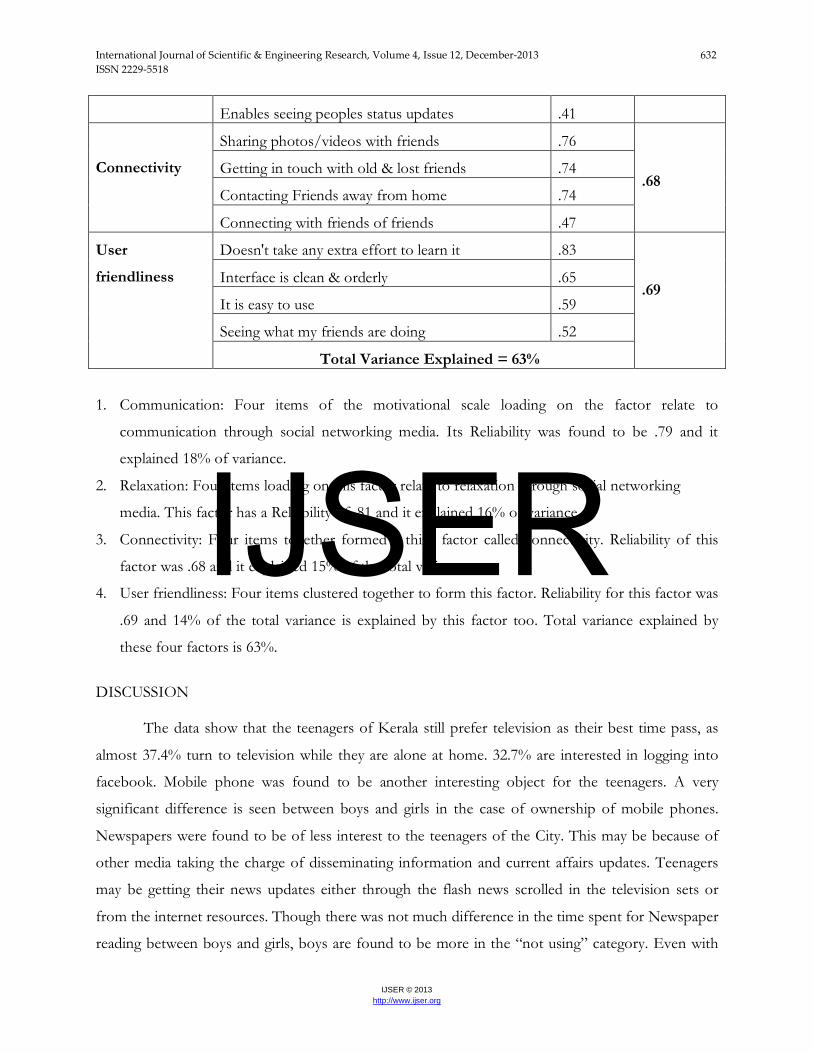
Table 3: Motivational Structure of Teenage Boys’ Social Media Usage
Factor Items Loading Reliability
Communication
Providing continuous updates of people/Events .77
.79
Sending Message to friends .69
Chatting with friends .62
Expressing opinion about issues .59
Relaxation
Relieves tension .83
.81 Helps me to relax .79
Provides many hours of leisure .68
IJSER
International Journal of Scientific & Engineering Research, Volume 4, Issue 12, December-2013 632 ISSN 2229-5518
IJSER © 2013 http://www.ijser.org
Enables seeing peoples status updates .41
Connectivity
Sharing photos/videos with friends .76
.68 Getting in touch with old & lost friends .74
Contacting Friends away from home .74
Connecting with friends of friends .47
User
friendliness
Doesn't take any extra effort to learn it .83
.69 Interface is clean & orderly .65
It is easy to use .59
Seeing what my friends are doing .52
Total Variance Explained = 63%
1. Communication: Four items of the motivational scale loading on the factor relate to
communication through social networking media. Its Reliability was found to be .79 and it
explained 18% of variance.
2. Relaxation: Four items loading on this factor relate to relaxation through social networking
media. This factor has a Reliability of .81 and it explained 16% of variance.
3. Connectivity: Four items together formed a third factor called connectivity. Reliability of this
factor was .68 and it explained 15% of the total variance.
4. User friendliness: Four items clustered together to form this factor. Reliability for this factor was
.69 and 14% of the total variance is explained by this factor too. Total variance explained by
these four factors is 63%.
DISCUSSION
The data show that the teenagers of Kerala still prefer television as their best time pass, as
almost 37.4% turn to television while they are alone at home. 32.7% are interested in logging into
facebook. Mobile phone was found to be another interesting object for the teenagers. A very
significant difference is seen between boys and girls in the case of ownership of mobile phones.
Newspapers were found to be of less interest to the teenagers of the City. This may be because of
other media taking the charge of disseminating information and current affairs updates. Teenagers
may be getting their news updates either through the flash news scrolled in the television sets or
from the internet resources. Though there was not much difference in the time spent for Newspaper
reading between boys and girls, boys are found to be more in the “not using” category. Even with
IJSER
International Journal of Scientific & Engineering Research, Volume 4, Issue 12, December-2013 633 ISSN 2229-5518
IJSER © 2013 http://www.ijser.org
the availability of popular FM radio programmes, radio is not much used by students. It points to
the findings that radio is largely used by travelers or housewives. Only students who are really
interested in any of the programmes of the FM Radio or those who like any particular RJ will tune to
their favourite FM channel. A significant difference is seen between boys and girls in their time
spent for listening to Radio.
The number of households with internet facility is also very high in the city. More than 66%
of the teenagers go online from home. Laptops were used more by girls and mobiles were used
more by boys to access internet and social networking media. But a common desktop computer is
the most readily available gadget for the teenagers of the city to access internet. But not much
difference was seen between boys and girls in their usage of desktops or other gadgets to access
internet. There is a slight edge for the girl students over their male counterparts in their time spend
for internet especially when it comes to the higher levels of time slots. But the difference was not
statistically significant. It must be noted that almost 42% of the teenagers spend more than 2 hours
on internet daily and among them only a negligible percentage of students use it for education
purpose. There is no significant difference between boys and girls in their usage of internet for
education purpose.
When it comes to the social networking media usage, a significant difference is seen between
boys and girls in their social networking site usage. Girl students are spending more time on social
networking media compared to the boys. Girls log in either very often or less often whereas boys log
in to these sites almost on a regular basis. The frequency of logging into social media sites also is
more for girls.
The three steps of factor analyses of the motivational structure of teenagers’ social
networking media usage have found same factors. But the orders of the factors and the items in the
factors were different in these three different groups. For the general group and the boys’ group the
order of factors was the same whereas the items were interchanged. The order of factors in the girls’
group was different from the other two groups. The numbers of items in the factors also were
different for all the three groups. The variance explained by these four factors was exactly 63% in all
the three groups.
CONCLUSION
The study was an attempt to analyze the time spend by teenagers for different media, where
they use it and what do they like to do online etc. Most of the students go online from home and
IJSER
International Journal of Scientific & Engineering Research, Volume 4, Issue 12, December-2013 634 ISSN 2229-5518
IJSER © 2013 http://www.ijser.org
generally they make use of desktops to access internet and social networking media. The favourite
pass time for the Kerala teenagers even today in the Social Networking Era is watching television.
This may be because of the easy access they have to television. More than half of the teenagers of
the capital city are proud owners of mobile phones. There is a higher percentage of girl students
reading Newspapers and listening to radio compared to the boys population.
Internet is used not much for education purpose both by boys and girls. More time in
internet is spent on Social Networking sites compared to the time they spend for educational needs.
Girls are found to be using internet more for education compared to boys. But boys use it more for
social networking. The most preferred activity online is social networking sites for a large number of
teenagers of Trivandrum. Another finding is that compared to a negligible percentage (8%) of
teenagers who use internet for more than two hours for academic works, 35% of the teenagers are
using more than two hours for social networking daily. The number of girls spending more time on
social networking sites is much more than that of the boys.
Again it was an attempt to understand the underlying gratification structure derived from
social networking media usage of the teenagers. The total variance explained by the four factors
(communication, connectivity, relaxation and user friendliness) is 63%. The study was conducted
only with teenagers of only one city in the state of Kerala. The study could be taken further to other
cities or even to other states and to different age groups of people to have a clear understanding of
the gratifications sought by the social networking media usage.
REFERENCE
1. boyd, d. & Ellison, N. B. (2007). Social network sites: Definition, history, and scholarship.
Journal of Computer-Mediated Communication, 13(1). Retrieved from:
http://jcmc.indiana.edu/vol13/issue1/boyd.ellison.html
2. boyd, danah, 2008. Taken out of Context. Doctoral Dissertation. Retrieved on 11 March
2013 from: http://www.danah.org/papers/TakenOutOfContext.pdf
3. Chudacoff, Howard P. 1989. How Old Are You?: Age Consciousness in American Culture.
Princeton, NJ: Princeton University Press.
4. Crosnoe, R. (2000). Friendships in childhood and adolescence: The life course and new
directions. Social Psychology Quarterly 63: 377-391.
5. Diamanduros, T. Jenkins, S.J. & Downs, E. (2007). Analysis of technology ownership and
selective use among undergraduates. College Student Journal. 41 (4) 970-976.
IJSER
International Journal of Scientific & Engineering Research, Volume 4, Issue 12, December-2013 635 ISSN 2229-5518
IJSER © 2013 http://www.ijser.org
6. Fuchs, Christian. 2011. An Alternative View of Privacy on Facebook. Information 2011, 2,
140- 165
7. Gadekar and Krishnatray, P. (2012). Motivations behind students’ facebook use. Media Asia.
8. Hill, J. P. (1983). Early adolescence: A research agenda. Journal of Early Adolescence, 3, 1-
21
9. Kaye, B. K. (1998). Uses and gratifications of the World Wide Web: From couch potato to
Web potato. New Jersey Journal of Communication, 6(1), 21-40.
10. Lenhart, A. & Madden, M. (2007). Social networking sites and teens: An overview.
Washington, DC: Pew Internet and American Life Project. Retrieved on 11 March 2013
from: http://www.pewinternet.org/PPF/r/198/report_display.asp.
11. Madden, Mary and Zickuhr, Kathryn. 2011. 65% of online adults use social networking
sites. Retrieved from: http://pewinternet.org/Reports/2011/Social-Networking-Sites.aspx
12. Nie, N. H., & Erbring, L. (2000). SIQSS Internet and society study. Retrieved April 21, 2002,
from Stanford University, Institute for the Quantitative Study of Society:
http://www.stanford.edu/group/siqss/Press_Release/InternetStudy.html
13. Peetz-Ballweg, Tricia. 2010. Examining usage and parental regulation of mobile phones and
their perceived impact on interpersonal family communication. (MA Dissertation, Gonzaga
University. UMI Number: 1492733)
14. Pew Internet & American Life Project (2010). Teens and mobile phones. Retrieved from:
http://www.pewinternet.org/Reports/2010/Teens-and-Mobile-Phones.aspx
15. Roberts, Donald F.; Foehr, Ulla G.; Rideout, Victoria J.; & Brodie, Mollyann. (1999). Kids &
media @ the new millennium. Menlo Park, CA: Kaiser Family Foundation.
16. Romm, C. T., Pliskin, N., & Clarke, R. J. (1997). Virtual communities and society: Toward an
integrative three-phase model. International Journal of Information Management, 17, 261–
270.
17. Shastri, Parth. 2011. Retrieved on 11 March 2013 from:
http://articles.timesofindia.indiatimes.com/2011-01-24/ahmedabad/28366239_1_social-
networking-online-games-users
18. Smith, L. (2007). Online networkers who click to 1000 friends. The Times. Retrieved from
http://www.thetimes.co.uk/tol/news/science/article2416229.
IJSER

International Journal of Scientific & Engineering Research, Volume 4, Issue 12, December-2013 636 ISSN 2229-5518
IJSER © 2013 http://www.ijser.org
19. Svensson, Robert. Shame as a Consequence of the Parent-Child Relationship: A Study of
Gender Differences in Juvenile Delinquency. European Journal of Criminology. 2004;1:477–
504.
20. Tay, Raymond. 2010. Impact of Social Media on Society. Retrieved on 17 Decemer 2012
from: http://ezinearticles.com/?Impact-of-Social-Media-on-Society&id=5378885
21. Tidwell, L. C., & Walther, J. B. (2002). Computer-mediated communication effects on
disclosure, impressions, and interpersonal evaluations: Getting to know one another a bit at
a time. Communication Research, 28(3), 317–348.
22. Young, Kimberly. 2012. Retrieved on 11 march 2013 from:
http://netaddictionrecovery.blogspot.com/
23. Zheng, Robert, Burrow-Sanchez, Jason and Drew, Clifford (eds.) 2008. Adolescent Online
Social Communication and Behavior: Relationship Formation on the Internet. IGI Press.
IJSER