technology evaluation report - infohouse - the most diverse
TRANSCRIPT
Technology Evaluation Reportfor the
NoVOCs Technology Evaluation
Superfund Innovative Technology Evaluation Program
TM
Prepared for:
U.S. Environmental Protection Agency Office of Research and Development
National Risk Managment Research LaboratoryCincinnati, Ohio
Prepared by:
Tetra Tech EM Inc.San Diego, California
EPA Contract No. 68-C5-0037Work Assignment No. 0-37
June 2000
Volume I: Technology Evaluation ReportAppendix A: Auxillary Tables and Graphs, Appendix B: Vendor Case Studies
Appendix C: Hydrogeological Report

i
EPA/540/R-00/502ASeptember 2000
MACTEC, Inc.
NoVOCs™ Technology
Technology Evaluation Report
National Risk Management Research LaboratoryOffice of Research and DevelopmentU.S. Environmental Protection Agency
Cincinnati, OH 45268
ii
Notice
The information in this document has been funded by the U.S. Environmental Protection Agency’s (EPA) SuperfundInnovative Technology Evaluation (SITE) Program under Contract No. 68-C5-0036, Work Assignment No. 0-37 toTetra Tech EM Inc. It has been subjected to EPA’s peer and administrative reviews and has been approved forpublication as an EPA document. Mention of trade names or commercial products does not constitute an en-dorsement or recommendation for use.
iii
Foreword
The U.S. EPA is charged by Congress with protection the National’s land, air, and water resources. Under amandate of national environmental laws, the Agency strives to formulate and implement actions leading to acompatible balance between human activities and the ability of natural systems to nurture life. To meet thismandate, EPA’s research program is providing data and technical support for solving environmental problemstoday and building a science knowledge base necessary to manage our ecological resources wisely, understandhow pollutants affect our health, and prevent or reduce environmental risks in the future.
The National Risk Management Research Laboratory (NRMRL) is the Agency’s center for investigation of tech-nological and management approaches for reducing risks from threats to human health and the environment. Thefocus of the Laboratory’s research program is on methods for the prevention and control of pollution to air, land,water and subsurface resources; protection of water quality in public water systems; remediation of contaminatedsites and groundwater; and prevention and control of indoor air pollution. The goal of this research effort is tocatalyze development and implementation of innovative, cost-effective environmental technologies; develop sci-entific and engineering information needed by EPA to support regulatory and policy decisions; and provide tech-nical support and information transfer to ensure effective implementation of environmental regulations and strat-egies.
The Superfund Innovative Technology Evaluation (SITE) Program was authorized by the Superfund Amend-ments and Reauthorization Act of 1986. The Program, administered by EPA, is intended to accelerate the devel-opment and use of innovative cleanup technologies applicable to Superfund and other hazardous waste sites.This purpose is accomplished through technology evaluations designed to provide performance and cost data onselected technologies.
An evaluation of the MACTEC Inc., NoVOCs™ technology was conducted under the SITE Program, in partner-ship with the Naval Facilities Engineering Command Southwest Division, the Navy Environmental LeadershipProgram, the EPA Technology Innovation Office, and Clean Sites, Inc. Specifically, the NoVOCs™ technologyperformance in treating groundwater contaminated with volatile organic compounds (VOC) at Naval Air StationNorth Island, Installation Restoration Site 9 was evaluated. The results of the evaluation, including information onthe performance and cost of the technology, are presented in this Technology Evaluation Report (TER). Becauseof operational difficulties encountered during the demonstration, a complete evaluation of the performance andcost characteristics of the NoVOCs™ technology’s ability to treat VOC-contaminated groundwater could not beconducted. However, valuable information was collected regarding the operation and maintenance of the NoVOCs™technology and site-specific factors that may influence the performance and cost of the system. This informationmay be useful to decision-makers when carrying out specific remedial actions using this technology or conduct-ing further technology performance evaluations. Data from the SITE evaluation may require extrapolation forestimating the operating ranges in which the technology will perform satisfactorily. Only limited conclusions canbe drawn from the field evaluation documented in this TER.
E. Timothy Oppelt, DirectorNational Risk Management Research Laboratory
iv
This report was prepared under the direction of Michelle Simon, the U.S.EPA Work Assignment Manager. TheMACTEC NoVOCs™ technology evaluation was conducted under the EPA Superfund Innovative TechnologyEvaluation (SITE) Program. This report was prepared for the EPA SITE Program by Tetra Tech EM Inc. TheNoVOCs™ technology evaluation was a cooperative effort that involved the following personnel from the EPANational Risk Management Research Laboratory (NRMRL); EPA Technology Innovation Office (TIO); Naval Fa-cilities Engineering Command Southwest Division (SWDIV); Navy Environmental Leadership Program (NELP);Clean Sites, Inc; MACTEC, Inc.: Termatrix, Inc.; California Department of Toxic Substances Control (DTSC); theRegional Water Quality Control Board, San Diego Region (RWQCB); San Diego Air Pollution Control District(APCD); Bechtel National, Inc.; Gilbert Hill Associates; and Umtanum Enterprises.
Joe Aiken MACTEC, Inc.Rafat Abbasi DTSC Project ManagerSteve Baker Umtanum EnterprisesCharles Cheng RWQCB Project ManagerJohn Clark Thermatrix, Inc.Bill Collins SWDIV Installation Restoration Program ManagerDave Demars SWDIV Remedial Project ManagerScott Donavan Bechtel National, Inc.Annette Gatchett EPA/NRMRL/SITE Program ManagerEric Jensen MACTEC, Inc., SubcontractorAnn Kern EPA/NRMRL Divisional Quality Assurance ManagerJim Kozakowski Bechtel National, Inc.Fayaz Lakhuala MACTEC, Inc., SubcontractorMike Magee NELP Program ManagerMark McGlathery MACTEC, Inc.Charles Miller Gilbert Hill AssociatesDebbie Newberry Clean Sites Project ManagerRich Rolfe San Diego APCDWarren Schultz MACTEC, Inc.Michelle Simon EPA/NRMRL Work Assignment ManagerGary Turner EPA/TIO Project ManagerMelinda Trizinsky Clean Sites Technical Program Manager
EPA would also like to thank the following reviewers:
Marc Gill Mitreter Systems for James Gonzales of the Air ForceCenter for Environmental Excellence
Robert Hinchee Parsons EngineeringRichard Johnson Oregon Graduate Research Institute
Acknowledgments

v
Contents
Volume I
Notice ............................................................................................................................................................ iiForeword ...................................................................................................................................................... iiiAcknowledgments ........................................................................................................................................ ivFigures ........................................................................................................................................................ viiiTables ........................................................................................................................................................... ixAcronyms and Abbreviations ....................................................................................................................... xiii
Executive Summary ................................................................................................................................. ES-1
1.0 Introduction .........................................................................................................................11.1 Project Background.......................................................................................................51.2 The Superfund Innovative Technology Evaluation Program ..........................................81.3 Technology Description .................................................................................................91.4 Key Contacts ..............................................................................................................14
2.0 Site Description, Objectives, and procedures ...........................................................................16
2.1 Demonstration Site Description...................................................................................162.1.1 Site History .................................................................................................... 162.1.2 Site Topography .............................................................................................172.1.3 Regional and Site Geology ............................................................................ 17
2.1.3.1 Regional Geology .............................................................................192.1.3.2 Site Geology ..................................................................................... 19
2.1.4 Site Hydrogeology ..........................................................................................202.1.5 Soil and Groundwater Contamination ............................................................. 23
2.2 Evaluation Objectives ................................................................................................. 24
2.3 Evaluation Methods and Procedures ..........................................................................252.3.1 Field Equipment Installation ...........................................................................252.3.2 Evaluation Design ..........................................................................................26
2.3.2.1 Sampling and Analysis program ....................................................... 262.3.2.2 Sampling and Measurement Locations .............................................31
2.3.3 Sampling Methods .........................................................................................322.3.3.1 Groundwater Samples ...................................................................... 322.3.3.2 Air Sampling ..................................................................................... 322.3.3.3 Air Flow Measurements ....................................................................33
2.3.4 Analytical Methods .........................................................................................33
2.3.5 Quality Assurance and Quality Control program ............................................332.3.5.1 Field Quality Control Checks ............................................................352.3.5.2 Laboratory Quality Control Checks ...................................................35
2.4 Modifications to the Test Evaluation Plan ....................................................................36

vi
3.0 Evaluation Results .........................................................................................................383.1 Operating Conditions ..................................................................................................38
3.1.1 NoVOCs™ and Thermatrix System Configurations ........................................ 383.1.1.1 NoVOCs™ System Configuration .....................................................383.1.1.2 Thermatrix Flameless Thermal Oxidation System Configuration ......45
3.1.2 NoVOCs™ Demonstration Operation Data Narrative ..................................... 483.1.2.1 System Startup nd Shakedown 2/26-3/26/98 ....................................523.1.2.2 Early System Operation 4/20 - 6/19/98 .............................................593.1.2.3 Aquifer Testing and System Modification 7-9/98 ................................633.1.2.4 NoVOCs™ Well Operation after Reconfiguration 9/24-10/31/98 ....... 693.1.2.5 Final Configuration and Operation 12/4/98 - 1/4/99 ...........................69
3.1.3 System Operation and Maintenance ..............................................................833.1.4 Colloidal Borescope .......................................................................................903.1.5 Diffusional Multi-layer Sampler .......................................................................91
3.2 Results .........................................................................................................923.2.1 Primary Objectives .........................................................................................93
3.2.1.1 Primary Objective P1 ........................................................................933.2.1.2 Primary Objective P2 ........................................................................973.2.1.3 Primary Objective P3 ........................................................................98
3.2.2 Secondary Objectives .................................................................................. 1053.2.2.1 Secondary Objective S1 ................................................................. 1073.2.2.2 Secondary Objective S2 ................................................................. 1073.2.2.3 Secondary Objective S3 ................................................................. 1123.2.2.4 Secondary Objective S4 ................................................................. 1143.2.2.5 Secondary Objective S5 ................................................................. 1143.2.2.6 Secondary Objective S6 ................................................................. 1183.2.2.7 Secondary Objective S7 ................................................................. 119
3.3 Data Quality ....................................................................................................... 120
4.0 Economic Analysis ....................................................................................................... 124
4.1 Basis of Economic Anallysis ..................................................................................... 1244.1.1 Operating, Maintenance, and Monitoring Factors ......................................... 1254.1.2 Site Conditions and System Design Factors ................................................ 126
4.2 Cost by Category ...................................................................................................... 1284.2.1 Site Preparation Costs ................................................................................. 1284.2.2 Permitting and Regulatory Requirements Costs .......................................... 1304.2.3 Equipment Costs.......................................................................................... 1314.2.4 Startup Costs ............................................................................................... 1324.2.5 Labor Costs ................................................................................................. 1324.2.6 Consumables and Supplies Costs ............................................................... 1324.2.7 Utilities Costs ............................................................................................... 1334.2.8 Effluent Treatment and Disposal Costs ........................................................ 1334.2.9 Residuals and Waste Shipping and Handling Costs ..................................... 1344.2.10 Analytical Services Costs............................................................................. 1354.2.11 Maintenance and Modification Costs ........................................................... 1364.2.12 Demobilization Costs ................................................................................... 136
Contents, Cont.d

vii
Contents, Cont.
4.3 Cost Summary ........................................................................................................ 137
5.0 Conclusions ........................................................................................................ 138
6.0 Technology Status and Case Studies ........................................................................................... 146
7.0 References ........................................................................................................ 149
Appendix A. Auxiliary Tables and GraphsAppendix B. Vendor Case StudiesAppendix C. Hydrogeologic Investigation Results
Volume II
Appendix D, Part 1: Laboratory Data - First Baseline Sampling Event
Volume III
Appendix D, Part 2: Laboratory Data - First Baseline Sampling Event (continued)
Volume IV
Appendix D, Part 3: Laboratory Data - First Through Fourth Weekly Sampling Events
Volume V
Appendix D, Part 4: Laboratory Data - First Monthly and Second Baseline Sampling Events
Volume VI
Appendix E: Field DataAppendix F: Quality Assurance and Quality Control Data Summary
viii
1. Vicinity map ....................................................................................................................................... 22. Naval Air Station North Island and Site 9 location map ..................................................................... 33. SITE 9 chemical waste disposal areas .............................................................................................. 44. NoVOCs™ system .......................................................................................................................... 105. Well locations .................................................................................................................................. 126. Generalized cross-section ............................................................................................................... 137. SITE 9 topographic elevations ......................................................................................................... 188. Geologic cross-section location....................................................................................................... 219. Geologic cross-section A-A’ ............................................................................................................ 2210a. NoVOCs™ as-built diagram ............................................................................................................ 3910b. Wellhead as-built diagram ............................................................................................................... 4110c. Reconfigured wellhead as-built diagram .......................................................................................... 4211a. Wellhead area photograph .............................................................................................................. 4611b. Wellhead photograph ...................................................................................................................... 4611c. Service equipment photograph ....................................................................................................... 4611d. Control trailer photograph ................................................................................................................ 4612. Thermatrix flameless oxidation system ........................................................................................... 4713a. NoVOCs™ System blower run time - sheet 1 ................................................................................. 4913b. NoVOCs™ System blower run time - sheet 2 ................................................................................. 5013c. NoVOCs™ System blower run time - sheet 3 ................................................................................. 5114. NoVOCs™ System pressure and flow measurement - 2/26/98 ....................................................... 5315. NoVOCs™ System well pumping rate versus air to water ratio - 3/16/98 ........................................ 5516. Groundwater air sparging pH results ............................................................................................... 5617. Titration test results ......................................................................................................................... 5718. NoVOCs™ System pH cycles - 3/13 and 3/17/98 .......................................................................... 58
19a. NoVOCs™ well internals photograph .............................................................................................. 6019b. NoVOCs™ well air unit photograph ................................................................................................. 6019c. NoVOCs™ well educator pipe photograph ...................................................................................... 6019d. Biofouling sample photograph ......................................................................................................... 6020. Water level in the NoVOCs™ well - 5/13/98 .................................................................................... 6121. NoVOCs™ well recharge test results .............................................................................................. 6522. Orifice plate flow sensor calibration curve ....................................................................................... 6723. Iron precipitation test results ........................................................................................................... 70
24. NoVOCs™ well recharge test - 12/2/98........................................................................................... 7225a. NoVOCs™ well recharge piezometer water level - 12/4-5/98 ......................................................... 7425b. NoVOCs™ well recharge piezometer water level - 12/6-7/98 .......................................................... 7525c. NoVOCs™ well recharge piezometer water level - 12/6-7/98 .......................................................... 7625d. NoVOCs™ well recharge piezometer water level - 12/7-8/98 .......................................................... 7726. NoVOCs™ well pumping rate - 12/31/98 - 1/4/99 ............................................................................ 8027. Simplified iron stability diagram ....................................................................................................... 8628. Total volatile organic compound mass removed best fit trend line ................................................. 10429. Total volatile organic compound mass removed during system operation ..................................... 106
Figures

ix
Tables
1. Well screen intervals ....................................................................................................................... 272. Sampling and analysis summary .................................................................................................... 283. Analytical methods.......................................................................................................................... 344. NoVOCs™ system operating parameters - 12/10/98 ...................................................................... 785. Results of field analyses - 12/30/98 ................................................................................................ 836. Treatment system removal summary .............................................................................................. 947. Air sample results - NoVOCs™ influent sampling port A1 ............................................................ 1008. Air sample results - NoVOCs™ effluent sampling port A2 ............................................................ 1019. Summary of total volatile organic compound mass removed ........................................................ 10310. 1,1-dichloroethene concentration summary .................................................................................. 10811. CIS - 1,2-dichloroethene concentration summary ......................................................................... 10912. Trichloroethene concentration summary ....................................................................................... 11013. Summary of operating parameters ............................................................................................... 11314. Air sample results - Thermatrix influent sampling port A3 ............................................................. 11515. Air sample results - Thermatrix effluent sampling port A4 ............................................................. 11616. Data quality outliers ...................................................................................................................... 12117. Costs associated with the NoVOCs™ system .............................................................................. 12918. Costs associated with the Thermatrix system ............................................................................... 135

x
APCD Air Pollution Control DistrictAPHA American Public Health AssociationARAR Applicable or Relevant and Appropriate RequirementsASTM American Society for Testing and MaterialsATTIC Alternative Treatment Technologies Information CenterBechtel Bechtel National, Inc.bgs Below ground surfaceBTEX Benzene, toluene, ethylbenzene, and xylenesCERI Center for Environmental Research Informationcm/sec Centimeters per secondCPT Cone penetrometer testDCA DichloroethaneDCE DichloroetheneDNAPL Dense nonaqueous-phase liquidEG&GE EG&G EnvironmentalEh Reduction/oxidation potentialEPA U. S. Environmental Protection AgencyEF Degree Fahrenheitft/day Feet per dayft/ft Feet per footft 2 /day Square feet per daygpm Gallons per minutegpm/ft Gallons per minute per footg/cm 3 Grams per cubic centimeterHCl Hydrochloric acidHP HorsepowerIR Installation RestorationkWh Kilowatt hourkW/HP Kilowatt per horsepowerMACTEC MACTEC, Inc.MCAWW Method for the Chemical Analysis of Water and WastesMCL Maximum contaminant levelsmg/kg Milligrams per kilogrammg/L Milligrams per literMLLW Mean lower low waterMS Matrix spikeMSD Matrix spike duplicatemv MillivoltsNA Not analyzedNC Not calculatedNAS Naval Air StationNELP Navy Environmental Leadership ProgramNOAA National Oceanic and Atmospheric AdministrationNTU Nephelometric turbidity units
Acronyms and Abbreviations

xi
NRMRL National Risk Management Research LaboratoryNTIS National Technical Information ServiceORD Office of Research and DevelopmentOSWER Office of Solid Waste and Emergency ResponsePAH Polynuclear aromatic hydrocarbonPCE Tetrachloroetheneppb v/v Parts per billion on a volume per volume basisPPE Personal protective equipmentppm Parts per millionpsi Pounds per square inchPVC Polyvinyl chlorideQA/QC Quality assurance/quality controlQAPP Quality assurance project planRCRA Resource Conservation and Recovery ActRPD Relative percent differenceRTU Remote telemetry unitRWQCB Regional Water Quality Control BoardSARA Superfund Amendments and Reauthorization ActSRB Sulfur reducing bacteriascfm Standard cubic feet per minuteSITE Superfund Innovative Technology EvaluationSVOC Semivolatile organic compoundSWDIV Naval Facilities Engineering Command Southwest DivisionSW-846 U.S. EPA Test Methods for Evaluating Solid Wastes1,1,1-TCA 1,1,1-TrichloroethaneTCE TrichloroetheneTDS Total dissolved solidsTEP Test evaluation planTER Technology evaluation reportTetra Tech Tetra Tech EM Inc.Thermatrix Thermatrix, Inc.TIO Technology Innovation OfficeVOC Volatile organic compoundUCL Upper confidence limitVISITT Vendor Information System for Innovative Treatment TechnologiesWC Water columnµg/L Micrograms per literµmhos/cm Micromhos per centimeter
Acronyms and Abbreviations Cont.

ES-1
EXECUTIVE SUMMARY
This Technology Evaluation Report (TER) summarizes the findings of an evaluation of the MACTEC,
Inc. (MACTEC), NoVOCs™ in-well volatile organic compound (VOC) stripping system by the U.S.
Environmental Protection Agency (EPA), National Risk Management Research Laboratory, Superfund
Innovative Technology Evaluation (SITE) Program. The report also includes performance data on the
Thermatrix, Inc. (Thermatrix), flameless oxidation system, which was used to treat offgas from the
NoVOCs™ system. The NoVOCs™ system was demonstrated at Installation Restoration Site 9 at the
Naval Air Station (NAS) North Island in San Diego, California, and was evaluated over an 11-month
period from February 1998 to January 1999. The evaluation focused on the ability of the NoVOCs™
system to treat groundwater contaminated with VOCs, specifically, tetrachloroethene, trichloroethene
(TCE), dichloroethene (DCE), vinyl chloride, benzene, toluene, ethylbenzene, and xylene.
The demonstration was conducted in partnership with Naval Facilities Engineering Command Southwest
Division (SWDIV), Navy Environmental Leadership Program, the EPA Technology Innovation Office,
and Clean Sites, Inc. Both the NoVOCs™ and Thermatrix systems were operated and monitored by
SWDIV’s support contractor, Bechtel National, Inc. (Bechtel). This report summarizes data collected by
all involved parties and includes a comprehensive description of the demonstration at NAS North Island
and its results.
The NoVOCsTM system did not function without operational difficulties in the highly saline aquifer
containing groundwater with total dissolved solids ranging from 18,000 to 41,000 mg/L, which
represents an extreme geochemical environment. Because of operational difficulties encountered during
the demonstration, a complete evaluation of the performance and cost characteristics of the NoVOCs™
technology could not be conducted. However, valuable information was collected regarding the
operation and maintenance of the NoVOCs™ technology and site-specific factors that may influence the
performance and cost of the system. This information may be useful to other decision-makers when
carrying out specific remedial actions using this technology or conducting further technology
performance evaluations. Data from the SITE evaluation may require extrapolation for estimating the
operating ranges in which the technology will perform satisfactorily. Since the demonstration was
stopped due to operational difficulties, only limited conclusions can be drawn from the field evaluation
documented in this TER.
ES-2
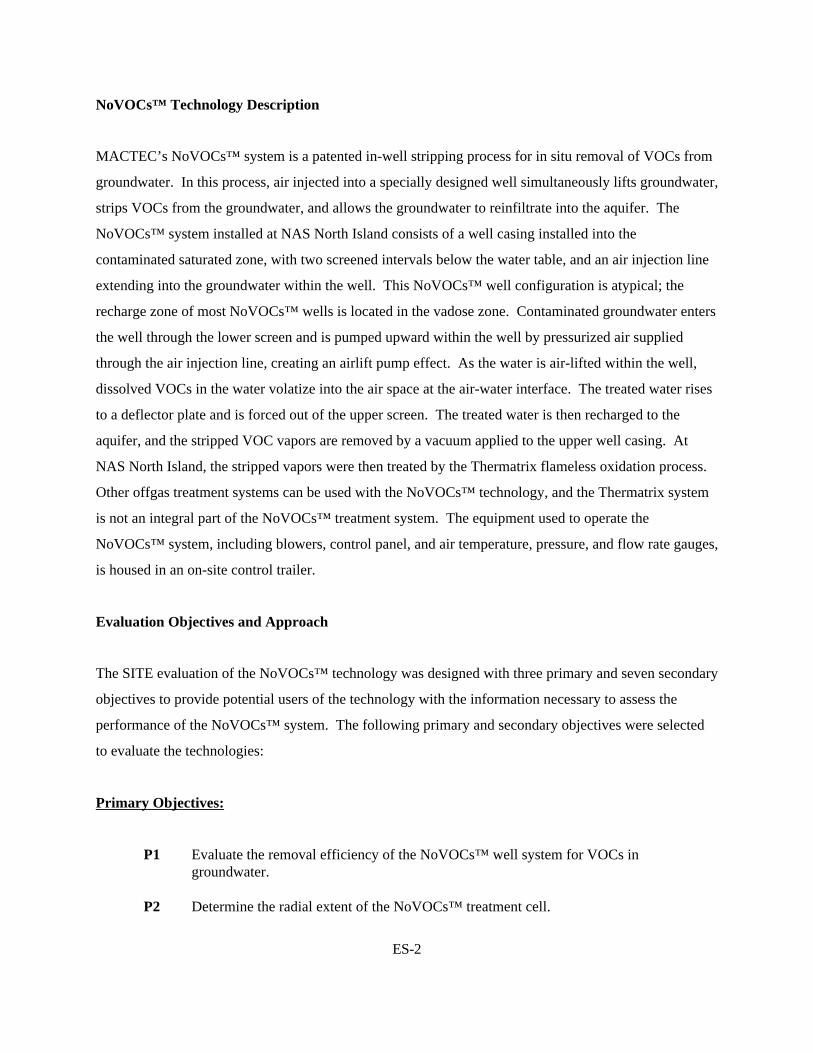
NoVOCs™ Technology Description
MACTEC’s NoVOCs™ system is a patented in-well stripping process for in situ removal of VOCs from
groundwater. In this process, air injected into a specially designed well simultaneously lifts groundwater,
strips VOCs from the groundwater, and allows the groundwater to reinfiltrate into the aquifer. The
NoVOCs™ system installed at NAS North Island consists of a well casing installed into the
contaminated saturated zone, with two screened intervals below the water table, and an air injection line
extending into the groundwater within the well. This NoVOCs™ well configuration is atypical; the
recharge zone of most NoVOCs™ wells is located in the vadose zone. Contaminated groundwater enters
the well through the lower screen and is pumped upward within the well by pressurized air supplied
through the air injection line, creating an airlift pump effect. As the water is air-lifted within the well,
dissolved VOCs in the water volatize into the air space at the air-water interface. The treated water rises
to a deflector plate and is forced out of the upper screen. The treated water is then recharged to the
aquifer, and the stripped VOC vapors are removed by a vacuum applied to the upper well casing. At
NAS North Island, the stripped vapors were then treated by the Thermatrix flameless oxidation process.
Other offgas treatment systems can be used with the NoVOCs™ technology, and the Thermatrix system
is not an integral part of the NoVOCs™ treatment system. The equipment used to operate the
NoVOCs™ system, including blowers, control panel, and air temperature, pressure, and flow rate gauges,
is housed in an on-site control trailer.
Evaluation Objectives and Approach
The SITE evaluation of the NoVOCs™ technology was designed with three primary and seven secondary
objectives to provide potential users of the technology with the information necessary to assess the
performance of the NoVOCs™ system. The following primary and secondary objectives were selected
to evaluate the technologies:
Primary Objectives:
P1 Evaluate the removal efficiency of the NoVOCs™ well system for VOCs ingroundwater.
P2 Determine the radial extent of the NoVOCs™ treatment cell.

ES-3
P3 Quantify the average monthly total VOC mass removed from groundwater treated by thesystem for 6 months.
Secondary Objectives:
S1 Quantify the changes in VOC concentrations in the groundwater within the NoVOCs™treatment cell.
S2 Document changes in selected geochemical parameters that may be affected by theNoVOCs™ system.
S3 Document NoVOCs™ system operating parameters.
S4 Document pre- and post-treatment VOC concentrations and system operating parametersin the Thermatrix flameless oxidation offgas treatment system.
S5 Document the hydrogeologic characteristics at the treatment site.
S6 Document the changes in pressure head in the aquifer caused by the NoVOCs™ system.
S7 Estimate the capital and operating costs of constructing the NoVOCs™ system andThermatrix flameless oxidation process and maintaining them for 6 months.
Because of operational difficulties with the NoVOCs™ system during the evaluation, not all objectives
could be fully evaluated. Specifically, primary objectives P2 and P3 could not be fully evaluated. In
these cases, results and conclusions are presented based on the available data.
The primary and secondary objectives were evaluated by collecting weekly and monthly samples from
the groundwater and system offgas, as well as conducting a series of aquifer hydraulic tests. Samples
were collected and analyzed using the methods and procedures presented in the Technology Evaluation
Plan/Quality Assurance Project Plan for the MACTEC NoVOCs™ Technology Evaluation at NAS North
Island (Tetra Tech 1998).
During the evaluation, groundwater samples were collected from the NoVOCs™ system influent and
effluent using two piezometers installed adjacent to the NoVOCs™ well and from 10 groundwater
monitoring wells installed upgradient, crossgradient, and downgradient of the NoVOCs™ well. The
groundwater monitoring wells were installed at different depths and radii from the NoVOCs™ well to
evaluate changes in contaminant concentrations within the aquifer associated with operation of the
ES-4
NoVOCs™ system. Air samples were also collected from four sampling locations to evaluate the
concentration of contaminants in the influent and effluent of both the NoVOCs™ and Thermatrix
systems.
Operation and Maintenance
Operation and maintenance of the NoVOCs™ system was conducted primarily by Bechtel with technical
guidance from MACTEC. The NoVOCs™ system was designed to operate continuously, 24 hours a day,
7 days a week. However, during the demonstration, the system experienced significant operational
difficulties and was limited to four main operating periods: System Startup and Shakedown (February 26
through March 26, 1998), Early System Operation (April 20 through June 19, 1998), Reconfiguration
Operation (September 24 through October 30, 1998), and Final Configuration Operation (December 4,
1998 through January 4, 1999).
Beginning in early May 1998, the NoVOCs™ system began experiencing operating problems associated
with high water levels in the NoVOCs™ well and lower-than-designed pumping rates. Initially, it was
thought that the flow sensor was not accurately measuring the pumping rate. However, as system
operation progressed, the continued low pumping rate and increased frequency of the high water level in
the NoVOCs™ well suggested that a more significant problem was occurring. By June 1998, the
pumping rate had been reduced from the design rate of 25 gallons per minute (gpm) to about 5 gpm.
Based on discussions between the Navy and MACTEC, the system was shut down on June 19, 1998, to
evaluate the cause of the poor performance. Suspected causes for the poor performance included (1)
biofouling or scaling of the screen intervals and formation near the NoVOCs™ well, (2) possible
differences in hydraulic characteristic between the upper and lower portions of the aquifer, and (3)
design problems with the NoVOCs™ well, in particular, the length of the recharge screen.
To evaluate the recharge capacity of the NoVOCs™ system and provide information on the hydraulic
characteristics of the aquifer in the vicinity of the NoVOCs™ system, a down-well video tape survey and
a series of aquifer hydraulic tests were conducted. Based on the aquifer testing, it was concluded that the
length of the screened intervals of the NoVOCs™ well should be able to sustain the design pumping rate
of 25 gpm. However, during the video tape survey, fouling of the NoVOCs™ well screens by
microbiological growth and iron precipitation was observed, which appeared to have impaired the
ES-5
performance of the NoVOCs™ system by obstructing the well screen and filter pack. Attempts to
control fouling by addition of various acids, dispersants, and biocides were unsuccessful, and failure to
control the fouling eventually caused termination of the demonstration in January 1999.
Based on the results of the SITE evaluation at NAS North Island and other recirculating well evaluations,
well fouling is a recognized problem that requires an appropriate design, as well as monitoring,
operation, and maintenance for successful management. Groundwater wells, including in-well stripping
systems and recirculating wells, such as the NoVOCs™ system, are subject to fouling from a variety of
common causes. The three most common causes of fouling in recirculating wells and groundwater wells
in general are (1) accumulation of silt in the well structure, (2) biofouling by colonizing microorganisms,
and (3) formation of chemical precipitates or insoluble mineral species. These issues can sometimes be
controlled through appropriate design and construction of filter pack and well screens, groundwater pH
control to manage formation of chemical precipitates and insoluble mineral species, and injection of a
suitable biocide to prevent biofouling. However, any design that does not provide geochemical controls
based on site-specific hydrogeologic and geochemical conditions is likely to experience significant
operation and maintenance problems due to fouling.
Evaluation Conclusions
Because of operational difficulties with the NoVOCs™ system throughout the demonstration, only
limited data were collected to evaluate the technology. Based on the results of the limited data collected
during the SITE evaluation, the following conclusions may be drawn about the applicability of the
NoVOCs™ technology:
P1 Comparison of VOC results for groundwater samples taken adjacent to the influent and effluentof the NoVOCs™ system indicated that 1,1-DCE, cis-1,2-DCE, and TCE concentrations werereduced by greater than 98, 95, and 93 percent, respectively, in all the events, except the firstsampling event, which was conducted during system shakedown activities. Excluding the firstsampling event, the mean concentration of 1,1-DCE, cis-1,2-DCE, and TCE in the waterdischarged from the NoVOCs™ system was about 27, 1,400, and 32 micrograms per liter (Fg/L),respectively. The 95 percent upper confidence limits of the means for 1,1-DCE, cis-1,2-DCE,and TCE in the treated groundwater were calculated to be about 37, 1,760, and 46 Fg/L,respectively. The maximum contaminant levels (MCL) for these compounds in groundwater are6 Fg/L for 1,1-DCE, 6 Fg/L for cis-1,2-DCE, and 5 Fg/L for TCE. MACTEC claims that theNoVOCs™ system can reduce effluent VOC concentrations to below MCLs if the contaminantsource has been removed. Since dense nonaqueous-phase liquids may be present in the aquifer at

ES-6
the site and may act as a continuing source of groundwater contamination, MACTEC did notmake any claims for reduction of VOC concentrations in groundwater at Site 9.
P2 Because of the sporadic operation of the NoVOCs™ system, a direct evaluation of the radialextent of the NoVOCs™ treatment cell was not conducted. In lieu of direct evaluation method,aquifer hydraulic tests conducted to assess the hydrogeologic characteristics of the site were usedto indirectly evaluate the potential radial extent of the NoVOCs™ treatment cell. Although theaquifer pump tests cannot be directly applied to evaluate the radial extent of the NoVOCs™treatment cell or even that groundwater recirculation was established, the test data does provideinformation on the radius of influence of the well under pumping (2-dimensional) and dipole (3-dimensional) flow conditions. The resulting changes in pressure head provide an indication ofthe potential for flow in the surrounding aquifer and are used to provide an estimate of the radialextent of influence created by the NoVOCs™ well. However, the pressure head changes do notaccurately represent flow patterns or contaminant transport. Consequently no firm conclusionscan be drawn about the radial extent of the NoVOCs™ treatment cell.
During the constant discharge rate (discharge = 20 gpm) pumping test, measurable drawdownswere observed at about 100 feet from the NoVOCs™ well in all directions and different depths. This information indicates that the radius of influence by extraction, specifically at 20 gpm,could be as large as 100 feet. The dipole flow test data shows that measurable pressureresponses occur at crossgradient locations 30 feet from the NoVOCs™ well and may beobserved at farther distances. However, no drawdowns or water level rises could be positivelymeasured in monitoring wells beyond the 30-foot distance.
P3 Because of operational problems with the NoVOCs™ system, the mass of VOCs removed by theNoVOCs™ system was evaluated during a limited period of operation from April 28 to June 8,1998. During this period, the average total VOC mass removed by the NoVOCs™ systemranged from 0.01 to 0.14 pounds per hour (lb/hr) and averaged 0.10 lb/hr during the fivesampling events. Accounting for the sporadic operation of the NoVOCs™ system, the mass oftotal VOCs removed during the entire operation period from April 20 through June 19, 1998, wasestimated to be about 90 pounds.
S1 VOC concentrations appear to be stratified in the aquifer. In general, the highest concentrationsof the three primary VOCs, 1,1-DCE, cis-1,2-DCE, and TCE, were detected in the deepmonitoring wells. This trend was especially pronounced for cis-1,2-DCE, which was detected atconcentrations between 440 and 96,000 Fg/L in the deep wells, but only between 120 and 1,200Fg/L in the shallow wells. The intermediate wells generally had the lowest concentration of allthree primary VOCs. Because of the limited amount of data collected and operational problemswith the NoVOCs™ system throughout the demonstration, trends in the VOC concentration dataassociated with operation of the NoVOCs™ system were not apparent.
S2 Groundwater samples were collected and analyzed for dissolved metals, alkalinity, total organiccarbon, and dissolved organic carbon to evaluate changes in the selected geochemical parameterscaused by the NoVOCs™ system. Despite the possible iron fouling problems experienced in theNoVOCs™ well, the groundwater analytical results for dissolved metals exhibited no clear

ES-7
trends in the data that would suggest that precipitation of dissolved metals was occurring in theaquifer. Based on a review of the data, alkalinity, total organic carbon, and dissolved organiccarbon results remained relatively unchanged during the demonstration. Total dissolved solidconcentrations showed an increasing trend with depth; however, concentrations did not appear tobe affected by operation of the NoVOCs™ system. Conductivity and salinity values measured inthe field also increased with depth and appeared to correlate with the analytical results for totaldissolved solids. No clear trends were apparent from the field measurements of temperature, pH,and dissolved oxygen, and insufficient data were collected to adequately evaluate trendsassociated with oxidation/reduction potential.
S3 During the four operational periods, Bechtel measured the NoVOCs™ system operatingparameters, including air temperature, pressure, flow rate, water pumping rate, and pH in thegroundwater effluent. The average air temperature at the well intake during the four operationalperiods ranged from 132 to 152 oF; the pressure ranged from 2.2 to 3.3 pounds per square inch;and air flow ranged from 52.4 to 69.0 standard cubic feet per minute. The water pumping ratewithin the NoVOCs™ well varied throughout the demonstration; however, based on dataprovided by SWDIV, the pumping rate ranged from 8 to 34 gpm. Additionally, the average pHin the groundwater effluent during the four operational periods ranged from 3.60 to 7.28.
S4 Based on a comparison of influent and effluent air samples collected from the Thermatrixsystem, total VOC concentrations in the 1-hour composite samples collected from the influentranged from 22,120 to 59,200 parts per billion (ppb) on a volume per volume (v/v) basis andaveraged 45,200 ppb v/v during the five sampling events. Total VOC concentrations in the 1-hour composite samples collected from the effluent air sample port ranged from 2.8 to 7.2 ppbv/v and averaged 4.8 ppb v/v during the five sampling events. Total VOC concentrationsmeasured in the Thermatrix influent air sample port were reduced by greater than 99.9 percent inall five sampling events.
S5 Based on the results of the hydrogeologic investigation conducted at the treatment site, thefollowing hydrogeologic characteristics were estimated:
- Groundwater generally flows to the west or northwest in both of the upper and lower aquiferzones. The horizontal hydraulic gradient in both aquifer zones is relatively flat, ranging from0.005 to 0.01. Groundwater direction and velocity measurements collected from themonitoring well near the shoreline of the San Diego Bay, using the Colloidal Borescope,indicate that groundwater flows in a west-southwest direction at an average of velocity of 5feet per day (ft/day).
- The average hydraulic conductivity is 29 ft/day or 0.01 centimeters per second. The averageaquifer storativity and specific yield are 0.004 and 0.07, respectively. The average ratio ofhorizontal to vertical hydraulic conductivity is 5.7.
- The calculated average specific capacities are 1.48 gallons per minute per foot (gpm/ft) forthe upper screened interval during extraction, 1.50 gpm/ft for the upper screened intervalduring injection, and 3.22 gpm/ft for the lower screened interval during extraction. Thecalculated average well efficiencies are 82 percent for the upper screened interval during

ES-8
extraction, 97 percent for the upper screened interval during injection, and 91 percent for thelower screened interval during extraction.
- The radius of pressure influence (+/- 0.01 feet) during the constant discharge pumping test(20 gpm) is at least 100 feet, based on the drawdown measured at the observation wells.
- The maximum flow of clean tap water that can be injected through the upper screen of theNoVOCs™ well is 25 gpm.
- The aquifer hydraulic conditions do not limit application of the NoVOCs™ technology. TheNoVOCs™ well as designed should be able to extract and inject a flow rate of 20 gpm, basedon the estimated aquifer hydraulic characteristics.
S6 Pressure head changes in the aquifer caused by the NoVOCs™ system were measured in thegroundwater monitoring wells in the vicinity of the NoVOCs™ system during a tidal studyconducted at the treatment site before and during operation of the NoVOCs™ system. Groundwater level changes caused by startup and shutdown of the NoVOCs™ system wereevident in the water level data for well cluster MW-45, MW-46, and MW-47, located about30 feet from the NoVOCs™ well. The water level data for observation wells MW-45 (the upperscreened well in this cluster) and MW-46 (the intermediate screened well) showed water levelincreases after system startup. The groundwater elevation increase in well MW-45 wasapproximately 0.15 feet. Observation well MW-46, the intermediate-depth well, showed a waterlevel increase of approximately 0.05 feet. Observation well MW-47, the deep screened well,showed a water level decrease of approximately 0.025 feet. This pattern of water level increasesand decreases associated with the operation of the NoVOCs™ system was expected, based on monitoring well screen locations relative to NoVOCs™ well screen locations. The deepscreened well experienced a drop in water level as water was drawn toward the NoVOCs™ wellintake, and the upper screened wells experienced increases in water level as water was liftedinside of the NoVOCs™ well and discharged into the upper aquifer zone. In well pair MW-48and MW-49 (located about 62 feet from the NoVOCs™ well) and in wells MW-50 and MW-51(located about 91 and 105 feet, respectively, from the NoVOCs™ well), water level changesassociated with NoVOCs™ system operation were not apparent.
S7 An economic analysis of using the NoVOCs™ and Thermatrix technologies to treat VOC-contaminated groundwater and offgas was conducted. Based on the SITE evaluation and costinformation provided by the Navy and MACTEC, one-time capital costs for a NoVOCs™ systemwere estimated to be $190,000; annual operation and maintenance costs were estimated to be$160,000 per year for the first year and $150,000 per year thereafter. Because of the timerequired to remediate an aquifer is site-specific, costs have been estimated for operation of aNoVOCs™ system over a range of time for comparison purposes. Based on these estimates, thetotal cost for operating a single NoVOCs™ system was calculated to be $350,000 for 1 year;$670,000 for 3 years; $1,000,000 for 5 years; and $2,000,000 for 10 years. These estimatesinclude an annual inflation rate of 4 percent.
Costs for implementing a NoVOCs™ system at another site may vary substantially from thisestimate for the SITE evaluation. A number of factors affect the cost of treatment using the

ES-9
NoVOCs™ system, including soil type, contaminant type and concentration, depth togroundwater, site geology and hydrogeology, groundwater geochemistry, site size andaccessibility, required support facilities and available utilities, type of offgas treatment unit used,and treatment goals. It is important to (1) characterize the site thoroughly before implementingthis technology to ensure that treatment is focused on contaminated areas and (2) determine thecirculation cell radius for the well and the resulting number of wells needed to remediate aparticular site.
The cost of treatment per unit volume of water was not calculated because of the number ofassumptions required to make such a calculation and the limited duration of system operation. Because of the site-specific nature of treatment costs, costs per unit volume of water will varygreatly from project to project.
Based on cost information provided by SWDIV, the total cost of the Thermatrix system duringthe NoVOCs™ demonstration was about $989,000. This cost includes system acquisition,installation, operation, maintenance, monitoring, and source testing.

1
1.0 INTRODUCTION
This Technology Evaluation Report (TER) documents and summarizes the findings of an evaluation of
the MACTEC, Inc. (MACTEC), NoVOCs™ in-well volatile organic compound (VOC) stripping system
conducted by the U.S. Environmental Protection Agency (EPA), National Risk Management Research
Laboratory (NRMRL) under the Superfund Innovative Technology Evaluation (SITE) Program. The
report also includes performance data on the Thermatrix, Inc. (Thermatrix), flameless oxidation system,
which was used to treat offgas from the NoVOCs™ system. The demonstration of the NoVOCs™
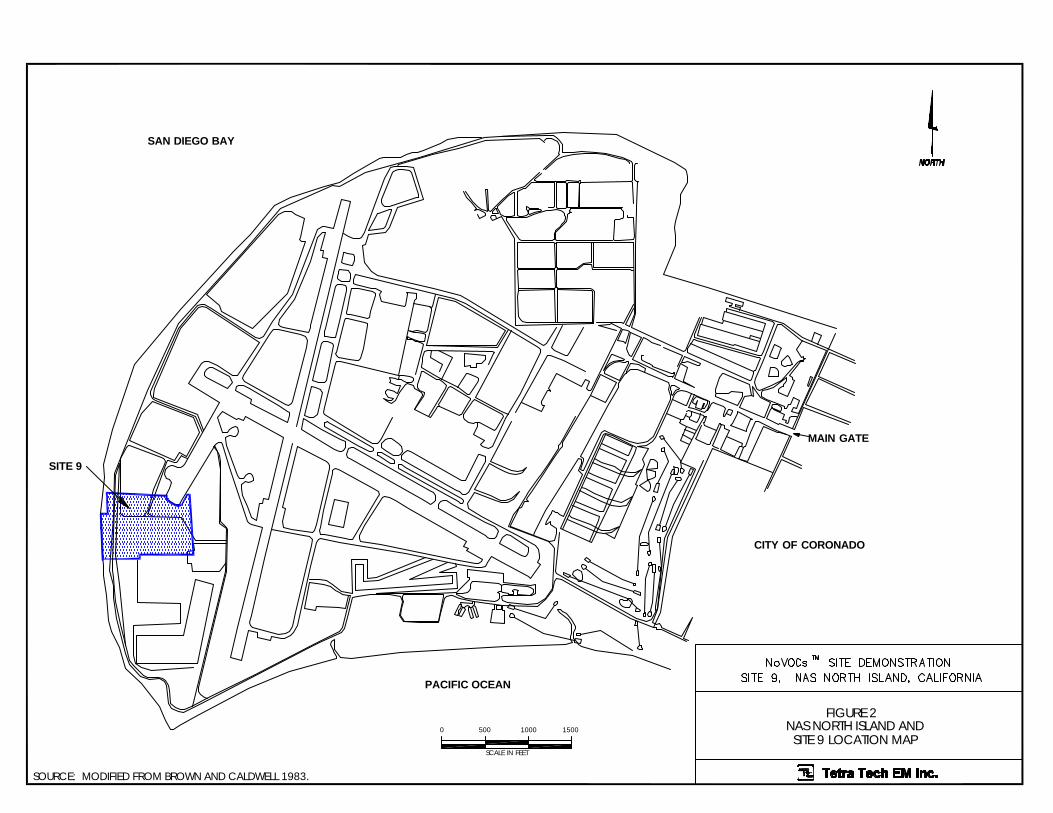
system was conducted at Installation Restoration (IR) Site 9 at the Naval Air Station (NAS) North Island
in San Diego, California (see Figures 1, 2, and 3) to evaluate the technology's ability to treat VOC-
contaminated groundwater. In addition to MACTEC and Thermatrix, the NoVOCs™ demonstration was
conducted in partnership with the EPA Technology Innovation Office (TIO), Naval Facilities
Engineering Command Southwest Division (SWDIV), Navy Environmental Leadership Program, and the
innovative technology public-private partnership program facilitated by Clean Sites, Inc. (Clean Sites).
Demonstration data collected by SWDIV and the vendor are included in this report.
Installation and operation of the NoVOCs™ system during the demonstration was conducted by
SWDIV's support contractor, Bechtel National, Inc. (Bechtel). Tetra Tech EM Inc. (Tetra Tech) was the
SITE Program contractor for the evaluation. This report documents the activities conducted during the
demonstration and summarizes data collected by all involved parties.
This TER provides information on the ability of the NoVOCs™ technology to treat groundwater
contaminated with VOCs and includes a comprehensive description of the demonstration at NAS North
Island and its results. Because of operational difficulties encountered during the demonstration, a
thorough evaluation of the performance and cost characteristics of the NoVOCs™ technology's ability to
treat VOC-contaminated groundwater could not be conducted. However, valuable information was
collected regarding the operation and maintenance of the NoVOCs™ technology and site-specific factors
that may influence system performance. This information may be useful to other decision-makers for
consideration when carrying out specific remedial actions using this technology or conducting further
technology performance evaluations. Data from the demonstration may require extrapolation for
estimating the operating ranges in which the technology will perform satisfactorily. Only limited
conclusions can be drawn from this field demonstration.

Tetra Tech EM Inc.
FIGURE 1VICINITY MAP
Naval Air StationNorth Island
Pacific Ocean Naval Amphibious Base
City Of Coronado
32nd StreetNaval Station
San Diego Bay
Lindberg Field
City of San Diego
NoVOCsTM SITE DemonstrationSite 9, NAS North Island, California
SAN DIEGO BAY
MAIN GATE
SITE 9
SOURCE: MODIFIED FROM BROWN AND CALDWELL 1983.
PACIFIC OCEAN
CITY OF CORONADO
NAS NORTH ISLAND ANDFIGURE 2
SITE 9 LOCATION MAPSCALE IN FEET
0 1500500 1000


5
The TER is divided into seven sections. Section 1.0 presents the project background, SITE Program
information, technology description, and key contacts. Section 2.0 describes the demonstration site,
evaluation objectives, evaluation methods and procedures, and modifications to the NoVOCs™
demonstration Technology Evaluation Plan/Quality Assurance Project Plan (TEP/QAPP) (Tetra Tech
1998). Section 3.0 presents the results of measurements taken during the demonstration. Section 4.0
presents the technology economic analysis. Section 5.0 presents the conclusions of the evaluation,
Section 6.0 discusses the technology status, and Section 7.0 includes a list of references.
The TER is appended by six sections, which are divided into six volumes. Appendix A—Auxiliary
Tables and Graphs, Appendix B—Vendor Case Studies, and Appendix C—Hydrogeologic Investigation
Results, are presented, along with the TER in Volume I. Appendix D—Laboratory Data, are presented in
Volumes II through V. Appendix E—Field Data, and Appendix F—Quality Assurance and Quality
Control Data Summary, are presented in Volume VI.
1.1 PROJECT BACKGROUND
As part of the feasibility study for the cleanup of the Chemical Waste Disposal Area (Site 9) at NAS
North Island, SWDIV is conducting a series of pilot-scale treatability studies to obtain site-specific
performance and cost data on potentially applicable remedial technologies to address soil and
groundwater contamination at the site. During screening of applicable technologies, the NoVOCs™
technology was identified as a possible remedial solution to treat VOC-contaminated groundwater at Site
9. In addition, an innovative offgas treatment system, the Thermatrix flameless oxidation system, was
selected to treat the offgas generated by the NoVOCs™ system. SWDIV, in cooperation with EPA TIO,
Clean Sites, and the EPA SITE Program, began project planning of the NoVOCs™ and Thermatrix
technology evaluation in 1995. Clean Sites also facilitated an Innovative Technology Public-Private
Partnership that includes ICI, DuPont, and General Electric to provide technical review and input during
the demonstration. Initiation of the NoVOCs™ demonstration was originally planned for 1997, but
because of various regulatory, financial, and technical issues, implementation of the demonstration was
delayed until 1998.
Based on site characterization information from Site 9, the initial design for the NoVOCs™ well
prepared by EG&G Environmental (EG&G) included the extraction of groundwater from the lower
portion of the aquifer and injection of treated water into the vadose zone through an infiltration gallery.

6
Installation of the NoVOCs™ well at NAS North Island began in October 1997. During advancement of
soil borings, a silt layer was encountered at a depth that bisected the treatment zone. Because of
concerns that the silt layer may act as a hydraulic barrier at the site and may adversely impact formation
of a circulation cell, the location of the NoVOCs™ well was moved about 300 feet southeast, and the
well configuration was redesigned.
Installation of the redesigned NoVOCs™ well at the second location began in January 1998. The
redesigned well included extraction of groundwater from the lower portion of the aquifer and injection of
treated groundwater in the saturation zone, just below the A silt/clay. Before installation of the
redesigned well, the NoVOCs™ technology was sold by EG&G Environmental to MACTEC in
December 1997. As a result of the sale, a new NoVOCs™ project team was brought in by MACTEC.
In February 1998, installation of the NoVOCs™ well was completed, and the NoVOCs™ technology
began system startup and shakedown activities. Bechtel, the environmental support contractor for
SWDIV, MACTEC, and Thermatrix managed the installation and operation of the NoVOCs™ well and
the offgas treatment systems, with assistance from Gilbert Hill Associates and Umtanum Enterprises.
The NoVOCs™ system was installed immediately downgradient from a contaminant source area to treat
VOC-contaminated groundwater. Because of geologic conditions encountered during advancement of
the NoVOCs™ well and associated monitoring wells, the NoVOCs™ well design was altered during
installation to treat a portion of the aquifer instead of the entire aquifer.
On February 26, 1998, the NoVOCs™ system began startup and shakedown activities, which continued
through March 9, 1998. On March 13, 1998, the system began continuous operation with only minor
interruptions for system checks and balances. The NoVOCs™ system was shut down by MACTEC on
March 26, 1998, because the pH control system did not send a high pH shutdown signal to the blower
control system.
After MACTEC added a pH shutdown signal, the system was restarted on April 20, 1998. The EPA
SITE Program evaluation of the NoVOCs™ system also began in April 1998 and included collection of
air and groundwater samples from the NoVOCs™ system and surrounding monitoring points. The
evaluation was conducted in accordance with the Technology Evaluation Plan/Quality Assurance Project
Plan for the MACTEC NoVOCs™ Technology Evaluation at NAS North Island (Tetra Tech 1998). By
June 1998, the pumping rate of the NoVOCs™ system had been reduced from the design rate of 25

7
gallons per minute (gpm) to about 5 gpm because injection rates above 5 gpm could not be maintained
without the water level in the well rising. In addition, during this period, the system experienced
numerous shutdowns because of high water levels in the NoVOCs™ well. Based on discussions between
the Navy and the technology vendor, the system was shut down on June 19, 1998, to evaluate the cause
of the system operating problems. Suspected causes included (1) biofouling or scaling of the screen
intervals and formation near the NoVOCs™ system; (2) possible differences in hydraulic characteristics
between the upper and lower portions of the aquifer; and (3) design problems with the NoVOCs™ well,
in particular, the length of the recharge screen. The Site was particularly challenging because the
groundwater contained total dissolved solids (TDS) concentrations ranging from 18,000 to 41,000 mg/L;
a much higher TDS than in a typical drinking water aquifer.
To determine if the operating problems were caused by improper well design or aquifer conditions, a
series of aquifer pump tests were conducted from July 27 through August 5, 1998. The pump tests
provided information on the recharge capacity of the NoVOCs™ system and the aquifer hydraulic
characteristics in the vicinity of the NoVOCs™ system. The hydrogeologic study included: (1) a tidal
influence study to evaluate natural variations in water level at the site caused by tides in San Diego Bay,
and (2) a series of groundwater pumping tests in the shallow and deep portions of the aquifer, including
step drawdown tests, a 32-hour constant discharge pumping test, an injection test, and a dipole flow test
to evaluate the aquifer characteristics in the vicinity of the NoVOCs™ system. A biofouling and scaling
study was also conducted by the vendor.
Based on the results of these studies, it was determined that the initial well design would be modified to
allow for more efficient air-water separation and a sequestering agent would be added to the system to
minimize metal precipitation. Significant biological growth was noted during pump test activities, so it
was decided that a periodic biocide treatment would also be added to the groundwater flowing through
the system. The internal components of the NoVOCs™ well were redesigned by MACTEC and were
installed in September 1998.
Operation of the redesigned NoVOCs™ system was initiated on September 24, 1998, using a modified
chemical treatment, which consisted of acid and biocide injection into the influent piezometer to control
the precipitation of iron and biological growth near the NoVOCs™ well. The redesigned system
continued operation until October 29, 1998. During this period, the system continued to experience

8
problems with high water levels in the NoVOCs™ well and was not able to operate for sustained periods
of time. As a result of inconsistent operation, completion of planned evaluation activities, including the
dye trace study and collection of groundwater and air samples to evaluate system performance, were
postponed until satisfactory operating conditions could be achieved.
A project team meeting was held in San Diego, California, on November 9 and 10, 1998, to discuss
system operating problems and continued evaluation of the NoVOCs™ system. At the meeting,
MACTEC indicated that they were not willing to commit additional resources to making the NoVOCs™
system work at NAS North Island and withdrew from the demonstration. However, SWDIV decided to
continue operation of the NoVOCs™ system and modified the chemical treatment used to control metal
precipitation and biological growth in an effort to get the system operational and continue the evaluation
of the system.
On December 4, 1998, the NoVOCs™ system was restarted. During operation of the NoVOCs™
system, the well was aggressively treated with hydrochloric acid, citric acid, bromide/chloride solution,
and hydrogen peroxide to mitigate biofouling and precipitation of iron. However, even with aggressive
chemical treatment, the system continued to experience operational shutdowns because of high water
levels in the NoVOCs™ well. In addition, the Thermatrix system began to experience maintenance
problems that also adversely affected operation of the NoVOCs™ system. Finally, on January 4, 1999,
the NoVOCs™ demonstration was terminated by SWDIV because of continued operating problems
associated with biofouling of the NoVOCs™ well.
1.2 THE SUPERFUND INNOVATIVE TECHNOLOGY EVALUATION PROGRAM
The SITE Program was established by EPA's Office of Solid Waste and Emergency Response (OSWER)
and Office of Research and Development (ORD) in response to the Superfund Amendments and
Reauthorization Act of 1986 (SARA). The SITE Program promotes the development, evaluation, and
use of new or innovative technologies to clean up Superfund sites across the country.
The SITE Program's primary purpose is to maximize the use of alternatives in cleaning up hazardous
waste sites by encouraging the development and evaluation of innovative treatment and monitoring
technologies. It consists of three major elements:

9
• The Technology Evaluation Program
• The Monitoring and Measurement Technologies Program
• The Technology Transfer Program
The objective of the Technology Evaluation Program is to develop reliable performance and cost data on
innovative technologies so that potential users may assess the technology's site-specific applicability.
Technologies evaluated are either currently available or close to being available for remediation of
Superfund sites. SITE evaluations are conducted on hazardous waste sites under conditions that closely
simulate full-scale remediation conditions, thus ensuring the usefulness and reliability of information
collected. Data collected are used to assess: (1) the performance of the technology, (2) the potential
need for pre- and post-treatment processing of wastes, (3) potential operating problems, and (4)
approximate costs. The evaluations also allow for assessment of long-term risks.
Existing technologies that improve field monitoring and site characterizations are identified in the
Monitoring and Measurement Technologies Program. New technologies that provide faster, more cost-
effective contamination and site assessment data are supported by this program. The Monitoring and
Measurement Technologies Program also formulates protocols and standard operating procedures for
evaluation methods and equipment.
The Technology Transfer Program disseminates technical information on innovative technologies in the
Evaluation and Monitoring and Measurements Technologies Programs through various activities. These
activities increase the awareness and promote the use of innovative technologies for assessment and
remediation at Superfund sites. The goal of technology transfer activities is to develop interactive
communication among individuals requiring up-to-date technical information.
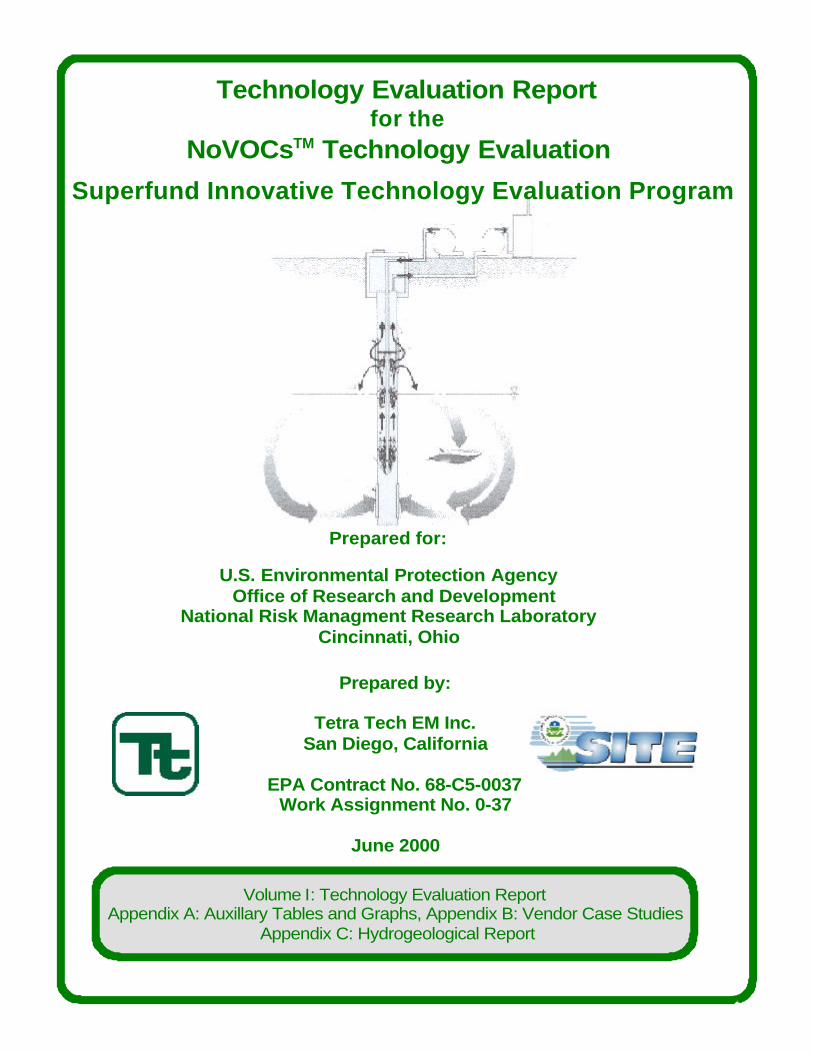
1.3 TECHNOLOGY DESCRIPTION
MACTEC’s NoVOCs™ system is a patented in-well stripping process (U.S. Patent No. 5,180,503) for in
situ removal of VOCs from groundwater. A schematic of the treatment process is shown in Figure 4. In
this process, air injected into a specially designed well simultaneously creates an airlift pump and an in
situ stripping reactor to circulate and remediate groundwater (EG&G 1996).
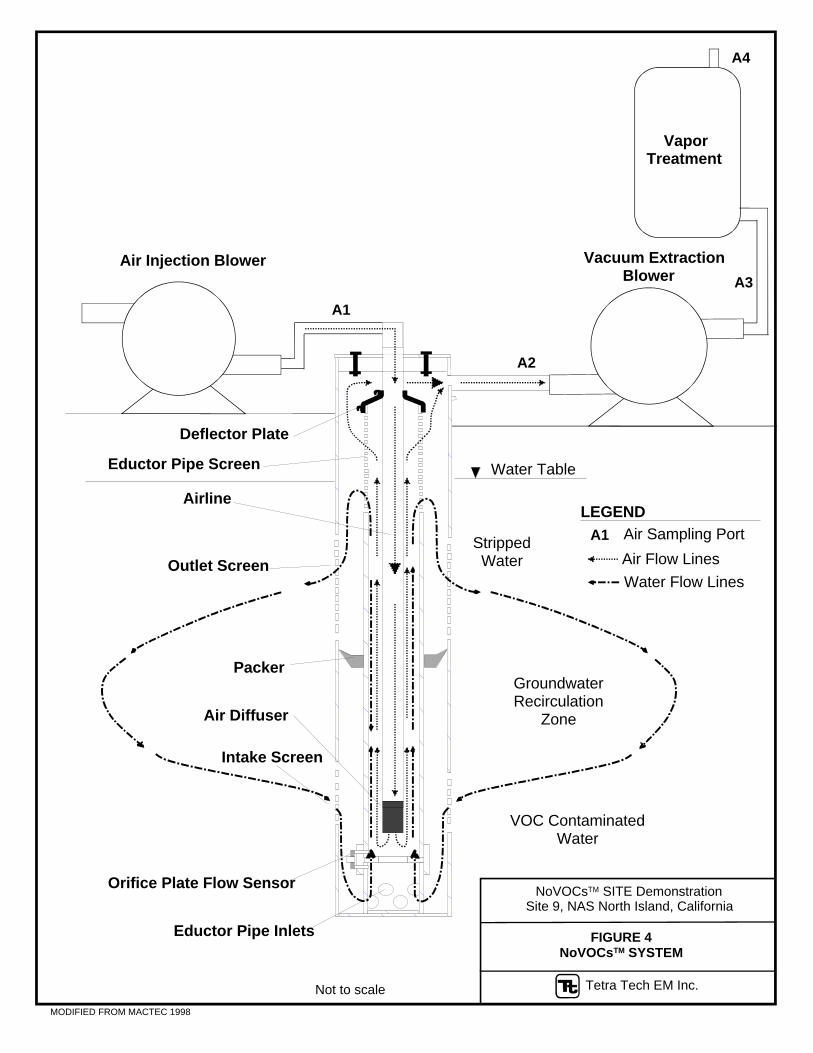
Airline
Stripped Water
VOC ContaminatedWater
GroundwaterRecirculation
Zone
MODIFIED FROM MACTEC 1998
Tetra Tech EM Inc.
FIGURE 4NoVOCsTM SYSTEM
Not to scale
Eductor Pipe Screen Water Table
Outlet Screen
Packer
Air Diffuser
Intake Screen
Orifice Plate Flow Sensor
Eductor Pipe Inlets
Air Injection Blower Vacuum Extraction Blower
VaporTreatment
LEGEND
Air Flow Lines
Water Flow Lines
Deflector Plate
NoVOCsTM SITE DemonstrationSite 9, NAS North Island, California
A1
A2
A3
A4
Air Sampling PortA1

11
The NoVOCs™ system at NAS North Island consisted of a well casing installed in the contaminated
saturated zone, with screened intervals below the water table and an air injection line extending into the
groundwater within the well. Contaminated groundwater enters the well through the lower screen and is
pumped upward within the well by pressurized air supplied through the air injection line, creating an air-
lift pump effect. As the water is air-lifted within the well, dissolved VOCs in the water volatilize into the
air space at the air-water interface. The treated water rises to a deflector plate and is forced out of the
upper screen. Treated water is recharged to the aquifer, and stripped VOC vapors are removed from the
subsurface by a vacuum applied to the upper well casing. At NAS North Island, the stripped vapors were
treated by the Thermatrix flameless oxidation process (EG&GE 1996) and discharged to the atmosphere.
Other open- and closed-loop offgas treatment systems can be used with the NoVOCs™ technology, and
the Thermatrix system is not an integral part of the NoVOCs™ treatment system. The equipment used to
operate the NoVOCs™ system, including blowers, control panel, and air temperature, pressure, and flow
rate gauges, was housed in an on-site control trailer.
The NoVOCs™ well may be used to remediate contaminant source areas or as a groundwater
interdiction system to prevent further migration of a contaminant plume. At NAS North Island, one
NoVOCs™ well was installed to remediate a portion of the aquifer downgradient from a contaminant
source area. Two piezometers and 10 monitoring wells were also installed to enable sample collection in
support of the evaluation of the NoVOCs™ system. Figure 5 shows a plan view of the location of the
NoVOCs™ system well and associated piezometers and monitoring wells. Figure 6 shows a generalized
cross-section of the NoVOCs™ system well, piezometers, and crossgradient monitoring wells.
MACTEC claims that the NoVOCs™ system can reduce effluent groundwater VOC concentrations to
below federal maximum contaminant levels (MCL) if the contaminant source has been removed.
Because dense nonaqueous-phase liquids (DNAPL) may be present in the aquifer at this evaluation site
and may act as a continuing source of groundwater contamination, MACTEC did not make any claims
for the reduction of dissolved VOC concentrations in groundwater at Site 9. Given the designed
pumping rate of 25 gpm and a total air flow rate of 120 standard cubic feet per minute (scfm), MACTEC
estimated that the effective radius of the circulation cell established by the NoVOCs™ system at this site
would be at least 90 feet (EG&GE 1997). In addition, the vendor claimed that the NoVOCs™ system
would remove more than 80 percent of the VOCs that pass through the system.

NoVOCs Well
LEGEND
(INCLUDES PIEZOMETERS
APPROXIMATE LOCATION OFMONITORING WELL OR NoVOCs WELL
N 3rd STREET WEST
PROPANE TANKS
NoVOCS-THERMATRIX
EXISTING SVE PAD
4th
STR
EE
T W
ES
T
SCALE IN FEET
0 100
NORTH
50
EQUIPMENT PAD
PZ-01 AND PZ-02)
MW-54
MW-53
MW-52
MW-46
MW-47MW-45
MW-51
MW-50
MW-48MW-49
WELL LOCATIONS
FIGURE 5

Tetra Tech EM Inc.
FIGURE 6GENERALIZED CROSS-SECTION
UpperRecharge
Screen
LowerIntakeScreen
WellCasing
EductorPipe
AirInjection
Line
VadoseZone
SaturatedZone
Packer
MW
-46
MW
-45
Packer
Water Table
South North
Not to scale
MW
-47
MW
-51
PZ
-02
PZ
-01
MW
-48
MW
-49
MW
-50
No
VO
Cs
WE
LL
NoVOCsTM SITE DemonstrationSite 9, NAS North Island, California

14
1.4 KEY CONTACTS
Additional information on the SITE Program and the evaluation can be obtained from the NRMRL
Project Manager:
• Michelle Simon, P.E.U.S. Environmental Protection AgencyOffice of Research and Development26 West Martin Luther King DriveCincinnati, Ohio 45268Telephone: (513) 569-7469, Facsimile: (513) 569-7676E-mail: [email protected]
Additional information on the NoVOCs™ technology or the evaluation can be obtained from the
technology vendor:
• Warren SchultzMACTEC, Inc.1819 Denver West Drive, Suite 400Golden, Colorado 80401Telephone: (303) 278-3100, Facsimile: (303) 273-5000E-mail: [email protected]
In addition, information on the SITE Program is available through the following on-line information
clearinghouses:
• SITE Program Home Page: http://www.epa.gov/ORD/SITE
• The Alternative Treatment Technology Information Center (ATTIC) InternetAccess: http://www.epa.gov/attic
• Cleanup Information Bulletin Board System (CLU-IN)Help Desk: (301) 589-8368; Internet Access: http://www.clu-in.org
• EPA Remediation and Characterization Innovative TechnologiesInternet Access: http://www.epa.reachit.org
• Groundwater Remediation Technology CenterInternet Access: http://www.gwrtac.org

15
Technical reports may be obtained by contacting the National Service Center for Environmental
Publications (NSCEP) in Cincinnati, Ohio. To find out about newly published documents or to be placed
on the SITE mailing list, call or write to:
C U.S. EPA/NSCEPP.O. Box 42419Cincinnati, OH 45242-2419(800) 490-9198

16
2.0 SITE DESCRIPTION, OBJECTIVES, AND PROCEDURES
Demonstration site background, objectives, and methods and procedures for the NoVOCs™ technology
evaluation are described in the following sections.
2.1 DEMONSTRATION SITE DESCRIPTION
This section provides information on site conditions, including site history, topography, geology,
hydrogeology, and soil and groundwater contamination at NAS North Island and Site 9.
2.1.1 Site History
NAS North Island is the largest naval aviation complex on the West Coast and is home to three aircraft
carriers and the Third Fleet flagship, USS Coronado. NAS North Island is located at the northern end of
the peninsula that forms San Diego Bay and is bordered by the City of Coronado to the east, the Pacific
Ocean to the south, and San Diego Bay to the north and west (see Figure 1). The 2,806-acre complex,
officially commissioned in 1917, provides aviation support services to the fleet, aircraft maintenance,
airfield operations, pierside services, and logistics. The mission of NAS North Island is to maintain and
operate facilities and to provide services and material that support operation of aviation activities and
units of the Operating Forces of the Navy, as well as other units, as designated by the Chief of Naval
Operations.
Past hazardous waste disposal practices at NAS North Island have resulted in soil and groundwater
contamination. The Navy has undertaken investigations to determine the extent of contamination and
possible cleanup methods as part of the IR Program. Under the IR Program, 14 contaminated areas have
been designated IR sites, one of which is Site 9 (see Figure 2).
Site 9, the 40-acre former chemical waste disposal area, is located on the western end of NAS North
Island. Site 9 operated from the 1940s to the mid-1970s and consisted of three major waste disposal
areas: a shallow pit used for disposal of liquid wastes (located within the waste disposal area shown in
Figure 3); four parallel trenches, each containing different types of wastes (solvents, caustics, acids, and
semisynthetics consisting of ceramic and metallic compounds); and a large unimproved area used for

17
burying drums containing unidentified chemical wastes, located south of the NoVOCs™ well. An
estimated 8 to 24 million gallons of waste were disposed of at Site 9 over its 30 years of operation
(Jacobs 1995a).
Contamination from these disposal areas has migrated to the underlying groundwater. Although no
official history of chemical disposal exists for most of Site 9 outside of the three disposal areas,
groundwater contamination is widespread throughout the site. Elevated levels of chlorinated solvents
and their breakdown products, as well as petroleum hydrocarbons and metals, are present in groundwater
at Site 9. Based on the high dissolved concentrations of chlorinated solvent compounds, the presence of
DNAPL in the subsurface is suspected (Jacobs 1995a).
The Navy selected a location immediately south of the intersection of 4th Street West and North 3rd
Street West to install the NoVOCs™ system (see Figure 3). Cone penetrometer test (CPT) boreholes
advanced at the proposed NoVOCs™ location provided additional characterization of subsurface
lithology and confirmed that significant groundwater contamination was present (Bechtel 1998).
2.1.2 Site Topography
The topography of the northern half of Site 9 is relatively flat with an elevation of about 13 feet above
mean lower low water (MLLW). It has virtually no relief and is covered by asphalt paving. The
southern half of the site is unpaved and is almost entirely covered by a terrace composed of hydraulic
dredge spoils. The terrace has an elevation of about 23 feet above MLLW along its northern face and
slopes gently southward to about 18 feet above MLLW (Jacobs 1994). Topographic elevations and
surface features are shown in Figure 7. The NoVOCs™ well was installed on the terrace at a surface
elevation of about 22 to 23 feet above MLLW.
2.1.3 Regional and Site Geology
This section discusses the regional and site geology for Site 9.


19
2.1.3.1 Regional Geology
NAS North Island is situated in the coastal portion of the Peninsular Range Geomorphic Province. This
region is underlain by a basement complex of late Cretaceous undifferentiated igneous rocks of the
Southern California Batholith and Jurassic prebatholithic metavolcanic rocks. The basement complex is
nonconformably overlain by a sedimentary succession of marine and nonmarine rocks that were
deposited within the San Diego embayment. These rocks range in age from Late Cretaceous to Recent.
The most abundant deposits of the embayment are gently folded and faulted Eocene marine, lagoonal,
and nonmarine rocks that thin eastward and trend northwest (Jacobs 1995b).
2.1.3.2 Site Geology
Site 9 is underlain by artificial fill to a depth of about 15 feet below ground surface (bgs) in the vicinity
of the NoVOCs™ well. The artificial fill in this area varies in thickness. The terrace in the southern
portion of the site is composed of hydraulic fill derived from dredging the San Diego Bay and consists of
fine-grained, loose sand. In addition, in the immediate vicinity of the site, the former Whaler’s Bight, a
shallow lagoon formerly present at the western edge of North Island, was filled with sediments during the
early part of the twentieth century. Below the fill material is the Bay Point Formation, a poorly
consolidated, fine- and medium-grained fossiliferous sandstone (Kennedy 1975).
The depositional environment of the Bay Point Formation at the site was lagoonal and shallow marine.
Sediment accumulated on the southern portion of North Island generally from northward transport of
sediment along the shore. As described below, most of the uppermost sediments at the site are composed
of fine-grained sand, with varying amounts of silt and medium-grained sand. Two thin silt and clay
layers are present in the subsurface at the site and are likely to be continuous in the vicinity of the site,
based on observations in the numerous borings and wells installed at the site (Bechtel 1998).
The first fine-grained layer is a thin (2-to 5-feet-thick) clay, silt, and clayey sand layer designated as
A clay/silt (Jacobs 1994). The A clay/silt occurs at about 35 to 40 feet bgs and is present beneath Site 9
(Jacobs 1994). Recent investigations by Bechtel have indicated that the A clay/silt is continuous from
the proposed NoVOCs™ well locations west to the shoreline wells. Beneath the unconsolidated
sediments is a sandstone layer at about 90 feet bgs. The second layer is the B clay, located about 105 feet
20
bgs, that also appears to be continuous in the vicinity of the site. The location of a geologic cross-section
is shown in Figure 8, and the cross-section depicting the subsurface geology of the site is shown in
Figure 9.
Boring S9-SB-34 located near the NoVOCs™ well encountered mostly sand and silty sand. The A
clay/silt layer was encountered at 35.5 feet bgs, dense sands were encountered between 60 and 61 feet
bgs and 65 to 67.5 feet bgs, and a thin, cemented sandstone layer was encountered at 79 feet bgs. In
addition, the sand fractions of the sands and silty sands ranged from very fine- to coarse-grained and
contained various quantities of shell fragments. The log for boring S9-SB-34 is provided in Volume VI,
Appendix E.
2.1.4 Site Hydrogeology
The generally accepted hydrogeologic conceptual model for islands and peninsulas surrounded by salt
water is a lens-shaped body of fresh water resting isostatically atop saltwater because of density
differences. At Site 9, groundwater occurs at about 8 feet bgs (5 feet above MLLW). The upper 110 feet
of the saturated zone contains an unconfined aquifer with a thin (5 to 20 feet), discontinuous freshwater
lens, a brackish mixing zone (30 to 100 feet), and a saltwater wedge intruding inland. The reported
values for some of the hydrogeological parameters of the site are as follows (Jacobs 1995b):
C Hydraulic Gradient: 0.0008 foot per foot (ft/ft) over most of the site, but steepens near theshoreline to 0.006 ft/ft
C Transmissivity: 1,195 square feet per day (ft2/day)
C Specific Yield: 3.2 x 10⁻¹ (dimensionless)
C Hydraulic Conductivity: 12 feet per day (ft/day) or 4.2 x 10⁻³ centimeters per second (cm/sec)
C Effective Porosity: 0.25 (dimensionless)
These were the hydrogeologic parameters used to design the NoVOCs™ well installed at NAS North
Island. The possibility that the A clay/silt layer posed a hydraulic barrier to effective groundwater


SOURCE: MODIFIED FROM BECHTEL 1998.
A'A
GEOLOGIC CROSS SECTION A-A'
FIGURE 9
23
circulation also impacted the design of the well and resulted in an installation with both extraction and
recharge occurring in the saturated zone under the A clay/silt.
In general, the hydraulic gradient is toward the west, varying between southwest and northwest and is
tidally influenced. The distribution of groundwater contamination also suggests that the general flow of
groundwater is toward the west. Contaminants associated with the site have been detected in pore water
of San Diego Bay, west of Site 9 (SPAWAR Systems Center 1998). A survey of pore water
concentrations of VOCs was conducted in the spring of 1998 in the upper 5 feet of sediment adjacent to
and west of Site 9. The results of the survey documented that VOCs were present in the pore water at
depths of about 20 to 30 feet below MLLW. The data suggest that contaminants are migrating west from
Site 9, at a depth consistent with the A clay/silt layer, and discharging to the bay through pore water
interchange with the bay water (Bechtel 1998).
2.1.5 Soil and Groundwater Contamination
Groundwater at NAS North Island is saline, with concentrations ranging from 18,000 to 41,000 mg/L.
Based on findings from previous investigations at the site (Jacobs 1995a, 1995b), high concentrations of
chlorinated solvents, chlorinated solvent breakdown products, petroleum hydrocarbons, and metals are
present in the saturated and unsaturated zones. The major contaminants detected in groundwater are
chlorinated aliphatic hydrocarbon solvents (tetrachloroethene [PCE], trichloroethene [TCE], and
1,1,1-trichloroethane) and their breakdown products (dichloroethane, dichloroethene [DCE], and vinyl
chloride); lower concentrations of aromatic hydrocarbons (benzene, toluene, ethylbenzene, and xylenes
[BTEX]); and heavy metals. Because of the high concentrations of chlorinated solvent compounds in
groundwater above the B clay, DNAPL occurrences are suspected at several locations beneath Site 9. If
present, DNAPL may act as a long-term source of dissolved-phase contamination in the unconfined
aquifer.
Contaminants in soils consist of heavy metals, VOCs, and semivolatile organic compounds (SVOC).
Eighteen priority pollutant VOCs have been detected in soil samples with individual compound
concentrations of up to 3,600 milligrams per kilogram (mg/kg). Fourteen priority pollutant SVOCs,
including polynuclear aromatic hydrocarbons (PAH), have been detected in soil samples with individual
compound concentrations up to 1,668 mg/kg. In the former release areas, soils reportedly are virtually

24
saturated with VOCs (Jacobs 1995a). In addition, large quantities of VOCs are believed to have
evaporated from saturated soils and groundwater into the vadose zone. Elevated levels of TCE, PCE, and
toluene have been detected in soil gas within the vadose zone (Jacobs 1995a).
2.2 EVALUATION OBJECTIVES
The SITE evaluation was designed to address primary and secondary objectives selected for the
NoVOCs™ technology. These objectives were selected to provide potential users of the NoVOCs™
technology with the necessary technical information to assess the performance of the treatment system.
For the SITE evaluation of the NoVOCs™ technology, three primary and seven secondary objectives
were selected and are summarized below:
Primary Objectives:
P1 Evaluate the removal efficiency of the NoVOCs™ well system for VOCs ingroundwater.
P2 Determine the radial extent of the NoVOCs™ treatment cell.
P3 Quantify the average monthly total VOC mass removed from groundwater treated by thesystem for 6 months.
Secondary Objectives:
S1 Quantify the changes in VOC concentrations in the groundwater within the NoVOCs™treatment cell.
S2 Document changes in selected geochemical parameters that may be affected by theNoVOCs™ system.
S3 Document NoVOCs™ system operating parameters.
S4 Document pre- and post-treatment VOC concentrations and system operating parametersin the Thermatrix flameless oxidation offgas treatment system.
S5 Document the hydrogeologic characteristics at the treatment site.
S6 Document the changes in pressure head in the aquifer caused by the NoVOCs™ system.

25
S7 Estimate the capital and operating costs of constructing the NoVOCs™ system andThermatrix flameless oxidation process and maintaining them for 6 months.
The objectives were evaluated by collecting weekly and monthly samples from the groundwater and
system offgas, as well as conducting a series of pump tests. To meet the evaluation objectives, data were
collected and analyzed using the methods and procedures summarized in Section 2.3.
2.3 EVALUATION METHODS AND PROCEDURES
This section describes the methods and procedures used to collect and analyze samples for the SITE
evaluation of the NoVOCs™ technology. Field and analytical methods used to collect and analyze
samples were as outlined in Sections 2.3.2, 2.3.3., and 2.3.4. Activities associated with the NoVOCs™
SITE evaluation included (1) field equipment installation, (2) evaluation design, (3) groundwater and soil
gas sample collection and analysis, and (4) field and laboratory quality assurance and quality control
(QA/QC).
2.3.1 Field Equipment Installation
Predemonstration activities conducted by SWDIV's support contractor, Bechtel, included (1)
advancement of a CPT and collection of groundwater samples to evaluate the geology and contaminant
distribution at the demonstration site, (2) continuous coring and installation of the NoVOCs™ well and
two adjacent piezometers, and (3) the drilling of 10 soil borings and subsequent installation and
completion of the borings into monitoring wells. The depths and locations of the piezometers and
monitoring wells are described below.
The two piezometers were installed within the sand pack of the NoVOCs™ well: one adjacent to the
NoVOCs™ recharge screen (PZ-01), and one adjacent to the NoVOCs™ intake screen (PZ-02). The
natural groundwater flow direction across the site is generally to the west. Seven crossgradient
monitoring wells were installed at four distances from the NoVOCs™ well, as follows: a cluster of three
wells 30 feet from the NoVOCs™ well (monitoring wells MW-45, MW-46, and MW-47), a well pair 60
feet from the NoVOCs™ well (monitoring wells MW-48 and MW-49), and single monitoring wells 90
and 105 feet from the NoVOCs™ well (monitoring wells MW-50 and MW-51). Two downgradient
monitoring wells (MW-52 and MW-53) were installed as a pair about 100 feet from the NoVOCs™ well,

26
and a single monitoring well (MW-54) was also installed 100 feet upgradient of the NoVOCs™ well.
Each monitoring well was screened at one of the following three intervals: at the top of the treatment
zone (between about 41 and 47 feet bgs [-19.1 to -25.0 feet MLLW]), in the middle of the treatment zone
(between about 49 and 62 feet bgs [-35.1 to -40.4 feet MLLW]), and at the bottom of the treatment zone
(between about 67 and 78 feet bgs [-43.6 to -58.0 feet MLLW]). These screen intervals provided
information on changes in contaminant concentrations through the aquifer. A summary of well screen
intervals for the individual wells is presented in Table 1.
2.3.2 Evaluation Design
This section describes the sampling and analysis program and sample collection frequency and locations.
The purpose of the demonstration design was to collect and analyze samples of known and acceptable
quality to achieve the objectives stated in Section 2.2.
2.3.2.1 Sampling and Analysis Program
To meet the demonstration objectives, the sampling and analysis program was divided into three phases:
(1) baseline sampling, (2) long-term sampling, and (3) dye trace sampling.
Baseline Sampling. Baseline sampling included the collection of groundwater samples from the
monitoring wells to determine VOCs, SVOCs, dissolved metal concentrations, and select geochemical
parameters at the start and end of the evaluation. Data obtained during the baseline sampling events were
used to achieve secondary objectives S1 and S2. The first baseline sampling was conducted in April
1998 to assess contaminant concentrations in the aquifer before startup of the NoVOCs™ system under
early operating conditions. A second baseline sampling event was conducted in September 1998 to
assess contaminant concentrations in the aquifer before startup of the NoVOCs™ system under
reconfigured operating conditions. An overview of the sampling and analysis conducted for baseline
sampling is shown in Table 2.

27
TABLE 1
WELL SCREEN INTERVALSNoVOCs™ SITE Demonstration
Site 9, NAS North Island, California
Well Description
Distance FromNoVOCs™Well (feet)
Screen IntervalDepths
(feet bgs) Designation
IW-01 NoVOCs™ well 0 43 to 47 and72 to 78
System well
PZ-01 NoVOCs™ recharge piezometer 0 40 to 45 Shallow
PZ-02 NoVOCs™ intake piezometer 0 70 to 75 Deep
MW-45 Crossgradient monitoring well 30 42 to 47 Shallow
MW-46 Crossgradient monitoring well 30 57 to 62 Intermediate
MW-47 Crossgradient monitoring well 30 72 to 77 Deep
MW-48 Crossgradient monitoring well 60 52 to 57 Intermediate
MW-49 Crossgradient monitoring well 60 67 to 72 Deep
MW-50 Crossgradient monitoring well 90 52 to 57 Intermediate
MW-51 Crossgradient monitoring well 105 49 to 54 Intermediate
MW-52 Downgradient monitoring well 100 41 to 46 Shallow
MW-53 Downgradient monitoring well 100 72 to 77 Deep
MW-54 Upgradient monitoring well 100 38 to 78 Shallow
Note:
bgs Below ground surface

28
TABLE 2
SAMPLING AND ANALYSIS SUMMARYNoVOCs™ SITE Demonstration
Site 9, NAS North Island, California
SamplingEvent
SamplingLocation Sample Type
AnalyticalParameter Sampling Frequency
WhereAnalyzed Method Purpose
BaselineSamplingEvent
PZ-01 and PZ-02and MW-45through MW-54
Groundwater VOCs Before and afterdemonstration of theNoVOCs™ technology
Laboratory 8260B (SW-846) S2
SVOCs Laboratory 8270 (SW-846) S2
Dissolved metals Laboratory 3010/6010B(SW-846)
S2
Dissolvedorganic carbon
Laboratory 9060 SW-846 S2
Alkalinity Laboratory 310.1 (MCAWW) S2
Total dissolvedsolids
Laboratory 160.1 (MCAWW) S2
Dissolved oxygen In field 360.1 (MCAWW) S2
Redox potential In field 2580B (APHA) S2
pH In field 150.1 (MCAWW) S2
Specificconductivity
In field 120.1 (MCAWW) S2
Temperature In field 170.1 (MCAWW) S2
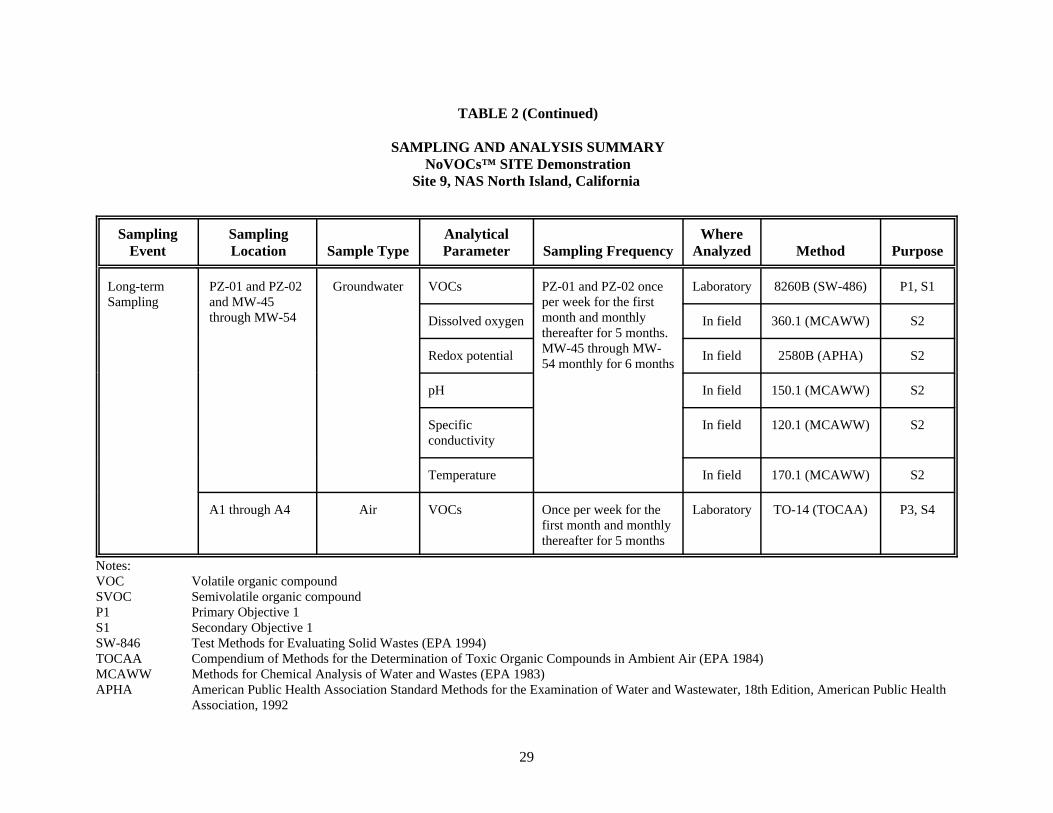
29
TABLE 2 (Continued)
SAMPLING AND ANALYSIS SUMMARYNoVOCs™ SITE Demonstration
Site 9, NAS North Island, California
SamplingEvent
SamplingLocation Sample Type
AnalyticalParameter Sampling Frequency
WhereAnalyzed Method Purpose
Long-termSampling
PZ-01 and PZ-02and MW-45through MW-54
Groundwater VOCs PZ-01 and PZ-02 onceper week for the firstmonth and monthlythereafter for 5 months. MW-45 through MW-54 monthly for 6 months
Laboratory 8260B (SW-486) P1, S1
Dissolved oxygen In field 360.1 (MCAWW) S2
Redox potential In field 2580B (APHA) S2
pH In field 150.1 (MCAWW) S2
Specificconductivity
In field 120.1 (MCAWW) S2
Temperature In field 170.1 (MCAWW) S2
A1 through A4 Air VOCs Once per week for thefirst month and monthlythereafter for 5 months
Laboratory TO-14 (TOCAA) P3, S4
Notes:VOC Volatile organic compoundSVOC Semivolatile organic compoundP1 Primary Objective 1S1 Secondary Objective 1SW-846 Test Methods for Evaluating Solid Wastes (EPA 1994)TOCAA Compendium of Methods for the Determination of Toxic Organic Compounds in Ambient Air (EPA 1984)MCAWW Methods for Chemical Analysis of Water and Wastes (EPA 1983)APHA American Public Health Association Standard Methods for the Examination of Water and Wastewater, 18th Edition, American Public Health
Association, 1992