technology assessment on low-temperature waste heat
TRANSCRIPT

ORNL/TM-2021/2150
Technology Assessment on Low-Temperature Waste Heat Recovery in Industry
Arvind Thekdi Sachin Nimbalkar Senthil Sundaramoorthy Kristina Armstrong Anthony Taylor Jack Gritton Thomas Wenning Joe Cresko
September 2021

DOCUMENT AVAILABILITY
Reports produced after January 1, 1996, are generally available free via US Department of Energy (DOE) SciTech Connect. Website www.osti.gov Reports produced before January 1, 1996, may be purchased by members of the public from the following source: National Technical Information Service 5285 Port Royal Road Springfield, VA 22161 Telephone 703-605-6000 (1-800-553-6847) TDD 703-487-4639 Fax 703-605-6900 E-mail [email protected] Website http://classic.ntis.gov/ Reports are available to DOE employees, DOE contractors, Energy Technology Data Exchange representatives, and International Nuclear Information System representatives from the following source: Office of Scientific and Technical Information PO Box 62 Oak Ridge, TN 37831 Telephone 865-576-8401 Fax 865-576-5728 E-mail [email protected] Website http://www.osti.gov/contact.html
This report was prepared as an account of work sponsored by an agency of the United States Government. Neither the United States Government nor any agency thereof, nor any of their employees, makes any warranty, express or implied, or assumes any legal liability or responsibility for the accuracy, completeness, or usefulness of any information, apparatus, product, or process disclosed, or represents that its use would not infringe privately owned rights. Reference herein to any specific commercial product, process, or service by trade name, trademark, manufacturer, or otherwise, does not necessarily constitute or imply its endorsement, recommendation, or favoring by the United States Government or any agency thereof. The views and opinions of authors expressed herein do not necessarily state or reflect those of the United States Government or any agency thereof.

ORNL/TM-2021/2150
Manufacturing Science Division (MSD)
TECHNOLOGY ASSESSMENT ON LOW-TEMPERATURE WASTE HEAT
RECOVERY IN INDUSTRY
Arvind Thekdi*
Sachin Nimbalkar†
Senthil Sundaramoorthy†
Kristina Armstrong†
Anthony Taylor†
Jack Gritton†
Thomas Wenning†
Joe Cresko‡
* E3M, Inc.
† Oak Ridge National Laboratory
‡ US Department of Energy
September 2021
Prepared by
OAK RIDGE NATIONAL LABORATORY
Oak Ridge, TN 37831-6283
managed by
UT-BATTELLE, LLC
for the
US DEPARTMENT OF ENERGY
under contract DE-AC05-00OR22725


iii
CONTENTS
LIST OF FIGURES ..................................................................................................................................... iv LIST OF TABLES ........................................................................................................................................ v ABBREVIATIONS ..................................................................................................................................... vi ACKNOWLEDGMENTS .......................................................................................................................... vii EXECUTIVE SUMMARY ....................................................................................................................... viii 1. INTRODUCTION ............................................................................................................................. 1-1
1.1 WASTE HEAT IN EXHAUST GASES AND HEAT RECOVERY ISSUES ........................ 1-1 2. LOW-TEMPERATURE WASTE HEAT ......................................................................................... 2-1
2.1 DEFINITION OF LOW-GRADE WASTE HEAT ................................................................. 2-1 2.2 SOURCES AND CHARACTERISTICS OF LOW-GRADE WASTE HEAT ....................... 2-2 2.3 LOW-TEMPERATURE WASTE HEAT AVAILABILITY .................................................. 2-7
3. LOW-TEMPERATURE HEAT RECOVERY TECHNOLOGY...................................................... 3-1 3.1 HEAT EXCHANGERS ........................................................................................................... 3-1 3.2 HEAT PIPE ............................................................................................................................ 3-18 3.3 HEAT PUMPS ....................................................................................................................... 3-20 3.4 THERMOCOMPRESSOR .................................................................................................... 3-22 3.5 THERMALLY ACTIVATED TECHNOLOGIES ................................................................ 3-24
4. NEW AND EMERGING TECHNOLOGIES ................................................................................... 4-1 4.1 Organic Rankine Cycle ............................................................................................................ 4-1 4.2 KALINA CYCLE .................................................................................................................... 4-3 4.3 SUPER CRITICAL CO2 CYCLE ............................................................................................ 4-6 4.4 TRILATERAL FLASH OR VARIABLE PHASE CYCLE .................................................... 4-8 4.5 PHASE CHANGE MATERIAL ENGINE ............................................................................ 4-10 4.6 THERMOELECTRIC GENERATION ................................................................................. 4-10 4.7 THERMIONIC GENERATOR ............................................................................................. 4-12 4.8 PIEZOELECTRIC GENERATION ...................................................................................... 4-12 4.9 TRANSPORT MEMBRANE CONDENSER ....................................................................... 4-13 4.10 MICROBIAL HEAT RECOVERY ....................................................................................... 4-14 4.11 STIRLING ENGINE ............................................................................................................. 4-14 4.12 THERMAL STORAGE ......................................................................................................... 4-15 4.13 LOW-TEMPERATURE WASTE HEAT TECHNOLOGIES SUMMARY ......................... 4-15
5. ECONOMIC OVERVIEW OF LOW-TEMPERATURE WASTE HEAT TO POWER
SYSTEMS ......................................................................................................................................... 5-1 5.1 INTRODUCTION ................................................................................................................... 5-1 5.2 CONCLUSIONS ...................................................................................................................... 5-5
REFERENCES .......................................................................................................................................... 5-6 APPENDIX A. LOW-TEMPERATURE WASTE HEAT SOURCES FROM MAJOR
INDUSTRIAL SECTORS ................................................................................................................ A-1 APPENDIX B. LOW-TEMPERATURE WASTE HEAT ESTIMATE BASED ON MECS DATA ...... B-1

iv
LIST OF FIGURES
Figure 1-1. Application of waste heat recovery. ........................................................................................ 1-1 Figure 1-2. Waste heat to power. ............................................................................................................... 1-2 Figure 1-3. Rankine cycle setup. ................................................................................................................ 1-2 Figure 1-4. Thermoelectric generator technology. ..................................................................................... 1-3 Figure 3-1. Typical single-pass and multiple-pass (U-tube) shell and tube heat exchangers. ................... 3-2 Figure 3-2. Conventional noncondensing feed water economizer. ............................................................ 3-5 Figure 3-3. Feed water economizer minimum metal temperature requirement to avoid acid
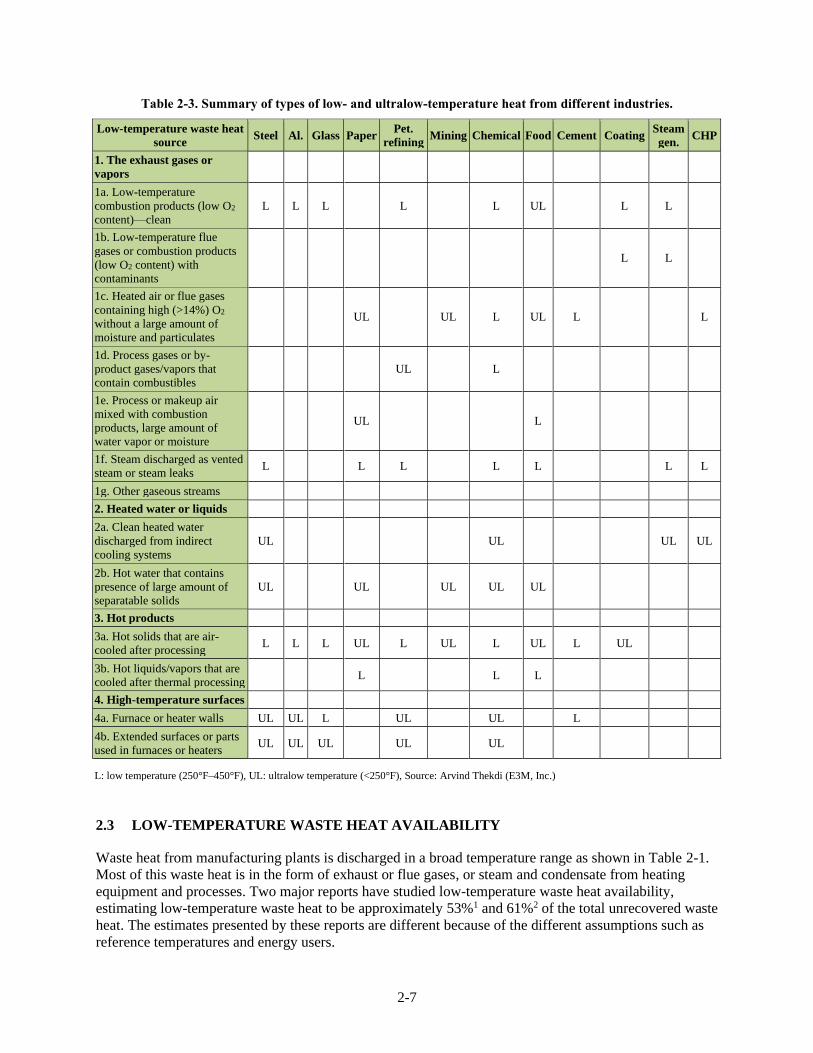
condensation. ................................................................................................................................ 3-6 Figure 3-4. Heat recovery by lowering flue gas temperature using a condensing heat exchanger. ........... 3-7 Figure 3-5. Use of a condensing heat exchanger to increase boiler efficiency. ......................................... 3-8 Figure 3-6: Installation of a noncontact condensing economizer at a chemical plant. .............................. 3-8 Figure 3-7. A direct contact condensing heat exchanger.............................................................................. 3-9 Figure 3-8. Installation of a direct contact condensing heat exchanger on a boiler. ................................ 3-10 Figure 3-9. Typical plate and frame heat exchanger. ............................................................................... 3-12 Figure 3-10. Spiral heat exchanger interior construction and the finished unit. ...................................... 3-14 Figure 3-11. Typical recuperator design and application for combustion air preheating. ....................... 3-15 Figure 3-12. Three main configurations of convective recuperators. ...................................................... 3-15 Figure 3-13. Typical heat wheel WHR unit. ............................................................................................ 3-17 Figure 3-14. A heat pipe construction and functional schematic. ............................................................ 3-19 Figure 3-15. Assembled unit of heat pipes for use in gas to liquid heat transfer. .................................... 3-19 Figure 3-16. Working principle of a heat pump for heat recovery applications. ..................................... 3-21 Figure 3-17. Industrial application areas for heat pumps. ........................................................................ 3-21 Figure 3-18. Thermocompressor components. ........................................................................................ 3-23 Figure 3-19. Application of a thermocompressor on a paper-drying machine. ....................................... 3-24 Figure 3-20. Simplified absorption cycle using waste heat. .................................................................... 3-25 Figure 3-21. Schematic of a single-effect ammonia–water absorption chiller system. ........................... 3-26 Figure 4-1. Illustration of an industrial ORC technology. ......................................................................... 4-1 Figure 4-2. ORC applicability based on source temperature and output energy. ...................................... 4-2 Figure 4-3. The ORC in recovering flue gas from CHP. ........................................................................... 4-3 Figure 4-4. Kalina cycle flow schematic. .................................................................................................. 4-4 Figure 4-5. Plant size comparison between a sCO2 system and a steam Rankine system. ........................ 4-6 Figure 4-6. Flow schematic for a simple sCO2 cycle system. .................................................................... 4-7 Figure 4-7. (1) Assembling, (2) shipping, (3) installing, and (4) testing of a sCO2 system in
Groveport, Ohio. ........................................................................................................................... 4-8 Figure 4-8. Schematic of a simple VPC system. ........................................................................................ 4-9 Figure 4-9. Schematic view of a PCM engine system. ............................................................................ 4-10 Figure 4-10. Schematic view of a TEG system setup. ............................................................................. 4-11 Figure 4-11. Schematic view of a thermionic generator. ......................................................................... 4-12 Figure 4-12. Schematic view of TMC system components. .................................................................... 4-13 Figure 4-13. Comparison of industrial waste heat temperatures and WHR technology
operating temperatures. ............................................................................................................... 4-13 Figure 4-14. Schematic view of a TMC system components. ................................................................. 4-14 Figure 5-1. Survey results of potential CHP customers and their interest based on time to
recuperate investment, adapted from results of a 2003 Primen survey. ........................................ 5-1 Figure 5-2. Time-dependent present value of waste heat to power system savings. ................................. 5-2 Figure 5-3. Agglomerated cost-size data from industry for comparing different types of waste
heat to power systems. .................................................................................................................. 5-3 Figure 5-4. Component cost breakdown of an ORC heat recovery system. .............................................. 5-3

v
Figure 5-5. Component cost breakdown of a VPC heat recovery system. ................................................. 5-4 Figure 5-6. Component cost breakdown of a Stirling engine heat recovery system. ................................. 5-4 Figure 5-7. Spark spread for selected regions of higher electricity costs. ................................................. 5-5
LIST OF TABLES
Table 2-1. Temperature range and characteristics for low-temperature industrial waste heat
sources. ......................................................................................................................................... 2-5 Table 2-2. Common discharge sources of waste heat and their forms from various energy systems
used in a manufacturing plant. ...................................................................................................... 2-6 Table 2-3. Summary of types of low- and ultralow-temperature heat from different industries. .............. 2-7 Table 2-4. Waste heat sources and temperature ranges. ............................................................................ 2-8 Table 2-5. Estimated additional low-temperature waste heat. ................................................................... 2-9 Table 2-6. Estimate of low-temperature waste heat based on top-down analysis. ................................... 2-11 Table 3-1. Advantages and disadvantages of shell and tube heat exchangers. .......................................... 3-4 Table 3-2. Advantages and disadvantages of plate and frame heat exchangers. ..................................... 3-13 Table 4-1. An inventory of Kalina cycle recovery systems. ...................................................................... 4-5 Table 4-2. Current waste heat to power technology inventory. ............................................................... 4-16 Table 4-3. Current research into ORC improvements. ............................................................................ 4-17 Table 4-4. Current waste heat recycling technology database. ................................................................ 4-18 Table 4-5. Research into future waste heat to power technology database. ............................................. 4-20 Table 5-1. Model determining payback period of CHP. ............................................................................ 5-2

vi
ABBREVIATIONS
CHE compact heat exchanger
CHP combined heat and power
COP coefficient of performance
DOE US Department of Energy
EIA US Energy Information Administration
HRSG heat recovery steam generator
MECS Manufacturing Energy Consumption Survey
NAICS North American Industry Classification System
O&M operations and maintenance
ORC organic Rankine cycle
ORNL Oak Ridge National Laboratory
PCM phase change material
sCO2 supercritical CO2
TE thermoelectric
TEG thermoelectric generator
TMC transport membrane condenser
VPC variable-phase cycle
WHR waste heat recovery

vii
ACKNOWLEDGMENTS
The authors gratefully acknowledge the support and guidance of Stephen Sikirica and Bob Gemmer of the
US Department of Energy’s Advanced Manufacturing Office. The authors also thank Subodh Chaudhari,
David Vance, William Peter, Craig Blue, Ron Ott, James Parks II, Jennifer Travis, and Olivia Shafer of
Oak Ridge National Laboratory who assisted in the development and review of this report. Also, it is a
pleasure to acknowledge the help of William Morrow (Lawrence Berkeley National Laboratory), Alberta
Carpenter (National Renewable Energy Laboratory), Diane Graziano (Argonne National Laboratory), and
Sarang Supekar (Argonne National Laboratory), who reviewed a draft of this report and provided
valuable comments.
This work was supported in part by the US Department of Energy, Office of Science, Office of
Workforce Development for Teachers and Scientists under the Science Undergraduate Laboratory
Internships program.

viii
EXECUTIVE SUMMARY
Many manufacturing processes require heat to produce finished products. However, a large percentage of
the heat used for the manufacturing operations is lost as low- (<450°F), medium- (450°F–1,200°F), or
high-temperature (>1,200°F) waste heat. Most of the waste heat is produced in the form of heat in exhaust
or flue gases discharged from heating systems. Heat content of the flue gases includes sensible and latent
heat that is produced from the combustion of fossil fuels such as natural gas. Reduction and reuse of this
waste heat can increase energy efficiency, reduce greenhouse gas emissions, and increase profits. Waste
heat in the low-temperature regime is especially promising because it accounts for more than 50% of
industrial waste heat. Facilities attempt to reduce waste heat (reduction), use low-temperature waste heat
within the same process (recycling), or use the heat outside the process in which it is generated
(recovery). In the case of heat recovery, waste heat can be used in a different heating process or for
conversion to electricity. However, significant barriers remain in implementing low-temperature waste
heat recycling or recovery because of challenges such as contaminants in the flue gases, material
corrosion related to condensate produced from water condensation, relatively low efficiencies, and long
payback periods.
An analysis was conducted to estimate the magnitude of low-temperature waste heat available in the US
manufacturing sector and to identify current and emerging low-temperature heat recovery technologies
and equipment. The primary focus of the analysis is on the industries that produce the lowest-temperature
waste heat: the chemical, primary metal, petroleum, nonmetallic mineral, fabricated metal, food, paper,
and wood industries. In addition to identifying the waste streams, their characteristics, and currently
available heat recovery technologies, the study also explored future research opportunities and economic
barriers for recovery technology implementation. Special attention was given to applicable heat to power
conversion technologies such as the organic Rankine cycle, thermoelectric conversion, and the
supercritical CO2 cycle. The study included investigations in research and new developments, including
turbine and heat exchanger cost for waste heat to power systems, size, efficiency, and intermittency of
waste heat streams.
Results indicate that recycling or reducing waste heat, when economically justified, should be the first
step since it is the most efficient and cost-effective in most cases. In this case, energy is not converted
from one form to another and synchronization of heat supply and heat demand is not essential. In most
cases, changes in the infrastructure are minimal and the project cost could be justifiable. When no good
option exists for use of heat for recycling or reduction, the organic Rankine cycle is often the most cost-
effective method for converting waste heat to electric power. Several new and emerging technologies are
being pursued for waste heat to power conversion; however, their industrial applications, particularly for
the low-temperature regime, could be several years away.

1-1
1. INTRODUCTION
1.1 WASTE HEAT IN EXHAUST GASES AND HEAT RECOVERY ISSUES
Discharge of low-grade waste heat at lower than 450°F from industrial facilities contributes to a large
amount of wasted energy, increase in CO2 or greenhouse gas emissions, and increased cost. This report
describes the results of several studies carried out by the US Department of Energy’s (DOE’s) Oak Ridge
National Laboratory (ORNL) and E3M, Inc., and it includes sources, amounts, and characteristics of
waste heat with details of current and emerging technologies to recover low-grade waste heat. The focus
of this study is the US manufacturing sector, based on available data and technology information for 2008
to 2011. The amount of low-grade waste heat, based on 120°F as a reference temperature, from the
manufacturing sector is about 1,180 TBtu per year, approximately 53% of the unrecovered waste heat in
industry.1 Although this waste heat is significant and could provide a good opportunity for recovery,
several challenges exist in extracting and collecting this heat, transporting it from the source of the waste
heat to the point of use, and using or transforming it to a usable form.
One way in which waste heat is recovered is by transporting the heat from the source (process or
equipment) to another process or equipment that can use the heat in thermal form. For example, as shown
in Figure 1-1, the waste heat from a heating process or heat source can be used for other applications such
as preheating water, producing low-pressure steam, space heating, and cooling through use of absorption
cooling technology. The exhaust heat, if at a high enough temperature, can also be used in another heating
process.
Figure 1-1. Application of waste heat recovery.
Technologies and systems to recover heat for the purposes mentioned are well established. In most cases,
heat recovery requires some type of heat exchanger; a large variety of direct and indirect heat exchanger
designs have been developed and used by the industries. Developments focus on reducing the size of the
equipment, using better materials, improving heat exchanger cleaning methods, and using advanced
methods for preventive maintenance. However, there is still considerable room for improvement in the
performance of the equipment, as well as cost reduction through improvements, innovations, or even
disrupting technologies.
Waste heat-to-power systems is another common recovery technology; Figure 1-2 illustrates a
generalization in which the waste heat stream is directed toward a heat to power conversion system. Many
options are available for actual configuration and hardware for the heat to power systems, including the
Heat recovery
(e.g., steam, hot
water, HVAC,
cooling)
Heating system
(e.g., furnaces, ovens,
heaters)
Fuel Heat in exhaust gas
Heated product
Ex., gas
Combustion air
Entering product

1-2
use of the Rankine cycle, or direct conversion of heat to electricity through the use of technologies such
as thermoelectric (TE) power generation.
Figure 1-2. Waste heat to power.
In Rankine cycle–based systems, as shown in the schematic diagram in Figure 1-3, 11 the waste heat
stream enters the power generation system and transfers its heat to the pressurized working fluid (water)
in the evaporator or “boiler” section. The working fluid is selected in such a manner that it can operate
within the temperature range available from the waste heat source. The working fluid is water in the case
of a steam Rankine cycle. In the case of the organic Rankine cycle (ORC), an organic fluid that can boil at
low temperatures, such as refrigerants, are used as the working fluid. With adequate temperature of the
waste heat stream and selection of proper working fluid, the system converts the working fluid into a
vapor, typically superheated, state. The high-pressure vapor enters a turbine, spinning the blades and
reducing the vapor pressure. The turbine connects to an electrical generator, which converts the
mechanical energy of turbine rotation into electricity. The low-pressure working fluid exiting from the
turbine enters the condenser, which uses water or air to cool the vapor, condensing it to a liquid. Finally, a
pump pressurizes the liquid to send it to the evaporator or boiler section and repeat the cycle.
Figure 1-3. Rankine cycle setup.
Heat recovery
(e.g., electricity
generation)
Heating system
(e.g., furnaces, ovens,
heaters) Fuel
Heat in exhaust gas
Heated product
Ex., gas
Entering product
Combustion air

1-3
Low-temperature power generation is a developing field with a large amount of research directed toward
developing efficient and low-cost components (e.g., heat exchangers, turbines, condensers). There are
many variations of the conventional steam cycle, such as Rankine cycle discussed previously, that are
used to generate electrical power, though all of them generally use a rotating turbine attached to a
generator to convert mechanical energy to electrical energy.
Another method of waste heat-to-power conversion is direct conversion using the Seebeck effect, named
after the inventor Thomas Johann Seebeck. Commonly known as TE power generation, when heat is
applied to the hot side of a TE generator and the cold side is maintained at as low of a value as possible,
electricity is produced (Figure 1-4). Almost any heat source at temperatures above 400°F can be used to
maintain hot side temperatures. Efficiency (expressed in terms of electric energy generated divided by the
amount of heat supplied) of a TE system is relatively low, usually in the range of 2% to 5%. 10
Figure 1-4. Thermoelectric generator technology.
Historically, the cost of thermoelectric power generation has been high because of limitations in material
knowledge and associated processing issues. Recent technology developments in material science and
advanced manufacturing techniques have demonstrated a high potential for reduced production costs.
However, for the foreseeable future, use of TE devices for waste heat recovery (WHR) in industries is not
considered practical because of their low efficiency and historically high initial costs. More details of the
technology and its application are discussed in Section 4.6.
Transporting heat to another process in the facility is highly efficient compared with waste heat-to-power
technologies. Because conversion between forms always results in a loss of energy, efficiency on heat
cycles is physically limited as described by the Carnot cycle. However, in many facilities, finding a use
for low-grade heat in other processes is difficult, but many processes in the facility can use electricity.
Waste heat to power is often the best option when the facility does not have another process that can use
the recovered heat.
This review of the advances in low-grade WHR technology provides information required by industries to
determine if WHR is worth the investment. The payback period, or the number of years for the savings
introduced by the new system to pay for its costs, is a useful decision-making criterion for WHR
implementation. Facility investment decisions are often made based on economic considerations rather
than environmental benefit reasons. In the past, the high cost of recovering waste heat in the low-
temperature range prevented industries from making investments in WHR. The present and future
research may result in new technologies with lower cost and higher overall energy conversion efficiency

1-4
for low-temperature WHR, increasing the cost-effectiveness and potentially the uptake by industry.
Additionally, the government considers environmental benefit and energy savings as important criteria in
the decision-making process. Thus, public policy could play a role in encouraging the uptake of the WHR
industry through considering energy and environmental benefits.
This report presents details of important factors in low-temperature heat recovery, currently available and
used WHR technologies, as well as emerging technologies that may allow wider use of low-temperature
WHR.

2-1
2. LOW-TEMPERATURE WASTE HEAT
This section discusses details of low-temperature waste heat in different industries, reporting the
magnitude of low-temperature waste heat (at <450°F) as characterized in the previous chapter. These
values should be considered rough approximations because of the assumptions, approximations, and age
of the data used for computation, but they do illustrate the general trends in waste heat generation from
various industrial processes. Three different approaches for estimating low-temperature waste heat for the
manufacturing sectors (NAICS [North American Industry Classification System] 311 to 339) resulted in
significant variation, from 905 TBtu/year given in a BCS, Inc. report2 to 1,182 TBtu/year given in a ICF
International report.1 Another approach using MECS data indicated that the low-temperature waste heat
could be between 1,084 and 1,637 TBtu/year (Refer Table 2-6). These differences could be due to using
different reference temperatures, assumptions made in estimates, and accounting for secondary low-
temperature heat from high-temperature heat sources after heat recovery is used. In any case, the amount
of recoverable or unrecovered low-temperature waste heat energy is a large percentage (50% to 60%) of
the total energy used in manufacturing. Despite the large amount of total energy, these sources have low
exergy, resulting in lower recoverable energy. Thus, these systems have a low efficiency than higher-
temperature systems.
Waste heat is recovered in three ways: by heating or preheating another process stream, converting it to
electricity, or recycling it back into the same process. In most industrial facilities, the low-grade waste
heat is converted into electricity since finding other processes that can use this low-grade waste heat is
difficult. Though conversion will inherently have energy losses, converting waste heat to power is
beneficial when economical, and continued research in this area is improving reliability and cost.
2.1 DEFINITION OF LOW-GRADE WASTE HEAT
Areas or subsystems that use energy in a manufacturing facility or an industrial plant produce waste heat.
In most cases, the important characteristics of waste heat are the form in which they are available (e.g.,
gas, liquid, or solid) and their temperature (low, medium, and high). The waste heat temperature
influences the analysis of waste heat sources and recovery; therefore, the temperature regimes for waste
heat–related discussions must be clearly identified. A BCS report2 prepared in 2008 identified three
temperature ranges to classify waste heat sources and opportunities; however, there is no general
agreement or basis for this definition of the temperature ranges. A later report (prepared in 2011 by E3M,
Inc. and ORNL3) expanded the temperature ranges on high and low ends of the spectrum. This allows for
the exploration and identification of waste heat use and R&D opportunities in temperature ranges below
250°F (ultralow-temperature) and higher than 1,600°F (ultrahigh-temperature), where it is difficult to
identify cost-effective WHR methods or equipment. Therefore, the report recognizes the following five
temperature ranges:
• Ultralow temperature: <250°F. The lower temperature for this range is usually the ambient
temperature or the temperature of a cooling medium such as cooling tower water or other water used
for cooling systems. The upper limit is based on several considerations, such as the condensation
temperature of combustion products or flue gases (usually below 180°F for natural gas combustion
products); the applicability of low temperature is based on nonoxidizing materials such as aluminum
or nonmetallic materials such as polymers or plastics, or the use of low-temperature WHR systems
such as heat pumps.
• Low temperature: 250°–450°F. Waste heat in this temperature range is available in hot gases
discharged from ovens, heaters, and so on, and in the form of steam, hot products, hot surfaces, and
so on.

2-2
• Medium temperature: 450°–1,200°F. Waste heat in this temperature range is available in
combustion products, hot gases discharged from ovens, heaters, and so on. It is in the form of hot
surfaces in certain equipment such as cement kilns, liquid metal ladles, and glass melting furnaces.
• High temperature: 1,200°–1,600°F. This is the normal definition of the high-temperature range
based on availability of equipment and material. However, the BCS report defined >1,200°F to be
“high.” This BCS range is based on contacts with the industry and WHR equipment suppliers; we
suggest that the high-temperature range be divided in two temperature ranges. Waste heat available
from hot gases discharged from ovens, furnaces, incinerators, and so on fall under this temperature
category.
• Ultrahigh temperature: >1,600°F. WHR from streams above 1,600°F requires use of special high-
temperature materials that can be metallic or nonmetallic, such as ceramics. Selection of material and
equipment design becomes critical in many cases; as waste heat streams at such high temperatures
contain a large number of contaminants.
This report discusses the ultralow- and low-temperature ranges (i.e., temperature below 450°F) of waste
heat and we will use the term “low-temperature” to simplify the discussion in this report.
2.2 SOURCES AND CHARACTERISTICS OF LOW-GRADE WASTE HEAT
A large source of low-temperature waste heat for most industries includes hot gases or air from heating
systems such as boilers, heat treat ovens, dryers, fired heaters, hot solids leaving a furnace or oven and hot
liquids from process heat exchangers and other cooling systems. Waste heat in the form of exhaust gases
is readily recognized but the heat content of solids discharged from heating equipment and hot liquids are
often ignored.
Some of the low-temperature waste heat in different forms and sources include the following:
i. Waste heat sources in low-temperature gases such as air and steam include heat from compressed
air, vented steam leaks, HVAC exhaust air, and more.
ii. Waste heat in liquids include heat from cooling water, heated wash water, and boiler blow-down
water.
iii. Low-temperature waste heat in solids includes heat contained or emitted from hot products that
are discharged after processing or after reactions are completed, material handling systems such
as baskets, trays, conveyors etc.
iv. Other sources that are less obvious include hot by-products, such as ash or slag from processes or
combustion of solid materials, radiation from heating systems (e.g., ovens, furnaces), and furnace
walls.
In addition to the mentioned sources, electric systems (e.g., electric motors, electrical transmission lines,
transformers, switch gear) and cooling systems (e.g., cooling towers, liquid coolers, or heat exchangers
using ambient air, cooling ponds) are also sources of low-temperature waste heat. The total amount of
heat discharged in these forms is very large; however, recovering and using the heat can be difficult at
economically justifiable means.
Additional sources of low-temperature waste heat outside the heating equipment include the following
plant energy systems:
2-3
i. Steam systems, including steam generators or boilers, steam distribution, use or end-use, and
condensate return systems
ii. On-site power generation using internal combustion engines, gas turbines, micro turbines, steam
turbines, fuel cells, and so on
iii. Compressed air systems (compressors, air distribution, and end-use), which may use electric
motors, steam drives (i.e., steam turbine), or reciprocating engines to drive compressors
iv. Air conditioning and cooling systems used as part of manufacturing or the plant HVAC facilities
v. Plant facilities, including centralized heating – cooling facilities, on-site transportation, and other
energy systems
Regardless of the type of application, there is always some energy loss associated with these systems.
Most of these losses are in the form of sensible heat. However, a few sources, such as moist air and steam,
may contain latent heat as a large percentage of the total heat content of the waste heat. Other sources of
waste heat (e.g., gases from reactors, gasifiers, ore reduction processes) may contain heat in the form of
chemical or reactive component heat, but it is not always possible to recover this heat in a practical and
economically viable way. The following sections briefly describe some of the major low temperature
waste heat sources.
Industrial Furnaces, Ovens, Heaters, and More
Industrial furnaces and other similar equipment (e.g., ovens, heaters, dryers) are typically fuel-fired
systems used in manufacturing facilities. These systems transfer heat to the charge material, generated
from combustion of different types of fuels such as fossil fuels, byproduct gases, liquid fuels (fuel oils),
and solid fuels (coal, biomass, solid waste). Furnaces discharge flue gases or combustion products
(occasionally mixed with additional air or moisture) as waste heat. Electricity is also a source of heat,
with no locally produced combustion products; however, these furnaces still discharge waste heat in the
form of hot and possibly humid air that is required for process safety or ventilation. This equipment
operates in a very broad temperature range, from as low as 250°F to as high as 3,000°F, discharging waste
heat in the same or lower temperature range. Depending on the process carried out within the heating
equipment, flue gases may contain combustion products or various additional components, referred to as
“contaminants.” These gases are discharged at temperature higher than the condensation temperature of
the moisture content. This maintains the gas temperature at or above 150°F. Much of the heat content of
discharged gases is in the form of latent heat of the moisture. Selection and use of waste heat recovery
equipment depends on several factors, such as temperature, flow rate, and quality of the gases; a process
heating source book4 provides more information on process heating equipment use and operation.
Boilers—Steam Generators
Manufacturing plants often rely on boilers for steam generation for use in a plant or to produce electrical
power. Boilers use fossil fuels, such as natural gas, coal or by-product fuels, to supply necessary heat for
steam production. More information on boiler types, sizes, and operating practices are given in the Steam
System Survey Guide.5 For large boilers, it is common to use the economizers that preheat boiler feed
water by recovering portion of the exhaust gas heat and, in some cases, combustion air preheaters to
recover more heat from the exhaust gases. However due to potential corrosion issues, the exhaust gas
temperature is typically maintained between 150°F to 250°F. The exact temperature depends on sulfur
content of the fuel. A special class of boilers, heat recovery steam generators (HRSGs), use the sensible
heat of exhaust gases from prime movers such as gas (combustion) turbines or large reciprocating

2-4
engines. These boilers operate within a narrow temperature range of 300°F to 500°F, with a flue gas
oxygen content of 2% to 5%, making it easy to identify heat recovery systems and estimate recoverable
heat.
Gas (Combustion) Turbines
Industry uses gas turbines, also known as “combustion turbines,” for power production or as part of
combined heat and power (CHP) systems that deliver electrical power and steam, usually within large
energy user complexes such as petroleum refineries, paper mills, and chemical plants. Gas turbines
produce electrical power, measured in megawatts, and deliver exhaust gases in a temperature range of
700°F to 950°F. Most gas turbine installations use HRSGs to recover part of the exhaust gas heat. Flue
gases from HRSGs are in the temperature range of 300°F to 450°F and may contain 3% to 5% oxygen
(more information on gas turbine–based HRSG installation is available from the US Environmental
Protection Agency6). As with boilers, it is possible to recover this low-grade heat by using some of the
technologies discussed in Section 4.
Reciprocating Engines
Reciprocating engines are used as prime movers for driving rotary equipment, such as compressors,
pumps, electric generators. They use natural gas or diesel fuel and discharge waste heat in three forms.
About 30% of the heat input is lost in exhaust gases at a temperature higher than 700°F. The other two
forms of waste heat are engine jacket coolants and lubrication oil cooling systems. These two sources of
heat are at about 275°F to 450°F. More information on reciprocating engines is given by the US
Environmental Protection Agency.6 Reciprocating engines are well suited for CHP in commercial and
light industrial applications of less than 5 MW. Smaller engine systems produce hot water and larger
systems can produce low-pressure steam. Multiple reciprocating engines can be used to increase system
capacity and enhance overall reliability.
Microturbines
Microturbines are small, compact, lightweight combustion turbines that typically have power outputs of
30 to 300 kW and use a variety of fuels, including natural gas and liquid fuels. A heat exchanger recovers
thermal energy from the microturbine exhaust to produce hot water or low-pressure steam. Exhaust gas
temperature from a microturbine depends on the degree of heat recovery. In designs with a recuperator to
preheat intake air, the exhaust gas temperate is only about 260°F; without a recuperator, the exhaust gas
temperature is about 500°F.7 The thermal energy from the heat recovery system can be used for potable
water heating, absorption cooling, desiccant dehumidification, space heating, process heating, and other
building uses.
Fuel Cells
Fuel cells are an emerging technology with the potential to serve power and thermal needs with very low
emissions and high electrical efficiency. Fuel cells use an electrochemical or battery-like process to
convert the chemical energy of the oxidation of a fuel (typically hydrogen into water) into electricity. The
hydrogen can be obtained from processing natural gas, coal, methanol, and other hydrocarbon fuels. As a
less mature technology, fuel cells have high capital costs, an immature support infrastructure, and
technical risk for early adopters. However, the advantages of fuel cells include low emissions and noise,
high power efficiency over a range of load factors, and modular design.

2-5
For industrial heating processes, the temperature of exhaust gas or air depends on the process operating
temperature, heating system design, and operating practices. Table 2-1 shows the most common sources
of low-temperature waste heat sources, their temperature range, and the cleanliness of these gases. 3
Table 2-1. Temperature range and characteristics for low-temperature industrial waste heat sources.
Waste heat source* Temperature range Cleanliness
Oven, dryer-type heating system exhaust gases 250°F–500°F Varies
Reciprocating engines Jacket cooling water 190°F–200°F Clean
Reciprocating engines exhaust gases (for gas fuels) 400°F–1,100°F Mostly clean
Hot surfaces 150°F–600°F Clean
Compressor after-inter–cooler water 100°F–180°F Clean
Hot products 200°F–2,500°F Mostly clean
Steam vents or leaks 250°F–600°F Mostly clean
Condensate 150°F–500°F Clean
Emission control devices—thermal oxidizers and so on 150°F–1,500°F Mostly clean
Cooling water from cooling systems 120°F–250°F Mostly clean
*This does not include sources at lower than 120°F. This includes gases or liquids from condensers, HVAC exhaust air, water
from washing systems in the food industry, and more.
As mentioned earlier, low-temperature waste heat is discharged in many different forms depending on the
heat source. Commonly available forms include sensible heat in solids, liquids, and gases; latent heat of
fusion or melting; heat of condensation; and chemical heat as combustible gases, vapors, solids (see Table
2-2).
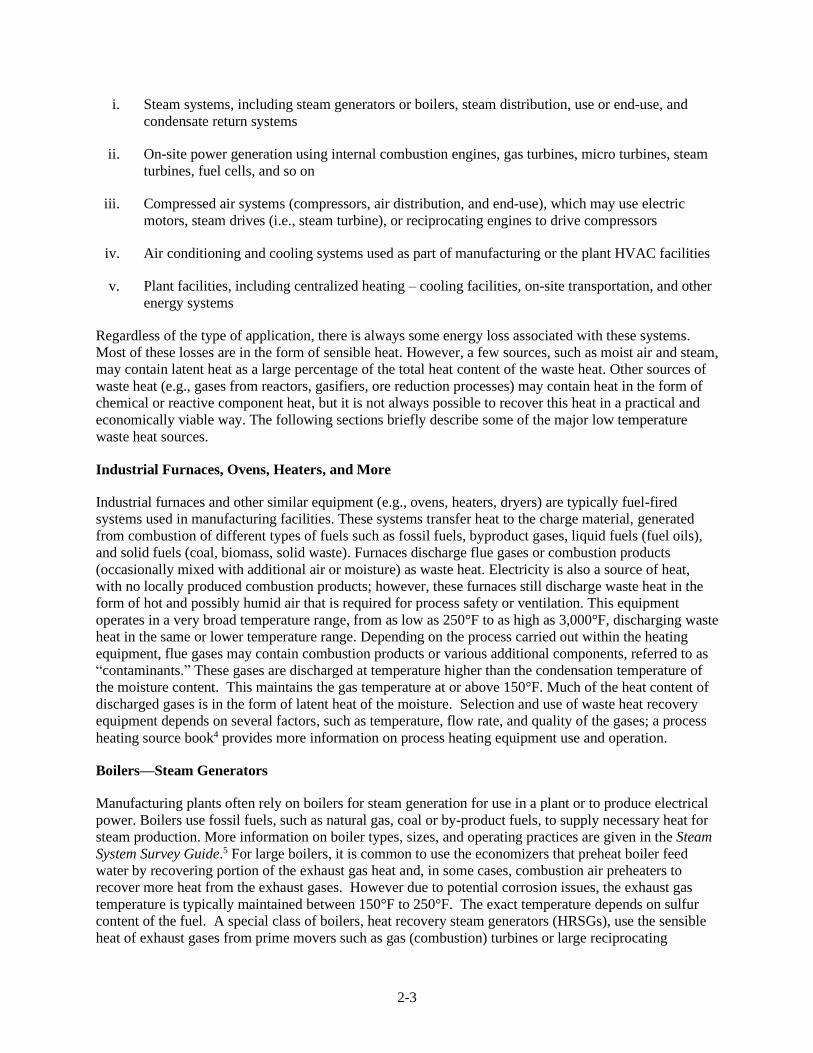
Different industries generate and discharge waste heat from different sources in a variety of forms. The
quality and amount of the waste heat determines the possibility of heat recovery and type of equipment
needed. Table 2-3 provides a summary of types of low- and ultralow-temperature heat from different
industries. Low-temperature waste heat is produced in all industries, despite industries having widely
varied process temperatures. For example, industries such as steel, glass, and cement use a very high-
temperature material processing; however, because of the use of heat recovery systems, the final waste
stream (mostly in the form of flue gases) is at a low temperature because of thermodynamic and economic
limitations of heat recovery systems used in these industries.
The amount of waste heat depends on the energy or heat input, and composition and temperature of the
waste stream. The manufacturing sector uses hundreds of different processes and several types of
processing systems or equipment for each process. Additionally, production rate or processing rate for the
equipment changes to meet production requirements. Hence, knowledge of waste heat characteristics as
well as annual energy use data is required to estimate the total amount of waste heat available.
The following section discusses various approaches used to estimate low-temperature waste heat,
including a review of available information and calculations based on other information.

2-6
Table 2-2. Common discharge sources of waste heat and their forms from various energy systems used in a
manufacturing plant.
No. Waste heat source
Sensible-
latent heat
content in
gases or
air
Chemical
heat
content in
gases
Sensible
heat in
liquids
Sensible
heat in
solids
Exothermic
heat of
reaction
Radiation/
convection
from hot
surfaces
Heat in
steam or
condensable
vapors
1 Fuel-fired boilers
or steam generators X X X X
2
Steam systems,
including
distribution, use,
and condensate
return
X X
3
Industrial heating
equipment such as
furnaces, heaters,
ovens, and dryers
X Maybe X X X X Maybe
4
Other heating
systems (e.g.,
thermal oxidizers,
evaporators,
distillation
columns, ladle
heaters)
X Maybe X Maybe X X
5
Power generation
equipment such as
combustion
turbines, steam
turbines, and
internal
combustion
engines
X X X X
6
Prime movers such
as fuel fired
internal
combustion
engines to drive
compressors, and
pumps
X Maybe X Maybe
7
Compressed air or
gas systems that
use intercoolers or
after-coolers
X X
8
Building heating
and cooling
(HVAC) systems
X X
Source: Arvind Thekdi (E3M, Inc.)
2-7
Table 2-3. Summary of types of low- and ultralow-temperature heat from different industries.
Low-temperature waste heat
source Steel Al. Glass Paper
Pet.
refining Mining Chemical Food Cement Coating
Steam
gen. CHP
1. The exhaust gases or
vapors
1a. Low-temperature
combustion products (low O2
content)—clean
L L L L L UL L L
1b. Low-temperature flue
gases or combustion products
(low O2 content) with
contaminants
L L
1c. Heated air or flue gases
containing high (>14%) O2
without a large amount of
moisture and particulates
UL UL L UL L L
1d. Process gases or by-
product gases/vapors that
contain combustibles
UL L
1e. Process or makeup air
mixed with combustion
products, large amount of
water vapor or moisture
UL L
1f. Steam discharged as vented
steam or steam leaks L L L L L L L
1g. Other gaseous streams
2. Heated water or liquids
2a. Clean heated water
discharged from indirect
cooling systems
UL UL UL UL
2b. Hot water that contains
presence of large amount of
separatable solids
UL UL UL UL UL
3. Hot products
3a. Hot solids that are air-
cooled after processing L L L UL L UL L UL L UL
3b. Hot liquids/vapors that are
cooled after thermal processing L L L
4. High-temperature surfaces
4a. Furnace or heater walls UL UL L UL UL L
4b. Extended surfaces or parts
used in furnaces or heaters UL UL UL UL UL
L: low temperature (250°F–450°F), UL: ultralow temperature (<250°F), Source: Arvind Thekdi (E3M, Inc.)
2.3 LOW-TEMPERATURE WASTE HEAT AVAILABILITY
Waste heat from manufacturing plants is discharged in a broad temperature range as shown in Table 2-1.
Most of this waste heat is in the form of exhaust or flue gases, or steam and condensate from heating
equipment and processes. Two major reports have studied low-temperature waste heat availability,
estimating low-temperature waste heat to be approximately 53%1 and 61%2 of the total unrecovered waste
heat. The estimates presented by these reports are different because of the different assumptions such as
reference temperatures and energy users.

2-8
The source suggesting 61% is from a 2008 BCS report. This report analyzed industrial processes using a
large amount of energy and reported estimates of waste heat in low-, medium-, and high-temperature
ranges. Unrecovered waste heat availability was reported at reference temperatures of 77°F and 300°F.
Total recoverable low-temperature waste heat, defined as 450°F and lower, accounted for approximately
908 TBtu/year (using 77°F as a reference temperature). This is based on the total unrecovered waste heat
of 1,478 TBtu/year, and the low-temperature waste heat being about 61% of the total unrecovered waste
heat.
The other source (prepared by ICF International)1 gives values of low-temperature waste heat as 570
TBtu/year for temperatures lower than 300°F and 612 TBtu/year for temperatures between 300°F and
450°F, totaling to 1,182 TBtu/year for low temperature as defined in this report. This heat represents 53%
of the estimated total waste heat available (2,240 TBtu/year). The ICF report used 120°F as reference
temperature, possibly contributing to the higher total waste heat estimate than reported by the BCS report.
Additionally, the BCS report included only the major energy user sectors and not all industrial sectors.
Additionally, it is unclear if either of the references accounted for residual or secondary low-temperature
heat. The recovery of medium- and high-temperature waste heat usually results in the production of lower
temperature streams due to economical or thermodynamic limitations of the heat recovery equipment
used. This low-temperature waste heat stream is usually not used and is discharged into the atmosphere.
Table 2-4, as taken from the ICF report, shows waste heat sources from different industries and the
energy content of the waste heat by temperature ranges. This table includes all manufacturing sectors
(NAICS 311 to 339) reported in Manufacturing Energy Consumption Survey (MECS) report published by
the US Energy Information Administration (EIA) of DOE. Assuming that the secondary waste heat is not
included in the low-temperature waste heat values shown in Table 2-4, these values were used to estimate
the total amount of low-temperature waste heat generated (as shown in Table 2-5). An average heat
recovery equipment effectiveness or capability of high-temperature WHR systems is assumed to be 60%,
meaning the remaining 40% is still available as low-temperature heat. Based on this assumption, the total
additional low-temperature heat as secondary waste heat can be 425 TBtu/year (370.4 + 54.4 TBtu/yr).
Accounting for this heat, the total amount of estimated low-temperature waste heat is about
1,600 TBtu/year, or 71.6%. of the total reported in Table 2.4.
Table 2-4. Waste heat sources and temperature ranges.
Industry
Energy content (TBtu/yr) by temperature*
<300°F 300°F–450°F 450°F–1,200°F >1,200°F Total
(TBtu/yr)
311: Food manufacturing 3.70 28.30 19.20 - 51.20
312: Beverage and tobacco product
manufacturing 0.20 1.60 0.20 - 2.00
313: Textile mills 10.30 1.90 0.40 - 12.60
314: Textile product mills - - - - 0.00
315: Apparel manufacturing 1.10 - - - 1.10
316: Leather and allied product
manufacturing - 0.00
321: Wood product manufacturing 46.80 42.80 4.40 - 94.00
322: Paper manufacturing 50.30 97.00 5.30 - 152.60
323: Printing and related support activities 15.50 3.20 3.40 1.10 23.20
324: Petroleum and coal products
manufacturing 86.40 114.20 658.10 5.60 864.30

2-9
Industry
Energy content (TBtu/yr) by temperature*
<300°F 300°F–450°F 450°F–1,200°F >1,200°F Total
(TBtu/yr)
325: Chemical manufacturing 112.80 80.40 108.30 22.90 324.40
326: Plastic and rubber products
manufacturing 7.90 2.40 0.60 0.50 11.40
327: Nonmetallic mineral product
manufacturing 19.50 48.10 105.70 18.90 192.20
331: Primary metal manufacturing 142.70 56.80 7.20 87.20 293.90
332: Fabricated metal product
manufacturing 49.50 114.80 9.80 - 174.10
333: Machinery manufacturing 7.40 5.70 1.30 - 14.40
334: Computer and electronic product
manufacturing 3.10 2.20 - - 5.30
335: Electrical equipment manufacturing 2.00 1.40 0.30 3.70
336: Transportation equipment
manufacturing 6.20 7.40 1.10 - 14.70
337: Furniture and related product
manufacturing 2.10 1.90 0.50 0.10 4.60
339: Miscellaneous manufacturing 2.10 2.00 0.50 0.10 4.70
Total energy content (TBtu/yr) 570 612 926 136 2,244
* Reference temperature of 120°F
Table 2-5. Estimated additional low-temperature waste heat.
Energy content (TBtu/yr) by temperature range
<300°F 300°F–450°F 450°F–1,200°F >1,200°F Total
(TBtu/yr)
Waste heat (TBtu/year) 570 612 926 136 2,244
Percentage at lower temperature 100% 100% 40% 40%
Low-temperature heat 570 612 370 54 1,606
Low-temperature heat as a percentage of total waste heat 71.6%
Alternate Analyses
The described estimates of low-temperature waste heat were supplemented with two approaches. One was
based on process information, termed “bottom-up analysis,” and included analysis of commonly used
thermal processes in manufacturing and their operating data, specifically operating temperatures. The
second approach, termed “top-down analysis,” was based on extensive energy use data available from
EIA in the form of the 2010 MECS. 8
Bottom-Up Analysis
In this approach, a list of commonly used industrial heating processes was developed and arranged by
NAICS code so they could be associated with specific industries in 3- to 5-digit format. The list includes
data such as the process name, NAICS code, type of waste heat, operating temperature range (higher and
lower) for the process, and type of energy used (see Appendix A for the full list). For each process
information such as process and flue gas exit temperature, type of energy used, and estimated flue gas
2-10
analysis (e.g., particularly oxygen content, moisture content of flue gases) can be used to calculate
available heat (percentage of heat remaining in the process system) and flue gas loss as a percentage of
the total heat input of the process. This gives us magnitude of waste heat per unit of heat input. However,
total quantity or magnitude of waste heat cannot be calculated without knowledge of total energy use or
heat energy input data, which could not be obtained at this time. MECS data cannot be directly applied to
determine energy use for specific processes, even when such data is available for 5-digit NAICS codes.
Therefore, we decided to take a second approach that allows the use of MECS data to get information on
total energy use for the processes under consideration and apply the exhaust gas heat loss.
The above calculations consider only the recoverable heat from flue gases as practiced by the industry at
this time. It does not consider possible recovery from other waste heat sources such as wall loss, opening
loss, heat content of hot material discharged from a heating equipment, cooling systems (where used) etc.
In most cases the heat loss (except heat content of the heated or processed material) is less than 5% of the
total heat input. Some of the exceptions where the surface or skin heat loss exceed 5% include cement
kilns, glass melting furnaces, liquid metal handling equipment (ladles) etc. None of the reports cited for
waste heat sources and recovery (BCS and ICF) consider these waste heat sources.
Top-Down Analysis
This approach, based on the MECS8 report, uses energy consumption values for many manufacturing
plants reported in 3- to 5-digit NAICS codes. The analysis, given in Appendix B, is based on energy use
data contained in the 2013 edition of the MECS report, which uses data collected in 2010 from
manufacturing plants. The report provides energy use in manufacturing in various categories:
1. Conventional boiler energy use
2. CHP and/or cogeneration process
3. Process heating
4. Other
After reviewing each manufacturing area that had energy use data (available for NAICS 311 to 339,
ranging from 3- to 5-digit levels of specification), we estimated the quantity of low-temperature waste
heat for each of the four categories. This estimate was based on thermal process operating parameters,
particularly the exhaust gas temperature and presence of excess air, moisture, or other heat-carrying
materials (i.e., combustible gases), which can be used to calculate approximate available heat. The value
of available heat was used to calculate waste heat loss as a percentage of the total energy used for the first
three categories.
1. For conventional boilers, an average flue gas temperature of 400°F with 2% to 4% oxygen (dry basis)
was used. This provides an average available heat of approximately 82.5%. The waste heat (100%–
82.5%) is then 17.5% of the heat used for the boilers. This is a broad assumption but is reasonably
valid for a quick analysis.
2. For CHP, there are at least three options: CHP using a high-pressure steam boiler with the use of a
steam turbine generator system; use of a combustion turbine followed by an HRSG; and use of
reciprocating engines for production of power with heat recovery in the form of hot water or steam
generation. Out of these three options, the first two are the most prevalent in manufacturing plants.
Once again, we assumed that these boilers or HRSG units discharge waste heat at about 350°F with
4% to 6% oxygen in flue gases resulting in available heat of 82.5% or heat loss of 17.5% of the
boiler–HRSG heat input.

2-11
3. For the process heating category, energy use for each NAICS sector was individually evaluated for
exhaust gas temperature range and flue gas analysis that can be used to estimate available heat and
hence the energy loss. This was a very qualitative approach based on the author’s (Arvind Thekdi’s)
experience as well as review of available data such as (i) type of equipment used (e.g., furnace,
heater, oven dryer), (ii) presence of excess air used for safety concerns as in the case of drying ovens,
(iii) presence of water vapor that will reduce available heat and increase waste heat, and (iv) use of a
heat recovery device such a convection section. Available heat values were derived by using available
heat calculators and verified by using a reference commonly used by the equipment designers and
users.9
4. Waste heat discharged from reciprocating engines and other prime movers was not accounted for.
Although some of these engines may have been accounted for under CHP equipment, prime movers
can also drive compressors, pumps, and other process equipment, and waste heat from these units is
difficult to estimate.
5. The most difficult decision was related to the use of a category listed as “Other” in the MECS report.
Much of this can be energy used in the form of by-product energy sources (by-product gases
produced in chemical, petroleum, and steel industries) and other energy sources (waste products used
in the forest products sector such as pulp-paper and lumber industry, or bio-fuels). Two cases were
analyzed: the “without other” case assumed that none of this energy produces any waste heat and the
“with other” case assumed that 10% of this energy is available as low-temperature waste heat.
Although there is no verifiable basis for either one of these assumptions, both values are reported in
Table 2-6 to provide an estimated range of low-temperature waste heat.
6. All fired heating systems, including boilers and HRSGs, result in low-temperature waste heat since
even the most advanced heat recovery system (economizers, convection heaters, regenerative burners,
regenerators, and recuperators) discharge hot gases at minimum of 350°F or higher. The calculations
assume that each of these waste heat sources is a potential low-temperature waste heat source.
Table 2-6. Estimate of low-temperature waste heat based on top-down analysis.
Waste heat from manufacturing sector NAICS 311 to 339
NAICS range Without other* (TBtu/year) With other* (TBtu/year)
311 to 316 156 169
321 to 322 133 299
323 to 327 603 903
331 to 339 192 265
Total 1,084 1,637
*Other refers to energy use category identified as “Other” in MECS report
Comparisons of results from this approach gave a total low-temperature waste heat range between 1,084
and 1,637 TBtu/year compared with the previously reported values from EIA MECS as 1,182 to
1,606 TBtu/year. Considering the assumptions made in the analysis values of usable waste heat, these are
comparable. More accurate values could be obtained by a detailed analysis of thermal processes used,
heating equipment used, and the process operating parameters used.

3-1
3. LOW-TEMPERATURE HEAT RECOVERY TECHNOLOGY
Introduction
Industry uses many different technologies and associated equipment to recover heat in manufacturing
plants. Heat recovery from low-temperature streams can be divided into two categories: (i) conventional
and currently used technologies, and (ii) emerging or new technologies. This section discusses
conventional or current technologies.
3.1 HEAT EXCHANGERS
There are several types of heat exchangers, each designed and sized to meet specific requirements of a
process or system. All of them transfer heat from a higher-temperature stream to a lower-temperature
fluid stream, which is a common and well-established configuration. Although heat exchangers have been
used by industry for many decades, innovation continues with several new designs introduced as modified
older designs or designs with added performance enhancement features. Heat exchangers can also recover
heat from process streams containing otherwise wasted heat. This section discusses heat exchanger
designs and performance related to WHR from process streams or other areas with waste heat. Several
type of heat exchangers can be used for WHR. Some of the most common and widely used heat
exchangers include the following:
• Shell and tube type heat exchangers
• Plate-and-frame type compact heat exchangers (CHEs)
• Spiral heat exchangers
• Recuperators, which can be considered as a subclass of the above three heat exchangers
• Regenerators for recovery of sensible and latent heat from gases
• Condensing heat exchangers, including noncontact and direct contact designs
• Desiccant-type heat exchangers for gases with water vapor content
The major performance indicator of heat exchangers, “effectiveness” (i.e., efficiency), is defined as the
ratio of actual heat transfer rate, qactual (Btu/h), to maximum possible heat transfer rate or heat availability
qmax (Btu/h). For a gaseous or liquid medium, these are defined as
qactual = Ch * (Thout − Thin) = Cc * (Tcin − Tcout)
qmax = Cmin * (Thin − Tcin)
∈=𝑞𝑎𝑐𝑡𝑢𝑎𝑙
𝑞𝑚𝑎𝑥
where
Ɛ = effectiveness (nondimensional)
Thout = temperature of the outgoing hot-side fluid
Thin = temperature of the incoming hot-side fluid
Tcin = temperature of the incoming cold-side fluid
Tcout = temperature of the outgoing cold-side fluid
Ch and Cc are total heat capacities of hot and cold fluid, respectively. They are defined as
Ch = mh * cph and Cc = mc * cpc

3-2
mh = mass flow rate (lbm/hr) of hot fluid
mc = mass flow rate (lbm/hr) of colder fluid
cph and cpc = specific heats (Btu/[lbm-°F]) of hot and cold fluids, respectively
In addition to the effectiveness, several additional operating parameters affect the final selection of the
heat exchanger:
• Pressure drop through the heat exchanger on the hot and cold sides of the heat exchanger
• Part load or flow rate performance measured in terms of effectiveness and temperature of the heat
exchanger components
• Potential deterioration of performance by contaminants such as the particulates and corrosive fluids
• Ease of cleaning the heat exchangers to maintain its performance
• Initial cost and operations and maintenance (O&M) cost
Shell and Tube Heat Exchangers
Shell and tube heat exchangers are the “workhorse” of industries such as the chemical industry, food
industry, and petroleum refining industry, and are extensively used for process heat transfer and heat
recovery applications. Many suppliers offer shell and tube heat exchangers as a custom unit for a specific
application or as a standard design.
A typical shell and tube heat exchanger consists of several tubes contained and sealed in a cylindrical
shell. The tubes and shell have various potential configurations and can contain additional heat transfer
enhancement devices such as baffles and fins. Figure 3-1 shows two typical designs of shell and tube heat
exchangers.
Figure 3-1. Typical single-pass and multiple-pass (U-tube) shell and tube heat exchangers.
Courtesy: Chemical Engineering World Blogspot.

3-3
The fixed tube design consists of many tubes that carry one type of fluid (e.g., hot fluid). The shell
contains the tubes and the flow of another (cold) type of fluid. The tubes connect to a tube sheet on the
front and back sides of the shell to isolate the tube-side fluid from the shell-side fluid. The shell-side
(cold) fluid flows into the shell, usually on the exit side of the tubes (hot fluid), to provide counter-current
flows that give higher heat transfer rates (see Figure 3-1). The shell may contain baffles, arranged in a
variety of configurations, to provide different flow patterns for the shell-side fluid and enhance heat
transfer on the shell side. The shell- and tube-side fluids may be at different pressures.
For a U-tube heat exchanger, the tubes are in a U shape. Tube-side fluid entry and exit are on the same
side of the heat exchanger using only one header. A tight baffle separates the incoming and exiting tube-
side fluid. The shell-side configuration is very similar to the fixed tube sheet design.
Shell and tube heat exchangers offer several advantages over other types of heat exchangers. They can be
used for high pressures, with a large pressure differential between the shell side and tube side, simple
design, easy maintenance, and proven design used by the industry for many years.
Performance of the heat exchanger, measured in terms of its effectiveness or efficiency, depends on
several factors, including the type of fluids (e.g., liquid, gas, condensing vapors, vaporizing liquids), their
pressure and temperature, heat exchanger design features such as the tube- and shell-side flow
configuration, type and configuration of baffles, and tube-side heat transfer enhancement. Typical shell
and tube heat exchangers have an effectiveness of 40% to 60%.
For waste heat recycling or recovery applications in which the waste heat source (such as lower-pressure
steam or vapors) heats higher-pressure liquids (such as water), the waste heat source is introduced on the
shell side, and the liquid is passed through the tubes. This configuration is typical for two reasons. The
tubes are stronger than the shell, making them more suitable for high-pressure liquids. Additionally, it is
easier to clean the tube side than the shell side, keeping the heated products (fluids) cleaner. If the tube
side is used to cool waste sources, such as vapors or steam, condensate could form on the inside of the
tube, causing flow irregularities and leading to problems with the exchanger.
These heat exchangers, when used for recovering heat from hot gases to heat water or other liquids, have
a relatively low effectiveness or efficiency due to a large difference in heat transfer coefficient on the gas
side. Heat transfer enhancements can improve effectiveness by using finned tubes and proper placement
of baffles (to develop a fluid flow pattern that increases heat transfer) and by promoting vapor
condensation on the shell side. The heat exchanger effectiveness is higher when the heat exchanger
transfers heat to liquids from other liquids or steam. Then, the heat transfer coefficients on both sides of
the heat transfer surface (tubes in this case) can be comparable, resulting in relatively higher overall heat
transfer coefficient.
There are several common heat sources and applications for WHR using shell and tube type heat
exchangers:
1. Condensates from process steam, distillation processes or refrigeration, and air-conditioning systems
2. Coolants from engines, lubricants, bearings, air compressors, furnace doors, pipes, and grates
3. Flue gas streams and exhaust gas streams from furnaces, dryers, ovens, and boilers and exhaust stacks
from fired heating systems
4. Quench oil from heat treating furnaces

3-4
With a few notable exceptions, most low-temperature heat exchangers are constructed from cast iron or
copper tubes. The tubes may have aluminum or copper fins pressed in, soldered, or welded on the tubes.
Several new features have been incorporated, such as special fin design for finned tube heat exchangers
and rendering of tube-on-plate condensers with a Coanda-effect louver design that allows air to flow in
waveform. These improvements offer higher heat transfer rates. The advantages and disadvantages of
shell and tube heat exchangers are summarized in Table 3-1.
Table 3-1. Advantages and disadvantages of shell and tube heat exchangers.
Advantages Disadvantages
Widely known and understood since it is the most
common type
Less thermally efficient than other types of heat transfer
equipment
Most versatile compared to other exchangers in terms
of types of service
Subject to flow-induced vibration, which can lead to
equipment failure
Widest range of allowable design pressures and
temperatures
Not well suited for temperature cross-conditions
(multiple units in series must be used)
Rugged mechanical construction can withstand
substantial physical and process use
Contains stagnant zones (dead zones) on the shell side,
which can lead to corrosion problems
Subject to flow maldistribution, especially with two
phase inlet streams
Plastic Heat Exchangers
Metal heat exchangers are subject to corrosion, oxidation, and microbiological attacks. Common chemical
water treatments can adversely affect metal heat exchangers, causing slow degradation and loss in heat
transfer capacity.
New plastic heat exchanger technology, developed by several suppliers, offers an alternative to metal heat
exchangers. The use of specialized plastics for heat exchanger tubing provides effective energy transfer in
most applications. Some suppliers claim that the heat transfer capacity of plastic tubing is comparable to
that of copper heat exchangers, and that the transfer rate remains consistent for both heating and cooling.
These heat exchangers are not subject to corrosion, oxidation, microbiological attacks, or galvanic action,
thereby allowing plastic heat exchangers to function effectively under conditions in which conventional
systems would not survive. Additionally, friction or contact between coils during operation is not an issue
for the plastic for two key reasons: the coils naturally dampen the vibrations in the system, and the tube
material surface is smoother, permitting little friction between tubing rows even if they do come in
contact. Additionally, plastic is lightweight and the surface of plastic tubing is smoother than copper and
resists the buildup of material deposits, which can restrict both fluid and airflow through and around the
coils. If an internal buildup does occur, flushing at a moderate pressure can remove buildup from the
plastic.
Despite their significant advantages, plastic heat exchangers are not suitable for all applications: they
cannot be used for high pressure, for high temperature, or with refrigerants. Plastic is not a suitable heat
transfer media for systems with operating temperatures higher than 220°F or pressures higher than
150 psi. Finally, plastic cannot be used with any gaseous systems because it does not serve as a sufficient
vapor barrier.

3-5
Noncondensing Feed Water Economizers
Noncondensing feed water economizers, a special class of shell and tube heat exchanger, recover heat
from boiler flue gases to preheat boiler feed water. Noncondensing economizers cool combustion
products to a temperature at which condensation of water content in flue gases is prevented. Generally,
when using noncondensing economizers, sensible heat of water vapor is recovered from flue gas and the
boiler efficiency increases by 1% for every 40°F reduction in flue gas temperature.12 However,
condensation of water vapor in flue gas allows for both sensible and latent heat recovery and provides
much larger benefits, often reducing fuel requirements by 5% to 10%.
Figure 3-2 shows a conventional noncondensing economizer in which boiler flue gases flow around coils
containing boiler feed water from a deaerator. There are several designs of the same basic configuration,
and in each case, flue gases pass around the water-cooled coils to preheat boiler feed water. The water-
cooled tubes are finned to enhance gas-side heat transfer and keep the unit size as small as possible. Key
considerations for the application of these economizers include sulfur content of the fuel, flue gas
temperature, feed water inlet and outlet temperature, and overall effectiveness of the economizers. Sulfur
content is critical since below–dew point conditions in the flue result in sulfuric acid formation that could
damage or destroy the tubes of the economizer. Therefore, the feed water and flue gas temperatures
leaving the economizer are always maintained higher than the flue gas water condensation temperature.
The exact temperature that should be maintained depends on the type of fuel used (mainly sulfur content)
and excess air used for the combustion. Figure 3-3 shows the recommended minimum feed water
temperature leaving the economizer (i.e., the acid dew point) for various sulfur content in the fuel.5
Maintaining the feed water and flue gas temperatures above a certain minimum value will help keep the
tube and interior parts of the economizer (heat exchanger) above certain temperatures and avoid acid
condensation inside the economizer itself.
Figure 3-2. Conventional noncondensing feed water economizer.

3-6
Figure 3-3. Feed water economizer minimum metal temperature requirement to avoid acid condensation.
Similar to other shell and tube heat exchangers, noncondensing economizers have many different
configurations, but all of them have feed water flowing inside the tubes while the gas flows outside the
tubes. The gas–water flow is counter-current (i.e., cross-flow), so the heated water discharges at the high-
temperature gases side and the gases travel along the economizer tubes and discharge at the colder tube
side. Because any condensation will take place at the gas exit, the tube outside temperature and any part
of the shell interior temperature must be kept above the acid dew point (about 140°F for natural gas flue
products). Finally, a soot blowing arrangement must be used to keep the water tube surfaces clean for
economizers used in systems that use fuels such as coal, bio-fuels, and solid or liquid waste fuels.
Condensing Economizers
Noncondensing economizers avoid cooling the flue gases to the water vapor dew point, thereby
recovering only the sensible heat contained in the flue gases. Condensing economizers, however, are
designed to cool flue gases below water condensation temperature and can recover both the sensible and
latent heat from the flue gas products. Stoichiometrically, every pound of natural gas combusted produces
2.25 lb of water vapor; this not only represents a significant amount of latent heat energy, but also a
significant amount of water that can be recovered. Advancements in materials, metallurgy, and heat
recovery methodology now allow for the recovery of this energy and the realization of fuel cost savings.
Figure 3-4 illustrates the increased rate of heat transfer and efficiency increase once the heat recovery
process enters the latent recovery zone for natural gas fuel (commonly used in North America).17 The red
portion of the heat transfer curve represents the sensible heat transfer rate as it relates to the exit flue gas
temperature; the blue portion of the curve represents the sensible and latent heat transfer rate. The heat
transfer rate increases exponentially once the heat transfer includes latent heat energy recovery. The pink
dotted line illustrates the potential increase in efficiency from decreasing the flue gas exit temperature
from the normal 450°F to 105°F. Decreasing the exit temperature allows for the operating efficiency of
the fired equipment (e.g., boilers) to increase from 80% to 95%. These values are based on a higher
heating value.
3-7
Figure 3-4. Heat recovery by lowering flue gas temperature using a condensing heat exchanger.
Courtesy: Combustion and Energy Systems, Ltd.
Noncontact and contact heat exchangers are the two types of condensing heat exchangers used by the
industry. In the noncontact design, the flue gases are separated from feed water, similar to previously
discussed economizers, and a separate heat exchanger is often used after a conventional economizer or
heat exchanger. In the contact-type condensing economizer, the flue gases come in direct contact with the
feed water or other type of water to cool the gases to a very low temperature and recover a large
percentage of the latent heat. These are further discussed in the next section.
Figure 3-5 shows a typical noncontact condensing economizer system setup for recovering latent heat
from a package boiler. The traditional economizer (a noncondensing heat exchanger) recovers the
sensible heat of flue gases and exit gases feed into a noncontact condensing heat exchanger. The
noncontact condensing heat exchanger is specially designed to use corrosive resistant materials because
of the acidic condensate from flue gas (e.g., stainless steel and specially coated carbon steel). The heat
exchanger includes a water drain and collection arrangement on the flue gas side. The cold makeup water
is uncontaminated, and it is heated to a higher temperature in a conventional economizer for boiler feed
water.

3-8
Figure 3-5. Use of a condensing heat exchanger to increase boiler efficiency.
The same schematic applies to single or multiple boilers; for multiple-boiler or other heat source
applications, a single unit will tie into all the boiler stacks, combine the flue gas flows, and recycle the
heat into the process fluid or loop that requires heat. A typical system will have the two economizers
installed in series, with a bypass to divert gases from the noncondensing (conventional) economizer
directly to the stack in case the condensing economizer needs to be isolated. An installation of a
noncontact condensing economizer at a chemical plant is shown in Figure 3-6.
Figure 3-6: Installation of a noncontact condensing economizer at a chemical plant. Courtesy: Combustion and
Energy Systems, Ltd.
The noncontact condensing economizer unit design is very similar to a shell and tube heat exchanger with
the tube and shell material selected to withstand acidic environments. The following list provides general
guidelines for material selection, though variations from these materials may be substantial.

3-9
• Tubes: stainless steel, similar to grade 316 or better
• Fins for the tubes: aluminum bonded to the tubes
• Feed water headers: carbon steel for the makeup or process water; typically, the headers are
fabricated from 304 stainless steel
• All surfaces in contact with makeup or process water usually made from stainless steel; the shell
where acidic gases and condensate is present is fabricated using stainless steel, usually 304 or
equivalent
Overall, economics and payback period for the installation of a noncontact condensing economizer
depend on the cost of fuel, size of the installation, and location of the installed system. Based on
installations at several locations, as per the supplier,18 the payback period can vary from less than
8 months to 2 years, assuming a natural gas cost of $8.00 per MMBtu. The use of a condensing
economizer is most rewarding when the makeup water temperature is low all year, as in the case of colder
climate regions.
Direct Contact Economizers
A direct contact heat exchanger, sometimes referred to as a “boiler stack economizer,” is a special class of
heat exchanger that is different from conventional heat exchangers. In this unit, flue gases come into
direct contact with water and transfer heat to the water while recovering sensible and latent heat content.
Figure 3-7 illustrates a typical arrangement for a direct contact condensing heat exchanger.
Figure 3-7. A direct contact condensing heat exchanger.
The direct contact condensing economizer consists of a vapor-conditioning chamber followed by a
countercurrent spray chamber. In the spray chamber, small droplets of water come into direct contact with
the hot flue gas, providing a non-fouling heat transfer surface. The water droplets cool the stack gas,
condensing the flue gas water vapor content. The spray chamber may be equipped with packing to
improve contact between the water spray and hot flue gas. A mist eliminator is required to prevent

3-10
carryover of small droplets. The direct contact design offers a high heat transfer coupled with a water
recovery capability since the heated water can be collected for heating boiler feed water, space heating, or
other plant process needs, if suitable. Recovered water will be acidic and may require treatment, such as
membrane technology, external heat exchangers, pH control, or water filtration (if a fuel other than
natural gas was used) prior to use. In cases in which the heated water is used to heat another stream, such
as makeup water, it is necessary to install a secondary water-to-water heat exchanger to transfer heat from
the first stream (acidic hot water) to the secondary stream (makeup water) as shown in Figure 3-7. The
materials consideration for this unit are very similar to those discussed for a noncontact condensing heat
exchanger from the previous section.
Heat recovery performance of a direct contact heat exchanger depends on the incoming water
temperature, a typical unit can drop the flue gas temperature to 5°F to 10°F above the inlet water
temperature. This allows recovery of a large percentage of the flue gas heat content. In most cases, the
flue gas inlet temperature can be very high and the unit can be used without a conventional economizer.
However, too high of an inlet water temperature will result in a higher exit temperature for gases, now
saturated with water vapor and thus still containing a large amount of latent heat to recover. The direct
contact heat exchanger offers a very high efficiency, up to 100% (based on higher heating value), and
potential for boiler efficiency improvement of up to 20% due to a very low final flue gas temperature.
Direct contact heat exchangers can recover heat from exhaust gases from many types of heating
equipment such as boilers, ovens, heaters, and dryers. In most applications, the entering flue gas
temperature should be kept low enough to avoid boiling the water produced by the unit. The normal range
has been from 150°F to 450°F. Typical payback period for installation of a direct contact heat exchanger
varies from 2 to 4 years. Figure 3-8 shows an installation of a roof-mounted direct contact heat exchanger
on a small 200 HP boiler that uses the heat of flue gases to heat water for processes.
Figure 3-8. Installation of a direct contact condensing heat exchanger on a boiler.
The advantages in using a direct contact heat exchanger include the following:

3-11
• Lack of surfaces to corrode, foul, or otherwise degrade the heat transfer performance
• Potentially superior heat transfer for a given volume of heat exchanger due to the larger heat transfer
surface area achievable and the ability to transfer heat at much lower temperature differences between
the two streams
• Much lower pressure drop associated with direct contactors compared with their tubular counterparts
• Relatively lower capital cost compared to non-contact designs; direct contact heat exchangers can be
constructed out of little more than a pressure vessel, inlet nozzles for the fluid streams, and exit ports
Some of the disadvantages of direct contact heat exchangers are as follows:
• Presence of acidic components in the heated water
• Possible presence of solids (e.g., soot, ash particles) in the hot water for certain fuels
• Limit on cooling water inlet temperature
• Possible increased maintenance due to plugging of packing or heat transfer material
• Possible longer payback period if fuel prices are low and a secondary heat exchanger is required
(such as heating of boiler feed water)
CHEs
CHEs have a very high surface area to volume ratio. This compactness is achievable through higher
surface densities (i.e., heat transfer surface area per unit volume of heat exchanger) and through
enhancement of heat transfer coefficients by selection of heat transfer surface geometries. Such heat
exchangers,19 when used for gas-to-gas heat exchange, have a surface density of 700 m2/m3 (213 ft2/ft3).
When used for liquids or two-phase flows involving phase change (vaporizing or condensation), the
surface density is about 300 m2/m3 (92 ft2/ft3). A typical shell and tube heat exchanger in comparison has
a surface density of less than 100 m2/m3 (30 ft2/ft3) on the fluid side with plain tubes, and 2–3 times
greater than that with high fin density. A higher surface area to volume ratio also results in smaller flow
passages with two effects: (1) the tendency to develop a laminar flow in the channels and (2) high
pressure drops. Laminar flow is associated with lower heat transfer coefficients, making it necessary to
use various heat transfer enhancement techniques to improve efficiency. This has resulted in a wide
variety of designs of CHEs, some of which have been in routine use for many decades (e.g., radiators).
Continuous R&D is underway as the demand increases for more innovative, efficient, and cost-effective
designs.
The most commonly used CHE units are plate and frame heat exchangers and spiral heat exchangers. The
plate and frame heat exchanger (Figure 3-9) consists of a frame in which closely spaced metal plates are
clamped between a head and follower. The plates have corner ports with gaskets sealing the ports and
along the plate edges. A double seal forms pockets open to atmosphere to prevent mixing of product and
service liquids in the rare event of leakage past a gasket. Recent developments have introduced the
double-wall plate. The plates are grouped into passes with each fluid being directed evenly between the
paralleled passages in each pass.

3-12
Figure 3-9. Typical plate and frame heat exchanger. Courtesy: Alfa Laval Heat Exchangers.
Plates are made from a range of materials, including stainless steel, titanium, Hastelloy, Avesta 254 SMO,
Avesta 254 SLX, and any material ductile enough to be formed by a press. The special design of the
trough pattern strengthens the plates, increases the effective heat transfer area, and produces turbulence in
the liquid flow between plates. Plates are available between 25 gauge and 18 gauge (0.5 and 1.2 mm)
thickness with an effective heat transfer area ranging from 0.25 to 35 ft2 (0.03 to 3.5 m2). Flow ports and
associated pipework are proportional to the plate area and control the maximum liquid throughput. Until
recently, applications for plate heat exchangers were restricted by the need for elastomeric gaskets, but
recent advances in design have widened the range of applications by introducing brazed and welded
plates.
Some of the advantages and features of the CHEs include the following:
• For liquid/liquid duties, the plate heat exchanger will usually give a higher overall heat transfer
coefficient with similar pressure drop as a shell and tube heat exchanger.
• The effective mean temperature difference will usually be higher with the plate heat exchanger
resulting in higher effectiveness.
• A plate heat exchanger is more compact than a tubular design, usually occupying less floor space.
• For most materials of construction, sheet metal for plates is less expensive per unit area than tubes of
the same thickness.
• In many applications, the heat transfer surface of the plate is less susceptible to fouling than a tubular
unit. This is due to higher fluid velocities, a high degree of turbulence (increasing the rate of foulant
removal and resulting in a lower asymptotic fouling resistance), proper selection of plate material,
and smooth surfaces.

3-13
The most common WHR application for CHEs is heat recovery from hot liquids such as hot water
discharged from processing equipment, engine cooling systems, and so on. CHEs are more suitable than
direct contact heat exchangers to handle liquids with some contaminants (e.g., small particles, debris).
With proper selection of plate and gasket material, they can handle corrosive liquids. CHEs are not
typically used for low-density fluids such as gases, steam, or other vapors because of the restrictions in
the flow area of the ports on plate units. From a mechanical viewpoint, the plate passage is not optimal for
gas/vapor flow, and gasketed plate units are usually unable to withstand high operating pressures. The
tubular heat exchanger will often be the most economical solution in this case since the plate heat
exchangers are rarely made out of carbon steel. A plate heat exchanger can be economical if carbon steel
construction is acceptable and when a closer temperature approach is not required.
More information on design and application of CHEs can be obtained from books and supplier literature
that discuss various aspects of CHEs and their applications.20,21,22,23 The advantages and disadvantages of
CHEs are summarized in Table 3-2.
Table 3-2. Advantages and disadvantages of plate and frame heat exchangers.
Advantages Disadvantages
Low initial purchase cost (plate type) Narrow range of allowable pressures and
temperatures
Many different configurations available (gasketed, semi-
welded, welded, spiral)
Subject to plugging/fouling because of the very
narrow flow path
High heat transfer coefficients (3 or more times greater than
for shell and tube heat exchangers because of the much
higher wall shear stress)
Gasketed units require specialized opening and
closing procedures
Tend to exhibit low fouling characteristics because of the
high turbulence within the exchanger
Material of construction selection is critical
because wall thickness is very thin (typically less
than 10 mm)
True countercurrent designs allow significant temperature
crosses to be achieved
Require small footprint for installation and have small
volume hold-up
Spiral Heat Exchanger
Spiral plate exchangers, shown in Figure 3-10, are a special class of CHEs that are mainly used to process
viscous, heavily fouling fluids, or fluids containing particles or fibers. The heat exchanger is formed by
winding two flat parallel plates together to form a coil with the ends welded or sealed with gaskets. In
their normal orientation, spiral heat exchangers are true counter-current flow heat exchangers with hot
and cold fluids flowing in opposite directions relative to each other. Normally, alternate edges of the
passages are welded closed so that fluids can flow through continuous, isolated channels, thereby
avoiding cross-contamination. The passage spacing (usually ranging from 0.25 to 1.25 in. depending on
the fluid) is maintained primarily by sealing bars mounted at the passage edge and spacing studs. Certain
designs do not contain spacing studs, such as units applied to handle sewage sludge, which reduces the
likelihood of plugging. Depending on thermal and pressure drop requirements, passage width may range
from 9 to 96 in. with complete units available from 5 to 3,000 ft2. Covers with full face gaskets are fitted
to each side of the unit. Material of fabrication may be carbon steel, SS304, SS316, L-grade stainless,
alloy 20, alloy 400, alloy 200, and many other weldable and cold workable material. General guidelines
for pressure and temperature limitations are 150 psig and 800°F. 114

3-14
Figure 3-10. Spiral heat exchanger interior construction and the finished unit.
Courtesy: Alfa Laval Heat Exchangers.
Spiral heat exchangers offer several advantages over other types of heat exchangers:
• Large passages that allow their use with sludge and other liquids with large solids content
• Each fluid flows through a single uniform passage, eliminating mal-distribution and localized low
velocity areas
• Fully counter-current fluid flow for optimal thermal effectiveness
• Ease of inspection and cleaning of heat transfer surfaces by simply removing the covers
• Compact design requires less space than a conventional heat exchanger
• Spiral passage promotes turbulence and induces a scrubbing action, which lowers the fouling
tendency
Spiral heat exchangers can be used for single-phase flow (liquid to liquid) or two-phase flow (vapor to
liquid) heat transfer. Some of the single-phase applications for heat recovery applications include product
heating or cooling, heat recovery economizers, and feed or bottom interchanges; two-phase applications
include condensing and cooling of mixed vapors, steam heating of slurries, and other viscous materials in
chemical industries.
Recuperators
The manufacturing industries use the term “recuperator” for a special class of gas to gas heat exchanger,
which is used to preheat air using heat from exhaust gases. In a recuperator, heat exchange takes place
between the flue gases and the air through metallic or ceramic walls. Metallic recuperators are used for
low- to medium-temperature heat recovery applications whereas ceramic is used for high-temperature
applications. A typical recuperator used on industrial heating equipment is shown in Figure 3-11. 10 Flue
gases from a furnace or oven pass through one side of the recuperator, separated by a wall from the cold
combustion air.
There are many different configurations and designs of recuperators used by the industry. The different
types are convective, radiation, hybrid, ceramic, and a special class known as self-recuperative burners.
However, only one type—the convective recuperator—is of interest for low-temperature heat recovery.

3-15
Figure 3-11. Typical recuperator design and application for combustion air preheating.
Convective (convection) recuperator
Convection recuperators use convection heat transfer from gases as the primary mode of heat transfer,
comprising tube bundles or flat sheets to construct flow passages for the hot and cold gases. For low-
temperature applications, recuperators are constructed from metals such as aluminum and carbon steel.
Convection recuperators are available in many sizes ranging from gas rates of less than 100 cfm to as high
as 10,000 cfm and temperature ranging from 300°F to 1,600°F. They use three primary flow
configurations for the gases: parallel flow, counter-current flow, and cross flow, shown in Figure 3-12;
variations of these are also common.
Figure 3-12. Three main configurations of convective recuperators.
Courtesy: Thermopedia.
In the counter flow arrangement, hot gases flow in the opposite direction of the air flow, resulting in
highest temperature difference throughout the heat exchanger. In parallel flow systems, the hot gas and
cold air enter at the same level or plane and flow parallel to each other as heat from gases is transferred to
the air. Peak metal temperature is lower for parallel-flow systems than it is for counter-flow recuperators.
In cross-flow recuperators, the gas and air flows are in perpendicular directions, resulting in the peak
metal temperature being located at the bottom part of the recuperator tubes. In general, achievable air
temperature for a given set of values for the air and gas flows is the highest for counter-flow recuperators

3-16
and the lowest for parallel-flow recuperators. Selection of recuperator configuration largely depends on
the application and allowable peak metal temperature. Specifically, selection of a recuperator is based on
the following parameters:
• Exhaust or hot gas: flow, temperature, moisture content, presence of corrosive materials (type and
concentration), and particulates (type and concentration)
• Air or cold gas: flow, temperature, moisture content, presence of corrosive materials (type and
concentration), and particulates (type and concentration)
• Required air preheat temperature
• Allowable pressure drops on the hot gas and cold air sides
• Operating schedule and possible changes in these values of the mentioned parameters with time
• Type of fuel, fuel cost, and operating hours
Design and installation of a recuperator requires consideration and allowance for many issues, such as
thermal expansion, insulation of exposed surfaces, allowance for accessibility, inspection of internal parts,
monitoring of inlet gas temperature to avoid accidental high temperature of hot gases entering the
recuperator, and provision for controlling inlet hot gas temperature through injection of cold air in hot
gases. It is also desirable to monitor hot gas composition to detect presence of combustible gases when
the hot gases are products of combustion from fired heating equipment. In many large installations, it is
common to monitor outlet temperature of heated air and pressure drop on the hot and cold gas sides to
detect any abnormality and possible leakage due to tube or seal failure.
Performance of a recuperator is expressed in terms of effectiveness, given by the following equation.
𝐸𝑓𝑓 =∆Hair
∆Hmax
where
𝐸𝑓𝑓 = effectiveness of the recuperator
∆Hair = heat transferred to air (Btu/h)
∆H𝑚𝑎𝑥 = heat available from hot gas (Btu/h)
It is often necessary to know the amount of heat transferred and, more specifically, the temperature of
heated air leaving the recuperator. This can be calculated via the heat available from hot gases and
supplier-provided recuperator effectiveness.
Performance of recuperators
As discussed in a previous section, recuperator performance can be stated as its effectiveness and
preheated combustion air temperature delivered. However, for a given recuperator, both parameters can
change significantly as the temperature and flow of the inlet gases change. In practical applications, both
parameters change as the operating conditions change for the equipment on which a recuperator is
installed.

3-17
The recuperator equipment suppliers offer recuperators in standard and custom designs. They use detailed
heat transfer calculations to determine effectiveness for a certain operating condition, including hot gas
flow, temperature, cold air flow, and dimensions of the recuperator heat transfer surfaces. However, the
final results stated in the performance guarantee are based on testing of one or more units under a set of
operating conditions and then extrapolating and/or interpolating for the performance, as well as
simulation modeling. The change in flow and temperature of air and gas within the recuperator affects
heat transfer, effectiveness, and the combustion air temperature delivered at the exit end of a recuperator.
Therefore, the given effectiveness is not valid for heat transfer calculations at all operating conditions.
Typical performance for a convection recuperator shows that the combustion air temperature increases as
the flows go down. Further calculations using exit air temperature also indicate that the recuperator
effectiveness increases as the flows go down. As a result of this, the peak metal temperature for the
recuperator could go up. Hence, the material selection for a recuperator should be based on the “turn-
down” operating conditions and not the high-flow design conditions.
Detailed information on design, performance, and application of recuperators is available in References
14 and 15. A list of suppliers is given in Reference 16.
Regenerators
Regenerators are used as an alternative option to recover waste heat from hot gases to heat air. Static bed
and rotary regenerators are the two basic designs of regenerators. Static bed regenerators are rarely used
for low-temperature heat recovery. Their use is limited to high-temperature heating systems such as glass
melting, steel reheating furnaces, aluminum melting furnaces, and blast furnace air heating. Rotary
regenerators, commonly known as heat wheels, are used for heat recovery in low- to medium-temperature
applications.
A heat wheel consists of a properly sized porous disk rotating between two side-by-side cold and hot
ducts (Figure 3-13)3. The axis of the disk is located parallel and on the partition between the two ducts.
The core of the wheel, known as the “wheel matrix,” permits heat and moisture transfer between the two
airstreams. One of the most common matrix materials is aluminum because of its high thermal
conductivity and high specific heat compared with carbon steel. However, depending on operating
temperature, several other matrix materials such as ceramics, stainless steel, plastics, and paper are also
used.
Figure 3-13. Typical heat wheel WHR unit.
Cooled exhaust gases

3-18
In the low-temperature heat wheel design, the matrix material is corrugated metal to form small flow
channels (e.g., sinusoidal, triangular, or hexagonal) with a height of about 2 mm. These small flow
channels result in a large surface area for heat and mass transfer. The effectiveness of heat exchangers
strongly depends on the heat transfer surface area—the larger the surface area, the greater the
effectiveness. Therefore, heat wheels have very high heat transfer surface area to volume ratios.
Commercial heat wheels often have heat transfer surface area to volume ratios of about 800–4,000 m2/m3
(250 to 1,250 ft2/ft3), which results in very high heat transfer even with compact wheels.
In the most used heat wheel design, hot air transfers sensible heat to the disk, making the metal hot. As
the disk rotates from the hot side to the cold side, cold air picks up heat from the hot metal matrix, cooling
the metal. Further rotation of the disk brings it back to the hot air duct side to heat the matrix again and
the cycle continues. The overall efficiency of sensible heat transfer for this kind of regenerator can be as
high as 85%. Its main area of application is where heat is exchanged between large masses of air having
small temperature differences. The typical application of heat wheel fabricated from materials such as
aluminum or carbon steel is for low- to medium-temperature gases, usually limited to about 600°F.
The heat wheel system requires good seals between the higher-pressure air being heated and the lower-
pressure exhaust gases. Reliability of seals and plugging up of the gas passages have been the major
drawbacks of a heat wheel. Several steps have been taken to improve and automatically adjust the seals to
control air leaks as the seals wear out with the use.
Heat wheels are commonly used for preheating combustion air for large boilers. The commonly known
Lungstrom air preheater is an example of a metallic heat wheel used to preheat combustion air. This type
of heat exchanger design includes special arrangement for adjusting the seals and cleaning the heat
transfer surfaces. Application of heat wheels is very limited for industrial furnaces; however, they are
commonly used for low-temperature ovens and dryers. They can recover heat from oven exhaust gases to
preheat building ventilation air or makeup air for the ovens and dryers. Another application of the heat
wheel is in industrial plant buildings, where it is used to recover heat from ventilation air especially
during cold climate conditions. Desiccant heat wheels are a special type of heat wheel that is primarily
used to remove moisture from process air or building air. These are not technically heat recovery systems,
but they play an important role in improving process thermal efficiency for certain applications.
3.2 HEAT PIPE
Heat pipes are a heat recovery device with no moving parts. As shown in Figure 3-14,3 the heat pipe
comprises three elements—a sealed container, a capillary wick structure, and a working fluid. The
capillary wick structure is integrally fabricated into the interior surface of the container tube and sealed
under vacuum. In many cases, the tube outer surface has extended surfaces or fins to enhance heat
transfer between the fluid (gases) and the heat pipe unit. Heat applied to the external surface of the heat
pipe is in equilibrium with its own vapor as the container tube is under vacuum. Thermal energy applied
to the external surface of the heat pipe causes the working fluid near the surface to evaporate
instantaneously (latent heat of vaporization). This part of the heat pipe is usually referred to as the
“evaporator region.” The vapor then travels to the other end of the pipe or the condenser region, where the
thermal energy is removed, causing the vapor to condense into liquid again (latent heat of condensation).
The condensed liquid then flows back to the evaporated region. Commonly used fluids are ammonia,
acetone, the Freon compounds, and water. Water, which is perhaps the most widely used working fluid,
has good thermophysical properties such as large heat of vaporization and surface tension, and has the
added benefit of being safe to use during handling.

3-19
Figure 3-14. A heat pipe construction and functional schematic.
Heat pipes can be used to transfer heat between gases to gases, gases to liquids, or liquids to liquids, and
to raise low-pressure steam using heat from medium-temperature waste heat. The design, dimensions,
orientation and other factors depend on the specific application. Heat pipes have been used in many types
of applications in a variety of industries.
A commercially available unit consists of a bundle of tubes of varying diameter (from as small as 1/8 to
1 in. and larger) and lengths to meet specific application requirements. A typical assembled unit (gas-to-
liquid unit designed by Spirax Sarco) is shown in Figure 3-15.
Figure 3-15. Assembled unit of heat pipes for use in gas to liquid heat transfer. Courtesy: Spirax Sarco.
The heat pipe heat exchanger needs very little mechanical maintenance because no parts wear out. It does
not need input power for its operation, and it is free from cooling water and lubrication systems. It also
lowers the fan horsepower requirement and increases the overall thermal efficiency of the system. The
heat pipe heat recovery systems can operate up to 600°F with 60% to 80% heat recovery capability.
The temperature limit of a heat pipe is determined by the material of construction (outer tube), type of
working fluid, wick material, and contaminant composition of gases and liquids. In most cases, copper,
aluminum, or carbon steel is used for the tube and extended surfaces. Stainless steel is used in the
presence of acidic gases and at high temperatures. Heat pipe designs are available for temperatures as
high as 1,600°F.

3-20
Typical heat pipe applications
Heat pipes are used in the following industrial applications:
• Space heating: Heat pipe transfers the thermal energy from process exhaust for building space
heating. The preheated air can be blended, if required. The requirement of additional heating
equipment to deliver heated makeup air is drastically reduced or eliminated.
• Process to process: Heat pipe heat exchangers recover thermal energy waste from the process exhaust
and transfer this energy to the incoming process air. The incoming air becomes warmer and can be
used for the same process or for other processes, reducing process energy consumption.
• HVAC applications:
o Cooling: Heat pipe heat exchangers precool the building makeup air in the summer and reduce
the total tons of refrigeration to be delivered by the cooling system. Thermal energy is transferred
to the cool exhaust from the hot supply makeup air, which results in cooler supply makeup air.
o Heating: The above process is reversed during the winter to preheat the makeup air.
• Other applications:
o Preheating boiler combustion air
o Recovering waste heat from furnaces
o Reheating fresh air for hot air driers
o Recovering waste heat from catalytic deodorizing equipment
o Reusing furnace waste heat as heat source for other ovens
o Cooling closed rooms with outside air
o Preheating boiler feed water with WHR from flue gases in the heat pipe economizers
o Drying, curing, and baking ovens
o Reclaiming waste steams
o Recovering waste heat from Brick kilns (secondary recovery)
o Recovering waste heat from Reverberatory furnaces (secondary recovery)
3.3 HEAT PUMPS
In the various options previously discussed, waste heat spontaneously transfers “downhill” from a hot
fluid to a lower temperature fluid. When energy is repeatedly transferred or transformed, it eventually has
such low intensity (resides in a medium at such low temperature) that it can no longer be viable to use for
most applications.
It has been a general rule of thumb in industrial operations that fluids with temperatures lower than 250°F
are the limit for WHR because of the risk of condensation of corrosive liquids. However, when fuel costs
rise, even such waste heat can be used economically for space heating and other low-temperature
applications. It is possible to reverse the direction of spontaneous energy flow by using a thermodynamic
system: heat pumps.
Most heat pumps work on the principle of the vapor compression cycle. In this cycle, the circulating
substance is physically separated from the source (waste heat, with a temperature of Tin) and user (heat to
be used in the process, Tout) streams, and is reused in a cyclical fashion, therefore being called a “closed
cycle.” As shown in Figure 3-16, the following processes take place in a heat pump:
• In the evaporator, the heat is extracted from the heat source to boil the circulating working fluid.

3-21
• The low-temperature working fluid vapor is compressed by a compressor, which requires external
work. The work done on the vapor raises its pressure and temperature to a level at which its energy
becomes available for use.
• The heat is delivered to the condenser, where it is transferred to the process.
• The throttling valve reduces the pressure of the circulating working fluid back to the evaporator
condition, where the cycle repeats.
Figure 3-16. Working principle of a heat pump for heat recovery applications.
Heat pump applications are most promising when the heating and cooling capabilities can be used in
combination (e.g., a plastics factory where chilled water is used to cool injection-molding machines while
the heat output from the heat pump is used to provide factory or office heating). Other examples of heat
pump installation include product drying, maintaining dry atmosphere for storage and drying compressed
air. Application of heat pumps for industrial applications is not given much consideration; however, heat
pumps can be used for several applications in an industrial plant, shown in Figure 3-17. 24
Figure 3-17. Industrial application areas for heat pumps.
The performance of heat pump is rated in coefficient of performance (COP), which is the ratio of heat
output to the amount of energy input.
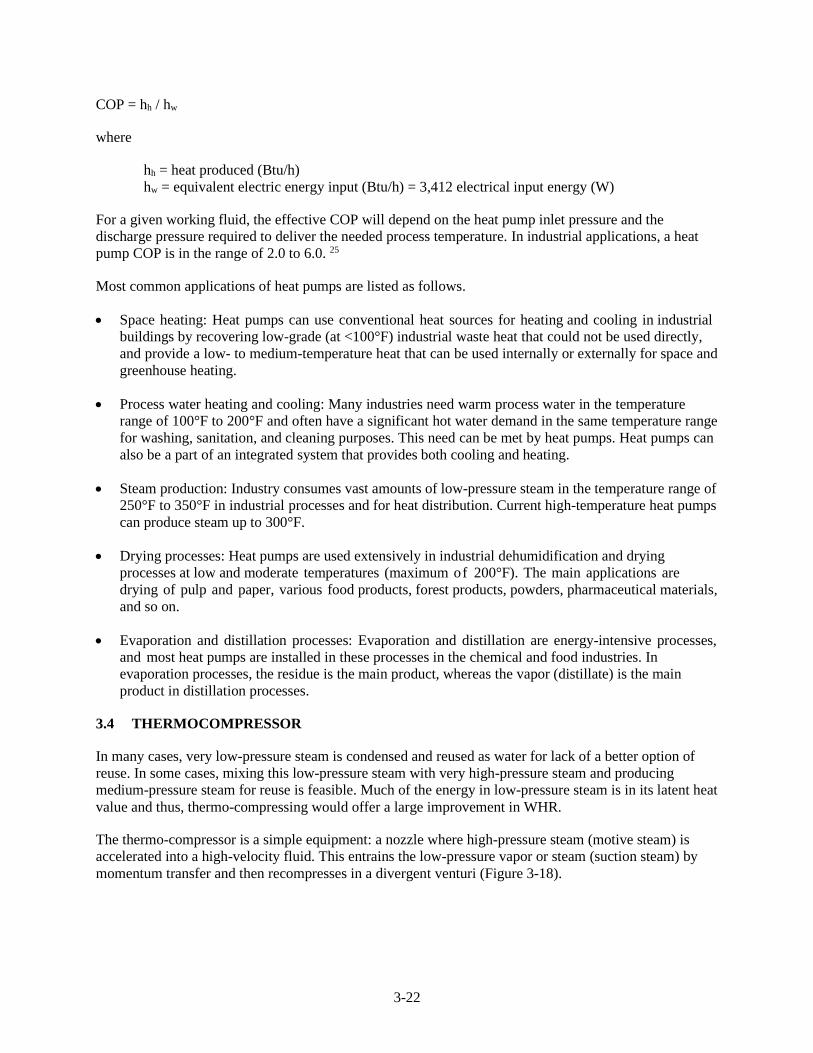
3-22
COP = hh / hw
where
hh = heat produced (Btu/h)
hw = equivalent electric energy input (Btu/h) = 3,412 electrical input energy (W)
For a given working fluid, the effective COP will depend on the heat pump inlet pressure and the
discharge pressure required to deliver the needed process temperature. In industrial applications, a heat
pump COP is in the range of 2.0 to 6.0. 25
Most common applications of heat pumps are listed as follows.
• Space heating: Heat pumps can use conventional heat sources for heating and cooling in industrial
buildings by recovering low-grade (at <100°F) industrial waste heat that could not be used directly,
and provide a low- to medium-temperature heat that can be used internally or externally for space and
greenhouse heating.
• Process water heating and cooling: Many industries need warm process water in the temperature
range of 100°F to 200°F and often have a significant hot water demand in the same temperature range
for washing, sanitation, and cleaning purposes. This need can be met by heat pumps. Heat pumps can
also be a part of an integrated system that provides both cooling and heating.
• Steam production: Industry consumes vast amounts of low-pressure steam in the temperature range of
250°F to 350°F in industrial processes and for heat distribution. Current high-temperature heat pumps
can produce steam up to 300°F.
• Drying processes: Heat pumps are used extensively in industrial dehumidification and drying
processes at low and moderate temperatures (maximum of 200°F). The main applications are
drying of pulp and paper, various food products, forest products, powders, pharmaceutical materials,
and so on.
• Evaporation and distillation processes: Evaporation and distillation are energy-intensive processes,
and most heat pumps are installed in these processes in the chemical and food industries. In
evaporation processes, the residue is the main product, whereas the vapor (distillate) is the main
product in distillation processes.
3.4 THERMOCOMPRESSOR
In many cases, very low-pressure steam is condensed and reused as water for lack of a better option of
reuse. In some cases, mixing this low-pressure steam with very high-pressure steam and producing
medium-pressure steam for reuse is feasible. Much of the energy in low-pressure steam is in its latent heat
value and thus, thermo-compressing would offer a large improvement in WHR.
The thermo-compressor is a simple equipment: a nozzle where high-pressure steam (motive steam) is
accelerated into a high-velocity fluid. This entrains the low-pressure vapor or steam (suction steam) by
momentum transfer and then recompresses in a divergent venturi (Figure 3-18).

3-23
Figure 3-18. Thermocompressor components. Courtesy: Spirax Sarco.
Applications such as evaporators and paper dryers use thermocompressors to recompress the boiling
steam and use it as heating steam. Thermocompressor selection is based on the required compression
ratio, defined as the ratio of discharge pressure to suction pressure with all pressures measured in absolute
pressure. For most applications, the thermocompressor system is designed to keep compression ratio
lower than 1.8 to 2.1 to avoid use of sonic or critical velocity of the motive steam beyond which flow can
be choked.
When applied properly, thermocompressors offer several advantages:
• Simple construction—steam jet thermocompressors can be made from any machinable materials for
increased abrasion resistance.
• Compact design and comparatively lightweight enables overhead installations.
• No moving or rotating parts lead to minimal maintenance requirements; therefore, the units can be
installed in remote or inaccessible locations.
• Discharge steam is oil-free, and there is no lubrication contamination.
• Thermocompressors are suitable for hazardous areas; no explosion-proof motors are required.
• Recirculation occurs without loss of heat or energy through reducing valves.
Figure 3-19 illustrates the application of a thermocompressor on a paper-drying machine using steam as
the source of heat. In this case, the thermocompressor pressurizes the lower-pressure flash steam from a
condensate collection vessel to the required steam pressure using higher-pressure steam or motive steam.
This system allows recovery and recirculation of flash steam while recovering part of the energy content
of the return condensate.

3-24
Figure 3-19. Application of a thermocompressor on a paper-drying machine.
The operating requirements (such as the final pressure and amount of steam required for the process) are
used to determine pressure and quantity of motive (high-pressure) steam required for thermocompressor
operation. Blatchley and Stratton26 give guidance on this by using certain standard-size
thermocompressors.
3.5 THERMALLY ACTIVATED TECHNOLOGIES
Thermally activated technologies consists of equipment using thermal energy for heating, cooling,
humidity control, and power (mechanical and electric). They include absorption chillers for cooling,
desiccant systems for humidity control, and organic Rankine systems for power generation. CHP systems
that use waste heat for power generation are also considered a thermally activated technology.
Absorption Chillers
Absorption chillers transfer recovered waste heat to an absorbent fluid and a refrigerant. There are two
primary systems, which use two different working fluid mixtures: ammonia–water and LiBr–water.
Ammonia–water systems are used by cooling equipment, ranging from small refrigerators to large heat-
recovery machines installed with power plants. Ammonia is an excellent refrigerant with a high latent
heat and excellent heat transfer characteristics. However, because of its toxicity, it is used only in limited
applications and is usually set up outdoors to allow natural dilution of any leaks. Aqueous LiBr is used for
all types of systems and is being widely used to avoid concerns about toxicity of ammonia-based systems.
A LiBr system uses solution of water and LiBr as a working fluid instead of an ammonia and water
mixture. The system uses waste heat in the form of low-pressure steam or hot water to supply necessary
energy to power the system. The thermal system replaces a compressor used in electrically driven vapor
compression systems commonly used by the industry.
As shown in Figure 3-20,3 a typical LiBr absorption chiller includes two vessels or shells. The upper shell
contains the generator and condenser; the lower shell contains the absorber and evaporator. Heat supplied
in the generator section is added to a solution of LiBr–water. This heat causes the refrigerant, in this case
water, to boil out of the solution in a distillation process. The water vapor then passes into the condenser
section, where a cooling medium condenses the vapor back to a liquid state. The water then flows down
to the evaporator section, where it passes over tubes containing the fluid to be cooled (labeled “chilled

3-25
water” in the figure). By maintaining a very low pressure in the absorber-evaporator shell, the water (i.e.,
“liquid refrigerant”) boils at a very low temperature. This boiling causes the water to absorb heat from the
fluid to be cooled, thus lowering its temperature. The evaporated water (formerly the liquid refrigerant)
then passes into the absorber section, mixing with the concentrated LiBr–water solution. This strong
solution (strong in LiBr) absorbs the vapor from the evaporator section to form a weaker solution. This is
the absorption process that gives the cycle its name. The weak solution is then pumped to the generator
section to repeat the cycle. One of the biggest advantages of the LiBr–water system is its ability to
produce chilled liquid temperatures below 32°F.
Figure 3-20. Simplified absorption cycle using waste heat.
The system discussed is a single-effect absorber system. Two variations use advanced heat transfer
components, known as “double effect” and “triple effect” systems. The double effect unit requires two
condenser and generator systems, and the triple effect unit requires three condensers and generators.
These systems offer better performance in terms of energy use compared to single-effect system but
comes with an added cost.
Efficiency of cooling systems or chillers is indicated by COP, which is defined as cooling output divided
by the required heat input. For a single-effect unit that does not include extensive heat recovery heat
exchangers, the COP is in the range of 0.5 to 0.7. For double- and triple-effect systems, the range of COP
is 1.0 to 1.1 and 1.4 to 1.5 respectively. A comparable electrically operated system would have a COP of
4.5 to 6.0, but since absorption units use waste heat, the operating cost is very small compared with the
electrical units.
Choice of a particular system (single, double or triple) is driven by generator heat source temperature. The
following list obtained from Papar27 matches the type of system to heat sources commonly used for
industrial systems.
• Single-effect
▪ Generator temperature (180°F–300°F)
▪ Waste heat fired
▪ Hot water fired (180°F–220°F)
▪ Steam fired (<15 psig)

3-26
• Double-effect
▪ Generator temperature (275°F–350°F)
▪ Steam fired (>50 psig)
▪ Direct natural gas fired
• Triple-effect
▪ Generator temperature (350°F–400°F)
▪ Steam fired (>100 psig)
▪ Direct natural gas fired
There are several important operating issues associated with LiBr systems. The minimum temperature
must remain above 40°F. It is necessary to control the unit operation to maintain the solution
concentration above crystallization point to avoid salt crystallization. This requires the use of several
built-in safety systems. Additionally, the units have relatively large footprint because of the use of large
vessels.
Ammonia Water Absorption System
In a single-effect ammonia–water system as shown in Figure 3-21,27 ammonia is the refrigerant and water
is the absorbent. High-pressure liquid refrigerant from the condenser passes into the evaporator through
an expansion valve that reduces the pressure of the refrigerant to the low pressure existing in the
evaporator. The liquid refrigerant vaporizes in the evaporator by absorbing heat from the medium being
cooled, and the resulting low-pressure vapor passes to the absorber. The low-pressure vapor from the
evaporator is absorbed by the strong solution coming from the generator through an expansion valve, and
forms the weak solution in absorber. The weak solution is pumped to the generator, where the refrigerant
in the solution boils off. Heat for boiling off the refrigerant is supplied from hot water or steam produced
from waste heat or another source, such as flash steam. The remaining solution flows back to the absorber
and thus completes the cycle. For the ammonia–water system, an analyzer and a rectifier is used to
remove water vapor from the refrigerant mixture leaving the generator before reaching the condenser.
Figure 3-21. Schematic of a single-effect ammonia–water absorption chiller system.
Ammonia–water systems can use a variety of heat sources, such as waste or process surplus steams, hot
water, and geothermal or solar heat, at as low as 150°F. The COP value peaks out at about 1.5 for
advanced systems (such as triple-effect systems) with additional heat exchangers and other components.
Payback for these systems depends on the cost of the heat source, capital cost, and cost of electricity,

3-27
which would have to be used to produce the required cooling. If the source of heat is waste heat, it is
possible to justify such systems with less than a 3-year payback period.
The cost for these systems (operating and capital or investment) varies from $750 to $1,000 per
refrigeration ton. This includes the cost of the unit as installed at the location plus cost for auxiliary
condenser equipment (cooling tower, cooling water pumps, and cooling water piping). In most cases, the
cost of the absorption system could be 50% higher than the equivalent electrical system. The auxiliary
system cost is approximately 33% of the total cost of the system.

4-1
4. NEW AND EMERGING TECHNOLOGIES
In response to the availability of large amounts of low-temperature waste heat in manufacturing plants,
new technologies to use this low-grade waste heat are being developed or demonstrated. Most of these
technologies focus on the conversion of thermal energy (heat) into electrical energy using low-
temperature heat sources, such as flue gases or liquid streams (heat recovery system fluids). Over the past
three decades, several commercial products based on advanced systems (i.e., the ORC, ammonia–water–
based, and supercritical CO2 [sCO2] systems) have been developed and tested at manufacturing plants as a
result of research activities by national laboratories and private companies. Other efforts have been
directed to thermal storage, thermally activated technologies (cooling systems using waste heat),
mechanical methods of energy conversion, and thermoelectrical systems. Many of these technologies are
not yet widely adopted by the US industries. Adoption of these new technologies is hampered by
relatively low conversion efficiency, low natural gas prices, and the desire for shorter payback periods (in
some cases, less than 2 years). However, some companies have selected to install and test these new
technologies as demonstration projects or to be pioneers in new and emerging technologies. The
following sections describe some of these technologies and provide case studies highlighting the
performance of the selected technologies.
4.1 ORGANIC RANKINE CYCLE
Description
The Organic Rankine Cycle (ORC) technology is the most commonly used system by industrial facilities
to convert low-temperature waste heat into power. The basic cycle consists of a boiler (vaporizer), pump,
turbo-generator, condenser, and working fluid (organic fluids such as freons, isobutane, and isopentane).
Energy from the waste heat is transferred to the working fluid in the boiler, and then the working fluid
vaporizes and enters the electricity production stage. The working fluid vapor rotates the turbine, which is
coupled to a generator generating electricity. The working fluid then enters the condenser and travels
through a pump to start the cycle again.
Figure 4-1 outlines the WHR process for a simple ORC system. 37 Energy travels from industrial exhaust
to the organic Rankine recovery system, where a generator generates electricity and the remaining energy
is rejected to the atmosphere.
Figure 4-1. Illustration of an industrial ORC technology.

4-2
Advantages
• Converts waste thermal energy into electrical energy, which can be used in high electricity demand
sectors such as manufacturing
• Proven technology (high use in geothermal plants)
• Wide range of power generation or output in terms of kilowatts available
• Many units do not require an operator for monitoring because of remote controlling
Disadvantages
• Low efficiency (8%–15%)70
• Cost around $2,000/kW–2,500/kW70
• Organic working fluids may pose safety risks
Case Studies
Two case studies are considered below: a study on the ORC in a biopolymer plant by Rutgers University
and a report on ORC in a biogas plant by the Indo-German Forum.
The biopolymer plant
The powder-making process spans from wet chemical formation to drying the chemicals to form a
powder. In the case of biopolymer powders, the ovens used are set at a lower temperature to avoid
denaturing the protein structures. Arvay et al. found that a biopolymer dryer produced 9.7 MMBtu/h of
waste heat with a temperature around 240°F.68
The case study assumed the heat exchanger captures 90% of waste heat while the ORC converts the rest
of the 10% of waste heat to electricity, producing 250 kW of power. Using estimates from vendor data,
the authors calculated a 2.5 year potential payback time, assuming a $3,000/kW system installation cost
with a system run-time of 8,000 hours per year and electricity cost of $0.15/kWh.
Figure 4-2 shows the applicability of different ORC systems with respect to different waste stream
temperatures.37 As shown, ORCs are applicable with low-temperature waste heat sources whereas steam
Rankine cycles are typically used if the waste heat source is higher than 650°F.
Figure 4-2. ORC applicability based on source temperature and output energy.
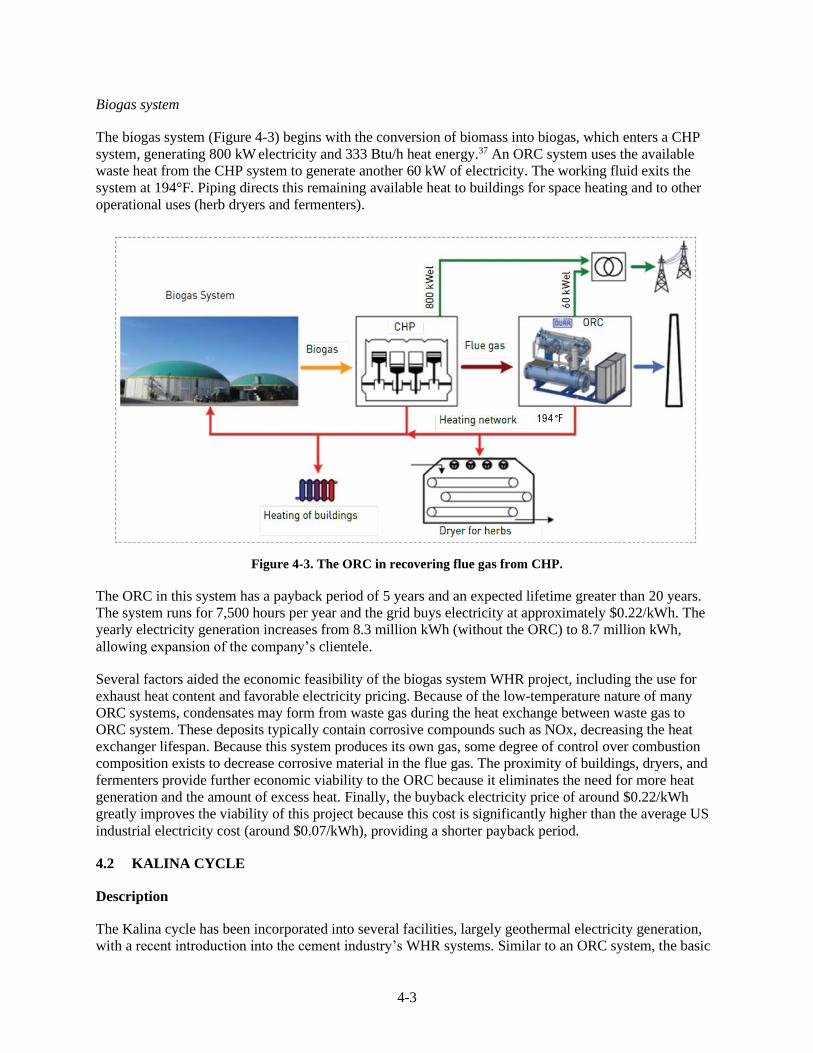
4-3
Biogas system
The biogas system (Figure 4-3) begins with the conversion of biomass into biogas, which enters a CHP
system, generating 800 kW electricity and 333 Btu/h heat energy.37 An ORC system uses the available
waste heat from the CHP system to generate another 60 kW of electricity. The working fluid exits the
system at 194°F. Piping directs this remaining available heat to buildings for space heating and to other
operational uses (herb dryers and fermenters).
Figure 4-3. The ORC in recovering flue gas from CHP.
The ORC in this system has a payback period of 5 years and an expected lifetime greater than 20 years.
The system runs for 7,500 hours per year and the grid buys electricity at approximately $0.22/kWh. The
yearly electricity generation increases from 8.3 million kWh (without the ORC) to 8.7 million kWh,
allowing expansion of the company’s clientele.
Several factors aided the economic feasibility of the biogas system WHR project, including the use for
exhaust heat content and favorable electricity pricing. Because of the low-temperature nature of many
ORC systems, condensates may form from waste gas during the heat exchange between waste gas to
ORC system. These deposits typically contain corrosive compounds such as NOx, decreasing the heat
exchanger lifespan. Because this system produces its own gas, some degree of control over combustion
composition exists to decrease corrosive material in the flue gas. The proximity of buildings, dryers, and
fermenters provide further economic viability to the ORC because it eliminates the need for more heat
generation and the amount of excess heat. Finally, the buyback electricity price of around $0.22/kWh
greatly improves the viability of this project because this cost is significantly higher than the average US
industrial electricity cost (around $0.07/kWh), providing a shorter payback period.
4.2 KALINA CYCLE
Description
The Kalina cycle has been incorporated into several facilities, largely geothermal electricity generation,
with a recent introduction into the cement industry’s WHR systems. Similar to an ORC system, the basic

4-4
Kalina cycle consists of a boiler, pump, turbine, generator, condenser, and working fluid (ammonia–
water). The working fluid is pumped and then energy from waste heat transfers to the working fluid in the
boiler and potentially from other heat exchangers and recuperators. The ammonia–water working fluid
expands in the turbine, causing the turbine to rotate. The generator captures this rotation and converts it to
electric energy, and the working fluid is cooled in the condenser and begins the cycle again. Figure 4-4
shows a schematic of a Kalina cycle setup. 11
Figure 4-4. Kalina cycle flow schematic.
The ammonia–water composition of the working fluid differentiates the Kalina cycle from steam cycles
and ORCs. Its cost varies significantly, with typical prices between $2,000/kW and $3,000/kW,70 though
prices have been known to dip close to $1,000/kW. A second generation cycle71 was developed by Dr.
Kalina and Kalex, LLC, which Dr. Kalina projects to have efficiency and cost improvements. However, it
introduces increased complexity through the addition of a number of separators, valves, and pumps.
Advantages
• Binary working fluid allows better capture of waste heat
• Ammonia–water combination enables the system to capture waste heat streams in a wide temperature
range
• Higher efficiency than other Rankine heat recovery systems
Disadvantages
• More maintenance because of added components and system complexity
• Limited suppliers and experience
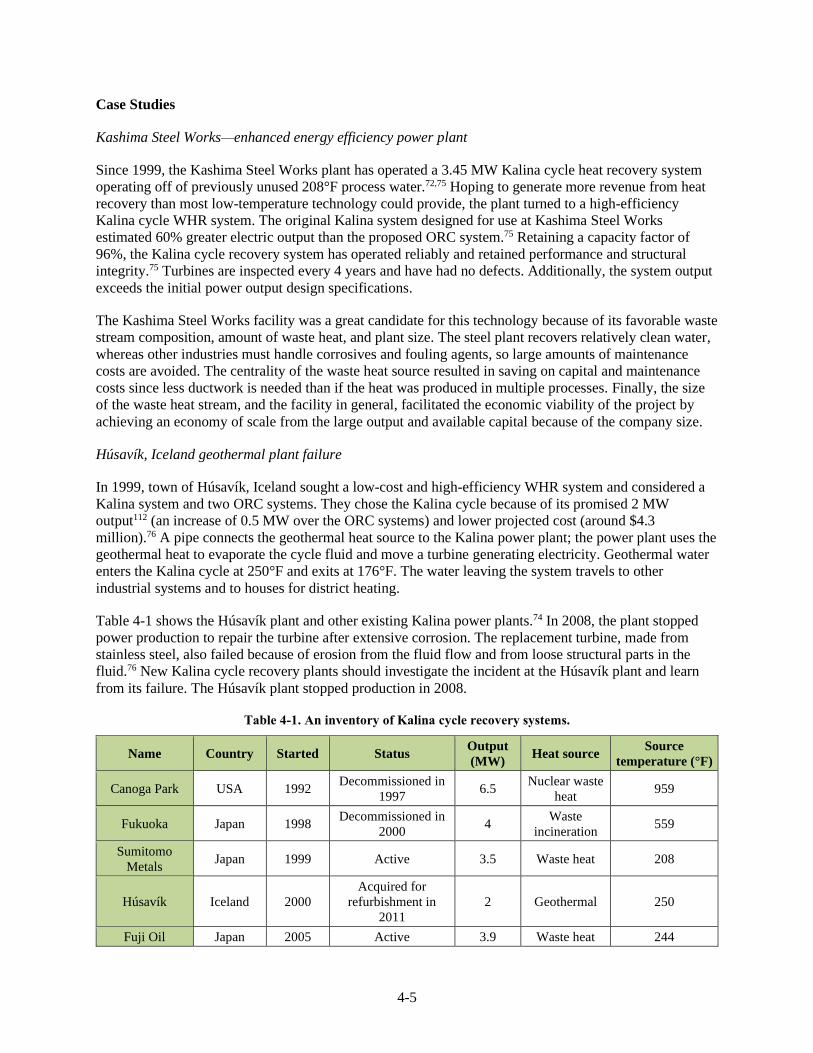
4-5
Case Studies
Kashima Steel Works—enhanced energy efficiency power plant
Since 1999, the Kashima Steel Works plant has operated a 3.45 MW Kalina cycle heat recovery system
operating off of previously unused 208°F process water.72,75 Hoping to generate more revenue from heat
recovery than most low-temperature technology could provide, the plant turned to a high-efficiency
Kalina cycle WHR system. The original Kalina system designed for use at Kashima Steel Works
estimated 60% greater electric output than the proposed ORC system.75 Retaining a capacity factor of
96%, the Kalina cycle recovery system has operated reliably and retained performance and structural
integrity.75 Turbines are inspected every 4 years and have had no defects. Additionally, the system output
exceeds the initial power output design specifications.
The Kashima Steel Works facility was a great candidate for this technology because of its favorable waste
stream composition, amount of waste heat, and plant size. The steel plant recovers relatively clean water,
whereas other industries must handle corrosives and fouling agents, so large amounts of maintenance
costs are avoided. The centrality of the waste heat source resulted in saving on capital and maintenance
costs since less ductwork is needed than if the heat was produced in multiple processes. Finally, the size
of the waste heat stream, and the facility in general, facilitated the economic viability of the project by
achieving an economy of scale from the large output and available capital because of the company size.
Húsavík, Iceland geothermal plant failure
In 1999, town of Húsavík, Iceland sought a low-cost and high-efficiency WHR system and considered a
Kalina system and two ORC systems. They chose the Kalina cycle because of its promised 2 MW
output112 (an increase of 0.5 MW over the ORC systems) and lower projected cost (around $4.3
million).76 A pipe connects the geothermal heat source to the Kalina power plant; the power plant uses the
geothermal heat to evaporate the cycle fluid and move a turbine generating electricity. Geothermal water
enters the Kalina cycle at 250°F and exits at 176°F. The water leaving the system travels to other
industrial systems and to houses for district heating.
Table 4-1 shows the Húsavík plant and other existing Kalina power plants.74 In 2008, the plant stopped
power production to repair the turbine after extensive corrosion. The replacement turbine, made from
stainless steel, also failed because of erosion from the fluid flow and from loose structural parts in the
fluid.76 New Kalina cycle recovery plants should investigate the incident at the Húsavík plant and learn
from its failure. The Húsavík plant stopped production in 2008.
Table 4-1. An inventory of Kalina cycle recovery systems.
Name Country Started Status Output
(MW) Heat source
Source
temperature (°F)
Canoga Park USA 1992 Decommissioned in
1997 6.5
Nuclear waste
heat 959
Fukuoka Japan 1998 Decommissioned in
2000 4
Waste
incineration 559
Sumitomo
Metals Japan 1999 Active 3.5 Waste heat 208
Húsavík Iceland 2000
Acquired for
refurbishment in
2011
2 Geothermal 250
Fuji Oil Japan 2005 Active 3.9 Waste heat 244

4-6
Name Country Started Status Output
(MW) Heat source
Source
temperature (°F)
Bruschal Germany 2009 Active 0.6 Geothermal 244
Unterhaching Germany 2009 Active 3.5 Geothermal 252
Shanghai Expo China 2010 Decommissioned
after expo 0.05 Solar hot water 198
Quingshui Taiwan 2011 Active 0.05 Geothermal 230
Khan Cement Pakistan — Under construction 8.5 Waste heat
(cement) —
Start Cement UAE — Under construction 4.8 Waste heat
(cement) —
4.3 SUPER CRITICAL CO2 CYCLE
Description
The sCO2 cycle uses CO2, which has a relatively low critical temperature and pressure compared with
working fluids in either a Rankine-1 or Brayton-based system. The supercritical fluid bypasses the
isothermal liquid-vapor phase change region, allowing better thermal match with the heat source. This
decreases irreversibility and increases efficiency over the conventional Rankine cycle and essentially
eliminates any noticeable pinch point. Figures 4-5 and 4-6 show a typical sCO2 system setup.78
The basic cycle consists of a turbine, compressor, recuperator, cooler, and CO2. Energy from the waste
heat stream transfers to the working fluid (CO2), which evaporates and enters the turbine. The turbo-
generator combination then converts mechanical energy to electrical energy. The recuperator then
preheats the CO2 liquid from the condenser to complete the cycle.1
Figure 4-5. Plant size comparison between a sCO2 system and a steam Rankine system.

4-7
Figure 4-6. Flow schematic for a simple sCO2 cycle system.
Advantages
• Better thermal match with the heat source
• CO2 is nontoxic, is nonflammable, and has a low environmental impact31
• Projected 15%–25% lower cost than ORC recovery system77,31
• Capable of handling cyclic operation without thermal fatigue or corrosion78
Disadvantages
• New technology with little commercial development31
• Potential maintenance issues31
• High pressure necessary to operate
Case Studies
Echogen is one of the companies developing and demonstrating sCO2 cycle technology for industrial
users. Many of these demonstrations are meant to illustrate the advantages of sCO2 over other commercial
systems and alleviate concern over the system pressure. Two of Echogen’s demonstration projects, WHR
on a naval vessel and for a municipal district heating, are discussed below.
Echogen Navy heat recovery system
In 2011, Echogen completed a Phase I small business innovative research project for the US Navy to
develop initial models and testing for sCO2 WHR on Navy vessels. Tests of the produced system showed
a fuel reduction of around 20% while occupying minimal space (an important factor considering the
confined space on board). This success paved the way for continued work with the US Navy through a
Phase II small business innovation research project. Also, Echogen signed an agreement with GE Marine
to be the exclusive provider of heat-to-power system for use on commercial and military marine vessels
worldwide.78,79
System pressure and leaks are important safety considerations for these systems. The high operating
pressure of a sCO2 system causes increased stress on components and thus component wear. High internal

4-8
stress can be mitigated through materials selection, system design, and a regular maintenance schedule. If
not properly maintained, leaks could cause large amounts of CO2 to escape. Because CO2 is heavier than
air, build-up could occur, creating a toxic atmosphere if the area is not properly ventilated. Levels
between 2% and 10% can cause mental and physical discomforts and temporary impairments, and
concentrations exceeding 10% can be fatal if exposed for several minutes.80
Echogen field testing in Groveport and Akron, Ohio
From 2010 to 2011, Echogen tested eight turbo-alternator configurations at a test site in Groveport, Ohio
(Figure 4-7).81 Heat from a natural gas–fired system was provided via a heat transfer fluid in place of flue
or exhaust gas for 80 days of operation with more than 85 system starts. Results from this year-long test
included an increased power rating from 250 to 400 kW and development of two turbine configurations
for endurance testing.78,81
After the Groveport testing, the system and additional plant hardware were transported to the Akron
Energy Systems municipal district heating facility for long-term testing of component durability and
system response to seasonal change. Echogen agreed to production of another test facility in New York
with the Dresser-Rand Corporation.81
Figure 4-7. (1) Assembling, (2) shipping, (3) installing, and (4) testing of a sCO2 system in Groveport, Ohio.
4.4 TRILATERAL FLASH OR VARIABLE PHASE CYCLE
Description
A generic variable-phase cycle contains a pump, liquid heat exchanger, turbine, and condenser. The
working fluid (refrigerant) is pressurized and transferred to the heat exchanger after which the fluid
flashes in the vaporizer and turbine.82 The key to this cycle is the vaporization of the working fluid

4-9
because vapor has a lower density, which leads to higher energy transfer from the working fluid to the
turbine. The turbine rotates and connects to a generator converting mechanical energy to electrical energy.
The fluid is then condensed and cycled back through the system. 82
Energent manufactures a variable-phase cycle system to convert geothermal heat to electrical energy and
has created a system for recovering waste heat from large ship engines. Additionally, Energent has been
operating a 1 MW variable phase geothermal power plant.83 From this project, Energent estimates the
system cost to be $2,500/kW.84 One of the benefits of this system is the variable-phase turbine, which can
efficiently expand the multiphase fluid with minimal erosion. Among other improvements, many high-
maintenance parts, such as the waste heat boiler, gearbox, seals, and lube system, are eliminated.85
Energent has operated a 1 MW geothermal power plant, where the only significant issue was solved by
changing heat exchanger type.86 Given temperature of previously used sources, this technology should not
have any significant issues transitioning to low-temperature waste heat to power. The system has been
used in chilling operations with 7-8% efficiency improvements over two phase expansion valves85. A
simple setup of a variable-phase cycle (VPC) system is shown in Figure 4-8. 87
Figure 4-8. Schematic of a simple VPC system.
Advantages
• 20%–40% increase in power output over ORC
• Decreased maintenance cost from the elimination of several parts
Disadvantages
• New technology with limited industrial development
• Requires a high flow rate of working fluid87
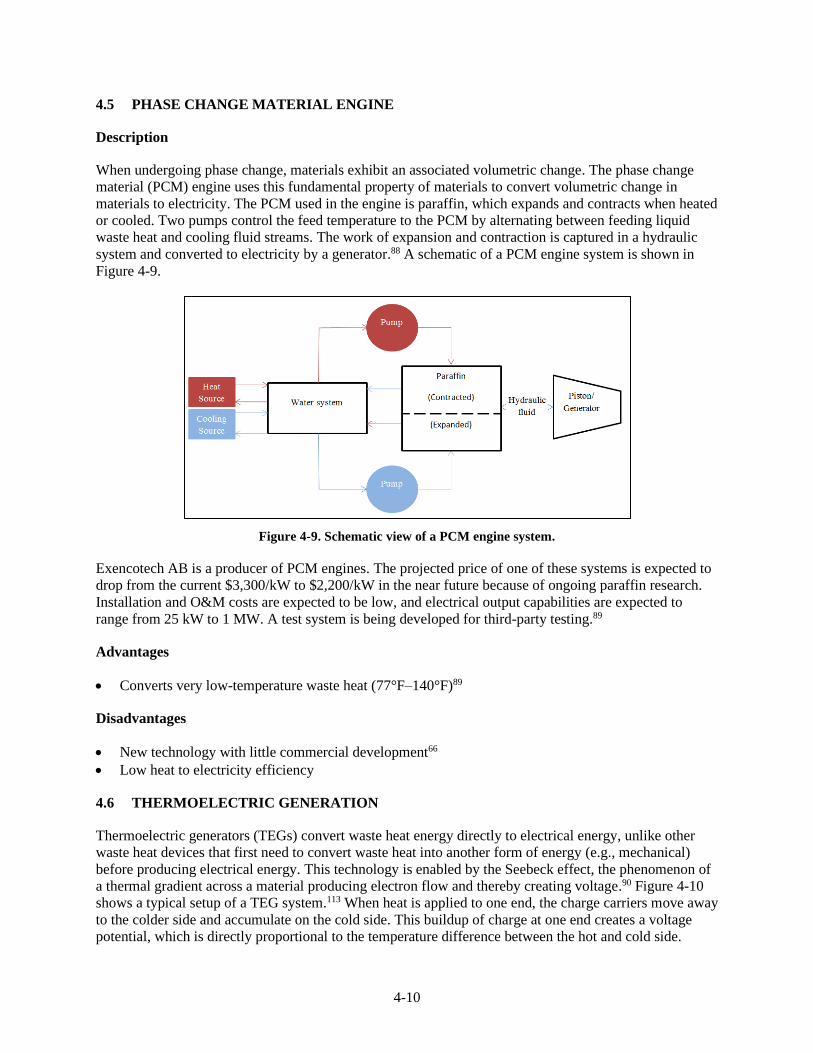
4-10
4.5 PHASE CHANGE MATERIAL ENGINE
Description
When undergoing phase change, materials exhibit an associated volumetric change. The phase change
material (PCM) engine uses this fundamental property of materials to convert volumetric change in
materials to electricity. The PCM used in the engine is paraffin, which expands and contracts when heated
or cooled. Two pumps control the feed temperature to the PCM by alternating between feeding liquid
waste heat and cooling fluid streams. The work of expansion and contraction is captured in a hydraulic
system and converted to electricity by a generator.88 A schematic of a PCM engine system is shown in
Figure 4-9.
Figure 4-9. Schematic view of a PCM engine system.
Exencotech AB is a producer of PCM engines. The projected price of one of these systems is expected to
drop from the current $3,300/kW to $2,200/kW in the near future because of ongoing paraffin research.
Installation and O&M costs are expected to be low, and electrical output capabilities are expected to
range from 25 kW to 1 MW. A test system is being developed for third-party testing.89
Advantages
• Converts very low-temperature waste heat (77°F–140°F)89
Disadvantages
• New technology with little commercial development66
• Low heat to electricity efficiency
4.6 THERMOELECTRIC GENERATION
Thermoelectric generators (TEGs) convert waste heat energy directly to electrical energy, unlike other
waste heat devices that first need to convert waste heat into another form of energy (e.g., mechanical)
before producing electrical energy. This technology is enabled by the Seebeck effect, the phenomenon of
a thermal gradient across a material producing electron flow and thereby creating voltage.90 Figure 4-10
shows a typical setup of a TEG system.113 When heat is applied to one end, the charge carriers move away
to the colder side and accumulate on the cold side. This buildup of charge at one end creates a voltage
potential, which is directly proportional to the temperature difference between the hot and cold side.

4-11
Stacking up of several n-type and p-type semiconductors will result in greater voltage or power
generation potential.
Figure 4-10. Schematic view of a TEG system setup.
For industrial waste heat applications, this technology largely remains in the laboratory development
stage, though there is at least one high-temperature commercial device. Error! Bookmark not
defined.Thermoelectric waste heat generation has two main advantages over other system types: scalability
and rugged design. Most TEG systems are composed of small modules, allowing an easy transition from
small to large scale. As a consequence of its scalability, TEGs have generated interest from the
automotive industry to recover car exhaust, thus providing a funding opportunity for further development.
Additionally, since TEGs contain no moving parts, longer lifetimes are achievable, and less maintenance
is needed.90
The low operational temperature, efficiency, and high materials cost are major barriers for commercial
development of TEGs. Current thermoelectric materials often require temperatures near 500°F to operate
at optimal efficiency with low-grade heat sources. Efficiency of a TE system is relatively low, usually in
the range of 2% to 5%, which does not produce enough electricity to economically justify the purchase.
However, recent advances in nanotechnology have increased the generation efficiency to 15% or higher.10
The most commonly used thermoelectric material, bismuth telluride, is moderately rare and costly,
pushing pricing to around $13,000/kW as opposed to other systems, which are usually priced at
$2,500/kW. 90
Further research into improved thermoelectric material is necessary to make TEGs economically feasible
for low temperatures. For example, Phononic Devices aims to improve the thermoelectric device
efficiency to 30% using silicon nanowires.91 Other research to improve economic and technical viability
of TEG systems includes research at the University of Illinois in stacked silicon nanotube thermoelectric
array and carbon nanotube-polymer thin films at Wake Forest University.92,93
Case Study
Alphabet Energy, Inc.
In October 2014, Alphabet Energy, Inc. introduced a TEG product called “E1,” which is essentially a
generator that uses thermoelectric generation instead of fuel to generate power. The E1 takes waste heat
from industrial machines such as engines and generators. The waste heat can be directed through a
flexible tube to the E1 generator. The E1 generator is made of 32 racks of thermoelectric modules and is
designed in such a way that its components can be switched to another material as materials technology
advances. The materials used in the E1 are the p-type tetrahedrites and the n-type magnesium silicide.30
Alphabet Energy claims that if exhaust from an engine that generates 1,000 kW of electricity from a
diesel fuel is applied to the E1, it can produce close to 25 kW power.73

4-12
4.7 THERMIONIC GENERATOR
Thermionic generator operates in a similar fashion to TEGs in which electric current is produced from the
difference in temperature between two media and without any moving parts. In case of a thermionic
generator, as seen in Figure 4-11,29 a temperature difference between two electrodes (emitter and
collector) generates flow of electrons in an interelectrode space (vacuum, vapor, or plasma) to generate
electricity.
Figure 4-11. Schematic view of a thermionic generator.
Thermal energy is applied by the heat source to the electrons inside the emitter and the collector is
attached to the heat sink to remove the heat from the collector. As thermal energy is applied, the electrons
in the emitter get energized. Once sufficient heat energy is applied, the electrons start moving out from
the emitter, making their way to the colder collector travelling through an interelectrode space. The
negative charge accumulated in the collector will induce a voltage difference between the two electrodes
generating an electric current. The flow of electrons or electricity will continue as the electrons travel
between the emitter and collector. The functionality of this technology is shown to be inefficient and
limited to high-temperature applications, but several attempts have been made to improve the efficiency
and enable use for low-temperature applications.10 The efficiency of thermionic generators ranges
between 10% and 20%, which is slightly better than the TEG range.28,13
4.8 PIEZOELECTRIC GENERATION
Piezoelectric generation systems convert heat to electrical energy through small pressure differences
applied to the piezo material. Exhaust heat transfers to pressurized helium, causing it to vibrate. The
helium working fluid continues to vibrate as it passes the piezoelectric generator, where it provides
pressure and produces mechanical energy. The piezo material then converts this mechanical energy to
electrical energy.
Research to improve these systems largely relies on improving the piezoelectric material properties. The
largest barriers for commercialization of piezoelectric generators for waste heat are efficiency, reliability,
and cost. Piezoelectric generation systems efficiency hovers around 1% and needs significant
improvement to achieve market presence. Lab tests show less than 1 year of reliable production for
current piezoelectric generation systems, far short of the 20 or more years of most commercial systems.1
Laboratory setups for piezoelectric generation systems cost $10,000/W,1 which would result in extremely
lengthy payback periods when compared with commercial WHR systems around $2/W–$3/W.

4-13
4.9 TRANSPORT MEMBRANE CONDENSER
Transport membrane condenser (TMC) technology was developed from the DOE research project
“Advanced Energy and Water Recovery Technology from Low-Grade Waste Heat.” In this process, flue
gas flows through the TMC, where latent heat and sensible heats are recovered along with water vapor.
The water vapor from the waste heat is condensed in pores on the membrane and wicked through the tube
wall, providing heat and water to preheat the cold makeup water. Figure 4-12 shows the TMC setup
placed in a duct, where flue gas passes through the tubes.31
Figure 4-12. Schematic view of TMC system components.
The transport membrane technology could recover low-temperature waste heat from calciners, limekilns,
recovery boilers, and post-cleaning processes. Advantages of TMCs include compact design, corrosion
resistance, modular design, water recovery, and cost-effectiveness. For a boiler heat recovery application,
the TMC had a payback period of 2 years. More tests in industrial settings will improve the TMC system
and introduce the technology to industry. During tests under normal operating conditions, no condensate
formation was noted within the stainless steel TMC enclosure. Commercialization has begun for TMCs
with implementation in boilers as an initial market introduction.52,94,95
Figure 4-13 compares the discussed technologies and their waste heat operating temperature ranges.
Figure 4-13. Comparison of industrial waste heat temperatures and WHR technology
operating temperatures.
50
150
250
350
450
550
650
750
Piezoelectric TMC sCO2 ORC Kalina
Tem
pe
ratu
re (
de
gre
e F
)
WHR Technologies
WHR Technologies Operating Temperatures

4-14
4.10 MICROBIAL HEAT RECOVERY
Microbial heat recovery cell development began in 2012 with funding from the DOE Advanced
Manufacturing Office. The cell designed to use WHR operates as a fuel cell and converts wastewater
effluent streams into electric power or hydrogen. The driving force for the release of electrons is the
energy that is captured using the concentration difference between the high-salinity and low-salinity
streams. The bacteria present in wastewater oxidizes organic matter and release electrons to an electrode
(anode), which passes to a counter-electrode (cathode) producing an electric current.
Figure 4-14. Schematic view of a TMC system components. HC = high salinity; LC = low salinity.
The technology is still in the R&D phase but could save 40 TBtu and 6 million tons of carbon emissions
annually. This technology is expected to salvage heat streams that are considered to be at temperatures
too low for WHR. Additionally, microbial heat recovery is expected to have higher efficiency, higher
yield, and a smaller footprint than conventional WHR, with likely applications in the pulp and paper
industry and chemical, food, pharmaceutical, and refinery markets. The system can be retrofitted into
existing plant operations; however, scaling up this technology, along with the cost for the ion exchange
membrane, remains problematic for commercialization and implementation.96 Initial systems would likely
be for low-volume heat applications because of scalability.
4.11 STIRLING ENGINE
The ideal Stirling cycle is composed of four simple steps: isothermal compression, isovolumetric heating,
isothermal expansion when electricity is generated, and isovolumetric cooling. Because of the cycle’s
near approximation to the Carnot cycle, research interest in Stirling engines has renewed in recent years,
especially in the low-temperature regime, despite historically low efficiencies. The general focus of recent
research has involved low-temperature differential Stirling engines, solar energy conversion, different
general designs (e.g., alpha, beta, gamma), and the more precise analysis of actual system
thermodynamics.97,98,99,100,101 Furthermore, other potential areas of use are being investigated, including
industrial waste heat. Electric output of these systems is typically in the range of a few to tens of
kilowatts, though there is some research into the potential for megawatt-scale systems. Unfortunately,
achieved efficiencies remain significantly below the theoretical potential of such systems.

4-15
4.12 THERMAL STORAGE
One of the factors inhibiting further implementation of WHR systems is the intermittent nature of waste
heat provided by many processes. If the waste heat is cascaded down to a lower-temperature process,
product quality could vary because of fluctuating temperatures or require a heat source to fluctuate
opposite of the waste heat cycle. Alternatively, if the electricity is produced from the heat, energy could
be lost through the need to start and stop the generation cycle. One potential solution to this issue is
coupling thermal storage technology, or the use of materials to capture, hold, and later release thermal
energy with waste heat to power or other continuous heating processes.
The three main categories of thermal storage are sensible, latent, and thermochemical. Sensible storage
involves using a material’s heat capacity to store and release thermal energy, and latent storage uses a
material’s latent heat of formation caused by a phase change. Latent heat systems also use sensible
storage, but the temperature range is generally insufficient for this to be considered significant when
compared with the heat of formation. Thermochemical storage uses chemical bonds as a means of storing
energy, typically through sorption/desorption cycles or by separating the products of a chemical reaction
that will later react to release heat. Although the most widely used of the three is sensible heat storage,
thermochemical storage offers the highest energy storage density.43,102,103
4.13 LOW-TEMPERATURE WASTE HEAT TECHNOLOGIES SUMMARY
In this section, several tables are presented to summarize the discussed conventional and upcoming WHR
systems, as well as several others that were not explicitly outlined in this report. Tables 4-2, 4-4, and 4-5
contain inventories of most available or emerging heat recovery technologies. Table 4-2 focuses on waste
heat to power technologies, and Table 4-4 considers waste heat recycling technologies. Both tables show
the advantages and disadvantages of the technologies, which helped narrow down the technologies of
interest to this report. Selected areas of improvement for ORC, with a focus on efficiency or cost, are
discussed in Table 4-3. Emerging technologies and those in the research phase are described in Table 4-5,
and they have promising commercial appeal. WHR systems are further categorized based on operating
temperature, efficiency, cost, future potential, and current development. ORC and Kalina cycles were
identified to be the commonly used low temperature WHR systems.

4-1
6
Table 4-2. Current waste heat to power technology inventory.
WHR method Brief
description
Operating
temperature WHR status Advantages Disadvantages
ORC
Waste heat
vaporizes a
working fluid
(refrigerant)
that powers a
turbine, which
creates electric
power35
Dependent on the
fluid used;2 302°F–
572°F using
hydrochloro-
fluorocarbon or
hydrocarbon;36
large inlet
temperature
ranging from
≤212°F to 842°F37
Most
commercially
developed low-
temperature
waste heat to
power
technology1
• Adaptable to various heat sources
• Proven technology with great
maturity
• Less complexity and maintenance,
possibility of small scale,
distributed generation system, low
investment and maintenance cost,
good market available with well-
known suppliers39
• Low turbine mechanical stress
• Absence of moisture during the
vapor expansion (which erodes the
blades)
• Automatic and continuous
operation (no operator attendant
required)
• Long life of the plant (>20 years)40
• Closed system and can be used with
CHP36
• Low efficiency—only 8%–15%
(electricity produced/heat
recovered)32
• Relatively high cost
• Hydrochlorofluorocarbon and
hydrocarbon working fluids are
flammable35
• Carnot thermodynamics law
limits the efficiency of the
system, but overall efficiency can
be increased to 95%36 if the
working fluid is further used in a
heat exchanger for district
heating, cooking, or preheating • Organic fluid can be flammable
and toxic; because the system is
closed, this is a small concern36
Kalina cycle
Cycle uses two
working fluids
and the
temperature
difference
between the
heat source and
heat sink to
convert waste
heat to electric
power35
Based on water and
ammonia boiling
point;2 can use heat
sources in 200°F to
1,000°F range41
Some
applications for
WHR in steel
and cement along
with geothermal
power plants41
• Nonflammable working fluid
• Large temperature range
• Tunable to better match heat source
and flow, and responds rapidly to
changes in heat source temperature
and flow41
• Requires a high maximum
pressure to obtain high
thermodynamic performance
• Ammonia is highly toxic and
corrosive35
• Relatively high cost limits
application; heat exchangers
significantly contribute to large
capital and maintenance costs
• Possible ammonia leak35
• Early stage of market
introduction with limited
suppliers41

4-1
7
Table 4-2. Current waste heat to power technology inventory (continued).
WHR method Brief
description
Operating
temperature WHR status Advantages Disadvantages
Thermoelectric
generation
Semiconductor
solids use
temperature
difference to
create electrical
energy2
Dependent on
thermoelectric
material; potential
for low, medium
and high
temperature43
High-
temperature
systems
(>900°F)
entering
market;42 more
R&D needed for
feasible low-
grade heat
recovery
• No moving parts (no/low
maintenance costs)
• Can be used in unmanned sites
• Smaller thermoelectric cells (can
use in space constrained
applications)43
• Potential for integration with other
power systems44
• High costs ($30/W)
• More suitable for medium to
high temperatures with current
technology
• Lack of thorough understanding
of underlying materials structures
and properties
• Short product life44
sCO2 cycle
sCO2 working
fluid is expanded
to generate
mechanical
energy in
turbine; then,
generator
converts
mechanical to
electric energy35
Approximately
390°F–930°F45
Some
applications but
not widely used
• Low environmental impact46
• Nontoxic, naturally abundant, and
inexpensive working fluids43
• Efficient heat exchange
• Compact turbomachinery38
• High cost (≥$2000/kW)36
• Higher pressures than most other
waste heat to power systems
• Not as thoroughly researched as
many other Rankine-related
systems38
Table 4-3. Current research into ORC improvements.
Improvement name Improvement description
Internal heat
exchanger Improves the transfer of heat in subcritical and low-pressure stages of supercritical ORC47
Micro-ORC Downscaling an ORC generator to improve low grade heat, with low power output; achieved isentropic efficiencies for expander and pump were
4.55% and 30% in one experiment48
Optimizing working
fluid for ORC
N-pentane showed the highest maximized energy efficiency (53.2%) and the lowest minimized levelized cost of electricity ($0.0863/kWh) compared to
R245fa and n-pentane/R245fa mixture. 0.05 and 0.1 molar R245fa are more profitable, although the pure fluids have better thermodynamic
performance than n-pentane/R245fa mixture. R245fa has a high manufacturing cost of $37/kg, and n-pentane has the lowest total capital investment of
$3,184/kW49 compared to R245fa and n-pentane/R245fa mixture.
Two-stage ORC
Uses a series double cascading-evaporating strategy (conventional ORC only has one)
Consists of a high- and low-pressure evaporator, high- and low-pressure pump, induction turbine, generator, condenser, cooling pump, and cooling
tower50

4-1
8
Table 4-4. Current waste heat recycling technology database.
WHR method Brief description Operating
temperature WHR status Advantages Disadvantages WHR potential
TMC
Water vapor from flue
gas is transported
through the
membrane structure
by condensation in
the inner separation
layer, followed by the
intermediate layer,
and then the substrate.
Some condensing
liquid blocks other
gas components.51
Highest recovery
rate around 170°F
for metallic
membrane tube51
Developed for
natural gas boiler
flue gas heat and
water recovery,51
commercialized
for boiler
optimization52
• Heated water
recovered from high
moisture
• Elevated temperature
environments
• Low-grade high-
moisture effluent
widely available51
• Research needed to
develop the porous
membranes working
in the capillary
condensation mode;
also, this process
works best with high
moisture in exhaust
gas51
Potential industry
energy savings of
4,139 TBtu/year and
avoided CO2 emissions
of 207.1 million
tons/year51
Rotating
regenerator (heat
wheel)
A wheel made of
heat-conducting
material rotates to
transfer heat between
a stream of waste air
and a stream of fresh
air traveling in
opposite
directions.33Error! B
ookmark not defined.
Known current
commercial
systems operate
well above the
low-temperature
range53
Demonstrated for
space heating from
dryer exhausts33
• Low cost
(commercially
available)
• Designed to facilitate
self-cleaning
• Recovers latent heat33
• Some fluid mixing is
inevitable, so
caution must be
taken when fluids
cannot be mixed
• Heating and cooling
cycles put stress on
heat exchanger,
which causes
cracking33
Effectiveness greater
than 90%33
Mechanical vapor
recompressor
An open cycle takes
the vapor that leaves
the evaporative
process, compresses
it, and recovers vapor
heat.33
—
Common in
whiskey
distilleries in
Scotland33
• Large potential for
expansion in other
food/industry
subsectors33
• Short payback times
• Isentropic efficiency
up to 80%34
— COP of 10 common;
short payback periods33
Plate heat
exchanger
Hot fluid and cold
liquid streams flow
through alternating
channels between
plates, providing a
large surface area for
heat exchange.33
To prevent
corrosion, water
condensation
should be avoided;
suggested 248°F–
347°F for heat
exchangers54
Mature technology
• Gasketed plate heat
exchanger allows for
easy cleaning
• Can be used for almost
all heat exchanger
duties
• Compact size
• Designed for easy
cleaning33
— —

4-1
9
Table 4-4. Current waste heat recycling technology database (continued).
WHR method Brief description Operating
temperature WHR status Advantages Disadvantages WHR potential
Shell heat
exchanger and
tube heat
exchanger
Heat is transferred
from waste gas stream
to fresh air, using a
large surface area of a
shell and tube
design.55
374°F used in a
Thailand study55
Demonstrated in a
case study in the
Thailand textile
industry55
• Shell and tube design
increases surface area,
which increases heat
transfer; the internal
rate of return from the
study was 182%55
—
Reduced fuel
consumption of
322.72 KJ/kg55
Heat pipe
exchanger
Two streams of
working fluid transfer
heat through a
condensation and
evaporation cycle.
Essentially, a bundle
of heat pipes is
assembled similar to
an air-cooled heat
exchanger.46
86°F–392°F46
Some level of
market
introduction since
the early 1990s56
• More efficient heat
exchange with low
grade heat than typical
heat exchangers
• Compact system
• No moving parts, so it
requires less
maintenance
• Needs no input power
for operation31
• Higher cost than
typical heat
exchangers46
—
Heat pump
Heat transfers from
the waste stream
through metal to
organic fluid, and
then to a heated fresh
stream.
Capable of using
heat lower than
176°F54
Mature technology • Simple design and
high efficiency54
• Electricity required
for operation
• Potentially toxic or
flammable working
fluids57
60% energy recovery
for liquid;58 analysis of
malting sites in UK
showed that an exhaust
temperature of 75°C
gave COP of 4.3 and
heat delivered could be
54–109 TJ/yr 55
Vapor
compression heat
pump
The pump compresses
vapor intake and
transfers the vapor
heat.32
Systems with
condenser
temperature over
302°F in
developement33
— • COP of 2–632 —
Significant CO2
emission savings and
short payback times
possible33

4-2
0
Table 4-5. Research into future waste heat to power technology database.
WHR method Brief description Operating
temperature WHR status Advantages Disadvantages WHR potential
Thermoelectric
battery
Heated with waste heat,
charged, and allowed to
cool59
— New technology59
• Uses low-cost,
abundant materials and
manufacturing
processes widely
available in the battery
industry59
• Low power density
compared with
conventional
thermoelectric devices
• Long-term reliability is
still in question
• Speed of battery
charging and
discharging can be
improved59
Electricity
conversion
efficiency of
5.7%—almost
double the
efficiency achieved
by conventional
thermoelectric
devices59
Piezoelectric
generation
Converts mechanical
energy of ambient
vibrations to electrical
energy2
200°F–300°F2
Not yet demonstrated
in industrial
applications;2
DARPA conducting
research to advance
technology44
• Low conversion
efficiency
• High internal impedance
• Requirement for
oscillatory heat loads
• Oscillatory electrical
signals
• Complex oscillatory
fluid dynamics within
the liquid/vapor
chamber
• Difficulties in obtaining
high enough oscillatory
frequencies
• Long-term reliability
and durability
• Very high cost
($10,000/W)44
Ammonia battery
regenerated by
low-grade waste
heat
Reaction between copper
anode and aqueous
ammonia along with
reduction of the copper
cathode produces current.
Heat is used to distill
ammonia out of the
anolyte and directed to the
catholyte. The former
cathode and anode switch
operational use60
— New technology60
• Scalable
• Does not need constant
flow
• Can convert a claim of
29% of chemical energy
to electrical energy
• No added consumption
of fossil fuels60
• Still in research phase,
and unknowns include
the corrosive effects
contaminants in waste
gas, the optimal
temperature to use, and
the cost for
manufacturers36
60 W/m2 power
density produced60

4-2
1
WHR method Brief description Operating
temperature WHR status Advantages Disadvantages WHR potential
Thermoacoustic
heat engine
Contains a high-
temperature heat
exchanger, stack, ambient
temperature heat
exchanger, and resonator.
The temperature gradient
between heat exchangers
pushes the compressible
fluid against the stack,
creating a pressure wave
that is transferred to
mechanical energy61
Study used
302°F61
Emerging
technology61
• Minimal investment and
low-cost ownership
• Simple design and
absence of moving
mechanical parts
• No exotic materials,
close tolerances, or
critical dimensions
• Physically small
compared with ORC
and Kalina cycle
• Converts energy into a
more useful form, so
the heat does not need
direct reuse in the
facility 61
• Further studies needed
to optimize the heat
exchanger design
• Further studies needed
on how thermoacoustic
heat engine technology
responds to large
thermal power input,
mean pressure, and
drive ratio cause
dissipative nonlinear
effects, which could
affect the acoustic
power that the engine
generates
• Design improvements
and material
improvement would
increase the thermal
efficiency61
• Limited heat exchange
surface and must have
uniform temperature
distribution 43
5.38% thermal
efficiency and
1,022 W of
acoustic power,
maximum of
19 kW recovered,60
50 W generated,62
3 kW and 41% of
Carnot
performance63
Vapor absorption
refrigeration
system
Takes the heat from the
steam turbine exhaust and
produces cooled air for
comfort cooling64
Inlet temperature
of water: 228°F;
mass flow rate:
3.76 T/h; inlet
pressure of steam
0.6 kg/cm2 64
Demonstrated in
Indian sugar plant64
• Electrical power
consumption of the
vapor absorption
machine is only around
2% of the power used
by a vapor compression
machine64
• The heat rejected in the
absorption machine is
about 60% more than in
a vapor compression
machine64
75 tons/year of fuel
savings, total
energy recovery of
45,158 KJ/kg more
than vapor
compression
system64
Goswami cycle
Combines the Rankine
cycle and vapor
absorption cycle; uses
binary mixture to produce
power and refrigeration at
the same time35
— Research phase35
• Production of power
and cooling in the same
cycle
• Design flexibility
• Efficient conversion of
moderate temperature
heat sources and the
possibility of improved
resource use35
• System complexity
Goswami cycle
combined with the
Rankine cycle was
found to produce
85 MW max net
work35
Trilateral flash/
VPC
Similar to a binary power
plant, but expansion starts 212°F–482°F65
1 MW geothermal
test plant facility • Very efficient in
recycling power
• Requires high fluid flow
rate87
Potential power
recovery could be

4-2
2
WHR method Brief description Operating
temperature WHR status Advantages Disadvantages WHR potential
from a saturated liquid
rather than a saturated
vapor. Heat is transferred
from the liquid to the
working fluid with high-
temperature matching65
operated86 compared with ORC65 14%–85% more
than ORC65
PCM engine
system
An energy cell converts
heat into mechanical
energy, and then volume
expansion of the material
changing from solid to
liquid produces
electricity66
77°F–140°F89
Demonstration
facility in
development89
• Capable of very low-
temperature recovery89
• The heat source must be
in a liquid form and
water must be available
for cooling. The heat
source and cooling
water have equal flow
rates66
ΔT = 86, efficiency
2%–2.5%;
ΔT = 122,
efficiency 3.8%–
4.4%89
Stirling engine
system
Isothermal compression,
isochoric heating,
isothermal expansion
during when electricity is
generated, and isochoric
cooling. Two-piston
system; exact mechanics
vary
—
A few systems are
nearing market
entrance
• Minimal O&M cost
• Quiet
• High efficiency
possible67
• Mechanically complex
Potential
efficiencies
approaching
Carnot efficiency
Thermionic
generator
Electrons move between
two electrodes in a
vacuum space initiated by
thermal energy to produce
current
—
• Compact device
• Quiet operation
• Few moving parts, low
maintenance
• Operates at high
temperatures
• Metals used for emitter
is expensive since it
must withstand high
temperatures
• Functionality limited to
high-temperature
applications but being
explored in low-
temperature applications
Reported
efficiencies in the
range of 10% to
20% 28,13

5-1
5. ECONOMIC OVERVIEW OF LOW-TEMPERATURE WASTE HEAT TO POWER
SYSTEMS
5.1 INTRODUCTION
Short payback periods are necessary for significant market penetration. Figure 5-1 shows how longer
payback periods result in less interest in investing in a WHR system:1, 104 no industrial respondents were
interested in waste heat to power systems with a 11 year payback period, whereas all were interested if
the payback period was less than 1 year. There is a small chance of purchase and market penetration for
5–10 year payback periods. Short payback periods result in significantly more interest, jumping to a third
of respondents at 4 years and nearly half of respondents at 2 years.
Figure 5-1. Survey results of potential CHP customers and their interest based on time to recuperate
investment, adapted from results of a 2003 Primen survey.
Table 5-1 relates industry interest in waste heat to power systems to system and electricity cost via the
payback period. For this model, O&M costs were assumed to be $0.015/kWh with 6,500 annual
operational hours. Payback periods ranged from 2.4 to 9.5 years (averaging near 6 years) depending on
industrial electricity costs (US average is $0.06/kWh–$0.08/kWh69) and waste heat system costs
($1,500/kW–$2,500/kW). Although this affords the opportunity for heat recovery systems to diffuse into
the market, the system cost needs to decrease to at least the 2 to 5 year payback period for better market
infiltration.
The simple payback period method does not consider depreciating value of money or loss of purchasing
power, so the need for improved economic performance is required for longer payback periods. To help
account for these risks, future cash flow was estimated and converted to present day dollars. The
conversion rate used was based off the interest rate of 20 year US Treasury bills with a small increase for
risk to 4% and converted from an annual to a quarterly rate. However, a low simple payback period
should not be the only consideration for a long-term investment. The long-term savings over the project’s
life may make it more viable than a project with a shorter payback period.
100
63
46
35 34
18
9
00
10
20
30
40
50
60
70
80
90
100
>1 1 2 3 4 5 6 to 10 <11
Inte
rest
in W
HR
sys
tem
s (%
)
Payback period (years)

5-2
Table 5-1. Model determining payback period of CHP.
Initial waste heat to power system cost ($/kW) In
du
stri
al
ele
ctr
icit
y c
ost
($
/kW
h) 1,000 1,500 2,000 2,500 3,000 3,500 4,000
0.05 4.40 6.59 8.79 10.99 13.19 15.38 17.58 0.06 3.42 5.13 6.84 8.55 10.26 11.97 13.68 <5 years
0.07 2.80 4.20 5.59 6.99 8.39 9.79 11.19
0.08 2.37 3.55 4.73 5.92 7.10 8.28 9.47
5–10
years
0.09 2.05 3.08 4.10 5.13 6.15 7.18 8.21
0.10 1.81 2.71 3.62 4.52 5.43 6.33 7.24
>11
years
0.11 1.62 2.43 3.24 4.05 4.86 5.67 6.48 0.12 1.47 2.20 2.93 3.66 4.40 5.13 5.86
As Figure 5-2 shows, systems with longer payback periods (X-axis in months) may accrue greater overall
energy savings than those with shorter payback systems. This baseline data assumes 6,500 hr/yr
operation, installed cost of $2,000/kW, $0.07/kWh electricity, and $0.015/kWh O&M unless otherwise
stipulated. Savings rate is determined by price of electricity, O&M costs, and hours of operation. While
greater risk is involved for such systems, future savings potential can make waste heat to power more
attractive if the system has low O&M or high electricity costs.
Figure 5-2. Time-dependent present value of waste heat to power system savings.
By far, the most established low-temperature waste heat to power technology is the ORC,1 likely because
the ORC offers the widest range of electricity outputs and lowest established cost (Figure 5-3). For ORC
systems, the largest portion of cost comes from the turbine and heat exchange devices (see Figure 5-4 for
more details).105 Comparing Figures 5-4,105 5-5,106 and 5-6,107 general trends in cost intensity can be noted.
The single largest cost of these systems is the electricity producing component (i.e., the turbine or engine)
followed by heat exchanging devices, boilers, and condensers. There are many opportunities for
decreasing cost, including heat exchanger materials with a higher coefficient of thermal conduction; novel

5-3
turbine materials or designs to decrease weight, decrease material cost, and increase lifetime; and
manufacturing techniques that minimize material and energy used for fabrication.
Figure 5-3. Agglomerated cost-size data from industry for comparing different types of waste
heat to power systems.
Economies of scale are another important aspect of waste heat to power systems production, both in
system size and product demand. As Figure 5-3 shows, maximum electrical output has at least as
significant of an effect on the normalized price ($/kW) as the type of system. Therefore, it is currently far
more economical for facilities with large waste streams to purchase a waste heat to power system despite
increased initial capital invested because the payback time decreases with normalized cost. Research
efforts are ongoing to make smaller output systems more economical.
Micro-ORC systems are one of the most widely researched systems in the low output heat to power field.
These systems share the design simplicity of their larger counterparts. Because of these similarities, a
strong knowledge base exists for design parameters and potential issues for micro-ORC, making the
extension a logical step for the waste heat to power industry into low-output systems.
Figure 5-4. Component cost breakdown of an ORC heat recovery system.
0
1000
2000
3000
4000
5000
6000
7000
8000
1 10 100 1000 10000
$/k
W
Maximum electric output rating (kW)
ORC
sCO2
VPC
PCM
Stirling
Refrigerant, 1% Fan, 6% Cooling Tower, 9%
Evaporator, 20%
Condenser, 3%
Pump, 4%
Turbine, 57%

5-4
In the same output power region as micro-ORC systems, other system types begin supplanting ORC as
the most cost efficient. Figure 5-3 shows that around 10 kW, both PCM and Stirling engines provide
greater cost savings than ORC. The PCM engine provides the added advantage of operating at
temperatures well below that of most systems,89 and Stirling engines are capable of extraordinary
efficiencies with some modern equipment reaching 65%–70% of the Carnot cycle.108
Figure 5-5. Component cost breakdown of a VPC heat recovery system.
Figure 5-6. Component cost breakdown of a Stirling engine heat recovery system.
At the other end of the output spectrum, Kalina cycle, VPC,85 and sCO2109 systems also provide high
efficiencies; however, the normalized cost remains similar to the smaller Stirling and PCM systems while
ORC normalized cost decreases with increasing output. In addition to the previously discussed economy
of scale, economy of scale with respect to product demand is also a factor. The drop in normalized cost
around 1 and 10 MW coincides with areas of industry that have seen some of the most significant waste
heat to power usage, namely the cement industry, which regularly uses units in this power range. Having
been the established waste heat to power system, ORCs would have been produced on a wider, and
therefore less expensive, scale than other systems of equivalent size.
Valves and Instruments, 7%
Heat Exchanger, …
Condenser, 15%
Turbine-Generator, 21%Pumps, 9%
Inventory Tank, 3%
Refrigerant, 13%
Other, 21%
Pumps, 5.6%Heat Exchanger,
9%
Installation, 5%
Inverter, 8%
Other, 7.4%
Engine, 65%

5-5
Location of the facility is another important factor in determining the viability of a waste heat to power
system. As Table 5-1 and Figure 5-2 show, the price of electricity is a major influence on the economic
viability for waste heat to power projects. Although the approximate United States industrial average
electricity cost was used to find typical payback, the actual cost paid varies significantly by region.
Figure 5-7 shows several regions of higher electricity cost using the spark spread (the difference between
electricity and natural gas prices).69 For industry in regions with a larger spark spread, waste heat to
power systems are more feasible because of the higher savings from avoided electricity costs.
Figure 5-7. Spark spread for selected regions of higher electricity costs.
In addition to energy prices, a few states acknowledge waste heat to power as a renewable equivalent
source of energy and provide economic incentive for implementation32 (more information can be found in
the Database of State Incentives for Renewables and Efficiency).110 In California, there is a cap and trade
system on CO2 emissions, with recent costs around $12.50/metric ton of CO2 emissions,111 which could
decrease the payback period and increase potential savings for WHR systems.
5.2 CONCLUSIONS
Because of the large amount of waste heat produced in the low-temperature regime by industry,
significant opportunities for WHR exist. The most efficient use of low-temperature waste heat is
recycling or reuse for process heating or preheating. The absence of such a process makes waste heat to
power systems more economically favorable for many facilities to lower cost and emissions while
recovering waste.
Although several system types offer higher efficiency, the ORC most often requires the least initial
investment to be paid back, giving it an economic edge. For significant market penetration of other new
and emerging technologies, payback period needs to be attractive with cost reduction of turbine/expanders
and heat exchangers, along with improvement in efficiencies. Significantly increased interest in
purchasing waste heat to power systems should manifest with a system price drop, O&M decrease, or
electricity cost increase that results in shorter payback periods.
-5
0
5
10
15
20
25
30
Jul-09 Nov-10 Apr-12 Aug-13 Dec-14 May-16
Spar
k Sp
read
(ce
nts
/kW
h)
U.S Average
Pacific Noncontiguous
New England
Pacific Contiguous
Middle Atlantic

5-6
REFERENCES
1. Elson, A., Tidball, R., and Hampson, A., Waste Heat to Power Market Assessment, ORNL/TM-
2014/620, ICF International, 2015.
2. BCS, Inc., Waste Heat Recovery: Technology and Opportunities in U.S. Industry, Industrial
Technologies Program, 2008.
3. Thekdi, A., Nimbalkar, S., Industrial Crosscutting Research and Development Priorities to Address
Waste Energy Minimization and Recovery, ORNL/TM-2014/622, Oak Ridge National Laboratory,
2014.
4. Industrial Heating Equipment Association, Improving Process Heating System Performance: A
Sourcebook for Industry, 2nd ed., 2007.
5. Harrell, G., Steam System Survey Guide, ORNL/TM-2001/263, Oak Ridge National Laboratory,
2001.
6. US Environmental Protection Agency (EPA) and Combined Heat and Power (CHP) Partnership
report prepared by ICF International, 2015.
7. Capstone Turbines, “Products.” [Online] Available at http://www.capstoneturbine.com/products/c30
8. US Energy Information Agency, Manufacturing Energy Consumption Survey (MECS), 2013.
[Online] Available at https://www.eia.gov/consumption/manufacturing/data/2010/
9. North American Manufacturing Co., North American Combustion Handbook, 3rd ed., Cleveland,
OH, 1986.
10. Jouhara, H., Navid, K., Sulaiman, A., Bertrand, D., Amisha, C., and Savvas, T., “Waste Heat
Recovery Technologies and Applications,” Thermal Science and Engineering Progress 6, 268–289,
2018.
11. Valdimarsson, P. and Eliasson, L., “Factors Influencing the Economics of the Kalina Power Cycle
and Situations of Superior Performance,” International Geothermal Conference, 2003.
12. US Department of Energy, “Use Feedwater Economizers for Waste Heat Recovery,” Steam Tip
Sheet #3, 2012. [Online] Available at http://energy.gov/eere/amo/downloads/use-feedwater-
economizers-waste-heat-recovery
13. Bickerton, I., and Fox, N. A., “Improving the Efficiency of a Thermionic Energy Converter Using
Dual Electric Fields and Electron Beaming”, Frontiers in Mechanical Engineering 3, 14, 2017.
14. Shah , R. K., and Sekulic, D. P., Fundamentals of Heat Exchanger Design, John Wiley & Sons, NY,
2003.
15. Trinks, W., and Mahoney, M. H., Industrial Furnaces, 4th ed., John Wiley & Sons, NY, 1967.
16. Industrial Heating Equipment Association. [Online] Available at www.ihea.org.
17. Combustion and Energy Systems, Ltd. [Online] Available at www.combustionandenergy.com
18. Condex Economizer System brochure. [Online] Available at http://www.condexenergy.com/
19. Morales, A. M., “Final Work: Compact Heat Exchangers, Design and Applications,” SlideShare,
2013. [Online] Available at www.slideshare.net/adlinilda/compact-heat-exchangers
20. Kays, W. M., Bernard, D., London, A. L., and London, A. L., Compact Heat Exchangers, 3rd ed.
Krieger Publishing Company, 1998.
5-7
21. Hesselgreaves, T. E., Compact Heat Exchangers: Selection, Design and Operation, published by
Elsevier Science Ltd., London UK, 2001.
22. Alfalaval Compact Heat Exchangers. [Online] Available at https://www.alfalaval.com/increase-
efficiency/products/compact-heat-exchangers/
23. Tranter Heat Exchangers. [Online] Available at http://www.tranter.com/about-us
24. Jacobs, R., et al. “Status and Outlook: Industrial Heat Pumps”, International Refrigeration and Air
Conditioning Conference, Purdue University, USA. 2010.
25. “Industrial Heat Pumps”, Emerson Climate Technologies. [Online] Available at
https://climate.emerson.com/documents/vilter-heat-pump-white-paper-en-us-5411194.pdf
26. Blatchley C. G., and Stratton H. J., “The Performance of Thermocompressors as Related to Paper
Machine Dryer Drainage Systems”, Schutte and Koerting. [Online] Available at www.s-
k.com/articles/PerformanceThermocompressors.pdf
27. Papar, R., “Absorption Chillers and Refrigeration,” Presentation at Southern California Gas
Company, 2010.
28. National Aeronautics and Space Administration (NASA), “Portable Compact Thermionic Power
Cell”, Category: Power Generation and Storage, Reference No: LAR-TOPS-294, Case No: LAR-
18860-1. [Online] Available at https://ntts-prod.s3.amazonaws.com/t2p/prod/t2media/tops/pdf/LAR-
TOPS-294.pdf.
29. Kamarul, K., Thye, L., and Khairudin, M., “Review on Thermionic Energy Converters,” IEEE
Transactions on Electron Devices 63:6, 2231–2241, 2016.
30. US Department of Energy, “Direct Thermal Energy Conversion Materials, Devices, and Systems,”
Quadrennial Technology Review 2015, Technology Assessment Chapter 6, 2015. [Online] Available
at https://www.energy.gov/sites/prod/files/2015/12/f27/QTR2015-6G-Direct-Thermal-Energy-
Conversion-Materials-Devices-and-Systems.pdf.
31. Nimbalkar, S., and Thekdi, A., Industrial Waste Heat Recovery: Potential Applications Available
Technologies and Crosscutting R&D opportunities (E. a. T. S. Division, Trans.), Oak Ridge National
Laboratory and E3M, Inc, 2014.
32. Amarnath, K. R., Waste Heat Recovery in Industrial Facilities: Opportunities for Combined Heat
and Power and Industrial Heat Pumps, California Electric Power Research Institute, 2010.
33. Law, R., Harvey, A., and Reay, D., “Opportunity for Low-grade Heat Recovery in the UK Food
Process Industry,” Sustainable Thermal Energy Management in the Process Industries International
Conference, 2011.
34. Arzbaecher, C., Fouche, E., and Parmenter, K., “Industrial Waste Heat Recovery: Benefits and
Recent Advancements in Technology and Applications,” at the ACEEE Summer Study on Energy
Efficiency in Industry, 2007.
35. Kumar, U., and Karimi, M. N., “Low Grade Waste Heat Recovery for Optimized Energy
Efficiencies and Enhanced Sustainability in Process Industries: A Comprehensive Review,”
International Journal of Multidisciplinary Sciences and Engineering, Vol. 5, No. 4, 2014.
36. Nimbalkar, S., Waste Heat Recovery from Industrial Process Heating Equipment, Lawrence Berkley
National Laboratory Seminar, 2013.
37. Goel, S., Gerzog, O., Datta, A., Sonde, R. R., Deshpande, K., Fink, J., and Schumacher, T., Market
Potential Study for Organic Rankine Cycle Technology in India, Indo-German Energy Forum, 2014.

5-8
38. Haddad, C., Perilhon, C., Danlos, A., Francois, M., and Descombes, G., “Some Efficient Solutions to
Recover Low and Medium Waste Heat: Competitiveness of the Thermoacoustic Technology,”
International Conference on Technologies and Materials for Renewable Energy, 2014.
39. Tchanche, B., Petrissans, M., and Papadakis, G., “Heat resources and organic Rankine cycle
machines,” Renewable and Sustainable Energy Reviews, Vol. 39, 1185–1199, 2014.
40. Turboden: Organic Rankine Cycle, 2015. [Online] Available at
http://www.turboden.eu/en/rankine/rankine-advantages.php
41. International Finance Corporation and Institute for Industrial Productivity, Waste heat recovery for
the cement sector: Market and supplier analysis, 2014.
42. Personal Communication with Alphabet Energy. July 2015.
43. Viklund, S., and Johansson, M., “Technologies for utilization of industrial excess heat: Potentials for
energy recovery and CO2 emission reduction,” Energy Conversion and Management, Vol. 77, Pp
369-379, 2013.
44. Hendricks, T., Engineering scoping study of thermoelectric generator systems for industrial waste
heat recovery, Pacific Northwest Laboratory, Industrial Technologies Program, 2006.
45. Kacludis, A., “Supercritical CO2 Refines Cogeneration,” Cogeneration and on-site power
production, Power Engineering International, 2013. [Online] Available at
https://www.powerengineeringint.com/coal-fired/equipment-coal-fired/supercritical-co2-refines-
cogeneration/
46. Ammar, Y., Joyce, S., Norman, R., Wang, Y., and Roskilly, A., “Low Grade Thermal Energy
Sources and Uses from the Process Industry in the UK,” Applied Energy 116, 387–397, 2011.
47. Zhu, Y., Hu, Z., Zhou, Y., Jiang, L., and Yu, L., “Discussion of the Internal Heat Exchanger's Effect
on the Organic Rankine Cycle,” Applied Thermal Energy 75, 334–343, 2015.
48. Yamada, N., Tominaga, Y., and Yoshida, T., “Demonstration of 10-W micro Organic Rankine Cycle
Generator for Low-grade Heat Recovery,” Energy, Elsevier, Vol. 78(C), 806–813, 2014.
49. Le, V., Khieri, A., Feidt, M., and Pelloux-Prayer, S., “Thermodynamic and Economic Optimization
of a Waste Heat to Power Plant driven by a Subcritical ORC using Pure or Zeotropic Working
Fluid,” Energy, Elsevier, Vol. 78(C), 622–638, 2014.
50. Li, T., Wang, Q., Zhu, J., Hu, K., and Fu, W., “Thermodynamic Optimization of Organic Rankine
Cycle using Two-stage Evaporation,” Renewable Energy, Vol. 75, 654–664, 2015.
51. Wang, D., Advanced Energy and Water Recovery Technology from Low Grade Waste Heat: Final
Technical Report, Prepared for Gas Technology Institute, 2011.
52. Cannon Boiler Works, Cannon Boiler Works Ultramizer Insert. [Online] Available at
http://cannonboilerworks.com/wp-content/uploads/Ulramizer_R1.pdf
53. Anderson, B. N., Personal communication with author 2017 .
54. Hammond, G. P., and Norman, J. B., “Heat Recovery Opportunities in the UK,” Applied Energy 116,
387–397, 2014.
55. Pattanapunt, P., Hussaro, K., Bunnakand, T., and Teekasap, S., “Waste Heat Recovery from Boiler
of Large-scale Textile Industry,” American Journal of Environmental Science 9:3, 231–239, 2013.
56. Shi, C., Wang, Y., Yang, Y., and Liao, Q., “Heat Transfer Effectiveness of Three-fluid Separated
Heat Pipe Exchanger,” Science Press and Institute of Engineering Thermophysics, CAS and
Springer-Verlag Berlin Heidelberg, 2010.

5-9
57. Industrial Heat Pumps, Frequently Asked Questions. [Online] Available at
http://www.industrialheatpumps.nl/en/f_a_q/
58. Bonilla, J. Blanco, J., Lopez, L., and Sala, J., “Technological Recovery Potential of Waste Heat in
the Industry of the Basque Country,” Applied Thermal Engineering 17:3, 283–288, 1997.
59. Bradley, R., “Batteries that Capture Low Grade Waste Heat: A Third of all Energy Wasted in the
U.S. Could Produce Electricity Instead,” Scientific American, a Division of Springer Nature
America, Inc. Scientific American 311, 6, 53, 2014.
60. Messer, A., Low-grade Waste Heat Regenerated Ammonia Battery, Penn State News, 2014. [Online]
Available at https://news.psu.edu/story/336898/2014/12/03/research/low-grade-waste-heat-
regenerates-ammonia-battery
61. Mumith, J., Makatsorsis, C., and Karayiannis, T. G., “Design of a Thermoacoustic Heat Engine for
Low Temperature Waste Heat Recovery in Food Manufacturing,” Applied Thermal Engineering
65:1–2, 588–596, 2014.
62. Normah, M. G., Irfan, A. R., Koh, K. S., Manet, A., and Zaki, A. M., “Investigation of a Portable
Standing Wave Thermoacoustic Heat Engine,” Procedia Engineering 56, 829–834, 2013.
63. Tijani, T. M., and Spoelstra S., “A Hot Air Driven Thermoacoustic Stirling Engine,” Applied
Thermal Engineering 61:2, 866–870, 2013.
64. Balaji, K., and Ramkumar, R., “Study of Waste Heat Recovery from Steam Turbine Xhaust for
Vapour Absorption System in Sugar Industry,” Procedia Engineering, Vol. 38. Pp1352-1356, 2012.
65. Smith, I., Stosie, N., and Aldis, C., “Trilateral Flash Cycle System: A High Efficiency Power Plant
for Liquid Resources,” Proceedings of the World Geothermal Congress; Firenze, Italy, pp. 2109–
2113, 18–31 May 1995.
66. Johansson, M., and Soderstrom, M., “Electricity generation from low temperature industrial excess
heat-an opportunity for the steel industry,” Energy Efficiency 7, pp. 203-215, 2014.
67. Abraham, N., Cool Energy Inc. [Online] Available at https://coolenergy.com/resources/information-
library/
68. Arvay, P., Muller, M., Ramdeen V., and Cunningham C., “Economic implementation of the organic
Rankine cycle in industry,” ACEEE Summer Study on Energy Efficiency in Industry, 2011.
69. US Energy Information Administration, Electricity data browser. [Online] Available at
http://www.eia.gov/electricity/data/browser/
70. Thekdi, A., Waste Heat Management Options: Industrial Process Heating Systems, 2009.
71. Kalina, A., “New binary geothermal power system,”, Proceedings of the International Conference
on Geothermal Power Engineering, Sochi, Russia, October 2003. [Online] Available at
http://www.geothermal-energy.org/pdf/IGAstandard/Russia/IGW2003/W00024.PDF
72. Sjoding, D., “Overview of Waste Heat Recovery for Power and Heat,” at the Waste Heat Recovery
for Power and Heat Workshop, Chicago, IL, 2010.
73. Lamonica, M., “A Thermoelectric Generator That Runs on Exhaust Fumes,” IEEE Spectrum, 2014.
[Online] Available at https://spectrum.ieee.org/energywise/green-tech/conservation/a-thermoelectric-
generator-that-runs-on-exhaust-fumes.
74. “Kalina Cycle Power Systems in Waste Heat Recovery Applications,” Global Cement Magazine,
August 2012. [Online] Available at http://www.globalcement.com/magazine/articles/721-kalina-
cycle-power-systems-in-waste-heat-recovery-applications

5-10
75. “Iron and Steel Industry-Waste Heat Recovery,” Global Geothermal – Advanced Waste Heat
Engineering, 2015. [Online] Available at http://www.globalgeothermal.com/IronSteelIndustry.aspx
76. Whittaker, P., “Corrosion in the Kalina Cycle - An investigation into corrosion problems at the
Kalina cycle geothermal power plant in Husavik, Iceland,” (Master thesis). A Master's thesis done at
RES | the School for Renewable Energy Science in affiliation with University of Iceland & the
University of Akureyri. Akureyri, February 2009. [Online] Available at
http://skemman.is/stream/get/1946/7042/17795/1/Peter_Whittaker.pdf
77. Giese, G., Personal communication with the author, July 2015.
78. Persichilli, M., Kacludis, A., Zdankiewicz, E., and Held, T., “Supercritical CO2 Power Cycle
Developments and Commercialization: Why sCO2 can Displace Steam Echogen Power Systems
LLC,” at Power-Gen India & Central Asia, 2012. [Online] Available at
http://www.echogen.com/documents/why-sco2-can-displace-steam.pdf
79. Echogen. Applications: Marine. Echogen Power Systems, July 2015. [Online] Available at
http://www.echogen.com/our-solution/applications/marine/
80. Universal Industrial Gases, Inc., Material safety data sheet: Gaseous CO2, 2015. [Online] Available
at http://www.uigi.com/MSDS_gaseous_CO2.html
81. Persichilli, M., Held, T., Hostler, S., and Zdankiewicz, E., Klapp, D., “Transforming Waste Heat to
Power through Development of a CO2-Based Power Cycle,” Presented at Electric Power Expo by
Echogen Power Systems LLC and American Electric Power, Rosemount, IL U.S., May 2011.
[Online] Available at http://www.echogen.com/documents/transforming-waste-heat-to-power-
russia.pdf
82. Giron, M., and Hays, L., Scale Resistant Heat Exchangers for Low Temperature Geothermal Binary
Cycle Power Plant: Final Report, Energent Corporation, November 2014.
83. Energent Corporation. Cryogenic Industries. [Online] Available at http://energent.net/projects/waste-
heat.html.
84. Hays, L., Personal communication with the author. June 2015.
85. Welch, P., and Boyle, P., New Turbines to Enable Geothermal Power Plants, Energent Corporation,
GRC Transactions, Vol. 33, 2009. [Online] Available at
http://www.energent.net/documents/Geothermal_Resources_Council_2009_Paper.pdf
86. Geothermal Technologies Peer Review Summary: Variable Phase Turbine Demonstration, 2011.
87. Fischer, J., “Comparison of Trilateral Cycles and Organic Rankine Cycles,” Energy, 36, pp. 6208–
6219, 2011.
88. Östlund, B., US Patent WO2009126080 A1: An Energy Cell. April 2008. Exencotech Ab.
89. Östlund, B., Personal communication with the author. June 2015.
90. Hill, J., “Study of Low-Grade Waste Heat Recovery and Energy Transportation Systems in Industrial
Applications,” Thesis; Alabama University, Department of Mechanical Engineering, University of
Alabama, 2011.
91. Kolodny, L., Phononic Devices Raises $10 Million to Turn Heat Waste into Energy. TechCrunch
Daily. February 23, 2011. [Online] Available at http://techcrunch.com/2011/02/23/phononic-devices-
10-millio/
92. Cross-campus team receives ARPA-E funding to develop waste heat capture system, Engineering at
Illinois, November 2, 2009. [Online] Available at http://engineering.illinois.edu/news/article/2009-
11-02-mechse-professor-receives-arpa-e-funding-develop-novel-waste-heat-capture-system

5-11
93. Johnson, D., Carbon Nanotube-enabled “Power Felt” Could Eventually Power Your Cell Phone,
IEEE Spectrum, 2012. [Online] Available at
http://spectrum.ieee.org/nanoclast/semiconductors/nanotechnology/will-carbon-nanotubeenabled-
power-felt-be-powering-your-cell-phone-soon
94. Wang, D., Energy and water recovery with transport membrane condenser, Public Interest Energy
Research (PIER) Program prepared by Gas Technology Institute, 2013.
95. Gas Technology Institute, Advanced waste heat & water recovery system demonstration at L.&N.
costume and linen service, 2011. [Online] Available at
http://www.ventcondenser.com/documents/White%20Paper_TMC-
Based%20HeatWater%20Recovery%20for%20LN.pdf
96. US Department of Energy, Bioelectrochemical Integration of Waste Heat Recovery, Waste-to-
Energy Conversion, and Waste-to-Chemical Conversion with Industrial Gas and Chemical
Manufacturing Processes, Industrial Technologies Program, 2013. [Online] Available at
http://energy.gov/sites/prod/files/2014/06/f17/5750_bioelectrochemical_integration_waste_heat_fact
sheet.pdf.
97. Puech, P. and Tishkova, V., “Thermodynamic analysis of a Stirling engine including regenerator
dead volume,” Renewable Energy 36:2, 872–878, 2011.
98. Karabulut, H., Yücesu, H. S., Çınar, C., and Aksoy, F., “An experimental study on the development
of a β-type Stirling engine for low and moderate temperature heat sources,” Applied Energy, Vol. 86,
pp. 68–73, 2009.
99. Kongtragool, B., and Wongwises, S., “Investigation on Power Output of the Gamma-configuration
Low Temperature Differential Stirling Engines,” Renew Energy, Vol. 30:3, pp. 465–476, 2005.
100. Shendage, D. J., Kedare, S. B., and Bapat, S. L., “An Analysis of Beta Type Stirling Engine with
Rhombic Drive Mechanism,” Renewable Energy, Vol. 36:1, pp. 289–297, 2011.
101. Scollo, L. S., Valdez, P. E., Santamarina, S. R., Chini, M. R., and Barón, J. H., “Twin Cylinder
Alpha Stirling Engine Combined Model and Prototype Redesign,” Hydrogen Energy, Vol. 38:4, pp.
1988–1996, 2013.
102. Lui, H., Nagano, K., Suggiyama, D., Togawa, J., and Nakamura, M., “Honeycomb Filters made from
Mesoporous Composite Material for an Open Sorption Thermal Energy Storage System to Store
Low-temperature Industrial Waste Heat,” International Journal of Heat and Mass Transfer, Vol. 65,
pp. 471–480, 2013.
103. Haider, M., and Werner, A., “An overview of state of the art in the fields of sensible, latent and
thermochemical thermal energy storage,” e & i Elektrotechnik und Informationstechnik 130:6,
pp.153–160, 2013.
104. Primen, Converting Distributed Energy Prospects into Customers, Primen’s 2003 Distributed
Energy Market Study, Boulder, Colorado, 2003.
105. Mortada, S., Aaraj, Y., Clodic, D., Said, W., and Ksayer, E. B., “Organic Rankine Cycle in Industrial
Processes,” Proceedings of ECOS 2013, the 26th International Conference on Efficiency, Cost,
Optimization, Simulation and Environmental Impact of Energy Systems, July 16–19, 2013.
106. Hays, Lance., “Demonstration of a Variable Turbine Power System for Low Temperature
Geothermal Resources,” Energent Corporation, 2012. [Online] Available at
https://www.osti.gov/servlets/purl/1136547
107. Cool Energy Inc., Business Overview. Available at http://coolenergy.com/wp-
content/uploads/2014/04/Cool-Energy-Strategic-Introduction-1405201.pdf

5-12
108. Thombare, D. G., and Verma, S. K., “Technological Development in the Stirling Cycle Engines,”
Renewable and Sustainable Energy Reviews 12:1, pp. 1–38, 2008.
109. Sarkar, J., “Review and Future Trends of Supercritical CO2 Rankine Cycles for Low-grade Heat
Conversion,” Renewable and Sustainable Energy Reviews 48, pp. 434–451, 2015.
110. NC Clean Energy Technology Center, US Department of Energy. Database of State Incentives for
Renewables & Efficiency. Available at http://www.dsireusa.org/
111. California Cap-and-Trade Program and Quebec Cap-and-Trade System. May 2015 Joint Auction #3:
Summary Results Report.
112. Alimonti, C., and Mohammadzadeh, M., Geothermal Energy Project: A power plant for Húsavík,
Iceland, 2019. 10.13140/RG.2.2.23399.80804.
113. Sigma-Aldrich, Materials for Advanced Thermoelectrics, 2015, Retrieved June 29, 2015, [Online]
Available at http://www.sigmaaldrich.com/materials-science/metal-and-ceramic-
science/thermoelectrics.html.
114. Lines, J., Heat Exchangers in Municipal Wastewater Treatment Plants, Graham Manufacturing
Company, Water Engineering & Management, 9, pp. 28-29, 1991.
Reference Material for Additional Information
i. Prepared for Sabine Brueske, Ridah Sabouni, Chris Zach, and Howard Andres, US Manufacturing
Energy Use and Greenhouse Gas Emissions Analysis, ORNL/TM-2012/504, Energetics, Inc.,
prepared for Oak Ridge National Laboratory, November 2012.
ii. Thekdi, A., and Bennett, R., Identifying opportunities for waste heat reduction, Energy Matters
2005.
iii. V.V. Viswanthan et al., Opportunity Analysis for Recovering Energy from Industrial Waste Heat
and Emissions, Pacific Northwest National Laboratory, April 2006.
iv. M. Kirschen, H. Pfeifer, F. J. Wahlers, H. Mees, “Off-gas Measurements for Mass and Energy
Balances of a Stainless Steel EAF,” Electric Furnace Proceedings, PR-325-56, Institute for
Industrial Furnaces, Aachen, Germany, Association for Iron and Steel Technology 2001.
v. Association for Iron and Steel Technology, US production capability, imports, and inventories, Iron
and Steel Technology, July, p. 18, 2014.
vi. Eric Stuart, “Environment and energy impacting U.S. EAF steelmaking sector,” presented at Steel
Forum, Steel Manufacturers Association, October 18, 2012.
vii. Euan J. Evenston, Howard D. Goodfellow and Michael J. Kempe, “EAF Process Optimization
through Off-gas Analysis and Closed-loop Process Control at Deacero, Saltillo, Mexico,” Electric
Furnace Proceedings, PR-324-005, 2000.
viii. Thekdi Arvind, Process Heating Qualified Specialist Training, 2015.
ix. Andrew Dasinger, Rajul Misra, An Inventory of Industrial Waste Heat and Opportunities for
Thermally Activated Technologies. Prepared by United Technologies Research Center. Prepared for
Oak Ridge National Lab, 2004.
x. US Environmental Protection Agency, 2001. National Energy Emissions Database
xi. Ozokwelu, D., Porcelli, J., Akinjiola, P., Chemical Bandwidth Study-exergy Analysis: A Powerful
Tool for Identifying Process Inefficiencies in the U.S. Chemical Industry. Prepared by JVP
International and Psage Research, LLC. Prepared for DOE ITP program, 2006.

5-13
xii. Villar, A., Arribas, J., Parrondo, J., “Waste-to-energy Technologies in Continuous Process
Industries,” Clean Technology Environmental Policy, 14, 29-39, 2012.
xiii. Beach, R., Bullock, A.M, Heller, K.B., Domanico, J.L., Muth, M.K., O’Connor, A.C., and Spooner,
R.B., Lime Production: Industry Profile. Research Triangle Institute Center for Economics
Research, prepared for US EPA, 2000.

APPENDIX A. LOW-TEMPERATURE WASTE HEAT SOURCES
FROM MAJOR INDUSTRIAL SECTORS

A-2
APPENDIX A. LOW-TEMPERATURE WASTE HEAT SOURCES FROM MAJOR
INDUSTRIAL SECTORS
No. NAICS
code Application Application area
Lower
temp.
range
(°F)
Higher
temp.
range
(°F)
Waste
heat
form
Heat source
1 325180 Calcining Lime kiln 1,600 1,800 Gas Natural gas or oil or other
2 325180 Calcining Calciner for NAHCO3 650 650 Gas Natural Gas or oil or
other
3 325120 Fluid heating H2 generation steam
reformer, heating 1,500 1,600 Gas
By-product gas or natural
gas
4 325120 Fluid heating
H2 generation steam
reformer, CO
converter
800 800 Gas By-product gas or natural
gas
5 325130 Nonmetal heating TiO2 heater and
vaporizer 1,120 1,120 Gas Electricity or natural gas
6 325130 Drying Pigment dryer 325 325 Gas Electricity or natural gas
7 325130 Fluid heating O2 heater 1,120 1,120 Gas Electricity or natural gas
8 325130 Drying Drying 250 350 Gas Electricity or natural gas
9 325130 Calcining Calciner—TiO2 1,500 1,500 Gas Electricity or natural gas
10 325211 Drying Drying 250 350 Gas Electricity
11 325212 Fluid heating Storage heating 200 250 Gas Electricity or natural gas
12 325220 Fluid heating Reactor heating 450 500 Gas Electricity or natural gas
13 325220 Nonmetal melting Melter 320 320 Gas Electricity
14 325220 Nonmetal melting Polymer melter 450 450 Gas Electricity
15 325220 Curing and forming Polymerizer 540 540 Gas Electricity
16 325412 Drying Drying 200 250 Gas Electricity
17 325110 Fluid heating Preheaters 400 500 Gas By-product gas or natural
gas
18 325110 Fluid heating Steam
heaters/superheaters 750 1,300 Gas
By-product gas or natural
gas
19 325110 Fluid heating Reformer (methanol) 1,500 1,500 Gas By-product gas or natural
gas
20 325110 Fluid heating Shift reactor 500 600 Gas By-product gas or natural
gas
21 325311 Calcining Methane preheating 400 450 Gas By-product gas or natural
gas
22 325311 Fluid heating Reformer (methane) 1,500 1,500 Gas By-product gas or natural
gas
23 324110 Fluid heating Preheating of
crude/feed, etc. 450 500 Gas
By-product gas or natural
gas
24 324110 Fluid heating
Distillation
(atmospheric and
vacuum) heating
750 780 Gas By-product gas or natural
gas

A-3
No. NAICS
code Application Application area
Lower
temp.
range
(°F)
Higher
temp.
range
(°F)
Waste
heat
form
Heat source
25 324110 Fluid heating Coking 900 1,100 Gas By-product gas or natural
gas
26 324110 Drying Material
drying/processing 700 1,000 Gas
By-product gas or natural
gas
27 324110 Fluid heating Lube oil processing 200 450 Steam Steam
28 324110 Fluid heating Reforming 1,100 1,400 Gas By-product gas or natural
gas
29 324110 Fluid heating Recovery boiler CO
burning 1,000 1,600 Gas By-product gas
30 324121 Drying Material
drying/processing 250 400 Gas Natural gas or oil
31 Curing and forming Laminating, casting,
molding 250 350 Gas Electricity or natural gas
32 327211 Nonmetal heating Cullet
drying/preheating 250 1,000 Gas Natural gas
33 327211 Nonmetal heating Annealing 900 1,000 Gas Electricity or natural gas
34 327211 Heat treating Tempering 1,300 1,600 Gas Electricity or natural gas
35 327211 Nonmetal heating Laminating/heating 1,000 1,100 Gas Electricity or natural gas
36 327212 Curing and forming Curing ovens 350 650 Gas Electricity or natural gas
37 327310 Calcining Calcining 500 1,000 Gas Natural gas or coal
38 327120 Drying Drying 250 300 Gas Electricity or natural gas
39 327120 Curing and forming Baking-curing 500 1,600 Gas Electricity or natural gas
40 327999 Drying Drying 250 300 Gas Natural gas
41 327999 Calcining Calcining 500 1,000 Gas Natural gas
42 327993 Curing and forming Curing ovens 350 650 Gas Electricity or natural gas
43 327993 Nonmetal melting Melters 500 1,600 Gas Electricity or other
44 331110 Metal heating Scrap
drying/preheating 350 600 Gas Natural gas or other
45 331110 Metal heating Scrap preheating 1,000 1,200 Gas Natural gas or other
46 331110 Metal heating Load preheating 250 600 Gas Natural gas or other
47 331110 Metal melting Direct fired furnaces 600 2,500 Gas Direct fired furnaces
48 331110 Drying Ladle drying 300 400 Gas By-product gas or natural
gas
49 331110 Metal melting Blast furnace stove air
preheating 200 800 Gas
By-product gas or natural
gas
50 331110 Drying Ore drying 300 400 Gas By-product gas or natural
gas
51 331110 Metal heating Preheating kilns 1,200 1,600 Gas By-product gas or natural
gas
52 Smelting and
agglomeration, etc. Sintering—strand 500 1,500 Gas
By-product gas or natural
gas
53 Smelting and
agglomeration, etc. Sinter cooling (air) 250 600 Gas Other

A-4
No. NAICS
code Application Application area
Lower
temp.
range
(°F)
Higher
temp.
range
(°F)
Waste
heat
form
Heat source
54 331511 Drying Mold drying 500 600 Gas Natural gas or other
55 331511 Metal heating Core baking 400 450 Gas Natural gas or other
56 331511 Metal heating Sand reclamation 800 1,200 Gas Natural gas or other
57 331511 Heat treating Heat treating
(tempering) 300 900 Gas Electricity or natural gas
58 331511 Heat treating
Heat treating
(hardening, heating for
forging
300 1,600 Gas Electricity or natural gas
59 331313 Calcining Calcining 400 800 Gas By-product gas or natural
gas
60 331313 Metal heating Anode baking 500 2,000 Gas Natural gas or oil
61 331314 Metal heating Scrap
drying/preheating 350 600 Gas Natural gas or other
62 331314 Metal heating Melting furnace 1,250 1,350 Gas Electricity or natural gas
63 331314 Heat treating Solution treatment
furnaces 350 400 Gas Electricity or natural gas
64 331314 Metal heating
Direct fired
homogenizing
furnaces
350 1,000 Gas Natural gas
65 Metal melting Sweating furnace 1,000 1,000 Gas By-product gas or natural
gas
66 Metal melting Melting furnace 1,000 1,000 Gas Natural gas
67 Metal heating Mold preheating 250 400 Gas Electricity or natural gas
68 Metal melting Distillation furnace 2,400 2,400 Gas Natural gas
69 Metal heating Scrap
drying/preheating 350 600 Gas Natural gas or other
70 Metal melting Sweating furnace 1,000 1,100 Gas By-product gas or natural
gas
71 Metal melting Melting/refining
furnaces 2,000 2,400 Gas Natural gas or other
72 331315 Metal melting Melting/refining
furnace 1,200 1,400 Gas Electricity or natural gas
73 331315 Metal heating Slab/billet/ingot
preheating 1,000 1,000 Gas Natural gas
74 331315 Heat treating Annealing 400 1,000 Gas Electricity or natural gas
75 331524 Metal heating Scrap
drying/preheating 350 600 Gas Natural gas or other
76 331524 Metal melting Melting furnace 1,250 1,350 Gas Electricity or natural gas
77 331524 Heat treating Solution treatment
furnace 350 400 Gas Natural gas
78 331524 Metal heating Direct fired
homogenizing furnace 350 1,000 Gas Natural gas
79 332811 Heat treating Variety of atmosphere
heat treating processes 400 1,600 Gas Electricity or natural gas

A-5
No. NAICS
code Application Application area
Lower
temp.
range
(°F)
Higher
temp.
range
(°F)
Waste
heat
form
Heat source
80 332431 Fluid heating Metal cleansing and
rinsing 200 500 Gas Steam or natural gas
81 332431 Drying Drying ovens 200 400 Gas Electricity or natural gas
82 332431 Fluid heating Thermal oxidizers 400 1,400 Gas Natural gas or other
83 332312 Fluid heating Metal cleansing and
rinsing 200 500 Gas Steam or natural gas
84 332312 Drying Drying ovens 200 400 Gas Electricity or natural gas
85 332312 Fluid heating Thermal oxidizers 400 1,400 Gas Natural gas or other
86 332111 Metal heating Preheating prior to
induction heating 600 1,400 Gas Natural gas or other
87 332111 Heat treating Annealing 400 700 Gas Electricity or natural gas
88 332111 Heat treating Heat treatment 400 700 Gas Electricity or natural gas
89 332216 Curing and forming Paint drying 200 350 Gas Electricity or natural gas
90 332216 Heat treating Heat treatment 1,000 1,600 Gas Electricity or natural gas
91 311340 Drying Beet sugar production
charcoal regenerator 200 200 Gas Electricity or natural gas
92 311211 Drying Drying for feed and
product 300 450 Gas Electricity or natural gas
93 311340 Nonmetal heating Cane sugar refining 900 900 Gas Electricity or natural gas
94 311340 Calcining Beet sugar production
lime kiln 600 600 Gas Electricity or natural gas
95 313210 Nonmetal heating Singeing 400 400 Gas Electricity or natural gas
96 321920 Drying Fiberboard
stabilization/drying 350 350 Gas Electricity or natural gas
97 322110 Calcining Lime kiln 1,200 1,200 Gas Natural gas or oil or other
98 322121 Calcining Lime kiln 1,200 1,200 Gas Natural gas or oil or other
99 323117 Fluid heating Fluid Heating 1,400 1,600 Gas Natural gas or other
100 325120 Fluid heating Compressed industrial
gas manufacturing 200 350 Gas Electricity or natural gas
Source: Arvind Thekdi (E3M Inc.)

APPENDIX B. LOW-TEMPERATURE WASTE HEAT ESTIMATE
BASED ON MECS DATA

B-2
APPENDIX B. LOW-TEMPERATURE WASTE HEAT ESTIMATE BASED ON MECS DATA
NAICS
code(a) End use
Residual
fuel oil
Distillate
fuel oil
and
diesel
fuel(c)
Natural
gas(d)
LPG and
NGL(e)
Coal
(excluding
coke and
breeze)
Other
(f)
Percent
waste
heat
Waste heat
TBtu/year
Low temp#
311 Food
TOTAL FUEL CONSUMPTION 12 22 579 6 182 101 17.5% 17.7
Indirect Uses-Boiler Fuel 10 3 334 2 162 —
Conventional Boiler Use 5 1 164 * 25 — 17.5% 34.1
CHP and/or Cogeneration Process 4 2 170 1 137 — 10% 31.4
Direct Uses-Total Process 1 7 189 2 18 —
Process Heating 1 Q 175 1 17 — 30% 58.2
End Use Not Reported 1 2 7 * 1 101
3112 Grain and Oilseed Milling
TOTAL FUEL CONSUMPTION * 1 121 * 126 45 17.5% 7.9
Indirect Uses-Boiler Fuel * * 70 * 115 —
Conventional Boiler Use * * 38 * 17 — 17.5% 9.6
CHP and/or Cogeneration Process * * 32 0 99 — 17.5% 22.9
Direct Uses-Total Process * * 47 * 9 —
Process Heating * 0 44 * 8 — 20% 10.4
End Use Not Reported 0 * 1 * 1 45
311221 Wet Corn Milling
TOTAL FUEL CONSUMPTION * * 53 * 110 25 17.5% 4.4
Indirect Uses-Boiler Fuel 0 * 23 0 102 —
Conventional Boiler Use 0 0 15 0 13 — 17.5% 4.9
CHP and/or Cogeneration Process 0 * 8 0 90 — 17.5% 17.2
Direct Uses-Total Process * * 29 * 8 —
Process Heating * 0 29 * 8 — 20% 7.4
End Use Not Reported 0 0 0 * 0 25
31131 Sugar
TOTAL FUEL CONSUMPTION 1 1 15 * 49 37 17.5% 6.5
Indirect Uses-Boiler Fuel 1 * 12 * 40 —
Conventional Boiler Use * 0 3 * 3 — 17.5% 1.1
CHP and/or Cogeneration Process 1 * 9 * 37 — 17.5% 8.2
Direct Uses-Total Process 0 * 3 * 8 —
Process Heating 0 0 3 0 8 — 20% 2.2
End Use Not Reported 0 * 0 * 0 37
3114 Fruit and Vegetable Preserving and
Specialty Foods
TOTAL FUEL CONSUMPTION 1 Q 100 1 2 4 17.5% 0.7
Indirect Uses-Boiler Fuel 1 * 66 * 2 —
Conventional Boiler Use 1 * 34 * 1 — 17.5% 6.3
CHP and/or Cogeneration Process * * 32 * 1 — 17.5% 5.8
Direct Uses-Total Process * Q 23 * 0 —
Process Heating * Q 22 * 0 — 20% 4.4
End Use Not Reported 0 * 1 * 0 4
3115 Dairy Products
TOTAL FUEL CONSUMPTION 2 2 66 1 * 2 17.5% 0.4
Indirect Uses-Boiler Fuel 1 1 41 * * —
Conventional Boiler Use 1 * 17 * * — 17.5% 3.2
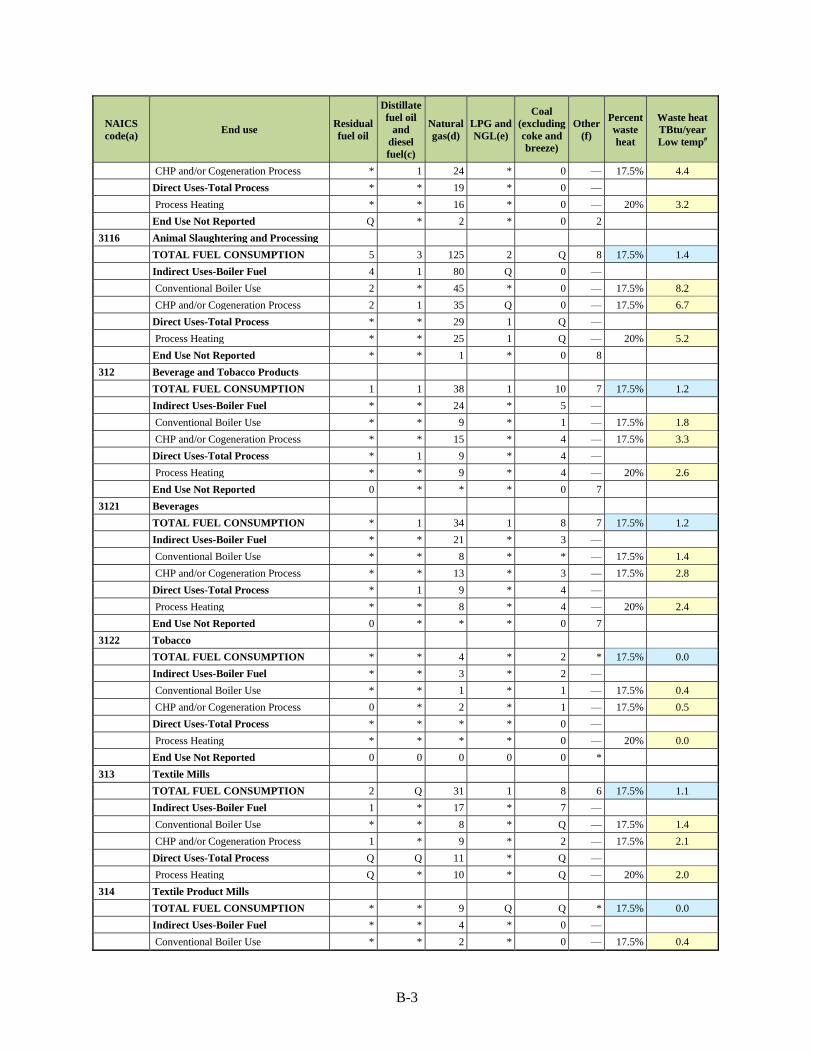
B-3
NAICS
code(a) End use
Residual
fuel oil
Distillate
fuel oil
and
diesel
fuel(c)
Natural
gas(d)
LPG and
NGL(e)
Coal
(excluding
coke and
breeze)
Other
(f)
Percent
waste
heat
Waste heat
TBtu/year
Low temp#
CHP and/or Cogeneration Process * 1 24 * 0 — 17.5% 4.4
Direct Uses-Total Process * * 19 * 0 —
Process Heating * * 16 * 0 — 20% 3.2
End Use Not Reported Q * 2 * 0 2
3116 Animal Slaughtering and Processing
TOTAL FUEL CONSUMPTION 5 3 125 2 Q 8 17.5% 1.4
Indirect Uses-Boiler Fuel 4 1 80 Q 0 —
Conventional Boiler Use 2 * 45 * 0 — 17.5% 8.2
CHP and/or Cogeneration Process 2 1 35 Q 0 — 17.5% 6.7
Direct Uses-Total Process * * 29 1 Q —
Process Heating * * 25 1 Q — 20% 5.2
End Use Not Reported * * 1 * 0 8
312 Beverage and Tobacco Products
TOTAL FUEL CONSUMPTION 1 1 38 1 10 7 17.5% 1.2
Indirect Uses-Boiler Fuel * * 24 * 5 —
Conventional Boiler Use * * 9 * 1 — 17.5% 1.8
CHP and/or Cogeneration Process * * 15 * 4 — 17.5% 3.3
Direct Uses-Total Process * 1 9 * 4 —
Process Heating * * 9 * 4 — 20% 2.6
End Use Not Reported 0 * * * 0 7
3121 Beverages
TOTAL FUEL CONSUMPTION * 1 34 1 8 7 17.5% 1.2
Indirect Uses-Boiler Fuel * * 21 * 3 —
Conventional Boiler Use * * 8 * * — 17.5% 1.4
CHP and/or Cogeneration Process * * 13 * 3 — 17.5% 2.8
Direct Uses-Total Process * 1 9 * 4 —
Process Heating * * 8 * 4 — 20% 2.4
End Use Not Reported 0 * * * 0 7
3122 Tobacco
TOTAL FUEL CONSUMPTION * * 4 * 2 * 17.5% 0.0
Indirect Uses-Boiler Fuel * * 3 * 2 —
Conventional Boiler Use * * 1 * 1 — 17.5% 0.4
CHP and/or Cogeneration Process 0 * 2 * 1 — 17.5% 0.5
Direct Uses-Total Process * * * * 0 —
Process Heating * * * * 0 — 20% 0.0
End Use Not Reported 0 0 0 0 0 *
313 Textile Mills
TOTAL FUEL CONSUMPTION 2 Q 31 1 8 6 17.5% 1.1
Indirect Uses-Boiler Fuel 1 * 17 * 7 —
Conventional Boiler Use * * 8 * Q — 17.5% 1.4
CHP and/or Cogeneration Process 1 * 9 * 2 — 17.5% 2.1
Direct Uses-Total Process Q Q 11 * Q —
Process Heating Q * 10 * Q — 20% 2.0
314 Textile Product Mills
TOTAL FUEL CONSUMPTION * * 9 Q Q * 17.5% 0.0
Indirect Uses-Boiler Fuel * * 4 * 0 —
Conventional Boiler Use * * 2 * 0 — 17.5% 0.4

B-4
NAICS
code(a) End use
Residual
fuel oil
Distillate
fuel oil
and
diesel
fuel(c)
Natural
gas(d)
LPG and
NGL(e)
Coal
(excluding
coke and
breeze)
Other
(f)
Percent
waste
heat
Waste heat
TBtu/year
Low temp#
CHP and/or Cogeneration Process 0 0 2 * 0 — 17.5% 0.4
Direct Uses-Total Process 0 * 3 * Q —
Process Heating 0 * 3 * Q — 20% 0.6
End Use Not Reported 0 0 * * 0 *
315 Apparel
TOTAL FUEL CONSUMPTION 0 * 2 * 0 * 17.5% 0.0
Indirect Uses-Boiler Fuel 0 * 1 * 0 —
Conventional Boiler Use 0 0 * 0 0 — 17.5% 0.0
CHP and/or Cogeneration Process 0 * * * 0 — 17.5% 0.0
Direct Uses-Total Process 0 0 1 * 0 —
Process Heating 0 0 1 * 0 — 20% 0.2
TOTAL FUEL CONSUMPTION * * 1 * 0 * 17.5% 0.0
Indirect Uses-Boiler Fuel 0 * * * 0 —
Conventional Boiler Use 0 * * * 0 — 17.5% 0.0
CHP and/or Cogeneration Process 0 * * * 0 — 17.5% 0.0
Direct Uses-Total Process 0 0 * * 0 —
Process Heating 0 0 * * 0 — 20% 0.0
Total for NAICS 311 - 315 Total 169.1
321 Wood Products
TOTAL FUEL CONSUMPTION * 22 34 3 1 357 17.5% 62.5
Indirect Uses-Boiler Fuel * Q 8 * 1 —
Conventional Boiler Use * * 2 * * — 17.5% 0.4
CHP and/or Cogeneration Process * Q 6 * * — 17.5% 1.1
Direct Uses-Total Process * Q 22 1 * —
Process Heating * * 21 * * — 20% 4.2
End Use Not Reported * Q * * 0 357
321113 Sawmills
TOTAL FUEL CONSUMPTION * Q 5 * 0 195 17.5% 34.1
Indirect Uses-Boiler Fuel * * 1 * 0 —
Conventional Boiler Use 0 * * * 0 — 17.5% 0.0
CHP and/or Cogeneration Process * * 1 * 0 — 17.5% 0.2
Direct Uses-Total Process * Q 4 * 0 —
Process Heating * * 4 * 0 — 20% 0.8
End Use Not Reported * Q * * 0 195
3212 Veneer, Plywood, and Engineered
Woods
TOTAL FUEL CONSUMPTION * 2 19 1 1 138 17.5% 24.2
Indirect Uses-Boiler Fuel * Q 4 * 1 —
Conventional Boiler Use * * 1 * * — 17.5% 0.2
CHP and/or Cogeneration Process 0 Q 3 * * — 17.5% 0.5
Direct Uses-Total Process * * 14 * * —
Process Heating * * 13 * * — 20% 2.6
End Use Not Reported 0 * * * 0 138
321219 Reconstituted Wood Products
TOTAL FUEL CONSUMPTION * Q 14 * 1 52 17.5% 9.1
Indirect Uses-Boiler Fuel * Q 3 * 1 —

B-5
NAICS
code(a) End use
Residual
fuel oil
Distillate
fuel oil
and
diesel
fuel(c)
Natural
gas(d)
LPG and
NGL(e)
Coal
(excluding
coke and
breeze)
Other
(f)
Percent
waste
heat
Waste heat
TBtu/year
Low temp#
Conventional Boiler Use * * 1 * * — 17.5% 0.2
CHP and/or Cogeneration Process 0 Q 2 0 * — 17.5% 0.4
Direct Uses-Total Process * * 11 * * —
Process Heating * * 11 * * — 20% 2.2
End Use Not Reported 0 0 * * 0 52
3219 Other Wood Products
TOTAL FUEL CONSUMPTION * 5 7 2 * 20 17.5% 3.5
Indirect Uses-Boiler Fuel 0 * 2 * 0 —
Conventional Boiler Use 0 * 1 * 0 — 17.5% 0.2
CHP and/or Cogeneration Process 0 * 1 * 0 — 17.5% 0.2
Direct Uses-Total Process 0 1 3 * * —
Process Heating 0 * 3 * * — 20% 0.6
End Use Not Reported * * * * 0 20
322 Paper
TOTAL FUEL CONSUMPTION 35 6 399 4 207 1,253 17.5% 219.3
Indirect Uses-Boiler Fuel 23 3 240 * 201 —
Conventional Boiler Use 7 * 50 * 7 — 17.5% 11.2
CHP and/or Cogeneration Process 17 2 190 * 194 — 17.5% 70.5
Direct Uses-Total Process 11 1 132 1 6 —
Process Heating 10 1 120 * 4 — 20% 27.0
Total for NAICS 321 – 322 Total 406.8
323 Printing and Related Support
TOTAL FUEL CONSUMPTION Q * 34 1 0 * 17.5% 0.0
Indirect Uses-Boiler Fuel 0 * 7 * 0 —
Conventional Boiler Use 0 0 3 * 0 — 17.5% 0.5
CHP and/or Cogeneration Process 0 * 5 * 0 — 17.5% 0.9
Direct Uses-Total Process 0 * 16 * 0 —
Process Heating 0 * 12 * 0 — 20% 2.4
324 Petroleum and Coal Products
TOTAL FUEL CONSUMPTION 17 24 918 26 11 2,162 17.5% 378.4
Indirect Uses-Boiler Fuel 4 7 298 7 3 —
Conventional Boiler Use 4 * 102 2 1 — 17.5% 19.1
CHP and/or Cogeneration Process 1 7 196 5 2 — 17.5% 36.9
Direct Uses-Total Process 10 11 567 18 9 —
Process Heating 10 7 516 18 4 — 20% 111.0
End Use Not Reported 2 1 34 1 0 2,162
324110 Petroleum Refineries
TOTAL FUEL CONSUMPTION 14 11 859 25 1 2,113 17.5% 369.8
Indirect Uses-Boiler Fuel 4 6 286 7 1 —
Conventional Boiler Use 4 * 98 2 1 — 17.5% 18.4
CHP and/or Cogeneration Process * 6 188 5 0 — 10% 19.9
Direct Uses-Total Process 7 2 524 17 0 —
Process Heating 7 1 475 17 0 — 20% 100.0
End Use Not Reported 2 * 33 1 0 2,113
324121 Asphalt Paving Mixture and Block
TOTAL FUEL CONSUMPTION 3 12 39 1 Q 6 17.5% 1.1

B-6
NAICS
code(a) End use
Residual
fuel oil
Distillate
fuel oil
and
diesel
fuel(c)
Natural
gas(d)
LPG and
NGL(e)
Coal
(excluding
coke and
breeze)
Other
(f)
Percent
waste
heat
Waste heat
TBtu/year
Low temp#
Indirect Uses-Boiler Fuel * * 5 * 0 —
Conventional Boiler Use * * 2 * 0 — 17.5% 0.4
CHP and/or Cogeneration Process 0 * 3 * 0 — 17.5% 0.5
Direct Uses-Total Process 3 8 33 1 Q —
Process Heating 3 6 30 1 Q — 20% 8.0
End Use Not Reported * * Q * 0 6
324199 Other Petroleum and Coal Products
TOTAL FUEL CONSUMPTION * * 5 * 9 41 17.5% 7.2
Indirect Uses-Boiler Fuel * 0 1 0 1 —
Conventional Boiler Use * 0 * 0 * — 17.5% 0.0
CHP and/or Cogeneration Process * 0 1 0 1 — 17.5% 0.4
Direct Uses-Total Process 0 * 4 * 8 —
Process Heating 0 * 4 * 3 — 20% 1.4
End Use Not Reported 0 0 0 * 0 41
325 Chemicals
TOTAL FUEL CONSUMPTION 7 8 1,784 7 200 765 17.5% 133.9
Indirect Uses-Boiler Fuel 4 2 1,000 1 187 —
Conventional Boiler Use 2 1 302 1 29 — 17.5% 58.6
CHP and/or Cogeneration Process 3 1 697 * 158 — 17.5% 150.3
Direct Uses-Total Process 2 2 750 1 13 —
Process Heating 2 1 624 * 13 — 20% 128.0
326 Plastics and Rubber Products
TOTAL FUEL CONSUMPTION * 2 103 2 Q Q 17.5% 0.0
Indirect Uses-Boiler Fuel * 2 44 * Q —
Conventional Boiler Use * Q 20 * 0 — 17.5% 3.5
CHP and/or Cogeneration Process 0 1 24 * Q — 17.5% 4.4
Direct Uses-Total Process 0 * 37 * 0 —
Process Heating 0 0 34 * 0 — 20% 6.8
327 Nonmetallic Mineral Products
TOTAL FUEL CONSUMPTION 1 23 273 2 217 83 17.5% 14.5
Indirect Uses-Boiler Fuel * * 11 * * —
Conventional Boiler Use 0 * 3 * 0 — 17.5% 0.5
CHP and/or Cogeneration Process * * 7 * * — 17.5% 1.2
Direct Uses-Total Process 1 12 239 1 216 —
Process Heating * 2 235 1 216 — 20% 90.8
End Use Not Reported 0 * 6 * 0 83
327121 Brick and Structural Clay Tile
TOTAL FUEL CONSUMPTION * * 16 * 1 1 17.5% 0.2
Indirect Uses-Boiler Fuel 0 0 * 0 0 —
Conventional Boiler Use 0 0 * 0 0 — 17.5% 0.0
CHP and/or Cogeneration Process 0 0 * 0 0 — 17.5% 0.0
Direct Uses-Total Process * * 15 * 1 —
Process Heating * * 15 * 1 — 20% 3.2
End Use Not Reported 0 0 1 * 0 1
327211 Flat Glass
TOTAL FUEL CONSUMPTION 0 * 43 * 0 * 17.5% 0.0
Indirect Uses-Boiler Fuel 0 0 * 0 0 —

B-7
NAICS
code(a) End use
Residual
fuel oil
Distillate
fuel oil
and
diesel
fuel(c)
Natural
gas(d)
LPG and
NGL(e)
Coal
(excluding
coke and
breeze)
Other
(f)
Percent
waste
heat
Waste heat
TBtu/year
Low temp#
Conventional Boiler Use 0 0 * 0 0 — 17.5% 0.0
CHP and/or Cogeneration Process 0 0 0 0 0 — 17.5% 0.0
Direct Uses-Total Process 0 * 41 * 0 —
Process Heating 0 * 41 * 0 — 30% 12.3
End Use Not Reported 0 0 0 * 0 *
327212 Other Pressed and Blown Glass and
Glassware
TOTAL FUEL CONSUMPTION 0 * 28 * 0 Q 17.5% 0.0
Indirect Uses-Boiler Fuel 0 * 1 * 0 —
Conventional Boiler Use 0 * * * 0 — 17.5% 0.0
CHP and/or Cogeneration Process 0 0 1 * 0 — 17.5% 0.2
Direct Uses-Total Process 0 * 25 * 0 —
Process Heating 0 * 24 * 0 — 30% 7.2
End Use Not Reported 0 0 1 * 0 Q
327213 Glass Containers
TOTAL FUEL CONSUMPTION 0 * 46 * 0 * 17.5% 0.0
Indirect Uses-Boiler Fuel 0 0 * 0 0 —
Conventional Boiler Use 0 0 * 0 0 — 17.5% 0.0
CHP and/or Cogeneration Process 0 0 * 0 0 — 17.5% 0.0
Direct Uses-Total Process 0 * 44 * 0 —
Process Heating 0 * 44 * 0 — 30% 13.2
End Use Not Reported 0 * 0 * 0 *
327215 Glass Products from Purchased Glass
TOTAL FUEL CONSUMPTION 0 * 5 * * *
Indirect Uses-Boiler Fuel 0 0 * 0 0 — 17.5% 0.0
Conventional Boiler Use 0 0 * 0 0 —
CHP and/or Cogeneration Process 0 0 * 0 0 — 17.5% 0.0
Direct Uses-Total Process 0 * 3 * 0 — 17.5% 0.5
Process Heating 0 * 3 * 0 — 30% 0.9
End Use Not Reported 0 * * * 0 *
327310 Cements
TOTAL FUEL CONSUMPTION * 3 13 * 135 63 17.5% 11.0
Indirect Uses-Boiler Fuel 0 0 * * 0 —
Conventional Boiler Use 0 0 * * 0 — 17.5% 0.0
CHP and/or Cogeneration Process 0 0 0 0 0 — 17.5% 0.0
Direct Uses-Total Process * 1 12 * 135 —
Process Heating * * 12 * 135 — 20% 29.4
End Use Not Reported 0 0 0 * 0 63
327410 Lime
TOTAL FUEL CONSUMPTION * 5 3 * 77 11 17.5% 1.9
Indirect Uses-Boiler Fuel 0 0 * 0 0 —
Conventional Boiler Use 0 0 * 0 0 — 17.5% 0.0
CHP and/or Cogeneration Process 0 0 0 0 0 — 17.5% 0.0
Direct Uses-Total Process 0 4 3 * 77 —
Process Heating 0 * 3 * 77 — 20% 16.0
End Use Not Reported 0 0 0 * 0 11
327420 Gypsum

B-8
NAICS
code(a) End use
Residual
fuel oil
Distillate
fuel oil
and
diesel
fuel(c)
Natural
gas(d)
LPG and
NGL(e)
Coal
(excluding
coke and
breeze)
Other
(f)
Percent
waste
heat
Waste heat
TBtu/year
Low temp#
TOTAL FUEL CONSUMPTION * * 39 * 0 * 17.5% 0.0
Indirect Uses-Boiler Fuel 0 0 1 0 0 —
Conventional Boiler Use 0 0 * 0 0 — 17.5% 0.0
CHP and/or Cogeneration Process 0 0 * 0 0 — 17.5% 0.0
Direct Uses-Total Process 0 * 36 * 0 —
Process Heating 0 * 35 * 0 — 20% 7.0
End Use Not Reported 0 0 0 0 0 *
327993 Mineral Wool
TOTAL FUEL CONSUMPTION 0 * 24 * 0 3 17.5% 0.5
Indirect Uses-Boiler Fuel 0 * 1 0 0 —
Conventional Boiler Use 0 0 * 0 0 — 17.5% 0.0
CHP and/or Cogeneration Process 0 * 1 0 0 — 17.5% 0.2
Direct Uses-Total Process 0 * 21 * 0 —
Process Heating 0 * 21 * 0 — 30% 6.3
End Use Not Reported 0 0 0 0 0 3
Total for NAICS 323 – 327 Total 1,126.2
331 Primary Metals
TOTAL FUEL CONSUMPTION 1 9 537 3 23 682 20% 136.4
Indirect Uses-Boiler Fuel 1 * 63 * 0 —
Conventional Boiler Use * * 22 * 0 — 17.5% 3.9
CHP and/or Cogeneration Process * * 42 * 0 — 17.5% 7.4
Direct Uses-Total Process * 3 434 1 21 —
Process Heating * * 403 1 21 — 30% 127.5
331111 Iron and Steel Mills
TOTAL FUEL CONSUMPTION * 5 325 * 23 633 20% 126.6
Indirect Uses-Boiler Fuel * * 38 * 0 —
Conventional Boiler Use * * W * 0 — 17.5% 0.0
CHP and/or Cogeneration Process * * W * 0 — 17.5% 0.0
Direct Uses-Total Process 0 2 272 * 21 —
Process Heating 0 * 252 * 21 — 30% 81.9
331112 Electrometallurgical Ferroalloy
Products
TOTAL FUEL CONSUMPTION 0 * 1 * 0 1 20% 0.2
Indirect Uses-Boiler Fuel 0 0 * 0 0 —
Conventional Boiler Use 0 0 * 0 0 — 17.5% 0.0
CHP and/or Cogeneration Process 0 0 * 0 0 — 17.5% 0.0
Direct Uses-Total Process 0 * 1 * 0 —
Process Heating 0 * 1 * 0 — 30% 0.3
3312 Steel Products from Purchased Steel
TOTAL FUEL CONSUMPTION * * 18 * 0 7 20% 1.4
Indirect Uses-Boiler Fuel 0 * 2 * 0 —
Conventional Boiler Use 0 0 1 * 0 — 17.5% 0.2
CHP and/or Cogeneration Process 0 * 1 0 0 — 17.5% 0.2
Direct Uses-Total Process * * 13 * 0 —
Process Heating 0 * 12 * 0 — 30% 3.6
3313 Alumina and Aluminum

B-9
NAICS
code(a) End use
Residual
fuel oil
Distillate
fuel oil
and
diesel
fuel(c)
Natural
gas(d)
LPG and
NGL(e)
Coal
(excluding
coke and
breeze)
Other
(f)
Percent
waste
heat
Waste heat
TBtu/year
Low temp#
TOTAL FUEL CONSUMPTION * 2 96 1 0 5 20% 1.0
Indirect Uses-Boiler Fuel * * 13 * 0 —
Conventional Boiler Use * * W * 0 — 17.5% 0.0
CHP and/or Cogeneration Process 0 0 W 0 0 — 17.5% 0.0
Direct Uses-Total Process * 1 78 * 0 —
Process Heating * * 73 * 0 — 20% 14.6
331314 Secondary Smelting and Alloying of
Aluminum
TOTAL FUEL CONSUMPTION * * 14 * 0 * 20% 0.0
Indirect Uses-Boiler Fuel 0 0 1 0 0 —
Conventional Boiler Use 0 0 0 0 0 — 17.5% 0.0
CHP and/or Cogeneration Process 0 0 1 0 0 — 17.5% 0.2
Direct Uses-Total Process * * 13 * 0 —
Process Heating * * 13 * 0 — 40% 5.2
331315 Aluminum Sheet, Plate, and Foils
TOTAL FUEL CONSUMPTION * * 40 * 0 2 20% 0.4
Indirect Uses-Boiler Fuel * 0 W 0 0 —
Conventional Boiler Use * 0 1 0 0 — 17.5% 0.2
CHP and/or Cogeneration Process 0 0 W 0 0 — 17.5% 0.0
Direct Uses-Total Process * * 37 * 0 —
Process Heating * 0 37 * 0 — 30% 11.1
331316 Aluminum Extruded Products
TOTAL FUEL CONSUMPTION 0 * 11 * 0 * 20% 0.0
Indirect Uses-Boiler Fuel 0 0 W * 0 —
Conventional Boiler Use 0 0 W * 0 — 17.5% 0.0
CHP and/or Cogeneration Process 0 0 W 0 0 — 17.5% 0.0
Direct Uses-Total Process 0 * W * 0 —
Process Heating 0 0 W * 0 — 30% 0.0
3314 Nonferrous Metals, except Aluminum
TOTAL FUEL CONSUMPTION * * 51 1 0 25 20% 5.0
Indirect Uses-Boiler Fuel 0 * 9 * 0 —
Conventional Boiler Use 0 * 4 * 0 — 17.5% 0.7
CHP and/or Cogeneration Process 0 * 5 * 0 — 17.5% 0.9
Direct Uses-Total Process 0 * 37 1 0 —
Process Heating 0 * 33 1 0 — 30% 10.2
331419 Primary Smelting and Refining of
Nonferrous Metals, except Copper
and Aluminum
TOTAL FUEL CONSUMPTION 0 * 12 * 0 22 20% 4.4
Indirect Uses-Boiler Fuel 0 * 1 0 0 —
Conventional Boiler Use 0 0 * 0 0 — 17.5% 0.0
CHP and/or Cogeneration Process 0 * 1 0 0 — 17.5% 0.2
Direct Uses-Total Process 0 * 11 * 0 —
Process Heating 0 * 8 * 0 — 30% 2.4
3315 Foundries
TOTAL FUEL CONSUMPTION 0 1 46 1 0 11 20% 2.2
Indirect Uses-Boiler Fuel 0 * 1 * 0 —
Conventional Boiler Use 0 * 1 * 0 — 17.5% 0.2

B-10
NAICS
code(a) End use
Residual
fuel oil
Distillate
fuel oil
and
diesel
fuel(c)
Natural
gas(d)
LPG and
NGL(e)
Coal
(excluding
coke and
breeze)
Other
(f)
Percent
waste
heat
Waste heat
TBtu/year
Low temp#
CHP and/or Cogeneration Process 0 * 1 * 0 — 17.5% 0.2
Direct Uses-Total Process 0 * 34 * 0 —
Process Heating 0 * 32 * 0 — 30% 9.6
331511 Iron Foundries
TOTAL FUEL CONSUMPTION 0 * 14 * 0 11 20% 2.2
Indirect Uses-Boiler Fuel 0 * * * 0 —
Conventional Boiler Use 0 * * * 0 — 17.5% 0.0
CHP and/or Cogeneration Process 0 * * 0 0 — 17.5% 0.0
Direct Uses-Total Process 0 * 9 * 0 —
Process Heating 0 * 8 * 0 — 30% 2.4
331521 Aluminum Die-Casting Foundries
TOTAL FUEL CONSUMPTION 0 * 11 * 0 * 20% 0.0
Indirect Uses-Boiler Fuel 0 0 * * 0 —
Conventional Boiler Use 0 0 * 0 0 — 17.5% 0.0
CHP and/or Cogeneration Process 0 0 * * 0 — 17.5% 0.0
Direct Uses-Total Process 0 * 9 * 0 —
Process Heating 0 0 8 * 0 — 30% 2.4
331524 Aluminum Foundries, except Die-
Casting
TOTAL FUEL CONSUMPTION 0 * 8 * 0 * 20% 0.0
Indirect Uses-Boiler Fuel 0 0 * * 0 —
Conventional Boiler Use 0 0 * * 0 — 17.5% 0.0
CHP and/or Cogeneration Process 0 0 * 0 0 — 17.5% 0.0
Direct Uses-Total Process 0 * 7 * 0 —
Process Heating 0 * 6 * 0 — 30% 1.8
332 Fabricated Metal Products
TOTAL FUEL CONSUMPTION * 3 163 5 Q Q 20% 0.0
Indirect Uses-Boiler Fuel 0 * 21 * 0 —
Conventional Boiler Use 0 0 11 0 0 — 17.5% 1.9
CHP and/or Cogeneration Process 0 * 10 * 0 — 17.5% 1.8
Direct Uses-Total Process 0 * 94 1 0 —
Process Heating 0 * 92 1 0 — 30% 27.9
333 Machinery
TOTAL FUEL CONSUMPTION * 3 71 2 0 1 20% 0.2
Indirect Uses-Boiler Fuel * * 6 * 0 —
Conventional Boiler Use 0 0 3 * 0 — 17.5% 0.5
CHP and/or Cogeneration Process * * 3 0 0 — 17.5% 0.5
Direct Uses-Total Process 0 3 30 1 0 —
Process Heating 0 * 28 * 0 — 30% 8.4
334 Computer and Electronic Products
TOTAL FUEL CONSUMPTION * * 42 * 0 * 20% 0.0
Indirect Uses-Boiler Fuel * * 14 0 0 —
Conventional Boiler Use 0 * 12 0 0 — 17.5% 2.1
CHP and/or Cogeneration Process * * 3 0 0 — 17.5% 0.5
Direct Uses-Total Process 0 * 6 * 0 —
Process Heating 0 * 5 * 0 — 20% 1.0
335 Electric Equipment, Appliances,

B-11
NAICS
code(a) End use
Residual
fuel oil
Distillate
fuel oil
and
diesel
fuel(c)
Natural
gas(d)
LPG and
NGL(e)
Coal
(excluding
coke and
breeze)
Other
(f)
Percent
waste
heat
Waste heat
TBtu/year
Low temp#
Components
TOTAL FUEL CONSUMPTION * 1 36 1 0 * 20% 0.0
Indirect Uses-Boiler Fuel * * 6 * 0 —
Conventional Boiler Use * * 4 * 0 — 17.5% 0.7
CHP and/or Cogeneration Process 0 0 3 * 0 — 17.5% 0.5
Direct Uses-Total Process * * 20 * 0 —
Process Heating 0 * 19 * 0 — 20% 3.8
336 Transportation Equipment
TOTAL FUEL CONSUMPTION 2 3 127 3 3 5 20% 1.0
Indirect Uses-Boiler Fuel 2 * 30 * 3 —
Conventional Boiler Use 2 * 13 * 3 — 17.5% 3.2
CHP and/or Cogeneration Process 0 * 16 * 0 — 17.5% 2.8
Direct Uses-Total Process * 1 52 1 0 —
Process Heating * * 43 * 0 — 20% 8.6
337 Furniture and Related Products
TOTAL FUEL CONSUMPTION 0 * 13 1 Q 4 20% 0.8
Indirect Uses-Boiler Fuel 0 0 1 0 * —
Conventional Boiler Use 0 0 * 0 * — 17.5% 0.0
CHP and/or Cogeneration Process 0 0 1 0 0 — 17.5% 0.2
Direct Uses-Total Process 0 * 5 * 0 —
Process Heating 0 * 5 * 0 — 20% 1.0
339 Miscellaneous
TOTAL FUEL CONSUMPTION * 1 16 * * * 20% 0.0
Indirect Uses-Boiler Fuel 0 * 5 * 0 —
Conventional Boiler Use 0 * 3 0 0 — 17.5% 0.5
CHP and/or Cogeneration Process 0 * 3 * 0 — 17.5% 0.5
Direct Uses-Total Process 0 * 5 * 0 —
Process Heating 0 * 4 * 0 — 20% 0.8
Total for NAICS 331 – 339 Total 360.7
Source: Arvind Thekdi
#The waste heat considered in this study includes only waste heat from flue gases and excludes all other losses such
as wall loss, opening loss etc. The percent waste heat estimates are based on the available heat analysis or stack loss
estimates of the energy systems (Boilers, CHP and process heating).
*Estimates less than 0.5
Abbreviations in Appendix B:
LPG – Liquid Petroleum Gas
NGL – Natural Gas Liquids
W – Withheld to avoid disclosing data for individual establishments.
Q - Withheld because Relative Standard Error is greater than 50 percent.