technology and market perspective for future value...
TRANSCRIPT

Research and Innovation
Technology and market perspective
Final Report from Oxford Research AS
for future Value Added Materials

EUROPEAN COMMISSION
Directorate-General for Research and InnovationDirectorate G — Industrial TechnologiesUnit G3 — Materials
E-mail: [email protected]
Contact: Helge WESSEL
European CommissionB-1049 Brussels
E-mail: [email protected]

EUROPEAN COMMISSION
Directorate-General for Research and InnovationIndustrial Technologies2012
Technology and market perspective for future Value Added Materials
Final Report
from Oxford Research AS
EUR 25027 EN
Edited by
Dr Helge Wesseland
Dr Renzo Tomellini

EUROPE DIRECT is a service to help you find answers to your questions about the European Union
Freephone number (*):00 800 6 7 8 9 10 11
(*) Certain mobile telephone operators do not allow access to 00 800 numbers or these calls may be billed
LEGAL NOTICE
Neither the European Commission nor any person acting on behalf of the Commission is responsible for the use which might be made of the following information.
The views expressed in this publication are the sole responsibility of the authors and do not necessarily reflect the views of the European Commission.
More information on the European Union is available on the Internet (http://europa.eu).
Cataloguing data can be found at the end of this publication.
Luxembourg: Publications Office of the European Union, 2012
ISBN 978-92-79-22003-6doi 10.2777/95202
© European Union, 2012Reproduction is authorised provided the source is acknowledged.
Picture © Fotolia, 2012
Printed in Belgium
Printed on elemental chlorine-free bleached paper (ECF)

3
Oxford Research was established in 1995 and is part of the Oxford Group. The company is a full service research company offering research and management consultancy ser-vices within the areas of international development, science & innovation, business development and welfare issues.
Oxford Research also carries out evaluations (especially management evaluations of programmes and organizations) and analyzes, and offers consultancy on strategy. The research company combines academic depth, excellence in communication and strate-gic understanding. Currently Oxford Research has branches in Denmark, Norway and Sweden, and has wide experience in conducting European research projects.
Oxford Research is also research partner of the European Network for Social and Eco-nomic Research (ENSR).
See our website for more information: www.oxfordresearch.eu
Authors: Bart Romanow, Mariana Gustafsson from Oxford Research AS
with expert support from Mattias Karlsson Dinnetz, PhD.
Oxford Research:
NORWAY DENMARK
Oxford Research AS Østre Strandgate 1, 4610 Kristiansand, Norge Telefon: (+47) 40 00 57 93 [email protected]
Oxford Research A/S Falkoner Allé 20, 4. sal 2000 Frederiksberg C Danmark Telefon: (+45) 33 69 13 69 Fax: (+45) 33 69 13 33 [email protected]
SWEDEN BELGIUM
Oxford Research AB Box 7578 Norrlandsgatan 12 103 93 Stockholm Telefon: (+46) 702965449 [email protected]
Oxford Research c/o ENSR 5, Rue Archimède, Box 4 1000 Brussels Phone +32 2 5100884 Fax +32 2 5100885 [email protected]

4

5
Table of Contents
Chapter 1. Executive summary / Conclusions ............................................................................... 9
Chapter 2. Introduction to the study ............................................................................................. 14
2.1 Materials technology and advancements in engineering ............................................... 14
2.2 Study context and approach ........................................................................................... 15
Chapter 3. Definition and classification ........................................................................................ 16
3.1 A general reflection on ‘value’ ........................................................................................ 16
3.2 Value Added Materials versus commodity materials ...................................................... 16
3.3 VAM properties based on literature review .................................................................... 17
3.4 Definition of VAMs based on interviews ......................................................................... 21
3.5 VAM definition ................................................................................................................ 22
3.6 What shall be not considered Value Added Material ...................................................... 22
3.7 Classification .................................................................................................................. 23
Chapter 4. Qualitative technology assessment and perspective in the social and economic context ......................................................................................................... 27
4.1 Grand Challenges .......................................................................................................... 27
4.1.1 Health, demographic change and wellbeing .................................................................. 28
4.1.2 Food security and the bio-based economy .................................................................... 30
4.1.3 Secure, clean and efficient energy ................................................................................. 31
4.1.4 Smart, green and integrated transport ........................................................................... 33
4.1.5 Supply of raw materials .................................................................................................. 33
4.1.6 Resource efficiency and climate action .......................................................................... 36
4.1.7 Inclusive, innovative and secure societies ..................................................................... 38
4.2 Business challenges ....................................................................................................... 40
Chapter 5. Qualitative and quantitative Value Added Materials market analysis by sector .... 44
5.1 General investment split ................................................................................................. 44
5.2 Overview of sectoral investment willingness .................................................................. 47
5.3 Findings from interviews ................................................................................................. 49
5.4 Emerging technologies within materials ......................................................................... 51

6
Chapter 6. Quantitative Value Added Materials market overview .............................................. 55
6.1 VAMs market size and development .............................................................................. 58
6.2 Energy sector ................................................................................................................. 61
6.3 Transport sector ............................................................................................................. 64
6.4 Environment sector ........................................................................................................ 66
6.5 Health sector .................................................................................................................. 68
6.6 Information and Communication Technologies (ICT) sector .......................................... 69
6.7 Other market estimates .................................................................................................. 70
Chapter 7. Potential future technological challenges ................................................................. 71
7.1 Challenges within health, demographic change and wellbeing ...................................... 71
7.2 Challenges in the context of food security and the bio-based economy ........................ 75
7.3 Challenges for secure, clean and efficient energy technologies .................................... 76
7.4 Challenges of smart, green and integrated transport ..................................................... 78
7.5 Challenges in the context of raw materials supply ......................................................... 79
7.6 Challenges within resource efficiency and climate action .............................................. 79
7.7 Technological challenges to solving the issues of secure societies ............................... 80
7.8 Innovation and the European paradox ........................................................................... 80
References ....................................................................................................................................... 82
Study methodology .............................................................................................................................. 85
Annex 1 – Market foresights relevant for Value Added Materials.................................................... 87
Annex 2 – Composition of respondents groups ............................................................................. 118

7
List of tables
Table 1: VAMs market share by sector .................................................................................................................... 10 Table 2: Classification of common engineering materials ........................................................................................ 24 Table 3: An overview of top emerging technologies within materials and the research centres working on
these in the last decade. ................................................................................................................................ 52 Table 4: Total market sizes for advanced and new materials .................................................................................. 58 Table 5: Size of identified markets where VAMs are applied ................................................................................... 59 Table 6: VAMs market share by sector .................................................................................................................... 59 Table 7: Share of VAM-related technologies in energy markets .............................................................................. 63 Table 8: Share of VAM-related technologies in ICT markets ................................................................................... 70 Table 9: Overview of identified market size values for sectors covered with the study ........................................... 94 Table 10: List of interviewed materials experts ...................................................................................................... 118 Table 11: List of interviewed bank, private equity & venture capital investment specialists .................................. 121
List of figures
Figure 1: VAMs as a part of advanced and new materials ....................................................................................... 19 Figure 2: Production concentration of critical raw mineral materials ........................................................................ 35 Figure 3: Investment willingness for VAMs by sector ............................................................................................... 45 Figure 4: Investment willingness for VAMs in the energy sector .............................................................................. 47 Figure 5: Investment willingness for VAMs in environment sector ........................................................................... 48 Figure 6: Investment willingness for VAMs in health sector ..................................................................................... 48 Figure 7: Investment willingness for VAMs in ICT sector ......................................................................................... 49 Figure 8: Changes in VAMs’ sector presence and market growth ........................................................................... 60 Figure 9: Global energy sector growth and structure 2007-2035 ............................................................................. 61 Figure 10: Energy sector structure 2015 .................................................................................................................. 61 Figure 11: Energy sector structure 2035 .................................................................................................................. 61 Figure 12: Energy sector size 2015 .......................................................................................................................... 62 Figure 13: Global renewables growth and structure ................................................................................................. 63 Figure 14: Share of VAM-related technologies in transport markets ....................................................................... 64 Figure 15: Share of VAM-related technologies in environmental markets ............................................................... 66 Figure 16: Share of VAM-related technologies in health markets ............................................................................ 68 Figure 17: ICT sector split and growth...................................................................................................................... 69 Figure 18: Energy-related markets for VAMs — selected foresights overview ........................................................ 87 Figure 19: Environment-related markets for VAMs — selected foresights overview ............................................... 88 Figure 20: Transport-related markets for VAMs — selected foresights overview .................................................... 89 Figure 21: Health-related markets for VAMs — foresights from ‘Roadmaps in Nanomedicine’ .............................. 90 Figure 22: Health-related markets for VAMs — selected foresights overview ......................................................... 91 Figure 23: ICT-related markets for VAMs — selected foresights overview .............................................................. 92 Figure 24: Selected cross-cutting markets for VAMs — foresights overview ........................................................... 93

8
Acknowledgments
The research team would like to thank all materials experts, investment market special-ists and all other stakeholders for their valuable input to the data collection, data analy-sis and comments during the report preparation process.
We would like to express special thanks to our main contact persons from European Commission: Dr. Helge Wessel and Dr. Renzo Tomellini. We thank them for their smooth co-operation.

9
Chapter 1. Executive summary / Conclusions
A range of new materials with advanced properties are created through the process of technological development and knowledge intensive production. These are known as Value Added Materials (VAMs). New materials appear all the time in the natural course of industrial development; however advanced materials are tailored to fulfil specific functions and/or have superior structural properties.
We distinguish four conditions that define Value Added Materials:
a knowledge-intensive and complex production process,
new, superior, tailor-made properties for structural or functional applica-tions,
potential to contribute to competitive advantage on the market,
potential to address Europe’s Grand Challenges.
1
1 The Grand Challenges, a term first used in the Lund Declaration, have been defined differently in various settings and have evolved over time. In the recent formulation of Grand Challenges used for planning Horizon 2020 within the European Commission, DG Research lists the following:
health, demographic change and wellbeing;
food security and bio-based economy;
secure, clean and efficient energy;
smart, green and integrated transport;
supply of raw materials;
resource efficiency and climate protection;
inclusive, innovative and secure societies.
Value Added Materials are present across all groups of commonly engineering mate-rials. Within the scope of material science, they may be classified broadly into the following three main (traditional) and two (relatively new) additional classes:
2
1. metals and alloys (ferrous and non-ferrous),
2. ceramics,
3. polymers,
4. semiconductors,3
5. composites.
Aim of the study
This study delineates a precise overview of VAMS through multiple perspectives of their various market sectors.
This major study seeks to achieve the fol-lowing objectives:
1. definition and classification of VAMs;
2. analysis: VAMs by sector;
3. detailed current market analysis by sector and technology application;
4. prediction of VAMs’ market develop-ment by sector;
5. current and potential future techno-logical market drivers;
2 Vinay Swastik, ‘Classification of Materials’, ,Metallurgist Encyclope-dia. 3 Items 4 and 5 of this list follow the classification of materials by Ash Tan. : http://EzineArticles.com/2894736
Value Added Materials are a group of advanced materials that have strate-gic importance for economic growth, industrial competitiveness or for addressing the Grand Challenges of our times.
10
6. analysis of potential economic and technological issues in the frame of society’s Grand Challenges.
Market size for Value Added Materials
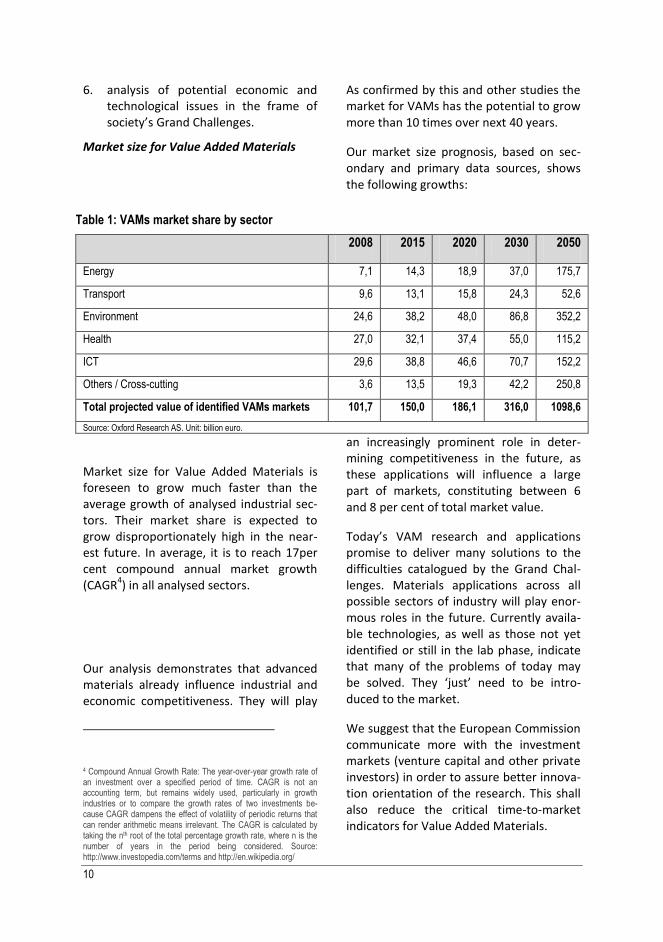
As confirmed by this and other studies the market for VAMs has the potential to grow more than 10 times over next 40 years.
Our market size prognosis, based on sec-ondary and primary data sources, shows the following growths:
Table 1: VAMs market share by sector
2008 2015 2020 2030 2050
Energy 7,1 14,3 18,9 37,0 175,7
Transport 9,6 13,1 15,8 24,3 52,6
Environment 24,6 38,2 48,0 86,8 352,2
Health 27,0 32,1 37,4 55,0 115,2
ICT 29,6 38,8 46,6 70,7 152,2
Others / Cross-cutting 3,6 13,5 19,3 42,2 250,8
Total projected value of identified VAMs markets 101,7 150,0 186,1 316,0 1098,6
Source: Oxford Research AS. Unit: billion euro.
Market size for Value Added Materials is foreseen to grow much faster than the average growth of analysed industrial sec-tors. Their market share is expected to grow disproportionately high in the near-est future. In average, it is to reach 17per cent compound annual market growth (CAGR
4) in all analysed sectors.
Our analysis demonstrates that advanced materials already influence industrial and economic competitiveness. They will play
4 Compound Annual Growth Rate: The year-over-year growth rate of an investment over a specified period of time. CAGR is not an accounting term, but remains widely used, particularly in growth industries or to compare the growth rates of two investments be-cause CAGR dampens the effect of volatility of periodic returns that can render arithmetic means irrelevant. The CAGR is calculated by taking the nth root of the total percentage growth rate, where n is the number of years in the period being considered. Source: http://www.investopedia.com/terms and http://en.wikipedia.org/
an increasingly prominent role in deter-mining competitiveness in the future, as these applications will influence a large part of markets, constituting between 6 and 8 per cent of total market value.
Today’s VAM research and applications promise to deliver many solutions to the difficulties catalogued by the Grand Chal-lenges. Materials applications across all possible sectors of industry will play enor-mous roles in the future. Currently availa-ble technologies, as well as those not yet identified or still in the lab phase, indicate that many of the problems of today may be solved. They ‘just’ need to be intro-duced to the market.
We suggest that the European Commission communicate more with the investment markets (venture capital and other private investors) in order to assure better innova-tion orientation of the research. This shall also reduce the critical time-to-market indicators for Value Added Materials.

11
Market specific conclusions
Patent protection is a very important factor for VAMs. Only well protected material innovation assures the com-petitive advantage on the market in the long run.
Scalability is a problem for VAMs. Knowledge intensivity makes them hard to scale into existing industrial applications. That is also one of the reasons for such a long time-to-market lag for many sophisticated materials (claimed to be around 20 years).
In order to improve time to market and obtain a higher impact of technol-ogies on a shorter time scale, the Eu-ropean Commission may consider dis-cussing research efforts with financial investment actors-investors on ven-ture capital (VC) and private equity (PE) markets.
Some large industries are considered to be already well covered (infor-mation and communication technolo-gy [ICT], automotive, pharmaceutical). Therefore research investment in the-se sectors is claimed to be less profit-able.
The market must be ready for any given VAM and there must be a poten-tial to use the new appearing material. The demand for a new material is largely dependent on its value. If the price is too high, producers will simply not buy it. This involves an important dimension of scalability, but also com-plexity of production.
Return on Investment (RoI) for various types of materials differs. It must be considered individually. Each deal made by a VC or PE investor is ex-pected to give a reasonable RoI, but even so for majority this is not the case. In several interviews, our in-
formants said that only four out of ten deals return money, and in reality a mere one to two bring multiple RoI.
In general terms the expected RoI differs between industries, also be-cause of sectoral specific conditions. For example, investments in infor-mation and communication technolo-gies have a short investment period, while those in energy or environment a very long one. The health sector has its own specific conditions due to ad-ditional safety regulations.
Investment willingness
Venture capital and private equity investors claim that the Grand Chal-lenges started to influence their in-vestment decisions in the past years and will even influence them more in the future.
Energy, environment and health were estimated to be the most promising sectors to invest in, due to the poten-tial big markets for sales in the future and still unsolved problems for all hu-manity.
These three sectors — energy, envi-ronment and health — cover over 80 per cent of investors’ ‘willingness’ to allocate their resources.
Key industrial sectors where VAMs will play an important role
Energy: important issues are genera-tion, distribution and storage, efficien-cy, and ways to integrate VAMs into existing structures.
Environment: a cross-cutting sector across the other industry sectors, in-terconnected with the energy sector.
Health: medical devices, biomaterials, tissue engineering and nanostruc-

12
tures— all are big markets, dealing with the concerns of an ageing society.
Transport sector: lightweight materials will be especially critical.
Information and communication tech-nologies sector: traditionally ICT has high growth rates in many areas, es-pecially in superconductivity and data transfer technologies, as well as dis-plays.
Most promising market growths
Several applications of Value Added Mate-rials have the potential for extreme growth in the future. Within the energy sector, average growth rate for identified Value Added Materials’ applications will reach 19 per cent. Most important growths will be associated with:
stationary fuel cells, with growth rate of 55per cent towards 2017;
supercapacitors for the energy sector, with growth rate of 49per cent to-wards 2015;
biogas plant equipment, with a CAGR of 30 per cent between 2010 and 2014;
nanoscale materials used in energy, catalytic and structural applications, with growth rate of 29 per cent cur-rently;
inks and catalysts, with growth rate of 28per cent towards 2015.
For the transport sector the identified applications of Value Added Materials will reach the average growth rate of 15 per cent, with especially high growths within:
supercapacitors for the transportation sector, with growth rate of 35 per cent before 2015;
market for electric vehicles with, growth rate of 20 per cent.
Within the environment sector, identified Value Added Materials applications will reach growth rates on the level of 17 per cent, with higher growths in:
carbon capture technologies, with 63 per cent growth rate;
nanotechnology for environmental applications, with 61 per cent growth rate up to 2014;
wastewater treatment delivery equipment, instrumentation, process equipment and treatment chemicals, with growth rate of 28per cent cur-rently;
nanofiltration membranes for water treatment, with current growth rate of 27per cent.
Health sector materials are characterised by lower perspective growths (average for selected materials’ applications on the level of 11 per cent) when compared to other sectors. Some high growing fields within health related materials are:
RNAi5 drug delivery market, with
growth rate of 28 per cent towards 2015;
quantum dots for the biomedical sec-tor and microspheres used in medical technology, both with growth rates around 25per cent before 2015.
The Information and Communication Technologies (ICT) sector is still character-ised by enormous potential for some ma-terials applications since the challenges we face with the growing demand for infor-mation require new technologies. The average growth rate for identified materi-als’ applications will be on the level of 25
5 RNA interference (RNAi) is a highly evolutionarily conserved mechanism of gene regulation. See http://www.rnaiweb.com

13
per cent! Still this sector was considered by PE and VC investment specialist as largely overinvested, with a high ratio of large companies present as research actors. Some key technologies where the highest growths will be encountered:
compound semiconductors for solar cells, with growth rate of 85per cent currently;
organic materials for transparent elec-tronic components, with growth rate of 57 per cent towards 2015;
superconducting electrical equipment with growth rate of 108per cent be-fore 2015;
nanorobots and NEMs (nanoelectro-mechanical systems), and related equipment and materials, with growth rate of 174 per cent up to 2015.
As one can see, the market potential and foresighted growth of VAMs is sometimes enormous. All data gathered within this study and presented in the following pages
demonstrate tremendous prospects for further development of a large range of applications.
The future for Value Added Materials looks bright. Yet many challenges exist and many barriers must be overcome in order for all existing and new coming technologies to really influence our lives and respond to the Grand Challenges of our time.
Methodology
This study is based on primary information gathered from interviews with two groups of stakeholders: materials experts and investors/investment advisors who deal with venture capital (VC) and private equi-ty (PE) investments. Our group then pre-pared a detailed analysis of available sec-ondary sources. When all relevant primary and secondary data were available, the team elaborated the market analysis and prediction.

14
Chapter 2. Introduction to the study
2.1 Materials technology and advancements in engineering
The use and processing of materials has been one of the main driving forces of development and prosperity since the early days of civilization. For centuries materials developed mainly in the fields of ceramics, metallurgy and glass .
6 More
recently an increasingly wide and complex range of different advanced materials, production processes, and integrated func-tional systems has emerged.
Materials science and engineering drasti-cally intensified in the 1960s, when appli-cations of materials became increasingly based on scientific principles rather than the empiricism that prevailed prior to World War II.
7 Materials science and engi-
neering today can be described as ‘the study of substances from which something else is made or can be made; [and] the synthesis, properties, and applications of these substances.’
8 This definition covers
both natural, traditional materials as well as synthetic, designed materials.
Since the 1970s there has been an unprec-edented expansion in the number of ad-vanced materials, novel production pro-cesses, and devices that have entered many aspects of human life.
9 These ad-
6 http://www.materialmoments.org/top100.html 7 http://www.accessscience.com 8 http://www.mpg.de/pdf/europeanWhiteBook/wb_materials_010_015.pdf 9: http://www.britannica.com
vanced materials, which form a basis of the modern high technology,
10 include:
steels and other metallic alloys
super-alloys
polymers
carbon materials
optical, electronic and magnetic mate-rials
superconductors
technical ceramics
composites
biomaterials.
Many of these have been successfully adapted by the markets and are now uti-lized in a range of industries and the urban living environment. Examples are encoun-tered daily in the areas of health, commu-nication, consumer goods and transporta-tion.
11 According to the Max Planck Insti-
tute of Materials Research, ‘Materials science plays a key role as one of the main pillars of economic progress and social well-being in Europe and, indeed, the world as a whole.’
12
The Technical Revolution (also called the Second Industrial Revolution) in the late 19
th and 20
th centuries is a good illustration
of severely disruptive developments in
10 http://www.mpg.de/pdf/europeanWhiteBook/wb_materials_010_015.pdf 11 http://www.mpg.de/pdf/europeanWhiteBook/wb_materials_011.pdf 12 http://www.mpg.de/pdf/europeanWhiteBook/wb_materials_016_017.pdf

15
manufacturing technologies. Advance-ments in chemical, electrical, petroleum and steel industries subsequently led to improvements in their respective applica-tion areas. As an example, the invention of the Bessemer converter enabled inexpen-sive mass production of steel, which moti-vated the rapid construction of railroad systems, skyscrapers and large ships.
13
2.2 Study context and approach
This study on ‘Technology and market perspective for future Value Added Mate-rials’ was commissioned by Directorate General for Research & Innovation, Mate-rials Research.
This assessment aims to understand the market of Value Added Materials through its social, economic, legal, political, eco-nomic and ecological effects. Our investi-gation presents decision-oriented options and points out various technical and eco-nomic scenarios when novel materials are developed and used.
This study focuses on the following market segments:
energy
environment
health
information and communications technology (ICT)
transportation
others (chemistry and catalysts, con-struction, etc.).
At the request of the European Commis-sion, study authors invited experts to give their opinions about these developing VAM markets. Materials experts as well as financial advisors and investors who are
13 http://www.britannica.com/EBchecked/topic/195896/history-of-Europe/58404/The-Industrial-Revolution#ref643971
directly engaged in related investments contributed to this inquiry. The result is a unique set of information about the intended decisions of private investment actors who deal with advanced technologies.
Our technology and market assessment highlights areas where two different types of specialists (materials experts and in-vestment advisors) generally agree on the development of Value Added Materials and their applications. A large set of sec-ondary data,
14 especially regarding mar-
kets’ size, supports the ideas presented by these primary sources.
Finally, this study lists commonly agreed-on facts for policy makers and elucidates issues to be solved through the political process.
Future research policies should not aim exclusively at technical efficiency and eco-nomic rationality. The social and economic consequences of introducing specific tech-nologies and novel materials need to be considered as well. Geopolitical considera-tions linked to the supply of strategic raw materials are also addressed.
14 Data from other sources relevant for the study included market size information from other institutes, relevant reports and forecasts.

16
Chapter 3. Definition and classification
3.1 A general reflection on ‘value’
Common sense tells us that ‘value added’ — be it in reference to a material, a pro-cess, a factor, a phenomenon, or an ele-ment — is something that improves some-thing else. A material with particular prop-erties can be deployed to enhance the functionality of a product, which gives it a higher degree of functionality and quality.
‘Value’ is subjective, reflecting the context in which it is used. The ‘value’ of the mate-rial will have different meanings depending on the stakeholders (companies/producers of VAMs, companies/users of VAMs, inves-tors, researchers, consumers), but also it will vary in different economic regions: Europe, Asia, Americas.
For an industrial company the value of a highly performing product lies in its capaci-ty to increase the company’s competitive advantage in the market. For a venture capitalist who has invested in such a com-pany, the value of the highly performing product lies in the return on investment (RoI) generated. The value of a highly per-forming product can lie in its potential to contribute to efficient energy savings. But it is also possible that the ‘value’ for this same product could have a negative effect on the environment or human health.
It is thus highly important to clarify what is meant by ‘value’. In this respect, the defi-nition of ‘Value Added Materials’ is a chal-lenge, because the word ‘value’ has differ-ent meanings.
3.2 Value Added Materials versus commodity materials
It is important to make a clear distinction between commodities and Value Added Materials in order to lay down a rational basis for this study. A commodity is a good for which there is demand, but that is traded without any specific qualitative segregation across a market segment. A commodity is fully or partially inter-changeable; that is, the market treats the good as equivalent regardless of source or means of production. A raw material is a commodity: a basic substance in its natu-ral, modified, or semi-processed state, used as an input to a production process for subsequent modification or transfor-
mation into a finished good.15
Soft com-
modities are primarily goods that are grown, such as coffee and soy beans, while hard commodities are mainly extracted through mining or similar exploitation and subject to a certain degree of processing, such as extraction of iron from its ore.
Therefore, commodity material suppliers compete basically on the basis of costs: their success depends on their internal cost position and not on the basis of mate-rial performance. Petroleum and copper are examples of well-known commodities. The price of petroleum is universal, and it varies on a daily basis due to global supply and demand. Thus, one of the characteris-tics of a commodity good is that its price is established as a function of its entire mar-ket. Commodities — raw or primary prod-ucts — are exchanged on so-called com-modity markets. These goods are traded
15 http://www.investorwords.com

17
on regulated exchanges, in which they are bought and sold in different types of standardised contracts.
Value Added Materials, on the other hand, are normally produced by a complex, inter-linked industry. In the most stringent in-terpretation, Value Added Materials are products whose worth is based on their performance or functionality, rather than their composition. They can be single enti-ties or formulations/combinations of sev-eral materials whose composition sharply influences the performance and processing of the end product. Products and services in the materials industry require intensive knowledge and powerful innovation.
The commoditisation of a good occurs when a goods market loses segregation relative to its supply base. This means that goods that previously had high margins for market actors become commodities, such as generic pharmaceuticals and silicon chips. It is therefore possible that certain Value Added Materials may become com-modities due to technological develop-ments.
3.3 VAM properties based on literature review
The following discussion is based on a comprehensive survey of a wide range of publications on materials science and technologies, numerous articles and a number of webpages, including ASM Inter-national (The Materials Information Socie-ty) sources and other materials-specialised institutions.
The first observation is that different names related to VAMs emerge in the literature. This indicates that while these terms are interconnected, there is no standard definition to date.
The most-used terms in the literature are ‘advanced materials’ and ‘new materials’. The term ‘Value Added Materials’ appears very seldom. We even find the inversed use ‘added value materials’. The term ‘Value Added Materials’ appears predomi-nantly in the EU documentation, in its work with FPs calls for proposals, work pro-grammes and policy documents.
A search through Google, Google-scholar, EBSCO databases and electronic books has brought no significant results on other sources where VAMs specifically are de-fined or discussed. We concluded that scientists and the industry don’t have sin-gle definition of what VAMs are, so we turned to policy documents and other documents from the European Commis-sion. The first observation is that VAMs are a kind of advanced materials with specific properties, that have both functional and structural applications, and that they are new. The question that we asked ourselves at this stage was what differentiates VAMs from the rest of the advanced materials, from the rest of the functional materials, and from the rest of the new materials. We looked for answers in material science and nanotechnology books and articles to find any defining elements that would help us to differentiate between them.
Adopting an open approach, the search was undertaken for the properties of the three ‘kinds’ of materials: VAMs, advanced materials, and new materials. A range of elements was found, describing the three in terms of properties, applications, pro-duction process, market characteristics,
Different but interrelated terms:
value-added materials
added value materials
advanced materials
new/novel materials

18
different effects, and their potential. These elements were analyzed and weighed. Several of them were chosen for further elaboration based on their relevance for the definition of VAMs and on context of the assignment.
The literature shows that through the current technological development and knowledge intensive production processes, a range of new materials with advanced properties are created. New materials appear all the time in the natural course of industrial development. Out of these a special group is tailored to fulfil specific functions and/or have superior structural properties; these are the advanced mate-rials.
Schulte described one special group of advanced materials ‘at the nanoscale …it seems that in terms of engineering there is a good chance that all the good things found close to the top (micro) and the bottom of the scale (atom, molecule) can be combined to produce something entire-ly superior or new.’16
Similarly, most advanced materials are called a ‘new generation’ of materials
17
that display physical attributes substantial-ly different from the generics
18 and provide
superior performance capacities.
If we assume that VAMs are included in the term ‘advanced materials’, it can be de-duced that VAMs share to a certain de-gree, if not entirely, properties that charac-terize advanced materials.
16 Schulte, J., (ed.) 2005. p. 98. 17 For example in: EU Commission 2011. Fisher, et al. 2008., Weng, Y., et al. 2011. Pinciotta, F., 2011. Waqar A., and M. J. Jackson,. 2009. 18 In Weng, Y., et al. 2011. Krueger, A., Kelsall, R., et al. 2005.
Advanced materials are described in the literature through the following properties and processes:
properties that are superior to those exhibited by commodity materials, that is, more durable and resistant materials, such as advanced steels;
materials and systems made out of these materials can be designed to ex-hibit novel and significantly improved physical, chemical and biological prop-erties, phenomena and processes;
higher energy absorption capacity;
tailored, significantly enhanced prop-erties and predictable performance;
new functionalities and improved performance, with higher knowledge content in the production process.
More specifically, we find the following descriptions that define the new and ad-vanced materials, which we believe include the VAMs.

19
Schulte describes advanced materials cre-ated through nano-engineering:.
19
Another description of advanced materials is in Rensselaer.
20
By this point, the conclusion must be made that the VAMs are a kind of advanced ma-terials, but still there is a need to find the
19 Schulte, J., (ed.) 2005. p. 111. 20 Rensselaer. 2004. Advanced Materials Sector Report, p. 1.
fundamental features that differentiate them from other materials categories. Schematically we understand the VAMs as a part of the advanced materials and new materials (see figure 1).
Figure 1: VAMs as a part of advanced and new materials
Our search for the fundamental features that differentiate VAMs from the rest of the advanced materials brought us back to the European Commission’s own docu-ments. Especially, the content of the work programmes reflects the Commission’s position and understanding of VAMs based on consultations with NMP Expert Advisory Group and the European Technology Plat-forms, as well as inputs from other FP7 themes, EURATOM
21 and RFCS
22. An im-
portant observation is that the Commission acknowledges the potential of advanced materials to contribute to fulfilling two strategic objectives of the European Union. These are: European industrial and eco-nomic competitiveness and meeting the Grand Challenges.
21 European Atomic Energy Community. 22 Research Fund for Coal and Steel.
New materials
Advanced Materials
VAMs
‘Many of these new materials are assembled out of existing building blocks, but are put together in novel ways, with properties that are often designed in, deliberately and con-sciously created to have specific, de-sired physical and chemical properties. The ability to measure, control and modify matter at the nanoscale, i.e. at the atomic and molecular level, results in materials with new structural and functional properties that have the potential to revolutionize existing markets or create whole new mar-kets.’
‘Advanced materials refer to all new materials and modifications to exist-ing materials to obtain superior per-formance in one or more characteris-tics that are critical for the application under consideration.’
‘Advanced materials are materials that are early in their product and/or technology lifecycle, that have signifi-cant room for growth in terms of the improvement of the performance characteristics (technology lifecycle) and their sales volume (product lifecy-cle.).

20
Some examples where the potential and the role of VAMs are described in Europe-an Commission documents follow below:
‘Materials will also support the development of solutions in materials sciences and engineering (including “horizontal technologies”) in order to overcome scientific, technological and related bottlenecks enabling new technologies that can give European industry a strong competitive advantage in the years to come.’
23
‘European competitiveness will be directly related to the ability in maintaining advanced technology in experimental facilities and con-tinuously developing new analytical tools.’
24
‘Added value materials with higher knowledge
content, new functionalities and improved performance are critical for industrial competi-tiveness and sustainable development; the materials themselves represent a key step in increasing the value of products and their per-formance, including design and control of their
processing, properties and performance.’25
The term ‘Value Added Material’ can also be linked to Sanford Moskowitz’s discus-sion of the Advanced Materials Revolu-
tion.26
He argues that the new generation
of advanced materials increasingly plays a prominent role in determining industrial and economic competitiveness, far more than their counterparts did in the past. The two former materials revolutions — the first based on coal-tar (in Germany) and mass production of metals and alloys (in the US) between 1870-1930 and the se-cond petrochemical-based in the US be-tween 1930-1960 — did not primarily rely on materials as such but rather on engi-neering design. Since 1980 a new genera-tion of advanced materials has emerged,
23 Work Programme 2012, Cooperation, Theme 4, Nanosciences, Nanotechnologies, Materials and New Production Technologies. 24 Ibidem. 25 Ibidem. 26 Moskowitz, S.L. 2009: The Coming of the Advanced Materials Revolution.
and these, contrary to novel materials in the past, will actually set the pace of inno-vation itself. Industrial competiveness now wholly depends on the continued devel-opment and growth of the so-called ‘sci-ence’ or knowledge-based industries, that include biotechnology, pharmaceuticals, and micro- and nano-electronics. As an example, the silicon chip is expected to reach its technological limit in its ability to miniaturise. After this point is reached, new electronic materials must be tailored to provide the basis for further develop-ments in miniaturisation.
Current and future materials with new properties thus help remove innovation bottlenecks in the development and com-petitiveness of industrial sectors. As a result of this, ‘added value’ translates into the inherent capacity of a material to over-come barriers in the development of new products in the science/knowledge-based economy.
In terms of VAMs’ role in addressing the Grand Challenges, we find the following in the work programmes:
‘Research will focus on materials science and
engineering defined in order to contribute to Europe's Grand Challenges, in line with the ‘Lund Declaration’, which states that "Meeting the Grand Challenges also requires (…) taking a global lead in the development of enabling technologies such as (…) materials.”’
27
‘Key Enabling Technologies (KETs) such as ad-
vanced materials are of exceptional importance. Mastering such technologies lays stable founda-tion for well-paid jobs in the EU and allows for sustainable, societal-agreed growth.’
28
‘The key objective is to radically improve mate-rials by increasing knowledge in materials sci-
27 Work Programme 2012, Cooperation, Theme 4, Nanosciences, Nanotechnologies, Materials and New Production Technologies. 28 Ibidem.

21
ence, in particular at the nanoscale, as well as to make progress in the field of environmentally friendly materials able to substitute currently harmful applications, and in the field of clean, flexible and efficient materials processing.’
29
3.4 Definition of VAMs based on interviews
In general most of the experts and the investors we interviewed agree with the four criteria defining VAMs proposed in Chapter 3.5 .
Some interviewees understand VAMs in terms of their breakthrough nature or the technologies using them. ‘Breakthrough’ is understood as intelligent solutions for difficult problems that will have a big im-pact in society or a revolutionary effect with respect to current practices.
There is also confusion with regards to the term ‘Value Added Materials’. The exam-ples below illustrate this.
VAMs understanding too narrow?
Our experts observed that the material is usually not considered ‘valuable’ in itself, but through the combined value of the devices, structures and systems of tech-nologies and production processing. In this sense, the material is just an element, a part of a structure. It is the value of the structure that the interviewees talk about and not the value of a specific material.
VAMs understanding too wide?
There were quite a few informants who perceive VAMs from the perspective of the production chain process. Here value is understood in terms of processing any
29 Ibidem.
matter that has been arranged for human purpose. In this meaning as soon as the matter becomes a material it has a certain value and with every step in any produc-tion process, value is added to the materi-al. From this perspective any materials that are used by humanity today have a value in themselves.
Examples from our interviews:
‘Copper is a commodity. As soon as you try to modify it or combine it, I would call it a VAM. Plumbing tube that has an improvement coat-ing on starts to be a value added material.’
‘You create some value in respect to a basic commodity. Doing something, you add value.’
‘You take a material and you shape and form it so that you have a more complex structure, or function in the end. The production process in itself is adding value to the material. In every single step in the production chain, you have added value, sometimes by work, sometimes by materials or technology.’
Take integration into account
An interesting approach emerged from a number of interviews:
‘You cannot separate materials from technology or manufacturing process. Materials are the first step of processing. We are dealing with complex, integrated systems that materials are a part of. The next generation of devices will have it all in one. ...The key word is integration and VAMs should facilitate this integration. Materials are becoming a part of the structure; they serve integration... Integration is adding new functionalities and combing functionalities in the sense that we now have the result of having a system, structure, device that can offer more than one functionality.’
“Materials are not the end but a beginning of the feeding chain of the industrial system.”’

22
3.5 VAM definition
Policy definition
A special group of advanced materials has a significant potential to address the Grand Challenges and contribute to industrial and economic competitive advantage on the market. In this respect the ‘added value’ of these advanced materials is for the whole society and not merely for a specific com-pany or industry. The ‘added value’ of the material is, in addition, of a strategic and long-term nature, targeting the whole society. In other words, a group of ad-vanced materials that have a strategic importance for society and technology shall be considered VAMs.
3.6 What shall be not considered Value Added Material
To address the question ‘What is not a VAM‘, we return to the main definition factors. The first differentiating point for VAMs is the ‘knowledge intensivity’ in the process of material production. Note that a ‘knowledge-intensive process’ is not pre-cisely defined and therefore leaves the field open for further discussion. However, the high level of knowledge required leads to the assumption that the manufacture of novel VAMs is associated with the creation and protection of intellectual property. This means that the knowledge necessary for their creation is not commonly accessi-ble in the market.
In this way widely known examples of thermoplastics as polyethylene, polypro-pylene, polystyrene and polyvinyl chloride shall not be considered VAMs. Their pro-duction methods are well-known and the production process is not knowledge in-tensive. It is also no longer characterised by intellectual property protection. Ther-moplastics have become bulk materials.
On the other hand if we take simple plastic and enhance its structure with nano-particles in a complex process probably not available to most manufacturers in order to obtain novel or enhanced properties, this process would result in a creation of VAM.
The same logic may apply to such com-monly used materials as glass for windows, cement for construction or aluminium for car industry. In general these are bulk materials used and produced in multiple applications. The production of these does not give any market advantage based on ‘unique’ material properties. The produc-ers only compete with the price of the produced outcome. In most cases these common materials are produced in pro-
We distinguish four conditions that define VAMs:
1. Knowledge-intensiveness and complex production process.
2. New, superior, tailor-made prop-erties for structural or functional applications.
3. Potential to contribute to com-petitive advantage on the market.
4. Potential to address the Grand Challenges.
Thus the definition of VAMs can be formulated like this:
‘VAMs are a group of advanced ma-terials that have strategic im-portance for economic growth, indus-trial competitiveness and address the Grand Challenges of our times.’

23
cesses that can no longer be viewed as knowledge intensive. Simplifications in the manufacturing process and the possession of its knowledge does not provide a com-petitive advantage on the market. Expira-tion of patent protection after 20 years, means that any competitor is free to man-ufacture the material.
On the other hand laboratories of large and small companies work intensively to enhance properties of such bulk materials in order to create VAMs that address many challenging applications. These materials — having extraordinary, enhanced or new properties and able to respond to market needs, thus creating market advantage for the producer — meet the definition of VAM.
3.7 Classification
Common engineering materials within the scope of Material Science may be classified broadly into the following three main (tra-ditional) and two (relatively new) addition-al classes:
30
1. metals and alloys (ferrous and non-ferrous),
2. ceramics,
3. polymers,
4. semiconductors,31
5. composites.
These classes can be further broken into
various sub-groups, each with different
applications. Every object we come across
belongs to one or combinations of these
classes.32
30 Vinay Swastik, ‘Classification of Materials’, Metallurgist Encyclope-dia. 31 Items 4 and 5 of this list follow the classification of materials by Ash Tan; http://EzineArticles.com/2894736 32 Ibidem.

24
Table 2: Classification of common engineer-ing materials
Group Important char-acteristics
Common exam-ples of engineer-
ing use33
Metals and Alloys
Hardness, re-sistance to corrosion, ther-mal and electrical conductivity, malleability, stiffness and property of magnetism.
Iron and steels, aluminium, cop-per, zinc, magne-sium, brass, bronze, invar, super alloys, super-conductors, etc.
Ceramics Thermal re-sistance, brittle-ness, opaque-ness to light, electrical insula-tion, high-temperature strength, abra-siveness, re-sistance to corrosion.
Silica, glass, cement, concrete, refractories, silicon carbide, boron nitride abrasives, fer-rites, insulators, garnets, etc.
Organic Polymers
Soft, light in weight, dimen-sionally unstable, poor conductors of heat and electricity, duc-tile, combustible, low-thermal resistance.
Plastics – poly vinyl chloride, poly tetra fluoro-ethylene, polycar-bonates.
Natural and synthetic fibers – nylon, terylene, leather, etc.
Other uses – explosives, refrig-erants, insulators, lubricants, deter-gents, fuels, vitamins, medi-cines, adhesives, etc.
Source: Metallurgist Encyclopaedia.
33 Please note that these are not necessarily examples of VAMs, but definitely there are VAMs existing within these groups in the form of different composite materials.
New additional classes for VAMs
Semiconductor materials are nominally small band gap insulators. The defining property of a semiconductor material is that it can be doped with impurities that alter its electronic properties in a control-lable way. The most commonly used semi-conductor materials are crystalline inor-ganic solids. Semiconductors can be classi-fied into many groups following periodic table groups of their constituent atoms
34
as well as by different approaches follow-ing their general properties: e.g. elemental semiconductors, compound semiconduc-tors, layered semiconductors, magnetic semiconductors, organic semiconductors, charge-transfer complexes and others.
Composite materials constitute the catego-ry where most VAMs will be identified. Composites are materials composed of two or more distinct phases (matrix phase and dispersed phase) and having bulk proper-ties significantly different from those of any of the constituents. A composite there-fore is a combination of two or more chemically distinct materials whose physi-cal characteristics are superior to its con-stituents acting independently. The classi-fication of composite materials (based on matrix material) follows this basic split:
35
Metal Matrix Composites (MMC) Met-al matrix composites are composed of a metallic matrix (aluminium, magne-sium, iron, cobalt, copper) and a dis-persed ceramic (oxides, carbides) or metallic (lead, tungsten, molybdenum) phase.
Ceramic Matrix Composites (CMC) Ceramic matrix composites are com-
34 See Fluck, E. ‘New notations in the periodic table’. Pure & App. Chem. 1988, 60, 431-436; and Leigh, G. J. ‘Nomenclature of Inorganic Chemistry: Recommendations.’ Blackwell Science, 1990. 35Dr. Dmitri Kopeliovich, ‘Classification of composites’. http://www.substech.com/

25
posed of a ceramic matrix and em-bedded fibres of other ceramic mate-rial (dispersed phase).
Polymer Matrix Composites (PMC) Polymer matrix composites are com-posed of a matrix from thermoset (un-saturated polyester [UP], epoxy [EP]) or thermoplastic, (polycarbonate [PC], polyvinylchloride [PVC], nylon, polysterene) and embedded glass, carbon, steel or kevlar fibres (dis-persed phase).
Another classification of composite mate-rials based on reinforcing material struc-ture divides them into:
1. Particulate Composites- These consist of a matrix reinforced by a dispersed phase in the form of parti-cles:
composites with random orienta-tion of particles, or
composites with preferred orien-tation of particles. Dispersed phase of these materials consists of two-dimensional flat platelets (flakes), laid parallel to each oth-er.
2. Fibrous Composites
Short-fibre reinforced composites consist of a matrix reinforced by a dispersed phase in the form of discontinuous fibres (length < 100* diameter).
Long-fibre reinforced composites consist of a matrix reinforced by a dispersed phase in form of con-tinuous fibres.
3. Laminate Composites
When a fibre-reinforced compo-site consists of several layers with different fibre orientations, it is called a multilayer (angle-ply) composite.
Sanford L. Moskowitz36
elaborates on ad-vanced-material families based on proper-ties, production methods and applications, as well as the classical materials split pre-sented above. Moskowitz divides them into:
bioengineered materials,
advanced metals: advanced stainless steel and ‘superalloys’,
advanced ceramics and superconduc-tors,
nanoceramics,
piezoelectric ceramics,
synthetic engineering (nonconducting) polymers,
organic electronic materials (conduct-ing polymers),
organic polymer electronics (OPEs) and display technology,
OPEs and the integrated circuit,
advanced (nonthin) coatings,
thermal barrier coatings,
conductive coatings,
anticorrosion metallic coatings,
multifunctional ( ‘smart’) coatings,
nanopowders and nanocomposites,
nanocarbon materials,
metal fullerenes,
nanotubes,
nanofibres,
thin films,
advanced composites.
The same study also suggests a simpler approach to classification, grouping new materials as follows:
bioengineered materials,
advanced (‘super’) alloys,
advanced ceramics,
engineering polymers,
36 Sanford L. Moskowitz. Advanced Materials Revolution Technology and Economic Growth in the Age of Globalization; John Wiley & Sons, Inc.,2009.

26
organic polymer electronics (OPEs),
advanced electronic materials (other),
advanced coatings,
nanopowders,
nanocarbon materials,
nanofibers,
thin films,
advanced composites. Production process dimension — the ‘nano’ level VAMs classification can be also ap-proached by the dimension on which the material is produced.
In short the main split here will be the macro, micro and nano levels. Most of the commonly used composites are obtained at macro and micro levels. The lower the scale, the more knowledge-intensive the process for material creation is; therefore more VAMs can be found on the micro and nano scale. Today OECD’s database of nanomaterials
37 contains a record of more
than 300 different materials produced at the nano level, divided into following cate-gories:
nano carbon (e.g. multi-walled carbon nanotubes-SWCNTs),
polymers specifically synthesized to exploit nano-properties (e.g. specifi-cally synthesized polystyrene),
dendrimers (e.g. polyamidoamine-PAMAM),
components of quantum Dd (e.g. bari-um titanate CAS 12047-27-7, or silicon germanium),
inorganic nanomaterials ( e.g. alumini-um borate CAS 6179-70-7, indum ox-ide CAS 1312 43-2, silicon dioxide CAS 60676-86-0),
polymers and other organics,
37 OECD Database on Research into the Safety of Manufactured Nanomaterials. http://webnet.oecd.org/NanoMaterials/Pagelet/Front/Default.aspx
dendrimeres,
nanorodes,
nanoplates,
nano clay (e.g. kaolinite).

27
Chapter 4. Qualitative technology assess-ment and perspective in the social and eco-nomic context
Investors interviewed for this study re-vealed a representative opinion focused on research-demanding businesses. A number of investment experts indicated that re-search in advanced technologies has be-come more socially responsible, and eager to address the major problems of our times.
Quantitative information gathered during these interviews indicates that future in-vestments will be largely directed towards the three most important sectors in this context: energy, environment and health.
In this chapter we give an overview of the Grand Challenges and point out possible VAM implementations that may solve them. These application areas are the result of secondary data analysis, based on the available strategies, roadmaps and foresights for industrial technologies as identified in our research mission. Annex 1 provides a full list of market sizes gathered from the secondary sources analysed.
4.1 Grand Challenges
The Grand Challenges reflect Europe’s issues, current and future trends and the policies being developed in response. .
This important discussion joins the future of the Community with Community spend-ing, since Value Added Materials develop-ment may influence our future ability to answer the Grand Challenges. The Lund
Declaration38
identifies a set of themes in
urgent need of solution. The Declaration emphasises the necessity for the European research community to respond. Following this declaration, the European Commission (EC) Research and Innovation DG published a report on ‘The Role of Community Re-search Policy in the Knowledge-Based
Economy’,39
prepared by the European
Research Area Expert Group (ERA-EG). It has identified ways to maximise the effi-ciency of Community research policy in the post-2010 period. Among its most im-portant recommendations is a call for con-centrated research efforts to solve the major problems it terms ‘Grand Societal Challenges’.
Later on, the European Commission (EC) Research and Innovation DG published ‘Strengthening the role of European Tech-nology Platforms in addressing Europe's
Grand Societal Challenges’.40
This report
summarises the work of an expert group
38 Lund Declaration, ‘Europe Must Focus on the Grand Challenges
of Our Time’, Swedish EU Presidency, 8 July 2009, Lund, Sweden.
http://www.se2009.eu/polopoly_fs/1.8460!menu/standard/file/lund_de
claration_final_version_9_july.pdf
39 Report of the European Research Area Expert Group on ‘The
Role of Community Research Policy in the Knowledge-Based
Economy’, [Online] http://ec.europa.eu/research/era/index_en.html
40 Report of the European Technology Platforms Expert Group.
‘Strengthening the role of European Technology Platforms in
addressing Europe's Grand Societal Challenges’.
http://www.ectp.org/groupes2/params/ectp/download_files/27D1047v
1_ETP_ExpertGroup_Report.pdf
28
on European Technology Platforms, con-vened by DG Research in early 2009. The expert group examined how the current 36 European Technology Platforms (ETPs) should evolve in the near future. This re-port proposes that all ETPs be encouraged to work in flexible clusters focused on addressing the key problems facing Eu-rope. These clusters should involve all relevant stakeholders, work across all as-pects of the knowledge triangle (innova-tion, research, education), and be respon-sible for implementing potential solutions.
Each of the Grand Challenges raises signifi-cant issues for the future, while potential solutions may be linked to Value Added Materials.
When planning future research activities, the European Commission formulated the following Grand Challenges:
health, demographic change and well-being;.
food security and the bio-based econ-omy;
secure, clean and efficient energy;
smart, green and integrated transport;
supply of raw materials;
resource efficiency and climate action;
inclusive, innovative and secure socie-ties.
Sections below discuss these challenges, then present an overview of how VAMs might address them within a wider social and economic context.
4.1.1 Health, demographic change and wellbeing
Europe is bracing for the social and eco-nomic impacts of a retiring ‘baby boom’ generation. But the aging of the population is not a temporary European trend — it is a long-term and global development, one
that will be felt for generations to come. Paradoxically, perhaps, the new technolo-gies to some extent add to longevity, as medicine, sanitation, and agricultural pro-duction have improved. Life expectancy around the world has risen and continues to rise. This, combined with falling birth rates, is causing what experts call the ‘de-mographic transition’—the gradual change from high to low levels of fertility and mor-tality.
One of the most important implications of this transition is that the elderly constitute a much greater share of the total popula-tion than before. Europe has seen both mortality and fertility fall since the 19th century. Since the 1960s, however, fertility has declined even more dramatically. Eu-rope now has so many elderly people and so few newborns, that mortality rates have started to climb again, now reaching levels similar to some developing countries.
Today, 19 of the world’s 20 ‘oldest’ coun-tries — those with the largest percentage of elderly people (age 65 or older) — are in Europe. In Italy, the world’s oldest country by these standards, over 19 per cent of the population is elderly. This figure is ex-pected to reach 28 per cent by 2030.
Aging populations will create a number of challenges for current and future govern-ments. One is how to sustain public pen-sion/social security systems as a larger proportion of people reach retirement and enjoy a longer life. New technological solu-tions including Value Added Materials may be used to cope with some problems relat-ed to old age and frailty, and most of all to health related challenges.
Public health and pandemics
The main consideration in public health issues is to provide medical care to every-one while minimising discrimination.

29
The terms of reference for this contract exclude pharmaceuticals as such from the potential list of Value Added Materials in the strict sense. Still drug research is im-portant to public health and official re-sponses to pandemics.
In this context other materials’ applications with a high potential to address this chal-lenge are listed in analysed secondary sources.
Materials with new functionalities and improved properties and comfort: re-sistance against an aggressive envi-ronment, hygienic and easy to clean, moisture control, thermal, electro-magnetic and acoustic isolation, heat storage and climatic functionality. These qualities create a ‘warm feeling’ and aesthetic appearance.
Active, multi-functional materials that improve the indoor climate and ener-gy consumption of buildings by means of nano, sensor and information tech-nology.
Development of new materials based on bio-technologies, for example em-bedded bioelectronics, active surface properties, or natural process tech-nologies.
Smart garments that can adapt their insulation function according to tem-perature changes (through integrated sensors and actuators), detect vital signals of the wearer’s body and react to them, change colour or emit light upon defined stimuli (through inte-grated sensors and actuators), detect and signal significant changes in the wearer’s environment (absence of ox-ygen, presence of toxic gases or chem-icals, radiation, strong electromagnetic fields etc.), generate or accumulate electric energy to power medical and other electronic devices.
Materials speeding up recovery after medical treatment: innovative wound dressings; light, breathable or-thoses/protheses.
Materials improving everyday life for the elderly: adaptive compressing stockings, functional diapers, custom-ised clothing for easy use and func-tionalities adapted to special needs.
Textile-compatible energy storage systems like electrochemical batteries and supercapacitor materials.
Flexible or fibre-based photovoltaic cells and piezo-electric materials.
Electroconductive materials and poly-mer optical fibres for communication. Materials for wireless textile commu-nication systems.
Nanobio-devices for diagnostics, ‘cells-on-chips‘ for sensing elements.
Targeting agents or contrast agents, swallowable imaging, diagnostic and therapeutic ‘pills’.
Materials for wireless implants and autarkic sensors (smart power man-agement).
Active delivery systems, releasing drugs, vitamins or nutrients into the body when certain conditions occur.
Materials for integrated microproces-sors capable of data analysis, enabling early detection and diagnosis of ill-nesses or diseases.
Smart clothes fitted with nanosensors to record parameters such as blood pressure, pulse and body temperature.
Photosensors for fluorescence (vision systems).
Carbon nanotube ink batteries, micro batteries, supercapacitors, and micro

30
fuel cells built with 3D nanostructures and nano materials.
Wide bandgap semiconductor material for energy conversion systems.
Advanced materials for interconnec-tions and bonding techniques, thick layer deposition processes and encap-sulation techniques.
Materials for LED phototherapy unit producing blue light and minimizing exposure to harmful ultraviolet radia-tion.
4.1.2 Food security and the bio-based economy
Malnutrition affects 2 billion people in the world today. With the predicted growth in population, by 2025 this number likely will increase vastly (especially in Africa and South Asia), as food demand in emerging countries increases. Moreover, supply is likely to be reduced and food prices may prove prohibitive for the poorest groups because of the reduction of agricultural land, irrigation problems and the general effects of climate change. Value Added Materials in the chemical sector that sup-port agriculture production may be an important factor in future solutions.
In general the VAMs may not directly influ-ence the food production sector apart from such applications as:
advanced chemicals and biochemicals supporting agricultural production;
new packaging materials for food.
Water
The need for water will increase sharply with the increases in world population and the rise in the standard of living and expec-
tations in emerging countries. Strong ten-sions may emerge, as the quantities avail-able are likely to decrease due to climate change.
Desalination plants may proliferate around the Mediterranean, in Asia, Australia and California. Early plants first located in the Middle East today produce half of the world’s desalinated water. Such first-generation desalination technologies use a great deal of combustion energy. Thus current methods of desalinisation will contribute to increased CO2 emissions and exacerbate problems in the natural hydro-logic cycle.
Water suppliers are already using new technologies based on Value Added Mate-rials, and VAMs’ influence can be expected to grow in the future. Applications for water supply systems include:
materials for advanced technologies to permit the re-use of waste water;
materials for treatment systems for rainwater harvesting;
materials that remove microbial pollu-tion (including viruses) and emerging contaminants;
materials for seawater desalination by innovative solar-powered membrane distillation systems;
integrated long-term materials and components, based on innovative, cost-efficient technologies, for new and existing infrastructures;
materials for manufacturing nanopo-rous membranes (filtration, packaging, electrolytic devices, large surface elec-trodes);
materials that reduce energy and chemical use in water and wastewater treatment systems.

31
4.1.3 Secure, clean and efficient energy
There is an increasing tension between rapidly growing demand and restricted supplies of petroleum-based resources (oil, gas). Their polluting nature is a complicat-ing factor, which holds true for a resource that is still abundant: coal. These tensions have caused an almost constant rise in energy prices. Increased use of renewable energy, as well as progress in the reduction of energy consumption, may help to con-tain price rises. But opinion is divided over the scope of possible change, and how and when this might happen. Value Added Materials may have a strong role here, responding to the need of technologies to create effective alternate energy sources.
Despite our technological sophistication, in 2025 the world’s energy demand will have increased by 50 per cent (relative to 2005) and will reach the equivalent of 15 billion tons oil equivalent. Oil production will have peaked, and some experts believe coal will become the prime energy source between now and 2050. Possibly, oil will still largely
be in the lead in 2025.41
The security of
energy supplies increasingly will be called into question in Europe. If policy does not change the EU of the future will be more dependent on external sources than in 2005. In 2030, the Union will import al-most 70 per cent of the energy it needs.
Value Added Materials have the potential to modify some of those figures with low energy or green energy solutions. VAM alternatives can redesign today’s energy-consuming devices in both homes and industry.
The list of possible applications in the en-ergy sector may be tracked from currently
41 International Energy Agency foresight.
available roadmaps and industry strate-gies.
1. Energy production
Generate electricity, heat and clean fuels ( hydrogen, bio-fuels, etc.) using advanced materials. Examples are high-temperature materials, coatings and functional materials for zero-emission fossil fuel; nuclear, biomass and waste-fired power plants; fuel cells.
Materials for renewable energy sys-tems: solar (photovoltaic and ther-mal), wave/tidal and wind. Technolo-gies include improved solar panels, materials and production technologies for concentrator solar cells with very high efficiencies.
New materials to substitute petrole-um-based chemical with bio-based ones: ‘Green’ specialty chemicals.
Advanced biofuels: cellulosic ethanol, advanced biodiesel, other bio-mass/sugar-based biofuels, bio-synthetic gas.
Propulsion technologies: materials required for reductions in the number, cost, size and weight of the electrical equipment; alternators, transformers, frequency converters, generators and electric motors.
Nanotechnologies: new catalysts to increase the conversion efficiencies of fuel cells and biodiesel, and to synthe-size biodegradable lubricants.
Bioisoprene applications: rubber, ad-hesives, specialty elastomers, bio-chemical and bio-based hydrocarbon fuel for transportation.
Materials with specific requirements for power plants with corrosion re-sistance (aqueous and high tempera-

32
ture), light weight technologies (com-posites, plastics) and environmental coatings.
Improved materials for nuclear energy sector used for plasma surrounding components.
Innovative fuels for nuclear energy sector (including minor actinide-bearing) and core performance.
New high temperature resistant mate-rials for nuclear reactors, energy mi-cro-generation units for MST energy scavenging and conversion materials for energy waste.
Catalyst with higher longevity and robustness.
Catalysts to exhibit oil stability over time; upgrading to fungible biofuel.
Materials allowing for exploration and extraction in a harsh environment (es-pecially those that address corrosion).
2. Energy transmission
Materials for high-power electronic systems.
New materials with conducting and superconducting properties for trans-mission of large electrical currents over long distances without energy losses.
Materials for electricity, gas and hy-drogen distribution; pipelines for cap-tured CO2 (such as new ceramic mate-rials).
Advanced materials for overhead transmission: high-temperature con-ductors suitable for use on both transmission and distribution circuits to increase their thermal ratings, im-proved insulation systems.
Advanced materials for under-ground/submarine transmission: high
temperature conductors and insula-tion systems for cable transmission, high temperature superconducting ca-bles and Gas Insulated Lines.
Functional coatings with advanced thermal control: high capacity heat pipes (500 w/m), phased loop (10 to 1000 kw.m).
3. Energy storage
Advanced materials for large- and small-scale energy storage.
4. Energy use and efficiency
Materials for sensors, actuators, and control and communication systems to efficiently manage all the devices with-in buildings.
Materials for outdoor smart lighting.
Materials for energy conservation and efficiency in construction, such as ad-vanced glass, insulating materials, ce-ramics, coatings, etc.
Nanostructured antireflection coat-ings, photonic crystal, plasmonic guid-ing and other nanoscale coupling structures to reduce reflection losses and improve light capture.
Radically-advanced construction con-cepts such as integrated and intelli-gent agent systems, programmable nano-materials and nano- construc-tors, bio-mimetic materials, structures and facility systems.
Active phase-changing materials that control the climate within the house.
New nanoporous insulating materials that enhance insulation.
Radiant barriers in ceilings and walls to reduce heat loss by over 50 per cent by reflecting or absorbing infrared ra-diation.

33
Durable materials with prolonged and predictable service life under aggres-sive conditions, featuring self-assessment and non-intrusive in-situ inspection techniques.
Compound semiconductors ingots and wafers for Solid State Lighting.
Efficient lighting in the form of light emitting diodes: LEDs, OLEDs. Materi-als for LED device performance.
Materials for electrochromic ‘smart’ windows (OLAE, chips), advanced ma-terials (nanostructured silver chloride or halide, photochromic production).
Materials for high quality, low cost optical transceiver modules.
Materials replacing silicon with higher speed properties.
4.1.4 Smart, green and integrated transport
‘Transport is rightly considered (...) as a key societal challenge. It should be also kept in mind that transport is a key condition for competitiveness.’
42
Value Added Materials will play a central role in one of the key grand challenges: green transport.
Innovative solutions for transport address materials and manufacturing processes for lower fuel consumption and development of alternative fuel sources. Materials sci-ence is engaged in developing new con-struction materials for roads and rail roads, as well as materials for transport security.
42 Informal discussion with stakeholders on the transport component of the next common strategic framework for research and innovation, Brussels, 16 June 2011. http://ec.europa.eu/research/horizon2020/pdf/workshops/smart_green_integrated_transport/summary_report_workshop_on_16_june_2011.pdf#view=fit&pagemode=none
Such processes will be critical to strength-en the global competitiveness of the Euro-pean transport industry.
It must be noted that advanced materials are used now in the transport industry to a very large extent. This may be seen in the advanced cars produced today.
Advanced cars begin with a chassis of complex aluminium composite. In many cases they are covered with nano en-hanced, self-healing coatings, with anti-reflex windows produced of advanced glass. The interiors are filled-in with ad-vanced electronics and sensors. Finally, energy supply in combustion vehicles uses a number of composites based on poly-mers and ceramic materials. The future holds more environmentally-friendly solu-tions, with advanced materials used for efficient energy storage as well as materi-als for alternative energy production (hy-drogen fuel cells, photovoltaics, and so on).
The ‘green’ aspect of transport is very much aligned with two other Grand Chal-lenges described here– ‘resource efficiency and climate action’ and ‘secure, clean and efficient energy’. Further examples of ap-plications of Value Added Materials for transport will be developed in other sec-tions.
4.1.5 Supply of raw materials
Raw materials are not a key subject of this study. VAMs in this context shall be seen rather as alternatives for raw materials. In fact, current problems with raw materials availability have put VAMs into the fore-front of political discussion.
The European Commission claims that 14 critical raw materials used for high tech products such as mobile phones, laptop computers and clean technologies are in danger of shortage. Increased recycling of products containing these materials will be

34
needed in the future. The list includes cobalt, gallium, indium and magnesium. They are increasingly used for ‘emerging technologies’ but are mined in only a few countries such as China, Russia and Mon-golia. These countries could either manipu-late the supply of these critical materials or take environmental action that may jeop-ardise EU imports.
After recent problems with materials avail-ability from China, EU is working to secure supplies of these minerals from outside the EU, such as from Latin America, Africa and Russia. The EU also started stockpiling— to better profit from the material that we have here.
43
Demand from emerging technologies (in-cluding demand for rare earths) is ex-pected to increase significantly by 2030, according to EU estimates.
44
Materials experts whom we interviewed described this situation as influencing the possibilities for large development of ma-terials’ technologies. Our informants noted the difficulties of replacing critical raw materials which sets the stage for devel-opment of VAMs’ market, especially in the field of catalysts and materials for energy storage. They also said that without a technological breakthrough it will not be possible to fully reduce the market need for critical raw materials.
43 Andrea Maresi, press officer for EU Industry Commissioner Antonio Tajani. 44 Report of the Ad hoc group on defining critical raw materials, June 2010, Brussels. http://ec.europa.eu/enterprise/policies/raw-materials/files/docs/report-b_en.pdf , http://europa.eu/rapid/pressReleasesAction.do?reference=IP/10/752&format=HT and http://europa.eu/rapid/pressReleasesAction.do?reference=MEMO/10/263&format=HTML&aged=0&language=EN&guiLanguage=en
The experts identified another approach: increased recycling of raw materials to reduce demand side of the market. There-fore one response to the raw materials challenge is more research on how to recy-cle technically-challenging products and improve collection. Here again Value Add-ed Materials might be of use in the design of such advanced recycling systems.

35
Figure 2: Production concentration of critical raw mineral materials
Sources: U.S. Geological Survey; Johnson Matthey; British Geological Survey. Information graphic by Tommy McCall and Mike Orcutt, ‘Tech-nology Review’ by MIT. Some percentages do not add up to 100 due to rounding. 2010 global production figures are estimates. U.S. production figures for selenium and indium are withheld. The historical production of lithium refers to lithium ore.

36
VAMs have the potential to substitute for raw materials. Still, interviewed experts see such applications as challenges for future research.
According to the secondary sources of this study, the research and industry deploy-ments in nearest future will focus on:
improved physical methods for miner-als concentration (enrichment of non-ferrous ores, froth flotation);
new technologies for production of precious metals;
development of chloride metallurgy;
processing systems for re-use and recycling;
innovative use of alternative energy sources for processing raw materials and metals recovery.
4.1.6 Resource efficiency and climate action
Global warming is no doubt one of the most serious problems facing humanity today. Two separate dimensions of global warming correspond to different kinds of advanced technologies under discussion. First is the prevention of the global warm-ing itself (reduction of emissions, clean production, less pollution in general). Se-cond is the technological efforts to miti-gate the consequences of global warming (natural disasters such as flooding, forest fires, hurricanes, desertification).
Global warming is also connected with other Grand Challenges, as it will have an impact on the long-term health and eco-nomic well-being of current and future generations.
In order to prevent a downward spiral, the current strategy underlines the need to
reduce emissions of heat-trapping gases by using the technology, know-how, and prac-tical solutions already at our disposal. Sec-ondly the strategy purses promising new technologies, including Value Added Mate-rials, that will enable us to produce highly efficient products with less pollution, thanks to knowledge-intensive production processes.
The European Commission followed this strategy to tackle global warming since the introduction of climate-related initiatives in 1991, when it issued the first Communi-ty strategy to limit carbon dioxide (CO2) emissions and improve energy efficiency. Several important directives were intro-duced at that time, including those to promote electricity from renewable ener-gy, voluntary commitments by car makers to reduce CO2 emissions by 25 per cent and proposals on the taxation of energy products. All those fields benefit from implementation of Value Added Materials.
Interviews again revealed the im-portant relationship between the research of Value Added Materials and their market implementation.
Although by definition VAMs are knowledge intensive, their market implementation is dependent on relatively simple (short and inexpen-sive) production processes. Only the VAMs that are able to be used in mass production with high cost effi-ciency have the potential of address-ing environmental challenges. This is due to the direct linkage between complexity, cost and pollution impact of the production processes. The more complicated the production process, the more energy it takes; therefore the VAM becomes more expensive and finally more polluting.

37
Examples include filters, protection and isolation films, new combustion sources, energy storage and electricity grids.
However, it is clear that action by both Member States and the European Com-munity need to be reinforced, if the EU is to succeed in cutting its greenhouse gas emissions to 8per cent below 1990 levels by 2008-2012, as required by the Kyoto Protocol. On the political level this was supported by the EU Council of Environ-ment Ministers, who acknowledged the importance of taking further steps at Community level by asking the Commission to put forward a list of priority actions and policy measures. The Commission re-sponded in June 2000 by launching the European Climate Change Programme (ECCP). The political dimension and com-mitment later on was strengthened through the engagement of the European Commission in the development of tech-nologies, particularly in the context of the framework programmes (FPs). Industrial technologies play a crucial role in the Commission’s portfolio of tools, and are strongly represented in European FPs, especially with the NMP priority in FP6 and FP7.
The second European Climate Change Programme (ECCP II), which was launched in October 2005, is still influencing the shape of the strategic dimensions of re-search conducted in FP7.
In spite of all political actions, the most important source of CO2 emissions world-wide is caused by the transportation of goods and people. Fossil fuel combustion generates more than 90 per cent of the world’s CO2 emissions.
Several materials applications are able to address this fossil fuel combustion chal-lenge:
high strength, low weight materials to reduce weight and friction, and there-fore fuel consumption and CO2 emis-sions (advanced composites, alloys and sandwich structures, near net shape materials);
materials reducing maintenance (low thermal expansion polymer matrix nanocomposites, super hard nanocrys-talline metals, alloys and intermetal-lics);
multimaterials (hybrid) systems: met-als-plastic, ceramics-metals, compo-sites, Al-Steel, metal-rubber, plastic-TPEs, plastic-metal-TPEs for automo-tive applications;
functionally graded materials and self-lubricant coatings for critical working environments (engines, sensors, me-chanical components, bifuel and trifuel engines, energy or fuel storage);
high temperature materials (thermal barrier coatings, nanocoatings, ceram-ic thin film coatings) for engine com-ponents, turbines resistant to corro-sion, wear, creep, temperatures;
catalytic and photo-catalytic materials and nanostructured coatings for dif-ferent applications (new combustion systems, alternative fuels, micro-combustion, environmental treat-ment);
materials for embedded sensors, to improve data acquisition, on-line mon-itoring and new designs;
environmentally friendly coatings for transport components (free of Cd, Cr, and Pb);
biodegradable and renewable materi-als (lubricants, fuels, plastics) to re-duce the CO2 emissions;
advanced road surface and bridge materials;

38
materials for electronic paper as an alternative to conventional books, newspapers and magazines.
After fossil fuel combustion the next two areas with high CO2 emission impact are iron, steel and cement production.
As indicated in the interviews future re-search on VAMs shall include new/improved methods of steel and ce-ment production in order to minimise their environmental impact. . Some expert opin-ions indicate the need for new research to change the chemical processes behind production of cement.
4.1.7 Inclusive, innovative and secure societies
This grand challenge is in fact composed of three separate issues. Openness of socie-ties is hardly connectable with discussion on advance materials; nevertheless in a larger context security is fundamental for society’s ability to be open. An innovative society, meanwhile, is the overwhelming factor motivating this study. Therefore in this section we will only address the securi-ty issues that can be directly answered with material science.
Current developments in the Arab coun-tries in Northern Africa, mass migrations influencing southern European countries and growing terrorist risks put security in forefront for industrial technologies and novel materials research. The European security strategy, ‘A Secure Europe in a Better World’, endorsed by the European Council in December 2003, outlines the global challenges and key threats in this area.
The Commission Communication from 2003 on ‘The European Defence and indus-trial and market issues – Towards an EU
Defence Equipment Policy’ emphasises the need for effective cooperation between national research programmes in the field of global security. The idea is to concen-trate on a few carefully selected subjects of advanced technology accompanied by specific measures.
Security is an evolving issue that presents many challenges to the EU. It impacts a wide range of existing and emerging EU policies (include competitiveness, transport, environment, energy, health, consumer protection, finances, trade, space and telecommunications). It is a critical consideration of the Common For-eign and Security Policy (CFSP) and the European Security and Defence Policy (ESDP). The research policy plays a cross-cutting role to target threats and reduce citizens’ concerns, helping to protect against terrorist threats.
The Union needs to use a range of instru-ments to deal with such current hazards as terrorism, proliferation of weapons of mass destruction, failed states, regional conflicts and organised crime. Industrial technologies can give the necessary assis-tance, offering scientific innovations in the area of detection, monitoring and early warning systems and technologies. Value Added Materials are often used for pro-duction of final products used in the area of security.
Technology itself cannot guarantee securi-ty, but security without the support of technology is impossible. It provides in-formation about dangers, helps to build effective protection against them and, if necessary, enables designated agencies to neutralize them. In other words: technolo-gy is a key ‘force enabler’ for a more se-cure Europe. Space technologies are a perfect illustration of this: A decision as to whether global positioning or earth obser-vation systems, for example, are to be

39
used for defence and security purposes is primarily political in character, not techno-logical. In any case, any developed system will very likely use Value Added Materials for many of its applications.
Secondary sources for our security discussion contain mostly materials applications within the fields of optics, electronics, data transfer and ad-vanced armours and body protection systems. VAMs possess trans-sectoral applicability in surveillance, military personal communication systems and personal security. New materials for electronics: materials for supercon-ductors, polymeric conductors and semiconductors, dielectrics, capaci-tors, photo resists, laser materials, lu-minescent materials for displays, as well as new adhesives, solders and packaging materials.
New materials in the field of optical data transfer: non-linear optics mate-rials, responsive optical materials for molecular switches, refractive materi-als and fibre optics materials for opti-cal cables.
Metamaterials for photonics (synthetic materials, mostly nanostructured): Photonic crystals, quantum dots (in-cluding composite colloidal nanoparti-cles in a glass or polymer matrix or semiconductor media) and materials exhibiting negative permittivity or permeability or both.
Group IV photonics: this includes sili-con (Si) and its combination with ger-manium (Ge) and tin (Sn) for applica-tions such as modulators and light sources with higher optical functionali-ty and performance.
Carbon nanotubes and graphene, which offer new vistas in photonics with their high absorption and mobili-
ty, complementing their use in non-photonic fields such as catalysis.
Material engineering in oxides and chalcogenides: while these materials have been known for a long time, nanotechnology offers new possibili-ties to utilise phenomena such as phase changes to significantly alter op-tical characteristics in a way not achieved with other materials.
Materials for ultraviolet and mid-infrared devices and fibres, including acousto-optic materials and Faraday rotators for optical isolators.
Organic phosphor materials for solid-state lighting, to achieve higher light conversion efficiencies than inorganic materials at significantly lower cost.
Nanoparticle integration in dielectric coating matrices for the development of improved optical switches, laser concepts and sensors.
Advanced polymer coatings which exhibit superior functional properties for photonic devices at low cost. It is possible to modify the physical, me-chanical and chemical characteristics of polymers in order to increase the functionality of optical devices. One example is including nanoparticles in the polymer matrix. Polymers also provide the key to flexible optical de-vices whilst the combination of poly-mers with semiconductor materials will give rise to novel components such as those based on optofluidics.
Graphene and carbon-based materials have highly desirable electronic prop-erties such as ultrahigh mobility, pos-sibility of innovative approaches to bandgap engineering, and ballistic transport at room temperature. Also they have excellent thermoelectric

40
properties, mechanical strength and electromechanical properties.
Manufacturing of low-power non-volatile 4M-bit carbon-based memo-ries with equivalent switching perfor-mance as SRAMs.
Carbon-based memories with ultra-low power consumption and non-volatility that serves as universal memory.
Materials for ‘harsh environment skin’— close-to-body protective mate-rials for harsh environments.
Materials for radiation-hardened chips, sensors and radars, PV modules.
Lightweight structures for satellites and observations systems.
Materials for structures giving stiff-ness/low mass/thermal properties, electrical-combined properties, mois-ture insensitive (non-hydroscopic) properties.
Materials for high-speed data pro-cessing.
4.2 Business challenges
Experts interviewed for this study clearly set forth several business-related issues. Seen in the context of existing economic limitations on the markets for VAMs, these concerns illuminate ways to address the Grand Challenges with greater strength.
Patent protection
Our definition of Value Added Materials in chapter 3 lists two important factors to consider while discussing the new and advanced materials on the market today. These are knowledge intensivity in produc-tion process and competitive advantage on the market. These two factors, taken to-
gether and in context, lead us to the con-clusion that VAMs knowledge intensive production processes must be patent pro-tected in order to assure competitive ad-vantage on the market. Simultaneously this is one way of preventing VAMs from be-coming a commodity over time. Only ma-terials that are protected by intellectual property regulations for 20 years will be able to maintain the competitive ad-vantage on the market. Limiting the com-petition through patents provides the necessary incentive to research and devel-opment, and rewards inventiveness.
Time to market
Time to market indicates the length of time it takes from a product’s conception until it is available for sale. This term is crucial for Value Added Materials, as well as for all other industry products and services. All interviewed experts saw the time to mar-ket as far too long for VAMs. Examples given by car producers and aircrafts pro-ducers confirm that the average time to market in these industries is around 20 years. This in reality is how long it takes before a new material gets from lab to demonstration, through tests and certifica-tions, and finally to production. In fact today’s cars and planes are built with ma-terials invented in the early ‘80s.
European research programmes must consider this particular factor in their plan-ning. Investors we interviewed clearly stated that it might be more reasonable for future research programmes to demon-strate a more business-based approach by investing in ideas where the market im-plementation is closer and the product life cycle may start sooner. Venture capital market advisors and business angels’ net-works have to gain profits from the busi-ness ideas they support. The obvious con-clusion is to learn from them when select-ing research to be financed.

41
Another very strong opinion from the in-terviews is that we ‘just’ have to imple-ment all technologies available today in order to deal with the societal challenges. In other words, the technological sophisti-cation exists now. It is the means that is lagging. From the perspective of 2020, there is no time for new research.
Small and Medium Enterprises (SMEs) need to be supported
SMEs are considered the primary innova-tion actors in developing the VAMs and their applications. But SMEs still encounter problems when striving to finance their projects, reach the market and make their products known to customers, while build-ing solid networks that would help them promote their VAMs. The role of private equity and venture capital is highlighted in this context.
Too high production costs
For a VAM to be considered interesting, it should be 30 per cent cheaper or perform 30 per cent better. This is the rule of thumb when replacing an old material with a new one in the open market. The excep-tion is fulfilling a regulation that bans the old materials for reasons of health risks, CO2 emissions and so on. The next several sections examine why.
The scale-up problem
The up-scaling step – taking a technical solution from the research laboratory to industry production — is very difficult to make. There must be a sufficient market for the product and a scalable production technology behind the idea. This is the ‘valley of death’ problem: a lot of very valuable materials are created in labs but the step into industrial application has not been achieved. Manufacturers cannot produce them at industrial scale at an economically reasonable price, and thus a
chicken-and-egg dilemma appears. To create a market for a material, it must be produced in large quantity in order to be profitable, but new markets have an inher-ent risk of too-small demand.
Economies of scale and scope
Economies of scale45
occur when increas-ing production volumes permit significant lowering of average cost. Because of the small volumes in typical production runs, scale economies are rarely exhibited and are not a feature of new and advanced materials supply. Once volumes become large and scale economies occur, the ma-terial is, by definition, neither new nor advanced.
Economies of scope are likely to be more important for some new materials than economies of scale. Economies of scope are characterised by cost reductions achieved through the jointness of some costs in producing differentiated products (that is, the integration of manufacturing options so that the same processes pro-duce different goods). The associated in-crease in product variety enables produc-ers to be flexible in fulfilling customer needs. There are significant economies of scope where new and advanced materials (such as engineering ceramics) are tailor-made. However, economies of scope can be difficult to achieve. The use of more specialized materials, unique design, and the level of skills required are all expensive to duplicate, and can discourage entry into niche markets.
Businesses working with VAMs are gener-ally associated with high risk and large capital intensivity
45 Australian Industry Commission, New and advanced materials report no. 42, 1995.

42
The investors emphasised that work with VAMs is a high-risk type of businesses. Capital intensiveness, commercialization risks, technology risks — all these factors influence capital funds’ willingness to allo-cate resources.
Quotations garnered from our interviews reflect these factors:
‘There [are] a lot of interesting things in materi-als science — the point is nevertheless to identi-fy the commercial need for it. It’s not that easy to see it often. It could be a really light and durable material, but you need 1 billion dollars to commercialize it — the magnitude of money is very large here — on billion scales — the risk is tremendous and the time perspective is large. The material may be cool, but the amount of investments needed and the risks involved outweigh its potential to pay off.’
‘You need to consider different commercial needs that you believe in, that are not only technically do-able, but also manufactured in such a way that it brings a high yield, with not-so-high production costs and not-so-high risks.’
‘People come with new materials and technolo-gies all the time, but these produce small changes in very complicated systems and re-quire [a] huge amount of money. It takes a long time, depending on what they do. Even if in the lab the results are good it may not be the same when tested in the industry. Many don’t under-stand how much time and money it takes to bring a new technology to the market. It is common that people put a lot of money in R&D of a material and then they search for its appli-cations: i.e. start from the technical side and try to match with some commercial needs. These applications can pay for all [the] money you need to invest, but one needs to start from the commercial side.’
Reasons for not investing
Our informants revealed several reasons for not investing in new developing busi-nesses in the area of materials industry.
The investors’ views can be summarised as follows:
too capital intensive (example: hydro-gen storage);
political complexity (example: hydro-power, nuclear power);
limited market (example: wave ener-gy);
market not ready (example: energy storage);
technological challenges (example: superconductivity facing complex technical problems, fuel cells, batter-ies — lot of R&D resources were in-vested with little success, hydropower — no mature technology);
lack of trust in market potential;
not profitable business (example: transports, environmental related businesses, unless policy regulates the market);
investor doesn’t know much about the specific market (example: prostheses or biomaterials);
risky business (example: health effects of nanotechnologies);
overinvested sector (example: ICT).
Many interviewed investors, especially those who invest in clean tech and med tech, are materials or technology experts themselves or have other technical back-grounds. They are updated with the re-search and developments in their field— they have a clear view on where the break-throughs are happening and the potential of development in the field.
The decision of how to invest partly re-flects the companies’ current investment portfolio and partly the respondent’s as-sessment on the future of a potential in-

43
vestment. Key factors affecting invest-ment decisions in VAM-related businesses
if the business provides a unique posi-tion on the market;
if the business is innovative;
if the business responds to a market need;
if the invention is or can be patented, or protected by other legal measures;
if the business has good managers and driving leaders;
applicability and scalability of the material;
solid intellectual property structure;
readiness of the market.
Excerpts from our interviews add context to the above factors. ‘You try to find whether
the technology has a unique precision when it comes in the market, what sort of influence it will have on the market. Innovativeness is clear-ly important, but also it has to have a market
potential — that there is a market need for it.’
‘As for all VC it is important that you can protect that by a patent, you need to have a good IP position with regards to the competitors.’
‘[I]t is important to have the people behind the company, who can drive this process and man-age the development.’
‘You pick areas where you think that the com-pany will achieve a unique position in the mar-ket.’
‘It may be a very noble technology, but the market is not ready for that. The market needs to react and show that they are willing to pay for it.’
The exit time for these businesses (mostly VC) varies from 3 to 5 (mostly) up to 10 to 12 years depending on industries, technol-ogy types and applications, with the energy and environment tending to have even
longer time frames (10 to 20 years) and ICT and health having shorter time frames (2 to 10 years).

44
Chapter 5. Qualitative and quantitative Value Added Materials market analysis by sector
At the request of European Commission, the approach of this study was to investi-gate venture capital investors, business angels and investment banks advisors in order to get a picture of their possible investments strategies and most promising investment areas for the future.
5.1 General investment split
Interviewed market investors expressed the opinion that most of the early stage and seed capital investments in advanced materials are not dedicated to a pre-selected particular sector. Investment in research on new materials brings uncer-tainty but also possible diversity of future applications. Investors at this stage make decisions based on the available flow of investment opportunities and general strategy of the fund. Because of these two factors, their investments are largely pre-defined.
For the purpose of this study they were asked to conduct a very open exercise: Freely allocate a hypothetical fund into a number of sectors, indicating potential future market growth, based on their best guesses and overview of current situation.
The interviews revealed that investment specialists were able to discuss potential split of investments in the future on a sec-tor level. It was nevertheless difficult for them to provide more precise divisions regarding detailed, expected future alloca-tions per sub sector or application area.
They also estimated the investment time-scale for private equity. The general ap-proach is defined here by the so-called
‘closing period’ of the venture capital funds.
Following the general theory of the private equity business, most venture capital funds have a fixed life of 10 years,
46 with the
possibility of a few years of extensions to allow for private companies still seeking liquidity. The investing cycle for most funds is generally three to five years, after which the focus is managing and making follow-on investments in an existing portfolio. This model was pioneered by successful funds in Silicon Valley through the 1980s to invest in technological trends broadly but only during their period of ascendance, and to cut exposure to management and marketing risks of any individual firm or its product.
Investors interviewed in this study ex-pressed a clear division in this regard be-tween the selected sectors. While ICT in-vestments are considered ‘faster’, energy, health and environment sectors are con-sidered to be long-run investments. There-fore in one venture capital cycle, we might expect 3 to 4 investing cycles in ICT related deals, and only 1 or 2 cycles in other sec-tors where investment requires more than 5 years and sometimes even 10 to 12 years engagement.
When it comes to expected Return on Investment (RoI) it seems that most of the investors are influenced not by the sector but the business idea or technology behind the potential investment deal. In other
46 http://en.wikipedia.org/wiki/Venture_capital

45
Source: Oxford Research AS. Percentage calculated from averages based on values of portfolio allocation (n=12).
words, the sector and subsector may not seem to be very lucrative in general terms, but the business may still have the poten-tial to generate very high RoI. In most of the interviews the average expected RoI from a single deal was estimated to be in the range of between 20 to 30 per cent, but as stated before some businesses have a shorter investment time frame than the entire fund duration. In general, the longer the engagement, the higher RoI expected. The RoI expected from VAM-related busi-ness varies depending on the type and stage of the company, the industry sector
and the time frame. One must remember that it is impossible to define precisely investors’ expectations with regard to RoI. Expectations are different each time. Ex-pectations are also high, since each inves-tor wants to multiply his/her investment. One must also remember that out of a number of different deals in one venture capital fund portfolio, some investments will never lead to successful commerciali-zation, and only a limited number of com-panies financed bring multiple, sometimes astronomical RoI.
Figure 3: Investment willingness for VAMs by sector
The willingness of the interviewed inves-tors to allocate their funds into invest-ments connected with development and market implementation of Value Added Materials is demonstrated in Figure 3. Interviewees clearly believe that the most promising investment sectors of the future are energy and environment, which make up more than 60 per cent of the available hypothetical portfolio. ICT and automotive were not highly ranked by private invest-
ment advisors. They reasoned that large enterprises’ own research investments made their involvement unnecessary and that these industries were largely ad-dressed by private capital in past decades (especially ICT industry).
Note that ICT is not fully reflected in this study. This particular sector is mostly com-posed of services and software, so that materials do not influence the market size directly. Our respondents were only asked

46
to give their opinion about investing in projects related to materials. Therefore the ICT sector is underestimated in our hypo-thetical allocations exercise, although some investors define semi-conductors, micro- and nano-electronics and the like as ‘ICT hardware’.
The specificity of the investments is also important for this study. Interviewees claimed that this type of investment in highly risky ideas is mostly addressed by private investors — venture capital funds and private equity business. Banks do not tend to operate within this kind of highly demanding and risky market. Stock market investors will also be far from this kind of investments since by definition such actors may invest only in companies already es-tablished on the stock market with a prop-er public securities structure. Investors interviewed also indicated another im-portant player for the development of research: large industry actors with their own research facilities, agendas and budg-ets.
A different set of interviews conducted simultaneously with materials experts representing research centres of such larger companies was not included in the results above, since this group was purely oriented in research within their industry (such as automotive, construction materi-als, etc.) and did not have an overview of the investment market trends.

47
Source: Oxford Research AS. Percentage calculated from averages based on values of portfolio allocation (n=10).
5.2 Overview of sectoral investment willingness
The following charts present results of the investigation of investors’ willingness to allocate resources within each of the sec-tors within the scope of this study.
Their willingness is understood in this con-text in terms of portfolio allocation. Each of respondents could allocate a hypothet-ical portfolio of investment fund into dif-ferent (predefined) sectors. The percent-ages demonstrated below show therefore the size of potential financial allocations
into research-oriented ‘deals’ of venture capital and private equity investors.
Please note that the less ‘popular’ the sector was, the lower the number of valid opinions regarding detailed investment directions. Investors could not give more detailed split, as their decisions are based on availability of good business ideas, and not reflecting any particular subsector categories.
Figure 4: Investment willingness for VAMs in the energy sector
Within the energy sector — which promis-es the most growth potential in the future — our study indicated the biggest potential in the energy storage field, which garnered one-third of the possible investments. This indicates that batteries and energy storage in large grids are critical issues for future development of many areas of the econo-my.
Following this were the investments in materials for energy generation and transmission. Finally, energy savings had reasonable share of the potential future market and thus was ranked fourth in this sector.

48
Figure 5: Investment willingness for VAMs in environment sector
The willingness to invest in the environ-mental sector was focused on water tech-nologies. All areas — from water treat-ment, desalination to waste water tech-nologies — took up to 48 per cent of the potential investments.
Another prospective area was solid waste management and related technologies (also related to technologies focusing on energy production from solid waste). The-se subsectors take more than three-quarters of total environmental sector allocations.
Figure 6: Investment willingness for VAMs in health sector
Source: Oxford Research AS. Percentage calculated from averages based on values of portfolio allocation (n=5).
Source: Oxford Research AS. Percentage calculated from averages based on values of portfolio allocation (n=5).

49
Source: Oxford Research AS. Percentage calculated from averages based on values of portfolio allocation (n=3).
The health sector is largely dominated by large drug manufacturers with their re-search-oriented agendas and own labora-tories. Still the health sector is very inter-esting for VC and PE (Venture Capital and Private Equity) in terms of producing medi-cal equipment, new technologies for diag-nosis and their related substances. Delivery
of prostheses and biomaterials for regen-erative medicine is considered a huge market for intensive development in the future. These are seen as highly profitable niche markets where a high innovativeness and knowledge intensivity play crucial roles.
Figure 7: Investment willingness for VAMs in ICT sector
The willingness to invest in transport ac-counted for 7 per cent of investors’ alloca-tions demonstrated at Figure 3 was not depicted in form of graph since there was no division in their answers.
The main reason for this is that the transport sector is normally divided by the mean of transportation including such categories as water, road, rail, air and space. A second approach to possible sec-tor division is two-fold: passenger transport and goods transport. In all cases the use of materials is not determined so much according to this possible market segment division, but rather by the mate-rial usability. For example, the ultra-light and highly durable materials for transport will be used in many transport subsectors as they will lower the fuel consumption of the vehicle. Also energy storage and highly efficient fuel cells have the potential to be
used in all transport environments. For these reasons investors were not able to give any information on the division of their possible investments in this sector, following the possible subsector divisions.
Investors consider that the applications developed in other sectors will be applied in the transport sector as a matter of course, and therefore they are not inter-ested in directly investing. However weight reduction and the role of lightweight mate-rials is perceived as crucial for this sector.
5.3 Findings from interviews
Interviewees give different estimates of future market shares of VAMs and differ-ent assessments in terms of percentages. Still, patterns clearly show confidence in future potential market growths. The diffi-culty of assessment of market size is

50
caused by the nature of VAMs, which can-not be separated from the production process and integration. VAMs are used in combination with other materials, tech-nologies and structures. Materials are just the beginning of the feeding chain of the industrial system. It is difficult to ‘put a finger’ on a specific VAM or group of VAMs. Segmenting VAMs is also difficult because of overlap across sectors. These overlaps will always influence the market segmentation and the value-chain struc-ture.
On the other hand all the respondents express confidence that the share of mate-rials will increase the future, although they say it is difficult to give numbers due to complexity of the nature of the VAMs and their context. Typical expressions used with respect to VAMs markets are ‘the markets will increase dramatically’ and ‘we see significant increase in the coming years.’
The development of VAMs markets de-pend on a range of factors
The development of materials markets also depends on the political environ-ment: regulations, policies to support renewable sources of energy as well as numerous other factors. For example, nuclear energy, along with the range of VAMs specifically associated with it, is subject to political uncertainty. Reg-ulations of CO2 emissions and other environmental requirements also in-fluence the markets.
Emerging markets for the VAMs will depend on the concomitant develop-ment of technologies and manufactur-ing systems that use these different materials.
The markets for the VAMs will depend on solutions integrating VAMs in dif-ferent structures and devices. As stat-
ed earlier, it is not possible to separate the materials from the production and integration processes. VAMs value de-pends on streamlined integration solu-tions, and their position in the value chain.
Price of VAMs application will matter. The markets for VAMs will depend on the ability of the VAM to be produced with low costs. Price is important when it comes to the competitiveness of a material. If there is a cheaper, non-VAM material available, industry will choose it. Customers will not buy VAMs at any price just because of their functionality or potential for re-ducing CO2 emissions or environmen-tal pollution. This is especially true if the price of the specific VAM is much higher. However, the success of the organic food and green building mar-kets, with ‘natural’ higher-cost prod-ucts, show that consumers will pay a reasonable higher price for a per-ceived improvement in quality that is in line with their personal values.
Producers will consider the total price for these materials and final costs of the entire applica-tion/device/structure for industrial production. If development of tech-nology implies multimillion invest-ments, these costs will play a role.
VAMs need to be produced and used under the conditions of energy sav-ing/energy effective production pro-cesses and with minimal CO2 emis-sions in order to develop and sustain their markets.
Market growth areas for materials indi-cated by interviewees:
catalysts;
clean tech;
novel pharmaceuticals;

51
tissue repair;
diagnostic technologies;
advanced sensors and monitoring systems (in all industries);
coatings (currently large market, with large market potential in the future);
intelligent packaging;
batteries (if a breakthrough happens);
advanced composites;
lightweight materials (currently very limited scale, but it will increase in the future);
fuel cells (currently limited market, but bound to increase in the future, espe-cially with government subsidies);
bio-based materials;
nano structures and thin films;
superconductivity (if a breakthrough that could substitute copper wires oc-curs);
LEDs.
Key industrial sectors where VAMs will play an important role, according to the interviewees
Energy (generation, distribution, stor-age and efficiency — all the subcate-gories): Huge market opportunities, but also important area with regard to focus on the Grand Challenges.
Environment: interconnected with the energy sector. A cross-cutting sector across the other industry sectors.
Health: medical devices, biomaterials. Tissue engineering, nanostructures considered as big markets, also deal-ing with challenges of the ageing soci-ety.
Transport sector: lightweight materi-als.
Industrial tools, machines, equipment and devices that are used to manufac-ture VAMs and further integrate them into systems.
‘Old’ markets and structural materials
The metals that are widely used today in construction, transport, and other sectors — steel, aluminium, copper — already have well-established markets. Entire in-dustries build on them and are developing metallic alloys and hybrid solutions. VAMs cannot replace these materials entirely, at least not until 2030 or even 2050. Instead VAM technologies and production pro-cesses can enhance the existing materials by providing them with superior proper-ties, multifunctionality, and making their production more energy efficient.
‘There is a danger in focusing lot of effort and resources on certain types of materials and not even know what their markets will be and at the same time ignore the basic materials that still are fundamentally used in many industrial sectors.’
5.4 Emerging technologies within materials
A good complement to the picture given by our expert investors is the yearly MIT ‘Technology Review’ assessment of emerg-ing technologies. MIT investigates the most promising technologies and materials-related research of the last decade, looking for those that have a potential to produce the greatest impact on our societies. An overview is presented in Table 2.

52
Table 3: An overview of top emerging technologies within materials and the research centres working on these in the last decade.
Year System / Technology
Description Material Sector Centre of Excellence
2011
Smart Transform-ers
Controlling the flow of electricity to stabilize the grid
Semiconductors based on compounds of silicon and carbon or gallium and nitrogen
Energy
North Carolina State University; Others working on smart trans-formers: Amantys, Cambridge, U.K.; Cree, Durham, North Caroli-na; Electric Power Research Institute, Palo Alto, California
Cancer Genomics
The use of sequencing to study the genomes of diseased cells
Health and Biotechnology
Washington University, St. Louis, Missouri; Others working on cancer genomics: BC Cancer Agency, Vancouver; Broad Institute, Cambridge, Massachusetts; Wellcome Trust Sanger Institute, Hixton, U.K.
Solid-State Batteries
Smaller and lighter lithium batteries will make electric vehicles more competitive, as liquid electrolyte is replaced with a thin layer of material that's not flammable
Not revealed
Transport, Energy
Sakti3, Ann Arbor, Michigan; Others working on solid-state batter-ies: Planar Energy, Orlando, Florida; Seeo, Berkeley, California; Toyota, Toyota City, Japan
Separating Chromo-somes
A matchbox-size device uses tiny valves, chan-nels, and chambers to separate the 23 pairs of chromosomes in the human genome so they can be analysed individually
Health and Biotechnology
Stanford University; Others working on separating chromosomes: Complete Genomics, Mountain View, California; Scripps Re-search Institute, San Diego, California; University of Washington
2010
Engineered Stem Cells
Transforming adult cells into stem cells called iPS cells
Health and Biotechnology
Cellular Dynamics, Madison, Wisconsin Others working on engi-neered stem cells: Fate Therapeutics, San Diego, CA; iPierian, South San Francisco, CA.; Children's Hospital Boston, Boston, MA; Kyoto University, Kyoto, Japan
Light-Trapping Photovolta-ics
Depositing nanoparticles made of silver on thin-film photovoltaic cells increase the cells' efficien-cy, which could make solar power more competi-tive
Thin-film photovoltaic cells
Energy
Australian National University,Canberra; Others working on light-trapping photovoltaics: Caltech, Pasadena, CA; University of New South Wales, Australia; FOM-Institute for Atomic and Molecular Physics, Amsterdam
Green Concrete
Reduce emissions in cement production by replacing limestone (a carbon rich mineral) with magnesium compounds
Magnesium com-pounds
Environment
Novacem, London; Others working on green concrete: MIT;. Geopolymer Institute, Los Gatos, CA; Saint-Quentin, France
Implantable Electronics
Implantable optical and medical devices with silk as the basis for the devices makes them biode-gradable
Films of silk fibroin
Health and Biotechnology
Tufts University, Medford/Somerville, MA; Others working on implantable electronics: University of Illinois Urbana-Champaign; Stanford University, CA

53
2009
$100 Genome
Sequence a human genome for just $100 using a nanofluidic chip
Health and Biotechnology
BioNanomatrix, San Diego, California
Racetrack Memory
Using nanowires to create an ultradense memory chip
Magnetic nanowires ICT IBM,Palo Alto, California
Nanopiezo-electronics
Piezoelectric nanowires could power implantable medical devices and serve as tiny sensors
Crystalline materials Health and Biotechnology
Georgia Tech, Atlanta
2008
Graphene Transistors
Transistors based on graphene, a carbon materi-al one atom thick, could have extraordinary electronic properties
Graphene ICT Georgia Tech, Atlanta
NanoRadio A nanoscale radio in which the key circuitry consists of a single carbon nanotube
Graphene ICT University of California, Berkeley
Atomic Magnetom-eters
Sensors called atomic magnetometers, the size of grain of rice, might someday be incorporated into everything from portable MRI machines to faster and cheaper detectors for unexploded bombs
High-temperature superconducting mate-rials
Health and Biotechnology, Security
U.S. National Institute of Standards and Technology, Gaithersburg, Maryland
2007
Nanocharg-ing Solar
Quantum-dots can hopefully enable the produc-tion of more efficient and less expensive solar cells, finally making solar power competitive with other sources of electricity
Semiconductors Energy, Environment
National Renewable Energy Laboratory, Golden, Colorado
Invisible Revolution
Structures of metamaterials that can manipulate electromagnetic radiation, including light, in ways not readily observed in nature
Artificially structured metamaterials
ICT, Energy
Duke University, Durham, North Carolina
Nanoheal-ing
Tiny fibres will save lives by stopping bleeding and aiding recovery from brain injury
Novel material made of nanoscale protein fragments (peptine)
Health and Biotechnology
MIT, Cambridge, Massachusetts
2006 Stretchable Silicon
Reinventing the way we use electronics by using stretchable silicon
Inorganic semiconduc-tors, single-crystal silicon
Health and Biotechnology
University of Illinois; Others working on stretchable silicon: Uni-versity of Cambridge, England; University of Tokyo; Princeton University, New Jersey
2005
Silicon Photonics
Making the material of computer chips emit light could speed data flow
Silicon photonics ICT University of California; Others working on silicon photonics: Intel's Photonics Technology Lab; University of Rochester, NewYork
Quantum Wires
Wires spun from carbon nanotubes could carry electricity farther and more efficiently
Carbon nanotubes Energy Rice University, Houston, Texas
2004 Nanowires Use of nanowires in electronics ICT University of California, Berkeley; Harvard University, Cambridge,

54
MA
2003
Injectable Tissue Engineering
Inject joints with specially designed mixtures of polymers, cells, and growth stimulators that solidify and form healthy tissue
Polymers Health and Biotechnology
Johns Hopkins University, Baltimore; Others working on injectable tissue engineering: Harvard Medical School, cartilage; Genzyme, cartilage; Rice U., bone and cardiovascular tissue; U. Michigan, bone and cartilage
Nano Solar Cells
Use nanotechnology to produce a photovoltaic material that can be spread like plastic wrap or paint, it offers the promise of cheap production costs that can make solar power competitive
Nanorod polymer composite
Energy, Environment
University of California, Berkeley; Others working on nano solar cells: U. Cambridge; Swiss Federal Institute of Technology, nano-crystalline dye-sensitized solar cells; U. California Santa Barbara; Johannes Kepler University, Linz, Austria
2001
Flexible Transistors
Flexible and cost-effective electronics for ubiqui-tous computing
Polymer semiconduc-tors
ICT IBM; Others working on flexible transistors: Lucent Technologies' Bell Labs; University of Cambridge, England; Pennsylvania State University; MIT
Micropho-tonics
Photonic crystals are on the cutting edge of microphotonics: technologies for directing light on a microscopic scale that will make a major impact on telecommunications
Photonic crystal ICT MIT; Others working on microphotonics: University of California, Los Angeles; Kyoto University, Japan; Caltech, Pasadena, CA; Nanovation Technologies, Miami, FL; Clarendon Photonics, Boston, MA
Source: The overview is based on ‘Technology Review’ (MIT), a yearly assessment of the emerging technologies that have a potential to produce the greatest impact. www.technologyreview.com Note: Year 2002 is missing from the list— no material-related applications listed. Massachusetts Institute of Technology, Cambridge, Massachusetts.

55
Chapter 6. Quantitative Value Added Materi-als market overview
Desk research results regarding identified markets for VAMs and their possible appli-cations are presented in the table in Annex 1. Charts below present an overview of results, and are designed to demonstrate the most promising areas and industries. Current foresights available on the market do not bring much information with regard to the long future. Far-reaching market foresights only extend to 2020.
A case study showing the uncertainty sur-rounding market foresights — how shifts in materials apply to production — is set out below, presenting the development of the smart phones market in recent years. Prior to this massive boom no market forecast managed to predict such a forceful devel-opment. This shows the inherent difficulty in such forecasting: it is impossible to take into account the specific and unknown factors that will develop in the future. Therefore forecasts can only be a tool in the work towards defining future markets.
This project was not designed in such a way to produce longer term foresights in full detail. Nevertheless it is believed that summary of foresights presented below may be used as a valid policy-making tool in the future, with a longer time perspec-tive towards 2030 and even 2050.
The projection of precise VAMs market share in the sector on the basis of statisti-cal methods based on primary data from producers or secondary data will not be very credible. The model would have too many uncertainties. The factors to be tak-en into consideration with such analysis are: general market trends (e.g. growing energy consumption, demand growth,
ageing societies), product life cycle (most of VAMs have started their life cycle per definition), precise information about ma-terials share in final product value (inter-viewed experts had different views here), and finally an unambiguous decision whether the material is to be regarded as VAM or not (if so, to be included in the calculation and projection). Such a model shall be then multiplied for all possible new materials identified on the market. One can see the complexity for measuring mar-ket size with such bottom up approach.
The model described above is of course theoretically possible, but — as shown with the smartphones case — largely inac-curate and misleading even with very much developed and known markets, and even with three years’ perspective. There-fore the general approach for this analysis is to identify existing market estimates and look for patterns within the data. The col-lected secondary data are presented in Annex 1, while below we present results of clustering of identified market estimates for each of the sectors.
It is clear that existing market estimates have in almost all cases two dimensions: one measurement of the market in the recent past and one in the near future. This finding suggested ways to cluster the find-ings in order to present a consistent over-view of future market growths and sizes.
When analysing these data one must take into consideration the general rule of fore-sight science, which says that one shall not make projections for a future that is longer

56
in time perspective than the existing his-torical data. The secondary market infor-mation gathered for VAMs gives market sizes only several years back and projects up to around 2016 to 2020. This is the
maximum time frame for prognosis cur-rently available. All other statistical ‘tricks’ are of course possible, but would not be reliable.
Smartphones; A case of sudden market change and diverse foresights
Smartphones are defined as high-end mobile phones that combine the functions of a personal digital assistant and a mobile phone. Today they also typically serve as porta-ble media players and camera phones with touchscreens, web browsers, GPS naviga-tion, Wi-Fi and mobile broadband access.
Market size
The smartphones’ share of the mobile phone market has shown an impressing growth over the last few years. As Gartner
1 has showed, smartphone sales in the US doubled
from the third quarter in 2009 to the third quarter in 2010. The global smartphone shipments grew by 74 per cent in the same time period. The total global mobile device sale to end users in 2010 totaled 1,6 billion units, an increase of close to 32 per cent from 2009. This means that the smartphone market is growing at double the rate compared to the overall mobile phone market. This is evident in Gartner’s report on market shares for smartphones; smartphones accounted for 19 per cent of the total mobile communications device sales in 2010, up from 11 per cent in the fourth quarter of 2007, and 12 per cent in 2008.
Materials for smartphones
Smartphones are interesting in the context of this VAMs discussion because of the highly specialized materials used for production, especially such components as screen, battery and processor. An interesting fact is that producers are going away from plastic applications. An example here is the iPhone. In the previous generations of iPhones, plastic, glass and aluminum were major elements, however, in the latest editions, plastic is no longer a leading case component.
The growth in the smartphone market means an increase in demand for electronic chemicals and polymers as well as other advanced materials. A key problem is that several of the materials needed in the smartphones are either extremely rare, like indium, a key component in the production of touchscreens, or are almost exclusively mined in China. This means that there are uncertainties related to the supply of such materials, as well as their price in the future. These uncertainties increase the need to find new materials that can replace rare earth materials.

57
Sources for the case study 47
47 Sources: http://www.mobilephonedevelopment.com/archives/1149 http://www.bgr.com/2011/03/10/berg-smartphone-shipments-grew-74-in-2010/ http://www.gartner.com/it/page.jsp?id=1543014 http://www.icis.com/Articles/2011/03/07/9439919/smartphones-and-tablets-fuel-huge-growth-for-electronic.html http://www.icis.com/Articles/2011/03/07/9439919/smartphones-and-tablets-fuel-huge-growth-for-electronic.html http://www.azonano.com/news.aspx?newsID=20360 http://www.gartner.com/it/page.jsp?id=1550814 http://www.bgr.com/2011/03/10/berg-smartphone-shipments-grew-74-in-2010/ http://gadgets.tmcnet.com/topics/gadgets/articles/137893-in-stat-expects-850-million-smartphones-shipped-2015.htm
Indium is one example where speculations have been made that its reserves will be exhausted by 2020. This means that within the next decade there is an acute need to find a replacement for this material. According to Gartner’s analyst Dean Freeman, the most likely replacement for ITO will be carbon nanotubes, or CNTs. Carbon nanotubes (also known as buckytubes) are allotropes of carbon. These cylindrical carbon mole-cules have novel properties which make them potentially useful in many applications in electronics, optics, and other fields of materials science, as well as potential uses in architectural fields. But that technology isn't quite ready yet.
Projections
The second factor that increases the demand for materials needed in smartphones is the expected growth in the market. As shown above, the market has already demon-strated high growth levels, and that growth is expected to continue in the future. As there are high levels of uncertainty linked to growth projections, there exist many different estimates on future market size. Gartner has predicted that in 2011 US con-sumers are more likely to purchase a smartphone than any other consumer device. Berg Insight anticipates that shipments of smartphones will hit 1.2 billion units in 2015, at which time they have estimated that there will be approximately 2.8 billion smartphone users worldwide. In-stat, on the other hand, has a less optimistic estimate for the smartphone market growth, arguing that 850 million smartphones will be shipped by 2015.

58
6.1 VAMs market size and devel-opment
Not many studies so far tried responding to the general question of market size for advanced materials.
Table 4: Total market sizes for advanced and new materials
1980 1990 2000 2008 2010 2015 2020 2030
Market for new materials according to Moskowitz study (billion USD)
2 17,5 51,7 102,7 177 316,7
Market for advanced materials according to Expert Group on KETs (billion euro)
100 150
Source: combined sources.
Since the Value Added Materials are par-ticularly new in terms of concept, second-ary data of current market sizes are taken from two sources: the study by Sanford Moskowitz
48 and the Final Report from
High level Expert Group on Key Enabling Technologies
49. These two studies present
comparable estimates of total market sizes. This information, together with trends identified from the interviews, draws a picture of potential market devel-opment for VAMS in the future. The data series used for the construction of the model feed are from trends drafted in the above mentioned studies. The size of mar-kets for VAMs after the 2030 was designed on the basis of two different conditions identified in the interviews with materials experts and investors.
Linear growth of materials applications in the industries with already long-lasting research in the area (automo-tive, ICT and health). These were indi-cated in the interviews as sectors with
48 Moskowitz, Sanford L. Advanced Materials Revolution Technology and Economic Growth in the Age of Globalization. Wiley & Sons, Inc. 2009. 49 High Level Group on Key Enabling Technologies. ‘Report by the working group on advanced materials technologies’. European Commission, June 2011.
large investment density in the last decades.
Non-linear growth trend of VAM mar-kets in energy and environment sec-tors, as well as the emergence of new materials used in multiple applications (cross sectoral).
This approach enabled us to calculate the share of VAMs in all products and markets where they are currently used. We com-pared the data presented in table 3 (above) with identified market shares in all sectors (presented in Annex 1). It also enabled calculations of proportional mar-ket allocations of Value Added Materials per sector and trend prognosis in the fu-ture.
The result of this analysis confirms the large potential for development of market applications of Value Added Materials. The market has the potential to grow more than 10 times over the next 40 years. This potential was underlined by all experts interviewed. Therefore the results of this analysis gives a reliable picture of how the markets for VAMs might develop in the future.

59
Table 5: Size of identified markets where VAMs are applied50
2008 2015 2020 2030 2050
Energy 83 230 335 640 2336
Transport 112 210 280 420 700
Environment 51 286 615 850 1501 4683
Health 314 517 662 952 1532
ICT 344 624 824 1224 2024
Others / Cross-cutting52 42 217 342 731 3335
Total markets value 1181 2413 3293 5468 14610
VAMs share in sector applications (%) 8,6 6,2 5,7 5,8 7,5
Source: Oxford Research AS. Unit: billion euro.
Table 6: VAMs market share by sector
2008 2015 2020 2030 2050
Energy 7,1 14,3 18,9 37,0 175,7
Transport 9,6 13,1 15,8 24,3 52,6
Environment 24,6 38,2 48,0 86,8 352,2
Health 27,0 32,1 37,4 55,0 115,2
ICT 29,6 38,8 46,6 70,7 152,2
Others / Cross-cutting 3,6 13,5 19,3 42,2 250,8
Total projected value of identified VAMs markets 101,7 150,0 186,1 316,0 1098,6
Source: Oxford Research AS. Unit: billion euro.
The change in VAMs’ sector presence resulting from the presented model is depicted in Figure 8.Note that the potential for VAMs’ market growth is much higher than average European GDP growth estimates.
50 Table 4 is showing only aggregated value of markets relevant for materials applications and not the value of entire sectors. See details in Annex 1. 51 The environment sector size is largely influenced by ‘energy efficient technologies for environment protection’ being currently around 40 % of the total value of the sector, and therefore its size shall be very much considered together with the energy sector. 52 The category ‘Others / Cross-cutting’ is used to group all those materials that either:
cannot be easily allocated to one of the industries analysed in this study;
have properties that enable them to be used in multiple industries;
cannot be allocated to any of the sectors at current stage because their market implementation is a subject for current research;
are used in industries other than those considered in this study ( e.g. food, construction, chemical etc.).

60
Figure 8: Changes in VAMs’ sector presence and market growth
energy 7 %
transport 9 %
environ-ment 24%
health 27 %
ICT 29 %
others 4 %
2008 total value
100 billion euro
energy 12 %
transport 8 %
environ-ment 28 % health
17 %
ICT 22 %
others 13 %
2030 total value
316 billion euro
energy 10 % transport
9 %
environ-ment 26 % health
20 %
ICT 25 %
others 10 %
2020 total value
186 billion euro
energy 16 %
transport 5 %
environ-ment 32 % health
10 %
ICT 14 %
others 23 %
2050 total value
1098 billion euro

61
Source: United States Energy Information Administration,
Design: Oxford Research AS. Unit: quadrillions BTU.
More detailed information regarding the situation in each of the sectors covered by this study is presented in the sections below.
6.2 Energy sector
The existing conservative market esti-mates
53 from the United States Energy
Information Administration reveal that the energy sector in terms of consumption (measured in quadrillions BTU
54) will de-
velop steadily through the years. USEIA’s market estimates also note that the con-sumption structure is not expected to change radically, based on the scenario of business-as-usual and no radical break-throughs. Following this scenario ‘black energy’ produced from oil and coal will remain the main sources of energy for modern humanity. On the global scale the role of renewable energy is predicted to have negligible influence the overall mar-ket structure.
Figure 9: Global energy sector growth and structure 2007-2035
The structure of the energy sector is pre-dicted to remain almost unchanged in
53 Global energy sector estimates are in most cases presented in quadrillions BTU (British Thermal Unit). Different energy sources have different prices, sometimes radically changing over time, and different unit effectiveness. It is common practice to provide market estimates in comparable energy units. 54 Different types of energy are measured by different physical units (barrels or gallons for petroleum, cubic feet for natural gas, tons for coal, kilowatthours for electricity). To compare different fuels, one needs to convert the measurements to the same units. BTU a measure of heat energy, is the most commonly used unit for compar-ing fuels and therefore covers most of the market.
terms of consumption and sources struc-ture.
Figure 10: Energy sector structure 2015
Figure 11: Energy sector structure 2035
A contradictory picture appears when simultaneously considering the USEIA data, the European initiatives meant to address future energy challenges, and the infor-
Source: United States Energy Information Administration. Design: Oxford Research AS. Unit: quadrillions BTU.
Source: United States Energy Information Administration. Design: Oxford Research AS. Unit:- quadrillions BTU.

62
mation gathered within this study. Rein-venting our energy system on a low-carbon model is one of the critical challenges of the 21
st Century. Today in the EU, our pri-
mary energy supply is 80 per cent depend-ent on fossil fuels. But the European Com-mission Strategic Energy Plan, the market estimates expressed by our interviewed experts and investors, and the data from analysed secondary sources all indicate that a share of renewable energy sources in the years to come will rapidly influence the global market structure, especially in developed countries. The perspective that renewables will have more influence than credited by the USEIA is in a way confirmed with available data from Market-Research.com — a company specializing in long term industry foresights, where the market size is provided not in terms of consumption, but total value. In 2009 the global energy market was estimated to be on the level of 4,235 trillion euros.
55 In
2014 the market size is to reach almost twice that number with 7,875 trillion eu-ros. Detailed market estimates for renew-able energies presented in Annex 1 also indicate much faster growth rates of re-newables.
With linear data imputation the overall energy market growth is shown in Figure 12 (below). Continuation of current trends will lead to a market of over 20 trillion euros in 2030. Is this possible? None of the interviewed experts was willing to confirm or deny; the perspective is simply too long and the uncertainties too many.
55 6,05 trillion USD, exchange rate used 1 USD=0,7 EUR; being 120 days average, from http://www.x-rates.com/ for Sept 26, 2011.
Figure 12: Energy sector size 2015
The average CAGR56
for all identified ener-gy sector applications of VAMs from 2009 to 2015 is 19 per cent. Highest growths are foresighted within the following catego-ries:
stationary fuel cells: CAGR 55% be-tween 2010-2016;
supercapacitors for energy industry: CAGR 49 % between 2010-2015;
biogas plant equipment: CAGR 30 % between 2010-2014;
nanoscale materials used in energy, catalytic and structural applications with growth rate of 29 % currently;
inks and catalysts with growth rate of 28% towards 2015.
The figures above confirm the thesis for-mulated by experts during conducted in-terviews. The biggest market size and mar-ket growth in nominal terms is foreseen in the area of energy storage and energy production, with a considerable share in photovoltaics and materials for large ener-gy systems and storage.
56 CAGR is the year-over-year growth rate of an investment over a specified period of time. CAGR is not an accounting term, but is widely used in growth industries or to compare the growth rates of two investments. CAGR dampens the effect of volatility of periodic returns that can render arithmetic means irrelevant.
Source: MarketResearch.com data for 2009 and 2014. Design and trend: Oxford Research AS. Unit: trillion euro.
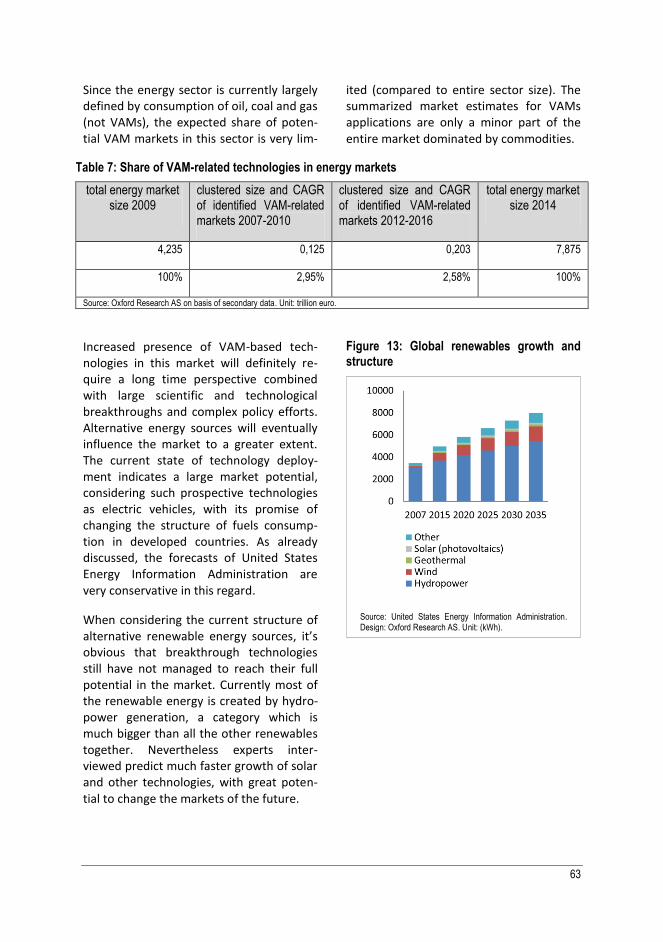
63
Since the energy sector is currently largely defined by consumption of oil, coal and gas (not VAMs), the expected share of poten-tial VAM markets in this sector is very lim-
ited (compared to entire sector size). The summarized market estimates for VAMs applications are only a minor part of the entire market dominated by commodities.
Table 7: Share of VAM-related technologies in energy markets
total energy market size 2009
clustered size and CAGR of identified VAM-related markets 2007-2010
clustered size and CAGR of identified VAM-related markets 2012-2016
total energy market size 2014
4,235 0,125 0,203 7,875
100% 2,95% 2,58% 100%
Source: Oxford Research AS on basis of secondary data. Unit: trillion euro.
Increased presence of VAM-based tech-nologies in this market will definitely re-quire a long time perspective combined with large scientific and technological breakthroughs and complex policy efforts. Alternative energy sources will eventually influence the market to a greater extent. The current state of technology deploy-ment indicates a large market potential, considering such prospective technologies as electric vehicles, with its promise of changing the structure of fuels consump-tion in developed countries. As already discussed, the forecasts of United States Energy Information Administration are very conservative in this regard.
When considering the current structure of alternative renewable energy sources, it’s obvious that breakthrough technologies still have not managed to reach their full potential in the market. Currently most of the renewable energy is created by hydro-power generation, a category which is much bigger than all the other renewables together. Nevertheless experts inter-viewed predict much faster growth of solar and other technologies, with great poten-tial to change the markets of the future.
Figure 13: Global renewables growth and structure
Source: United States Energy Information Administration. Design: Oxford Research AS. Unit: (kWh).

64
Source: Oxford Research AS on basis of secondary data. Unit: trillion euro.
6.3 Transport sector
The global transport sector is estimated to reach 3,12 trillion euros in 2012. This par-ticular sector is mostly composed of ser-vices. Transport of goods and persons are leading pillars for all economies and also importantly influence global environmen-tal challenges.
Figure 14: Share of VAM-related technolo-gies in transport markets
The use of advanced materials in this part of industry is mostly oriented to produc-tion of transport means (cars, airplanes, ships, space ships and so on) as well as roads and railways. Another large applica-tion area for Value Added Materials is transport efficiency (electronic systems) as well as transport security. Finally there is always a place for materials that will sub-stitute or create an alternative to oil, coal and gas— the market for these materials is depicted in the section (above) about the energy sector.
The two most likely areas in transportation for Value Added Materials are electric vehicles (EV) and ultra-light and highly durable materials. Please note that elec-tronic applications of materials (used in
transport and other industries) are dis-cussed later on within the ICT sector.
The secondary data regarding market sizes reveals that the Value Added Materials have still have a high potential within the market, especially in the context of energy efficiency and green transport. The share of identified VAM markets in the global scene will change from 3,5 per cent to 6,2 per cent compared to sector market size in 2012.
The average CAGR calculated from identi-fied materials applications within transport sector is on the level of 15 per cent. For the detailed market growths again the biggest expected CAGR is allocated to su-percapacitors for the transportation sec-tor, with CAGR equals 35 per cent and later on to the market for electric vehicles with CAGR equals 20 per cent.
The comparison of market sizes and growth is presented through the figures in Annex 1.
The biggest share of all identified markets for transport applications of VAMs is still the area of lightweight materials. This is the place where materials may still be introduced to the market. This field is also very much concerned by the time-to-

65
market issue. Interviews with experts indi-cated that the transportation sector is now starting to use materials invented some 15 to 20 years ago. Obviously there is space for improvement regarding time-to-market indicators. This is also an area where inno-vative new materials might be of particular interest to the industry.
The European Green Car Initiative57
indi-cates several challenges in the area of green transport development. One of the most important is energy storage systems, which still require intensive research. En-ergy storage is suggested as a crosscutting research direction for all current Frame-work Programme Priorities. This trend is confirmed by our interviews with materials experts and investment specialists.
57 European Green Cars Initiative PPP Multi-annual roadmap and long-term strategy; November 2010, www.green-cars-initiative.eu
The problems associated with energy stor-age will hamper development of electric vehicle (EV) market for the coming years. Still the analysed roadmap indicates that by 2020 it is possible that Europe will start mass production of 5 million EV/PHEV (plug-in hybrid electric) vehicles.
Trends related to energy storage (including batteries for EV) are therefore reflected in our foresight for market growth within the energy sector (above).

66
Source: Oxford Research AS on basis of secondary data. Unit: billion euros.
6.4 Environment sector
The environmental industry includes all
revenue-generating activities associated
with:
air pollution control;
water and waste water treatment;
waste management (including recov-ery and recycling);
contaminated land remediation;
environmental monitoring and in-strumentation;
noise and vibration control;
marine pollution control;
clean industrial processes.
Within these fields there is a place for Value Added Materials to play a crucial role in addressing the eco-challenges of our times.
Figure 15: Share of VAM-related technolo-gies in environmental markets
The global environmental market size fol-lowing some less optimistic scenarios is not growing as fast as would be expected — the past estimates indicate only 2 per cent
growth from 461,3 billion euro to 490 billion in 2010.
58
A more detailed look at existing market estimates from other sources indicates that these numbers are somehow too narrow and pessimistic. Analysed esti-mates regarding sub-sectors where a num-ber of applications are to appear for VAMs are much more optimistic — the average sector growth calculated on the basis of gathered data is at the level of 17 per cent CAGR. The market for water and water treatment was estimated to have reached 300 billion euro in 2010.
59
An overview of all other markets for VAMs identified within this sector indicates that only selected markets in total will be high-er than the initial current estimate for the entire sector already around year 2016 (see Annex 1 for details).
58 Office of Energy and Environmental, International Trade Admin-istration, U.S. Department of Commerce. 59 According to the ‘European Technology Platform for Water, 2010 Strategic Research Agenda’.

67
The most promising technology on the market within this sector is definitely car-bon capture technologies, where the ex-pected CAGR will be on the level of 63 per cent between 2010 and 2012. The total market size for this kind of technology is to rise from 62 to over 165 billion in just two years. Another very prospective market for Value Added Materials is ‘nanotechnolo-gies for environmental applications’, where the CAGR will reach 61 per cent. This rela-tively small market will grow from 1,4 billion in 2009 to 15,26 billion in 2014.
The biggest share in the group of identified technologies is the energy efficient tech-nologies, expected to reach 218 billion euro with CAGR of 9 per cent (much below average for the sector). Second biggest part of the market will be allocated to the intensively growing industry related to carbon capture technologies, mentioned above.

68
Source: Oxford Research AS on basis of secondary data. Unit: trillion euro.
6.5 Health sector
The global health sector is to reach almost 4 trillion euro this year. The foresights made by Plunkett Research Ltd
60., indicat-
ed the market was at the level of 3.85 trillion in 2010. The sector growth between 2006 and 2010 was at the level of 5 per cent CAGR.
Of course the biggest share in this sector is dedicated to services. In the context of this study, the most important market for ad-vanced Value Added Materials is located within drug manufacturing. This part of the market reached 360 billion Euros in 2010 globally.
61
Figure 16: Share of VAM-related technolo-gies in health markets
The drug market is a separate subject, due to specifications of the European Commis-sion research programmes; so it will not be considered in further analysis.
Other existing markets for Value Added Materials are nevertheless very much in-fluential.
60 Plunkett's Health Care Industry Almanac, 2011 edition 61 Plunkett Research®, Ltd.201, http://plunkettresearch.com/health%20care%20medical%20market%20research/industry%20and%20business%20data
The non-drug VAMs’ share in the market will grow within the years to come with average CAGR of 11 per cent.
The data available from the document ‘Roadmaps in nanomedicine: Towards 2020’
62 indicate even much more intensive
growth of the sector, with average growth of 30 per cent CAGR between 2015 and 2025 (see details in Annex 1).
In order to make this study comparative between sectors, this analysis of non-drug VAMs takes into consideration market estimates published by BCC Research
63.
The identified application areas where VAMs will play important role constitutes a growing part of the health sector in the future.
The fastest growing market is definitely connected with RNAi
64 drug delivery tech-
nologies, projected to grow from 4,9 billion euro in 2010 to the level of 16,87 billion euro in 2015. The CAGR in this period will be on the level of 28 per cent. The biggest share of the market within selected tech-nologies will be allocated to biotechnolo-gies used in medical applications. Biotech
62 ‘Roadmaps in nanomedicine: Towards 2020’, Joint European Commission & ETP Nanomedicine Expert Report, 2009. 63 http://www.bccresearch.com 64 RNA interference (RNAi) is a highly evolutionarily conserved mechanism of gene regulation. See http://www.rnaiweb.com

69
will have a 15 per cent growth rate, start-ing from 77 billion in 2010 to 156 billion euro in 2015. All market sizes are present-ed in detail in Annex 1.
6.6 Information and Communica-tion Technologies (ICT) sector
The ICT sector is expected to grow an av-erage CAGR of 5 per cent between 2007 and 2013.
Details regarding sector split are presented with Figure 17, below.
Figure 17: ICT sector split and growth
The ICT sector suffered a downturn in 2009 directly connected with the global financial crisis. Since that time sector growth has stabilized with the highest expected growth in communications (CAGR 6 per cent) and hardware and services (with expected 5 per cent CAGR). The potential markets for materials are mostly in hard-ware, and to a much smaller extent in communications infrastructure.
The share of identified VAM-related mar-kets in the entire sector is expected to grow substantially in the years to come. This comparative data are based on two sources (Digital Planet for total market estimates and BCC Research for selected markets summary). Therefore foresights with data from BCC Research have in this case higher growth ratio than Digital Plan-et’s estimates for the entire market, result-ing in numbers that first seem to show a growth of market share for materials mar-kets from 14,9per cent to 40,8 per cent.
This situation will not happen in reality, as the market in general is mostly composed of services and software. But such indica-tors may legitimately lead to the conclu-sion that materials market share will grow extremely well in the years to come.
Information regarding the share of detailed materials markets in the ICT sector is pre-sented in Annex 1.
Source: Digital Planet 2010. Design: Oxford Research AS. Unit: trillion euro.

70
Table 8: Share of VAM-related technologies in ICT markets
average ICT market size 2007-2010
clustered size and CAGR of identified VAM-related markets 2007-2010
clustered size and CAGR of identified VAM-related markets 2012-2016
average ICT market size 2011-2013
2569 384,5 1247,3 3056,6
100% 14,9% 40,8%65 100%
Source: Oxford Research AS on basis of secondary data. Unit : billion euro.
6.7 Other market estimates
Since many of new and advanced materials are cross-cutting above listed sectors, Figure 7 in Annex 1 presents information regarding their markets without sector allocation.
65 Without superconducting electrical equipment market, the total share of VAM markets will be around 325 bln euro and 20,44% of the entire ICT market.

71
Chapter 7. Potential future technological challenges
Relevant industry roadmaps, foresights and strategic papers reveal a number of current technological challenges and issues in the development of future materials.
This chapter presents an overview of the identified challenges to bringing VAMs into common use. This discussion again follows the delineation of Grand Challenges used by the European Commission for planning future research programmes.
Several materials experts within this pro-ject voiced an important and widespread opinion: In order to tackle the biggest soci-etal problems, we ‘just’ have to enable the use of technologies already available to-day. The thinking is that simply by adjust-ing current and future research pro-grammes’ priorities we can easily meet the Grand Challenges within the time frame of 2020. However, this is not a reasonable expectation due to the time-to-market factor.
Every breakthrough invented within the next five years will be visible on the market only after 2025 (at earliest), and probably after 2030 if it follows the usual time-to-market pattern. In this context only large scale implementation of already existing technologies may reasonably influence the nearest future and catalyse expected glob-al changes.
7.1 Challenges within health, demographic change and wellbeing
Optical sensors in health
Optical sensors are well suited for systems whose purpose is not to re-store an image to a final user but to analyse the content of a visual scene and make a decision. The main re-quirements for such a sensor are a wide intra-scene dynamic range and a data representation capability that fa-cilitates processing. Currently used standard image sensors have a too narrow dynamic range to cope with the tremendous change of illumina-tion occurring in natural visual scenes. The current state of the art is to per-form the logarithmic compression in the analogue domain, which leads to a high pixel-to-pixel fixed pattern noise that makes them unusable for com-mercial applications. Future genera-tions of visual front-ends, developed for robotic, medical or security appli-cations, will have to resolve this issue.
Smart health-related systems
Progress towards steadily shrinking structures will lead to situations where properties of devices can be defined by the presence or absence of a hand-ful of doping atoms. Neither quality assurance, principally in mass produc-tion, nor manufacturing based on sim-ulation seems to be possible in these circumstances. Other approaches to system design and manufacturing will have to be investigated.
There is a need for low cost and high performance materials in this sector.
The autonomy of smart systems de-pends upon their ability to scavenge energy from their environment, to

72
store it and to make efficient use of it. The limited life-time of batteries for implantable devices, e.g. pacemakers or implanted drug delivery systems, often necessitates surgical replace-ments after a comparatively short time (in relation to the scheduled sys-tem life time). Direct glucose fuel cells could be used as a sustainable power supply for long term implants, con-verting the chemical energy of the body’s glucose into electrical energy — the energy supply of smart implants is a challenge as well as an opportunity for smart systems integration. Prob-lems of implantable fuel cells are man-ifold. How to achieve fuel separation, because the body fluids contain fuel cell reactants, glucose and oxygen, simultaneously? How to guarantee a maximum of operation time? How to achieve exceptional system reliability?
Vision systems: new sensor technolo-gies still need to be developed. For ex-ample, terahertz imaging is quite new and the terahertz detectors that al-ready exist require ultra-cooling and are still monolithic. For multimedia and domestic applications, cost and compactness are the key drivers.
Medical Ultrasound: The ability to drive 100 - 200 volts at a frequency of several megahertz will improve the speed and performance of ultrasound scanners. The ability to process high-voltage signals using high-performance analogue integrated cir-cuits with high linearity and high fre-quency stability is a key requirement for improving ultrasound image quali-ty.
Reliability: In principle two strategies can be approached to reach the need-ed reliability, being the avoidance of defects (zero-defect), and the identifi-cation and substitution of defective
parts during operation (redundancy). Zero-defect requires a complete knowledge of ageing mechanisms within the circuits, enabling the mod-elling and simulation of the reliability gradient during operational life. Re-dundancy requires methods of esti-mating the number of expected fail-ures, identifying defective parts and paths, and substituting them with new ones. For both approaches, however, today’s tedious and expensive experi-mental reliability tests on processed silicon must, as far as possible, be sub-stituted by intensive simulation meth-ods.
Electronic systems for health related mobile applications have to withstand very harsh environments, including high temperatures, humidity, vibra-tion, fluid contamination and electro-magnetic compatibility. While these problems have largely been solved for conventional integrated circuit (IC) style packaged devices, a whole new set of challenges will have to be faced when these packages also contain in-tegrated sensors, actuators, mecha-tronics or opto-electronic functions.
Biosensors
There is a need to ensure the bio-compatibility of the materials both for in-vitro and in-vivo applications.
Ultra-low power consumption is re-quired of wireless connected portable or implantable systems. These must stay within the maximum thermal loads that implanted devices can im-pose on the human body.
Developing implants in bio-compatible packages will push miniaturisation to

73
the limits, while at the same time re-quiring the integration of many differ-ent types of device — for example, bio-sensors, nanoscale MEMS (microe-lectromechanical systems) devices, optical components, energy scaveng-ing systems and RF (radiofrequency) interfaces. Many of these highly com-plex heterogeneous systems will also need to achieve life-support system reliability.
Micro- and nanoelectronic systems for everyday use
This is a challenging research field that may boost or hinder technological de-velopments. Issues include the devel-opment of structural in-line metrology (accurate 3D measurement of differ-ent patterns, overlays etc.), fast and sensitive defect detection and classifi-cation, structural off-line characteriza-tion (including morphological, physical and chemical analysis of 3D nm sized structures made of complex material stacks), and methods of assessing the sources of process variability.
Challenges arise from the societal need to include sensors and actuators to nano- or microelectronic systems.
Electronic imaging: Currently, pixel sizes for these applications can be as small as 1.4 x 1.4 micron. Lowering the pixel size is mainly driven by cost at the device and system levels. Howev-er, it is becoming a real challenge to detect photons while decreasing pixel size. For non-visible imaging, different technologies are needed for different wavelength ranges. In addition to per-formance improvements that are common to all imagers, such as better sensitivity, dynamic range, endurance, lower noise and pixel-to-pixel cross-talk, there is a definite need for multi-
spectral analysis using a single sensor technology.
The success of MtM (More than Moore
66) will depend on a profound
understanding of the properties and behaviour of materials and their inter-faces under manufacturing, qualifica-tion testing and use conditions, and on the ability to tailor the material design for the requirements of specific appli-cations. This issue is already acute for MtM technologies, where multi-scale size effects and multi-material com-patibility, stability and reliability will be the key to success. Among the many challenges, characterisation and modelling of materials and their inter-face behaviour need more attention, especially for multi-scale, multiphysics and time dependent situations.
Heterogeneous integration: Intercon-nection, packaging and assembly are major bottlenecks for future nanoelec-tronics technology.
Equipment and materials: Historically, (poly)-silicon, silicon dioxide, silicon ni-tride and aluminium have been the materials of choice for semiconductor devices. In the last decade, however, it has proven impossible to further ex-tend dimensional scaling with this set of materials alone. A multitude of new high-performance materials with spe-cially engineered electrical, mechani-cal and chemical properties must be introduced to extend Moore's Law and allow fabrication of scaled devices that operate at higher speed and/or lower power. A huge material science effort is required to deliver the necessary properties, involving the selection,
66 Moore’s Law: The number of transistors on a chip doubles every 18 to 24 months

74
demonstration and integration of ap-propriate chemistries.
Sensors and actuators
The integration aspects (monolith-ic/hybrid) of sensors and actuators on-to CMOS platforms will be an im-portant challenge and focus for the years to come. This will include the development of sensors and actuators based on materials other than silicon (for example, III/V or plastic materials) that offer new functionality or lower cost, as well as arrays of sensors and actuators of the same or different functionality. In addition, new sensor types such as nanowires and carbon nanotubes with potential for improved sensitivity need to be investigated. Fabrication processes have to be de-veloped to integrate such new sensing elements into devices, systems and applications.
The major challenge in the area of sensors and actuators is the support of huge amounts of input and output da-ta envisaged in the application con-texts with minimal power require-ments and fail-safe operation.
The technical challenges for smart systems and environments may be summarised as how to create a con-sistent architecture for smart envi-ronments. This is characterised by three equally important trends: multi-vendor interoperability, dynamic de-vice configurations and extreme scala-bility.
Smart nano- and bio-materials for health
Need to assess surface and bulk physi-co-chemical properties of engineered nanomaterials.
Need to include sensitive or suscepti-ble populations in assessing risk.
Need to determine the most appropri-ate dose (a nanomaterial's mass may not be the most accurate way to eval-uate health effects).
Need to understand human health impacts of engineered nanomaterials: knowledge of molecular and cellular pathways, kinetics of absorption, dis-tribution, metabolism and excretion critical to understand potential health hazards.
Integration
Module integration: Future board and substrate technologies have to ensure cost-efficient integration of highly complex systems, with a high degree of miniaturisation and sufficient flexi-bility to adapt to different applica-tions. Technologies for embedded de-vices such as MEMS (Micro-Electro-Mechanical Systems), passive or active components, antennas and power management will be the key for highly integrated modules. To reach this goal, new substrate materials, embedding technologies and encapsulation tech-nologies have to be developed, such as high-K
67 and low-K
68 dielectrics, and
tailored polymers (such as glass transi-tion temperature -Tg, coefficient of thermal expansion - CTE and coeffi-cient of moisture expansion CME) that correct the mismatch between dies and substrates.
3D integration enables different opti-mised technologies to be combined
67 High-κ dielectric refers to a material with a high dielectric constant κ (as compared to silicon dioxide) used in semiconductor manufactur-ing processes which replaces the silicon dioxide gate dielectric. The implementation of high-κ gate dielectrics is one of several strategies developed to allow further miniaturization of microelectronic compo-nents, colloquially referred to as extending Moore's Law. http://en.wikipedia.org/wiki/High-k_dielectric 68 Low-κ dielectric is a material with a small dielectric constant relative to silicon dioxide. http://en.wikipedia.org/wiki/Low-k_dielectric

75
together and has the potential for low-cost fabrication through high yield, smaller footprints and multi-functionality. In addition, 3D integra-tion is an emerging solution to the 'wiring crisis' caused by signal propa-gation delay at board and chip levels, because it minimises interconnection lengths and eliminates speed-limiting intra-chip and inter-chip intercon-nects.
Construction industry
The existing building stock has a long life-time, while solutions to retrofit ex-isting buildings are lacking. For existing buildings, technical possibilities to cre-ate a more energy-efficient structure are poor and most of them remain to be invented. Low-intrusive retrofit techniques are lacking; affordability is still a major problem, and social de-mand and acceptance lag behind.
Corrosion leads to an increased use of materials and energy, and to larger amounts of waste. Corrosion-resistant materials have a role to play here at the industrial scale.
7.2 Challenges in the context of food security and the bio-based economy
Food
Require facilities, emerging technolo-gies, industrial engineering concepts and new added value products and services to improve utilization of food raw materials and waste into new ma-terials (food and non-food).
Agriculture‘s automation for highly productive and efficient production processes will determine development trends of agricultural machinery.
Biofuels
Largely driven by government support and high energy cost, biofuels need better efficiency in terms of biomass yield, nutrient and water use and en-ergy conversion.
Sustainable and reliable supplies of feedstocks will be a critical success factor for the long-term prospect of biomass-based technologies on a large scale. Factors include improving productivity in these sectors, develop-ing reliable supply chains that open up the feedstock potentials, certification issues, and prevention of excessive disturbances in agricultural and forest commodity markets. These challenges, which are not specific to bioenergy and biofuels’ use of biomass, should be addressed in a coherent effort shared with the relevant stakeholders and initiatives.
Because of the variety of potential biofuels feedstocks at global and EU levels, different conversion technolo-gies are needed based on mechanical, thermochemical, biological and chem-ical processes.
For algae biofuels, cost reduction and scale-up are the critical challenges.
Natural photosynthesis is inefficient. Artificial photosynthetic systems, in-spired by the natural system’s nano-components, are attractive alterna-tives Production of useful chemical fuels directly from sunlight with signif-icantly higher efficiencies than the natural system is possible because such artificial systems need not devote captured energy to the maintenance of life processes. Artificial photosyn-thetic systems need increased scien-tific effort to understand structure-function relationships of components,

76
as well as develop basic principles for component assembly and integration.
7.3 Challenges for secure, clean and efficient energy technologies
Renewable energy
The levelised cost of energy for many renewable energy (RE) technologies is currently higher than existing energy prices, though in various settings RE is already economically competitive.
The costs and challenges of integrating increasing shares of renewables into an existing energy supply system de-pend on the current share of RE, the availability and characteristics of RE resources, the system characteristics, and how the system evolves and de-velops in the future. Wind, solar PV energy and CSP (concentrating solar power) without storage can be more difficult to integrate than dispatchable hydropower, bioenergy, CSP with storage and geothermal energy. The costs associated with RE integration, whether for electricity, heating, cool-ing, gaseous or liquid fuels, are con-textual, site-specific and generally dif-ficult to determine.
As the penetration of variable RE sources increases, maintaining system reliability may become more challeng-ing and costly.
Nuclear energy
Nuclear power has unique technical challenges related to issues of material and fuel handling, fusion, fission and radiation damage as well as decom-missioning and storage.
Nuclear waste management is a keen issue. In particular, progress needs to
be made in building and operating fa-cilities for the disposal of spent fuel and high-level wastes. While solutions are at an advanced stage of technolog-ical development, there are often dif-ficulties in gaining political and public acceptance for their implementation.
Solar energy
Despite their cost-saving potential, the application of photonic integrated so-lutions has been restricted to a mod-est number of niche markets. The main reason for the slow market pen-etration is the huge fragmentation in integration technologies, most of which have been developed and fully optimised for specific applications. Due to this fragmentation most tech-nologies address a market that is too small to justify further development into a low-cost, high-volume manufac-turing process. And new technology development or optimisation is re-quired for each new application, which makes the entry costs high. This is very different from the situation in microe-lectronics, where a much bigger mar-ket, larger by several orders of magni-tude, is served by a smaller number of integration technologies (mainly CMOS
69) which can address a wide va-
riety of applications. This leads to ex-tensive cost sharing for the large in-vestments required to develop a pow-erful integration technology.
PV systems lack cost efficiency. To stay competitive in the longer term, devel-opers need to lower the cost of each unit of electricity generated, which re-quires more efficient cells, better
69 Complementary metal–oxide–semiconductor (CMOS) is a technol-ogy for constructing integrated circuits. CMOS technology is used in microprocessors, microcontrollers, static RAM, and other digital logic circuits. http://en.wikipedia.org/wiki/CMOS

77
productivity. There is also a need for scalable low-cost fabrication and manufacturing technologies.
The key technological challenge for the development of solar-heated buildings is to reduce the volume of the heat storage.
For solar thermal, storage of heat is a major bottleneck. Further advances in seasonal and compact storage will have a major impact on the use of so-lar thermal energy.
The main limitation to expansion of CSP (concentrating solar power) plants is not the availability of areas suitable for power production, but the distance between these areas and many large consumption centres. Challenge: effi-cient long-distance electricity trans-portation.
Given the arid/semi-arid nature of environments that are well-suited for CSP, a key challenge is accessing the cooling water needed for CSP plants.
Wind energy
Non-storability and energy loss pre-vent the wind electricity market from spreading globally. Large scale energy storage is the main challenge within this field.
The manufacturing and installation of the cables represent a significant cost in offshore developments and have proved to be high-risk areas during in-stallation and operations.
The integration of offshore wind into the grid represents a major challenge. The current grid infrastructure will not allow the full potential of offshore wind to be realised. Its potential can only be realised through the construc-tion of interconnected offshore grid systems and regulatory regimes that
are better able to manage the inter-mittency and flexibility of wind power generation.
Turbine developers need to address marine conditions, corrosion and reli-ability issues in the offshore sector. The key factors affecting the deploy-ment of offshore wind are the current shortage of turbines, and their reliabil-ity.
Geothermal energy
There are technical barriers to access-ing and engineering the resource (es-pecially drilling technology), geother-mal heat use and advanced geother-mal technologies. Geothermal has some health, safety and environmen-tal concerns as well. Advanced materi-als technologies for offshore, geopres-sured and super-critical (or even magma) resources could unlock a huge additional resource base.
The key challenge for widespread direct use of geothermal heat will be the ability to reliably engineer the sub-surface heat exchangers (using tech-nique known as ‘EGS’ – Enhanced Geo-thermal System) in a reproducible way to harness the heat flux at the re-quired temperature.
Fundamental research is required to bring about a significant breakthrough in compact, efficient storages.
Since transport of heat has limitations, geothermal heat can only be used where there is demand in the vicinity of the resource.
Hybrid district heating and cooling
To reach high penetrations of RE sys-tems in district heating requires the development of source systems that

78
can draw on a variety of heat and cool-ing sources to meet customer demand at any time.
Control and automation of systems are major challenges that should be worked through. As a hybrid system is not simply an addition of two or more separate systems, specific research should be carried on the best way to control the combined system. This needs to take into account the sto-chastic nature of sunlight availability (if it is used in the hybrid system) as well as climate conditions, heating and/or cooling demand forecasting. This research should also address en-ergy performance monitoring as well as early fault diagnosis for continued high performance over the system’s lifetime.
Fossil energy sources
Ultra-deep offshore oil reservoirs need new materials to alleviate platform structure, new technologies to guaran-tee flow assurance, new subsea robot-ics, a better understanding of well bore stability, sealing techniques, fit-for-purpose completions, high-temperature high-pressure sensors, imaging deep reservoir structure, etc. All of this makes innovation a neces-sary step.
7.4 Challenges of smart, green and integrated transport
Electric vehicles need to store their electricity on-board in such way that it can compete with hydrocarbon fuels in terms of the required energy densi-ty.
Maritime transport is vulnerable to future fuel oil shortage and rising pric-es because of today's oil-based pro-
pulsion systems. Existing long-life ships require retrofitting with new technologies to reduce fuel consump-tion and CO2 emissions.
Both current and near-term (that is, lithium-ion [Li-ion]) battery technolo-gies still have a number of issues that need to be addressed in order to im-prove overall vehicle cost and perfor-mance. These include battery storage capacity; battery duty (discharge) cy-cles; durability; life expectancy, and other issues such as energy density, power density, temperature sensitivi-ty, reductions in recharge time, and reductions in cost.
In road transport, replacement of conventional gasoline or diesel by al-ternative fuel will cause high wear, friction and increased thermal loading in engines due to the lack of lubricat-ing properties of bio-fuels, reduced compatibility with engine oils and seal material, as well as increased risks of corrosion. Existing solutions cannot cope with these problems, resulting in reduced engine reliability and compo-nent life time. For example, existing PVD coating wear out during compo-nent run-in phase (too thin) or do not possess resistance against fatigue (ex-isting thick layers produced by thermal spraying).
Fuel cells will play an important role in assuring the mobility of both vehicles and electrical devices (laptops and mobile phones, most commonly). One of the largest hurdles encountered in the development and production of fuel cells is their relatively low effi-ciencies. Naturally the catalyst plays a significant role in determining the effi-ciency of the cell, but the inability of the membranes to selectively transport protons between segments

79
of the cell also impacts on the perfor-mance.
Air transport is currently characterised by high fuel consumption and many CO2 and NOx emissions. Manufacture, maintenance and disposal of aircrafts and related products have a negative environmental impact.
R&D efforts in tribology (friction, lubri-cation and wear between surfaces) are inadequate. The lack of good solutions leads to inefficiency in energy con-sumption due to friction and reduced efficiency, maintenance costs, re-placement of materials and compo-nents, machine and plant shutdowns and increased lubricant consumption.
7.5 Challenges in the context of raw materials supply
Low substitutability of critical raw materials (high tech metals such as cobalt, platinum, rare earths, and tita-nium) will require extensive materials research in the years to come.
Solar photovoltaic (PV) active layers, as well as coating and barrier layers, require too many rare metals.
7.6 Challenges within resource efficiency and climate action
CO2 Capture and Storage (CCS)
High costs and risks still outweigh the commercial benefits of CCS. Research-ers need to further develop CO2 cap-ture techniques and reduce the energy consumption of oxygen production and CO2 treatment. The aim is to in-crease the efficiency of both CO2 cap-ture and individual power plants in or-
der to reduce energy consumption (which the capture process can in-crease).
Post-combustion technology CCS
There is insufficient experience for power plant applications on a large-scale. Special requirements, due to flue-gas conditions, have yet to be re-solved.
There is a high energy de-mand/penalty for regeneration of the solvent and energy requirements for CO2 compression.
Systems do not yet have full process integration and optimisation for pow-er generation.
An absorption system with high-throughput under an oxygen environ-ment is unavailable today.
Pre-combustion technology CCS
There are scale-up issues in designing and developing a highly reliable indus-trial-scale power plant with CO2 cap-ture.
Similarly, there is a problem with the scale-up of gasifiers.
Highly efficient gas turbines are need-ed for hydrogen combustion.
Energy losses by shift-reaction and the CO2 capture process must be compen-sated.
The goal is full-process integration and optimisation for power generation.
Oxy-fuel combustion technology CCS
No commercial gas- or coal-fired pow-er plants currently exist that operate under oxy-fuel conditions.

80
The only tests being performed are in laboratory-scale rigs and experimental boilers up to a size of a few MWth.
There are uncertainties as to what are acceptable impurities in the CO2-rich flue gas.
CO2-rich flue gas treatment is not yet developed.
7.7 Technological challenges to solving the issues of secure socie-ties
Satellite communication
Satellite services need continuous development to provide more power and bandwidth in space, in order to enable cheaper, smaller user termi-nals, as well as lower utilisation costs, and enhanced, higher data rate ser-vices.
Future satellite platforms will need to be flexible enough to support an evolving range and mix of traffic types. They must target a wide range of ap-plications and allow reconfigurations to follow service demand and user be-haviour, both in nature and in cover-age.
Currently there is a tendency for satel-lite technologies to compete with ter-restrial technologies, rather than to cooperate.
‘Security users’ experience enormous difficulties because a lack of coher-ence in security research and a disper-sion of efforts lead to enormous diffi-culties for interoperability between actors.
7.8 Innovation and the European paradox
Nanomaterials, like any innovative material, can have high impact on the processing and manufacturing tech-nologies of downstream industries. Process integration further down the value chains is a challenge which has to be overcome to ensure the de-ployment of nanotechnologies. Heavy investments with longer pay-back times should be supported along the value chains, as they are required for the uptake of nanotechnologies.
Up-scaling is critical in the develop-ment of any new process. In order to achieve mass production of nano-materials, multipurpose plants will have to be developed. Demonstration at industrial scale should therefore be supported in order to promote the deployment of nanotechnologies.
European R&D needs to address the ‘valley of death’ question. Research and development is generally strong in new technologies, but the transition from device to product and scale-up demonstration is weak, associated with low levels of venture capital fund-ing for KETs (Key Enabling Technolo-gies).
Related issues
The lack of agreed standards to relia-bly measure nanotechnology on-line during volume production creates co-ordination problems. There is a danger that every value chain, or chain seg-ment, will develop their own hetero-geneous standards based on second-ary properties.

81
Large initial investment costs in new plants and processes may lead to short-term lack of competitiveness.
European technology experiences a shortage of engineering expertise.
Product manufacturing processes need lengthy validation to meet regu-latory approval.
Researchers need to prove long-term safety and efficacy.
SMEs (Small and Medium Enterprises) experience difficulties accessing the single market. .
There is a lack of market-oriented public-private partnerships and pro-grammes coordinating actions aimed at shortening the time to market.
Venture capital funding usually re-quires a short exit horizon (about three years).
In Europe, industry is negatively influ-enced by a lack of political commit-ment and vagueness about the sup-port manufacturing will receive in the future. The predictability of regulatory regimes influences manufacturing companies’ decisions whether to in-vest or not in Europe.
There is a disconnection between patents share and manufacturing share.

82
References
Ashby, M. F., and D, R, H. Jones, Engineering Materi-als 2: An Introduction to Microstructures, Processing and Design, third edition. Elsevier: Oxford, 2006.
European Commission, FP7 NMP Work Programme, 2011.
Fisher, E., C. Selin, and J. M. Wetmore, The Year Book of Nanotechnology in Society. Vol. 1: Presenting Futures. Springer: USA, 2008.
Hannink R., H. J. and A. J. Hill (eds.), Nanostructure control of materials. Woodhead Publishing Limited: Cambridge, 2006.
Holley, S. E., ‘Nano Revolution — Big Impact: How Emerging Nanotechnologies Will Change the Future of Education and Industry in America (and More Specifi-cally in Oklahoma), an Abbreviated Account’. Journal of Technology Studies: 9-19.
Joachim, C., and L. Plevert, Nanosciences. The Invisible Revolution. World Scientific Publishing Co. Pte. Ltd., 2009.
Kelsall, R., I. Hamley, and M. Geoghegan (eds.,) Na-noscale Science and Technology. John Wiley & Sons, Ltd.: UK, 2005.
Krueger, A.,. Carbon Materials and Nanotechnology. Wiley-VCH Verlag GmbH & Co. KGaA, 2010.
Linton., J. D., ‘Determining demand, supply, and pricing for emerging markets based on disruptive process technologies’. Technological Forecasting & Social Change 71 (2004):105–120. 2003.
Moskowitz, Sanford L. 2009. Advanced Materials Revolution Technology and Economic Growth in the Age of Globalization. A. John Wiley & Sons, Inc., 2009.
Pinciotta, F. (ed.), Global Climate Change – The Tech-nology Challenge. Springer: USA, 2011.
Rensselaer, Advanced Materials Sector Report, Lally School of Management and Technology. Center for Economic Growth, 2004.
Schulte, J. (ed.), Nanotechnology: Global Strategies, Industry Trends and Applications. John Willey & Sons: West Sussex, Ltd. 2005.
Waqar A., and M. J. Jackson. Emerging Nanotechnolo-gies for Manufacturing. Elsevier:2009.
Weng, Y., H. Dong, and Y. Gan (eds.), Advanced Steels: The Recent Scenario in Steel Science and Technology. Springer and Metallurgical Industry Press, 2011.
Sources used for elaboration of Chapter 7:
European sources: European Technology Platfotms (ETPs) documents
‘Investing in the Development of Low Carbon Tech-nologies’ (SET-Plan). 2009.
EGCI Ad-hoc Industrial Advisory Group, ‘European Green Cars Initiative PPP; Multi-annual roadmap and long-term strategy’. 2010.
‘Strategic Research Agenda, European Space Technol-ogy Platform’, 2006.
‘Roadmap, European Technology Platform for Ad-vanced Engineering Materials and Technologies’, 2006.
‘Strategic Research Agenda, European Technology Platform on Sustainable Mineral Resources’, 2009.
‘Strategic Research Agenda, Waterborne Technology Platform’, 2011.
‘Strategic Research Agenda, European Technology Platform Smartgrids’, 2007.
‘Strategic Research Agenda, European Technology Platform for Zero-Emission Fossil Fuel Power Plants’, 2006.
‘Strategic Applications Research Agenda, eMobility Technology Platform’, 2010.
‘Common Vision for the Renewable Heating and Cooling Sector in Europe, European Technology Platform on Renewable Heating and Cooling’, 2011.
‘Strategic Research Agenda, Sustainable Nuclear Energy Technology Platform’, 2009.
‘Strategic Research Agenda, European Photovoltaic Technology Platform’, 2007.
‘Strategic Research Agenda, European Biofuels Tech-nology Platform’, 2010.
‘Strategic Research Agenda, European Nanoelectron-ics Initiative Advisory Council’, 2007.

83
‘Strategic Research Agenda, Networked European Software and Service Initiative’, 2011.
‘Strategic Research Agenda, European Technology Platform Photonics21’, 2010.
‘Strategic Research Agenda, European Technology Platform for Sustainable Chemistry’, 2005.
‘Strategic Research Agenda, European Wind Energy Technology Platform’, 2008.
‘Strategic Research Agenda, ARTEMIS European Technology Platform’, 2011.
‘Strategic Research Agenda, Integral Satcom Initia-tive’, 2006.
‘Strategic Research Agenda, European Technology Platform on Smart Systems Integration’, 2009.
‘Strategic Research Agenda, European Technology Platform on Nanomedicine’, 2006.
‘Strategic Research Agenda, European Technology Platform “Plants for the Future”, 2007.
‘Strategic Research Agenda, Forest-based Sector Technology Platform’, 2007.
‘Strategic Research Agenda, European Construction Technology Platform’, 2005.
‘Strategic Research Agenda, Manufuture Technology Platform’, 20006.
‘Strategic Research Agenda, European Technology Platform for the Future of Textiles and Clothing’, 2006.
‘Strategic Research Agenda, Water Supply and Sanita-tion Technology Platform’, 2010.
‘Strategic Research Agenda, Advisory Council for Aeronautics Research in Europe’, 2004.
‘Strategic Research Agenda, European Rail Research Advisory Council’, 2007.
‘Strategic Research Agenda, European Road Transport Research Advisory Council’, 2010.
European sources: other documents
‘Ageing well in the Information Society: An i2010 Initiative. Action Plan on Information and Communi-cation Technologies and Ageing’, European Commis-sion, 2007.
‘Europe 2020: A European strategy for smart, sustain-able and inclusive growth’, European Commission, 2010.
High Level Group on Key Enabling Technologies, ‘Mastering and deploying Key Enabling Technologies (KETs): Building the bridge to pass across the KETs' “Valley of death” for future European innovation and competitiveness’ (working document).
High Level Group on Key Enabling Technologies, ‘Thematic report by the Working Team on Advanced Manufacturing Systems’. 2010.
High Level Group on Key Enabling Technologies, ‘Report by the working group on advanced materials technologies’ (working document).
‘Preparing for our future: Developing a common strategy for key enabling technologies in the EU’ COM: 512-3, 2009.
‘Research for a Secure Europe: Report of the Group of Personalities in the field of Security Research’, 2004.
Extra-European sources: research priorities in the USA, Japan, China and South Korea
CHINA: ‘China's 12th Five-Year Plan: Overview’, March, 2011. http://www.kpmg.com/CN/en/IssuesAndInsights/ArticlesPublications/Publicationseries/5-years-plan/Documents/China-12th-Five-Year-Plan-Overview-201104.pdf
JAPAN: ‘White Paper on Science and Technology 2010— , Chapter 2: Strategic priority setting in Sci-ence and Technology’ (provisional transla-tion).http://www.mext.go.jp/english/whitepaper/1302537.htm
SOUTH KOREA: Korean Ministry of Science and Tech-nology, ‘Nanotechnology Korea’ (no date).
SOUTH KOREA: Korea Photonics Technology Institute, ‘R&D activities’. http://www.kopti.re.kr/english/rndactivities/leddevice.jsp (accessed 05/08/2011).
SOUTH KOREA: ‘Korea’s Nanotechnology Roadmap for the next ten years’, TWA, March, 2011.
USA: National Science and Technology Council, Com-mittee on Technology, ‘National Nanotechnology Initiative Strategic Plan’, February, 2011.

84
USA: NSCT Committee on Technology, ‘Nanoe-lectronics for 2020 and beyond’, July, 2010. USA: NSCT Committee on Technology, ‘Nano-technology for Solar Energy Collection and Conversion’, July, 2010.USA: NSCT Committee on Technology, ‘Nanomaterials and Human Health & Instrumentation, Metrology, and Ana-lytical Methods: Report of the National Nano-technology Initiative Workshop’, November, 2009. Extra-European sources: international organisations
International Energy Agency (IEA), ‘Technology roadmaps’. http://www.iea.org/subjectqueries/keyresult.asp?KEYWORD_ID=4156
IEA, ‘Technology Roadmap: Biofuels for Transport’, OECD/IEA, 2011.
IEA, ‘Carbon Capture and Storage: Progress and Next Steps’, OECD/IEA, 2010.
IEA, ‘Technology Roadmap: Solar photovoltaic ener-gy’, OECD/IEA, 2010.
IEA, ‘Technology Roadmap: Wind energy’, OECD/IEA, 2009.
IEA, ‘Technology Roadmaps: Smart grids’, OECD/IEA, 2011.
IEA, ‘Technology Roadmap: Nuclear energy’, OECD/IEA and OECD/NEA, 2010.
IEA, ‘Technology Roadmap: Geothermal heat and power’, OECD/IEA, 2011.
IEA, ‘Technology Roadmap: Energy-efficient Buildings: Heating and Cooling Equipment’, OECD/IEA, 2011.
IEA, ‘Technology Roadmap: Electric and plug-in hybrid electric vehicles’, OECD/IEA, 2011.
IEA, ‘Technology Roadmap: Concentrating solar power’, OECD/IEA, 2010.
IEA, ‘Cement Technology Roadmap 2009: Carbon emissions reductions up to 2050’, OECD/IEA and The World Business Council for Sustainable Development, 2009.
World Health Organization (WHO), ‘Innovative tech-nologies that address global health concerns: Out-come of the call “Global initiative on health technolo-gies”, WHO, 2010.
Intergovernmental Panel on Climate Change (IPCC), ‘Special Report on Renewable Energy Sources and Climate Change Mitigation: Summary for Policy Mak-ers’, IPCC, 2011.
Food and Agriculture Organisation of the United Nations (FAO), ‘Biotechnologies for agricultural de-velopment: proceedings of the international technical conference on agricultural biotechnologies in devel-oping countries’, FAO, 2011.

85
Study methodology
The most important aim for this study is to conduct solid research in order to create a precise overview and define perspectives of the various market segments for Value Added Materials.
The major study objectives are formulated as follows:
definition and classification,
analysis: VAM by segment,
detailed current market analysis by segment and technology application,
prediction of VAM market develop-ment by segment,
current and potential technological market drivers by segment,
analysis of potential economic and societal issues in the framework of grand societal challenges.
The study is based on four main work packages.
1. Identification of information
This first work package dealt with preparation of the further stages of the research as well as with detailed analysis of available secondary sources. Using the relevant data gath-ered in this stage, we conducted a me-ta-analysis and systematic review. Combining the results of several rele-vant sources allowed the creation of a set of related hypotheses (therefore this integrated both qualitative and quantitative approaches), elaborated in more detail and verified in the fol-lowing work packages.
This part of the study also contained preparations of database of experts
and interviewees to be engaged in fur-ther research.
2. Collection of information
Analysts gathered primary information under this work package. The research team conducted a series of interviews with two groups of stakeholders:
materials experts,
investors and investment ad-visors from banks, venture capital and private equity companies.
The first group of respondents, the materials experts, was also asked to participate in a Delphi group exercise in order to get a wide understanding of the challenges they face, and dis-cuss their definition of VAMs. The main information gathered helped create further work packages.
The detailed composition of the re-spondents groups is presented in An-nex 2.
3. Analysis and evaluation of data
When all relevant primary and sec-ondary data were available, the team elaborated on market analysis and prognosis.
The main challenge for this part of the study was to assess the sizes of mar-kets for VAMs and their share in those markets. The difficulty of this task was intensified by the fact that respond-ents — materials scientists and private investors — gave their input in the form of interviews. Also the discussion on definition of VAMs within the Del-phi Group exercise demonstrated that
86
it would be difficult to establish pre-cise and detailed information of cur-rent market shares of VAMs in each market segment.
The only possible approach therefore was to analyse existing market size in-formation and foresights for all sectors and subsectors (applications), then draw conclusions based on this analy-sis with support from qualitative in-formation obtained and other second-ary sources (roadmaps and foresights). We used triangulation to assure the data from interviews with market in-vestors.
4. Conclusion
This part prepared the final report and disseminated the study outcomes.

87
Annex 1. Market foresights relevant for Value Added Materials
Figure 18: Energy-related markets for VAMs — selected foresights overview
Source: selected BCC Research estimates. Design: Oxford Research AS. Unit: billion euro.

88
Source: selected BCC Research estimates. Design: Oxford Research AS. Unit: billion euro.
Figure 19: Environment-related markets for VAMs — selected foresights overview

89
Source: selected BCC Research estimates. Design: Oxford Research AS., Unit: billion euro.
Figure 20: Transport-related markets for VAMs — selected foresights overview

90
Figure 21: Health-related markets for VAMs — foresights from ‘Roadmaps in Nanomedicine’
Source: ‘Roadmaps in nanomedicine: towards 2020‘. Design: Oxford Research AS. Unit: billion euros.

91
Figure 22: Health-related markets for VAMs — selected foresights overview
Source: selected BCC Research estimates. Design: Oxford Research AS., Unit: billion euro.

92
Source: selected BCC Research estimates. Design: Oxford Research AS. Unit: billion euro.
Figure 23: ICT-related markets for VAMs — selected foresights overview70
70 The market for “‘superconducting electrical equipment’, reaching 622 billion euro, was presented within ICT sector following other sources and approaches. It can be of course also associated with the energy sector analysed in chapters above. This sector’s expected growth has also influenced the total share of materials foresighted use in ICT sector discussed at previous page.

93
Source: selected BCC Research estimate., Design: Oxford Research AS. Unit: billion euro.
Figure 24: Selected cross-cutting markets for VAMs — foresights overview7172
71 It is interesting that graphene products are emerging — from close to zero market up to a total of 472 million euro in 2020. 72 Full record of ’long names’ categories can be found in table below.

94
Table 9: Overview of identified market size values for sectors covered with the study73
Sector / applica-tion
Sub sector / application
Source Unit 2007 2008 2009 2010 2011 2012 2013 2014 2015 2016 2017 2020 2025 2030 2035 CAGR
Energy Market-Research.com
trillion € 4,235 7,87528
13 %
Energy US EIA quadrillion BTU
495,1 543,5 590,5 638,7 687 738,7
Liquids US EIA quadrillion BTU
174,71 179 186 197 210 223,6
Natural gas US EIA quadrillion BTU
112,13 129 141 150 155 162
Coal US EIA quadrillion BTU
132,45 139 152 168 186 206
Nuclear US EIA quadrillion BTU
27,1 32 37 41 44 47
Renewables US EIA quadrillion BTU
48,83 64 73 82 91 100
Hydropower US EIA kwhours 2999 3689 4166 4 591 5034 5 418
Wind US EIA kwhours 165 682 902 1 115 1234 1 355
Geothermal US EIA kwhours 57 98 108 119 142 160
Solar (photovolta-ics)
US EIA kwhours 6 95 126 140 153 165
Other US EIA kwhours 235 394 515 653 733 874
Advanced materi-als for renewable energy systems
BCC Research billion € 8,12 11,83 8 %
Biogas plant equipment
BCC Research billion € 2,1 6,02 30 %
Alternative energy storage
BCC Research billion € 0,2275 0,2961 5 %
Electrochemical batteries
BCC Research billion € 0,1652 0,2254 6 %
Fuel cells
BCC Research billion € 0,0175 0,0308 12 %
73 The market was gathered from various sources and denominated into euro using exchange rate being and average from 120 days before September 15th, 2011. 1 USD = 0,70 €; 1 GBP = 1,16 €O

95
Sector / applica-tion
Sub sector / application
Source Unit 2007 2008 2009 2010 2011 2012 2013 2014 2015 2016 2017 2020 2025 2030 2035 CAGR
PV shipments BCC Research billion € 28,84 54,6 14 %
PV modules materials
BCC Research billion € 18,55 32,9 12 %
Supercapacitors for the energy sector
BCC Research billion € 0,0574 0,4277 49 %
Utility-scale energy storage
BCC Research billion € 2,8 12,95
Energy-management systems
BCC Research billion € 42 49 3 %
Power electronics BCC Research billion € 6,86 12,39 22 %
Power MOSFETs BCC Research billion € 3,36 5,18 16 %
Stationary Fuel cells
BCC Research billion € 0,08603
1,82 55 %
Components for PEM fuel cell membrane elec-trode assembly (MEA) - membrane, bipolar plates, gaseous diffusion layers, catalyst ink and electrodes
BCC Research billion € 0,2681 0,6839 21 %
Membranes BCC Research billion € 0,14 0,2968 16 %
Inks and catalysts BCC Research billion € 0,0721 0,2478 28 %
Large and ad-vanced batteries
BCC Research billion € 5,74 7,7 6 %
Lithium battery market
BCC Research billion € 6,02 6,93 3 %
Nanoparticles used in energy, catalytic and structural applications
BCC Research billion € 0,25543
0,91 29 %
Portable battery-powered products
BCC Research billion € 297,71 323,05 1 %
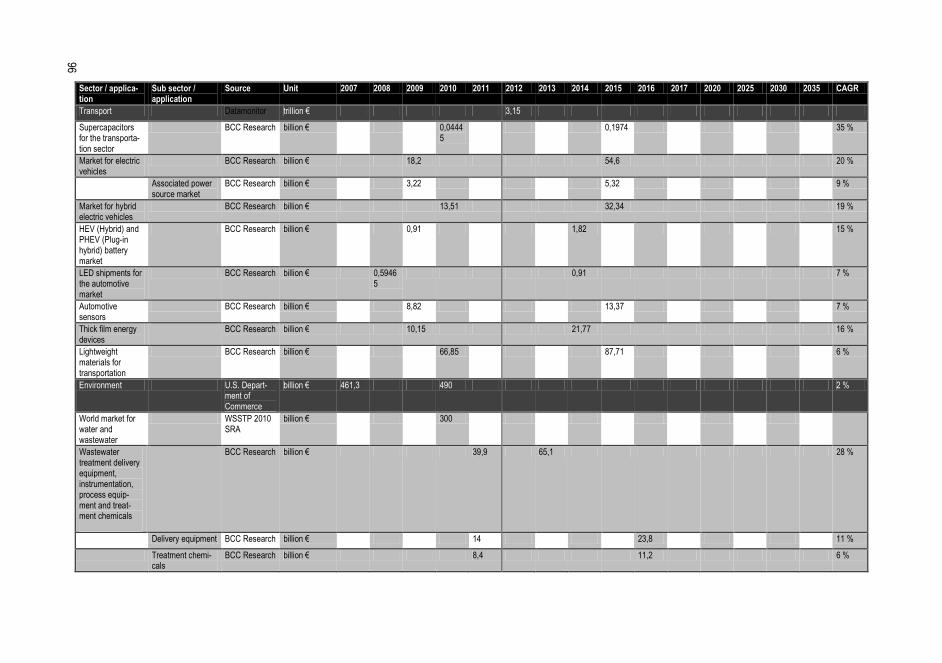
96
Sector / applica-tion
Sub sector / application
Source Unit 2007 2008 2009 2010 2011 2012 2013 2014 2015 2016 2017 2020 2025 2030 2035 CAGR
Transport Datamonitor trillion € 3,15
Supercapacitors for the transporta-tion sector
BCC Research billion € 0,04445
0,1974 35 %
Market for electric vehicles
BCC Research billion € 18,2 54,6 20 %
Associated power source market
BCC Research billion € 3,22 5,32 9 %
Market for hybrid electric vehicles
BCC Research billion € 13,51 32,34 19 %
HEV (Hybrid) and PHEV (Plug-in hybrid) battery market
BCC Research billion € 0,91 1,82 15 %
LED shipments for the automotive market
BCC Research billion € 0,59465
0,91 7 %
Automotive sensors
BCC Research billion € 8,82 13,37 7 %
Thick film energy devices
BCC Research billion € 10,15 21,77 16 %
Lightweight materials for transportation
BCC Research billion € 66,85 87,71 6 %
Environment U.S. Depart-ment of Commerce
billion € 461,3 490 2 %
World market for water and wastewater
WSSTP 2010 SRA
billion € 300
Wastewater treatment delivery equipment, instrumentation, process equip-ment and treat-ment chemicals
BCC Research billion € 39,9 65,1 28 %
Delivery equipment BCC Research billion € 14 23,8 11 %
Treatment chemi-cals
BCC Research billion € 8,4 11,2 6 %

97
Sector / applica-tion
Sub sector / application
Source Unit 2007 2008 2009 2010 2011 2012 2013 2014 2015 2016 2017 2020 2025 2030 2035 CAGR
Energy-efficient technologies
BCC Research billion € 140 218,19 9 %
Combined heat-and-power installations and retrofitting
BCC Research billion € 38,5 63 9 %
Membrane bioreactors
BCC Research billion € 0,2359 0,4389 11 %
Microfiltration membrane products used in liquid separation
BCC Research billion € 0,84 1,26 8 %
Nanofiltration membranes
BCC Research billion € 0,06825
0,21735
26 %
Nanofiltration membranes for water treatment
BCC Research billion € 0,04963
0,16674
27 %
Barrier materials that impart controlled-release properties
BCC Research billion € 0,42 0,7 11 %
Desalination plant equipment
BCC Research billion € 2,03 3,85 14 %
Reverse osmosis desalination equipment
BCC Research billion € 0,98 2,24 18 %
Thermal desalina-tion equipment
BCC Research billion € 0,98 1,54 9 %
Controlled-release barrier materials
BCC Research billion € 0,42 0,7 11 %
Carbon capture technologies
BCC Research billion € 62,09 165,41 63 %
Nanostructured products for water treatment
BCC Research billion € 0,98 1,54 9 %
Well-established products for water treatment (reverse osmosis, nanofil-tration, ultrafiltra-tion membrane modules)
BCC Research billion € 0,98 1,47 8 %

98
Sector / applica-tion
Sub sector / application
Source Unit 2007 2008 2009 2010 2011 2012 2013 2014 2015 2016 2017 2020 2025 2030 2035 CAGR
Emerging products (nanofibre filters, carbon nanotubes, nanoparticles)
BCC Research billion € 0,0315 0,0784 20 %
Nanotechnology for environmental applications
BCC Research billion € 1,4 15,26 61 %
Specialty chemi-cals for water treatment
BCC Research billion € 14,7 19,53 6 %
Corrosion inhibi-tors
BCC Research billion € 3,22 4,27 6 %
Coagulants and flocculants
BCC Research billion € 2,87 3,78 6 %
Health Photonics 21 report "Light-ing the way ahead"
billion € data only for Europe
641,9
Health market size Plunkett Research®, Ltd.2006
trillion € in 2006
3,15 3,85 5 %
Pharmaceutical Raw Materials Industry
Plunkett Research®, Ltd.2006
billion € 3,22
Dietary Supple-ments
Plunkett Research®, Ltd.2007
billion €
Alternative Medication
Plunkett Research®, Ltd.2008
billion € 1,89
Biotechnology Plunkett Research®, Ltd.2009
billion € 35,49
Healthcare Services
Plunkett Research®, Ltd.2010
billion € 35
Pharmaceutical (drug market)
Plunkett Research®,
billion € 238 360 15 %

99
Sector / applica-tion
Sub sector / application
Source Unit 2007 2008 2009 2010 2011 2012 2013 2014 2015 2016 2017 2020 2025 2030 2035 CAGR
Optical healthcare equipment
BMBF Optische Techno-logien 2007, used in Photonics 21 report "Light-ing the way ahead"
billion € 16,1 30,1 8 %
Biophotonics (including x-ray, PET and ultra-sound)
Photonics 21 report "Light-ing the way ahead"
billion €
Nanodiagnostics in vivo imaging
Clinical imager "Roadmaps in nano medi-cine: towards 2020"
billion € 0,05 0,7 70 %
Tumour therapy delivery system
"Roadmaps in nano medi-cine: towards 2020"
billion € 0,001 0,02 0,1 38 %
SPIO/USPIO (contrast agents)
"Roadmaps in nano medi-cine: towards 2020" (38)
billion € 0,01 0,1 1 58 %
Nanostructures as carriers plus drug release
"Roadmaps in nano medi-cine: towards 2020"
billion € 0,01 0,1 58 %
Nanodiagnostics in vitro imaging
Hospital "Roadmaps in nano medi-cine: towards 2020"
billion € 0,2 0,7 1,5 16 %
Physician office "Roadmaps in nanomedicine: towards 2020"
billion € 1 1,5 8 %
Home "Roadmaps in nanomedicine: towards 2020"
billion € 1,5

100
Sector / applica-tion
Sub sector / application
Source Unit 2007 2008 2009 2010 2011 2012 2013 2014 2015 2016 2017 2020 2025 2030 2035 CAGR
Nano pharmaceu-ticals
Non-invasive delivery of protein nanomedicines
"Roadmaps in nanomedicine: towards 2020"
billion € 10 20 15 %
Non-invasive delivery of DNA-based nanomedi-cines
"Roadmaps in nano medi-cine: towards 2020"
billion € 5 10 15 %
Non-invasive delivery of non-Lipinski molecule
"Roadmaps in nano medi-cine: towards 2020"
billion € 2 4 15 %
(Enabler) computa-tional tool
"Roadmaps in nano medi-cine: towards 2020"
billion € 0,015 0,02 0,04 15 %
Radical innovation-based nanomedi-cines
"Roadmaps in nano medicine: towards 2020"
billion € 1 3 25 %
Activated nanopar-ticles devices for x-ray modality
"Roadmaps in nano medi-cine: towards 2020"
billion € 0,5 2 32 %
Targeting drugs to facilitate cell differentiation
"Roadmaps in nano medi-cine: towards 2020"
billion € 2 6 25 %
Nanodevices Focused ultrasound therapy system, equipment only
"Roadmaps in nano medi-cine: towards 2020"
billion € 0,175 0,35 5 70 %
Linked MRI, equipment only
"Roadmaps in nano medi-cine: towards 2020"
billion € 0,175 0,35 0,5 7 %
Pressure and thermosensitivie drugs
"Roadmaps in nano medi-cine: towards 2020"
billion € 0,09 0,35 0,75 16 %
Targeted therapies in oncology
"Roadmaps in nano medicine: towards 2020"
billion € 30

101
Sector / applica-tion
Sub sector / application
Source Unit 2007 2008 2009 2010 2011 2012 2013 2014 2015 2016 2017 2020 2025 2030 2035 CAGR
Anti-inflammatory diseases
"Roadmaps in nano medi-cine: towards 2020"
billion €
CNS diseases "Roadmaps in nano medi-cine: towards 2020"
billion € 5 8 10 %
Regenerative medicine: smart biomaterials
Biocompatible biomaterials
"Roadmaps in nano medicine: towards 2020"
billion € 35 43 52 4 %
Regenerative medicine: cell therapies
Non stem cell based therapies
"Roadmaps in nano medi-cine: towards 2020"
billion € 1 2,5 20 %
Tissue engineering "Roadmaps in nano medi-cine: towards 2020"
billion € 10 20 15 %
Stem cell therapies "Roadmaps in nano medi-cine: towards 2020"
billion € 1 7 48 %
Supporting technologies
"Roadmaps in nano medi-cine: towards 2020"
billion € 3,5 8 18 %
Clinical healthcare IT technologies
BCC Research billion € 4,41 12,25 19 %
Medical device sensors
BCC Research billion € 6,3
Semiconduc-tor/MEMS sensors
BCC Research billion € 3,5 4,55 5 %
Passive medical device sensors
BCC Research billion € 0,98 0,91 -1 %
Nanomedicine BCC Research billion € 37,1 70 14 %
Medical lasers BCC Research billion € 1,61 3,36 16 %
Market for portable battery-powered products in the medical sector
BCC Research billion € 46,55
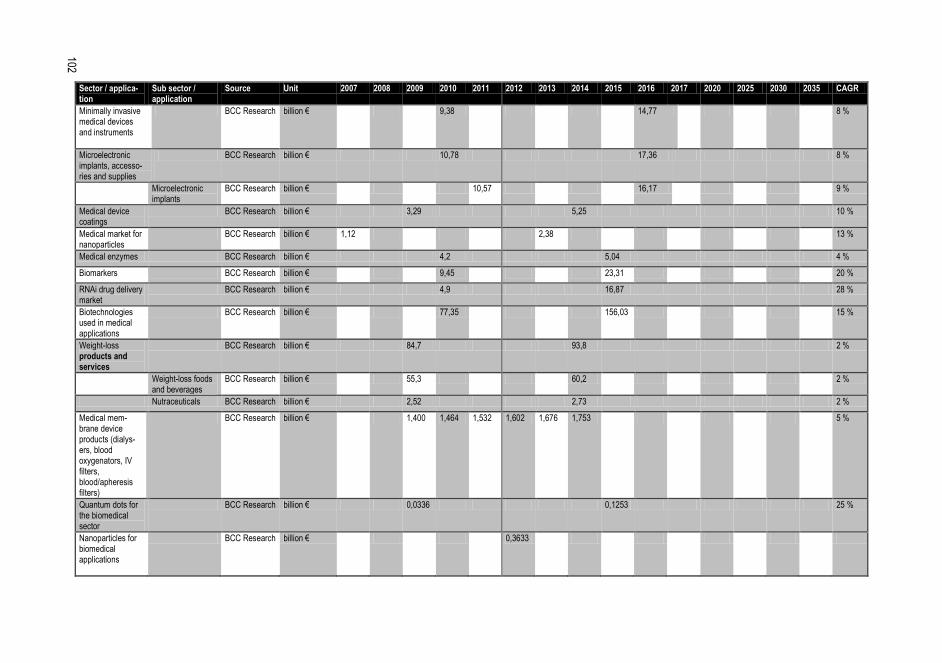
102
Sector / applica-tion
Sub sector / application
Source Unit 2007 2008 2009 2010 2011 2012 2013 2014 2015 2016 2017 2020 2025 2030 2035 CAGR
Minimally invasive medical devices and instruments
BCC Research billion € 9,38 14,77 8 %
Microelectronic implants, accesso-ries and supplies
BCC Research billion € 10,78 17,36 8 %
Microelectronic implants
BCC Research billion € 10,57 16,17 9 %
Medical device coatings
BCC Research billion € 3,29 5,25 10 %
Medical market for nanoparticles
BCC Research billion € 1,12 2,38 13 %
Medical enzymes BCC Research billion € 4,2 5,04 4 %
Biomarkers BCC Research billion € 9,45 23,31 20 %
RNAi drug delivery market
BCC Research billion € 4,9 16,87 28 %
Biotechnologies used in medical applications
BCC Research billion € 77,35 156,03 15 %
Weight-loss products and services
BCC Research billion € 84,7 93,8 2 %
Weight-loss foods and beverages
BCC Research billion € 55,3 60,2 2 %
Nutraceuticals BCC Research billion € 2,52 2,73 2 %
Medical mem-brane device products (dialys-ers, blood oxygenators, IV filters, blood/apheresis filters)
BCC Research billion € 1,400 1,464 1,532 1,602 1,676 1,753 5 %
Quantum dots for the biomedical sector
BCC Research billion € 0,0336 0,1253 25 %
Nanoparticles for biomedical applications
BCC Research billion € 0,3633

103
Sector / applica-tion
Sub sector / application
Source Unit 2007 2008 2009 2010 2011 2012 2013 2014 2015 2016 2017 2020 2025 2030 2035 CAGR
Microspheres used in medical tech-nology
BCC Research billion € 0,3367 0,98 24 %
Security and safety (equipment)
Photonics 21 report "Light-ing the way ahead"
billion €
Market for portable battery-powered products in the military sector
BCC Research billion € 1,26 2,24 12 %
Surveillance equipment market
BCC Research billion € 54,6 97,44 10 %
Mobile location technologies
BCC Research billion € 16,24 34,16 16 %
Vehicle navigation BCC Research billion € 11,06 26,74 19 %
Biometric technol-ogies
BCC Research billion € 3,5 8,4 19 %
Enzymes for textile processing
billion €
Chemical industry American Chemistry Council
billion € 2402,4
Paints and coatings
BCC Research billion € 69,79 81,62 3 %
Powder coating and emerging technologies segment
BCC Research billion € 12,6 16,1 5 %
Waterborne technologies
BCC Research billion € 43,82 47,6 2 %
Adhesives and sealants
BCC Research billion € 28,56 36,47 5 %
Pesticides BCC Research billion € 30,1 35,7 3 %
Biopesticides BCC Research billion € 1,12 2,31 16 %
Synthetic pesti-cides
BCC Research billion € 28,7 33,6 3 %
Agrochemical products
BCC Research billion € 83,72 137,2 10 %

104
Sector / applica-tion
Sub sector / application
Source Unit 2007 2008 2009 2010 2011 2012 2013 2014 2015 2016 2017 2020 2025 2030 2035 CAGR
Fertilisers BCC Research billion € 47,88 82,46 11 %
Pesticides BCC Research billion € 35,84 54,81 9 %
Powder coatings BCC Research billion € 4,55 6,37 7 %
Total ICT sector The World Information Technology and Services Alliance, DIGITAL PLANET 2010
trillion € 2,38 2,52 2,45 2,625 2,87 3,08 3,22 5 %
Hardware Digital Planet trillion € 0,315 0,343 0,336 0,336 0,364 0,392 0,413 5 %
Software Digital Planet trillion € 0,245 0,252 0,252 0,259 0,266 0,273 0,28 2 %
Services Digital Planet trillion € 0,49 0,525 0,49 0,525 0,56 0,595 0,665 5 %
Communications Digital Planet trillion € 1,33 1,47 1,435 1,575 1,68 1,82 1,89 6 %
Electronics industry
ENIAC 2007 SRA
billion € 773,5
Market for elec-tronics products (BCC)
ENIAC 2007 SRA
billion € 1400 2240 10 %
Materials and equipment
ENIAC 2007 SRA
billion € 56,7
Semiconductors ENIAC 2007 SRA
billion € 196
Compound semiconductors
BCC Research billion € 11,2 23,59 16 %
Compound semicon-ductors for wireless electronic devices
BCC Re-search
billion € 4,004 6,685 11 %
Compound semicon-ductors for optical data storage
BCC Research billion € 1,155 2,401 16 %
Compound semicon-ductors for fibre optics communica-tions
BCC Research billion € 0,805 4,249 39 %
Compound semicon-ductors illuminations
BCC Research billion € 1,33 1,631 4 %

105
Sector / applica-tion
Sub sector / application
Source Unit 2007 2008 2009 2010 2011 2012 2013 2014 2015 2016 2017 2020 2025 2030 2035 CAGR
Compound semiconductors for solar cells
BCC Research billion € 0,063 1,365 85 %
Compound semiconductors for new markets
BCC Research billion € 0,63 2,8 35 %
Transparent electronic compo-nents
BCC Research billion € 53,48 86,1 10 %
Organic materials for transparent electronic compo-nents
BCC Research billion € 1,47 14,21 57 %
Inorganic materials for transparent electronic compo-nents
BCC Research billion € 51,8 72,1 7 %
Memory to semiconductor manufacturers and end users
BCC Research billion € 32,34 55,3 11 %
Mainstream memory (e.g. DRAM)
BCC Research billion € 17,64 29,05 10 %
New age memory (e.g. NAND flash)
BCC Research billion € 8,96 17,99 15 %
Conformal coatings for electronics
BCC Research billion € 4,62 1,61 -19 %
Conformal coating materials
BCC Research billion € 1,05 1,61 9 %
Conformal coating equipment
BCC Research billion € 3,57 4,83 6 %
Market for mobile telematics systems
BCC Research billion € 36,4
PVD equipment for the microelectron-ics industry
BCC Research billion € 1,96 3,01 9 %
Thermal manage-ment products
BCC Research billion € 5,25 7,14 6 %

106
Sector / applica-tion
Sub sector / application
Source Unit 2007 2008 2009 2010 2011 2012 2013 2014 2015 2016 2017 2020 2025 2030 2035 CAGR
Thermal interface materials
BCC Research billion € 0,273 0,43876
8 %
Polymer-based TIM
BCC Research billion € 0,23975
0,38451
8 %
Metal-based TIM BCC Research billion € 0,02485
0,03766
7 %
Phase-change TIM BCC Research billion € 0,00847
0,01666
12 %
Paper thin displays BCC Research billion € 0,98 5,81 43 %
Paper-thin displays for electronic portable devices
BCC Research billion € 0,91 5,67 44 %
Paper-thin displays for advertising
BCC Research billion € 7,7 30,8 32 %
Fibre optic connectors (FOC)
BCC Research billion € 1,33 2,17 9 %
Electronic chemi-cals and materials
Electronics .ca
billion € 19,95 36,12 13 %
Wafers Electronics .ca billion € 10,29 18,69 13 %
Polymers and conductive polymers
Electronics .ca
billion € 1,33 4,13 25 %
Microelectronics cleaning equip-ment, consuma-bles and services
BCC Research billion € 2,03 5,6 18 %
Cleaning chemi-cals, gases and other consumables
BCC Research billion € 1,47 3,5 16 %
Cleaning equip-ment
BCC Research billion € 0,7 1,68 16 %
Atomic layer deposition
BCC Research billion € 0,2226 0,6846 21 %
Atomic layer deposition equip-ment
BCC Research billion € 0,1617 0,4053 17 %

107
Sector / applica-tion
Sub sector / application
Source Unit 2007 2008 2009 2010 2011 2012 2013 2014 2015 2016 2017 2020 2025 2030 2035 CAGR
Atomic layer deposition materi-als
BCC Research billion € 0,0609 0,27965
29 %
Microelectromech-anical (MEM) devices production and equipment
BCC Research billion € 5,32 9,24 12 %
Microfluidic MEMs BCC Research billion € 2,45 3,01 4 %
Accelerometers BCC Research billion € 0,504 1,89 30 %
Dielectrics and substrates for semiconductors
BCC Research billion € 9,45 12,81 6 %
Substrates BCC Research billion € 8,4 11,2 6 %
Dielectrics market BCC Research billion € 0,98 1,54 9 %
Optical coatings for the electronics market
BCC Research billion € 1,75 1,96 2 %
OLED (Organic Light-Emitting Diodes)
BCC Research billion € 2,73 5,67 16 %
OLED for displays market
BCC Research billion € 2,03 4,13 15 %
OLED for lights market
BCC Research billion € 0,7 1,54 14 %
Direct methanol fuel cells (used to make batteries)
Electronics .ca
billion € 0,04592
0,77 60 %
Strained silicon (used to make semiconductors devices)
Electronics .ca
billion € 2,45
Robotics industry BCC Research billion € 12,32 14,98 4 %
Nanorobots and NEMs, and related equipment and materials
BCC Research billion € 0,02821
0,58128
174 %
Market for sensors BCC Research billion € 39,41 64,05 8 %
Biosensors and chemical sensors
BCC Research billion € 9,1 14,7 10 %
Image sensors BCC Research billion € 12,6 18,9 8 %

108
Sector / applica-tion
Sub sector / application
Source Unit 2007 2008 2009 2010 2011 2012 2013 2014 2015 2016 2017 2020 2025 2030 2035 CAGR
Microsensors BCC Research billion € 3,64 8,4 15 %
MEMs microsen-sors
BCC Research billion € 2,24 4,55 15 %
Nanosensors BCC Research billion € 4,55 26,6 42 %
Biochips sensors BCC Research billion € 0,35 1,26
Nanoparticles used in electronic, magnetic and optoelectronic applications
BCC Research billion € 0,36533
0,77 16 %
Electronic applica-tions
BCC Research billion € 0,2891 0,6097 16 %
Thick film display devices
BCC Research billion € 0,84 1,96 18 %
Superconductors BCC Research billion € 1,4 2,38 11 %
Super conducting magnets
BCC Research billion € 1,33 1,68 5 %
Super conducting electrical equip-ment
BCC Research billion € 16,1 622,3 108 %
Information and Communication industry
EPOSS 2009 SRA
billion € 2350
Telecommunica-tions market
Photonics 21 SRA "Lighting the way ahead"
billion € 2380
Optical network equipment market
Photonics 21 SRA "Lighting the way ahead"
billion € 9,8
Optical component market
Photonics 21 SRA "Lighting the way ahead"
billion € 2,8
Smart systems EPOSS 2009 SRA
billion € 65

109
Sector / applica-tion
Sub sector / application
Source Unit 2007 2008 2009 2010 2011 2012 2013 2014 2015 2016 2017 2020 2025 2030 2035 CAGR
Monitoring and Control products and solutions
EPOSS 2009 SRA
billion € 188
Monitoring and control products and solutions for the vehicle market
EPOSS 2009 SRA
billion € 17
e-health market EPOSS 2009 SRA
billion €
Market for portable battery-powered products
BCC Research billion € 310,24 323,05
Market for portable battery-powered products in the communication sector
BCC Research billion € 89,32 84 -1 %
Market for portable battery-powered products in the computer sector
BCC Research billion € 71,33
Automation systems
BCC Research billion € 43,68 50,82 3 %
Embedded systems
BCC Research billion € 64,4 78,75 4 %
Embedded hardware
BCC Research billion € 62,86 76,72 4 %
Embedded software
BCC Research billion € 1,54 2,03 6 %
market for ad-vanced intelligent wireless microsys-tems
BCC Research billion € 0,0924 0,91 46 %
Fibre optic connectors for telecommunica-tions
BCC Research billion € 1,33 2,03 9 %
LEDs for display backlighting
BCC Research billion € 0,6531 1,05 10 %
Photonics industry Photonics 21 SRA "Lighting the way ahead"
billion € 270

110
Sector / applica-tion
Sub sector / application
Source Unit 2007 2008 2009 2010 2011 2012 2013 2014 2015 2016 2017 2020 2025 2030 2035 CAGR
Green photonics (photonics solutions that generate or conserve energy, cut greenhouse gas emissions, reduce pollution, yield environmentally sustainable outputs or improve public health)
Photonics 21 SRA "Lighting the way ahead"
billion € 20,23 70 182,7 20 %
Lighting market "Lighting the way ahead" Photonics 21 SRA
billion € 58
Professional luminaires
"Lighting the way ahead" Photonics 21 SRA
billion € 20,3
Consumer luminaires
"Lighting the way ahead" Photonics 21 SRA
billion € 16,24
Luminaire market
"Lighting the way ahead" Photonics 21 SRA
billion € 36
Lamps "Lighting the way ahead" Photonics 21 SRA
billion € 11,6
LED compo-nents
"Lighting the way ahead" Photonics 21 SRA
billion € 1,74
Lighting electronics
"Lighting the way ahead" Photonics 21 SRA
billion € 5,22
Automotive and special lighting applications
"Lighting the way ahead" Photonics 21 SRA
billion € 2,9
LED-based luminaires
"Lighting the way ahead" Photonics 21 SRA
billion € 3,71 10,43 19 %
OLED-lighting "Lighting the way ahead" Photonics 21 SRA
billion € 3,5
Safety and security equipment using photonic sensors
"Lighting the way ahead" Photonics 21 SRA
billion € 22 48 10 %
Safety "Lighting the way ahead" Photonics 21 SRA
billion € 7

111
Sector / applica-tion
Sub sector / application
Source Unit 2007 2008 2009 2010 2011 2012 2013 2014 2015 2016 2017 2020 2025 2030 2035 CAGR
Air pollution detection
"Lighting the way ahead" Photonics 21 SRA
billion € 2
Automotive sector "Lighting the way ahead" Photonics 21 SRA
billion € 5
Security "Lighting the way ahead" Photonics 21 SRA
billion € 15
Biometrics "Lighting the way ahead" Photonics 21 SRA
billion € 5
Videosurveil-lance "Lighting the way ahead" Photonics 21 SRA
billion € 5
Optical coatings BCC Research billion € 3,22 3,99 4 %
Quantum dots for the optoelectronics sector
BCC Research billion € 0,217
Silicon photonics product market
Electronics .ca
billion € 1,365
Wavelength division multiplex filter
Electronics .ca
billion € 0,434
Photonic crystals BCC Research billion € 1,54 24,15 58 %
Photonic crystals for displays
BCC Research billion € 4,2
Photonic crystals for optical fibres
BCC Research billion € 7,56

112
Sector / applica-tion
Sub sector / application
Source Unit 2007 2008 2009 2010 2011 2012 2013 2014 2015 2016 2017 2020 2025 2030 2035 CAGR
Food industry CIAA (in KBBE 2010 report)
billion € 2800
Food products contain-ing nanotechnology
‘Nanotechnol-ogies and food‘, 2010 House of Lords report (UK)
billion € 0,287 4,06 70 %
Probiotic supple-ments, ingredients and foods
BCC Research billion € 15,12 21,77 8 %
Active, controlled and intelligent packaging for food and beverage
BCC Research billion € 11,83 16,52
Entertainment industry
BCC Research billion € 46,83 58,31
Entertainment technology devices
BCC Research billion € 35,63 45,15
Enzymes billion €
Enzymes for industrial applica-tions
BCC Research billion € 2,31 3,08 6 %
Technical enzymes BCC Research billion € 0,7 1,05 8 %
Food and bever-age enzymes
BCC Research billion € 0,6825 0,91 6 %
Biochips BCC Research billion € 1,82 4,13 18 %
DNA microarrays (type of chip)
BCC Research billion € 0,91 1,89 16 %
LOAC (type of chip)
BCC Research billion € 0,5719 1,47 21 %
Nanotechnology Roco, Mirkin and Hersam. Sept 2010
billion € 177,8 700 26 %
Nano-enabled products
Roco, Mirkin and Hersam. Sept 2010
billion € 156,8
Nano-intermediates
Roco, Mirkin and Hersam. Sept 2010
billion € 20,3
Nano-materials Roco, Mirkin and Hersam. Sept 2010
billion € 0,7

113
Sector / applica-tion
Sub sector / application
Source Unit 2007 2008 2009 2010 2011 2012 2013 2014 2015 2016 2017 2020 2025 2030 2035 CAGR
Nanotechnology in the manufactur-ing and materials sector
Roco, Mirkin and Hersam. Sept 2010.
billion € 97,3
Nanotechnology in the electronics and IT sector
Roco, Mirkin and Hersam. Sept 2010
billion € 53,2
Nanotechnology in healthcare and life sciences
Roco, Mirkin and Hersam. Sept 2010
billion € 23,8
Nanotechnology in the energy and environment sector
Roco, Mirkin and Hersam. Sept 2010
billion € 2,8
Quantum dots (nanocrystals)
BCC Research billion € 0,0469 0,469 58 %
Nanobiotechnol-ogy products
BCC Research billion € 0,01351
20,79 334 %
Nanobiotechnology products for medical applications
BCC Research billion € 13,37 20,3 9 %
Carbon nanotubes grades (MWNTs, SWNTs, FWNTs)
BCC Research billion € 0,07 0,7 58 %
Multi-wall Carbon Nanotubes
BCC Research billion € 0,0721 0,60585
53 %
Few-wall Carbon Nanotubes
BCC Research billion € 0,000553
0,04375
140 %
Nanotechnology BCC Research billion € 8,19 18,2 14 %
Nanomaterials BCC Research billion € 6,3 13,72 14 %
Nanotools BCC Research billion € 1,82 4,76 17 %
Nanodevices BCC Research billion € 0,0217 0,16359
40 %
Nanofibre products BCC Research billion € 0,06279
1,54 34 %
Nanofibre products for the mechani-cal/chemical sector
BCC Research billion € 0,05201
0,98 34 %

114
Sector / applica-tion
Sub sector / application
Source Unit 2007 2008 2009 2010 2011 2012 2013 2014 2015 2016 2017 2020 2025 2030 2035 CAGR
Nanofibre products for the electronics sector
BCC Research billion € 0,00448
0,2261 48 %
Nanocomposites BCC Research billion € 0,322 0,966 25 %
Clay-based nanocomposites
BCC Research billion € 0,15883
0,48461
25 %
Ceramic-containing nanocomposites
BCC Research billion € 0,03374
0,10164
25 %
Nanocoatings and nanoadhesives
BCC Research billion € 1,61 13,37 42 %
Nanocoatings BCC Research billion € 1,47 12,53 43 %
Nanoadhesives BCC Research billion € 0,1197 0,84 38 %
Manufacturing billion €
Physical vapour deposition (PVD)
BCC Research billion € 6,3 10,36 10 %
PVD equipment BCC Research billion € 4,48 7,35 10 %
Chemical vapour deposition
BCC Research billion € 5,11 8,26
Ion implantation BCC Research billion € 3,08
Inorganic metal finishing technolo-gies
BCC Research billion € 29,61 42,77 6 %
Advanced protective gear and armour
BCC Research billion € 2,8 3,64 5 %
Other \ Unclassi-fied
Smart materials BCC Research billion € 13,72 28 13 %
Motors and actuators
BCC Research billion € 7,56 17,78 15 %
Transducers BCC Research billion € 4,69 6,58 6 %
Structural materials BCC Research billion € 0,77 2,38 21 %
Sensors BCC Research billion € 0,714 1,12 8 %
Graphene prod-ucts
BCC Re-search/elec-tronics.ca
billion € 0,469 0,4725 0 %

115
Sector / applica-tion
Sub sector / application
Source Unit 2007 2008 2009 2010 2011 2012 2013 2014 2015 2016 2017 2020 2025 2030 2035 CAGR
Graphene structur-al materials
BCC Re-search/elec-tronics.ca
billion € 0,01225
0,0637 39 %
Capacitors BCC Re-search/elec-tronics.ca
billion € 0,0182 0,238 67 %
Displays electronics.ca billion € 0,03066
Photovoltaics electronics.ca billion € 0,00525
0,0245 36 %
Thermal manage-ment
electronics.ca billion € 0,0105 0,01575
8 %
Microspheres BCC Research billion € 1,4 2,45 12 %
Ceramic matrix composites (CMCs)
BCC Research billion € 0,609 0,91 8 %
CMCs for the mechani-cal-chemical sector
BCC Research billion € 0,2205 0,3262 8 %
CMCs for the energy and environment sector
BCC Research billion € 0,1939 0,2758 7 %
Metal matrix composites
BCC Research mln kg 3,08 4,13 6 %
MMCs for ground transportation sector
BCC Research mln kg 1,68 2,24 7 %
MMCs for electron-ics/thermal management sector
BCC Research mln kg 1,05 1,47 7 %
Photocatalyst products
BCC Research billion € 0,5929 1,19 15 %
Photocatalyst products for the construction sector
BCC Research billion € 0,51821
1,05 15 %
Photocatalyst products for the consumer market
BCC Research billion € 0,0595 0,1106 13 %
Thick film devices BCC Research billion € 18,69 34,86 13 %
Rare earths BCC Research thousand tons 79,52 122,92 9 %

116
Sector / applica-tion
Sub sector / application
Source Unit 2007 2008 2009 2010 2011 2012 2013 2014 2015 2016 2017 2020 2025 2030 2035 CAGR
Mechanical and metallurgic applications
BCC Research thousand tons 25,76 39,48 9 %
Glass and ceram-ics applications
BCC Research thousand tons 22,75 34,23 9 %
Aerogels (2.6% of the market for microporous and nanoporous materials in 2008)
BCC Research billion € 0,05803
0,45241
51 %
Market for metals (secondary and mined metals)
BCC Research billion € 454,58 625,94 7 %
Smart glass BCC Research billion € 0,7 1,33 14 %
Smart glass for transportation applications
BCC Research billion € 0,6223 1,12 12 %
Smart glass for construction applications
BCC Research billion € 0,09709
0,15281
9 %
Powder metal injection moulding
BCC Research billion € 0,68943
1,33 14 %
Ceramic injection moulding compo-nents
BCC Research billion € 0,27615
0,5607 15 %
Liquid metal moulding compo-nents
BCC Research billion € 0,22106
0,3255 8 %
Metamaterials BCC Research billion € 0,13349
1,82 69 %
Electromagnetic metamaterials
BCC Research billion € 0,08225
0,22134
22 %
Extreme parameter and other met-amaterials
BCC Research billion € 0,05124
0,21098
33 %
Biodegradable polymer market
BCC Research billion € 1,08112
2,9 22 %
Packaging seg-ment
BCC Research billion € 0,76096
1,972 21 %

117
Sector / applica-tion
Sub sector / application
Source Unit 2007 2008 2009 2010 2011 2012 2013 2014 2015 2016 2017 2020 2025 2030 2035 CAGR
Fibre/fabric segment
BCC Research billion € 0,15544
0,5046 27 %
EMI/RFI shielding options
BCC Research billion € 3,15 3,64 3 %
Nonwoven materials
BCC Research billion € 13,804 18,096 6 %
Polymeric foams BCC Research billion € 8,7 9,976 3 %
Plastic additives BCC Research billion € 26,18 32,06 4 %
Property modifiers BCC Research billion € 13,09 16,03 4 %
Property stabilisers BCC Research billion € 8,82 10,78 4 %
Polymer absor-bents and adsor-bents
BCC Research billion € 0,00294
0,0049 11 %
Conductive polymers
BCC Research billion € 0,4756
Advanced ceram-ics
EuMat 2006 SRA (for 2004); electronics.ca (for 2015)
billion € 39,48

118
Annex 2 – Composition of respondents groups
Table 10: List of interviewed materials experts
Area Institution Name of the expert
Forestry FTP sprl Mr Johan Elvnert - FTP manager
Forestry CEI-Bois chairman (European Confedera-tion of woodworking industries) Stora Enso Wood Products
Jukka Kilpeläinen SVP of Corporate R&D
€ATEX and Biotex: a joint initiative by 2 ETPs: €ATEXT and (biotechnolo-gy)
Euratex Lutz Walter– €ATEXT (SRA chief editor)
Net!Works: Converged fixed and Wireless Communication Networks (also called eMobility)
Alcatel-Lucent, Bell Labs Germany Bernd Gloss
ECTP (European Construction tech-nology Platform)
Heidelberg Cement - Head of Re-search&Development
Wolfgang Dienemann - Co-leader of the Working group on Cementitious within the Focus Area on Materials
EPoSS: The European Technology Platform on Smart Systems Integra-tion
Microsystems Technology CSEM SA
Prof. Dr. Alex Dommann - Leader of the Key technologies Working Group within EPoSS
Food for Life Food and Consumer Product Safety Au-thority (NL)
Dr Jacqueline Castenmiller - Facilitator of the working group on Food and Health within the ETP

119
ERRAC: European Rail Research Advisory Council
Network Rail (UK) John Amoore - leader of the "Competitiveness" working group within ERRAC
Federation of European Materials Societies
FEMS - Executive officer, Consultant Dr. Jean-Marie Welter President of the Société Française de Métallurgie et de Matériaux (SF2M) from 2005-2006. Currently a technical consultant to the copper industry.
Energy National Renewable Energy Laboratory (NREL)
Prof. David Ginley Dr. David Ginley, Research Fel-low/Group Manager Process Technology and Advanced Concepts
University/Research National Institute for Materials Science (NIMS)
Sukekatsu Ushioda, Ph. D., President National Institute for Materials Science (NIMS), Japan
EuMaT: European Technology Plat-form for Advanced Engineering Ma-terials and Technologies
MEGGITT Wanda Wolny - Chair of the Working group on Materials for Information and Communication Technology at EuMaT.
Manutext: a joint initiative by 2 ETPs: Manufuture and Future tex-tiles and Clothing.
ITA Aachen Prof. Thomas Gries; Institute of Textile Technology at RWTH Aachen University and Chair for textile machinery (ITA)
SNETP: Sustainable nuclear energy Technology Platform
SCK-CEN (Belgian Nuclear Research cen-tre)
Dr. Leo Sannen; Manager Nuclear Materials Science (NMS) Institute SCK-CEN Dr. Marc Scibetta, Deputy Institute Manager Nuclear Ma-terials Science
FEMS (Federation of European Ma-terials Societies) - President of the executive committee
Federal Institute for Materials Research and Testing, BAM, Berlin.
Dr. Ing. Pedro D. Portella
Manufuture Daimler AG Heinrich Flegel (chairman)
ECTP (European Construction tech-nology Platform)
Advanced Composite group - technical director
Ebby Shahidi - Co-leader of the Working group on Compo-sites within the Focus Area on Materials

120
FEMS (Federation of European Ma-terials Societies) - Secretary
Rio Tinto Alcan, Engineered Products, T&I - CRV
Dr Hugh M. Dunlop, senior scientist, innovation programs
FEMS (Federation of European Ma-terials Societies) - Executive officer
National Centre for Metallurgical Research (CENIM), Madrid
Prof. Juan J. de Damborenea
Photonics21 TRUMPF GmbH + Co.; KG Johann-Maus-Strasse 2 71254 Ditzingen Germany
Dr. Thomas Rettich, Research Coordination
TPWind European Wind Energy Association Athanasia Arapogianni, research officer EWEA - the European Wind Energy Association asbl/vzw
Nanomedicine CEA (Commissariat à l'Energie Atomique) Patrick Boisseau - chair of the nano-diagnostics working group within the ETP
Research Funding Tekes, Finnish Funding Agency for Tech-nology and Innovation
Ms Sisko Sipilä chief technology adviser
Research European Spalation Source (ESS) Colin Carlile
FEMS (Federation of European Ma-terials Societies) - Vice-President of the executive committee
Fraunhofer Institute for Nondestructive Testing, Dresden
Prof. Ehrenfried Zschech
ECTP (European Construction Tech-nology Platform)
Università Politecnica delle Marche Gian Marco Revel - Co-leader of the ECTP Focus Area on Materials
ACARE: Advisory Council for Aero-nautics Research in Europe
ASD Mr Romain Muller (manufacturing industry contact)

121
Table 11: List of interviewed bank, private equity & venture capital investment specialists
Name of the company Name of the expert Sector
Intesa Sanpaolo, International Regulatory and Antitrust Affairs
Alessandra Perrazzelli Cross - sector
Polish Investment Fund Wojciech Szapiel Cross - sector
JKIC -JOERG KREISEL International Consultant Joerg Kreisel Cross - sector
Incitia Ventures Jens Petter Falck Software / ICT Services, Electronics /Semiconductors, Life Sci-ence, Energy / Cleantech / Industrial
Beheer Flevoland Participaties BV René Krijger ICT, Life Sciences, Production
Zouk Capital LLP Justin Mighell Cleantech
Octadim GmbH Mr Harald Fichtl Chemical - Materials, Energy, Environment Industrial Products, Other
WHEB Partners Dr. Aaron Small Cleanteach, Software, Hardware, Energy Sensors, Chemicals
Gimv NV Eline Talboom Cleantech, Life sciences
NBGI Ventures James Wong, Medtech, Life sciences
NREL Process Technology and Advanced Concepts Dr. David Ginley Nanotechnology and nanomaterials; transition metal oxides; organic electronics;
Baltcap Martin Kodar Wide range
AB Chalmersinvest Ingvar Andersson
Transportation; Cleantech; Chemicals and Materials; Energy and Environment; Life Sciences
Global Life Science Ventures Dr. Hans A. Küpper
Life Science Medtech


European Commission
EUR 25027 EN - Technology and market perspective for future Value Added Materials Final Report from Oxford Research AS
Luxembourg: Publications Office of the European Union
2012 — 124 pp. — 21 x 29,7 cm ISBN 978-92-79-22003-6doi 10.2777/9520


How to obtain EU publications
Free publications:• via EU Bookshop (http://bookshop.europa.eu);• at the European Union’s representations or delegations. You can obtain their contact details
on the Internet (http://ec.europa.eu) or by sending a fax to +352 2929-42758.
Priced publications:• via EU Bookshop (http://bookshop.europa.eu).
Priced subscriptions (e.g. annual series of the Official Journal of the European Union and reports of cases before the Court of Justice of the European Union):• viaoneofthesalesagentsofthePublicationsOfficeoftheEuropeanUnion
(http://publications.europa.eu/others/agents/index_en.htm).
Our society and in particular, the modern industrial economy are profoundly influenced by new advanced materials and technologies, which will play a major role in determining our future well-being.In the past, the traditional starting point in the develop-ment of new materials has been mainly influenced by their availability. Nowadays this is increasingly deter-mined by their expected end uses and required in-ser-vice performance. The realization of materials by design benefits from recent progress in nanotechnology, con-verging technologies and modelling.The aim of this study is to provide an overview and fu-ture perspective of the commercial market possibilities for value-added and value-adding materials and to set out the various technical and economic scenarios linked to their potential development and use. A major novelty is the sources and individuals consulted, which comprise as far as possible, those coming both from the materi-als fields and the financial sector, including investors and investment advisors that deal with venture capital and private equity investments.The study is intended to be for the benefit of all stake-holders in the field of new materials.
Studies & reports
KI-NA-25-027-EN
-C