technology & business strategy align to focus on the
TRANSCRIPT

A S U P P L E M E N T T O H O S P I T A L I T Y T E C H N O L O G Y
• FIFtEENth ANNUAL •• 2 0 1 5 • S E V E N T E E N T H A N N U A L •
INSIDE• Budget Trends: How Much Restaurants Plan to Invest, and Where• Strategy: Tech Leaders Identify Top Objectives & Challenges for Tech in 2015• Tracking Adoption: Current Installation Rates and Planned Rollouts• Plus the 2015 Top 10: Restaurants Pick Most Important Emerging Technologies
Annual study tracks technology budgets and
rollout plans in restaurants; 2015 brings increased pressure to meet rising
guest expectations
Technology & Business sTraTegy align To Focus
on The cusTomer experience
Technology & Business sTraTegy align To Focus
on The cusTomer experience

GROUP PUBLISHERLenore O’[email protected]
EDITORIALGROUP EDITOR-IN-CHIEF Abigail A. [email protected] EDITOR Dorothy [email protected] EDITOR Tammy Mastroberte
EKN RESEARCHSVP RESEARCH & PRINCIPAL ANALyST Gaurav [email protected] STRATEGy Giri [email protected]. RESEARCH ANALyST Asheesh [email protected]
SALESSR. ACCOUNT EXECUTIVE Leah [email protected] TO PUBLISHER Jen [email protected]
ART/PRODUCTIONCREATIVE DIRECTOR Colette [email protected] DIRECTOR Lauren DiMeoldimeo @edgellmail.comPRODUCTION MANAGER Lynn S. [email protected]
ONLINE MEDIAVP, MEDIA INTEGRATION Rob [email protected] OF LEAD GENERATION & AUDIENCE DEVELOPMENT Jason [email protected] DEVELOPMENT MANAGER Scott [email protected] EVENT PRODUCER Whitney [email protected]
MARKETING/EVENTS/CIRCULATIONDIRECTOR, EVENT PLANNING Pat [email protected] MANAGER Jeffrey [email protected]
SUBCRIPTIONS 978.671.0449REPRINTS: PARS Int’l, 212.221.9595 x319
CORPORATECEO/CHAIRMAN Gabriele A. [email protected] Gerald C. [email protected] PRESIDENT John [email protected]
CORPORATE OFFICE4 Middlebury Blvd. | Randolph NJ 07869973.607.1300 FAX: 973.607.1395
FOUNDER DOUGLAS C. EDGELL 1951-1998
CONTENTS
| | | | | | | | | | | | | | | | | | | | | | | | | | | | | | | | | | | | | | | | | | | | | | | | | | | | | | | | | | | | | | | | | | | | | | | | | | | | | | | | | | | | | | | | | | | | | | | | | | | | | | | | | | | | | | | | | | | | | | | | | | | | | | | | | | | | | | | | | | | | | | | | | | | | | | | | | | | | | | | | | | | | | | | | | | | | | | | | | | | | | | | | | | | | | | | | | | | |
Copyright © 2015 Hospitality Technology. All rights reserved. No part of this publication may be reproduced or transmitted in any form or by any means, electronic or mechanical, including photocopy, recording or information stor-age and retrieval systems without permission in writing from the publishers. For article reprints & e-prints, please contact PARS International at (212) 221-9595, Fax: (212) 221-9195 or email: [email protected]. POSTMASTER: Please send address changes to HOSPITALITy TECHNOLOGy, P.O. BOX 261, LOWELL, MA 01853. PRINTED IN THE U.S.A.
www.htmagazi n e.com R e stau Rant tech noLogY stu dY 2015 « hospitaLitY tech noLogY « 3
1 7 t h A N N U A L
CONtENtS
Tech Investments on the Risein RestaurantsBudgets increase to 5%+ of revenue; restaurants reveal allocations that run, grow and transform.
Measuring Perception:What’s Driving Technology in 2015customer-centric goals become top priorities.
Technology Investments & Strategic Focus Align to Put Customers Firststudy tracks 2015 tech budgets, rollout plans and iT decision-making in restaurants.
About the Survey Sample
Tracking Current Installation and Planned RolloutsFrom the front to the back of the house, mobile tech takes hold; security solutions are most important. plus, restaurants pick their top ten most important emerging technologies.
a profile of the respondents in the 2015 report.
4
6
14
20
26
[ INTRODU C T ION]
[ TE C HNOLOgy BU DgE TS]
[ TE C HNOLOgy STRATE g IE S ]
[ TE C HNOLOgy ROLLOU TS]
[ ME THODOLOgy]

1 7 t h A N N U A L
INtRODUCtION
HT’s annual Restaurant Technology Study has been tracking technology in-vestments in restaurants for 17 years running. In its early days, the bulk of the material focused on point-of-sale systems, and eventually back-of-house applications that could be tapped to create efficiency. Today, nearly every restaurant runs with a POS and has a financial management system to han-dle accounting. The activity is now in the front-of-the-house, where servers are testing out mobile devices, dynamic digital content is displayed on menu boards, guests are “checking-in” and posting photos of their meal, and practi-cally everyone is on Wi-Fi.
Restaurants have become a hot bed of activity for potential technology: manag-ers are getting mobile devices to monitor activity and reports on-the-fly, beacons are being explored as a method to track customers, and social media activity is finding its way into formalized loyalty pro-grams via Social CRM projects. Consum-ers are considering their options for mo-bile wallet, while restaurants — like all U.S. merchants — are feeling pressure to keep up with payment security requirements.
The objective of this report is to track ac-tivity in restaurant technology and provide decision-makers with deployment bench-marks that include both current installa-tion rates, as well as near-term planned roll-outs for the year ahead. Results show that mobile-enabled solutions will contin-ue to be a top priority, and payment tech-nology has everyone scrambling.
In last year’s report, findings suggest-ed that restaurants were funneling tech-nology resourses into customer-facing projects. They were (and still are) explor-ing ways to use mobile technology to en-gage with guests, and social media to de-velop deeper loyalty. There was a wrinkle, however. Despite having a tactical focus on customer-facing technology, most IT decision-makers reported a far greater strategic affiliation with goals that would create business efficiency and boost productivity, than with customer-centric strategy. This year’s report shows that sentiment is shifting. Technology teams are becoming increasingly accountable to customer-centric strategies. A grow-ing number of participants in this study say that customer engagement is a key driver for their IT efforts, and they feel increased pressure to meet rising cus-tomer expectations. This is good news, as this alignment will foster better data inte-gration across projects, and help prevent technology initiatives from death-by-silo development.
To help restaurants benchmark their IT spend, technology budgets are evaluated each year and provided as a percentage of overall revenue. This year, a new bench-
mark offers meaningful context into how technology budgets are allocated across three core areas: “Run, Grow, and Trans-form.” The budgeting model, developed by Gartner, suggests that CIOs shift away from budget-based thinking (bottom-line cost) towards portfolio-based thinking (top-line potential).
The overall findings in this report show that technology has become a signifi-cant factor in restaurant operations, and many organizations are eager to shed the “laggard” moniker that has long plagued the industry. Technology decision-makers will find this study a valuable tool in mea-suring their own footprint against com-petitors.
Furthermore, we hope executives an-swer candidly for themselves and their organizations some of the questions con-tained herein: how much of your technol-ogy budget goes towards “keeping the lights on,” for example, and do you use an IT steering committee? Holding up that mirror will continue to create visibil-ity around possible factors in the success and failure of technology projects, and can encourage restaurant companies to embrace technology as a key tool in de-livering exceptional service.
Technology Investments & Strategic Focus Align to Put Customers Firststudy tracks 2015 tech budgets, rollout plans and iT decision-making in restaurants
4 « hospitaLitY tech noLogY « R e stau Rant tech noLogY stu dY 2015 www.htmagazi n e.com
Abigail A. LordenGroup Editor-in-Chief
Hospitality Technology
Gaurav PantSVP Research & Principal Analyst
EKN Research

will work with moreoutsourced serviceproviders.
1 7 t h A N N U A L
Tech Investments on the Rise in Restaurants
Tech budgeTs on The riseAfter several years of budget cuts (2009 and 2010), followed by a few flat years (2011 and 2012), the economic recov-ery enabled restaurants to loosen purse strings and begin investing in technology in 2013. Right around the close of 2013, most restaurant executives were confi-dent that their technology budgets would see another healthy boost in 2014; busi-ness leaders were eager to deploy a vari-ety of new mobile solutions and upgrade legacy systems. History proves that they were correct.
In the 2014 edition of HT’s Restau-rant Technology Study (using data col-
Technology budgets are increasing, and there’s currently no evidence that growth will taper off any time soon. A restaurant’s primary business goal for implementing technology has long been to enable business efficiency — and it still is — but there’s change brewing. As this study will reveal, customer engagement is quickly becoming a priority for technol-ogy teams, particularly as IT leaders are consulted not just to develop one-off solu-tions, but to lend their expertise to overall customer engagement strategies.
To help restaurants evaluate their own IT spend in comparison to market trends, this report takes a detailed look at current
and historical technology budgets through several measurements. First, it measures technology budgets as a percentage of overall revenue. Though commonly used by both CIOs and CFOs, however, this ra-tio can fall short for restaurants that are in periods of either capital investment or have hit new efficiency highs. To offer fur-ther context, we also provide a useful al-ternative through a “run, grow, transform” measurement of budget allocations. Fi-nally, we look at how technology budgets are distributed across macro categories — hardware, software, and services — and across solution mix, including POS, networking, and others.
Budgets increase to 5%+ of revenue; restaurants reveal allocations that run, grow and transform
ChAPtER 1: tEChNOLOGY BUDGEtS
6 « hospitaLitY tech noLogY « R e stau Rant tech noLogY stu dY 2015 www.htmagazi n e.com
of restaurants expect tospend more on tech in 2015 than they did in 2014.
of restaurants anticipatean increase in technology
projects in 2015.
of technology budgets will go to CapEx. 45%
51%
47%
40%
SnapShot of 2015 Budget trendS
of technology budgets will go to OpEx.
60%

8 « hospitaLitY tech noLogY « R e stau Rant tech noLogY stu dY 2015 www.htmagazi n e.com
lected at the close of 2013) restaurant executives were asked about anticipated changes in the year ahead, including both the number of technology projects on their plates, and the size of their tech-nology budgets. Both, they projected, would increase. Nearly half of those sur-veyed (48%) said they expected a budget increase in 2014; and just over a third (36%) said they were planning for more IT projects in 2014, compared to 2013.
In the 2015 Restaurant Technology Study (with data collected at the summa-tion of 2014), survey respondents were asked to report on their actual FY2014 budgets. On average, restaurants al-located 5.8% of their total revenue to technology in 2014. This is a notable in-crease over 2013, when IT budgets were 3.5% of revenue. The average is in line with the hotel industry, at 4.9% of overall revenue according to the 2015 Lodging Technology Study. It also aligns with the growth projected in last year’s report,
when restaurants predicted that their IT budget would approach 5% in 2014; the reality in fact surpassed predictions.
To provide a useful comparative pic-ture against which restaurants can mea-sure their own technology investments, this report tracks IT budgets across a spectrum that ranges from one percent to ten percent of overall revenue. The pie graph shown, “IT Spend as a Percent of Revenue,” depicts these breakdowns. In years’ prior, the one-percent investors — that is, those restaurants that invested just one percent of overall revenue on technology — were the largest group. In the 2014 report (which measured actual budgets for FY2013), 44% of restaurants fell into the one-percent investor bucket. In evaluating FY2014 budgets, the one-percent investor group is less than half that size. Just 18% of restaurants fall into the one-percent investment group. The data shows that investments are moving up stream, with greater portions
of restaurants investing larger chunks of revenue on technology. At the highest end of the spectrum are the ten-percent investors, which account for 27% of the restaurants surveyed; this group more than doubled its size compared to last year’s report.
Looking ahead, there’s no evidence of a slowdown in either the number of technology projects swirling around the organization, or the need for more fund-ing. Nearly half (51%) of restaurants surveyed expect that they’ll spend more on tech in 2015 than they did in 2014. Almost the same amount, 47%, said they anticipate having more technology proj-ects on their plates this year, compared to last year.
While IT budgets may be on the rise, most restaurants are not planning to add internal technology staff as a part of their 2015 plans: 68% said the num-ber of IT staff will remain the same in 2015, while 28% will add staff. Just 4%
5%spent six-to-nine percent.
It Spend aS a percent of revenue
restaurants investedan average of 5.8% of revenue on technologyin 2014.
in 2013, it was3.5%.
27%of restaurants spent two percent of revenue on technology in 2014.
18%of restaurants spent one percent of revenue on technology in 2014.
27%invested ten percent or more of revenue on technology in 2014.
23%spent three-to-five percent of
revenue on technology.
InduStry average
5.8%
3.5%
1 7 t h A N N U A L
ChAPtER 1: tEChNOLOGY BUDGEtS

10 « hospitaLitY tech noLogY « R e stau Rant tech noLogY stu dY 2015 www.htmagazi n e.com
According to Gartner, companies spend 66% of their IT budgets to run IT (maintain IT systems) and they spend the rest on business growth projects or transformation projects. The ideal, ac-cording to Gartner, would be a 50/50 split, but achieving it isn’t easy.
In the 2015 Restaurant Technology Study, we measured RGT budgeting two ways. First, a simple split between op-erational costs (those needed to “keep the lights on”) and capital investments (spending to grow or transform). On av-erage, restaurants in 2015 will allocate 60% of their technology budget to opera-tional expenses and 40% towards capex projects. This aligns with averages in both the lodging and greater retail indus-tries, as measured by HT and its retail technology sister publication, RIS News.
The survey then asked restaurant ex-ecutives to identify how monies are al-located across RGT: maintaining existing systems (run), developing and rolling out new systems (grow), and R&D/innova-
plan to reduce IT staffing. It’s more likely that restaurants will turn to external IT resources, for example outsourced tech-nology, with 45% of restaurants antici-pating more activity here.
A new budgeT Model: run, grow And TrAnsforMThe measurements provided in this study for IT spend as a percent of rev-enue are offered with a word of caution. They should not be used as a firm mea-surement to evaluate if your company is spending too much or too little on tech-nology. The challenge with this approach to budget comparison is that it doesn’t take into account one key role of technol-ogy: to reduce cost. An increase in tech-nology spend can occur when a company is investing in capital projects for innova-tion. It could also, however, be the result of system maintenance with high over-head. Conversely, low technology bud-gets don’t necessarily mean that tech is a low priority. Rather it may mean that an
organization has effectively transitioned to hosted systems that have lower over-head but are still achieving unique effi-ciencies or customer experiences.
To provide more context, Gartner sug-gests an alternative model that mea-sures technology spend in terms of “run, grow, transform.” It asks: what percent of technology is spent to run the busi-ness (think, security, compliance and transactions); what percent is spent to grow the business (think about systems that enable marketing, customer loyalty); and what percent is spent to transform the business (Gartner gives the example of Apple’s entry into the music business via iTunes). The RGT model isn’t perfect, as it can be difficult to categorize some IT projects between either “grow” or “trans-form.” For example, a mobile ordering app that one CIO might see as transformative, another would consider a tool for sales growth. Nonetheless, CIOs are finding the RGT model a useful way to provide fur-ther context to budget allocations.
BudgetIng through run, grow, tranSform
Actual vs. ideal: how much is spent to run, grow or transform the business?gartner suggests a budgeting model that measures technology spend in terms of “run, grow, transform.” it asks: what percent of technol-ogy is spent to run the business; what percent is spent to grow the business; and what percent is spent to transform the business? To find out how restaurants stack up, survey participants were asked about actual versus ideal allocations for technology budgets. here’s what they are currently doing (actual), compared to what they say would be the ideal.
• Maintaining essential business processes• reducing costs• lessening risk
• improving performance• Top line growth• new customer acquisition or retention
• initiatives are rare and beyond just iT• new markets, products or business models• change affects entire ecosystem
53% 31% 17%
40% 24%
Actual Actual Actual
idealideal
36%ideal
run grow TrAnsforM
1 7 t h A N N U A L
ChAPtER 1: tEChNOLOGY BUDGEtS

which has accounted for approximately 20% of the budget for three years running (this year at 18%).
In examining the allocation of tech-nology budgets across a variety of solu-tion types, we see a few overall trends emerging. Point-of-sale and store-level back office solutions are receiving less each year, while allocations for networks and data security are on the rise. POS will account for about 24% of IT budgets this year (compared to 33% in 2014 and 35% in 2013). Store-level back-office will account for 11% of IT spending this year (compared to 16% last year). The POS and back-office are the traditional work-horse systems in a restaurant, but they are also becoming increasingly “thin.” Mobile tablets are less costly than full
stand-alone units, and restaurants are looking at software-as-a-service (SaaS) for a variety of POS and back-office ap-plications. In fact, just about a quarter of software budgets will go to SaaS in 2015. POS has been the biggest line-item in restaurants. In 2015, it still is, but not by as great a margin. •
tion (transform). Participants were also asked to indicate how they think their organizations should allocate technology budgets. Not surprisingly, the smallest percentage of tech budgets goes towards transformation (R&D/innovation at 17%), and the largest is spent on run (maintain-ing existing systems at 53%). The bal-ance (31%) is used to grow the business through rolling out new technology.
The good news is that restaurants are not wildly off the mark compared to how participants in the HT study think monies should be allocated. In general, they’d like to see system maintenance cost less — about 40% would be their ideal — and would allocate 36% to rolling out new technology, with 24% reserved for R&D/innovation.
budgeT AllocATions: sofTwAre vs. hArdwAre, Pos vs. neTworkingTo understand how technology is allo-cated across the restaurant, this study includes two lines of investigation. The first examines how funds are budgeted at a macro level, comparing hardware, software, services, networking, and in-ternal personnel. The second examines IT spending by solution type (e.g. POS, data security, kitchen technology, etc.).
Looking first at the macro budget, we can determine a few key trends. First and not surprisingly, budgets allocated to hardware are on a slow but steady de-
cline. In 2012, hardware took the lion’s share at 30% of the budget. In 2015, hardware allocations have dropped to 24%. Meanwhile, we see a slow but steady increase in software allocations.
In 2012, software comprised 20% of
the overall budget. This year, it’s up to 25% and barely edged out hardware as the largest line item. Allocations for net-working continue to increase (this year at 15%, up from 8% in 2012) as does spending on external service providers (at 16% this year, up from 11% in 2012). The one constant is internal personnel,
tech Budget allocatIon: SolutIon mIx
TOP TIER 2015
Pos solutions 24%
enterprise solutions 17%
networking & data security 15%
MID TIER
store-level back-office solutions 11%
customer engagement 10%
LOW TIER
Physical security 8%
kitchen Technology 6%
Budgets fornetworks and data security are on the rise
tech Budget allocatIon: macro mIx 2015 2012
software 25% 20%
hardware 24% 30%
internal Personnel 20% 18%
external service Providers 16% 11%
network and Telecom 15% 8%
1 7 t h A N N U A L
ChAPtER 1: tEChNOLOGY BUDGEtS
12 « hospitaLitY tech noLogY « R e stau Rant tech noLogY stu dY 2015

ChAPtER 2: tEChNOLOGY StRAtEGIES
14 « hospitaLitY tech noLogY « R e stau Rant tech noLogY stu dY 2015
technology leaders with an overall strat-egy around customer-centricity. Last year, the IT leaders that participated in this study were still identifying business efficiency and employee productivity as top goals for their teams’ efforts, far out-pacing any stock these executives had in meeting customer-centric goals. But the projects on their plates were telling us otherwise. IT executives were charged with customer-centric projects, but didn’t feel tied to bigger picture discussions of customer service and engagement.
The danger here is that these one-off solutions can find themselves discon-nected, born in silos, and unable to de-liver the type of data insight that comes with integration. Imagine, for example, a mobile app with no ties to a loyalty program, nor any ordering capability; the app would have little utility to the customer and indeed, HT research has found that most restaurant apps fall into this category.
This year, restaurants continue to churn out customer-centric technolo-gies, but a new enlightenment is emerg-ing among restaurant technology execu-tives. We’re seeing evidence of an overall shift in IT focus away from efficiency and governance, toward customer-centricity.
The number-one motivator for IT proj-ects in 2015 is still “business efficiency” and 66% of restaurant technology ex-ecutives identify with this objective. How-ever, “customer engagement / guest loyalty” has become a true contender for technology motivation in the minds
Tracking the size and allocation of tech-nology budgets provides an objective measurement of trends. It can be used as a tool to help CIOs and CFOs bench-mark their own technology spending against industry averages. It allows for self-reflection with the question, “Are our competitors spending more or less on certain types of systems than we are?” The budgets that make their way to paper and approval, however, have far less finite beginnings. They’re rooted in a company’s bigger-picture goals, and are influenced by subjective factors such as corporate culture and executive beliefs.
In this section of the report, we inves-tigate some of those subjective areas. We look at how innovation is perceived by the organization and ask about pro-cesses that might support or hinder the IT decision-making process, for example the use of an IT steering committee. By examining some of these subjective fac-tors, we can track patterns in perception and expose ways that restaurants might be able to improve their overall approach to decision making.
Technology objecTives& chAllengesIn restaurants, technology has histori-cally been used to streamline operations and create efficiencies. Funding is fun-neled to systems that enable transac-tions, track inventory and manage labor. Last year’s Restaurant Technology Study revealed evidence of a shift beginning to take shape in the way technology dollars were being spent. Rather than prioritiz-ing the tried-and-true efficiency systems, roll-out plans focused on technology that would directly impact the service experi-ence; things like customer mobile apps and social CRM rated high on restau-rants’ “to-do” lists.
This shift in project focus was a wel-come change for an industry that has long been criticized as a technology laggard. There was a caveat, however. The study also showed that, for many restaurants, there was a disconnection between strategy and tactic. Here’s why: restaurants were developing tactical technologies to impact the customer experience, but many hadn’t yet aligned
Measuring Perception: What’s Driving Technology in 2015customer-centric goals become top priorities
business efficiency
customer engagement / guest loyalty
security / compliance (eMv, Pci and payments)
cost-saving measures
enhanced guest service
employee productivity
revenue-generating opportunities
social responsibility
competitive pressure
what’S drIvIng tech projectS In 2015?
68%66%
23%40%
38%38%
33%34%
59%32%
26%9%
0%2%
6%
2015 2014
creating better customer engagement
has aligned withtechnology goals, this
year driving 53% of iT projects.
47%53%
21%

www.htmagazi n e.com R e stau Rant tech noLogY stu dY 2015 « hospitaLitY tech noLogY « 15
ables this study measured, there are two ties and six of the variables fall within a 10-point range. This suggests that res-taurant executives struggle with multiple challenges and aren’t easily able to iden-tify which are most pressing. This makes outliers even more meaningful.
The take-away: restaurants are fo-cused on rolling out customer-centric tech. For many, technology budgets have received the needed boost to accom-modate new projects in 2015. Technol-ogy leaders are shifting their focus away from “keeping the lights-on” toward be-ing a lightning-rod for customer engage-ment. This is good news, given how quickly mobile technology has changed consumer expectations when dining out. For restaurants, it’s time to embrace the technology, or risk losing market share to those who do.
innovATion: resTAurAnTs find fooTing on shAky groundRestaurants aren’t known for a willing-ness to experiment with new technolo-gies. For many restaurants, the core business is based on human interac-tion and personal service. Many a board room discussion tangled with the po-tential of some newfangled technology project to disrupt a high-touch service approach. At HT’s 2014 Restaurant Executive Summit, a panel of CEOs de-bated the most appropriate way to use tableside ordering technology. One said not at all, another said that in the hands of the server it can be a boon; and the third was supportive of table-mounted devices with which customers would in-terface directly. While operational models will influence what’s best for an individual
pectations is now an even greater chal-lenge for IT leaders than measuring ROI for their projects.
Technology leaders are taking in-creased accountability in guest-centric strategy. This also aligns with what we’ve seen in the lodging industry. In HT’s Lodging Technology Study, “keep-ing pace with guest expectations” over-took “lack of necessary budget” as the top challenge three years ago, and has remained hotels’ number-one challenge since that time. The gap between fund-ing and guest expectations is shrinking for restaurants, too. Last year, there was a 25-point gap between the two. This year, the gap is just 11 percentage points.
Fewer executives say their company doesn’t embrace technology — just 13% this year, compared to 23% last year. It’s also worth noting that of the 11 vari-
of IT leaders, this year driving 53% of IT projects. It’s now in second place among all the metrics HT measures. In fact, en-abling customer engagement overtook both “security/compliance” (which also saw a jump in importance this year) and “employee productivity” (which dropped significantly down the list).
This aligns with what restaurants tell us is a key challenge impacting technol-ogy. Survey respondents were asked to identify what factors are having the most detrimental impact on their technology efforts. A lack of funding took first place on the list, with 49% of restaurants say-ing that their company’s technology bud-get is insufficient. In second place on this year’s list, 38% of respondents said that “guests expect greater technology than we can keep pace with.” This challenge moved up one spot from last year’s third-place ranking. In fact, meeting guest ex-
1 7 t h A N N U A L
top challengeS facIngtechnology teamS
of the 11 variables this study measured, there are two ties and six of the vari-ables fall within a 10-point range. This
suggests that restaurant executives struggle with multiple challenges
and aren’t easily able to identify which are most pressing. This
makes outliers even more meaningful.
2015 2014
TOP TIER
Tech budgets are insufficient to . . . . . . . . . . . . . . . . . . . . 49% 58%keep pace with needed investments
guests expect greater technology . . . . . . . . . . . . . . . . . . 38% 33%than we can keep pace with
Migration from legacy systems . . . . . . . . . . . . . . . . . . . . 34% 33%
it is difficult to measure roi . . . . . . . . . . . . . . . . . . . . . . 32% 53%
MID TIER
we lack iT talent in our internal team . . . . . . . . . . . . . . . . 23% 31%
There is huge resistance to change in organization . . . . . . . . 21% 33%
resistance from franchisees to invest in new technology . . . . 21% nA
LOW TIER
The technology itself is insufficient to meet our needs . . . . . . 17% 25%
inaccessible data as a result of poor system integration. . . . . . . 17% nA
our company philosophy does not embrace technology innovation. . . 13% 23%
lost revenue as a result of poor system integration . . . . . . . . 11% nA
1 7 t h A N N U A L

1 7 t h A N N U A L
ChAPtER 2: tEChNOLOGY StRAtEGIES
16 « hospitaLitY tech noLogY « R e stau Rant tech noLogY stu dY 2015 www.htmagazi n e.com
participants rated their companies as “reactors,” the least innovative category on our scale: just 2% said they are busi-ness reactors and 17% said they are technology reactors. This year, not one participant identified their company a “reactor” to either business or technol-ogy. A growing number of restaurants were ranked as “close followers” in tech-nology compared to prior years.
While there’s still a gap in perception, for the first time we see real evidence of that gap shrinking. Ideally, we’d like to see innovator rankings for business and technology become fairly even. Technol-ogy is a core tool, inherent even, to en-abling business innovation — whether via customer-centric solutions, employee productivity, or back-of-house efficiency. The more restaurants continue to em-brace technology as an enabler to busi-ness innovation, the more aligned we’ll
brand, it’s clear that restaurants tread lightly with anything that may get in the way of a personal service experience.
This study seeks to measure the in-dustry’s hesitation in embracing tech-nology. Survey participants are asked to evaluate their company’s approach to technology through answering the question, “Are we innovators?” Histori-cally, when it came to business innova-tion, most overwhelmingly said “yes” and when it came to technology innovation, they said “no.” This year, when asked about technology innovation, they tenta-tively raised a hand and said “maybe.”
Here’s how it shakes out. Participants are asked to rank their companies’ business and technology innovation, separately, on a scale of four possible categories: an innovation leader, a close follower, a distant follower, or a reactor that only follows market trends. Since HT first started tracking perceptions around business or technology innovation, there’s been a notable gap between the two. Restaurants are far more willing to embrace business innovation than they
are to embrace technology innovation.In last year’s report, about half of
participants (49%) said they considered their company to be leader among res-taurants in business innovation. Far few-er (22%) said they consider their compa-ny to be a leader among restaurants in technology innovation. At the other end of the spectrum, 22% said they consider their company to be a distant follower. This year, the innovation needle moves in the right direction. A growing number (57%) consider themselves leaders in business innovation, and just over a third (36%) say their company is a technology innovator. Not only did both groups move upstream, the gap between business and technology innovation also shrank by six percentage points.
We see further evidence that restau-rants are willing to shed the laggard moniker. Last year a small number of
InnovatIon gap Slowly ShrInkIng
StrategIc uSe of technology: how doeS your reStaurant Stack upto competItorS?
20152014
leader inbusinessinnovation
leader inbusinessinnovation
57%49%
36%
34% 40% 26%BETTER SAME AS BEHIND
leader intechnologyinnovation
leader intechnologyinnovation
22%
fewer executives say their company doesn’t embrace technology – just 13% this year, compared to 23% last year.
Good news:

way through to front-line managers. In restaurants, these groups might also in-volve a select number of franchisees. To be effective, IT steering committees need to have teeth. They should have clear mandates with a written charter, and a genuine ability to influence decisions.
Similarly, most restaurants don’t see the link between technology and their company’s “mission.” This year, only 19% of restaurants say IT is referenced in their organization’s mission state-ment. We do, however, see a slow but steady positive trend, as this number was 9% a year ago.
To better understand this indicator, it’s important that mission statements not be confused with vision statements. Vision statements are the “North Star” for an organization. They offer a succinct picture of where the company wants to be over time; it’s an optimal future state. The mission statement, however, lives in the present, concisely articulating an or-ganization’s purpose today, and typically covers what the organization does, who it does it for, and how it does it. There’s no singular confirmed best way to craft a mission statement, and indeed they should reflect the character of the indi-vidual organization rather than follow a canned formula. Business strategists do agree that employees should know their company’s mission statement because it affords them a better understanding of their role in achieving goals.
In the restaurant industry, the greater mission is certainly to provide consum-ers with a great meal and service expe-rience, hopefully one that exceeds their expectations. If technology is a key fac-tor in how restaurants plan to meet that objective, then including a reference to that end in the mission statement will help technology become an integrated and influential business unit rather than a support team.
In the next section, the report takes a detailed look at the specific technology rollouts that are a top priority for 2015 and beyond. •
see these numbers. Those that can raise their hands with a resounding “yes” to both technology and business innovation will be the same that are making head-way in transitioning technology budgets away from just running the business, to-wards business growth and transformation.
As a follow-up, survey participants were asked how they measure their own company’s strategic use of technology compared to competitors. About 34% say they do this better than their com-petitors, 40% say they are on par, and 26% say they lag behind competitors. When comparing this year’s spread to last year, there’s a noticeable shift: more restaurants consider themselves to be lagging behind their competitors — 25% this year, compared to just 14% last year. This may well be a case of “keeping up with the Jonses.” Despite a greater will-
ingness to be technology innovators, there’s a fear that competitors are doing it better and faster, and so restaurants rate themselves critically. Concerns over competitive pressure help keep the heat on and encourage restaurants to see the value of technology as a way to offer con-sumers choice, rather than being seen as a detriment to the service experience.
how decisions Are MAde: Tech coMMiTTees & coMPAny MissionWe’ve established that technology in-vestments in the restaurant industry are increasing, and that guest expectations are a key driver. With the pressure on to invest wisely, are there ways that restau-rants can shift their strategies to con-tribute to more successful technology projects? To look for answers, the study measures several factors that can influ-ence IT decision-making: namely, the use of IT steering committees, and the integration of technology into the overall mission statement.
Only 31% of the restaurants in this study use an IT steering committee. While on par with HT’s findings in the lodging industry (32%), it’s still less than the average for organizational stan-dards. A survey by Info-Tech Research Group found that 41% of small compa-nies (sized between one and 250 em-ployees) use IT steering committees, and 63% of larger companies (with between 251 — 1,000 employees) use IT steering committees. IT steering committees are small in nature and typically involve dif-ferent members of the organization, from the CEO, to business-unit leaders, all the
18 « hospitaLitY tech noLogY « R e stau Rant tech noLogY stu dY 2015 www.htmagazi n e.com
doeS your company uSe a technology SteerIng commIttee?
31%4%
65%
yESI DON’T kNOW
NO
two opportunItIeS for Improvement
1 2consider forming an IT steering committee. just 30% of restaurants do this, far behind the industry average. small groups with real teeth to influence decisions are best.
link technology to the overall mission. just 19% of restaurants reference technology in their mission statement. if technology is a valuable differentiator in how your company attracts and serves guests, then say so.
1 7 t h A N N U A L
ChAPtER 2: tEChNOLOGY StRAtEGIES

ments — including front-of-house, back-of-house and security technologies — that restaurants are planning to roll out in 2015 and beyond. Planned invest-ments are measured against current installation levels to see what technolo-gies are gaining traction. As a follow-up, restaurant executives share insight into how important some of these technolo-gies are to their companies.
Technology adoption is noted on a scale that ranges from early adoption, all the way up through market saturation. The scale is as follows: technologies with an in-stallation base of less than 15% are con-sidered to be in early adoption. At between 15% and 50% installation rates, a technol-ogy is gaining momentum. Between 51% and 75%, the technology is becoming stan-dard; at 75% it’s mature; and at 85% in-stallation rates, a technology is considered saturated within the market.
fronT-of-house TechnologyIn prior years, when measuring installa-tion rates for a variety of front-of-house (FOH) technologies, we found that point of sale systems had hit market satura-tion. In the 2014 report, for example, they were at 92% installation rates. For that reason, we chose not to measure POS installation rates this year, allowing for increased focus on emerging technol-ogies, such as the use of beacons, cus-tomer mobile apps, smart printers, and belt-clip based printing. POS installation rates will be measured every other year in this study as a check-in.
This year’s report measured 19 differ-ent FOH technologies in all. Survey par-ticipants were asked to rank each of the 18 technologies with the following instal-lation status: currently using; have plans to add within the next year; have plans to add within the next one to two years; or no plans to add.
ChAPtER 3: tEChNOLOGY INvEStmENtS
20 « hospitaLitY tech noLogY « R e stau Rant tech noLogY stu dY 2015 www.htmagazi n e.com
Restaurants are spending more on technology in 2015. While business ef-ficiency is still their number-one motiva-tor for technology investments, customer
engagement/guest loyalty is becoming increasingly important to technology teams. In this section, we take a closer look at the specific technology invest-
Tracking Current Installation and Planned RolloutsFrom the front to the back of the house, mobile tech takes hold; security solutions are most important
store wi-fi
Touch screen
online ordering
Menu labeling/nutritional information
social crM Platform
Take-out/delivery system
customer Mobile App
digital signage
biometrics fingerprint reader
cloud-based Pos
energy efficient Pos
barcode scanners
smart Printers (receipt printer with integrated Pc)
wireless credit card Authorization
near field communications (nfc)
Mobile wallet
Tableside Payment devices
beacons
belt-clip / on-the-go Printing
currently using Plan to Add in 2015
front-of-houSe tech:current uSe & 2015 rollout planS
74%
72%
46%
43%
41%
41%
40%
39%
33%
28%
28%
26%
24%
20%
18%
15%
11%
13%
4%
13%
18%
30%
18%
15%
9%
13%
13%
15%
16%
27%
29%
37%
28%
29%
13%4%
7%
Thesetechnolo
gies
are poised for
growth in 2015
11%

1 7 t h A N N U A L
www.htmagazi n e.com R e stau Rant tech noLogY stu dY 2015 « hospitaLitY tech noLogY « 21
of the iPhone to use it, and that’ll take time. Meanwhile, the MCX Exchange has plans to release its CurrentC payment application sometime in 2015. The list of contenders doesn’t stop there. Mo-bile Payments Today released its “Mobile Wallet Comparison Guide for 2015.” The Guide is 61 pages, and details the capa-bilities of 151 “leading mobile wallets.” It’s still possible that this is anyone’s game to win.
According to HT’s study, currently, only 15% of restaurants accept mobile wal-let, up from the 7% installation base in the 2014 study. Looking ahead, 37% are planning to add mobile wallet in 2015, and an additional 17% will focus on this for 2016.
Looking at last year’s report, 2014 marked a year of growth for social re-wards/social CRM. In the 2014 report, 23% of restaurants had the ability to track and reward social media activity through their loyalty/CRM tool. Restau-rants then indicated that social CRM would be an area of focus for 2014, sec-ond only to mobile wallet for 2014 instal-lation plans. History proves they made good on this plan, with current installa-tion rates for social CRM up 18 percent-age points year-over-year, at a 41% in-stallation base in 2015. Looking ahead, another 30% of restaurants plan to focus on this capability in 2015.
Another hot topic for 2015 will be table-side payment devices. About 13% of res-taurants in the HT study currently offer tableside payment, but 29% say they’re looking at this technology in 2015.
bAck of house & securiTyTechnologiesIn restaurants, the back of the house is traditionally where technology has lived. This is the already-explored frontier for creating business efficiency, and for that reason several of the technologies this report historically measured have reached market saturation and were taken off of the evaluation list for 2015.
and location-based marketing using beacon technology. While only 11% of restaurants currently use location-based technology, 28% plan to add it in 2015, and an additional 20% say they’ll focus on this for 2016.
Like all other merchants, restaurants are watching the mobile wallet race with interest. Deloitte predicts that the use of mobile phones for making in-store pay-ments will grow by 1,000 percent dur-ing 2015, marking what the firm calls a “mass-market tipping point for NFC- enabled transactions.” Forrester fore-sees the mobile payments industry in the U.S. will be worth $142 billion by 2019. Currently, there are far too many solu-tions available for any single to emerge as the lead player. Although Apple Pay is gaining substantial media attention, con-sumers need to have the latest release
Two technologies stand out for having the highest current installation rates: in-store Wi-Fi (74%) and touch screens (72%). Both of these fall into the “becom-ing standard” range, and are very much on the cusp of hitting maturity. Based on 2015 installation plans, we expect they’ll reach maturity within the year.
The bulk of FOH technologies — 14 out of the 18 this report measured — fall into the “gaining momentum” category, with current installation rates ranging between 15% and 50%.
The greatest insight can be gleaned by looking at those technologies that are poised for growth within 2015, and look-ing slightly longer term, those that will spike in 2016. The participants in this study have substantial installation plans around mobile wallet, social CRM, the use of near-field communications (NFC),
company intranet
enterprise reporting
disaster recovery Plan for Technology systems
integrated / iP video for security
real-Time, web-based reporting
enterprise Management/enterprise resource Planning
Menu Analysis
labor screening and recruitment Tools
business intelligence
kitchen displays
customer relationship Management system
kitchen Management
food safety Management solution
Mobile device for Manager use
big data
72%
71%
70%
67%
63%
59%
57%
50%
50%
50%
48%
46%
40%
30%
30%
4%
11%
17%
11%
15%
13%
11%
22%
17%
11%
17%
15%
24%
30%
24%
Back-of-houSe technology:current uSe & 2015 rollout planS
currently using Plan to Add in 2015
Thesetechnolo
gies
are poised for
growth in 2015
1 7 t h A N N U A L

1 7 t h A N N U A L
POS software and hardware that, these days, must meet stringent PCI Compli-ance guidelines. Security and compliance ranked third on our list of “Top Business Goals Driving IT Projects” and grew in im-portance compared to last year.
To find out what specific elements of security restaurants will focus on in 2015, survey participants were provided a list of eight different technologies and strate-gies, including things like the use of point-to-point encryption and tokenization, as well as the use of breach insurance and maintaining a detailed privacy policy.
The biggest focus area will be EMV preparedness. About 40% of restaurants say that they have a well-defined road-map for making the migration. While this is an improvement over the 26% that could say the same last year, it still leaves more than half of the industry feeling unprepared, with the clock tick-ing. It’s a big focus area, with an addi-tional 35% of restaurants saying they’re going to have a transition plan ready this year. Red flag: that still leaves about 25% of restaurants admitting that they will not be ready when the liability shift takes place in October 2015.
Other focus areas for security in 2015 include tokenization at the card swipe, point-to-point encryption, the encryption of all customer data, and the purchase of breach protection/insurance.
iMPorTAnce of eMerging TechnologyA new feature was added to the research survey this year to track the perceived
These include: accounting and financial systems, time and attendance, kitchen printers, labor management, and inven-tory management software. These tech-nologies all had installation rates of ap-proximately 80% or higher in 2014.
Of the 15 BOH technologies we mea-sured, ten have installation rates of 50% or higher, meaning that these technolo-gies are becoming standard. This is a no-ticeable contrast to the FOH list, where of the 18 technologies measured, only two had an installation rate of 50% or higher (store Wi-Fi and touch screens at the POS). These figures reinforce that technology has long been a behind-the-scenes tool used to keep the prover-bial lights on, and the literal systems functioning. Looking ahead, the biggest growth areas for BOH technology will be the addition of mobile devices for mana-gerial use. About 30% of restaurants provide mobile devices to their manag-ers to access store applications, and another 30% are looking at adding this
technology in 2015. Other BOH priorities in 2015 include the use of big data, and a food safety management solution.
In a year-over-year comparison of actu-al installation rates from 2015 to 2014, a few technologies saw notable spikes, among them: the use of ERP systems, real-time, web-based reporting, enter-prise reporting, and the development of a disaster recovery plan for technology systems. All of these technologies grew by at least 15 percentage points over the course of 2014.
This is the year that the EMV liability shift will take effect, making security re-lated solutions top-of-mind for all mer-chants, restaurants included. Although the impact will be different due to the nature of card-not-present transactions in restaurants, technology upgrades still need to be done. When looking at the overall distribution of technology spend, security solutions account for 15% of the overall budget, but that doesn’t necessar-ily include investments made in general
22 « hospitaLitY tech noLogY « R e stau Rant tech noLogY stu dY 2015 www.htmagazi n e.com
payment SecurIty:current uSe & 2015 rollout planS
Maintain a policy that addresses information security for employees and contractors
use a managed services providerfor network security
detailed privacy policy regarding the use of customer information
Point-to-Point encryption (P2Pe)
encrypt all customer data
Tokenization at the card swipe
Purchased breach protection / insurance
well-defined roadmap for eMv preparedness
currently using Plan to Add in 2015
73%
64%
57%
52%
52%
48%
48%
40%
13%
14%
16%
27%
23%
32%
20%
35%
restaurants will not have an EMV planready when the liability shift takes placein October 2015.
1 in 4
ChAPtER 3: tEChNOLOGY INvEStmENtS
RED FLAg
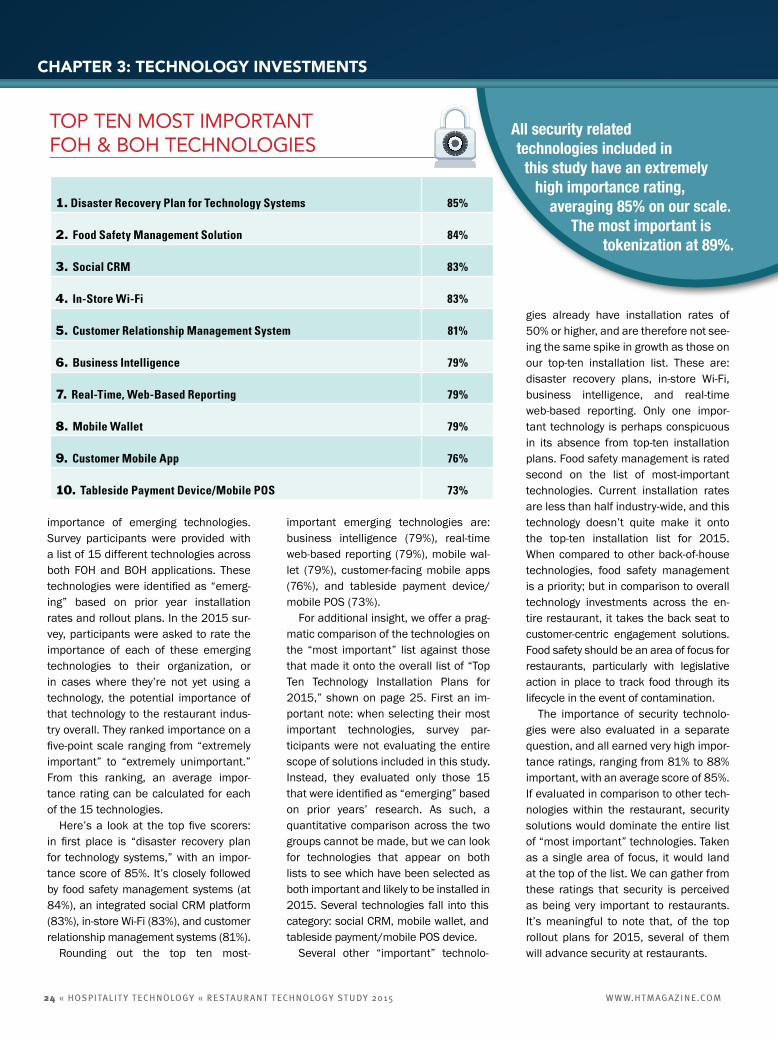
All security relatedtechnologies included in
this study have an extremely high importance rating,
averaging 85% on our scale. The most important is
tokenization at 89%.
24 « hospitaLitY tech noLogY « R e stau Rant tech noLogY stu dY 2015 www.htmagazi n e.com
gies already have installation rates of 50% or higher, and are therefore not see-ing the same spike in growth as those on our top-ten installation list. These are: disaster recovery plans, in-store Wi-Fi, business intelligence, and real-time web-based reporting. Only one impor-tant technology is perhaps conspicuous in its absence from top-ten installation plans. Food safety management is rated second on the list of most-important technologies. Current installation rates are less than half industry-wide, and this technology doesn’t quite make it onto the top-ten installation list for 2015. When compared to other back-of-house technologies, food safety management is a priority; but in comparison to overall technology investments across the en-tire restaurant, it takes the back seat to customer-centric engagement solutions. Food safety should be an area of focus for restaurants, particularly with legislative action in place to track food through its lifecycle in the event of contamination.
The importance of security technolo-gies were also evaluated in a separate question, and all earned very high impor-tance ratings, ranging from 81% to 88% important, with an average score of 85%. If evaluated in comparison to other tech-nologies within the restaurant, security solutions would dominate the entire list of “most important” technologies. Taken as a single area of focus, it would land at the top of the list. We can gather from these ratings that security is perceived as being very important to restaurants. It’s meaningful to note that, of the top rollout plans for 2015, several of them will advance security at restaurants.
importance of emerging technologies. Survey participants were provided with a list of 15 different technologies across both FOH and BOH applications. These technologies were identified as “emerg-ing” based on prior year installation rates and rollout plans. In the 2015 sur-vey, participants were asked to rate the importance of each of these emerging technologies to their organization, or in cases where they’re not yet using a technology, the potential importance of that technology to the restaurant indus-try overall. They ranked importance on a five-point scale ranging from “extremely important” to “extremely unimportant.” From this ranking, an average impor-tance rating can be calculated for each of the 15 technologies.
Here’s a look at the top five scorers: in first place is “disaster recovery plan for technology systems,” with an impor-tance score of 85%. It’s closely followed by food safety management systems (at 84%), an integrated social CRM platform (83%), in-store Wi-Fi (83%), and customer relationship management systems (81%).
Rounding out the top ten most-
important emerging technologies are: business intelligence (79%), real-time web-based reporting (79%), mobile wal-let (79%), customer-facing mobile apps (76%), and tableside payment device/mobile POS (73%).
For additional insight, we offer a prag-matic comparison of the technologies on the “most important” list against those that made it onto the overall list of “Top Ten Technology Installation Plans for 2015,” shown on page 25. First an im-portant note: when selecting their most important technologies, survey par-ticipants were not evaluating the entire scope of solutions included in this study. Instead, they evaluated only those 15 that were identified as “emerging” based on prior years’ research. As such, a quantitative comparison across the two groups cannot be made, but we can look for technologies that appear on both lists to see which have been selected as both important and likely to be installed in 2015. Several technologies fall into this category: social CRM, mobile wallet, and tableside payment/mobile POS device.
Several other “important” technolo-
top ten moSt Important foh & Boh technologIeS
1. disaster recovery Plan for Technology systems 85%
2. food safety Management solution 84%
3. social crM 83%
4. in-store wi-fi 83%
5. customer relationship Management system 81%
6. business intelligence 79%
7. real-Time, web-based reporting 79%
8. Mobile wallet 79%
9. customer Mobile App 76%
10. Tableside Payment device/Mobile Pos 73%
ChAPtER 3: tEChNOLOGY INvEStmENtS

Across all the technology areas measured, these
10 have the highestratings for 2015
roll-out plans.
www.htmagazi n e.com R e stau Rant tech noLogY stu dY 2015 « hospitaLitY tech noLogY « 25
The big PicTure:securing A Mobile worldAn overall look at 2015 technology roll-out plans reinforce that customer-centric solutions will again be high on IT teams’ lists. Mobile continues to be a major in-fluencer of trends for both customer and employee-facing applications. The biggest planned investment area in BOH technol-ogy is to add mobile devices for manag-ers. In FOH tech, we anticipate we’ll see plenty of activity around mobile wallet, so-cial CRM, and location-based technology. All of these dovetail with mobility.
Despite pressure to deliver mobile solutions that create a more direct rela-tionship with guests, it’s ensuring secu-rity that keeps technology executives up at night. Perhaps the mash-up of activity is best shown visually. The word cloud shown here is what happened when sur-vey respondents were invited to share, in an open-ended response, their pick for the technology that will have the great-est impact on the multi-unit restaurant industry over the next three to five years. Security-related topics flooded the re-sponse field, from “PCI Compliance” and “EMV” to “Data Security.” In Hospital-ity Technology’s 2015 Industry Outlook (Jan/Feb 2015), HT’s editorial advisory board answered a series of open-ended questions about their rollout plans for 2015. Mobility and payments came to the top of the list. Many were hopeful that the intersection between the two — perhaps in a secure form of mobile wal-let — will ultimately reduce the security concerns they so obviously share with other members of the hospitality indus-try. Only time will tell. •
top 10 technology InStallatIon planS for 2015
Mobile wallet
creating an eMv roadmap
Tokenization at the card swipe
Mobile device for manager use
social crM
Tableside Payment device/Mobile Pos
nfc capability
beacons for location-based marketing
Point-to-point encryption
wireless credit card authorization
current install base 2015 roll-out Plans
15%
40%
30%
41%
13%
11%
52% 27%
20%
18%
48%
37%
35%
32%
30%
30%
29%
29%
28%
27%
1 7 t h A N N U A L
tech wIth BIggeSt Impact?The word cloud shown here is a representation of answers to the question, “what technologies do you think will have the greatest impact on the multi-unitrestaurant industry in the next 3 to 5 years?”
1 7 t h A N N U A L

1 7 t h A N N U A L
THe 2015 ResTAuRAnT TecHnoLogy sTudy is the 17th consecutive execution of this research, and is published annually by Hospitality Technology magazine. The study draws on the input and opinions of restaurant professionals who are opt-in email subscribers to Hospitality Technology magazine. Each year, the survey questionnaire is revised to ensure that emerging technologies and trends are tracked. In addition, the research team is able to provide extensive year-over-year analysis through comparison to prior results, making HT’s annual Restaurant Technology Study the most comprehensive and longest-running bench-marking report for technology in restaurants.
The survey for the 2015 report was set up as an online questionnaire and distributed dur-ing December 2014 to restaurant executives via personalized e-mails. Respondents reported that their respective organizations manage and/or own nearly 18,000 units restaurants, with representation spanning quick-service, at 55% of the sample (including both QSR and fast-casual brands), and full-service brands, at 43% of the sample. The remaining 2% classi-fied themselves as “other.” The respondent pool’s breadth of operations spans global corpo-rations (30%), national brands (23%), and regional chains (47%). Non-franchised restaurant operators account for 46% of respondents; 48% are franchisors; and 7% are franchisees.
In terms of annual revenue, 36% of respondents work for companies with earnings of less than $50 million; 16% have annual revenue of between $50 and $99 million; 26% are be-tween $100 million and $499 million; 9% are between $500 million and $999 million; and 13% have annual revenue of $1 billion or more.
Respondents’ job functions span a variety of areas, with the largest portion being informa-tion systems/technology management (43%). An additional 16% are in corporate manage-ment, and 15% are restaurant owners. The remaining 27% include a diverse mix of profes-sionals in financial management, sales and marketing and operations roles. As subscribers to Hospitality Technology magazine, all respondents have indicated having influence in tech-nology purchasing decisions.
In cases where respondents were allowed to select multiple responses to a question, to-tal percentages will exceed 100%. In cases of single-select response options, results were rounded to the nearest whole number and will equal 100%, +/- 1%.
Hospitality Technology is published by Edgell Communications. Research support was pro-vided by EKN Research, a division of Edgell Communications.
26 « hospitaLitY tech noLogY « R e stau Rant tech noLogY stu dY 2015 www.htmagazi n e.com
• FIFtEENth ANNUAL •• S E V E N T E E N T H A N N U A L •
Research Partner
mEthODOLOGY

Hospitality Technology thanks the sponsors of the 2015 Restaurant Technology Study. Their support makes this valuable research possible.
Research Partner
• FIFtEENth ANNUAL •• 2 0 1 5 • S E V E N T E E N T H A N N U A L •