techno-economic assessment for generation iii+ small
TRANSCRIPT
000000
PNNL-30225
Techno-economic Assessment for Generation III+ Small Modular Reactor Deployments in the Pacific Northwest
April 2021
Mark R. Weimar, Ali Zbib, Don Todd, PNNL;
Jacopo Buongiorno, Koroush Shirvan, MIT
Prepared for the U.S. Department of Energy
under Contract DE-AC05-76RL01830
Choose an item.
DISCLAIMER
This report was prepared as an account of work sponsored by an agency of the
United States Government. Neither the United States Government nor any agency
thereof, nor Battelle Memorial Institute, nor any of their employees, makes any
warranty, express or implied, or assumes any legal liability or responsibility
for the accuracy, completeness, or usefulness of any information, apparatus,
product, or process disclosed, or represents that its use would not infringe
privately owned rights. Reference herein to any specific commercial product,
process, or service by trade name, trademark, manufacturer, or otherwise does not
necessarily constitute or imply its endorsement, recommendation, or favoring by
the United States Government or any agency thereof, or Battelle Memorial
Institute. The views and opinions of authors expressed herein do not necessarily
state or reflect those of the United States Government or any agency thereof.
PACIFIC NORTHWEST NATIONAL LABORATORY
operated by
BATTELLE
for the
UNITED STATES DEPARTMENT OF ENERGY
under Contract DE-AC05-76RL01830
Printed in the United States of America
Available to DOE and DOE contractors from the
Office of Scientific and Technical Information,
P.O. Box 62, Oak Ridge, TN 37831-0062;
ph: (865) 576-8401
fax: (865) 576-5728
email: [email protected]
Available to the public from the National Technical Information Service
5301 Shawnee Rd., Alexandria, VA 22312
ph: (800) 553-NTIS (6847)
email: [email protected] <https://www.ntis.gov/about>
Online ordering: http://www.ntis.gov

PNNL-30225
Techno-economic Assessment for Generation III+ Small Modular Reactor Deployments in the Pacific Northwest April 2021 Mark R. Weimar, Ali Zbib, Don Todd, PNNL; Jacopo Buongiorno, Koroush Shirvan, MIT Prepared for the U.S. Department of Energy under Contract DE-AC05-76RL01830 Pacific Northwest National Laboratory Richland, Washington 99354

PNNL-30225
Abstract ii
Acknowledgments
We thank Paul Boyadjian, Jose Reyes, Rudy Murgo, Kent Welter from NuScale, Doug McDonald and
Martin Owens from GEH Hitachi, Greg Cullen and Don Gregoire from Energy Northwest, and Mason
Baker from Utah Association of Municipal Power Systems (UAMPS) for their input on the content of this
report.
PNNL-30225
Abstract iii
Abstract
Legislative changes in the Pacific Northwest (PNW), notably in Washington State, are driving the
electricity sector to be carbon neutral by 2030 and ultimately carbon free by 2045. The legislative changes
have renewed interest in nuclear power as a sustainable, carbon-free source of baseload electricity. The
renewed interest aligns with the U.S. Department of Energy’s objectives of restoring U.S. leadership in
nuclear energy and accelerating the deployment of nuclear power plants, including small modular reactors
(SMRs), in the United States. Thus, Pacific Northwest National Laboratory (PNNL) in collaboration with
the Massachusetts Institute of Technology, conducted a study that evaluated siting Gen III+ SMR
concepts in Washington State. The study evaluated the market changes in consideration of Washington
State’s legislation. The study included the integration of advanced reactor concepts in a clean energy
portfolio. The legislative changes along with projected levelized costs of energy and the projected
electricity market were analyzed to determine the feasibility of introducing SMRs to meet the goals of
zero carbon emissions. Five case studies were analyzed combining two SMR technologies and three
potential sites: The NuScale SMR was evaluated at three potential sites and the GEH BWRX-300 was
evaluated at two potential sites. The first case study evaluated NuScale at the Idaho National Laboratory
as a potential Utah Association of Municipal Power Systems project. Case 2 evaluated a NuScale SMR at
the Energy Northwest site (Site 1) in eastern Washington State. The third case study evaluated placing a
GEH BWRX-300 at Site 1 with the same cost reductions as the NuScale Plant. Cases 4 and 5 evaluated
NuScale and an GEH BWRX-300, respectively, at the current Centralia coal plant site. Although
Levelized Costs of Electricity (LCOEs) were developed for both NuScale and GEH, the sets of LCOEs
are not comparable. NuScale’s estimate is based on the current design. GEH is using a design-to-cost
methodology with target pricing that is being confirmed as the design matures. The feasibility study
indicated that in a future carbon-free electricity sector, deployment of advanced SMRs would be
competitive if the projected LCOEs for these designs can be attained. An LCOE in the range of
$51/MWh–$54/MWh was calculated for the NuScale design using NuScale’s design estimates. An LCOE
in the range of $44–$51/MWh was calculated for the BWRX-300 using GEH’s design-to-cost and target
pricing input.

PNNL-30225
Abstract iv

PNNL-30225
Executive Summary v
Executive Summary
Legislative changes in the Pacific Northwest, notably in Washington State, are driving the electricity
sector to be carbon neutral by 2030 and ultimately carbon free by 2045. The legislative changes have
stimulated renewed interest in nuclear power as a sustainable, carbon-free source of firm, flexible
electricity. The renewed interest aligns with the U.S. Department of Energy’s objectives of restoring U.S.
leadership in nuclear energy and accelerating the deployment of nuclear power plants including small
modular reactors (SMRs) in the United States (U.S.). Thus, Pacific Northwest National Laboratory
(PNNL) and the Massachusetts Institute of Technology (MIT) conducted a study that evaluated the value
proposition of deploying Generation (Gen) III+ SMRs advanced reactor concepts in the Pacific
Northwest.
The feasibility study indicated that in a future carbon-free electricity sector, deployment of advanced
SMRs would be competitive if the projected LCOEs for these designs can be attained. An LCOE for an
nth-of-a-kind (NOAK) SMR in the range of $51/MWh–$54/MWh was calculated for the NuScale design
using NuScale’s design estimates. An LCOE in the range of $44–$51/MWh was calculated for the
BWRX-300 using GE-Hitachi’s (GEH’s) design-to-cost and target pricing input. All results are in 2019$
with the exception of Utah Association of Municipal Power Systems’ (UAMPS’) price of $55/MWh,
which is in 2018$. The NuScale and GEH BWRX-300 LCOEs are not intended to be directly compared
in this study. NuScale’s estimate is based on the current design. GEH is using a design-to-cost
methodology with target pricing that is being confirmed as the design matures. Whether there needs to be
a subsidy for the NOAK plant to enter the market depends on the price and quantity of competing
resources, the size of the future market, the quantity of non-emitting resources that need to be replaced,
and whether the UAMPS subscription price indicates that municipal utilities are willing to purchase firm
electricity at $55/MWh. In addition, the quantity of future non-emitting capacity depends on the amount
of emitting resources Washington utilities must replace, the availability and cost of unbundled renewable
energy credits (RECs), and the quantity of energy conservation projects that have a positive net present
value. Utilities can substitute up to 20 percent of the total sales with unbundled RECs and energy
conservation projects through 2045.
A study of the Pacific Northwest electricity market showed significant variation in load on a monthly,
daily and even 5-minute increment basis. An emerging clean energy market with a significant penetration
of variable and intermittent renewable energy sources will require additional flexible power sources to
address the load fluctuations. In addition to being a source of baseload power, these advanced nuclear
reactor concepts are being designed with attributes that will address the characteristics of the emerging
clean energy markets including flexible operation, black start capabilities, and island mode operation,
which will help augment the variable and intermittent sources.
SMRs may face competition from other firm power sources. The Energy Information Administration
(EIA) estimates geothermal entering the market in 2025 at $37/MWh (2019$), while advanced
geothermal is estimated to cost $47/MWh (2019$). Entities can get a $2/MWh tax credit that reduces the
cost to $35–$45/MWh if the project is properly structured. All estimates are probably in the same error
range. Natural gas combined cycle (NGCC) power could be purchased between 2030 and 2045 at a
penalty price of $97/MWh. These two resources bound the market for firm resources. If NGCC is
required, no subsidy would be required because NGCC would set the market price. However, near-firm
renewable resources could provide a portion of the energy required by the time the first SMR reaches
commercial operation. Variable renewable resources with batteries or other storage could provide
approximately 4 percent of the firm power requirements at current prices. According to two separate MIT
studies, wind plus battery could provide between 16 and 95 percent of firm power requirements in the
future at battery prices of about $150/MWh.
PNNL-30225
Executive Summary vi
UAMPS suggested an exchange agreement with Bonneville Power Administration (BPA) to reduce
current pancaking1 transmission costs. With BPA’s entry into the Energy Imbalance Market (EIM), a
potential for a Western Electricity Coordinating Council (WECC) area-wide market, and assuming the
potential one balancing authority like the Midwest Independent System Operator, the probability of
having a larger wholesale power market increases. With a wider wholesale power market, energy could
flow inexpensively from other EIM areas with an abundance of solar and wind at significantly reduced
transmission costs. Only one transmission cost is applied rather than pancaking the transmission costs
without the EIM and a wider wholesale market. One issue that will need to be understood is how the state
of Washington will handle the mix of electricity coming over the transmission system, which will include
carbon-emitting resources. The benefits of the EIM could be exemplified by the UAMPS shipping power
to Washington State. The EIM reduces the overall transmission costs from Idaho to BPA from $24/MWh
to $4/MWh.
The estimated market capacity derived from replacing carbon-emitting resources is about 5 GWe. With a
growing population and increasing electric vehicle (EV) penetration, the capacity requirement could be
larger. Near-firm production provides a narrow range for geothermal and SMRs to fill because near-firm
generation could provide up to 5 GWe, which is the current coal and natural gas generating capacity in
Washington State.
In a Day-Ahead Market like the California Independent System Operator’s (CAISO’s), the marginal cost
of providing energy provides the supply curve for electricity delivery. As such, geothermal and SMRs
would enter the market up to the quantity meeting their marginal costs. Everyone would receive the
highest bid price. The price obviously does not cover long-run costs, but the expectation is that power
shortages over time will provide prices high enough to cover the costs. In this scenario, no subsidy would
be required. Under the current system each Balancing Area Authority is responsible for assuring their
loads are balanced.
Bilateral agreements such as those occurring with UAMPS and subscribers to their plant are another
approach to determining if a subsidy is required. Subscribers will purchase a mix of generation to meet
their energy needs. If the UAMPS subscription target is an indicator, utilities appear to be willing to pay
$55/MWh for firm power, which indicates that a subsidy in the range $15–$30/MWh is required for the
first-of-a-kind (FOAK) plant depending on the assumptions used to derive the subsidy. This also suggests
that if the price of the NOAK plant is below the $55/MWh target, utilities might not need any further
subsidy for firm power. If the price for SMR electricity is higher, then a subsidy would be required to
bring the cost down to the point where utilities would buy the power. In addition, if the project can be
properly structured, the production tax credit could be potentially sold, which would provide an
approximate $7/MWh subsidy according to EIA, This indicates that if both NuScale and GEH can reach
their estimates for an NOAK plant they would need no additional subsidy.
Energy Northwest (ENW) is evaluating adding SMR capacity in Washington State. ENW, formerly the
Washington Public Power Supply System, was formed in 1957 and has a history of providing nuclear
power. It operates the Columbia Generating Station (CGS), a boiling water reactor (BWR) that is just
north of Richland, Washington, on a site that includes another partially built nuclear power plant. The
CGS produced power for $35.6/MWh and $47.6/MWh in fiscal year (FY) 2018 and FY 2019,
respectively. The fluctuation depends on refueling outages and other activities (ENW 2019). The
projected LCOE (2014–2043) is between $47/MWh and $52/MWh (ENW 2020). They are selling power
at cost to the BPA.
1 Pancaking refers to each transmission owner adding their transmission costs to the Power Purchase Agreement
price.

PNNL-30225
Executive Summary vii
This study evaluated the market changes considering Washington State’s legislation. The legislative
changes along with projected LCOEs and the projected electricity market were analyzed to determine the
feasibility of introducing Gen III+ SMRs to meet the goals of zero carbon emissions. Five cases studies
were analyzed:
• The first case study evaluated a NuScale SMR at the Idaho National Laboratory (INL) site as a
potential UAMPS project. The INL site is currently under development and UAMPS provided a
Power Purchase Agreement (PPA) price and suggested a way to get the electricity to Washington
State at lower costs.
• Case 2 evaluated a NuScale SMR at ENW’s Site 1 in eastern Washington State. The site was
previously evaluated for construction of a light water reactor (LWR) nuclear power plant. Cost
reductions associated with leveraging the existing infrastructure and documentation on the site, the
benefits of building the plant in proximity to an operating BWR (CGS), and the benefits of
constructing a plant in an area that already has a skilled nuclear energy workforce were assessed.
• The third case study evaluated placing an GEH BWRX-300 at Site 1 with the same cost reductions
as those of the NuScale plant.
• Cases 4 and 5 evaluated NuScale and an GEH BWRX-300, respectively, at the site of the current
coal plant in Centralia, Washington.
As this report was being finalized, two awards for advanced reactor demonstrations were announced by
the U.S. Department of Energy: TerraPower’s Natrium reactor, a 345 MWe sodium-cooled fast reactor
with a molten salt thermal energy storage that can flex the power output to 500 MWe, and X-Energy’s
Xe-100 reactor, a 320 MWe (4-80 MWe modules) high-temperature gas reactor. The impact of these
projects on the future energy markets were not evaluated in this study.

PNNL-30225
Executive Summary viii
PNNL-30225
Acronyms and Abbreviations ix
Acronyms and Abbreviations
AAPS Alternate AC Power Source
AC alternating current
ADS accelerator driven system
ARPA-E Advanced Research Projects Agency–Energy
ASME American Society of Mechanical Engineers
B&W Babcock & Wilcox
BA Balancing Authority
BAA Balancing Authority Area
BPA Bonneville Power Administration
BWR boiling water reactor
CAISO California Independent System Operator
CCS carbon capture and sequestration
CETA Clean Energy Transformation Act
CFPP Carbon-Free Power Plant
CGS Columbia Generating Station
CMSR CUBE Molten Salt Reactor
DCA Design Certification Application
DoD U.S. Department of Defense
DOE U.S. Department of Energy
E3 Energy + Environmental Economics
EEDB Energy Economics Data Base
EIA Energy Information Administration
EIM Energy Imbalance Market
EIS environmental impact statement
ENW Energy Northwest
EPA U.S. Environmental Protection Agency
EPC Engineering, Procurement and Construction
EPR European Pressurized Reactor
EPRI Electric Power Research Institute
EPZ Emergency Protection Zone
ER Environmental Report
EV electric vehicle
FOAK first-of-a-kind
FRP full rate production
FTE full-time equivalent (employee)
GEH GE-Hitachi
PNNL-30225
Acronyms and Abbreviations x
GW gigawatt
HFC hydrofluorocarbon
HLH High Load Hour
HX heat exchanger
I&C instrumentation and controls
IAEA International Atomic Energy Agency
ICBM Inter-Continental Ballistic Missile
ICS isolation condenser system
INL Idaho National Laboratory
IOU investor-owned utility
IRR internal rate of return
ITC investment tax credit
kgHM kilogram(s) heavy metals
kgIHM kilogram(s) initial heavy metals
LCOE levelized cost of electricity
LCOH levelized cost of heat
LDV light-duty vehicle
LEU low-enriched uranium
LLH Light Load Hour
LMP Locational Marginal Price
LWR light water reactor
MIT Massachusetts Institute of Technology
MMBTU million British thermal units
MW megawatt(s)
MWh megawatt-hour(s), unless otherwise stated, it is megawatt-hour electric
MWhe Megawatt-hour(s) electric
MWht megawatt-hour(s) thermal
NA not available
NEI Nuclear Energy Institute
NG natural gas
NGCC natural gas combined cycle
NGNP Next Generation Nuclear Plant
NOAK nth-of-a-kind
NPCC Northwest Power and Conservation Council
NPM nuclear power module
NPP nuclear power plant
NRC U.S. Nuclear Regulatory Commission
NREL National Renewable Energy Laboratory

PNNL-30225
Acronyms and Abbreviations xi
NRIC National Reactor Innovation Center
NW northwest
O&M operations and maintenance
ORNL Oak Ridge National Laboratory
PAC PacifiCorp
PCU power conversion unit
PJM Pennsylvania Jersey Maryland Independent System Operator
PNNL Pacific Northwest National Laboratory
PPA Power Purchase Agreement
PTC production tax credit
PUD Public Utility District
PWR Pressurized Water Reactor
REC Renewable Energy Credit
RPV Reactor Pressure Vessel
SCO Strategic Capabilities Office
SG steam generator
SIE South Idaho Exchange
SMR Small modular reactors
SNF Spent Nuclear Fuel
SSC structures, systems, and components
SWU Separative Work Unit
TE Terrestrial Energy
TRL Technology Readiness Level
TWR Traveling wave reactor
UAMPS Utah Association of Municipal Power Systems
U.S. United States
USD U.S. dollars
WA Washington
WACC weighted average cost of capital
WADOE Washington Department of Ecology
WAPA Western Area Power Administration
WEC Westinghouse Electric Company
WECC Western Electricity Coordinating Council
WLFR Westinghouse Lead Fast Reactor
WNP-1 Potential SMR site north of Richland next to WNP-2; also called Site 1 in this
report
WNP-2 Columbia Generating Station

PNNL-30225
Acronyms and Abbreviations xii
Table of Contents
Abstract ........................................................................................................................................................ iii
Executive Summary ...................................................................................................................................... v
Acronyms and Abbreviations ...................................................................................................................... ix
Figures …………………………………………………………………………………………………...xiii
Tables …………………………………………………………………………………………………...xiv
1.0 Introduction ......................................................................................................................................... 1
1.1 Study Purpose and Scope .................................................................................................... 1
1.2 Clean Energy Transformation Act ...................................................................................... 2
1.3 Commercial Nuclear Energy in the Pacific Northwest ....................................................... 4
1.4 Report Contents and Organization ...................................................................................... 4
2.0 Review of Nuclear Power Plant Characteristics.................................................................................. 5
2.1 Electrical Generating Characteristics Relevant to the Emerging Clean Energy
Market ................................................................................................................................. 5
2.1.1 Beyond Baseload ................................................................................................ 7
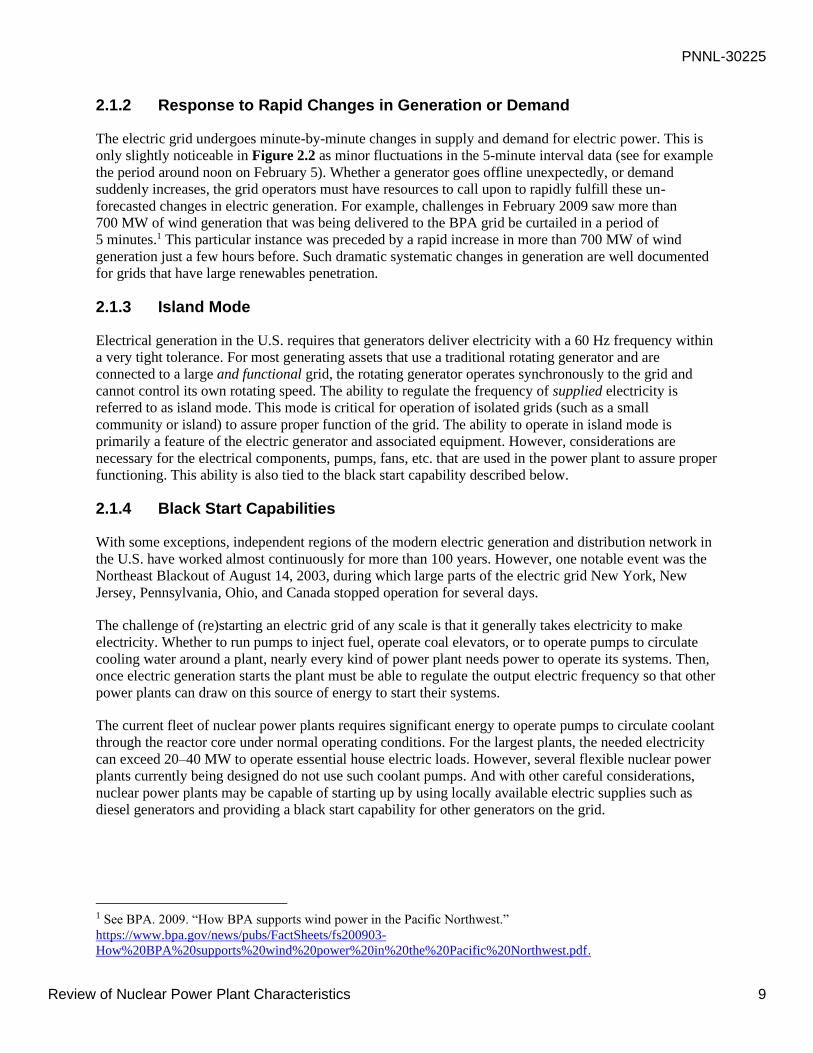
2.1.2 Response to Rapid Changes in Generation or Demand ...................................... 9
2.1.3 Island Mode ........................................................................................................ 9
2.1.4 Black Start Capabilities ...................................................................................... 9
2.1.5 Additional Services .......................................................................................... 10
2.2 Overview of Generation III+ Small Modular Reactor Concepts ...................................... 10
2.2.1 NuScale SMR ................................................................................................... 11
2.2.2 GEH BWRX-300 .............................................................................................. 12
3.0 Significant Relevant LCOE Studies and the Approach to Estimating LCOEs ................................. 14
3.1 LCOE Literature ............................................................................................................... 14
4.0 Current Energy Market and Projected Electricity Demand............................................................... 17
4.1 Current Supply and Demand for Electricity ..................................................................... 17
4.2 Impact of BPA Entry into the Energy Imbalance Market ................................................. 18
4.3 Projections of Electricity Demand and Supply ................................................................. 20
4.3.1 Adjustments to Future Market Projections ....................................................... 20
4.3.2 Impact of Moving to EVs on Electricity Demand ............................................ 21
4.4 Electricity Price Projections .............................................................................................. 22
5.0 Case Studies ...................................................................................................................................... 23
5.1 Approach to Estimating LCOE ......................................................................................... 24
5.2 Case 1: NuScale Facility at the Idaho National Laboratory Site ...................................... 28
5.3 Energy Northwest Site 1 ................................................................................................... 30
5.3.1 Case 2: NuScale at the Energy Northwest Site 1 .............................................. 31
5.3.2 Case 3: GEH BWRX-300 at the Energy Northwest Site 1 ............................... 38
5.4 Coal Plant Site in Centralia Washington .......................................................................... 40

PNNL-30225
Figures xiii
5.4.1 Case 4: NuScale Facility at the Coal Plant Site in Centralia Washington ........ 44
5.4.2 Case 5: GEH BWRX-300s at the Coal Plant Site in Centralia
Washington ....................................................................................................... 47
6.0 Firm and Near-firm Carbon-Free Generation Competition .............................................................. 51
6.1 Long-term Storage ............................................................................................................ 51
6.2 Wind and Solar with Long-Term Storage ......................................................................... 51
6.3 Future LCOEs ................................................................................................................... 52
7.0 Analysis of Results for NuScale and GEH BWRX-300 ................................................................... 59
7.1 Comparison of NuScale Results ....................................................................................... 59
7.2 Comparison of GEH BWRX-300 Results ........................................................................ 60
8.0 Conclusions ....................................................................................................................................... 62
9.0 References ......................................................................................................................................... 64
Appendix A – Questionnaires ................................................................................................................... A.1
A.1 GEH and NuScale Questionnaire .................................................................................... A.1
A.2 Energy Northwest Questionnaire .................................................................................... A.2
Figures
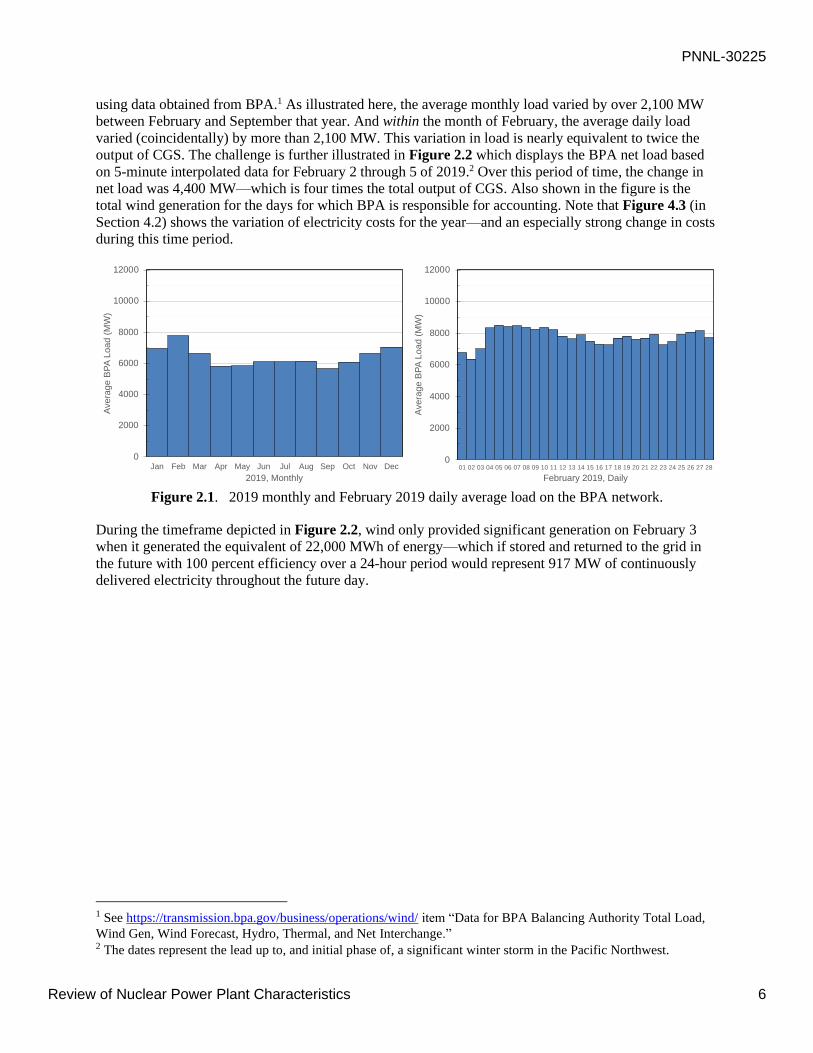
Figure 2.1. 2019 monthly and February 2019 daily average load on the BPA network. ...................... 6
Figure 2.2. Net load and total wind generation on select days. ............................................................. 7
Figure 2.3. Schematic of one NuScale SMR module. ......................................................................... 11
Figure 2.4. Schematic of the GEH BWRX-300 plant layout. ............................................................. 13
Figure 4.1. Washington State generation capacity by shares in 2018 (for a total generating capacity
of 30,983 MWe). ............................................................................................................... 17
Figure 4.2. The Western Interconnect Balancing Authority Areas in the EIM in 2019. ..................... 18
Figure 4.3. Components of the EIM wholesale price at Redmond WA ($/MWh). ............................. 20
Figure 4.4. Congested lines (indicated in red)with EV penetrations. .................................................. 22
Figure 5.1. Cost change from conceptual design to completion for mega-projects as designs mature.
(The blue data points are non-nuclear projects of similar complexity.) (Buongiorno et al.
2018) 24
Figure 5.2. Prices by month BPA rate proceeding for Light Load Hour (LLH) and High Load Hour
generation (HLH) (BPA 2016). ........................................................................................ 34
Figure 5.3. Example of NuScale plant load-following capability. The graphic indicates how well the
NuScale plant can follow demand and meet the gap between Horse Butte (wind project)
and demand. ...................................................................................................................... 35
Figure 5.4. Aerial view of the Centralia coal fire plants. (Graphic obtained from Google
Earth.)…..………………………………………………………………………………...41
Figure 5.5. TransAlta coal mining site. (Graphic obtained from Google Earth.) ................................ 42
Figure 5.6. Seismic map of the Centralia area. The lines indicate faults (DNR 1981). ...................... 43
Figure 6.1. Geothermal resources of the United States. ...................................................................... 56
Figure 6.2. Geothermal resource potential in Washington State. ........................................................ 57
PNNL-30225
Tables xiv
Figure 6.3. Geothermal resource favorability (accessibility to transmission) in Washington State.
………………………………………………………………………………...58
Tables
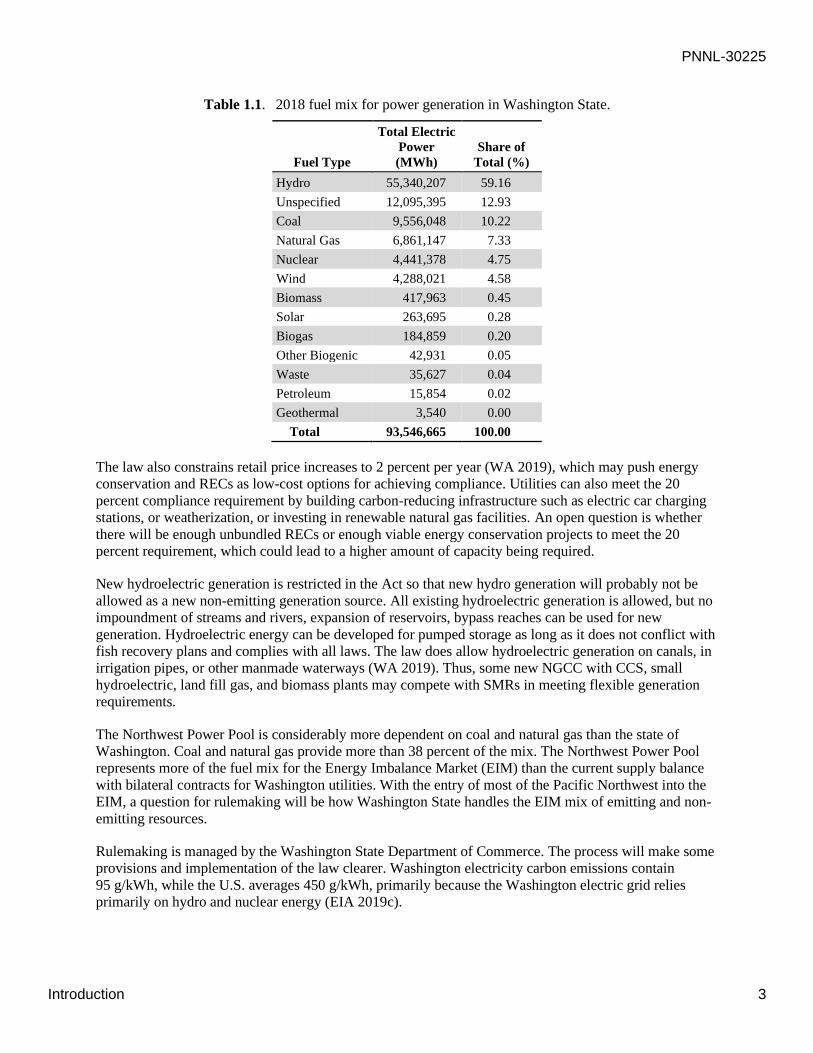
Table 1.1. 2018 fuel mix for power generation in Washington State. ................................................. 3
Table 2.1. NuScale SMR design data (12-module plant) .................................................................... 12
Table 2.2. GEH BWRX-300 design data. ........................................................................................... 13
Table 3.1. Comparison of conventional nuclear cost at the low and high end ($/MWh), Lazard (2019)
study ………………………………………………………………………………...14
Table 3.2. Capital costs with interest for advanced reactors, .............................................................. 15
Table 5.1. Comparison of the environmental characteristics at the proposed sites. ............................ 26
Table 5.2. NRC total cost for new reactors business line fee estimates (NRC 2020a). ....................... 27
Table 5.3. Nuclear fuel prices. ............................................................................................................. 28
Table 5.4. Added costs of delivering power from INL ($/MWh). ...................................................... 29
Table 5.5. A list of savings from Site 1 derived from using previous plants’ remaining structures
($000 2014$). .................................................................................................................... 31
Table 5.6. NuScale’s LCOEs at Site 1 for different real interest rates for the WACC ($/MWh). ...... 32
Table 5.7. Project length at Site 1 ($/MWh)........................................................................................ 32
Table 5.8. Operational period length at Site 1 ($/MWh). .................................................................... 32
Table 5.9. Impact of improving operating efficiency at Site 1 ($/MWh). ........................................... 33
Table 5.10. Impact of different capacity factors at Site 1 ($/MWh). ................................................... 33
Table 5.11. NuScale flexibility capabilities (Colbert 2019). ............................................................... 36
Table 5.12. Priority firm power rate and demand charges (BPA 2019c). ........................................... 36
Table 5.13. BPA load shaping rate. ..................................................................................................... 37
Table 5.14. Base transmission rates for main and secondary systems. ............................................... 37
Table 5.15. GEH BWRX-300’s LCOEs at Site 1 for different real interest rates for the WACC
($/MWh). ………………………………………………………………………………...39
Table 5.16. Project length at Site 1 ($/MWh)...................................................................................... 39
Table 5.17. Operational period length at Site 1 ($/MWh). .................................................................. 39
Table 5.18. Impact of improving operating efficiency at Site 1 ($/MWh). ......................................... 39
Table 5.19. Impact of different capacity factors at Site 1 ($/MWh).................................................... 40
Table 5.20. NuScale’s LCOEs for different real interest rates for the WACC at the Centralia site
($/MWh)………………………………………………………………………………... 45
Table 5.21. Project length at the Centralia site ($/MWh). ................................................................... 46
Table 5.22. Operational period length at the Centralia Site ($/MWh). ................................................ 46
Table 5.23. Impact of improving operating efficiency. ....................................................................... 46
Table 5.24. Impact of different capacity factors ($/MWh). ................................................................. 47
Table 5.25. GEH BWRX-300’s LCOEs for different real interest rates for the WACC at the Centralia
site ($/MWh). .................................................................................................................... 48

PNNL-30225
Tables xv
Table 5.26. Project length at the Centralia site ($/MWh). ................................................................... 48
Table 5.27. Operational period length at the Centralia Site ($/MWh). ............................................... 48
Table 5.28. Impact of improving operating efficiency. ....................................................................... 49
Table 5.29. Impact of lower capacity factors. ..................................................................................... 49
Table 6.1. LCOE for wind in the Columbia Basin before tax credits. ................................................ 52
Table 6.2. Forecast weighted1 LCOEs for generation resources entering service in 2025 ($/MWh
2019$) ………………………………………………………………………………...53
Table 6.3. Forecast unweighted LCOEs for generation resources entering service in 2025 ($/MWh
2019$)……………………………………………………………………………………
55
PNNL-30225
Introduction 1
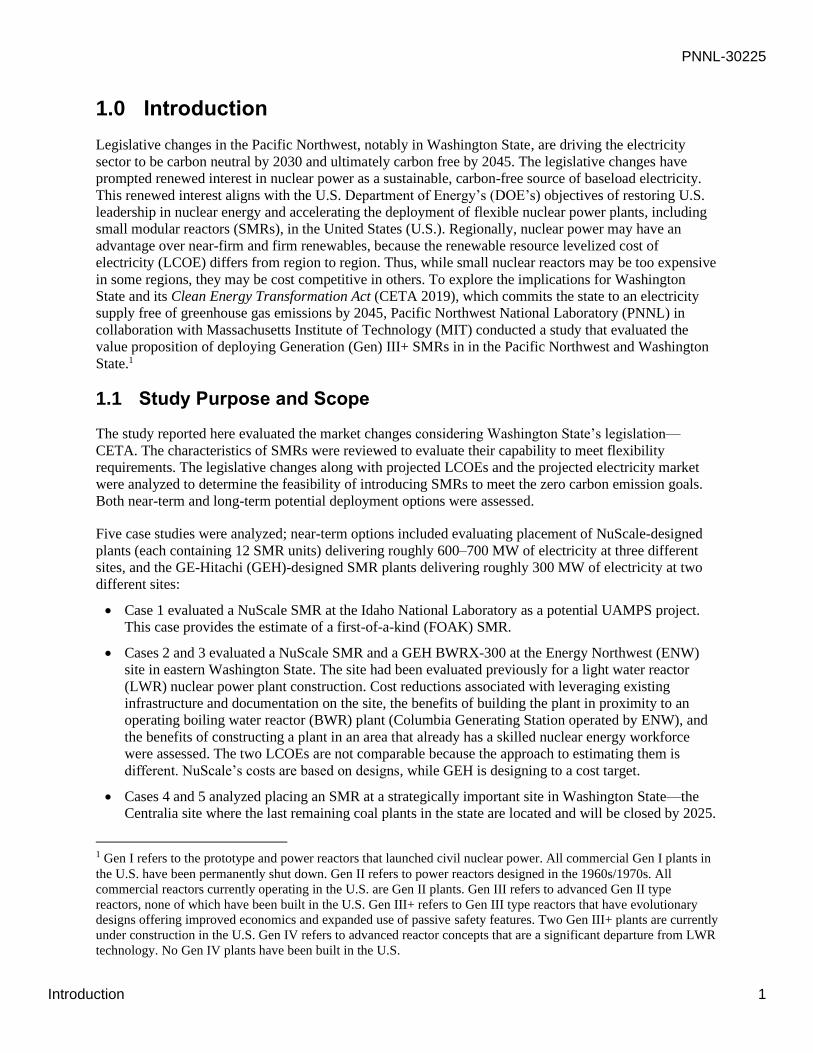
1.0 Introduction
Legislative changes in the Pacific Northwest, notably in Washington State, are driving the electricity
sector to be carbon neutral by 2030 and ultimately carbon free by 2045. The legislative changes have
prompted renewed interest in nuclear power as a sustainable, carbon-free source of baseload electricity.
This renewed interest aligns with the U.S. Department of Energy’s (DOE’s) objectives of restoring U.S.
leadership in nuclear energy and accelerating the deployment of flexible nuclear power plants, including
small modular reactors (SMRs), in the United States (U.S.). Regionally, nuclear power may have an
advantage over near-firm and firm renewables, because the renewable resource levelized cost of
electricity (LCOE) differs from region to region. Thus, while small nuclear reactors may be too expensive
in some regions, they may be cost competitive in others. To explore the implications for Washington
State and its Clean Energy Transformation Act (CETA 2019), which commits the state to an electricity
supply free of greenhouse gas emissions by 2045, Pacific Northwest National Laboratory (PNNL) in
collaboration with Massachusetts Institute of Technology (MIT) conducted a study that evaluated the
value proposition of deploying Generation (Gen) III+ SMRs in in the Pacific Northwest and Washington
State.1
1.1 Study Purpose and Scope
The study reported here evaluated the market changes considering Washington State’s legislation—
CETA. The characteristics of SMRs were reviewed to evaluate their capability to meet flexibility
requirements. The legislative changes along with projected LCOEs and the projected electricity market
were analyzed to determine the feasibility of introducing SMRs to meet the zero carbon emission goals.
Both near-term and long-term potential deployment options were assessed.
Five case studies were analyzed; near-term options included evaluating placement of NuScale-designed
plants (each containing 12 SMR units) delivering roughly 600–700 MW of electricity at three different
sites, and the GE-Hitachi (GEH)-designed SMR plants delivering roughly 300 MW of electricity at two
different sites:
• Case 1 evaluated a NuScale SMR at the Idaho National Laboratory as a potential UAMPS project.
This case provides the estimate of a first-of-a-kind (FOAK) SMR.
• Cases 2 and 3 evaluated a NuScale SMR and a GEH BWRX-300 at the Energy Northwest (ENW)
site in eastern Washington State. The site had been evaluated previously for a light water reactor
(LWR) nuclear power plant construction. Cost reductions associated with leveraging existing
infrastructure and documentation on the site, the benefits of building the plant in proximity to an
operating boiling water reactor (BWR) plant (Columbia Generating Station operated by ENW), and
the benefits of constructing a plant in an area that already has a skilled nuclear energy workforce
were assessed. The two LCOEs are not comparable because the approach to estimating them is
different. NuScale’s costs are based on designs, while GEH is designing to a cost target.
• Cases 4 and 5 analyzed placing an SMR at a strategically important site in Washington State—the
Centralia site where the last remaining coal plants in the state are located and will be closed by 2025.
1 Gen I refers to the prototype and power reactors that launched civil nuclear power. All commercial Gen I plants in
the U.S. have been permanently shut down. Gen II refers to power reactors designed in the 1960s/1970s. All
commercial reactors currently operating in the U.S. are Gen II plants. Gen III refers to advanced Gen II type
reactors, none of which have been built in the U.S. Gen III+ refers to Gen III type reactors that have evolutionary
designs offering improved economics and expanded use of passive safety features. Two Gen III+ plants are currently
under construction in the U.S. Gen IV refers to advanced reactor concepts that are a significant departure from LWR
technology. No Gen IV plants have been built in the U.S.

PNNL-30225
Introduction 2
With the loss of the coal plants, a source of dispatchable power will be lost. Two alternatives were
evaluated. One evaluated replacing the coal plants with SMRs. A second option evaluated adding an
SMR at the site but not at the current location of the facility. A brownfield site where coal had been
previously mined was chosen and one NuScale SMR or two GEH BWRX-300s were evaluated.
1.2 Clean Energy Transformation Act
Washington State’s CETA may provide opportunities for flexible nuclear power.1 The law calls for
carbon neutrality by 2030 and carbon-free power by 2045 in the state’s electricity sector. The law applies
to both investor-owned utilities and consumer-owned electricity—all electricity will be coming from non-
emitting resources by 2045. The law calls for the elimination of coal by 2025 and imposes potential
penalties for electricity generation for all carbon-emitting resources starting in 2030 (WA 2019). The
movement to non-dispatchable variable resource generation will require flexible non-carbon-emitting
resources to meet ramping and frequency regulation requirements. SMRs are a probable resource for
meeting the required flexibility, as are renewable methane (made with green hydrogen and carbon dioxide
[CO2]), renewable natural gas from decomposition of organic matter, and natural gas combined-cycle
(NGCC) generators with carbon capture and sequestration (CCS) (Roberts 2019).
Beginning in 2022, utilities must develop plans that lead to carbon neutrality by 2030 and carbon-free
generation by 2045. Utilities must pursue conservation measures first to meet load and then renewable
resources and non-emitting resources for 100 percent of load. Between 2030 and 2040, utilities can satisfy
up to 20 percent of their retail sales using alternative compliance options. Starting in 2030, compliance
with the law can be achieved by providing a compliance payment, using unbundled Renewable Energy
Credits (RECs), investing in energy transformation projects, and/or using energy recovery facilities to
generate electricity.
Compliance payments are based on $150/MWh for coal generation, $84/MWh for natural gas generation,
and $60/MWh for NGCC generators (WA 2019). These payments are consistent with a $150/T CO2 tax.
Unbundled RECs could provide the lowest cost of the approaches because they have been as low as
$0.35/REC for 1 MWh of renewable generated electricity (EPA ca 2018). As recently as 2019, the price
of a REC was below $1. Thus, a very inexpensive choice may be used by most Washington State utilities
to meet their requirements. As of 2018, only 17.5 percent of electricity generated was from natural gas or
coal (see Table 1.1) (WADOC 2019). The latest utility-by-utility information indicates that three
investor-owned utilities and two Public Utility Districts (PUDs) accounted for 77 percent of the carbon-
emitting resources in 2016. Thus 62 of 67 utilities may be able to purchase RECs to meet their obligations
before 2045 while the remaining 5 utilities may purchase RECs for a portion but will be required to make
the compliance payment on the remaining emitting resources (WADOC 2017) if they do not obtain non-
emitting generation resources. The remaining amount that needs to be filled by non-emitting resources or
pay the penalty is about 13 TWh currently or 1.5 to 2.0 GW.
1 Flexible nuclear power moves beyond inflexible baseload electric generation and delivers carbon-free electricity,
and other useable commodities such as process heat, to complement intermittent and variable generation sources.
PNNL-30225
Introduction 3
Table 1.1. 2018 fuel mix for power generation in Washington State.
Fuel Type
Total Electric
Power
(MWh)
Share of
Total (%)
Hydro 55,340,207 59.16
Unspecified 12,095,395 12.93
Coal 9,556,048 10.22
Natural Gas 6,861,147 7.33
Nuclear 4,441,378 4.75
Wind 4,288,021 4.58
Biomass 417,963 0.45
Solar 263,695 0.28
Biogas 184,859 0.20
Other Biogenic 42,931 0.05
Waste 35,627 0.04
Petroleum 15,854 0.02
Geothermal 3,540 0.00
Total 93,546,665 100.00
The law also constrains retail price increases to 2 percent per year (WA 2019), which may push energy
conservation and RECs as low-cost options for achieving compliance. Utilities can also meet the 20
percent compliance requirement by building carbon-reducing infrastructure such as electric car charging
stations, or weatherization, or investing in renewable natural gas facilities. An open question is whether
there will be enough unbundled RECs or enough viable energy conservation projects to meet the 20
percent requirement, which could lead to a higher amount of capacity being required.
New hydroelectric generation is restricted in the Act so that new hydro generation will probably not be
allowed as a new non-emitting generation source. All existing hydroelectric generation is allowed, but no
impoundment of streams and rivers, expansion of reservoirs, bypass reaches can be used for new
generation. Hydroelectric energy can be developed for pumped storage as long as it does not conflict with
fish recovery plans and complies with all laws. The law does allow hydroelectric generation on canals, in
irrigation pipes, or other manmade waterways (WA 2019). Thus, some new NGCC with CCS, small
hydroelectric, land fill gas, and biomass plants may compete with SMRs in meeting flexible generation
requirements.
The Northwest Power Pool is considerably more dependent on coal and natural gas than the state of
Washington. Coal and natural gas provide more than 38 percent of the mix. The Northwest Power Pool
represents more of the fuel mix for the Energy Imbalance Market (EIM) than the current supply balance
with bilateral contracts for Washington utilities. With the entry of most of the Pacific Northwest into the
EIM, a question for rulemaking will be how Washington State handles the EIM mix of emitting and non-
emitting resources.
Rulemaking is managed by the Washington State Department of Commerce. The process will make some
provisions and implementation of the law clearer. Washington electricity carbon emissions contain
95 g/kWh, while the U.S. averages 450 g/kWh, primarily because the Washington electric grid relies
primarily on hydro and nuclear energy (EIA 2019c).
PNNL-30225
Introduction 4
1.3 Commercial Nuclear Energy in the Pacific Northwest
ENW, formerly the Washington Public Power Supply System, was established in 1957. The current
nuclear power plant, Columbia Generating Station (CGS), is located 8 miles north of Richland,
Washington, at the site of nuclear power plant 2 (WPN-2) at Hanford. The plant cost $7.63 billion
(2018$) to construct and has a net capacity of 1,174 MWe. In fiscal year (FY) 2018, CGS generated 9,722
GWh at a cost of $35.6/MWh and in FY 2019, it generated 8,873 GWh at a cost of $47.6/MWh. The
fluctuation depends on the timing of the refueling outage and other activities (ENW 2019). The projected
levelized cost of electricity (2014–2043) is between $47/MWh and $52/MWh (ENW 2020). They are
selling power at cost to the Bonneville Power Administration (BPA).
Initially, ENW attempted to build five nuclear generating facilities. The projects’ cost estimate reached
almost $24 billion in 1981. WNP-4, at Hanford, and WNP-5, at Satsop, Washington, neither project
supported by BPA, were discontinued in 1982. ENW completed WNP-2, at Hanford, and has two
partially completed plants—WNP-1 and WNP-4 at Hanford. Significant effort was put into determining
whether the two plants should be completed. WNP-4 has been put through a restoration process involving
the removal of equipment and materials and 28 of the 30 prefabricated buildings. Two other plants, WNP-
3 and WNP-5, at Satsop, Washington, were turned over to the Satsop Redevelopment Project. Currently,
BPA is paying for the upkeep of the two plants and is responsible for the restoration costs if alternative
uses cannot be found. If the sites are returned to brownfield status, the costs for the two sites could be as
high as $100 million. The WNP-1 site was 70 percent complete when construction was stopped on the
traditional large Gen II nuclear plant. WNP-1, referred to as Site 1 in this study (Case Study 2 and Case
Study 3), is now a potential site for SMRs because a significant amount of the construction and
infrastructure has already been completed (Miller 2013).
1.4 Report Contents and Organization
The ensuing sections of this report review the characteristics of nuclear power plants (Section 2.0), and
present information about and approaches to estimating LCOEs derived from reviewing related literature
(Section 3.0). The current energy market and projected electricity demand are discussed in Section 4.0.
The case studies analyzed to determine the feasibility of introducing SMRs to meet the goals of zero
carbon emissions are presented in Section 5.0, followed by discussion in Section 6.0 of firm and near-firm
renewable energy grid generation resources that may provide competition to SMR generation. Finally, the
results derived from the case studies that evaluated the NuScale SMR and GEH’s BWRX-300 are
analyzed in Section 7.0, and study conclusions are presented in Section 8.0. Appendix A contains related
questionnaires developed to estimate the LCOE for the SMRs.

PNNL-30225
Review of Nuclear Power Plant Characteristics 5
2.0 Review of Nuclear Power Plant Characteristics
Flexible nuclear power technologies that have evolved in the past decade can provide significant
benefits—including characteristics that assist the electric grid in operating reliably and flexibly when
siting the technologies—when transitioning to the emerging clean energy market of tomorrow. Nuclear
power technology is one of the few carbon-free sources that can provide flexibility in deployment in
terms of total electrical output (from 1 MW to more than 1,000 MW depending on the design), and newer
technologies are free from many siting constraints associated with wind, solar, geothermal, and hydro
installations. Indeed, modern nuclear installations may not require emergency evacuation zones and some
technologies will discharge excess thermal energy to the air instead relying on water from a river or
another source.
This section summarizes SMR characteristics that are important for assuring smooth operation of the
electric grid.
2.1 Electrical Generating Characteristics Relevant to the Emerging Clean Energy Market
The characteristics of flexible nuclear power summarized in this section support a range of electrical
distribution networks in assuring optimal, reliable, and efficient operation of the electrical grid. While
discussion here is relevant to electric grids of today, the emerging clean energy market of tomorrow will
drive innovation in the infrastructure toward new kinds of capable, flexible, and affordable generating
assets.1 From highly integrated and robust multi-gigawatt–scale electric distribution networks (such as
that operated by BPA) to isolated networks of the megawatt scale, integration of large amounts of
variable or intermittent generating sources in the electric distribution and consumption network requires
adaptable, flexible, and dispatchable generating (and energy storage) assets to make sure reliable on-
demand delivery of electricity is available to augment variable and intermittent sources.
Electric generating assets of the emerging market may require adaptability to local natural resources. For
example, the geographic location of a localized megawatt-scale electric network may not provide
adequate cooling water sources for operation of a traditional steam turbine/generator system to reject
excess heat through the steam cooling towers used by plants such as CGS. Or, environmental permits may
not be readily secured for a project. Or, there may be a large commercial facility, such as a paper mill,
that can use the residual thermal energy left over from electric generation.
Even when supporting today’s large BPA electric distribution network, the mixing and matching of
generating characteristics is necessary to make sure an electric grid functions on the hottest days and
coldest nights. This requires a mix of reliable and affordable baseload generation and dispatchable
generation that covers the daily and seasonal variations in electric consumption.
The challenges faced in operating the BPA electric distribution network are illustrated in Figure 2.1. The
figure illustrates the average monthly net load2 for 2019 and the average daily load in February 2019
1 A generating asset in this section refers to any system that can deliver net-positive usable electricity to the electric
grid at 60 Hz. Novel technologies may incorporate generation and storage capabilities for instance, but unlike an
electric (battery), pumped storage, or thermal energy storage asset, the generating asset is capable of net positive
contributions of power. 2 Net load represents loads within BPA's Balancing Authority and does not include loads transferred out of the
region or scheduled for use by customers with their own Balancing Authorities, such as Seattle and Tacoma.
PNNL-30225
Review of Nuclear Power Plant Characteristics 6
using data obtained from BPA.1 As illustrated here, the average monthly load varied by over 2,100 MW
between February and September that year. And within the month of February, the average daily load
varied (coincidentally) by more than 2,100 MW. This variation in load is nearly equivalent to twice the
output of CGS. The challenge is further illustrated in Figure 2.2 which displays the BPA net load based
on 5-minute interpolated data for February 2 through 5 of 2019.2 Over this period of time, the change in
net load was 4,400 MW—which is four times the total output of CGS. Also shown in the figure is the
total wind generation for the days for which BPA is responsible for accounting. Note that Figure 4.3 (in
Section 4.2) shows the variation of electricity costs for the year—and an especially strong change in costs
during this time period.
Figure 2.1. 2019 monthly and February 2019 daily average load on the BPA network.
During the timeframe depicted in Figure 2.2, wind only provided significant generation on February 3
when it generated the equivalent of 22,000 MWh of energy—which if stored and returned to the grid in
the future with 100 percent efficiency over a 24-hour period would represent 917 MW of continuously
delivered electricity throughout the future day.
1 See https://transmission.bpa.gov/business/operations/wind/ item “Data for BPA Balancing Authority Total Load,
Wind Gen, Wind Forecast, Hydro, Thermal, and Net Interchange.” 2 The dates represent the lead up to, and initial phase of, a significant winter storm in the Pacific Northwest.
0
2000
4000
6000
8000
10000
12000
Jan Feb Mar Apr May Jun Jul Aug Sep Oct Nov Dec
Ave
rag
e B
PA
Lo
ad
(M
W)
2019, Monthly
0
2000
4000
6000
8000
10000
12000
01 02 03 04 05 06 07 08 09 10 11 12 13 14 15 16 17 18 19 20 21 22 23 24 25 26 27 28
Ave
rag
e B
PA
Lo
ad
(M
W)
February 2019, Daily

PNNL-30225
Review of Nuclear Power Plant Characteristics 7
Figure 2.2. Net load and total wind generation on select days.
The fundamental challenge to a modern electric grid is that electricity is ephemeral—there is currently no
affordable and large-scale capability to store 1,000s of megawatt-hour equivalents of energy generated in
one moment for future use. And this is the driver for innovation in flexible nuclear power technologies—
to deliver carbon-free infrastructure to deliver the capable, flexible, and affordable generating assets
needed for the emerging clean energy market of tomorrow.
Several generating characteristics summarized in the following sections are anticipated to be important to
the emerging electric generation network. The inherent value of a project is increased for a flexible
nuclear power generating asset if it incorporates any of these characteristics. However, “pricing-in” this
inherent value into a pure economic analysis is challenging (some examples are addressed later in this
document), especially for the innovations that will drive the emerging clean energy market of tomorrow
that has not yet arrived. See IAEA Nuclear Energy Series No. NP-T-3.23 for additional information in a
broader worldwide context (IAEA 2018).
2.1.1 Beyond Baseload
Baseload electric supply involves delivery of ultra-cheap electricity with uninterrupted performance over
a period of weeks and months. Generating assets delivering baseload electricity, such as the current fleet
of nuclear power plants and modern NGCC plants, are highly optimized with complex arrangements of
systems that maximize thermal efficiency1 for the cheapest attainable electric cost. And baseload units
may not function as efficiently at reduced power levels. Overall, the performance of these assets is
measured by the capacity factor, the percentage of time during the year that an asset generates power at
its rated power level. Increased costs associated with the complexity of baseload generating assets are
recovered by maximizing the capacity factor, and hence revenue through the near-continuous generation
of electricity.
1 Thermal efficiency is the efficiency of converting chemical or nuclear heat released from fuel into electricity. A
high efficiency means less fuel is consumed per unit of generated electricity.
0
2000
4000
6000
8000
10000
12000
12:00 AM 12:00 PM 12:00 AM 12:00 PM 12:00 AM 12:00 PM 12:00 AM 12:00 PM 12:00 AM
Pow
er
(MW
)
February 2nd through 5th, 2019
BPA Load Total Wind Generation

PNNL-30225
Review of Nuclear Power Plant Characteristics 8
Electric consumption varies widely throughout the day and the season based on consumer demand,
commercial activity, and environmental conditions, as illustrated earlier in Figure 2.1 and Figure 2.2.
And, any electric grid that has significant penetration of non-dispatchable intermittent electric generating
assets requires dispatchable assets that have the flexibility to adapt to the generation swings, sometimes
called peaker units, as the wind dies down, or clouds develop, or as river flows decrease later in the
summer months and fall. A large portion of this variation and intermittency can be forecast by electric
grid operators a day or a week ahead based on current conditions and a dispatch notice sent to a generator
to cover the needs. Mitigating these forecastable swings in electric supply using assets designed for large
capacity factors, such as current nuclear or combined-cycle natural gas units, is technically challenging
and other assets are preferred. A simple-cycle natural gas plant that is relatively cheap to build and can
power up/down rapidly, but much less thermally efficient than a NGCC plant, may be an affordable
option to cover daily demand swings, for example. The electric supply market pays a premium for assets
that can respond to daily and/or seasonal swings in electric energy consumption.
Historically, generating assets that have relatively low construction costs (up-front investments) that may
have a larger fuel cost have played an important role in fulfilling dispatchable beyond-baseload
generation needs in many electricity networks—especially simple-cycle natural gas plants. And in the
Pacific Northwest, this service is in part fulfilled by hydroelectric generation. However, with
decarbonization goals and with increased consideration of hydroelectric generation impacts on river
ecosystems, the emerging clean energy market will expand beyond simple-cycle natural gas and
hydropower for carbon-free beyond-baseload generating capacity to fulfill forecastable electric power
generation demand.
Several characteristics listed below are incorporated into flexible nuclear power plants to increase their
inherent value in delivering dispatchable electric generation and for transcending the traditional baseload
generation role of the current nuclear power plant fleet. These characteristics are incorporated through
purposeful decisions during the design process and may involve compromises in terms of the thermal
efficiency, fuel costs, and construction costs of a plant. All flexible nuclear power plants that are currently
being designed can be tailored, to varying degrees, to specific situations for providing electric power
generation to account for forecasted demand and generation changes.
• Seasonal load swings – as illustrated in Figure 2.1 on a monthly basis, the Pacific Northwest is
unique in the U.S. in that the regional authorities may order large non-hydro baseload plants to
curtail generation during the spring runoff season when electric demand is low and hydro generation
is maximized.
• Variable daily load swings – as illustrated in Figure 2.2, every electric grid experiences daily
variation in electric energy consumption. This occurs for many reasons throughout the day, including
industrial demand, heating/cooling loads, and other causes—and unique shapes occur in the daily
demand curve depending on summer (cooling) and winter (heating) conditions.
• Intermittent forecasted generation changes – windy seasons, prolonged weather inversions, and
forecasted droughts that dampen river flows that result in forecasted decreases in renewable
generation assets are examples of knowable generation changes that must be accounted for.
Note that some current nuclear power plants located outside the U.S. already have the capacity to ramp
electrical generation up/down by 20 percent per hour and follow the variable daily and intermittent
forecasted load swings. An analysis by Buongiorno et al. (2020) indicates such a plant could meet 92–98
percent of all variable generation under the conditions of the study.
The means by which several nuclear plants achieve these characteristics are discussed later.
PNNL-30225
Review of Nuclear Power Plant Characteristics 9
2.1.2 Response to Rapid Changes in Generation or Demand
The electric grid undergoes minute-by-minute changes in supply and demand for electric power. This is
only slightly noticeable in Figure 2.2 as minor fluctuations in the 5-minute interval data (see for example
the period around noon on February 5). Whether a generator goes offline unexpectedly, or demand
suddenly increases, the grid operators must have resources to call upon to rapidly fulfill these un-
forecasted changes in electric generation. For example, challenges in February 2009 saw more than
700 MW of wind generation that was being delivered to the BPA grid be curtailed in a period of
5 minutes.1 This particular instance was preceded by a rapid increase in more than 700 MW of wind
generation just a few hours before. Such dramatic systematic changes in generation are well documented
for grids that have large renewables penetration.
2.1.3 Island Mode
Electrical generation in the U.S. requires that generators deliver electricity with a 60 Hz frequency within
a very tight tolerance. For most generating assets that use a traditional rotating generator and are
connected to a large and functional grid, the rotating generator operates synchronously to the grid and
cannot control its own rotating speed. The ability to regulate the frequency of supplied electricity is
referred to as island mode. This mode is critical for operation of isolated grids (such as a small
community or island) to assure proper function of the grid. The ability to operate in island mode is
primarily a feature of the electric generator and associated equipment. However, considerations are
necessary for the electrical components, pumps, fans, etc. that are used in the power plant to assure proper
functioning. This ability is also tied to the black start capability described below.
2.1.4 Black Start Capabilities
With some exceptions, independent regions of the modern electric generation and distribution network in
the U.S. have worked almost continuously for more than 100 years. However, one notable event was the
Northeast Blackout of August 14, 2003, during which large parts of the electric grid New York, New
Jersey, Pennsylvania, Ohio, and Canada stopped operation for several days.
The challenge of (re)starting an electric grid of any scale is that it generally takes electricity to make
electricity. Whether to run pumps to inject fuel, operate coal elevators, or to operate pumps to circulate
cooling water around a plant, nearly every kind of power plant needs power to operate its systems. Then,
once electric generation starts the plant must be able to regulate the output electric frequency so that other
power plants can draw on this source of energy to start their systems.
The current fleet of nuclear power plants requires significant energy to operate pumps to circulate coolant
through the reactor core under normal operating conditions. For the largest plants, the needed electricity
can exceed 20–40 MW to operate essential house electric loads. However, several flexible nuclear power
plants currently being designed do not use such coolant pumps. And with other careful considerations,
nuclear power plants may be capable of starting up by using locally available electric supplies such as
diesel generators and providing a black start capability for other generators on the grid.
1 See BPA. 2009. “How BPA supports wind power in the Pacific Northwest.”
https://www.bpa.gov/news/pubs/FactSheets/fs200903-
How%20BPA%20supports%20wind%20power%20in%20the%20Pacific%20Northwest.pdf.
PNNL-30225
Review of Nuclear Power Plant Characteristics 10
2.1.5 Additional Services
Additional services, some of which are called ancillary services, incorporate a broad set of beyond-
baseload capabilities that can be sold to electric grid operators by providers in deregulated or capacity
markets. Examples are provided below and can be tracked back to the discussions earlier in this section—
they are related to the operation of the grid, swings in demand, and the need to balance grid operations.
1. Arbitrage – Trading in the wholesale energy markets by buying energy during off-peak, low-price
periods and selling it during peak, high-price periods.
2. Capacity or Resource Adequacy – A provider is dispatched during peak demand events to supply
energy or to reduce consumption (generating electric and not consuming it are equivalent in this
case). The service reduces the need for new peaking power plants and other peaking resources.
3. Regulation Up and Down Services – A provider responds to a strong imbalance in supply and
demand in order to provide a corrective response to all or a segment of an area. This ensures near
instantaneous and continuous balance of generation and load.
4. Frequency Response – The provider delivers energy in order to maintain frequency stability when it
deviates outside the set limit, thereby keeping generation and load balanced within the system. This is
achieved by dispatching energy whenever deviations beyond set limits occur, thereby keeping load
and generation within the system balanced.
5. Spinning/Non-spinning Reserve – Spinning reserve represents capacity that is online and capable of
synchronizing to the grid within 10 minutes. Non-spinning reserve is offline generation capable of
being brought onto the grid and synchronized to it within 30 minutes.
2.2 Overview of Generation III+ Small Modular Reactor Concepts
A wide range of flexible nuclear power technologies are currently under active development. A large
number of the designs are considerably smaller than the electrical output of CGS on an individual unit or
module basis, but some of them are designed to be built in groups or clusters of modules that can reach an
output similar to that of CGS based on the electrical supply needs of the region. The Advanced Reactor
Information System (ARIS, https://aris.iaea.org/) is an online database maintained by the International
Atomic Energy Agency that is designed to easily obtain up-to-date overview information about reactor
technologies being developed and deployed around the world. From the database, interested readers can
obtain design-specific information, such as electrical output, provided by the developers for these
concepts. Given the easy access to information, a broad survey of flexible nuclear power technologies is
not provided here. The NuScale SMR and GEH BWRX-300 designs are of particular interest in this
report and are discussed in a little more detail later in this section.
Approval of a commercial nuclear power reactor in the U.S. requires licensing by the U.S. Nuclear
Regulatory Commission (NRC). There are multiple pathways for licensing of a new plant. One pathway
is by submission of a Design Certification Application (DCA) by a nuclear technology developer to the
NRC. This DCA submission is a very significant milestone that involves disclosure of a large collection
of reports and documents about the proposed technology. Approval of this application takes several years
of technical review by the NRC and a formal rulemaking process. A completed rulemaking certifies a
nuclear power plant design, independent of an application to construct or operate the plant. A list of all
certified and in-process applications can be found on the NRC website at
https://www.nrc.gov/reactors/new-reactors/design-cert.html. Links on the page to each design provide
access to the large collection of reports and documents, as well as information and communications
exchanged between the NRC and the applicant. Considering the depth and detail that must be submitted
for scrutiny and the extensive cost of the review, a DCA submitted by a nuclear technology developer
PNNL-30225
Review of Nuclear Power Plant Characteristics 11
demonstrates significant maturity in the design and strong financial commitment to the endeavor by the
developer.
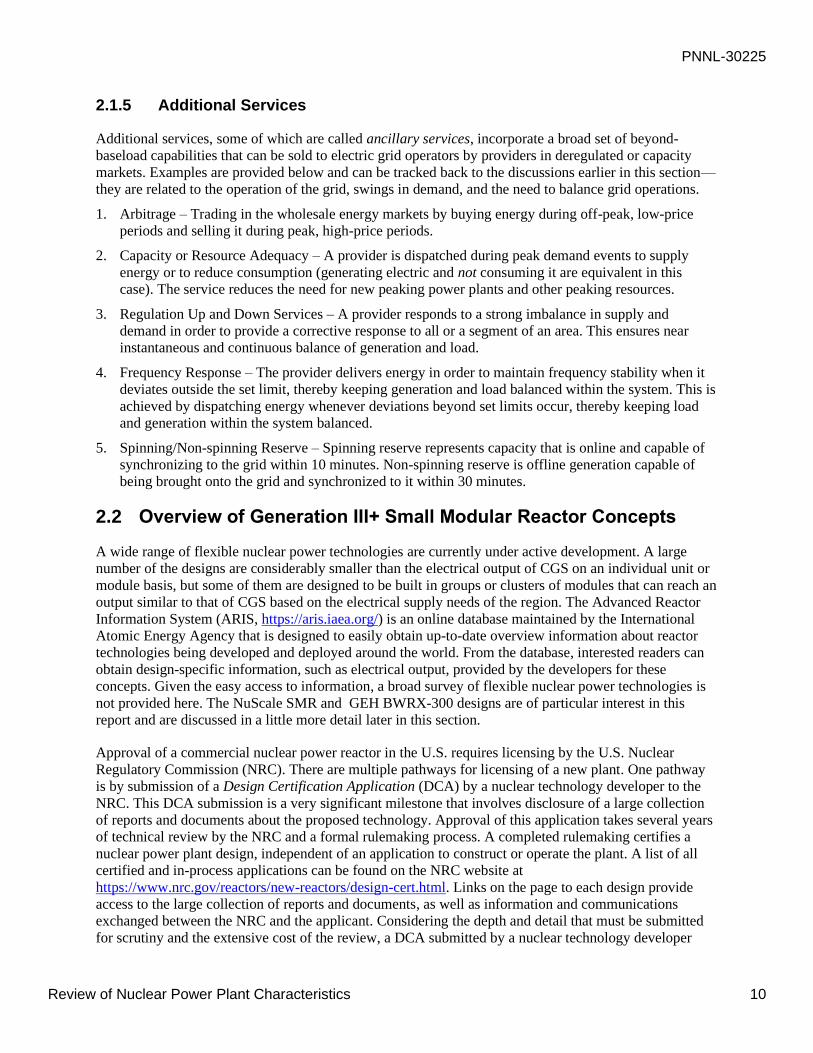
2.2.1 NuScale SMR
A single NuScale SMR module is a compact design in which key components are contained within the
reactor vessel. The design is novel because it uses single-phase natural circulation processes to circulate
cooling water through the fuel contained in the nuclear core—no pumps are necessary to circulate cooling
water in the primary circuit. Integration of the key components inside the reactor vessel and no reliance
on recirculation pumps contribute to a significant increase in safety margins for this design over previous
generations of nuclear power plants. An illustration of a single module is shown in Figure 2.3. While
there is flexibility to use other numbers of modules, a NuScale plant in this study includes 12 modules.
Key design data are listed in Table 2.1 for the NuScale SMR plant (all data in the table are from
documents submitted to the NRC).
Figure 2.3. Schematic of one NuScale SMR module.1
1 NRC. “Design Certification Application – NuScale.” Accessed August 3, 2020 at
https://www.nrc.gov/reactors/new-reactors/smr/nuscale.html

PNNL-30225
Review of Nuclear Power Plant Characteristics 12
Table 2.1. NuScale SMR design data (12-module plant).
Attribute Value
Thermal capacity 1,920-2,400 MWt*
Electrical capacity 600–720 MWe (gross output)(a)
Capacity factor >95%
Fuel design Standard design consistent with existing pressurized water
reactors, but shorter; 37 assemblies per module.
Fuel form Pelletized uranium dioxide form with <5% enrichment
Refueling interval 24-month
Operating lifetime 40 years – initial NRC license duration
80 years – with life extension
(a) Thermal and electrical capacity indicate two values. The first value is consistent with
regulatory submittals in 2017. The latter value reflects a planned uprate addressed in the
forthcoming “NuScale720” Standard Plant submittal.
Considering the electrical generating characteristics in Section 2.1, a number of publications describe the
flexibility and capabilities of the NuScale SMR to deliver these characteristics. See, for example, the
paper by Ingersoll et al. (2015) that addresses integration with wind-generating sources. A number of
these capabilities were incorporated into the design that is undergoing NRC review. For example, the
indicated reference describes three ways to deliver longer-term to short-term load-following capability
and ability to rapidly respond to electrical demand signals by
• taking one or more modules offline for extended periods of low grid demand or sustained wind
output,
• maneuvering reactor power for one or more modules during intermediate periods to compensate for
hourly changes in demand or wind generation, or
• bypassing the module’s steam turbine directly to the condenser for rapid responses to load or wind
generation variations.
The reference goes on to describe realistic scenarios on the BPA electric grid and provide a technical
discussion of how individual modules, and the plant as a whole, may respond. And, without pumps to
circulate cooling water in the primary circuit that would require electric to operate them, and with careful
design considerations for other systems, the NuScale plant is expected to be able to operate in island
mode and provide black start capabilities. Pending in-field demonstrations, these features of the design
appear to enable the NuScale SMR to provide reliable on-demand delivery of electricity to augment the
variable and intermittent sources.
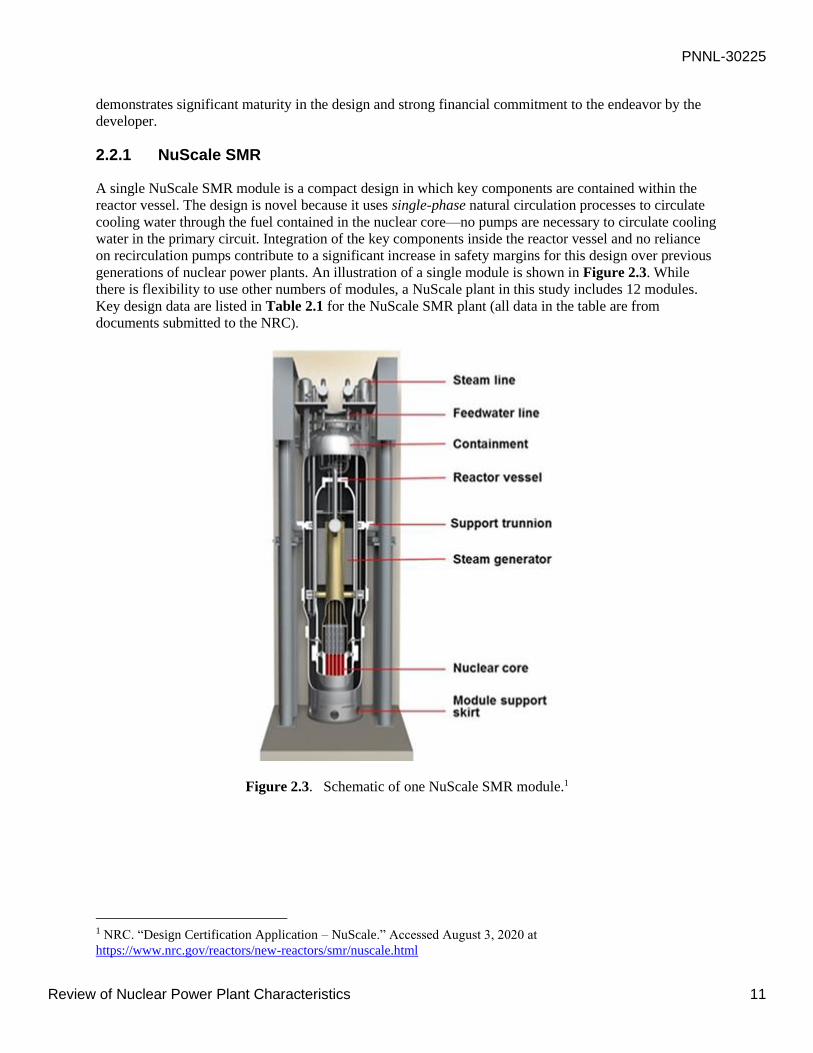
2.2.2 GEH BWRX-300
The GEH BWRX-300 plant is an evolution of the NRC-approved ESBWR (Economic Simplified Boiling
Water Reactor) design, which itself draws many elements from earlier designs, including CGS. The plant
is a compact design in which key components are contained within the reactor vessel. The design draws
upon the ESBWR in using two-phase natural circulation processes to circulate cooling water through the
fuel contained in the nuclear core—no pumps are necessary to circulate cooling water in the primary
circuit. Integration of the key components inside the reactor vessel and no reliance on recirculation pumps
contribute to a significant increase in safety margins for this design over previous generations of nuclear
plants. An illustration of a single plant is shown in Figure 2.4. A single site can contain a single plant or
multiple plants. Key design data (provided by the designer) are listed in Table 2.2 for the BWRX-300
plant.
PNNL-30225
Review of Nuclear Power Plant Characteristics 13
Figure 2.4. Schematic of the GEH BWRX-300 plant layout.1
Table 2.2. GEH BWRX-300 design data.
Attribute Value
Thermal capacity 870 MWt
Electrical capacity 300 MWe (gross output)
Capacity factor >95%
Fuel design Standard design consistent with existing boiling
water reactors, but shorter.
Fuel form Pelletized uranium dioxide form with <5%
enrichment
Refueling interval Up to 24-month interval
Operating lifetime 60 years – proposed NRC initial license duration
GEH has not yet submitted a DCA to the NRC for review so detailed design data are not publicly
available. However, technical review of the design shows it can achieve many of the electrical generating
characteristics described in Section 2.1. However, the rates at which the plant can respond to electrical
load changes cannot be determined without detailed data. The plant operates without pumps to circulate
cooling water in the primary circuit that would require electricity to operate them, so it is expected the
design can operate in island mode and provide black start capabilities if certain decisions are made during
the design process.
Pending more detailed design data and in-field demonstrations, the design of the BWRX-300 plant is
expected to provide reliable on-demand delivery of electricity to augment the variable and intermittent
sources.
1 GE-Hitachi. “BWRX-300.” Accessed August 3, 2020 at https://nuclear.gepower.com/build-a-
plant/products/nuclear-power-plants-overview/bwrx-300
PNNL-30225
Significant Relevant LCOE Studies and the Approach to Estimating LCOEs 14
3.0 Significant Relevant LCOE Studies and the Approach to Estimating LCOEs
Relevant LCOEs for SMRs and large nuclear power plants are reviewed in this section.
3.1 LCOE Literature
Recent studies of the LCOE for SMRs show nth-of-a-kind (NOAK) reactors with costs from $65 to
$100/MWh. Conventional nuclear power takes advantage of economies of scale, while small nuclear
reactors try to offset that advantage with the ability to manufacture modular components in a factory
setting. The factory setting takes advantage of a trained workforce within a specified quality assurance
setting to avoid the construction delays associated with the increased cost of capital. The big question for
modularization is whether it can reduce the capital cost because that is where the largest improvement in
cost can occur. The combination of fuel costs and operations and maintenance (O&M) costs is estimated
in the $29/MWh to $42/MWh range and these costs are much better understood than engineering designs,
costs to construct, and the time cost of money associated with construction.
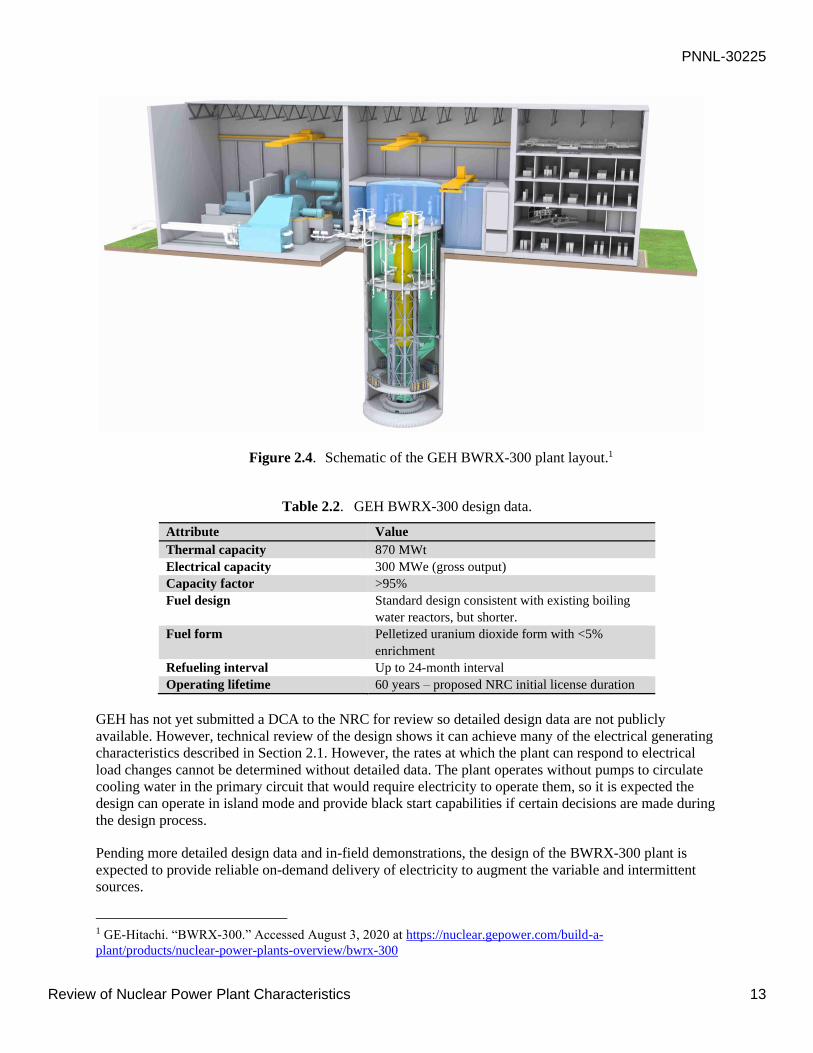
New construction of conventional nuclear power indicates the capital costs are a significant deterrent to
competitive electricity generation. Lazard’s paper (2019) noted that the cost of capital provides a
significant difference in the LCOE of new nuclear power. It noted that for unsubsidized power, the LCOE
ran between $118/MWh and $192/MWh for after-tax internal rates of return (IRRs) of 5.4 and 9.2
percent, respectively. See Table 3.1 for comparison of conventional nuclear power’s cost at the low end
and high end from the Lazard (2019) study. These costs for new-build nuclear plants contrast with current
operating nuclear reactor costs. A recent study by the Nuclear Energy Institute (NEI 2018) indicated costs
of $29/MWh and $42/MWh with an average of $32/MWh. According to NEI, fuel costs do not
significantly distinguish between the large nuclear reactors. NEI data indicate that fuel costs are about $6–
$7/MWh rather than the $9/MWh indicated by Lazard.
Table 3.1. Comparison of conventional nuclear cost at the low and high end ($/MWh) from the Lazard
(2019) study
Cost Type Low End High End
Capital Cost 91 162
Fixed O&M 15 17
Variable O&M 4 4
Fuel 9 9
MIT estimates that if modularization could reduce construction time and costs by 20 percent, the
overnight costs of capital could decline by $1,000/kWe (Buongiorno 2018). Their forecasted reduction in
overnight capital costs was based on the reductions in cost for modularization in the chemical plants,
offshore oil and gas platforms, and liquified natural gas plants. The MIT report discusses modularization
success in the nuclear industry and nuclear submarine builds. They estimate that the reduction in
overnight capital costs would reduce the interest and ownership costs by one-third, providing an overall
savings of $1,600/kWe in installed costs.
The MIT study provided capital estimates for advanced reactors (Table 3.2) and indicated the costs ran
from $5.2 billion to $6.1 billion for reactors sized between 2,400 MWt to 3,400 MWt for conceptual and
pre-conceptual design. Based on estimates in the study, the LCOEs are provided. The values shown in
Table 3.2 would have been in the $110/MWh to $115/MWh range if a common O&M cost had been
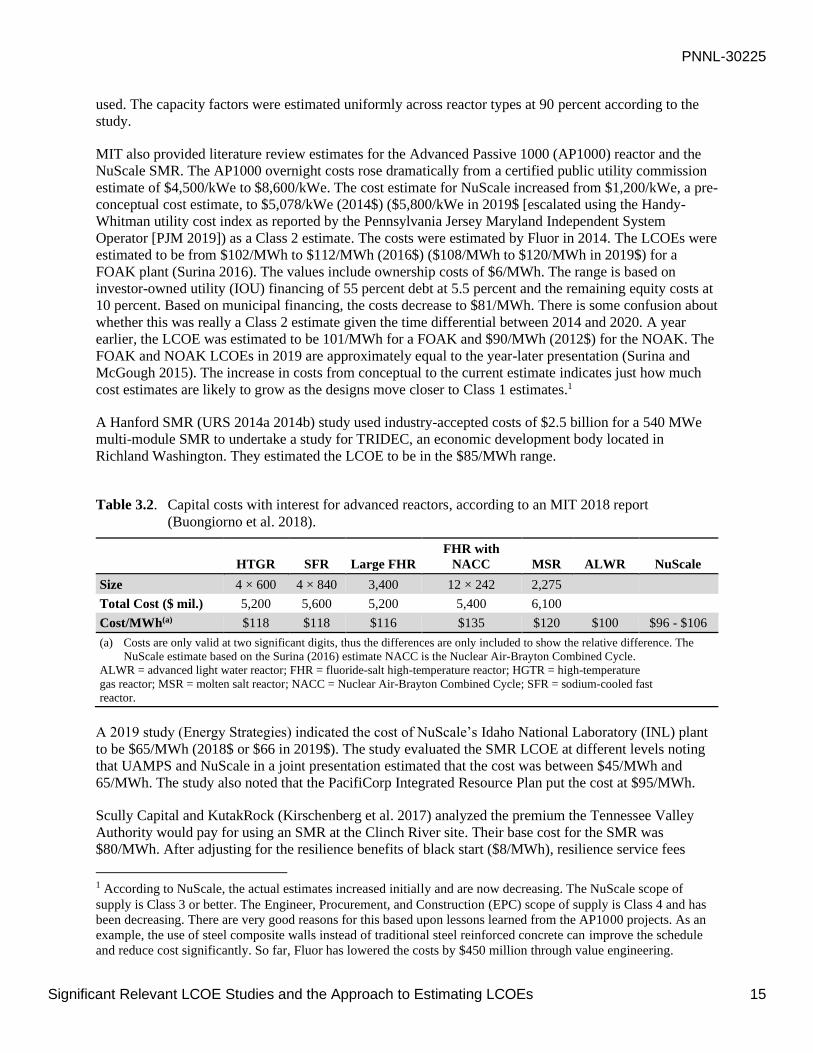
PNNL-30225
Significant Relevant LCOE Studies and the Approach to Estimating LCOEs 15
used. The capacity factors were estimated uniformly across reactor types at 90 percent according to the
study.
MIT also provided literature review estimates for the Advanced Passive 1000 (AP1000) reactor and the
NuScale SMR. The AP1000 overnight costs rose dramatically from a certified public utility commission
estimate of $4,500/kWe to $8,600/kWe. The cost estimate for NuScale increased from $1,200/kWe, a pre-
conceptual cost estimate, to $5,078/kWe (2014$) ($5,800/kWe in 2019$ [escalated using the Handy-
Whitman utility cost index as reported by the Pennsylvania Jersey Maryland Independent System
Operator [PJM 2019]) as a Class 2 estimate. The costs were estimated by Fluor in 2014. The LCOEs were
estimated to be from $102/MWh to $112/MWh (2016$) ($108/MWh to $120/MWh in 2019$) for a
FOAK plant (Surina 2016). The values include ownership costs of $6/MWh. The range is based on
investor-owned utility (IOU) financing of 55 percent debt at 5.5 percent and the remaining equity costs at
10 percent. Based on municipal financing, the costs decrease to $81/MWh. There is some confusion about
whether this was really a Class 2 estimate given the time differential between 2014 and 2020. A year
earlier, the LCOE was estimated to be 101/MWh for a FOAK and $90/MWh (2012$) for the NOAK. The
FOAK and NOAK LCOEs in 2019 are approximately equal to the year-later presentation (Surina and
McGough 2015). The increase in costs from conceptual to the current estimate indicates just how much
cost estimates are likely to grow as the designs move closer to Class 1 estimates.1
A Hanford SMR (URS 2014a 2014b) study used industry-accepted costs of $2.5 billion for a 540 MWe
multi-module SMR to undertake a study for TRIDEC, an economic development body located in
Richland Washington. They estimated the LCOE to be in the $85/MWh range.
Table 3.2. Capital costs with interest for advanced reactors, according to an MIT 2018 report
(Buongiorno et al. 2018).
HTGR SFR Large FHR
FHR with
NACC MSR ALWR NuScale
Size 4 × 600 4 × 840 3,400 12 × 242 2,275
Total Cost ($ mil.) 5,200 5,600 5,200 5,400 6,100
Cost/MWh(a) $118 $118 $116 $135 $120 $100 $96 - $106
(a) Costs are only valid at two significant digits, thus the differences are only included to show the relative difference. The
NuScale estimate based on the Surina (2016) estimate NACC is the Nuclear Air-Brayton Combined Cycle.
ALWR = advanced light water reactor; FHR = fluoride-salt high-temperature reactor; HGTR = high-temperature
gas reactor; MSR = molten salt reactor; NACC = Nuclear Air-Brayton Combined Cycle; SFR = sodium-cooled fast
reactor.
A 2019 study (Energy Strategies) indicated the cost of NuScale’s Idaho National Laboratory (INL) plant
to be $65/MWh (2018$ or $66 in 2019$). The study evaluated the SMR LCOE at different levels noting
that UAMPS and NuScale in a joint presentation estimated that the cost was between $45/MWh and
65/MWh. The study also noted that the PacifiCorp Integrated Resource Plan put the cost at $95/MWh.
Scully Capital and KutakRock (Kirschenberg et al. 2017) analyzed the premium the Tennessee Valley
Authority would pay for using an SMR at the Clinch River site. Their base cost for the SMR was
$80/MWh. After adjusting for the resilience benefits of black start ($8/MWh), resilience service fees
1 According to NuScale, the actual estimates increased initially and are now decreasing. The NuScale scope of
supply is Class 3 or better. The Engineer, Procurement, and Construction (EPC) scope of supply is Class 4 and has
been decreasing. There are very good reasons for this based upon lessons learned from the AP1000 projects. As an
example, the use of steel composite walls instead of traditional steel reinforced concrete can improve the schedule
and reduce cost significantly. So far, Fluor has lowered the costs by $450 million through value engineering.

PNNL-30225
Significant Relevant LCOE Studies and the Approach to Estimating LCOEs 16
($6/MWh), and research and isotope fees ($2/MWh), a premium of $18/MWh remained above the cost of
installing a NGCC facility estimated to have an LCOE of $54/MWh. No basis was provided for the SMR
cost.
An Energy + Environmental Economics (E-3) study (Aas et al. 2020) used a portfolio approach to analyze
the potential for an SMR to meet the requirements of providing power in the Western Electricity
Coordinating Council (WECC) for ENW. That study used a NuScale capital cost of $4,900/kWe and in
that report National Renewable Energy Laboratory (NREL) report estimated capital cost of $5,600/kWe.
Both cost estimates for fixed O&M were $9.9/MW-yr.
The U.S. Energy Information Administration (EIA) indicates the average cost of advanced nuclear power
is $6,317/kWe (2019$) for overnight cost. They also indicated there is an 8.7 percent added cost for
building in the Pacific Northwest (EIA 2020a). They also calculated the LCOE for advanced nuclear
power (2,256 MWe) to be $82/MWh, comprising capital at $56/MWh, fixed O&M at $16/MWh, variable
O&M at $9/MWh, and transmission at $1/MWh. A production tax credit could reduce the LCOE by
$7/MWh for entities that can monetize the tax credits. The production tax credit can be transferred by a
capital injection into the project, but care must be taken to assure the availability of the tax credit. An
advanced nuclear power reactor built in the Pacific Northwest would cost $90/MWh using the EIA
regional cost tables. The EIA cost estimates do not include the cost of interest.

PNNL-30225
Current Energy Market and Projected Electricity Demand 17
4.0 Current Energy Market and Projected Electricity Demand
The study documented here primarily depends on the Northwest Power and Planning Council’s (NPCC’s)
Seventh Power Plan (NPCC 2019) for the forecast of power and bases Washington’s market forecast on
the NPCC plan. The forecast takes the most recent EIA data as the base for Washington State and lays the
power plan on top of it. Because this study reaches beyond the scope of the power plan, potential changes
in future demand were reviewed and evaluated. For example, the potential for electric vehicles to become
a large portion of transportation by 2045 is examined. Note that this market evaluation was completed
prior to the COVID-19 pandemic. The recovery from the pandemic in the U.S. and in the state of
Washington could impact future projections.
4.1 Current Supply and Demand for Electricity
Washington State’s 2018 electricity generating capacity is 30,983 MWe. Figure 4.1 shows the capacity
by major resource type. Approximately 5 GWe is natural gas and coal based. Hydroelectric generation
accounts for about 69 percent of capacity. Nuclear and non-hydro renewables each provide another 4 and
11 percent, respectively. Approximately 15 percent of capacity is provided by fossil generation (EIA
2019a, 2019b). Coal generation, according to the Washington law, will be eliminated by 2025 or taxed at
$150/MWh. All commercial coal generation in Washington State will be closed by 2025 (Varton 2018).
The remaining 9 percent of installed capacity currently only operates 18–73 percent of the time, and the
largest share operates at about 42 percent of capacity. Thus, natural gas can probably replace the loss of
coal generation in the short term. In the longer term, the change in load will determine whether adequate
generation capacity is available.
Figure 4.1. Washington State generation capacity by shares in 2018 (for a total generating capacity of
30,983 MWe).

PNNL-30225
Current Energy Market and Projected Electricity Demand 18
4.2 Impact of BPA Entry into the Energy Imbalance Market
The BPA will likely enter the EIM in 20221 (BPA 2019a). A final decision will be made in fall 2021. This
report assumes BPA will be in the EIM. With BPA’s potential entry into the EIM, most of the Pacific
Northwest will be covered, with exception of a small area in north-central Washington. Most of the load
centers will be participants in the EIM. Certain parts of Washington are already a part of the EIM,
including Seattle City Light, Puget Sound Energy and PacifiCorp West (Figure 4.2). Tacoma Power will
join in 2022 as well. With BPA’s entry most of the power in Washington will be delivered by
transmission assets in the EIM. Currently, BPA owns 75 percent of the electric power transmission in the
Pacific Northwest.
Figure 4.2. The Western Interconnect Balancing Authority Areas in the EIM in 2019.
1 The energy imbalance market is the voluntary real-time market. The EIM allows cooperators to provide the lowest
cost power to all the markets within its boundaries. The system gives each participant visibility into grid operations
across all participating entities. The market allows the system to better integrate renewables in the system in real
time.

PNNL-30225
Current Energy Market and Projected Electricity Demand 19
BPA markets power from 31 hydroelectric projects with an installed capacity of 22 GW. In addition, BPA
markets the power of other entities including ENW’s CGS. BPA’s energy mix is 97 percent carbon free
(Florescu and Pead 2018). Few of the Federal Columbia River Power System dams are truly flexible
given the constraints on the system and other purposes that the system must serve. The Endangered
Species Act, navigation, flood control, irrigation, and recreation drive the amount of capacity available to
meet generation and flexibility requirements. The overall capacity of the region’s hydroelectric dams is
33 GW. The system can only generate 26 GW for 2 hours, 24 GW for 4 hours, and can only provide 19
GW for 10 hours. In addition, BPA’s capacity includes ramping capacity of 1,000 MW per hour when
ramping up but is very limited meeting down ramping capacity (Florescu and Pead 2018). In 2018, BPA
only had 600–900 MW of firm transmission available to go to the EIM market (Florescu and Pead 2018).
Providing flexibility is a primary reason to study the LCOEs of SMRs, because they may be able to
provide the flexibility required to incorporate more variable resource renewables as indicated in a recent
study by E-3 (Aas 2020).
Most of BPA’s firm contracts will expire just before a potential SMR comes online in 2029/2030.
Currently, BPA’s firm rate is $37.4/MWh. In addition, almost any plant in the Pacific Northwest may be
able to participate in the EIM. Thus, wholesale market prices will be strongly influenced by the EIM
average plus or minus transmission losses and congestion costs.
Because Washington State is a net exporter of electricity, most of the time, the value of transmission
losses is negative for power delivered compared with the rest of the EIM. Figure 4.3 shows the market
components for the EIM locational market price for Redmond, Washington, a city bordering Seattle,
Washington. The orange line is the EIM average price and the blue indications that are mostly obscured
by the congestion value are the whole price at Redmond. The components indicate the significant
difference in wholesale electricity cost between the EIM average and Redmond, Washington. The average
annual whole price for Redmond in 2019 was $35.35/MWh. Average wholesale prices were collected for
Pendleton, Oregon, as an indicator of eastside prices for electricity and for Bellingham, Washington, as
well as three sites surrounding the Centralia coal plant in an effort to see if there were any congestion
issues near the coal plant site. There were differences in the average annual Day-Ahead Market, but they
were minimal and were near the Redmond price, indicating that in the Pacific Northwest prices across the
region were not different enough to make a difference in where an SMR would be located. Other issues
such as the relative cost of production would drive the siting decision.
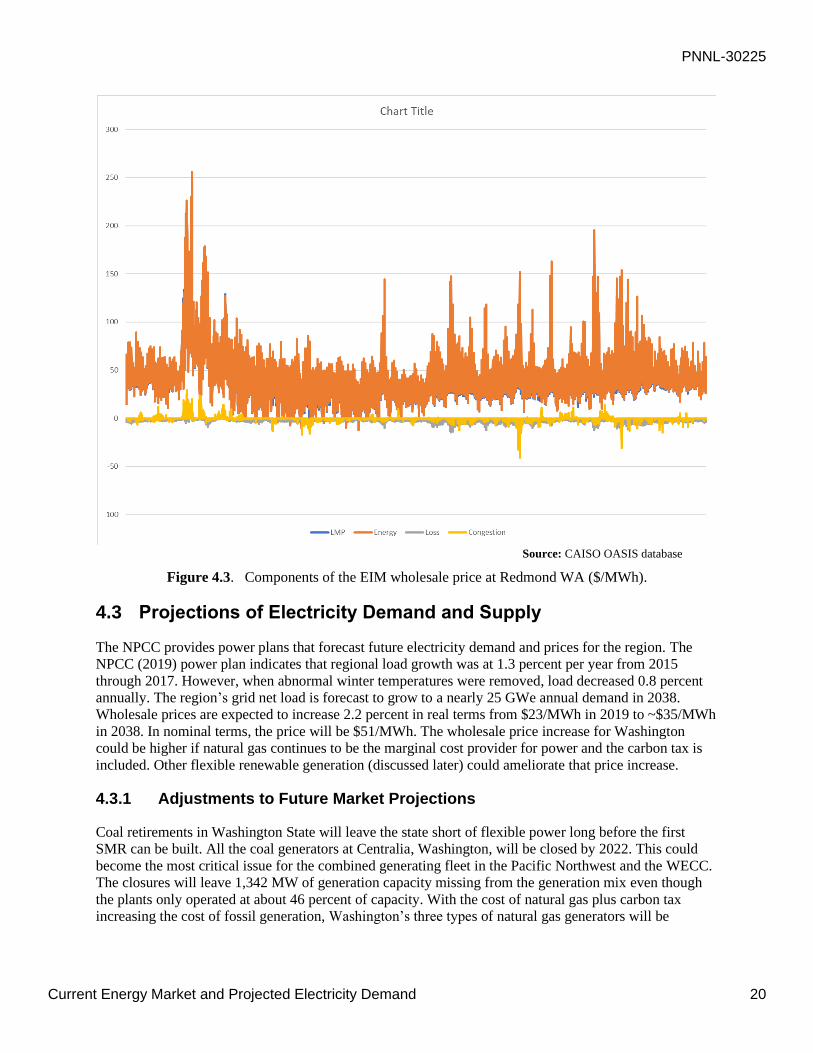
PNNL-30225
Current Energy Market and Projected Electricity Demand 20
Source: CAISO OASIS database
Figure 4.3. Components of the EIM wholesale price at Redmond WA ($/MWh).
4.3 Projections of Electricity Demand and Supply
The NPCC provides power plans that forecast future electricity demand and prices for the region. The
NPCC (2019) power plan indicates that regional load growth was at 1.3 percent per year from 2015
through 2017. However, when abnormal winter temperatures were removed, load decreased 0.8 percent
annually. The region’s grid net load is forecast to grow to a nearly 25 GWe annual demand in 2038.
Wholesale prices are expected to increase 2.2 percent in real terms from $23/MWh in 2019 to ~$35/MWh
in 2038. In nominal terms, the price will be $51/MWh. The wholesale price increase for Washington
could be higher if natural gas continues to be the marginal cost provider for power and the carbon tax is
included. Other flexible renewable generation (discussed later) could ameliorate that price increase.
4.3.1 Adjustments to Future Market Projections
Coal retirements in Washington State will leave the state short of flexible power long before the first
SMR can be built. All the coal generators at Centralia, Washington, will be closed by 2022. This could
become the most critical issue for the combined generating fleet in the Pacific Northwest and the WECC.
The closures will leave 1,342 MW of generation capacity missing from the generation mix even though
the plants only operated at about 46 percent of capacity. With the cost of natural gas plus carbon tax
increasing the cost of fossil generation, Washington’s three types of natural gas generators will be
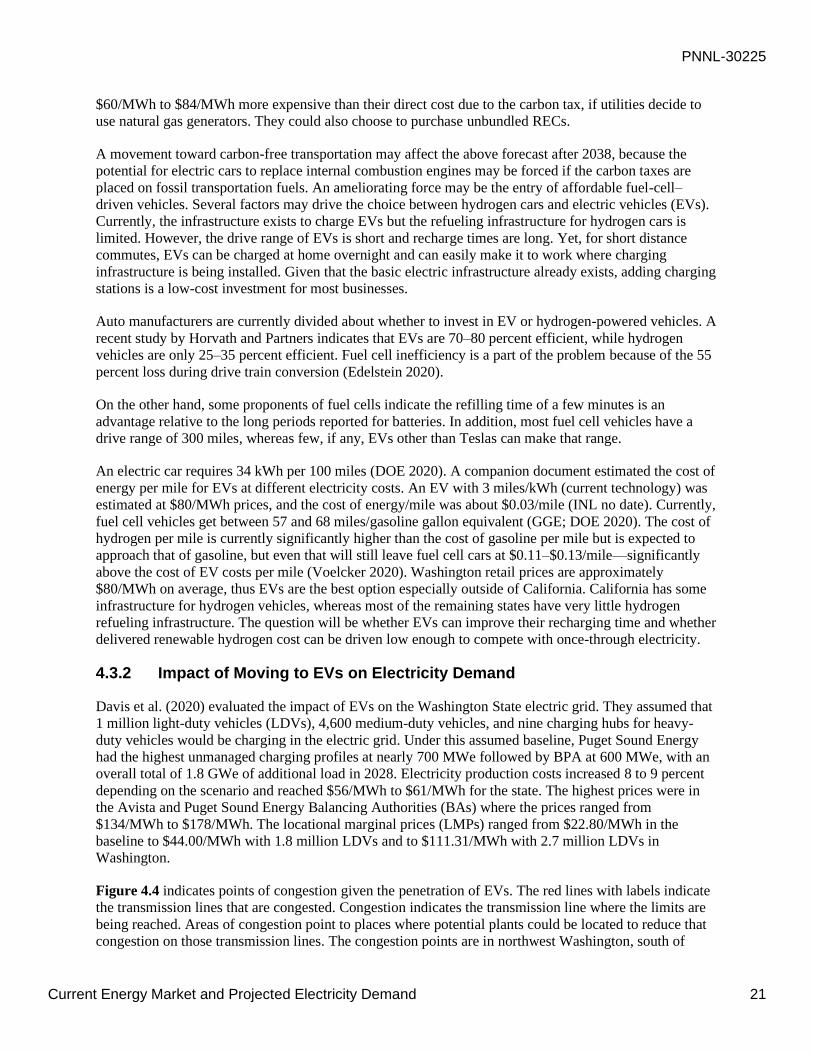
PNNL-30225
Current Energy Market and Projected Electricity Demand 21
$60/MWh to $84/MWh more expensive than their direct cost due to the carbon tax, if utilities decide to
use natural gas generators. They could also choose to purchase unbundled RECs.
A movement toward carbon-free transportation may affect the above forecast after 2038, because the
potential for electric cars to replace internal combustion engines may be forced if the carbon taxes are
placed on fossil transportation fuels. An ameliorating force may be the entry of affordable fuel-cell–
driven vehicles. Several factors may drive the choice between hydrogen cars and electric vehicles (EVs).
Currently, the infrastructure exists to charge EVs but the refueling infrastructure for hydrogen cars is
limited. However, the drive range of EVs is short and recharge times are long. Yet, for short distance
commutes, EVs can be charged at home overnight and can easily make it to work where charging
infrastructure is being installed. Given that the basic electric infrastructure already exists, adding charging
stations is a low-cost investment for most businesses.
Auto manufacturers are currently divided about whether to invest in EV or hydrogen-powered vehicles. A
recent study by Horvath and Partners indicates that EVs are 70–80 percent efficient, while hydrogen
vehicles are only 25–35 percent efficient. Fuel cell inefficiency is a part of the problem because of the 55
percent loss during drive train conversion (Edelstein 2020).
On the other hand, some proponents of fuel cells indicate the refilling time of a few minutes is an
advantage relative to the long periods reported for batteries. In addition, most fuel cell vehicles have a
drive range of 300 miles, whereas few, if any, EVs other than Teslas can make that range.
An electric car requires 34 kWh per 100 miles (DOE 2020). A companion document estimated the cost of
energy per mile for EVs at different electricity costs. An EV with 3 miles/kWh (current technology) was
estimated at $80/MWh prices, and the cost of energy/mile was about $0.03/mile (INL no date). Currently,
fuel cell vehicles get between 57 and 68 miles/gasoline gallon equivalent (GGE; DOE 2020). The cost of
hydrogen per mile is currently significantly higher than the cost of gasoline per mile but is expected to
approach that of gasoline, but even that will still leave fuel cell cars at $0.11–$0.13/mile—significantly
above the cost of EV costs per mile (Voelcker 2020). Washington retail prices are approximately
$80/MWh on average, thus EVs are the best option especially outside of California. California has some
infrastructure for hydrogen vehicles, whereas most of the remaining states have very little hydrogen
refueling infrastructure. The question will be whether EVs can improve their recharging time and whether
delivered renewable hydrogen cost can be driven low enough to compete with once-through electricity.
4.3.2 Impact of Moving to EVs on Electricity Demand
Davis et al. (2020) evaluated the impact of EVs on the Washington State electric grid. They assumed that
1 million light-duty vehicles (LDVs), 4,600 medium-duty vehicles, and nine charging hubs for heavy-
duty vehicles would be charging in the electric grid. Under this assumed baseline, Puget Sound Energy
had the highest unmanaged charging profiles at nearly 700 MWe followed by BPA at 600 MWe, with an
overall total of 1.8 GWe of additional load in 2028. Electricity production costs increased 8 to 9 percent
depending on the scenario and reached $56/MWh to $61/MWh for the state. The highest prices were in
the Avista and Puget Sound Energy Balancing Authorities (BAs) where the prices ranged from
$134/MWh to $178/MWh. The locational marginal prices (LMPs) ranged from $22.80/MWh in the
baseline to $44.00/MWh with 1.8 million LDVs and to $111.31/MWh with 2.7 million LDVs in
Washington.
Figure 4.4 indicates points of congestion given the penetration of EVs. The red lines with labels indicate
the transmission lines that are congested. Congestion indicates the transmission line where the limits are
being reached. Areas of congestion point to places where potential plants could be located to reduce that
congestion on those transmission lines. The congestion points are in northwest Washington, south of
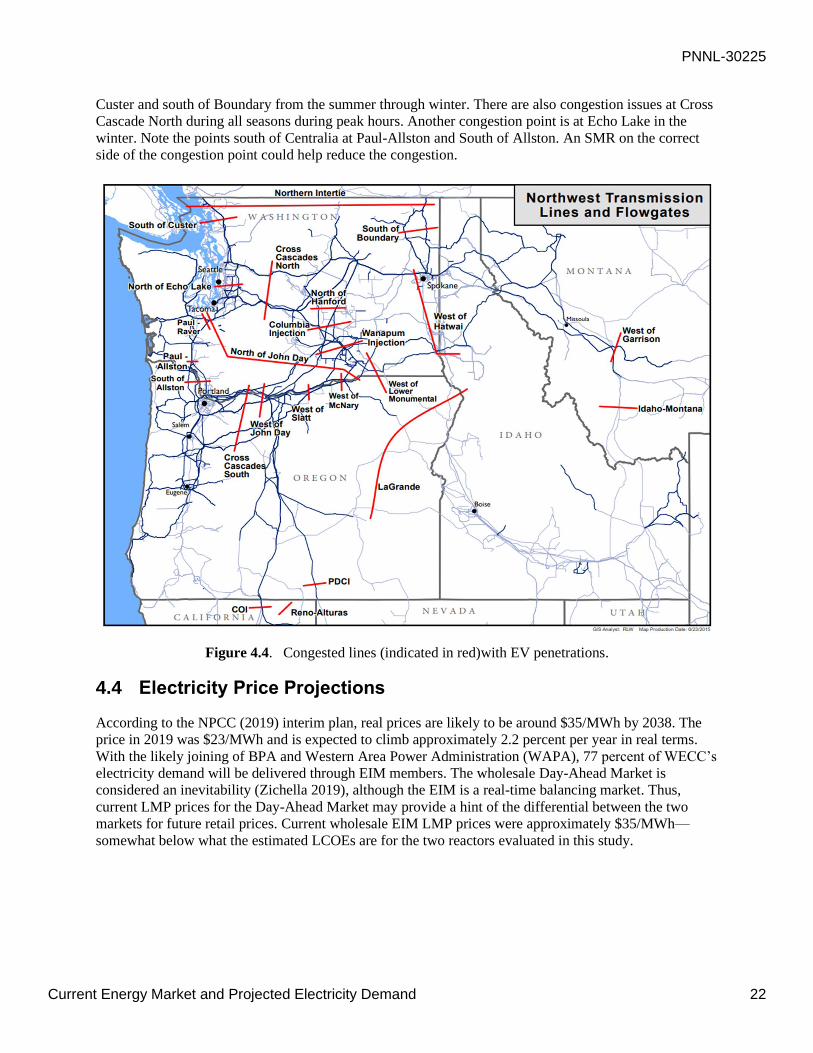
PNNL-30225
Current Energy Market and Projected Electricity Demand 22
Custer and south of Boundary from the summer through winter. There are also congestion issues at Cross
Cascade North during all seasons during peak hours. Another congestion point is at Echo Lake in the
winter. Note the points south of Centralia at Paul-Allston and South of Allston. An SMR on the correct
side of the congestion point could help reduce the congestion.
Figure 4.4. Congested lines (indicated in red)with EV penetrations.
4.4 Electricity Price Projections
According to the NPCC (2019) interim plan, real prices are likely to be around $35/MWh by 2038. The
price in 2019 was $23/MWh and is expected to climb approximately 2.2 percent per year in real terms.
With the likely joining of BPA and Western Area Power Administration (WAPA), 77 percent of WECC’s
electricity demand will be delivered through EIM members. The wholesale Day-Ahead Market is
considered an inevitability (Zichella 2019), although the EIM is a real-time balancing market. Thus,
current LMP prices for the Day-Ahead Market may provide a hint of the differential between the two
markets for future retail prices. Current wholesale EIM LMP prices were approximately $35/MWh—
somewhat below what the estimated LCOEs are for the two reactors evaluated in this study.

PNNL-30225
Case Studies 23
5.0 Case Studies
This section introduces the approach to estimating the LCOE (Section 5.1) and presents the case studies
for the (1) NuScale facility at INL, (2, 3) ENW Site 1 NuScale and GEH BWRX-300 options, and (4, 5)
Centralia NuScale and GEH BWRX-300 options developed to evaluate the LCOEs for NuScale and GEH
SMRs and presented in Section 5.2 in the order listed below.
• Case 1: NuScale Facility at Idaho National Laboratory
• Case 2: NuScale facility at ENW Site 1
• Case 3: GEH BWRX-300 at ENW Site 1
• Case 4: NuScale facility at coal plant site in Centralia Washington
• Case 5: GEH BWRX-300s at coal plant site in Centralia Washington.
Currently, there is little comparability in the LCOE estimates for the two SMRs being studied in detail.
The differences in the result are related to the different levels of maturity for the two designs and cost
estimate approaches. GEH is using a design-to-cost methodology with target pricing that is being
confirmed as the design matures. NuScale’s estimates are more mature than GEH’s estimates. An
estimate of the historical cost growth of mega-projects (both nuclear and non-nuclear by MIT
[Buongiorno et 2018]) indicates that there was significant growth in the cost of the NuScale estimate
between earlier and later estimates (Figure 5.1). The green lines indicate the projected change in costs as
normal project cost estimates move from Class 5 to Class 1 to actual costs. At completion actual costs are
1.0. Costs can diverge either positively or negatively from the final cost of the project. If that trend
continues the figure implies that NuScale’s recent estimate is about 75 percent of what the projected
actual cost for the FOAK plant will be. Improvements in the capacity of the individual module from 50
MW to 60 MW and a $450 million reduction in costs as a result of value engineering may have changed
the calculation though. UAMPS provides a $55/MWh Power Purchase Agreement (PPA) cost at the
beginning of this project for the UAMPS facility at INL. The value is heavily subsidized because the total
project costs are currently estimated to be more than $6 billion because DOE is providing up to $1.4
billion in financing (DOE/NE 2020).
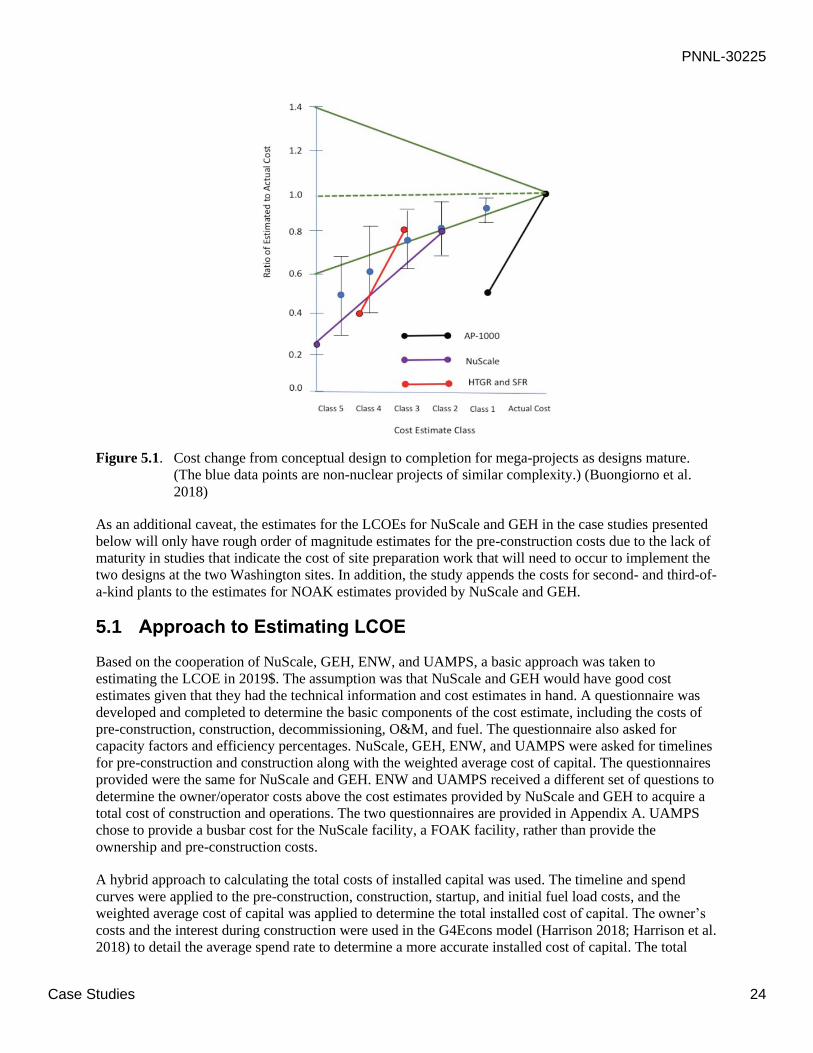
PNNL-30225
Case Studies 24
Figure 5.1. Cost change from conceptual design to completion for mega-projects as designs mature.
(The blue data points are non-nuclear projects of similar complexity.) (Buongiorno et al.
2018)
As an additional caveat, the estimates for the LCOEs for NuScale and GEH in the case studies presented
below will only have rough order of magnitude estimates for the pre-construction costs due to the lack of
maturity in studies that indicate the cost of site preparation work that will need to occur to implement the
two designs at the two Washington sites. In addition, the study appends the costs for second- and third-of-
a-kind plants to the estimates for NOAK estimates provided by NuScale and GEH.
5.1 Approach to Estimating LCOE
Based on the cooperation of NuScale, GEH, ENW, and UAMPS, a basic approach was taken to
estimating the LCOE in 2019$. The assumption was that NuScale and GEH would have good cost
estimates given that they had the technical information and cost estimates in hand. A questionnaire was
developed and completed to determine the basic components of the cost estimate, including the costs of
pre-construction, construction, decommissioning, O&M, and fuel. The questionnaire also asked for
capacity factors and efficiency percentages. NuScale, GEH, ENW, and UAMPS were asked for timelines
for pre-construction and construction along with the weighted average cost of capital. The questionnaires
provided were the same for NuScale and GEH. ENW and UAMPS received a different set of questions to
determine the owner/operator costs above the cost estimates provided by NuScale and GEH to acquire a
total cost of construction and operations. The two questionnaires are provided in Appendix A. UAMPS
chose to provide a busbar cost for the NuScale facility, a FOAK facility, rather than provide the
ownership and pre-construction costs.
A hybrid approach to calculating the total costs of installed capital was used. The timeline and spend
curves were applied to the pre-construction, construction, startup, and initial fuel load costs, and the
weighted average cost of capital was applied to determine the total installed cost of capital. The owner’s
costs and the interest during construction were used in the G4Econs model (Harrison 2018; Harrison et al.
2018) to detail the average spend rate to determine a more accurate installed cost of capital. The total

PNNL-30225
Case Studies 25
installed cost of capital divided by the capacity of the plant provides the cost per kilowatt-hour. The
G4Econs model provides this calculation. G4Econs was used to calculate the LCOE.
Neither GEH nor NuScale provided all the information requested in the questionnaires. Thus, cost bases
were adjusted to make the two cost estimates similar but not comparable. For example, one estimate
included the initial fuel load, the other did not; each provided decontamination and decommissioning
costs, but in a slightly different form, although both were based on NRC calculation methods; neither
included contingency, but the bases for being less than Class 1 estimates would indicate that some level of
contingency should be included. A Reliable Fuel Supply model (Phillips et al. 2010) was used to calculate
the missing initial fuel load for one plant. Rothwell (2004) was used to apply an appropriate contingency
based on the class of estimate provided. However, even with adjustments, the two LCOEs are not be
considered equivalent because the approaches taken toward the two estimates are totally different. One
entity is basing its cost estimates on the designs, the other is deploying a design-to-cost strategy to meet a
cost target. The different approaches to the cost estimate make them incomparable.
ENW will also have costs above those calculated by GEH and NuScale for pre-construction activities as
well as O&M. Additional costs that ENW will bear if they build an SMR at Site 1 (also known as WNP-
1) were estimated from a previous study. An ENW study performed by URS provided a basis for pre-
construction and construction costs for a new site, and then calculated potential savings for use of Site 1,
which already has an operating nuclear power plant (URS 2014a, 2014b). The costs for pre-construction
and construction were escalated to 2019$ because they are in 2014$. Construction cost savings are
deducted from the NuScale and GEH estimates.
In addition, ENW will be required to undertake a number of activities for licensing and permitting a new
plant. ENW estimates that the overall cost of permitting a new plant and other owner’s work will be
approximately $200 million for the NOAK plant. The 2014 URS study indicated that ENW might be able
to save $34 million on permitting a new plant because of work from the previous environmental impact
statement (EIS) and report work done at Site 1. The Centralia site will not have that advantage.
NRC regulations require that an EIS be developed for siting new commercial power reactors. An EIS is
required for a construction license under Title 10 of the Code of Federal Regulations Part 50 (10 CFR
Part 50), or a combined operation license or early site permit under 10 CFR Part 52. NuScale is applying
for a license under Part 52 and GEH is applying under Part 50 for the initial BWRX-300s. The EIS is
based on an environmental report (ER) prepared by an applicant for an NRC license or permit that
describes the environmental impacts of the proposed plant and reasonable alternatives. NEI reported
increasing total costs of NRC reviews of early site permits; the PSEG Nuclear, LLC review cost more
than $18M (NEI 2018). The costs to an applicant for the EIS phase of new plant licensing can be
considered in three categories:
• Direct Cost to the Applicant: ER preparation and EIS support
• Fee recovery by NRC: NRC staff effort for EIS preparation and licensee interactions
• NRC sub-contractor support for EIS preparation.
The cost of the EIS is based on the need to fully characterize the site. Once the site characterization
information is collected, the assessment steps are similar. In the vicinity of Site 1, the NRC recently
completed a Supplemental EIS for the renewal of the CGS operating license. In addition, DOE prepares
annual Site Environmental Reports for the Hanford Site. The differences in the environmental
characteristics of the two sites are highlighted in Table 5.1Table 5.1. Comparison of the
environmental characteristics at the proposed sites..
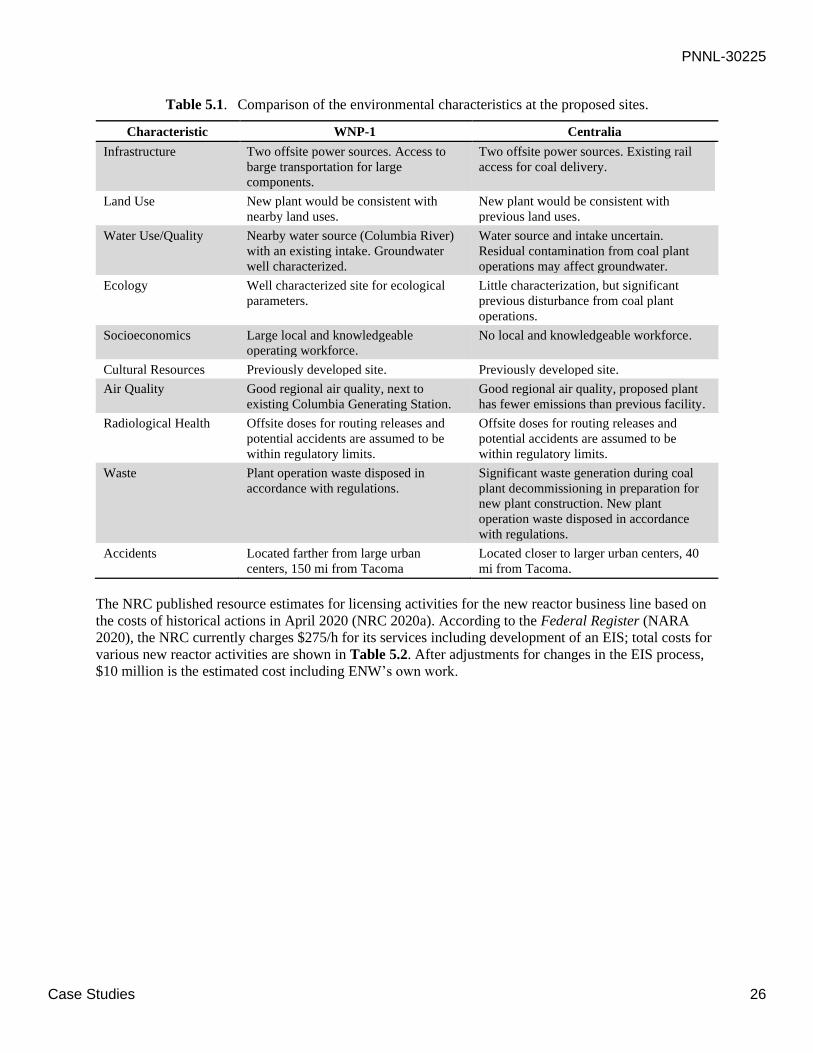
PNNL-30225
Case Studies 26
Table 5.1. Comparison of the environmental characteristics at the proposed sites.
Characteristic WNP-1 Centralia
Infrastructure Two offsite power sources. Access to
barge transportation for large
components.
Two offsite power sources. Existing rail
access for coal delivery.
Land Use New plant would be consistent with
nearby land uses.
New plant would be consistent with
previous land uses.
Water Use/Quality Nearby water source (Columbia River)
with an existing intake. Groundwater
well characterized.
Water source and intake uncertain.
Residual contamination from coal plant
operations may affect groundwater.
Ecology Well characterized site for ecological
parameters.
Little characterization, but significant
previous disturbance from coal plant
operations.
Socioeconomics Large local and knowledgeable
operating workforce.
No local and knowledgeable workforce.
Cultural Resources Previously developed site. Previously developed site.
Air Quality Good regional air quality, next to
existing Columbia Generating Station.
Good regional air quality, proposed plant
has fewer emissions than previous facility.
Radiological Health Offsite doses for routing releases and
potential accidents are assumed to be
within regulatory limits.
Offsite doses for routing releases and
potential accidents are assumed to be
within regulatory limits.
Waste Plant operation waste disposed in
accordance with regulations.
Significant waste generation during coal
plant decommissioning in preparation for
new plant construction. New plant
operation waste disposed in accordance
with regulations.
Accidents Located farther from large urban
centers, 150 mi from Tacoma
Located closer to larger urban centers, 40
mi from Tacoma.
The NRC published resource estimates for licensing activities for the new reactor business line based on
the costs of historical actions in April 2020 (NRC 2020a). According to the Federal Register (NARA
2020), the NRC currently charges $275/h for its services including development of an EIS; total costs for
various new reactor activities are shown in Table 5.2. After adjustments for changes in the EIS process,
$10 million is the estimated cost including ENW’s own work.

PNNL-30225
Case Studies 27
Table 5.2. NRC total cost for new reactors business line fee estimates (NRC 2020a).
Staff Hours Contractor Costs
Total
Cost
Licensing
Action
Low Level
of Effort
High
Level of
Effort Average
Low Level
of Effort
High
Level of
Effort Average
License
Amendments
30 1,819 263 N/A N/A N/A $0.072
Combined
Licenses
(8 total)
44,269 178,160 89,261 $2.76M $8.88M $5.02M $24.55M
Early Site
Permits (6
total)
14,626 64,940 29,104 $1.87M $5.11M $2.76M $8.00M
Design
Certifications
(6 total)
108,000 257,104 179,395 N/A N/A N/A $49.33M
The O&M costs include a $65,000 per property lease at Site 1 and ENW will pay taxes annually. ENW is
exempt from federal taxes (ENW 2018), but they will pay the Washington Privilege tax. They indicated
that Site 1 will pay 2 percent of gross revenues plus 5 percent of the first 4 mills of value per kilowatt-
hour and 5 percent of the first 4 mils of self-generated electricity. They also provided the Washington
Privilege Tax value for a 720 MWe SMR at the Centralia site (based on RCW 54.28.20). ENW will also
pay annual regulatory fees to the NRC (NRC 2020b). The annual fees have not been determined for
SMRs, but the language in the regulation indicated that they will be apportioned by the megawatt-thermal
of the reactor. Thus, the $4.7 million regulatory fee for large power reactors was apportioned by the
megawatt-thermal of each of the reactors based on the average megawatt-thermal rating of the U.S.
nuclear plant fleet. The calculations assumed an average of 3,600 MWt and a net efficiency of 30 percent.
ENW will also pay insurance. Only one firm underwrites insurance for the nuclear industry, American
Nuclear Insurers. A single unit reactor pays $1 million; the average for additional units is another $0.3
million or $1.3 million total (NRC 2019). In addition, ENW provided their overhead rates to apply to
operating costs.
The Centralia site costs were based on the added costs for pre-construction. The Centralia site is the
current site of Washington’s only coal-fired generation plants. The expectation is that the transmission
hookups will be large enough to handle two NuScale plants or four GEH BWRX-300s. In addition,
because TransAlta may be converting one of their coal plants to natural gas for the transition period to
2045, a brownfield site at one of TransAlta remediated sites will be used. The assumed site would pay
$196,000/ac and construct a transmission line to the transmission access vacated by the one coal plant that
will be removed.
The weighted average cost of capital (WACC) was assumed to be 4.3 percent, similar to ENW’s WACC,
and was used for both plants. In addition, a 5 percent and 7 percent WACC was evaluated to analyze the
effect of the change in interest costs on the LCOE. A sinking fund rate of 1 percent was based on the
average treasury yields for long-term bonds, a lowest-risk approach.
ENW projected fuel costs from their 2019 annual budget were used to provide a range of fuel prices
(Table 5.3) (ENW 2018). A $250/kgHM was assumed for standard fuel fabrication costs. An additional
25 percent surcharge was added to NuScale’s fabrication costs because the size of their fuel rods is
unique.
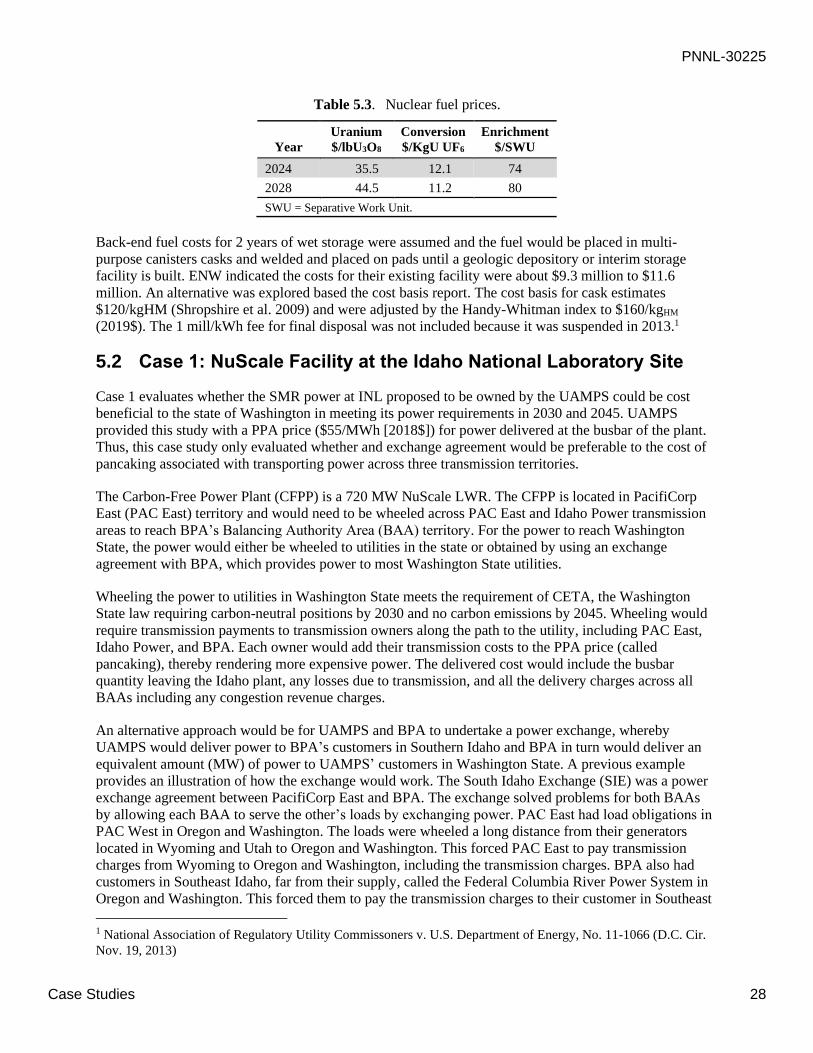
PNNL-30225
Case Studies 28
Table 5.3. Nuclear fuel prices.
Year
Uranium
$/lbU3O8
Conversion
$/KgU UF6
Enrichment
$/SWU
2024 35.5 12.1 74
2028 44.5 11.2 80
SWU = Separative Work Unit.
Back-end fuel costs for 2 years of wet storage were assumed and the fuel would be placed in multi-
purpose canisters casks and welded and placed on pads until a geologic depository or interim storage
facility is built. ENW indicated the costs for their existing facility were about $9.3 million to $11.6
million. An alternative was explored based the cost basis report. The cost basis for cask estimates
$120/kgHM (Shropshire et al. 2009) and were adjusted by the Handy-Whitman index to $160/kgHM
(2019$). The 1 mill/kWh fee for final disposal was not included because it was suspended in 2013.1
5.2 Case 1: NuScale Facility at the Idaho National Laboratory Site
Case 1 evaluates whether the SMR power at INL proposed to be owned by the UAMPS could be cost
beneficial to the state of Washington in meeting its power requirements in 2030 and 2045. UAMPS
provided this study with a PPA price ($55/MWh [2018$]) for power delivered at the busbar of the plant.
Thus, this case study only evaluated whether and exchange agreement would be preferable to the cost of
pancaking associated with transporting power across three transmission territories.
The Carbon-Free Power Plant (CFPP) is a 720 MW NuScale LWR. The CFPP is located in PacifiCorp
East (PAC East) territory and would need to be wheeled across PAC East and Idaho Power transmission
areas to reach BPA’s Balancing Authority Area (BAA) territory. For the power to reach Washington
State, the power would either be wheeled to utilities in the state or obtained by using an exchange
agreement with BPA, which provides power to most Washington State utilities.
Wheeling the power to utilities in Washington State meets the requirement of CETA, the Washington
State law requiring carbon-neutral positions by 2030 and no carbon emissions by 2045. Wheeling would
require transmission payments to transmission owners along the path to the utility, including PAC East,
Idaho Power, and BPA. Each owner would add their transmission costs to the PPA price (called
pancaking), thereby rendering more expensive power. The delivered cost would include the busbar
quantity leaving the Idaho plant, any losses due to transmission, and all the delivery charges across all
BAAs including any congestion revenue charges.
An alternative approach would be for UAMPS and BPA to undertake a power exchange, whereby
UAMPS would deliver power to BPA’s customers in Southern Idaho and BPA in turn would deliver an
equivalent amount (MW) of power to UAMPS’ customers in Washington State. A previous example
provides an illustration of how the exchange would work. The South Idaho Exchange (SIE) was a power
exchange agreement between PacifiCorp East and BPA. The exchange solved problems for both BAAs
by allowing each BAA to serve the other’s loads by exchanging power. PAC East had load obligations in
PAC West in Oregon and Washington. The loads were wheeled a long distance from their generators
located in Wyoming and Utah to Oregon and Washington. This forced PAC East to pay transmission
charges from Wyoming to Oregon and Washington, including the transmission charges. BPA also had
customers in Southeast Idaho, far from their supply, called the Federal Columbia River Power System in
Oregon and Washington. This forced them to pay the transmission charges to their customer in Southeast
1 National Association of Regulatory Utility Commissoners v. U.S. Department of Energy, No. 11-1066 (D.C. Cir.
Nov. 19, 2013)
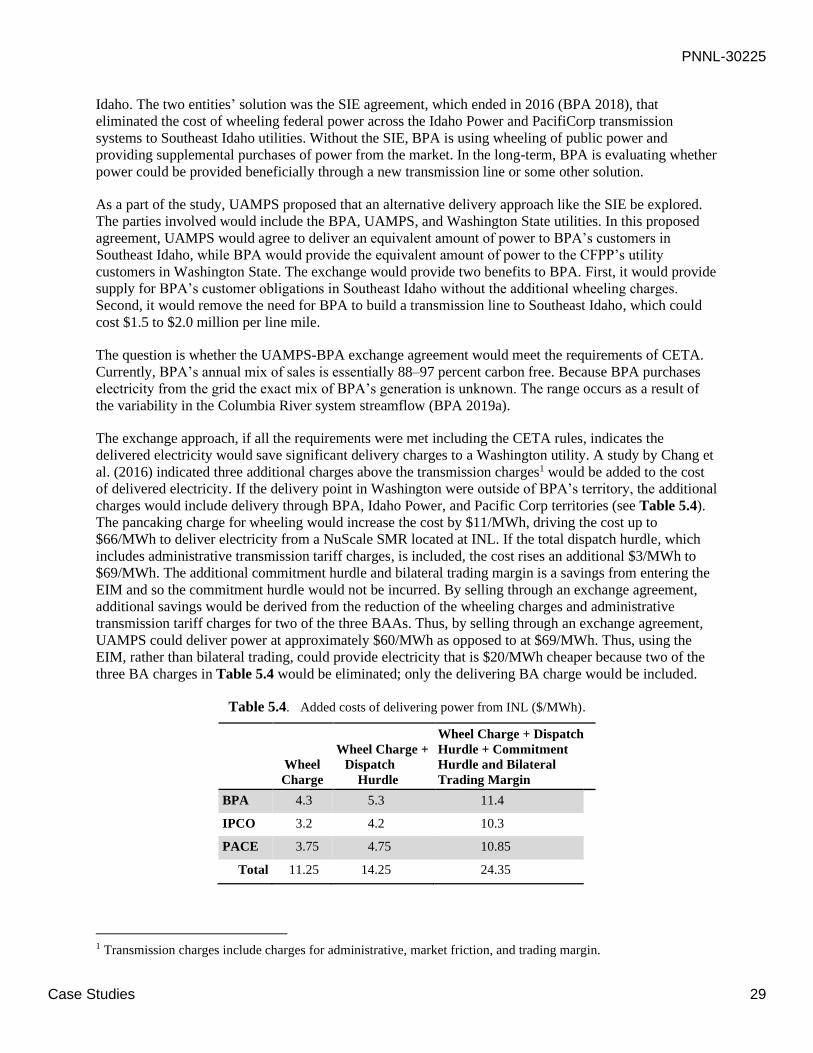
PNNL-30225
Case Studies 29
Idaho. The two entities’ solution was the SIE agreement, which ended in 2016 (BPA 2018), that
eliminated the cost of wheeling federal power across the Idaho Power and PacifiCorp transmission
systems to Southeast Idaho utilities. Without the SIE, BPA is using wheeling of public power and
providing supplemental purchases of power from the market. In the long-term, BPA is evaluating whether
power could be provided beneficially through a new transmission line or some other solution.
As a part of the study, UAMPS proposed that an alternative delivery approach like the SIE be explored.
The parties involved would include the BPA, UAMPS, and Washington State utilities. In this proposed
agreement, UAMPS would agree to deliver an equivalent amount of power to BPA’s customers in
Southeast Idaho, while BPA would provide the equivalent amount of power to the CFPP’s utility
customers in Washington State. The exchange would provide two benefits to BPA. First, it would provide
supply for BPA’s customer obligations in Southeast Idaho without the additional wheeling charges.
Second, it would remove the need for BPA to build a transmission line to Southeast Idaho, which could
cost $1.5 to $2.0 million per line mile.
The question is whether the UAMPS-BPA exchange agreement would meet the requirements of CETA.
Currently, BPA’s annual mix of sales is essentially 88–97 percent carbon free. Because BPA purchases
electricity from the grid the exact mix of BPA’s generation is unknown. The range occurs as a result of
the variability in the Columbia River system streamflow (BPA 2019a).
The exchange approach, if all the requirements were met including the CETA rules, indicates the
delivered electricity would save significant delivery charges to a Washington utility. A study by Chang et
al. (2016) indicated three additional charges above the transmission charges1 would be added to the cost
of delivered electricity. If the delivery point in Washington were outside of BPA’s territory, the additional
charges would include delivery through BPA, Idaho Power, and Pacific Corp territories (see Table 5.4).
The pancaking charge for wheeling would increase the cost by $11/MWh, driving the cost up to
$66/MWh to deliver electricity from a NuScale SMR located at INL. If the total dispatch hurdle, which
includes administrative transmission tariff charges, is included, the cost rises an additional $3/MWh to
$69/MWh. The additional commitment hurdle and bilateral trading margin is a savings from entering the
EIM and so the commitment hurdle would not be incurred. By selling through an exchange agreement,
additional savings would be derived from the reduction of the wheeling charges and administrative
transmission tariff charges for two of the three BAAs. Thus, by selling through an exchange agreement,
UAMPS could deliver power at approximately $60/MWh as opposed to at $69/MWh. Thus, using the
EIM, rather than bilateral trading, could provide electricity that is $20/MWh cheaper because two of the
three BA charges in Table 5.4 would be eliminated; only the delivering BA charge would be included.
Table 5.4. Added costs of delivering power from INL ($/MWh).
Wheel
Charge
Wheel Charge +
Dispatch
Hurdle
Wheel Charge + Dispatch
Hurdle + Commitment
Hurdle and Bilateral
Trading Margin
BPA 4.3 5.3 11.4
IPCO 3.2 4.2 10.3
PACE 3.75 4.75 10.85
Total 11.25 14.25 24.35
1 Transmission charges include charges for administrative, market friction, and trading margin.

PNNL-30225
Case Studies 30
5.3 Energy Northwest Site 1
ENW is expected to be the owner/operator for an SMR at Site 1. According to ENW, they obtained a
URS report in 2014 that said they could reduce costs substantially for the site. That study reported
approximately $30 million (2014$) could be saved in licensing costs. The biggest cost savings in the
licensing process involve the following activities in which all or a portion thereof may be reduced
substantially if we could base much of it on what was completed in the past. The costs and benefits that
would accrue to an ENW facility at Site 1 are listed below.
• Final Safety Analysis Report development (required by 10 CFR 52.79)
– seismic characterization
– geologic characterization
– hydrologic characterization
– meteorological characterization
– assessment of nearby facilities, hazards, population
• Siting assessment (required by 10 CFR 52.79(a)(1) and 10 CFR 100) in addition to that needed for
the Final Safety Analysis Report
– features having a significant bearing on accident (probability/consequence)
– underground structure and history
– underground tectonic structures and effects of manmade activities
– evaluation of past earthquakes on site
– ground properties
– historical earthquakes affecting the site
– nearby earthquake epicenters
– determination of capable faults within 200 miles
– required investigation for surface faulting
– required investigation for seismically induced floods and water waves
– seismic and geologic design bases
○ safe shutdown earthquake
○ operating basis earthquake
• ER (required by 10 CFR 50.30(f) and described in NRC Regulatory Guide 4.2 (NRC 2018)
– land use
– water resources
– ecological resources
– socioeconomics
– environmental justice
– historical and cultural resources
– air resources
– nonradiological health
○ public and occupational health
○ noise
○ transportation
○ electromagnetic fields
– environmental impacts from construction
○ environmental impacts from operation
○ fuel cycle, transportation and decommissioning impacts
○ cumulative impacts

PNNL-30225
Case Studies 31
○ environmental impacts of alternatives
– energy alternatives
– site alternatives
– design/system alternatives.
In addition, the URS (2014a and 2014b) study indicated that because Site 1 was 65 percent finished when
work stopped at the site and that the remaining structures were in good shape, they could be used for the
construction of an SMR. The study indicated that nearly $140 million (2014$) could be saved. The costs
and benefits that would accrue to an ENW facility at Site 1 are listed in Table 5.5. The remaining amount
of savings would be due to a 1-year savings related to the shortened project schedule.
Table 5.5. A list of savings from Site 1 derived from using previous plants’ remaining structures ($000
2014$).
Account Description
Factory
Cost Labor Cost
Material
Cost Total Cost Credits
211 Yardwork 570 20,138 15,080 35,788 17,733
218B Administration and Service
Building
1,184 5,343 4,312 10,839 3,252
218D Fire Pump House 57 362 260 679 679
218L Technical Support Center 78 723 408 1,209 1,028
218S Wastewater Treatment Center 13 683 459 1,155 1,039
214 Security Building 78 1,395 616 2,090 1,672
216 Waste Processing Building 983 14,244 8,089 23,316 11,658
242 Station Service Equipment 37,767 2,890 533 41,191 1,978
243 Switchboards 2,918 646 253 3,818 998
244 Protective Equipment
4,504 3,879 8,383 507
252 Air, Water and Steam Service
Systems
11,725 21,853 7,601 41,179 10,361
253 Communication Systems 3,222 6,999 1,124 11,345 7,434
254 Furnishings and Fixtures 3,993 981 132 5,105 1,855
255 Wastewater Treatment
Equipment
1,425 3,661 396 5,482 5,207
The study also indicated the plant would take one less year to complete because of all the items already in
place. Both GEH and NuScale plants had 1 year of construction removed.
5.3.1 Case 2: NuScale at the Energy Northwest Site 1
According to the agreements with NuScale and GEH only the LCOE will be published. At approximately
$51.02/MWh over a 40-year operational period (see Table 5.6), the NuScale costs at ENW Site 1 are
lower than the $55/MWh provided by UAMPS for the INL site; the former is the comparative baseline
value assuming a 4 percent WACC, 30 percent efficiency, and a 95 percent capacity factor. The value in

PNNL-30225
Case Studies 32
every table in this section is compared against the $51.02/MWh. The Site 1 facility would benefit from
previous EIS and licensing efforts, from facilities and infrastructure built for the Site 1 reactor that was
never completed, and from a 1-year reduction in the construction time. Thus, estimates for other sites may
be higher depending the benefits of the site.
Different levels of the WACC were considered as part of the analysis, including evaluated costs at 3, 4, 5,
6, and 7 percent. The 3 and 5 percent WACC levels provide a bounding level for organizations such as
ENW. The 7 percent real rate reflects the LCOE at an the IOU’s real rate. Note that the interest rate
increase of 1 percent adds more than $5/MWh and that the effect of compounding adds $7/MWh between
6 percent and 7 percent weighted average costs of capital.
The effects of a lower fuel cost using an MIT value of $6.00/kgU1 for conversion rather than the
$11.20/kgU that ENW was forecasting for 2028 were evaluated. We also lowered the prices for uranium
and enrichment to the ENW 2024 prices of $35.5/lb of U3O8 and $74/Separative Work Unit (SWU). The
change in fuel cost decreased the LCOE by $0.59/MWh from the baseline value of $51.02. This further
emphasizes how little fuel costs influence the overall LCOE.
Table 5.6. NuScale’s LCOEs at Site 1 for different real interest rates for the WACC ($/MWh).
Interest Rate
LCOE 3% WACC 4% WACC 5% WACC 6% WACC 7% WACC
$/MWh (2019$) 46.20 51.02 56.40 62.35 68.83
The project length affects the LCOE through the added costs of interest during construction. The added
interest costs approximately $2/MWh as the project length balloons by 4 years. Although only the project
length was increased, typically the construction costs increase as annual fixed overhead accumulates
(Table 5.7).
Table 5.7. Project length at Site 1 ($/MWh).
Project Length
LCOE 4 years 5 years 6 years 7 years 8 years 9 years
$/MWh (2019$) 50.41 51.02 52.27 52.27 52.92 53.58
Table 5.8 illustrates the impact on LCOE of extending the operating length from 40 years to 100 years,
assuming that financing is based on the operating period. Although costs decline to $44/MWh from about
$51/MWh, most plants will be financed for 40 years or less. The value for 100 years provides the average
cost across the operating period. Once the plant is financed the 40 years cash costs will decline
dramatically.
Table 5.8. Operational period length at Site 1 ($/MWh).
Length of Operations
LCOE 40 years 60 years 80 years 100 years
1 Personal communications with Jacopo Buongiorno, August 28, 2020.
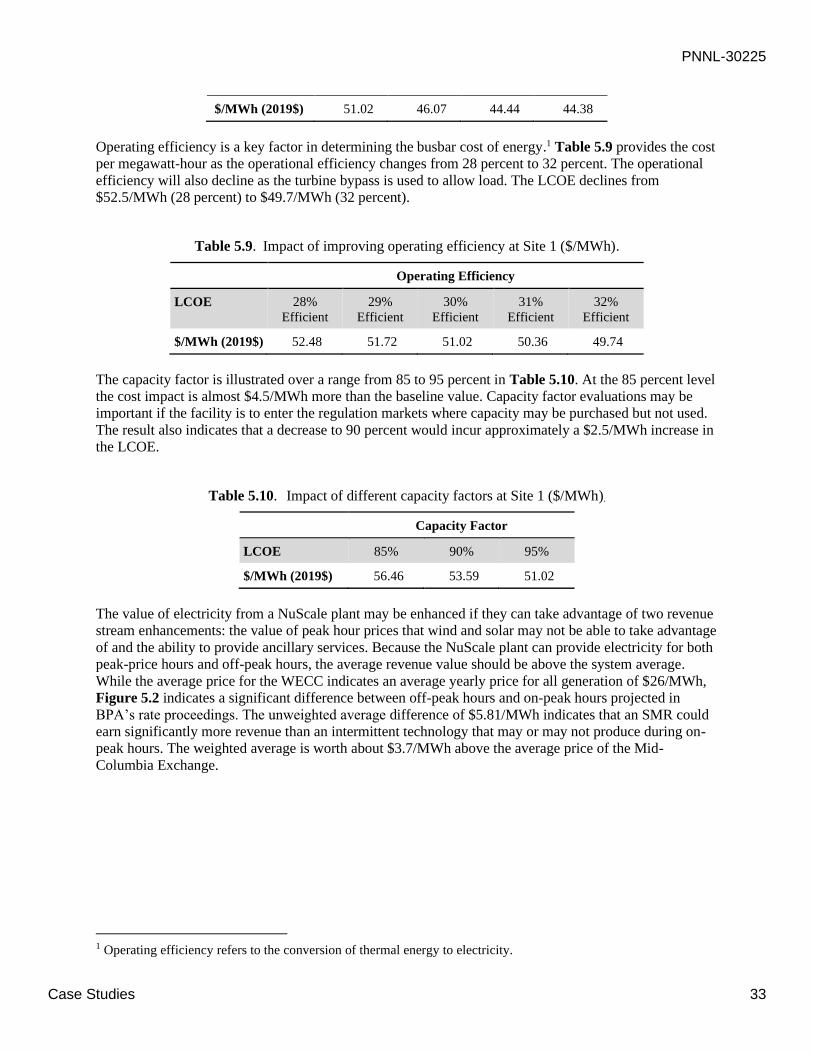
PNNL-30225
Case Studies 33
$/MWh (2019$) 51.02 46.07 44.44 44.38
Operating efficiency is a key factor in determining the busbar cost of energy.1 Table 5.9 provides the cost
per megawatt-hour as the operational efficiency changes from 28 percent to 32 percent. The operational
efficiency will also decline as the turbine bypass is used to allow load. The LCOE declines from
$52.5/MWh (28 percent) to $49.7/MWh (32 percent).
Table 5.9. Impact of improving operating efficiency at Site 1 ($/MWh).
Operating Efficiency
LCOE 28%
Efficient
29%
Efficient
30%
Efficient
31%
Efficient
32%
Efficient
$/MWh (2019$) 52.48 51.72 51.02 50.36 49.74
The capacity factor is illustrated over a range from 85 to 95 percent in Table 5.10. At the 85 percent level
the cost impact is almost $4.5/MWh more than the baseline value. Capacity factor evaluations may be
important if the facility is to enter the regulation markets where capacity may be purchased but not used.
The result also indicates that a decrease to 90 percent would incur approximately a $2.5/MWh increase in
the LCOE.
Table 5.10. Impact of different capacity factors at Site 1 ($/MWh).
Capacity Factor
LCOE 85% 90% 95%
$/MWh (2019$) 56.46 53.59 51.02
The value of electricity from a NuScale plant may be enhanced if they can take advantage of two revenue
stream enhancements: the value of peak hour prices that wind and solar may not be able to take advantage
of and the ability to provide ancillary services. Because the NuScale plant can provide electricity for both
peak-price hours and off-peak hours, the average revenue value should be above the system average.
While the average price for the WECC indicates an average yearly price for all generation of $26/MWh,
Figure 5.2 indicates a significant difference between off-peak hours and on-peak hours projected in
BPA’s rate proceedings. The unweighted average difference of $5.81/MWh indicates that an SMR could
earn significantly more revenue than an intermittent technology that may or may not produce during on-
peak hours. The weighted average is worth about $3.7/MWh above the average price of the Mid-
Columbia Exchange.
1 Operating efficiency refers to the conversion of thermal energy to electricity.
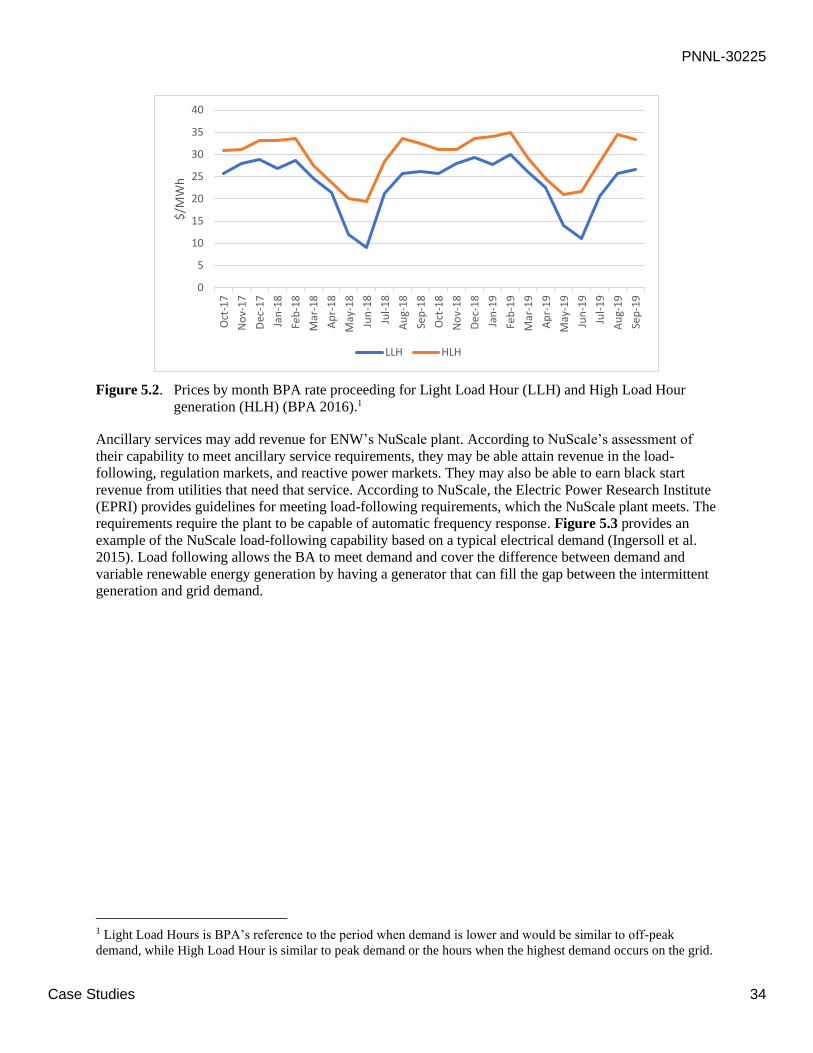
PNNL-30225
Case Studies 34
Figure 5.2. Prices by month BPA rate proceeding for Light Load Hour (LLH) and High Load Hour
generation (HLH) (BPA 2016).1
Ancillary services may add revenue for ENW’s NuScale plant. According to NuScale’s assessment of
their capability to meet ancillary service requirements, they may be able attain revenue in the load-
following, regulation markets, and reactive power markets. They may also be able to earn black start
revenue from utilities that need that service. According to NuScale, the Electric Power Research Institute
(EPRI) provides guidelines for meeting load-following requirements, which the NuScale plant meets. The
requirements require the plant to be capable of automatic frequency response. Figure 5.3 provides an
example of the NuScale load-following capability based on a typical electrical demand (Ingersoll et al.
2015). Load following allows the BA to meet demand and cover the difference between demand and
variable renewable energy generation by having a generator that can fill the gap between the intermittent
generation and grid demand.
1 Light Load Hours is BPA’s reference to the period when demand is lower and would be similar to off-peak
demand, while High Load Hour is similar to peak demand or the hours when the highest demand occurs on the grid.
0
5
10
15
20
25
30
35
40
Oct-17
Nov-17
Dec-17
Jan-18
Feb-18
Mar-18
Apr-18
May-18
Jun-18
Jul-18
Aug-18
Sep-18
Oct-18
Nov-18
Dec-18
Jan-19
Feb-19
Mar-19
Apr-19
May-19
Jun-19
Jul-19
Aug-19
Sep-19
$/M
Wh
LLH HLH
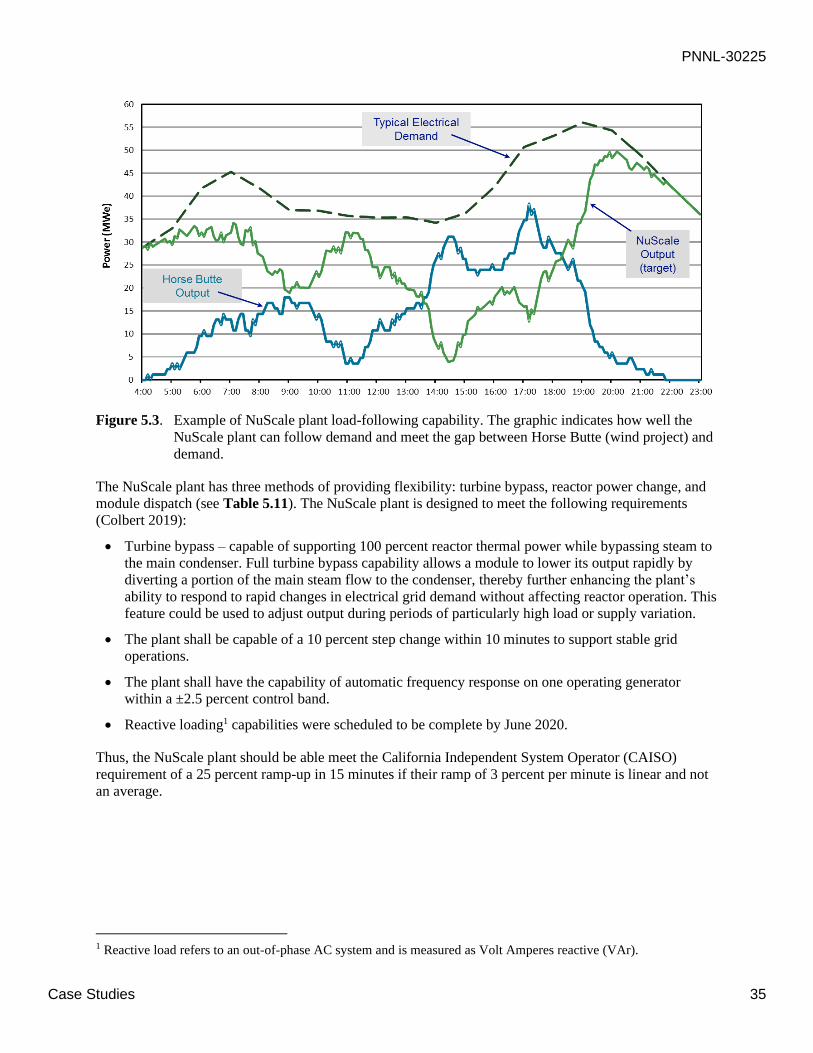
PNNL-30225
Case Studies 35
Figure 5.3. Example of NuScale plant load-following capability. The graphic indicates how well the
NuScale plant can follow demand and meet the gap between Horse Butte (wind project) and
demand.
The NuScale plant has three methods of providing flexibility: turbine bypass, reactor power change, and
module dispatch (see Table 5.11). The NuScale plant is designed to meet the following requirements
(Colbert 2019):
• Turbine bypass – capable of supporting 100 percent reactor thermal power while bypassing steam to
the main condenser. Full turbine bypass capability allows a module to lower its output rapidly by
diverting a portion of the main steam flow to the condenser, thereby further enhancing the plant’s
ability to respond to rapid changes in electrical grid demand without affecting reactor operation. This
feature could be used to adjust output during periods of particularly high load or supply variation.
• The plant shall be capable of a 10 percent step change within 10 minutes to support stable grid
operations.
• The plant shall have the capability of automatic frequency response on one operating generator
within a ±2.5 percent control band.
• Reactive loading1 capabilities were scheduled to be complete by June 2020.
Thus, the NuScale plant should be able meet the California Independent System Operator (CAISO)
requirement of a 25 percent ramp-up in 15 minutes if their ramp of 3 percent per minute is linear and not
an average.
1 Reactive load refers to an out-of-phase AC system and is measured as Volt Amperes reactive (VAr).

PNNL-30225
Case Studies 36
Table 5.11. NuScale flexibility capabilities (Colbert 2019).
Method Up Power Down Power
Turbine Bypass 20% to 100%
27 minutes
3%/minute
100% to 20%
8 minutes
10%/minute
Reactor Power
Change
20% to 100%
96 minutes
50%/hour
100% to 20%
< 24 minutes
200%/hour
Module Dispatch HSD to 100%
13 hours
Refueling
100% to HSD
30 minutes
200%/hour
HSD = Hot Shutdown.
BPA provides ancillary services to their customers as an additional charge to the delivered electricity.
However, there is no wholesale market in the Pacific Northwest for ancillary services. BPA’s priority
firm power rate along with the demand charge rate are shown in Table 5.12 (BPA 2019c). The rates
indicate BPA’s cost to deliver. Thus, the value to a generator providing these services would be somewhat
less. BPA’s load following includes a load-shaping charge. The load-following charge comprises two of
three charges: a load-following charge, a demand charge, and a load-shaping charge.
Table 5.12. Priority firm power rate and demand charges (BPA 2019c).
Energy Rate
($/MWh)
Demand
Rate
($/kW)
Month HLH LLH HLH
October 39.03 34.07 11.42
November 40.38 37.03 12.07
December 43.28 38.75 13.45
January 40.43 34.4 12.1
February 39.55 34.47 11.66
March 34.38 31.3 9.19
April 33.17 29.59 8.61
May 26.9 21.74 5.6
June 25.71 16.87 5.04
July 36.64 30.5 10.27
August 40.43 35.4 12.1
September 40.05 35.17 11.91
BPA’s load-following rate is as follows (BPA 2019c):
• Customer Rate = ($1,980,553 * TOCA) composite and (-200,365) * TOCA for non-slice customers
• TOCA = Fiscal year Individual M High-Water Mark/Total fiscal year high-water mark.
A load-following customer will also pay the demand charge listed in Table 5.13 (BPA 2019c). The load-
shaping charge is shown in Table 5.13. The load-shaping billing determinant is based on the portion High
Load Hour (HLH) and Light Load Hour (LLH) portion for each month and the number of actual load

PNNL-30225
Case Studies 37
kilowatt-hours minus the shaped load in kilowatt-hours. The load-shaping charge can be positive or
negative depending on whether the billing determinant for load shaping is positive or negative.
Table 5.13. BPA load-shaping rate.
Month
Rate in
mills/kWh
HLH
($/MWh)
LLH
($/MWh)
October 23.84 18.88
November 25.19 21.84
December 28.09 23.56
January 25.24 19.21
February 24.36 19.28
March 19.19 16.11
April 17.98 14.4
May 11.71 6.55
June 10.52 1.68
July 21.45 15.31
August 25.24 20.21
September 24.86 19.98
Transmission charges are the net of transmission costs and the BPA formula transmission rate is
dependent on the type of transmission, the distance, and whether energy is crossing 230 kV lines or lines
less than 230 kV (see Table 5.14) (BPA 2019b). The rates are calculated each quarter based on the
Ancillary and Control Area Service Rates - ACS-20 Reactive and Voltage Control requirement
($1.726/kW/month +1 and multiplied by the sum of the main and secondary charges). Assuming there is
no reactive power issue, it is just the sum of main and secondary charges. The rate for Site 1 would be
approximately $2.1/MWh charge.
Table 5.14. Base transmission rates for main and secondary systems.
Main Grid Charges Rate
1 Main Grid Distance $0.0729 per mile
2 Main Grid Interconnection Terminal $0.76kW
3 Main Grid Terminal $0.84/kW
4 Main Grid Miscellaneous Facilities $4.16/kW
Secondary System Charges
1 Secondary System Distance $0.7173 per mile
2 Secondary System Transformation $7.84/kW
3 Secondary System Intermediate Terminal $3.03/kW
4 Secondary System Interconnection Terminal $2.14/kW
5.3.1.1 Conclusions for NuScale at Site 1
With the value of electricity on the Mid-Columbia Exchange averaging approximately $23/MWh, and
expected rise to $35/MWh (see Section 4.4.1) according to the Northwest Power Plan, and if this is the
market price to compete with before 2030, the NuScale plant would require about a $16/MWh subsidy for

PNNL-30225
Case Studies 38
ENW to break even in the baseline case ($51.02/MWh) if the market value is the cost of the competition.
If nuclear power is the only non-emitting dispatchable resource, the penalty for emitting resources
($60/MWh, see Section 4.3.1) makes it cost competitive with NGCC at $36.61/MWh, which including
the penalty would cost $96.61/MWh after 2029.
Perhaps with the EIM expanding to include most of the state of Washington there will be a wholesale
market by the time the NuScale plant is built. If the CAISO wholesale market is expanded to the region
the value of ancillary services might be met by the NuScale plant. Regulation Up prices varied between
$2.88/MWh to $6.86/MWh while Regulation Down prices varied between $3.03/MWh to $5.29/MWh.
The prices for these services appeared to decline over the collection period from 2009 to 2014 (Zhou et al.
2016). These prices are above the cost of the energy. Thus, the NuScale plant could earn as much as
$35/MWh for energy and add on the ancillary services value if a wholesale market opened in the future
for this product before 2029.
Thus, given the CETA charges for NGCC generation of $60/MWh, a NuScale plant at Site 1 should be a
competitive resource if there are no other firm resources after 2029.
5.3.2 Case 3: GEH BWRX-300 at the Energy Northwest Site 1
The GEH BWRX-300 and NuScale LCOEs are not intended to be directly compared in this study. GEH
is using a design-to-cost methodology with target pricing that is being confirmed as the design matures.
NuScale’s estimate is based on the current design. According to the agreements with GEH only the LCOE
will be published. The GEH BWRX-300 at Site 1 provides an LCOE of $43.98/MWh based on
Table 5.15 at the 4 percent WACC. This is the comparative value in every table. However, some factors
favor the GEH BWRX-300 at Site 1 over the Centralia site, which is discussed later. As noted above,
there are about $300 million in savings for building at Site 1. The facility will benefit from previous EIS
and licensing efforts reducing the cost by approximately $30 million, from facilities built for the Site 1
reactor that was never completed, and the remaining 1-year reduction in the construction time. Thus,
estimates for other sites may be higher depending on the benefits of the site.
As a part of the analysis we evaluated the different levels of the WACC including evaluating costs at 3, 4,
5, 6, and 7 percent. The 3 and 5 percent WACC levels provide a bounding level for organizations such as
ENW. The 7 percent real rate reflects the LCOE at an the IOU’s real rate. Note that the interest rate
increase of 1 percent adds more than $4.00/MWh and that the effect of compounding adds $5.20/MWh
between 6 percent and 7 percent.
We also evaluated the effects of a lower fuel cost using an MIT value of $6.00/kgU for conversion rather
than the $11.20/kgU that ENW was forecasting for 2028. We also lowered the prices for uranium and
enrichment to the ENW 2024 prices of $35.5/lb of U3O8 and $74/SWU. The change in fuel cost
decreased the LCOE by $0.59/MWh from the $43.98/MWh level, which we are considering the expected
price. This further emphasizes how little fuel costs influence the overall LCOE.

PNNL-30225
Case Studies 39
Table 5.15. GEH BWRX-300’s LCOEs at Site 1 for different real interest rates for the WACC
($/MWh).
Interest Rate
LCOE 3% WACC 4% WACC 5% WACC 6% WACC 7% WACC
$/MWh (2019$) 40.60 43.98 47.69 51.72 56.06
The project length impacts the LCOE through the added costs of interest during construction. The added
interest costs approximately $2/MWh because the project length balloons by 5 years. Although only the
project length was increased, typically the construction costs increase as annual fixed overhead
accumulates (Table 5.16).
Table 5.16. Project length at Site 1 ($/MWh).
Project Length
LCOE 4 years 5 years 6 years 7 years 8 years 9 years
$/MWh (2019$) 43.98 44.40 44.83 45.18 45.73 46.20
Table 5.17 provides the impact on LCOE of extending the operating length from 40 years to 100 years.
Although costs decline to $38/MWh from just less than $44/MWh, most plants will be financed for
40 years or less. GEH indicated they are planning for their plant to operate for 60 years as the base case.
The value for 100 years provides the average cost across operating periods. Once the plant is financed, the
cash costs above 40 years will decline dramatically.
Table 5.17. Operational period length at Site 1 ($/MWh).
Length of Operations
LCOE 40 years 60 years 80 years 100 years
$/MWh (2019$) 43.98 42.74 38.50 37.72
Operating efficiency is a key factor in determining the busbar cost of energy. Table 5.18 provides costs
per megawatt-hour as the operational efficiency changes from 28 percent to 32 percent. The operational
efficiency will also decline if load following is to be undertaken. The LCOE declines from $48/MWh
(28 percent) to $44/MWh (32 percent).
Table 5.18. Impact of improving operating efficiency at Site 1 ($/MWh).
Operating Efficiency
LCOE 28%
Efficient
29%
Efficient
30%
Efficient
31%
Efficient
32%
Efficient
$/MWh (2019$) 47.90 46.98 46.11 45.31 43.98
The capacity factor was evaluated from 85 to 95 percent (Table 5.19). At the 85 percent level the cost is
more than $5/MWh—more than at 95 percent. Capacity factor evaluations may be important if the facility
is to enter the load-following markets where steam must be unused to meet load-following requirements.
The result also indicates that a decrease to 90 percent would increase the LCOE by almost $3/MWh.
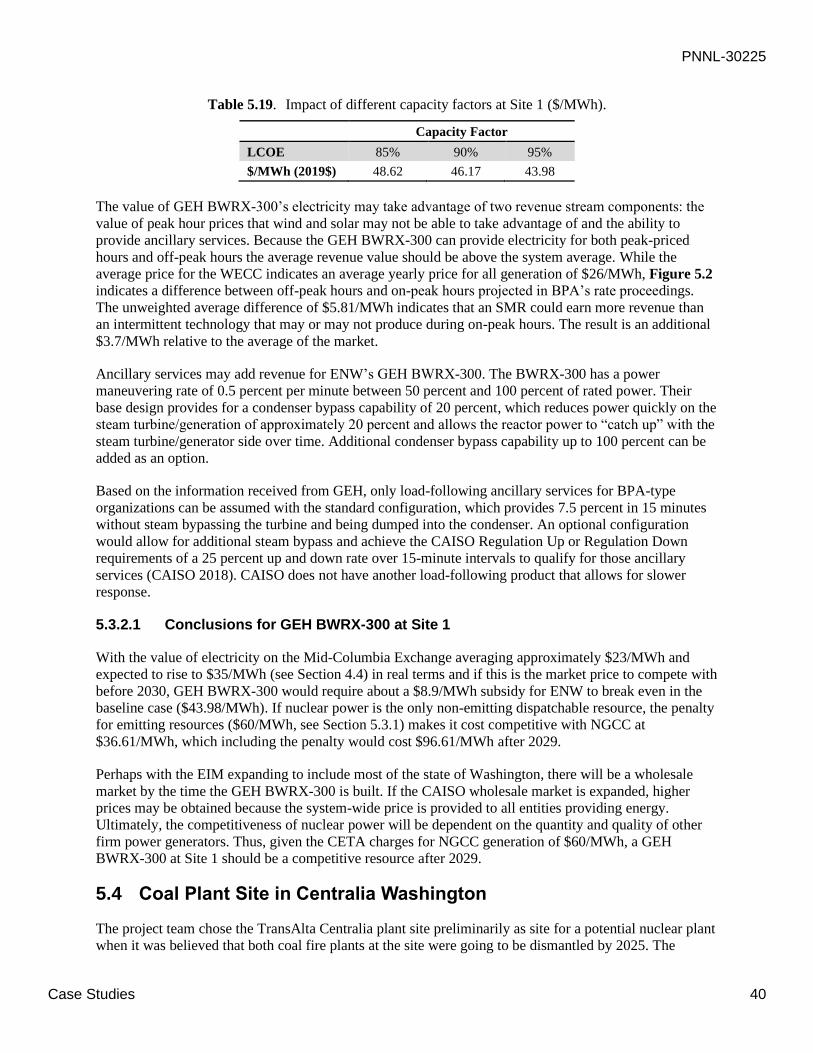
PNNL-30225
Case Studies 40
Table 5.19. Impact of different capacity factors at Site 1 ($/MWh).
Capacity Factor
LCOE 85% 90% 95%
$/MWh (2019$) 48.62 46.17 43.98
The value of GEH BWRX-300’s electricity may take advantage of two revenue stream components: the
value of peak hour prices that wind and solar may not be able to take advantage of and the ability to
provide ancillary services. Because the GEH BWRX-300 can provide electricity for both peak-priced
hours and off-peak hours the average revenue value should be above the system average. While the
average price for the WECC indicates an average yearly price for all generation of $26/MWh, Figure 5.2
indicates a difference between off-peak hours and on-peak hours projected in BPA’s rate proceedings.
The unweighted average difference of $5.81/MWh indicates that an SMR could earn more revenue than
an intermittent technology that may or may not produce during on-peak hours. The result is an additional
$3.7/MWh relative to the average of the market.
Ancillary services may add revenue for ENW’s GEH BWRX-300. The BWRX-300 has a power
maneuvering rate of 0.5 percent per minute between 50 percent and 100 percent of rated power. Their
base design provides for a condenser bypass capability of 20 percent, which reduces power quickly on the
steam turbine/generation of approximately 20 percent and allows the reactor power to “catch up” with the
steam turbine/generator side over time. Additional condenser bypass capability up to 100 percent can be
added as an option.
Based on the information received from GEH, only load-following ancillary services for BPA-type
organizations can be assumed with the standard configuration, which provides 7.5 percent in 15 minutes
without steam bypassing the turbine and being dumped into the condenser. An optional configuration
would allow for additional steam bypass and achieve the CAISO Regulation Up or Regulation Down
requirements of a 25 percent up and down rate over 15-minute intervals to qualify for those ancillary
services (CAISO 2018). CAISO does not have another load-following product that allows for slower
response.
5.3.2.1 Conclusions for GEH BWRX-300 at Site 1
With the value of electricity on the Mid-Columbia Exchange averaging approximately $23/MWh and
expected to rise to $35/MWh (see Section 4.4) in real terms and if this is the market price to compete with
before 2030, GEH BWRX-300 would require about a $8.9/MWh subsidy for ENW to break even in the
baseline case ($43.98/MWh). If nuclear power is the only non-emitting dispatchable resource, the penalty
for emitting resources ($60/MWh, see Section 5.3.1) makes it cost competitive with NGCC at
$36.61/MWh, which including the penalty would cost $96.61/MWh after 2029.
Perhaps with the EIM expanding to include most of the state of Washington, there will be a wholesale
market by the time the GEH BWRX-300 is built. If the CAISO wholesale market is expanded, higher
prices may be obtained because the system-wide price is provided to all entities providing energy.
Ultimately, the competitiveness of nuclear power will be dependent on the quantity and quality of other
firm power generators. Thus, given the CETA charges for NGCC generation of $60/MWh, a GEH
BWRX-300 at Site 1 should be a competitive resource after 2029.
5.4 Coal Plant Site in Centralia Washington
The project team chose the TransAlta Centralia plant site preliminarily as site for a potential nuclear plant
when it was believed that both coal fire plants at the site were going to be dismantled by 2025. The
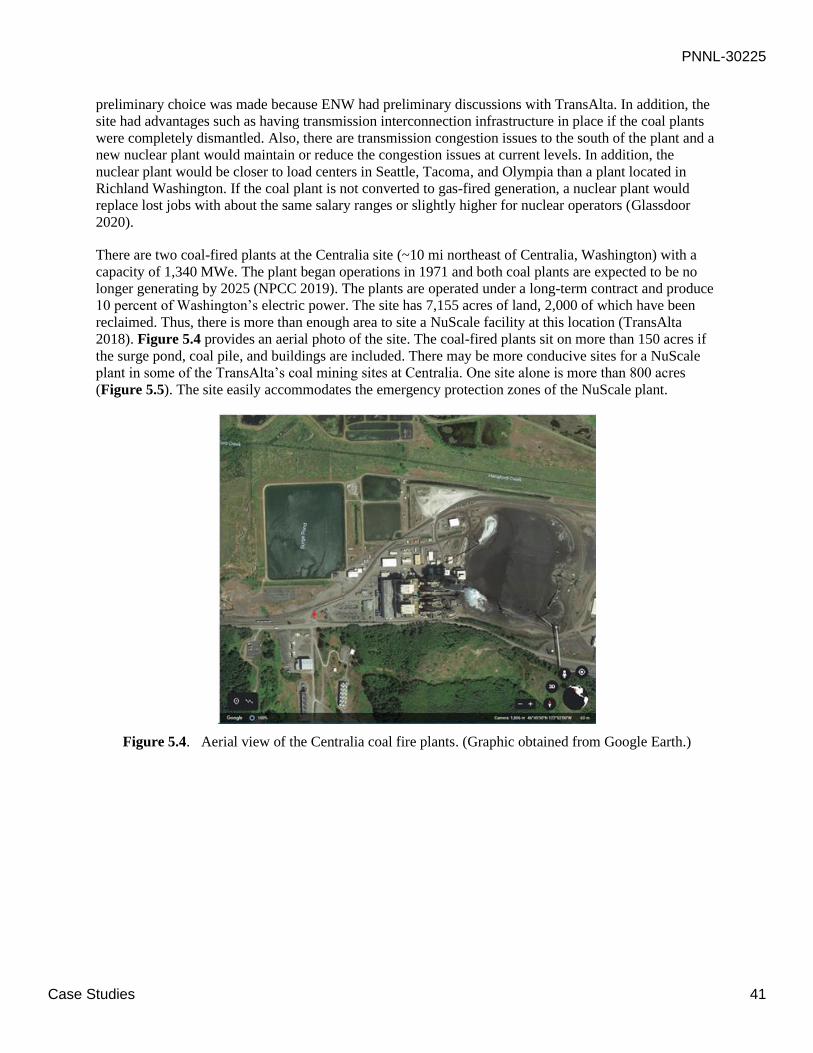
PNNL-30225
Case Studies 41
preliminary choice was made because ENW had preliminary discussions with TransAlta. In addition, the
site had advantages such as having transmission interconnection infrastructure in place if the coal plants
were completely dismantled. Also, there are transmission congestion issues to the south of the plant and a
new nuclear plant would maintain or reduce the congestion issues at current levels. In addition, the
nuclear plant would be closer to load centers in Seattle, Tacoma, and Olympia than a plant located in
Richland Washington. If the coal plant is not converted to gas-fired generation, a nuclear plant would
replace lost jobs with about the same salary ranges or slightly higher for nuclear operators (Glassdoor
2020).
There are two coal-fired plants at the Centralia site (~10 mi northeast of Centralia, Washington) with a
capacity of 1,340 MWe. The plant began operations in 1971 and both coal plants are expected to be no
longer generating by 2025 (NPCC 2019). The plants are operated under a long-term contract and produce
10 percent of Washington’s electric power. The site has 7,155 acres of land, 2,000 of which have been
reclaimed. Thus, there is more than enough area to site a NuScale facility at this location (TransAlta
2018). Figure 5.4 provides an aerial photo of the site. The coal-fired plants sit on more than 150 acres if
the surge pond, coal pile, and buildings are included. There may be more conducive sites for a NuScale
plant in some of the TransAlta’s coal mining sites at Centralia. One site alone is more than 800 acres
(Figure 5.5). The site easily accommodates the emergency protection zones of the NuScale plant.
Figure 5.4. Aerial view of the Centralia coal fire plants. (Graphic obtained from Google Earth.)

PNNL-30225
Case Studies 42
Figure 5.5. TransAlta coal mining site. (Graphic obtained from Google Earth.)
The Centralia site sits near a seismically active area (Figure 5.6). The NuScale facility, however, is
designed to safely ride through a significant seismic event. The plant is designed to accommodate input
spectra with frequencies ranging from 3 to 12 Hz and peak ground accelerations of 1.15 g (NuScale
2020).
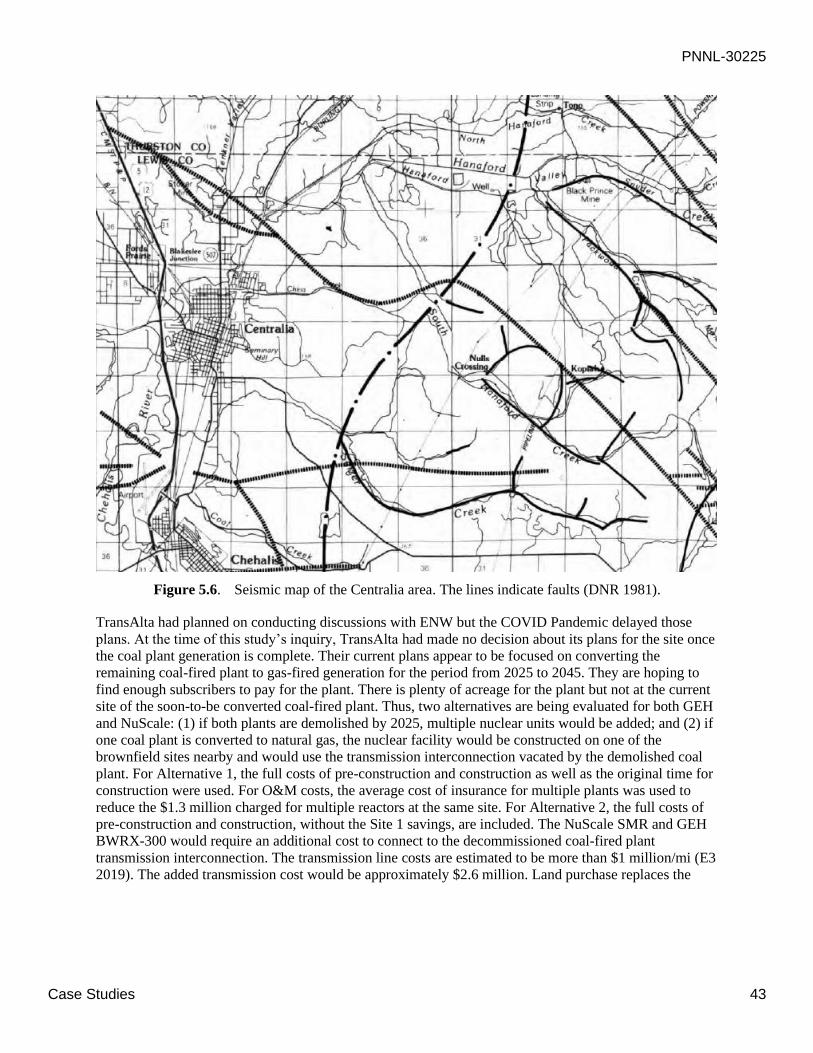
PNNL-30225
Case Studies 43
Figure 5.6. Seismic map of the Centralia area. The lines indicate faults (DNR 1981).
TransAlta had planned on conducting discussions with ENW but the COVID Pandemic delayed those
plans. At the time of this study’s inquiry, TransAlta had made no decision about its plans for the site once
the coal plant generation is complete. Their current plans appear to be focused on converting the
remaining coal-fired plant to gas-fired generation for the period from 2025 to 2045. They are hoping to
find enough subscribers to pay for the plant. There is plenty of acreage for the plant but not at the current
site of the soon-to-be converted coal-fired plant. Thus, two alternatives are being evaluated for both GEH
and NuScale: (1) if both plants are demolished by 2025, multiple nuclear units would be added; and (2) if
one coal plant is converted to natural gas, the nuclear facility would be constructed on one of the
brownfield sites nearby and would use the transmission interconnection vacated by the demolished coal
plant. For Alternative 1, the full costs of pre-construction and construction as well as the original time for
construction were used. For O&M costs, the average cost of insurance for multiple plants was used to
reduce the $1.3 million charged for multiple reactors at the same site. For Alternative 2, the full costs of
pre-construction and construction, without the Site 1 savings, are included. The NuScale SMR and GEH
BWRX-300 would require an additional cost to connect to the decommissioned coal-fired plant
transmission interconnection. The transmission line costs are estimated to be more than $1 million/mi (E3
2019). The added transmission cost would be approximately $2.6 million. Land purchase replaces the
PNNL-30225
Case Studies 44
$65,000 per year cost of land lease at Site 1. The purchase price of ~98,500/acre1 was based on two
vacant industrial lots near Centralia, Washington.
5.4.1 Case 4: NuScale Facility at the Coal Plant Site in Centralia Washington
Two alternatives were developed for the Centralia site. The first alternative evaluated the LCOE for two
NuScale plants to replace the current coal plants at the site, which would be of similar size to the current
coal plant capacities. The second case evaluated adding only one NuScale plant at the site in one of the
remediated brownfield coal mine sites, which would take advantage of the coal plant that will be removed
because TransAlta may convert the remaining coal plant to natural gas and operate it until 2045.
According to the agreements with NuScale only the LCOE will be published. The NuScale costs at the
Centralia site are lower than the $55.00/MWh provided by UAMPS for a NuScale reactor deployed at the
INL site at approximately $53.88/MWh with two plants and $53.98/MWh with one plant (see
Table 5.20). These values are the comparative baseline values in every table in this section against which
other cases are compared.
Though the cost savings are not included in this analysis because they are beyond the scope, NuScale
believes there are a number of advantages to the two-plant combination that could reduce the costs:
• Sharing systems (radioactive waste processing, site cooling water, chilled water, demineralized
water, pool surge control, nitrogen, auxiliary boiler, and utility water) would minimize the quantity
of components like tanks, pumps, valves, etc.
• Cooling tower quantities could be replaced or reduced with a site reservoir for condenser cooling.
• Modular construction would reduce the need for local skilled labor, reduce cost, and reduce schedule
time. Fluor has positive experience with constructing modules (i.e., systems) in Fluor facilities and
transporting them to sites when they are ready for installation. Doing do also allows construction
activities to continue regardless of site climate constraints.
• The alternate AC power source (AAPS) can be shared among the four NuScale plants, thereby
eliminating the need to have separate AAPS sources for each of the NuScale plants. The AAPS
source is used to help start an individual nuclear power module (NPM) (e.g., restart an individual
NPM in the event that all power has been lost).
• The security area could be optimized by evaluating the potential for creating one large protected area
that encompasses all of the plant facilities. In addition, having one central alarm station and
secondary alarm station for the site as opposed to separate stations could prove advantageous in
terms of facility size and security staff requirements.
• Staffing levels could be optimized between plants. To satisfy NRC requirements, approximately 300
plant personnel (including security personnel) are needed to operate and maintain one NuScale plant
(12 modules). There is an opportunity to optimize plant staffing levels if a multi-site services
strategy provided by NuScale Plant Services is employed.
• Other optimizations also could be realized:
– Optimize the building footprint.
– Evaluate optimal turbine arrangement and subsequent turbine building(s) for a multi-plant site.
1 LoopNet. Accessed July 1, 2020 at https://www.loopnet.com/search/commercial-real-estate/centralia-wa/for-
sale/?sk=625515db6dbc22db9997f822824dcc1a&bb=59j64p1-vQh7o8sgf
PNNL-30225
Case Studies 45
– Assess the ability to use a central radioactive waste building(s) for central site processing, instead
of having one radioactive waste building for each plant.
– Assess the ability to consolidate utility buildings, annex buildings, administration and training
facilities, and warehouse buildings.
– Optimize the site for a combined dry cask storage location.
– Evaluate the feasibility of combining four control buildings into a single one while maintaining
four separate control rooms.
– Localize fabrication for both the NPM and balance of plant equipment.
– Combine and optimize plant programs such as in-service testing, in-service inspection,
maintenance, Reactor Pressure Vessel (RPV) surveillance, etc. Conduct optimization such as
reducing the average quantity of inspection and test activities based on increased in-service
component data.
As a part of the analysis and consistent with calculations for Site 1 in the previous section, the different
levels of the WACC including evaluated costs at 3, 4, 5, 6 and 7 percent were evaluated. The 3 and 5
percent WACC levels provide a bounding level of organizations such as ENW. The 7 percent real rate
reflects the LCOE at an IOU’s real rate. Note that the interest rate of 1 percent adds more than $5/MWh
and that the effect of compounding adds approximately $7/MWh when evaluating costs at 6 percent and 7
percent.
The effects of a lower fuel cost using an MIT value of $6.00/kgU for conversion rather than the
$11.20/kgU that ENW was forecasting for 2028 were also evaluated. The prices for uranium and
enrichment to the ENW 2024 prices of $35.5/lb of U3O8 and $74/SWU were also lowered. The change in
fuel cost decreased the LCOE by $0.58/MWh from the $53.98 level, which we are considering the
expected price. This further emphasizes how little fuel costs influence the overall LCOE. There is only
about a $0.10/MWh difference in the cost between the one-plant and two-plant scenarios; the two-plant
scenario is slightly less expensive because it takes advantage of a lower insurance cost and does not
require an investment of $2.6 million in transmission lines.
Table 5.20. NuScale’s LCOEs for different real interest rates for the WACC at the Centralia site
($/MWh).
Interest Rate
LCOE 3% WACC 4% WACC 5% WACC 6% WACC 7% WACC
Replace 2
coal plants
$/MWh
(2019$)
48.47 53.88 59.96 66.72 74.13
Replace 1
coal plant
$/MWh
(2019$)
48.57 53.98 60.07 66.83 74.26
The project length impacts the LCOE through the added costs of interest during construction. The added
interest costs approximately $2/MWh because the project length balloons by 3 years. Although only the
project length was increased, typically the construction costs increase as annual fixed overhead
accumulates (see Table 5.21).
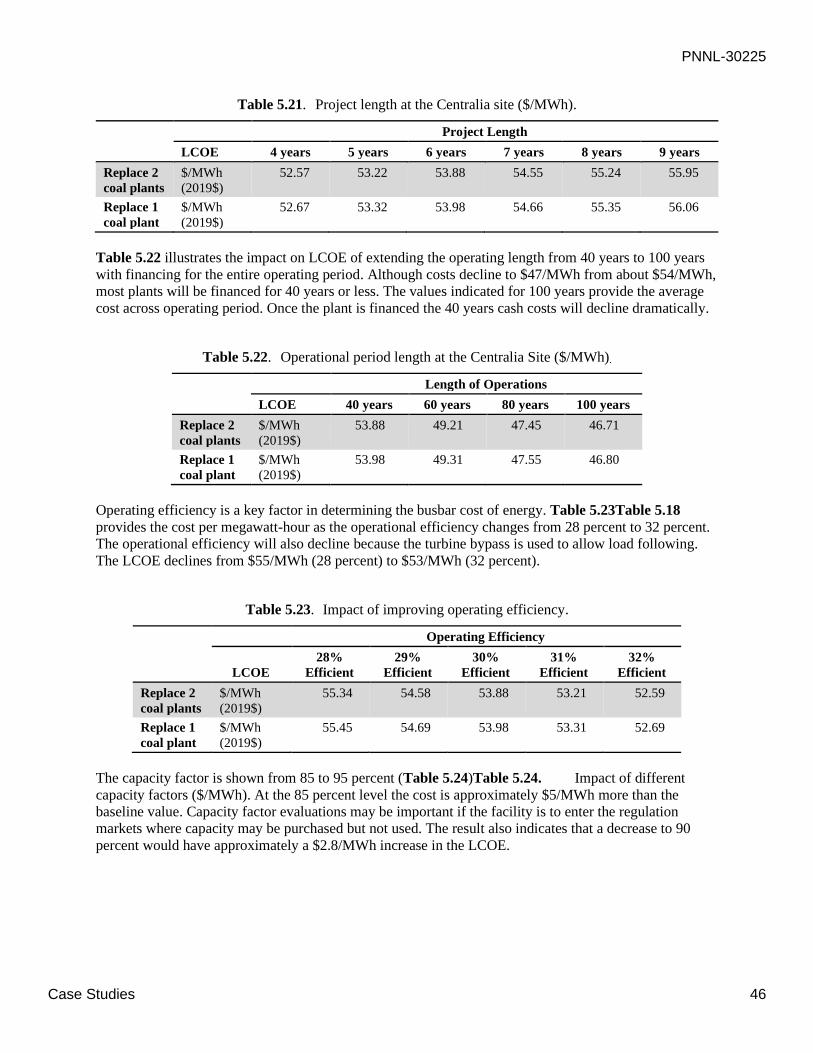
PNNL-30225
Case Studies 46
Table 5.21. Project length at the Centralia site ($/MWh).
Project Length
LCOE 4 years 5 years 6 years 7 years 8 years 9 years
Replace 2
coal plants
$/MWh
(2019$)
52.57 53.22 53.88 54.55 55.24 55.95
Replace 1
coal plant
$/MWh
(2019$)
52.67 53.32 53.98 54.66 55.35 56.06
Table 5.22 illustrates the impact on LCOE of extending the operating length from 40 years to 100 years
with financing for the entire operating period. Although costs decline to $47/MWh from about $54/MWh,
most plants will be financed for 40 years or less. The values indicated for 100 years provide the average
cost across operating period. Once the plant is financed the 40 years cash costs will decline dramatically.
Table 5.22. Operational period length at the Centralia Site ($/MWh).
Length of Operations
LCOE 40 years 60 years 80 years 100 years
Replace 2
coal plants
$/MWh
(2019$)
53.88 49.21 47.45 46.71
Replace 1
coal plant
$/MWh
(2019$)
53.98 49.31 47.55 46.80
Operating efficiency is a key factor in determining the busbar cost of energy. Table 5.23Table 5.18
provides the cost per megawatt-hour as the operational efficiency changes from 28 percent to 32 percent.
The operational efficiency will also decline because the turbine bypass is used to allow load following.
The LCOE declines from $55/MWh (28 percent) to $53/MWh (32 percent).
Table 5.23. Impact of improving operating efficiency.
Operating Efficiency
LCOE
28%
Efficient
29%
Efficient
30%
Efficient
31%
Efficient
32%
Efficient
Replace 2
coal plants
$/MWh
(2019$)
55.34 54.58 53.88 53.21 52.59
Replace 1
coal plant
$/MWh
(2019$)
55.45 54.69 53.98 53.31 52.69
The capacity factor is shown from 85 to 95 percent (Table 5.24)Table 5.24. Impact of different
capacity factors ($/MWh). At the 85 percent level the cost is approximately $5/MWh more than the
baseline value. Capacity factor evaluations may be important if the facility is to enter the regulation
markets where capacity may be purchased but not used. The result also indicates that a decrease to 90
percent would have approximately a $2.8/MWh increase in the LCOE.

PNNL-30225
Case Studies 47
Table 5.24. Impact of different capacity factors ($/MWh).
Capacity Factor
LCOE 85% 90% 95%
Replace 2
coal plants
$/MWh
(2019$)
59.66 56.61 53.88
Replace 1
coal plant
$/MWh
(2019$)
59.77 56.72 53.98
NuScale would have the same opportunities for added revenues from flexible ramping and ancillary
services as discussed in Case 2.
5.4.1.1 Conclusions about the Centralia Site for NuScale
With the value of electricity on the Mid-Columbia Exchange averaging approximately $23/MWh and
expected to rise to $35/MWh (see Section 5.4.1), and if this is the market price to compete with prior to
2030, the NuScale plant would require about a $19/MWh subsidy for ENW to break even in the expected
case ($53.88/MWh with two plants and $53.98/MWh with one plant). If nuclear is the only non-emitting
dispatchable resource, the penalty for carbon emitting resources ($60/MWh) makes the SMR cost
competitive with NGCC generating at $36.61/MWh, which, including the penalty, would cost
$96.61/MWh.
Perhaps with the EIM expanding to include most of the state of Washington, there will be a wholesale
market by the time the NuScale plant is built. If the CAISO wholesale market is expanded to the region,
the value of ancillary services could be met by the NuScale plant. Regulation Up prices varied between
$2.88/MWh to $6.86/MWh while Regulation Down prices ranged from $3.03/MWh to $5.29/MWh. The
prices for these services appeared to decline over the collection period from 2009 to 2014 (Zhou 2016).
These prices are above the cost of the energy. Thus, the NuScale plant could earn as much as $35/MWh
for energy and add on the ancillary services value if a wholesale market opened in the future for this
product, if this is the market price to compete with prior to 2030.
Thus, given the CETA charges for NGCC generation of $60/MWh, a NuScale plant at the Centralia site
should be a competitive resource after 2029. However, Site 1 provides about a $3/MWh advantage over
the Centralia site due to the value of the savings for the remaining WNP-1 plant at Site 1, which was
never completed.
5.4.2 Case 5: GEH BWRX-300s at the Coal Plant Site in Centralia Washington
Two alternatives were developed for the Centralia site. The first alternative evaluated the LCOE for four
GEH BWRX-300s to replace the current two coal plants at the site, which would be of similar size. The
second case evaluated adding only two GEH BWRX-300s at the site in one of the remediated brownfield
coal mine sites, which would take advantage of the coal plant that will be removed because TransAlta
may convert the remaining coal plant to natural gas and operate it until 2045 when carbon emitting
resources such as coal and natural gas plants will be disallowed.
According to the agreements with GEH only the LCOE will be published. The GEH BWRX-300 LCOEs
of $50.52/MWh (replace two coal plants) and $50.70/MWh (replace one coal plant) at the Centralia site
are higher than the $43.98/MWh at Site 1 (see Table 5.25) because of an added year of construction and
the lack of savings for facilities already in place at Site 1.

PNNL-30225
Case Studies 48
As a part of the analysis, and consistent with calculations for Site 1 in the previous sections, we evaluated
the different levels of the WACC at 3, 4, 5, 6, and 7 percent. The 3 and 5 percent WACC levels provide a
bounding level for organizations such as ENW. The 7 percent real rate reflects the LCOE at an IOU’s real
rate. Note that the interest rate of 1 percent adds approximately $4.50/MWh at lower values of the WACC
and that the effect of compounding adds almost $6.00/MWh to costs when evaluated at 6 percent and 7
percent.
We also evaluated the effects of a lower fuel cost using an MIT value of $6.00/kgU for conversion rather
than the $11.20/kgU that ENW was forecasting for 2028. We also lowered the prices for uranium and
enrichment to the ENW 2024 prices of $35.5/lb of U3O8 and $74/SWU. The change in fuel cost decreased
the LCOE by $0.59/MWh from the reference value at 4 percent. This further emphasizes how little fuel
costs influence the overall LCOE.
Table 5.25. GEH BWRX-300’s LCOEs for different real interest rates for the WACC at the
Centralia site ($/MWh).
Interest Rate
LCOE 3% WACC 4% WACC 5% WACC 6% WACC 7% WACC
Replace 2
coal plants
$/MWh
(2019$)
46.05 50.52 55.37 60.88 66.74
Replace 1
coal plant
$/MWh
(2019$)
46.23 50.70 55.65 61.06 66.92
The project length impacts the LCOE through the added costs of interest during construction. The added
interest costs increase the LCOE by more than $2/MWh because the project length balloons by 4 years.
Although only the project length was increased, typically the construction costs increase as annual fixed
overheads accumulate (see Table 5.26).
Table 5.26. Project length at the Centralia site ($/MWh).
Project Length
LCOE 4 years 5 years 6 years 7 years 8 years 9 years
Replace 2
coal plants
$/MWh
(2019$)
49.98 50.52 51.07 51.53 52.21 52.80
Replace 1
coal plant
$/MWh
(2019$)
50.16 50.70 51.25 51.81 52.39 52.98
Table 5.27 provides the impact on LCOE of extending the operating length from 40 years to 100 years.
Although costs decline to $43/MWh from just more than $50.5/MWh, most plants will be financed for
40 years or less. The value for 100 years provides the average cost across the operating period. Once the
plant is financed the 40 years cash costs will decline dramatically.
Table 5.27. Operational period length at the Centralia Site ($/MWh).
Length of Operations
LCOE 40 years 60 years 80 years 100 years
Replace 2 coal
plants
$/MWh (2019$) 50.52 45.88 48.67 42.99
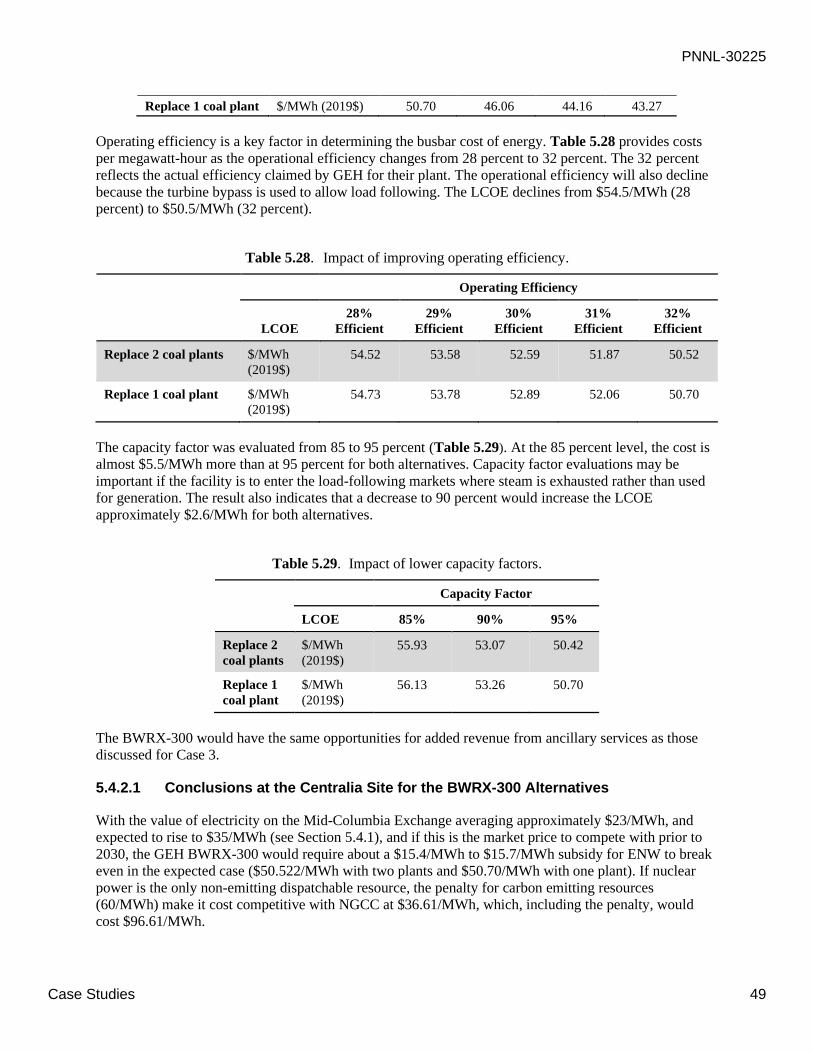
PNNL-30225
Case Studies 49
Replace 1 coal plant $/MWh (2019$) 50.70 46.06 44.16 43.27
Operating efficiency is a key factor in determining the busbar cost of energy. Table 5.28 provides costs
per megawatt-hour as the operational efficiency changes from 28 percent to 32 percent. The 32 percent
reflects the actual efficiency claimed by GEH for their plant. The operational efficiency will also decline
because the turbine bypass is used to allow load following. The LCOE declines from $54.5/MWh (28
percent) to $50.5/MWh (32 percent).
Table 5.28. Impact of improving operating efficiency.
Operating Efficiency
LCOE
28%
Efficient
29%
Efficient
30%
Efficient
31%
Efficient
32%
Efficient
Replace 2 coal plants $/MWh
(2019$)
54.52 53.58 52.59 51.87 50.52
Replace 1 coal plant $/MWh
(2019$)
54.73 53.78 52.89 52.06 50.70
The capacity factor was evaluated from 85 to 95 percent (Table 5.29). At the 85 percent level, the cost is
almost $5.5/MWh more than at 95 percent for both alternatives. Capacity factor evaluations may be
important if the facility is to enter the load-following markets where steam is exhausted rather than used
for generation. The result also indicates that a decrease to 90 percent would increase the LCOE
approximately $2.6/MWh for both alternatives.
Table 5.29. Impact of lower capacity factors.
Capacity Factor
LCOE 85% 90% 95%
Replace 2
coal plants
$/MWh
(2019$)
55.93 53.07 50.42
Replace 1
coal plant
$/MWh
(2019$)
56.13 53.26 50.70
The BWRX-300 would have the same opportunities for added revenue from ancillary services as those
discussed for Case 3.
5.4.2.1 Conclusions at the Centralia Site for the BWRX-300 Alternatives
With the value of electricity on the Mid-Columbia Exchange averaging approximately $23/MWh, and
expected to rise to $35/MWh (see Section 5.4.1), and if this is the market price to compete with prior to
2030, the GEH BWRX-300 would require about a $15.4/MWh to $15.7/MWh subsidy for ENW to break
even in the expected case ($50.522/MWh with two plants and $50.70/MWh with one plant). If nuclear
power is the only non-emitting dispatchable resource, the penalty for carbon emitting resources
(60/MWh) make it cost competitive with NGCC at $36.61/MWh, which, including the penalty, would
cost $96.61/MWh.

PNNL-30225
Case Studies 50
Perhaps with the EIM expanding to include most of the state of Washington there will be a wholesale
market by the time the GEH BWRX-300 is built. The locational market prices are above the cost of the
energy today. Thus, the GEH BWRX-300 could earn as much as $35/MWh for energy. Thus, given the
CETA charges for NGCC generation of $60/MWh, a GEH BWRX-300 at the Centralia site should be a
competitive resource if NGCC generation is the only resource competing after 2029. Unless significant
cost savings can be shown for multiple plants together, reducing the overall costs by more than
$5.5/MWh, Site 1 even with transmission charges is a lower cost alternative to the Centralia site.

PNNL-30225
Firm and Near-firm Carbon-Free Generation Competition 51
6.0 Firm and Near-firm Carbon-Free Generation Competition
Firm and near-firm renewable energy grid generation resources may provide competition to SMR
generation. For example, a Minnesota utility, Great River Energy, is installing a 1 MW, 150 MWh storage
system developed by Form Energy (Spector 2020). This is a FOAK facility, but it will provide Great
River Energy with dispatchable wind power. Given the relative short timeline from permitting to
generation for most of these resources and their relatively inexpensive power, they may provide stiff
competition to the longer permitting to generation time paths for SMRs. However, renewable energy
suffers from its variability and, although it is of low cost compared to firm power alternatives, it fails to
provide the flexibility required to meet long duration periods when wind and sun are not providing
adequate electricity. The question then becomes whether renewables can be firmed up at low enough
costs to be competitive in the flexible market. An MIT study indicates that storage costs need to be
perhaps as low as $20/kWh for long-term storage to be feasible. But that value ends up being a worst-case
scenario (Roberts 2020).
6.1 Long-term Storage
Currently, the cost for long-term storage is prohibitively high to keep the lights on using only variable
renewable energy. Lithium ion batteries cost approximately $200/kWh for approximately 4 hours of
storage (Hanley 2020). The storage is valuable though because it has high ramping speeds and is
dispatchable. However, storage cannot currently cover 100 percent of outage times that could occur with
variable energy resources like wind and solar. NREL forecasts costs potentially dropping to $76/kWh at
the low end and $258/kWh at the high end by 2050 (Cole and Frazier 2019). The high-end value has
already been surpassed in 2020 according to Hanley (2020). The low-end value still does not reach the
$20/kWh required in the MIT study. However, the MIT study indicates other ways to reach firm
dispatchable power without going to $20/kWh by using transmission, demand-side management, and
supplemental generation. The price of batteries only needs to drop to $700/kW and $150/kWh if wind and
solar reach 95 percent of needs. The study set the capital cost of wind at $1,500/kW. The study also
assumed no further price decreases in wind or solar (Zigler et al. 2019). Some forecasts for wind LCOEs
indicate they will drop a further 26 percent by 2025 (Shouman 2020). That is probably enough to cover
the cost of long-term storage such as Form Energy’s. In all likelihood, some combination of long duration
batteries and fast ramping batteries will be required to stabilize the grid if they are competitive.
6.2 Wind and Solar with Long-Term Storage
The combined cost of the long-term storage solution plus wind is dependent on the quality of the wind
and the turbine size. Washington and Oregon are home to several wind farms. According to the NREL
wind map, the Pacific Northwest wind averages in the 5.5–6.5 miles per second range in the areas where
wind farms exist. Capacity factors for that wind speed in the PPAs indicate the cost of wind is in the
range of $40–$55/MWh for recent PPAs in the West (LBL 2018). Depending on the vintage of the wind
farm production, tax credits need to be added back to understand the cost of power. An LCOE for wind in
the Columbia Basin was calculated assuming $1,470/kW (2018$), $29/kW O&M costs, at discount
rates—5 percent and 8 percent, and two capacity factors, 35 percent and 40 percent (see Table 6.1). A
DOE report (Wiser et al. 2019) indicated that the cost of wind energy is averaging below $20/MWh.
These wind projects are earning a production tax credit of $24/MWh (Davis 2019). These prices are not
for firm wind. A long duration battery as noted previously would be required.
Note that ENW’s wind farm at the Nine Canyon Wind Project costs between $59/MWh and $83/MWh
depending on the wind capacity in a year (ENW 2018). Thus, currently installed wind is more expensive
than the projected SMR costs and a SMR could provide dispatchable power.
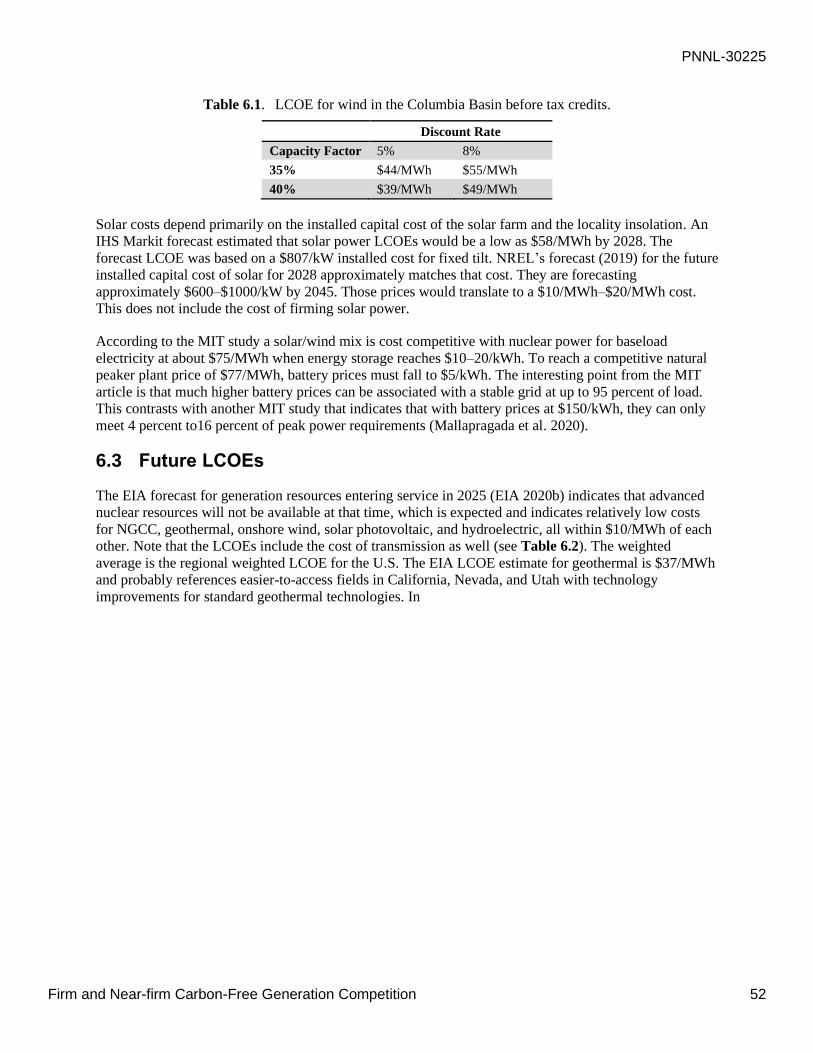
PNNL-30225
Firm and Near-firm Carbon-Free Generation Competition 52
Table 6.1. LCOE for wind in the Columbia Basin before tax credits.
Discount Rate
Capacity Factor 5% 8%
35% $44/MWh $55/MWh
40% $39/MWh $49/MWh
Solar costs depend primarily on the installed capital cost of the solar farm and the locality insolation. An
IHS Markit forecast estimated that solar power LCOEs would be a low as $58/MWh by 2028. The
forecast LCOE was based on a $807/kW installed cost for fixed tilt. NREL’s forecast (2019) for the future
installed capital cost of solar for 2028 approximately matches that cost. They are forecasting
approximately $600–$1000/kW by 2045. Those prices would translate to a $10/MWh–$20/MWh cost.
This does not include the cost of firming solar power.
According to the MIT study a solar/wind mix is cost competitive with nuclear power for baseload
electricity at about $75/MWh when energy storage reaches $10–20/kWh. To reach a competitive natural
peaker plant price of $77/MWh, battery prices must fall to $5/kWh. The interesting point from the MIT
article is that much higher battery prices can be associated with a stable grid at up to 95 percent of load.
This contrasts with another MIT study that indicates that with battery prices at $150/kWh, they can only
meet 4 percent to16 percent of peak power requirements (Mallapragada et al. 2020).
6.3 Future LCOEs
The EIA forecast for generation resources entering service in 2025 (EIA 2020b) indicates that advanced
nuclear resources will not be available at that time, which is expected and indicates relatively low costs
for NGCC, geothermal, onshore wind, solar photovoltaic, and hydroelectric, all within $10/MWh of each
other. Note that the LCOEs include the cost of transmission as well (see Table 6.2). The weighted
average is the regional weighted LCOE for the U.S. The EIA LCOE estimate for geothermal is $37/MWh
and probably references easier-to-access fields in California, Nevada, and Utah with technology
improvements for standard geothermal technologies. In

PNNL-30225
Firm and Near-firm Carbon-Free Generation Competition 53
Table 6.3, note that advanced nuclear costs are forecast at approximately $82/MWh before the investment
tax credit, substantially higher than our estimates for the SMRs in this study. Thus, geothermal, a
dispatchable generation source, is available to meet firm resource requirements and has the capability to
provide ancillary services (GEA 2013). The issue for geothermal is whether the resource will be available
in Washington at competitive prices in the next 10 years. There appears to be significant geothermal
resource above the 200oC range, which is favorable for geothermal development (see Figure 6.1). Further
investigation of the resource indicated there are two areas within Washington State that meet the two
requirements for future geothermal electricity production; thermal potential and easy access to
transmission or favorability (Source: https://www.eia.gov/energyexplained/geothermal/where-geothermal-energy-is-
found.php#:~:text=U.S.%20geothermal%20power%20plants%20are,most%20electricity%20from%20geothermal%20energy.
Figure 6.2 and Figure 6.3 ). The portion of the figure labeled (a) indicates thermal potential while the
portion labeled (b) indicates potential feasibility (proximity to transmission and lack of land use
restrictions). Points 5 and 6 along the Columbia River are the Wind River area and the Roosevelt area.
Both sites should have few issues with permitting and location to existing transmission systems
(Boschmann et al. 2014). Additionally, the cost of extracting electricity needs to be competitive. A recent
study of enhanced geothermal systems indicates the cost could be in the $47/MWh range including
transmission costs (2019$) (Cladouhos 2018). Given the error band for the estimates the LCOEs could be
equivalent. Should If the estimates prove accurate and based on SMR LCOEs, SMRs would need a
$0/MWh–$30/MWh subsidy to be competitive with geothermal. Currently, there is only 2.6 GWe of
geothermal, mainly in the WECC and Hawaii. Thus, geothermal and SMRs may compete for the
approximate 5 GWe of capacity Washington State needs in firm capacity. However, a further question is
whether in 10 years the battery market will make wind and solar a cost-competitive dispatchable resource
relative to geothermal and SMRs.
Table 6.2. Forecast weighted(a) LCOEs for generation resources entering service in 2025 ($/MWh
2019$).
Plant Type
Capacity
Factor
(percent)
Levelized
Capital
Cost
Levelized
Fixed
O&M(b)
Levelized
Variable
O&M
Levelized
Transmission
Cost
Total
System
LCOE
Levelized
Tax
Credit(c)
Total
LCOE
Including
Tax
Credit
Ultra-
supercritical coal
NB NB NB NB NB NB NB NB
Combined cycle 87 7.48 1.59 26.4 1.13 36.61 NA 36.61
Combustion
turbine
30 16.1 2.65 46.51 3.44 68.71 NA 68.71
Advanced nuclear
NB NB NB NB NB NB NB NB
Geothermal 90 20.36 14.5 1.16 1.45 37.47 -2.04 35.44
Biomass NB NB NB NB NB NB NB NB
Wind, onshore 40 23.51 7.51 0 3.08 34.1 NA 34.1
Wind, offshore 45 84 27.89 0 3.15 115.04 NA 115.04
Solar photovoltaic(d)
30 24.12 5.77 0 2.91 32.8 -2.41 30.39

PNNL-30225
Firm and Near-firm Carbon-Free Generation Competition 54
Hydroelectric(e, f) 73 28.89 7.64 1.39 1.62 39.54 NA 39.54
(a) The capacity-weighted average is the average levelized cost per technology, weighted by the new capacity coming online in
each region. The capacity additions for each region are based on additions from 2023 to 2025. Technologies for which capacity
additions are not expected do not have a capacity-weighted average and are marked as NB, or not built.
(b) O&M = operations and maintenance.
(c) The tax credit component is based on targeted federal tax credits such as the production tax credit (PTC) or investment tax
credit (ITC) available for some technologies. It reflects tax credits available only for plants entering service in 2025 and the
substantial phaseout of both the PTC and ITC as scheduled under current law. Technologies not eligible for PTC or ITC are
indicated as NA, or not available. The results are based on a regional model, and state or local incentives are not included in
LCOE calculations. See text box on page 2 for details about how the tax credits are represented in the model (EIA 2020b).
(d) Costs are expressed in terms of net AC (alternating current) power available to the grid for the installed capacity.
(e) As modeled, EIA assumes that hydroelectric generation has seasonal storage so that it can be dispatched within a season, but
overall operation is limited by resources available by site and season.
(f) Costs are for the 2023 online year. Source: U.S. Energy Information Administration, Annual Energy Outlook 2020. See page 6
for details about the exception (EIA 2020b).
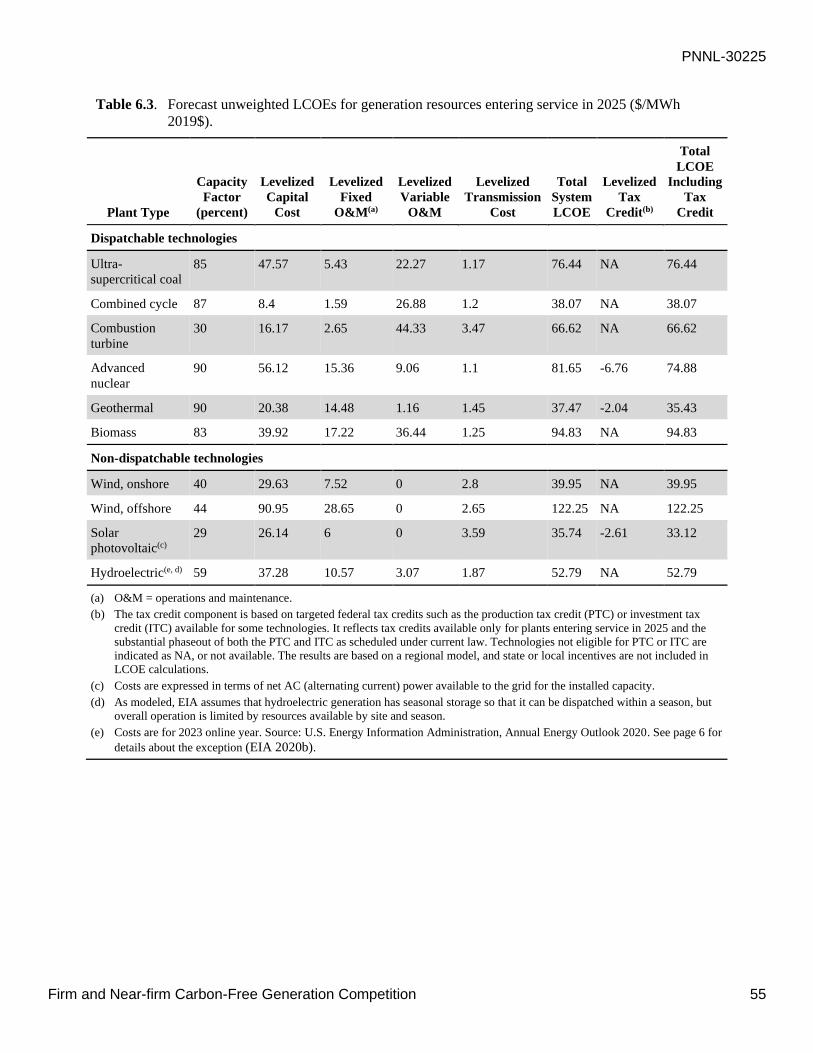
PNNL-30225
Firm and Near-firm Carbon-Free Generation Competition 55
Table 6.3. Forecast unweighted LCOEs for generation resources entering service in 2025 ($/MWh
2019$).
Plant Type
Capacity
Factor
(percent)
Levelized
Capital
Cost
Levelized
Fixed
O&M(a)
Levelized
Variable
O&M
Levelized
Transmission
Cost
Total
System
LCOE
Levelized
Tax
Credit(b)
Total
LCOE
Including
Tax
Credit
Dispatchable technologies
Ultra-
supercritical coal
85 47.57 5.43 22.27 1.17 76.44 NA 76.44
Combined cycle 87 8.4 1.59 26.88 1.2 38.07 NA 38.07
Combustion
turbine
30 16.17 2.65 44.33 3.47 66.62 NA 66.62
Advanced
nuclear
90 56.12 15.36 9.06 1.1 81.65 -6.76 74.88
Geothermal 90 20.38 14.48 1.16 1.45 37.47 -2.04 35.43
Biomass 83 39.92 17.22 36.44 1.25 94.83 NA 94.83
Non-dispatchable technologies
Wind, onshore 40 29.63 7.52 0 2.8 39.95 NA 39.95
Wind, offshore 44 90.95 28.65 0 2.65 122.25 NA 122.25
Solar
photovoltaic(c)
29 26.14 6 0 3.59 35.74 -2.61 33.12
Hydroelectric(e, d) 59 37.28 10.57 3.07 1.87 52.79 NA 52.79
(a) O&M = operations and maintenance.
(b) The tax credit component is based on targeted federal tax credits such as the production tax credit (PTC) or investment tax
credit (ITC) available for some technologies. It reflects tax credits available only for plants entering service in 2025 and the
substantial phaseout of both the PTC and ITC as scheduled under current law. Technologies not eligible for PTC or ITC are
indicated as NA, or not available. The results are based on a regional model, and state or local incentives are not included in
LCOE calculations.
(c) Costs are expressed in terms of net AC (alternating current) power available to the grid for the installed capacity.
(d) As modeled, EIA assumes that hydroelectric generation has seasonal storage so that it can be dispatched within a season, but
overall operation is limited by resources available by site and season.
(e) Costs are for 2023 online year. Source: U.S. Energy Information Administration, Annual Energy Outlook 2020. See page 6 for
details about the exception (EIA 2020b).
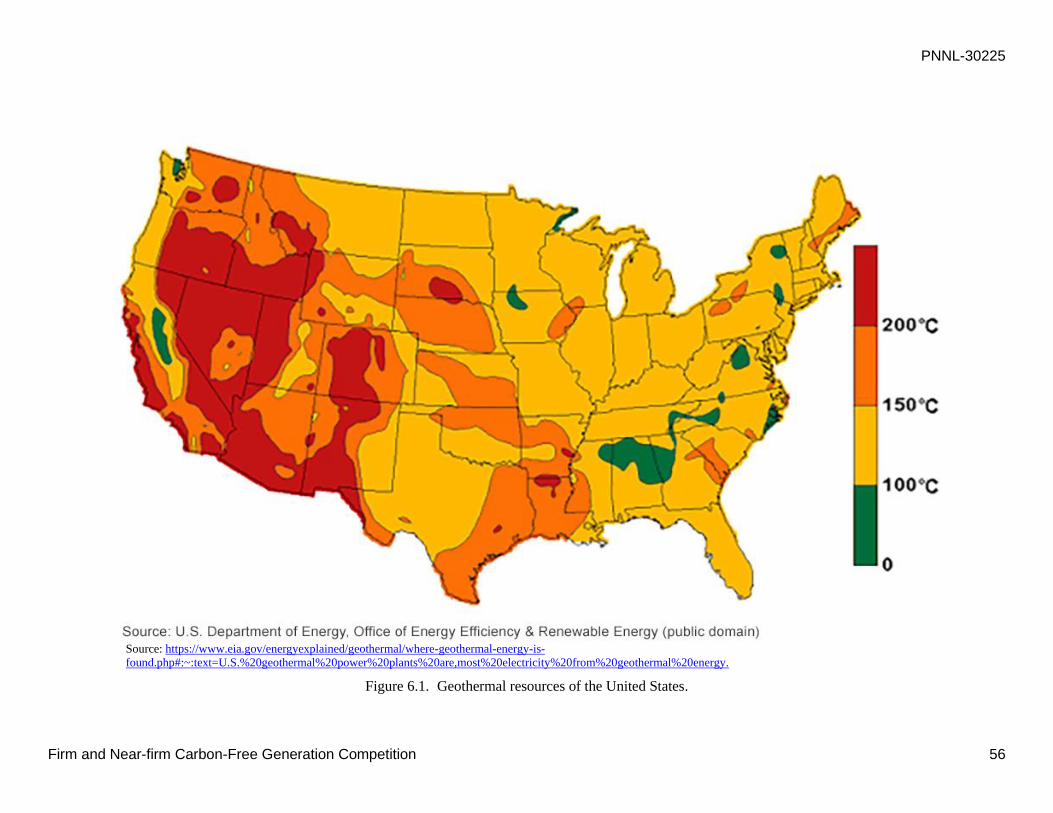
PNNL-30225
Firm and Near-firm Carbon-Free Generation Competition 56
Source: https://www.eia.gov/energyexplained/geothermal/where-geothermal-energy-is-
found.php#:~:text=U.S.%20geothermal%20power%20plants%20are,most%20electricity%20from%20geothermal%20energy.
Figure 6.1. Geothermal resources of the United States.
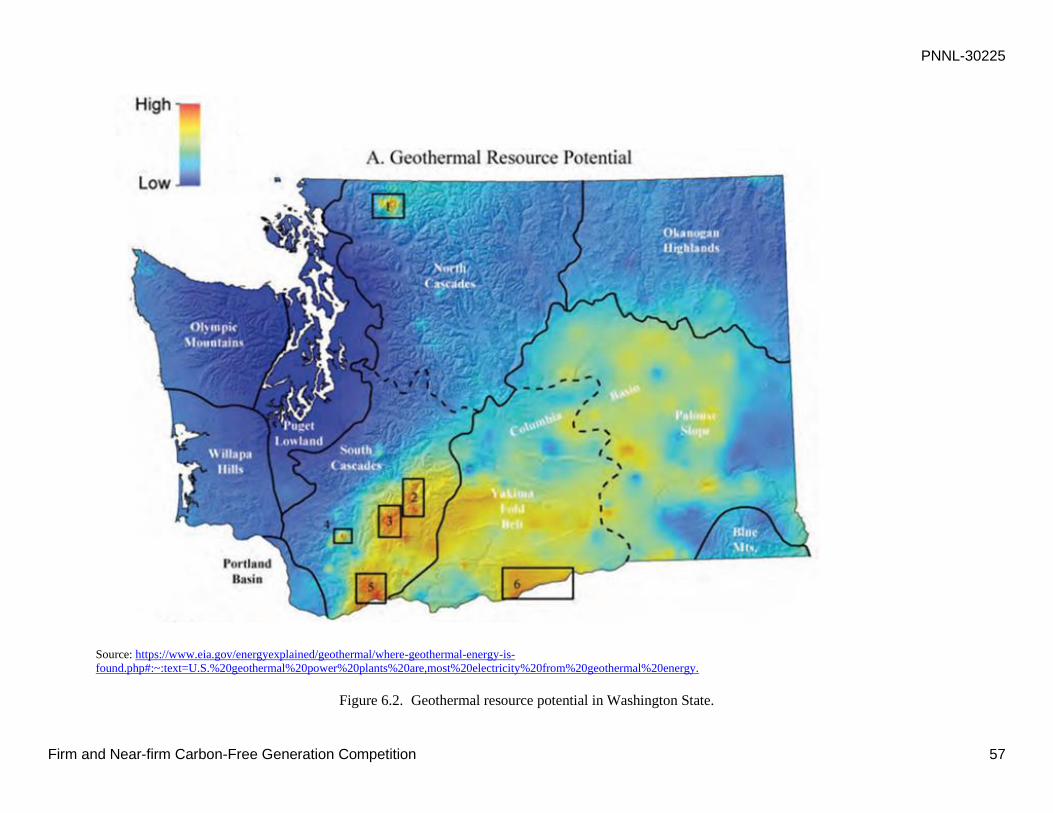
PNNL-30225
Firm and Near-firm Carbon-Free Generation Competition 57
Source: https://www.eia.gov/energyexplained/geothermal/where-geothermal-energy-is-
found.php#:~:text=U.S.%20geothermal%20power%20plants%20are,most%20electricity%20from%20geothermal%20energy.
Figure 6.2. Geothermal resource potential in Washington State.
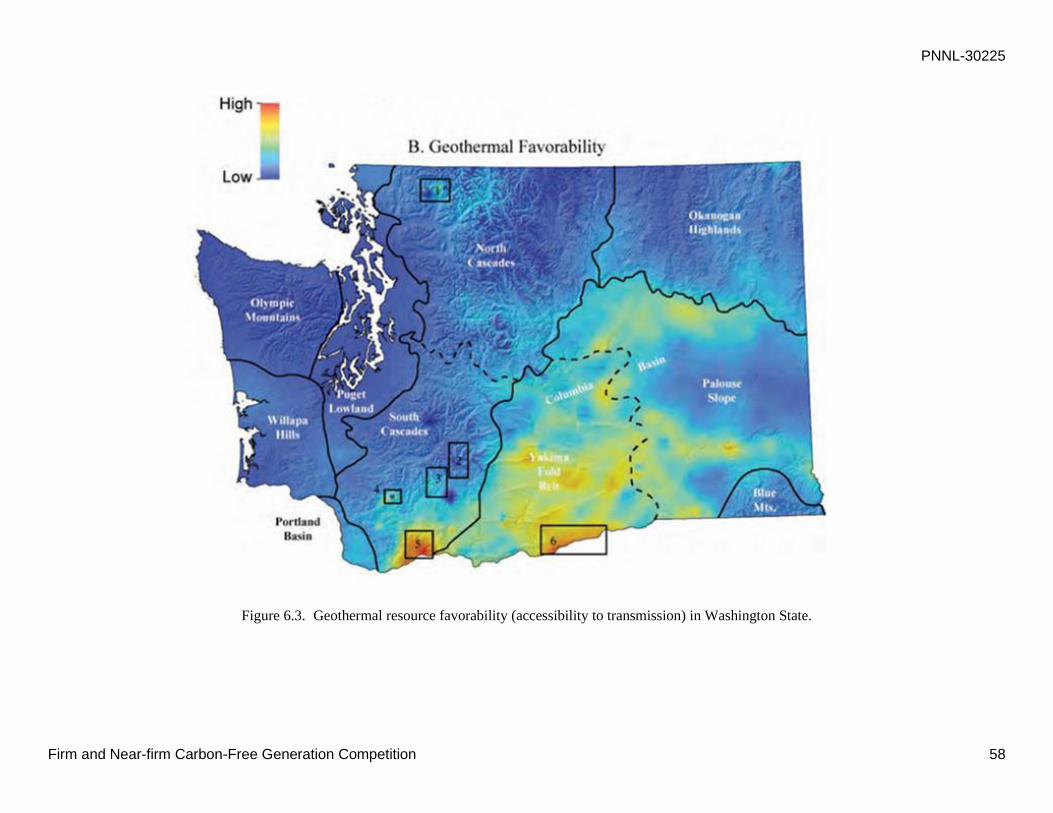
PNNL-30225
Firm and Near-firm Carbon-Free Generation Competition 58
Figure 6.3. Geothermal resource favorability (accessibility to transmission) in Washington State.

PNNL-30225
Analysis of Results for NuScale and GEH BWRX-300 59
7.0 Analysis of Results for NuScale and GEH BWRX-300
The following sections provide a summary of the results for the NuScale and GEH BWRX SMRs on a
case-by-case basis. The LCOEs for the NuScale and GEH BWRX-300 SMRS are not directly comparable
because of the different approaches taken to provide the estimated costs and associated LCOEs.
7.1 Comparison of NuScale Results
The UAMPS SMR at INL has a total project cost of approximately $6 billion. DOE has agreed to inject
$1.35 billion into the project, reducing the overall target cost to $55.00/MWh (2018$) (UAMPS 2020a,
2020b). The DOE subsidy amounts to an approximate $15–$30/MWh subsidy to UAMPS’ subscribers
depending on the WACC and other assumptions used. The estimated project costs are based on a Class IV
estimate. A Class III estimate will be provided in 2021, a Class II estimate at the end of 2022, and a Class
I estimate in September 2024 (Burns &McDonnell 2020). The first unit is expected to be commercially
operable in 2029 (Burns & McDonnell 2020) and the remaining facilities to be completed by August
2030. The resulting estimated LCOEs for Site 1 ($51/MWh) and the Centralia site ($54/MWh) would
appear to be approximately correct for an NOAK facility given the project costs, target price, and subsidy
levels. Given that there was very little difference in the LMPs for the two sites and transmission costs did
not differ much, Site 1 would be the lower cost location for a NuScale SMR compared to Centralia. Site 1
provides about $300 million in savings due to operable infrastructure at the that can be used for the SMR
in terms of pre-construction, construction, and construction time savings. Additionally, Site 1 is a place
where the population accepts nuclear power and has a workforce in place, but additional workforce will
be required to staff the SMR. But firm capacity will be needed in the future.
The main competitors with NuScale’s SMR are NGCC, geothermal, and near-firm wind and solar.
Electricity generated from NGCC resources costs utilities an additional $60/MWh, raising the cost to
Washington utilities to $97/MWh. The LCOEs of geothermal, $37/MWh to $47/MWh, are below the
NuScale LCOEs of $51/MWh, a $4/MWh to $14/MWh difference. Note that given the error band around
the estimate for enhanced geothermal systems, the two estimates are probably equivalent. Including the
geothermal tax credit adds $2.04/MWh to the difference increases the margin between NuScale and
geothermal to $6/MWh to $16/MWh. If ENW structures the deal to sell the tax credits, the differential
would decrease to $-1/MWh to $9/MWh. The real question is how much geothermal penetration will
there be at this price? The heat maps indicated there were plenty of resources in the WECC to provide
geothermal generation. However, there is only about 1.4 GW of capacity currently. Apparently, the lower
variable costs of wind and solar do not allow new geothermal resources to enter the market. But firm
capacity will be needed in the future.
NuScale’s plant may receive premiums above the average market price. Because firm resources can
produce power to meet the demand, they can receive the on-peak price and off-peak prices. On the other
hand, wind only receives revenue when the wind blows. The premium for the Mid-Columbia Exchange
appears to provide $3.7/MWh above the average price. In addition, because the SMR appears to meet the
requirements of the EIM for Regulation Up and Reg Down product, NuScale may be able to receive
premiums for providing that service to the EIM.
Range analysis was undertaken to understand the impact on LCOEs of changes in interest rates, project
schedule, plant efficiency, operation period, and capacity factors. Increasing the interest rate by 2
percentage points increased the cost by $11/MWh above the $51/MWh cost for Site 1. Lengthening the
project period by 3 years increased the LCOE to $2/MWh. The small change really does not show the
complete impact of lengthening the project period because annual fixed costs would continue to
accumulate and increase the cost. Increasing the operating period from 40 to 60 years decreased the

PNNL-30225
Analysis of Results for NuScale and GEH BWRX-300 60
LCOE by $4/MWh. Reducing operating efficiency to 28 percent from 30 percent increased the costs by
$1/MWh. Reducing the capacity factor to 85 percent raised the LCOE by $5/MWh for Site 1. Interest
costs and capacity appear to be the largest cost factors for Site 1. An increased project period may
actually be the worst problem because of the unavoidable fixed costs over the extended period (which
were not assessed).
7.2 Comparison of GEH BWRX-300 Results
No FOAK estimates were found for the GEH BWRX-300. Thus, no comparison of the FOAK and the
NOAK could be undertaken. In addition, remember that the GEH BWRX-300 and NuScale LCOEs are
not intended to be directly compared in this study. GEH used a design-to-cost methodology with target
pricing that is being confirmed as the design matures. NuScale’s estimate is based on the current design.
The main competitors of GEH BWRX-300 are NGCC, geothermal generation, and potentially near-firm
wind and solar. Electricity generated by NGCC costs utilities an additional $60/MWh, raising the cost to
Washington utilities to 96.61 starting in 2030. The LCOE of geothermal, $37/MWh to $47/MWh, is
around the GEH BWRX-300 LCOE of $44/MWh, a $-3/MWh to $7/MWh difference. Note that given the
error band around the estimate for enhanced geothermal systems, the two estimates are probably
equivalent. Adding the geothermal tax credit adds $2/MWh to the range makes the difference $-1/MWh
to $9/MWh. If ENW is able to structure the deal to sell the tax credits, the differential would decrease to
$-7/MWh to $3/MWh. The real question is how much geothermal penetration will there be at the
indicated prices? The heat maps indicated there were plenty of resources in the WECC to provide
geothermal generation. However, there is only about 1.4 GW of capacity currently. Apparently, the lower
marginal costs of wind and solar do not provide for an adequate return to new resources. But firm
capacity will be needed in the future.
Given the lower costs of Site 1 ($44/MWh) compared to the Centralia site ($51/MWh), and the lack of a
significant differential in transmission costs and locational market prices between the two sites, Site 1 will
be the lower cost location to build the SMR compared to the Centralia Site. Site 1 already has
infrastructure associated with WNP-1 that is deemed useful and that will reduce the costs by about $300
million in project costs in terms of pre-construction, construction, and construction time savings.
Additionally, Site 1 is a place where the population accepts nuclear power and has a workforce in place,
but additional workforce will be required to staff the SMR.
The GEH BWRX-300 plant may receive premiums above the average market price. Because firm
resources can produce to meet demand, they can receive on-peak prices and off-peak prices, whereas
wind only receives revenue when the wind blows. The premium for the Mid-Columbia Exchange appears
to provide $4/MWh above the average price. In addition, because the SMR appears to meet the
requirements of the EIM for Regulation Up and Regulation Down product, GEH may be able to receive
premiums for providing that service to the EIM.
Range analysis was undertaken to understand the impact on LCOEs of changes in interest rates, project
schedule, plant efficiency, operation period, and capacity factors. Increasing the interest rate by
2 percentage points increased the cost by $8/MWh above the $44/MWh cost for Site 1. Lengthening the
project period by 3 years increased the LCOE by $1/MWh. The small change really does not show the
complete impact of lengthening the project period because annual fixed costs would continue to
accumulate and increase the cost. Increasing the operating period from 40 to 60 years decreased the
LCOE by $1/MWh. Reducing operating efficiency to 30 percent from 32.8 percent increased the costs by
$3/MWh. Reducing the capacity factor to 85 percent raised the LCOE by $5/MWh for Site 1. Interest
costs and capacity appear to be the largest cost factors for Site 1. An increased project period may

PNNL-30225
Analysis of Results for NuScale and GEH BWRX-300 61
actually be the worst problem because of the unavoidable fixed costs over the extended period (which
were not assessed).
PNNL-30225
Conclusions 62
8.0 Conclusions
Both NuScale ($51/MWh–$54/MWh) and GEH ($44–$51/MWh) LCOEs for an NOAK plant are above
the future cost of geothermal, the only other potential non-carbon-emitting firm generation resource. Note
that given the error band around the estimate for enhanced geothermal systems, the two estimates are
probably equivalent. Note that the NuScale and GEH LCOEs cannot be directly compared because of the
different methods used to estimate their costs. Whether there needs to be a subsidy for the NOAK plant to
enter the market depends on the price and quantity of competing resources, the size of the future market,
and the quantity of non-emitting resources that needs to be replaced and whether the UAMPs subscription
price indicates that municipal utilities are willing to purchase electricity at $55/MWh. In addition, the
quantity of non-emitting capacity depends on how many emitting resources Washington utilities must
replace, the availability of unbundled RECs, and the quantity of energy conservation projects that have a
positive net present value. Utilities can substitute up to 20 percent of the total sales with unbundled RECs
and energy conservation projects.
EIA estimates geothermal entering the market in 2025 at $37/MWh (2019$) and this estimate is probably
reflective of easier-to-access fields in California, Nevada, and Utah. Another study estimated the
enhanced geothermal system would cost around $47/MWh (2019$), enter service in about 10 years, and
the cost reflects the probable LCOE for geothermal in Washington State. Entities that have a tax appetite
get a $2/MWh tax credit that reduces the cost to $35/MWh to $45/MWh. NGCC could be purchased
between 2030 and 2045 at a penalty price of $97/MWh. These two resources bound the market for firm
resources. If NGCC is required, no subsidy would be required because NGCC would set the market price.
However, near-firm renewable resources could provide a portion of the energy required by the time the
first SMR reaches commercial operation. Variable renewable resources with batteries or other storage
could provide approximately 4 percent of the firm power requirements at current prices. According to two
separate MIT studies, wind plus battery could provide between 16 and 95 percent of firm power
requirements in the future at battery prices of about $150/kWh. With the entrance of BPA into the EIM,
power could flow inexpensively from other EIM areas with an abundance of solar and wind and
significantly reduced transmission costs. Only one transmission cost is applied rather than pancaking the
transmission costs without the EIM. One issue that will need to be understood is how the state of
Washington will handle the mix of electricity coming over the wires, which will include carbon-emitting
resources. The benefits of the EIM could be exemplified by UAMPS shipping power to Washington
State. The EIM reduces the overall transmission costs from $24/MWh to $4/MWh.
The estimated Washington firm market capacity due to replacing carbon-emitting resources is about
5 GWe. With a growing population and increasing EV penetration, the capacity requirement could be
larger. Near-firm production provides a small range for geothermal and SMRs to fill as the near-firm
generation is needed to replace approximately 5 GWe of natural gas and coal generating capacity for
Washington State.
In a Day-Ahead Market like CAISO’s, the marginal cost of delivering energy provides the supply curve
for electricity delivery. As such, geothermal and SMRs would enter up to the quantity meeting their
marginal costs. Everyone would receive the highest bid price. The price obviously does not cover long-
run costs, but the expectation is that power shortages over time will provide prices high enough to cover
the costs. In this scenario, no subsidy would be required.
Bilateral agreements, such as those occurring with UAMPS and subscribers to their plant, are another
approach to determining if a subsidy is required. Subscribers will purchase the lowest-cost generation to
meet their energy needs. If the UAMPs subscription target is an indicator, utilities appear willing to pay
$55/MWh, which indicates that a subsidy of $15–$30/MWh is required for the FOAK plant depending on
the assumptions used. This would also suggest that if the price of the NOAK plant is below the $55/MWh

PNNL-30225
Conclusions 63
target, utilities would not need any further subsidy. If the price for SMR electricity is higher, then a
subsidy would be required to bring the cost down to the point where utilities would buy the power. In
addition, if the project can be properly structured, the cost of the production tax credit could be potentially
sold, which would provide an approximate $7/MWh subsidy according to the EIA. This would indicate
that if both GEH and NuScale can reach their estimates for an NOAK plant they would need no additional
subsidy.

PNNL-30225
References 64
9.0 References
10 CFR 50. Title 10 of the Code of Federal Regulations Part 50. Energy, Domestic Licensing of
Production and Utilization Facilities. U.S. Nuclear Regulatory Commission.
10 CFR 52. Title 10 of the Code of Federal Regulations Part 52. Energy, Certificatons, and Approvals for
Nuclear Power Plants. U.S. Nuclear Regulatory Commission.
10 CFR 100. Title 10 of the Code of Federal Regulations Part 100. Energy, Reactor Site Criteria. U.S.
Nuclear Regulatory Commission.
Aas D, O Sawyerr, C Kolster, P O’Neill, and A Olsen. 2020. “Pacific Northwest Zero Emitting Resources
Study.” Prepared for Energy Northwest by Energy + Environmental Economics (E3). Accessed May 19,
2020 at https://www.ethree.com/wp-content/uploads/2020/02/E3-Pacific-Northwest-Zero-Emitting-
Resources-Study-Jan-2020.pdf.
Boschmann DE, JL Czajkowski, JD Bowman. 2014. “Geothermal Favorability Model of Washington
State. Washington Department of Natural Resources. Open File Report 2014-02. Accessed August 26,
2020 at https://www.dnr.wa.gov/publications/ger_ofr2014-02_geothermal_favorability.pdf
BPA – Bonneville Power Administration. 2016.” BP-18 Rate Proceeding.” Accessed June 29, 2020 at
https://www.bpa.gov/Finance/RateCases/BP-18/bp18/BP-18-E-BPA-
04%20Power%20Market%20Price%20Study%20and%20Documentation.pdf.
BPA – Bonneville Power Administration. 2019a. “Administrator’s Record of Decision: Energy Imbalance
Market Policy.” Available at https://www.bpa.gov/news/pubs/RecordsofDecision/rod-20190926-Energy-
Imbalance-Market-Policy.pdf.
BPA – Bonneville Power Administration. 2019b. “Administrator’s Record of Decision. Appendix C:
2020 Transmission and Ancillary and Control Service Rate Schedules and General Rate Schedule
Provisions.” Accessed June 30, 2020 at https://www.bpa.gov/Finance/RateCases/BP-20/BP18/BP-
20/Final-Proposal/BP-20-A-03-
AP03%20Appendix%20C%20Transmission%20Rate%20Schedules%20and%20GRSPs.pdf.
BPA – Bonneville Power Administration. 2019c. “2020 Power Rate Schedules and General Rate
Schedule Provisions (FY2020-2021.” Accessed June 30, 2020 at
https://www.bpa.gov/Finance/RateInformation/Documents/2020%20Power%20Rate%20Schedules%20a
nd%20GRSPs_Rev_1-21-20.pdf.
BPA – Bonneville Power Administration. March 2018. “Letter to Regional Customers and Interested
Parties.” U.S. Department of Energy. Access March 16, 2020 at https://www.bpa.gov/p/Power-
Contracts/Regional-Dialogue/rdi/TransferServicesLetterRegion_030118.pdf.
Buongiorno J, J Parsons, M Corradini, D Petti, et al. 2018. “The Future of Nuclear Energy in a Carbon-
Constrained World: An Interdisciplinary MIT Study.” Massachusetts Institute of Technology. MIT
Energy Initiative, Revision 1.
Buongiorno J, K Shirvan, E Baglietto, C Forsberg, M Driscoll, H Einstein, I Macdonald, WR Stewart, E
Velez-Lopez, K Johnston, and G Hashimoto. 2020. Japan’s Next Nuclear Energy System (JNext), Final
Report. Center for Advanced Nuclear Energy Systems (CANES), Report MIT, MIT-ANP-TR-187, March
31, 2020.

PNNL-30225
References 65
Burns & McDonnell. 2020. “UAMPS – CFPP Cooling Technology and Schedule.” Accessed July 27,
2020 at https://www.losalamosnm.us/cms/One.aspx?portalId=6435810&pageId=16896197.
CAISO – California Independent System Operator. 2018. “Fifth Replacement Electronic Tariff.”
Accessed July 2, 2020 at http://www.caiso.com/Documents/Section8-AncillaryServices-asof-Nov1-
2018.pdf.
CETA – Clean Energy Transformation Act of 2019. Senate Bill 5116 Chapter 288, State of Washington.
Chang JW, JP Pfeifenberger, CO Aydin, MG Aydin, K Van Horn, P Cahill, L Regan, and C McIntyre.
2016. “Senate Bill 350: The Impacts of a Regional ISO-Operated Power Market on California.” The
Brattle Group.” Accessed June 5, 2020 at
file:///H:/PNW%20Nuke%20Study/Transmission%20costs/SB350Study-
Volume5ProductionCostAnalysis.pdf.
Cladouhos T, S Petty, A Bonneville, A Schultz, C Sorlie. 2018. “SuperHot EGS and the Newberry Deep
Drilling Project, 43rd Workshop on Geothermal Reservoir Engineering Stanford University, Stanford,
California.
Colbert, C. 2019. “Modern Energy Solutions with NuScale’s Small Modular Reactor.” 06/19/2019.
Accessed 01/27/2021 at
https://www.rmel.org/rmeldocs/Library/Presentations/2019/SUPPLY19_eBinder%20Part%202.pdf
Cole W and AW Frazier. 2019. Cost Projections for Utility-Scale Battery Storage. NREL/TP-6A20-
73222. National Renewable Energy Laboratory, Golden, Colorado. Accessed June 25, 2020 at
https://www.nrel.gov/docs/fy19osti/73222.pdf.
Davis JG. 2019. “IRS Releases 2019 Section 45 Production Tax Credit Amounts.” In Tax Equity Times.
Accessed May 14, 2020 at https://www.taxequitytimes.com/2019/07/irs-releases-2019-section-45-
production-tax-credit-amounts/.
Davis S, D Bhatnagar, and S Sridhar. 2020. “Grid Capacity for EVs at Scale.” Presentation at Pacific
Northwest National Laboratory, Richland, Washington.
DNR – Washington Department of Natural Resources. 1981. “Lineament and Fault Maps of the South
Cascades, Washington: Centralia Quadrangle. Accessed 01/27/2021.
DOE/NE – U.S. Department of Energy. 2020. “DOE Approves Award for Carbon Free Power Project.
10/16/2020. Office of Nuclear Energy. Accessed 01/27/2021 at https://www.energy.gov/ne/articles/doe-
approves-award-carbon-free-power-project.
.
DOE – U.S. Department of Energy. 2020. “Compare Fuel Cell Vehicles.” Office of Energy Efficiency
and Renewable Energy. (Last updated March 11/2020.) Accessed June 8, 2020 at
https://www.fueleconomy.gov/feg/fcv_sbs.shtml.
E3 – Energy+Environmental Economics. 2019. “Generation and Transmission Resource Cost Update
2019.” Prepared for WECC. Accessed June 17, 2020 at https://www.wecc.org/Administrative/E3-
WECC%20Resource%20Cost%20Update-201905%20RAC%20DS%20Presentation.pdf.
PNNL-30225
References 66
Edelstein S. 2020. “Battery-electric or Hydrogen Fuel Cell? VW lay out why one is the Winner.” In
Green Car Reports. Accessed June 8, 2020 at https://www.greencarreports.com/news/1127660_battery-
electric-or-hydrogen-fuel-cell-vw-lays-out-why-one-is-the-winner.
EIA – U.S. Energy Information Administration, Sep 2019a. Form EIA-860, Annual Electric Generator
Report. Accessed February 26, 2020 at https://www.eia.gov/electricity/data/eia860/.
EIA – U.S. Energy Information Administration, Sep 2019b. Form EIA-923, Power Plant Operations
Report. Accessed February 26, 2020 at https://www.eia.gov/electricity/data/eia860/.
EIA – U.S. Energy Information Administration, Sep 2019c. “Table 9.5. Emissions from Energy
Consumption at Conventional Power Plants and Combined-Heat-and-Power Plants, by State, 2017 and
2018.” Accessed June 23, 2020 at https://www.eia.gov/electricity/annual/html/epa_09_05.html.
EIA – U.S. Energy Information Administration. 2020a. “Cost and Performance Characteristics of New
Generating Technologies, Annual Energy Outlook.” Accessed May 19, 2020 at
https://www.eia.gov/outlooks/aeo/assumptions/pdf/table_8.2.pdf.
EIA – U.S. Energy Information Administration. 2020b. “Levelized Cost and Levelized Avoided Cost of
New Generation Resources in the Annual Energy Outlook 2020.” Accessed May 19, 2020 at
https://www.eia.gov/outlooks/aeo/pdf/electricity_generation.pdf.
Endangered Species Act of 1973, as amended. 16 U.S.C. ch. 35 § 1531 et seq.
Energy Strategies. 2019. “Analyzing the Cost of Small Modular Reactors and Alternative Power
Portfolios.” Prepared for the Healthy Environment Alliance of Utah. Accessed May 19, 2020 at
https://www.healutah.org/wp-content/uploads/2019/06/Energy-Strategies-Study_Analyzing-the-Cost-of-
Small-Modular-Reactors-and-Alternative-Power-Portfolios.pdf
ENW – Energy Northwest. 2018. “Energy Northwest: 2018 Annual Report.” Accessed May 19, 2020 at
https://www.energy-
northwest.com/whoweare/finance/Documents/2018%20Annual%20Report%20Financials.pdf.
ENW – Energy Northwest. 2019. “Energy Northwest: 2019 Annual Report.” Accessed May 26, 2020 at
https://www.energy-
northwest.com/whoweare/finance/Documents/2018%20Annual%20Report%20Financials.pdf.
ENW – Energy Northwest. 2020. “Columbia Generating Station.” Accessed May 26, 2020 at
https://www.energy-
northwest.com/whoweare/finance/Documents/2019%20Annual%20Report%20Financials.pdf.
EPA – Environmental Protection Agency. ca 2018. “Green Power Pricing.” (undated webpage). Accessed
May 20, 2020 at https://www.epa.gov/greenpower/green-power-pricing.
Florescu P and J Pead. March 2018. “Realizing the Value of Bonneville Power Administration’s Flexible
Hydroelectric Assets. Masters of Public Policy, Harvard University.” Client: E Mainzer and D Marker.
Bonneville Power Administration.
GEA – Geothermal Association. 2013. “The Values of Geothermal Energy.” Accessed June 28, 2020 at
https://geothermal.org/PDFs/Values_of_Geothermal_Energy.pdf.

PNNL-30225
References 67
Glassdoor. 2020. “Jobs.” Accessed June 10, 2020 at https://www.glassdoor.com/Job/jobs.htm?
suggestCount=0&suggestChosen=false&clickSource=searchBtn&typedKeyword=&locT=C&locId=1150
330&jobType=&context=Jobs&sc.keyword=nuclear+operator&dropdown=0.
Hanley S. 2020. “Will Form Energy Aqueous Air Battery Challenge Tesla for Grid Storage Dominance.”
CleanTechnica. Access June 25, 2020 at https://cleantechnica.com/2020/05/11/will-form-energy-aqueous-
air-battery-challenge-tesla-for-grid-storage-
dominance/#:~:text=Now%2C%20that%20does%20not%20mean,that%20is%20the%20case%2C%20BO
OM!.
Harrison TJ, MA Moore, KA Williams, and JD Rader. 2018. “G4ECONS User Manual.” GenIV
International Forum.
Harrison TJ. 2018. “G4ECONS_Rev3_Work_Rev_5.” GenIV International Forum.
IAEA – International Atomic Energy Agency. 2018. “Non-baseload Operation in Nuclear Power Plants:
Load Following and Frequency Control Modes of Flexible Operation.” IAEA Nuclear Energy Series, No.
NP-T-3-3.23.
Ingersol DT, C Cobert, Z Houghton, R Snuggerud, JW Gaston, and M Empey. 2015. “Can Nuclear Power
and Renewables be Friends?” In Proceedings of ICAPP 2015, Nice, France. Paper 15555.
INL – Idaho National Laboratory. No date. “Comparing Energy Costs per Mile for Electric and Gasoline-
Fueled Vehicles.” Advanced Vehicle Testing Activity, INL/MIS-11-22490. (undated web page).
Accessed June 8, 2020 at https://avt.inl.gov/sites/default/files/pdf/fsev/costs.pdf.
Kirschenberg S, H Jackler, J Eun, B Oakley, and W Goldenberg. 2017. “Small Modular Reactors: Adding
to the Resilience at Federal Facilities.” KutakRock LLP and Scully Capital for Allegheny Science &
Technology Corporation. Accessed May 19, 2020 at
https://www.energy.gov/sites/prod/files/2018/01/f47/Small%20Modular%20Reactors%20-
%20Adding%20to%20Resilience%20at%20Federal%20Facilities%20.pdf.
Lazard. 2019. “Lazard’s Levelized Cost of Energy Analysis – Version 13.0. Accessed May 18, 2020 at
https://www.lazard.com/media/451086/lazards-levelized-cost-of-energy-version-130-vf.pdf.
Lazard. 2018. “Lazard’s Levelized Cost of Energy Analysis – Version 12.0. Accessed May 18, 2020 at
https://www.lazard.com/media/450784/lazards-levelized-cost-of-energy-version-120-vfinal.pdf.
LBL – Lawrence Berkeley Laboratory. 2018. “2018 Wind Technologies Report.” U.S. Department of
Energy, Office of Efficiency and Renewable Energy. Accessed July 28, 2018 at
https://emp.lbl.gov/sites/default/files/wtmr_final_for_posting_8-9-19.pdf.
Mallapragada DS, NA Sepulveda, and JD Jenkins. 2020. “Long-run system value of battery energy
storage in future grids with increasing wind and solar generation.” Applied Energy 275:115390.
Miller G. 2013. “Energy Northwest: Coming of Age, 1999-2012.” First edition, ISBN: 978-1-9333245-
32-4. Documentary Media at www.documentarymedia.com.
NARA – National Archives and Records Administration. 2020. “Nuclear Regulatory Commission, 10
CFR Part 170 and 171.” Federal Register, Vol. 85:32. Office of the Federal Register (OFR). Accessed
June 17, 2020 at https://www.govinfo.gov/content/pkg/FR-2020-02-18/pdf/2020-03054.pdf.

PNNL-30225
References 68
NREL – National Renewable Energy Laboratory. ca 2020. Annual Technology Baseline. Accessed
February 26, 2021 at https://atb.nrel.gov/electricity/2020/index.php?t=sd
NEI – Nuclear Energy Institute. 2018. “Industry Finds NRC’s New Reactor Reviews Costly.” Accessed
April 30, 2020 at https://www.nei.org/news/2018/nei-finds-nrc-new-reactor-reviews-inefficient.
NPCC – Northwest Power and Conservation Council. 2019. Seventh Power Plan and Midterm
Assessment. Document 2019-03. Accessed May11, 2020 at
https://www.nwcouncil.org/sites/default/files/7th%20Plan%20Midterm%20Assessment%20Final%20Cnc
l%20Doc%20%232019-3.pdf.
NRC – Nuclear Regulatory Commission. 2018. “Regulatory Guide 4.2, Revision 3. Preparation of
Environmental Reporst for Nuclear Power Stations.” Available at
https://www.nrc.gov/docs/ML1807/ML18071A400.pdf
NRC – U.S. Nuclear Regulation Commission. 2020a. “New Reactors Business Line Fee Estimates.”
Access June 17, 2020 at https://www.nrc.gov/reactors/new-reactors/new-licensing-files/nro-fee-
transformation-data.pdf.
NRC –U.S. Nuclear Regulation Commission. 2020b. “Part 171 – Annual Fees for Reactor Licenses and
Fuel Cycle Licenses and Materials Licenses, Including Holders of Certificates of Compliance,
Registrations, and Quality Assurance Program Approvals and Government Agencies Licensed by the
NRC.” (Website last update May 7, 2020). Accessed May 29, 2020 at https://www.nrc.gov/reading-
rm/doc-collections/cfr/part171/.
NRC – U.S. Nuclear Regulation Commission. 2019. “Backgrounder on Nuclear Insurance and Disaster
Relief.” (Website last update May 3, 2019). Accessed May 29, 2020 at https://www.nrc.gov/reading-
rm/doc-collections/fact-sheets/nuclear-insurance.html.
NuScale. 2020. “Protection Against Extreme External Events Like Fukushima.” Accessed June 10, 2020
at https://www.nuscalepower.com/benefits/safety-features/extreme-event-
protection#:~:text=The%20NuScale%20ultimate%20heat%20sink,ranging%20from%203%E2%80%901
2%20Hz.
Phillips JR, SJ Kreyling, S Short, and MR Weimar. 2010. “Economic and Nonproliferation Analysis
Framework for Assessing Reliable Nuclear Fuel Service Arrangements.” United States: N. p., 2010.
PJM – Pennsylvania Jersey Maryland Integrated System Operator. 2019. “Memo to the Cost
Development Subcommittee Date.” May 1, 2019. Accessed May 18, 2020 at https://www.pjm.com/-
/media/committees-groups/subcommittees/cds/postings/handy-whitman-index.ashx?la=en.
Roberts D. 2019. “A Closer Look at Washington’s Superb New 100% Clean Electricity Bill.” In Vox.
Accessed May 20, 2020 at https://www.vox.com/energy-and-
environment/2019/4/18/18363292/washington-clean-energy-bill.
Roberts D. 2020. “Getting to 100% renewable requires cheap energy storage. But how cheap?” Vox.
Accessed June 25, 2020 at https://www.vox.com/energy-and-environment/2019/8/9/20767886/renewable-
energy-storage-cost-electricity.

PNNL-30225
References 69
Rothwell G. 2004. “Cost Contingency as the Standard Deviation of the Cost Estimate for Cost
Engineering.” Stanford Institute for Economic Policy Research, Stanford University, Palo Alto,
California. SIEPR Discussion Paper No. 04-05.
Shouman ERM. 2020. “Global Prediction of Wind Energy Market Strategy for Electricity Generation.” In
Intech Open. DOI: 1-.5772/intechoen.89968. Accessed May 14, 2020 at
https://www.intechopen.com/books/modeling-simulation-and-optimization-of-wind-farms-and-hybrid-
systems/global-prediction-of-wind-energy-market-strategy-for-electricity-generation
Shropshire DE, KA Williams, JD Smith, BW Dixon, M Munzik-Gougar, RD Adams D Gombert,
JT Carter, E Schneider, and D Hebditch. 2009. Advanced Fuel Cycle Cost Basis. INL/EXT-07-12107
Rev. 2. Idaho National Laboratory. Idaho Falls, Idaho. Accessed June 16, 2020 at
https://inldigitallibrary.inl.gov/sites/sti/sti/4536700.pdf.
Spector J. 2020. “Long Duration Breakthrough? Form Energy’s First Project Tries Pushing Storage to
150 hours.” GreenTech Media. Accessed June 25, 2020 at
https://www.greentechmedia.com/articles/read/form-energys-first-project-pushes-long-duration-storage-
to-new-heights-150-hour-duration.
Surina J. 2016. “NuScale Power Plant Economics.” Presentation. NuScale Power LLC, Chief Financial
Officer. NuFab, Northwestern University.
Surina J and M McGough. 2015. “The NuScale Value Proposition.” Presentation. NuScale Power LLC,
Chief Financial Officer and Chief Commercial Officer.
TransAlta. 2018. “Centralia Mine.” Accessed June 10, 2020 at https://www.transalta.com/facilities/mines-
operation/centralia-
mine/#:~:text=Since%201971%2C%20approximately%202%2C000%20acres,multi%2Dyear%20reclama
tion%20process%20continues.
UAMPS – Utah Association of Municipal Power Systems. 2020a. “Development Approach to the Carbon
Free Power Project.” Utah Association of Municipal Power Systems. Accessed July 27, 2020 at
https://www.losalamosnm.us/UserFiles/Servers/Server_6435726/File/Government/Departments/Public%
20Utilities/CFPP/20200721-
Presentations/CFPP%20Town%20Hall%20Development%20Approach%20_Mason%20Baker_7-21-
20.pdf.
UAMPS – Utah Association of Municipal Power Systems. 2020b. “Carbon Free Power Project
Development Status and Overview.” Utah Association of Municipal Power Systems. Accessed July 27,
2020 at
https://www.losalamosnm.us/UserFiles/Servers/Server_6435726/File/Government/Departments/Public%
20Utilities/CFPP/CFPP%20Development%20Status%20and%20Overview_July%2015%202020.%20FIN
AL%20(2).pdf.
URS. 2014a. Small Modular Reactor Hanford Site Analysis. Final Report. Richland Washington.
URS. 2014b. Supporting Documentation for Small Modular Reactor Hanford Site Analysis. Final Report.
Richland Washington.
PNNL-30225
References 70
Varton, S. 2018. “ In Washington, a Coal-Fired Power Plant Plant Will Put Its Money on the Sun.”
Accessed July 2020 at https://www.nrdc.org/stories/washington-coal-fired-power-plant-will-put-its-
money-sun.
Voelcker J. 2020. “Why We Still Can’t Deliver on the Promise of Hydrogen Cars.” The Drive. Accessed
June 8, 2020 at https://www.thedrive.com/tech/33408/why-we-still-cant-deliver-on-the-promise-of-
hydrogen-cars.
WA – State of Washington. 2019. “Engrossed Second Substitute Senate Bill 5116.” Effective date May 7,
2019. Accessed May 20, 2020 at https://lawfilesext.leg.wa.gov/biennium/2019-
20/Pdf/Bills/Session%20Laws/Senate/5116-S2.SL.pdf.
WADOC – Washington State Department of Commerce. 2017. “Washington State Electric Utility Fuel
Mix Disclosure Reports for Calendar Year 2016.” Accessed June 8, 2020 at
https://ci.ellensburg.wa.us/DocumentCenter/View/4636/Commerce-Dept-WA-FMD-2016.
WADOC – Washington State Department of Commerce. 2019. “Washington State Electric Utility Fuel
Mix Disclosure Reports.” Accessed June 8, 2020 at https://www.commerce.wa.gov/wp-
content/uploads/2020/04/Energy-Fuel-Mix-Disclosure-2018.pdf.
Wiser R, M Bolinger, et al. 2019. “2018 Wind Technologies Market Report.” Lawrence Berkeley
National Laboratory for the U.S. Department of Energy. Accessed May 14, 2020 at
https://emp.lbl.gov/sites/default/files/wtmr_final_for_posting_8-9-19.pdf.
Zhou Z, T Levin, and G Conzelmann. 2016. Survey of Ancillary Services Markets. ANLESD-16/1.
Argonne National Laboratory, Lemont, Illinois. Accessed June 30, 2020 at
https://publications.anl.gov/anlpubs/2016/01/124217.pdf.
Zichella C. 2019. “Western EIM Expands, Electricity Markets Outlook Brightens.” Expert blog, Natural
Resource Development Council. Access June 23, 2020 at https://www.nrdc.org/experts/carl-
zichella/western-eim-expands-electricity-markets-outlook-brightens.
Zigler MS, JM Mueller, GD Pereira, J Song, M Ferrara, YM Chiang, and JE Trancik. 2019. “Storage
Requirements and Costs of Shaping Renewable Energy Toward Grid Decarbonization.” Joule 3: pp.
2134-2153.

PNNL-30225
Appendix A.1
Appendix A – Questionnaires
A.1 GEH and NuScale Questionnaire
Assume Nth-of-a-Kind Plant Deployment
Please provide ranges for applicable items with expected, low and high.
1.0 Plant Data Expected Low High
Plant name -
Gross of Plant Power (MWth/MWe)- ______ ______ ______
Net Plant Efficiency – ______ ______ ______
Rolling Plant Capacity Factor Over Several Years – ______ ______ ______
Fuel Form (UO2, metallic, aqueous, etc.) &
Enrichment (LEU/HALEU/other) – ______ ______ ______
Ultimate Heat Sink (water or air cooling) - ______ ______ ______
Number of Individual Modules per Plant (if applicable) –
Site Size (Acres) ______ ______ ______
Emergency Planning Zone-Plume exposure pathway (Miles) ______ ______ ______
Probability of attaining the mileage (Probability) ______ ______ ______
Emergency Planning Zone-Ingestion pathway (Miles) ______ ______ ______
Probability of attaining the mileage (Probability) ______ ______ ______
2.0 Economics Data
Interest rate – site acquisition, licensing and civil works phase ______ ______ ______
Interest rate – construction phase ______ ______ ______
Interest rate – operating phase ______ ______ ______
Interest rate – decommissioning sinking fund ______ ______ ______
Interest rate – other sinking funds? ______ ______ ______
Ownership – discount rate ______ ______ ______
Time period – licensing, acquisition, and civil works phase ______ ______ ______
• Expected Cost ______ ______ ______
Time period – construction phase ______ ______ ______
• Construction costs and spend curve ______ ______ ______
• Cost to tie into the electric grid including new transmission lines ______ ______ ______
• Safety amount of concrete used to construct plant ______ ______ ______
• Non-safety amount of concrete used to construct plant ______ ______ ______
• Safety amount of steel used to construct plant ______ ______ ______
• Non-safety amount of steel used to construct plant ______ ______ ______
• Total Cost ______ ______ ______
Time period – start up months ______ ______ ______
Operating Phase – number of years ______ ______ ______
• Estimated annual maintenance costs ______ ______ ______
• Estimate of annual fuel costs (what are underlying assumptions for SWU, O3O8, etc. to help
normalize across multiple vendors) ______ ______ ______
• Estimate of annual costs to store fuel at site ______ ______ ______
Number of Plant Personnel & Estimated Annual Salaries ______ ______ ______
• Engineering & Maintenance Support ______ ______ ______
PNNL-30225
Appendix A.2
• Average annual salaries ______ ______ ______
• Operations ______ ______ ______
• Average annual salaries ______ ______ ______
• Refueling Support ______ ______ ______
• Average annual salaries ______ ______ ______
• Security cost estimate ______ ______ ______
• Overhead Personnel ______ ______ ______
• Average annual salaries ______ ______ ______
Deactivation & Decommissioning Phase – Number of Years ______ ______ ______
• Estimated Cost ______ ______ ______
3.0 Additional Information for Consideration
Is there a phased deployment of a modular SMR, or multiple single SMR units at one site? If it is a
phased deployment of modules, what is the time period to achieve first revenue and is this shorter than the
entire plant construction phase?
Summarize Attributes for Flexible Operations (e.g., load following, frequency control, reactive power,
etc.)
Summarize Approach to Flexible Operations: For example, dumping steam to condenser or reactor power
maneuvering and response time to significant load changes (seasonal, weekly, daily, 5-minutes, etc.).
Summarize Non-baseload Applications: shifting power to energy storage, hydrogen production, pumped
hydro, or providing process heat for industrial uses during periods of low grid demand. Include
information on process heat temperature for these applications.
Electrical grid “cold start” capability?
Capable of micro grid / Island mode operations?
Fuel reload frequency and planned outage durations
What is additional cost per MWe to add new capacity to support new grid demand?
What is ratio of installed MWe vs regional daily peak grid demand?
What is ratio of installed MWe vs regional daily average grid demand?
A.2 Energy Northwest Questionnaire Will the NuScale facility be a part of Energy Northwest?
If yes, what discount rate will be used to determine delivery of electricity at cost?
What is Energy Northwest’s overhead costs for adding the NuScale facility? Please break it down by
type of overhead.
• Staff recruitment $______
• Office overhead $______
• Management Expense $______
• Property taxes or payments in lieu of taxes (PILT) $______
• Insurance $______
• Cost of Borrowing %______

PNNL-30225
Appendix A.3
• Salary Overheads %______
o Taxes %______
o Insurance %______
o Benefits %______
o Fringes %______
• Any other salary related costs ______
• Other (Please enumerate) ______
Will there be site cost/savings associated with using the Energy Northwest site? Enumerate added savings
and added costs by line item?
• Land and Land Rights $______
• Site permitting $______
• Plant licensing $______
• Plant Permits $______
• Plant Studies $______
• Plant Reports $______
• Public Awareness Programs $______
• Site Remediation Work $______
• Additional Transmission Capacity Required $______
• Will there be additional costs for siting the SMR next to a traditional LWR? $______
• How much footprint is available for the SMR? $______

PNNL-30225
Pacific Northwest National Laboratory
902 Battelle Boulevard
P.O. Box 999
Richland, WA 99354
1-888-375-PNNL (7665)
www.pnnl.gov