techno-economic analysis of biochemical scenarios for production of cellulosic ethanol
TRANSCRIPT

Technical Report NREL/TP-6A2-46588 June 2010
Techno-Economic Analysis of Biochemical Scenarios for Production of Cellulosic Ethanol F. Kabir Kazi, J. Fortman, and R. Anex Iowa State University
G. Kothandaraman ConocoPhillips Company
D. Hsu, A. Aden, and A. Dutta National Renewable Energy Laboratory

National Renewable Energy Laboratory 1617 Cole Boulevard, Golden, Colorado 80401-3393 303-275-3000 • www.nrel.gov
NREL is a national laboratory of the U.S. Department of Energy Office of Energy Efficiency and Renewable Energy Operated by the Alliance for Sustainable Energy, LLC
Contract No. DE-AC36-08-GO28308
Technical Report NREL/TP-6A2-46588 June 2010
Techno-Economic Analysis of Biochemical Scenarios for Production of Cellulosic Ethanol F. Kabir Kazi, J. Fortman, and R. Anex Iowa State University
G. Kothandaraman ConocoPhillips Company
D. Hsu, A. Aden, and A. Dutta National Renewable Energy Laboratory
Prepared under Task No. BB07.7510

NOTICE
This report was prepared as an account of work sponsored by an agency of the United States government. Neither the United States government nor any agency thereof, nor any of their employees, makes any warranty, express or implied, or assumes any legal liability or responsibility for the accuracy, completeness, or usefulness of any information, apparatus, product, or process disclosed, or represents that its use would not infringe privately owned rights. Reference herein to any specific commercial product, process, or service by trade name, trademark, manufacturer, or otherwise does not necessarily constitute or imply its endorsement, recommendation, or favoring by the United States government or any agency thereof. The views and opinions of authors expressed herein do not necessarily state or reflect those of the United States government or any agency thereof.
Available electronically at http://www.osti.gov/bridge
Available for a processing fee to U.S. Department of Energy and its contractors, in paper, from:
U.S. Department of Energy Office of Scientific and Technical Information P.O. Box 62 Oak Ridge, TN 37831-0062 phone: 865.576.8401 fax: 865.576.5728 email: mailto:[email protected]
Available for sale to the public, in paper, from: U.S. Department of Commerce National Technical Information Service 5285 Port Royal Road Springfield, VA 22161 phone: 800.553.6847 fax: 703.605.6900 email: [email protected] online ordering: http://www.ntis.gov/ordering.htm
Printed on paper containing at least 50% wastepaper, including 20% postconsumer waste

iii
Foreword
The purpose of this techno-economic analysis is to compare a set of biofuel conversion technologies selected for their promise and near-term technical viability. Every effort has been made to make this comparison on an equivalent basis using common assumptions. The process design and parameter value choices underlying this analysis are based on public domain literature only. For these reasons, the results are not indicative of potential performance. Rather they are meant to represent the most likely performance given the current state of public knowledge.

iv
List of Acronyms
AFEX ammonia fiber explosion (or expansion) ASPEN Advanced Simulator For Process Engineering (software) BTU British thermal unit CAFI Consortium for Applied Fundamentals and Innovation COD chemical oxygen demand DB declining balance (depreciation) EtOH ethanol EVD experimentally validated data FCI fixed capital investment FPU filter paper units GGE gallons of gasoline equivalent IRS Internal Revenue Service MACRS (IRS) modified accelerated cost recovery system PV product value MM million MT metric ton NREL National Renewable Energy Laboratory SSCF simultaneous saccharification and cofermentation SSF simultaneous saccharification and fermentation ST short ton TD&IC total direct and indirect costs TCI total capital investment

v
Executive Summary
A techno-economic analysis on the production of cellulosic ethanol by fermentation was conducted to understand the viability of liquid biofuel production processes within the next 5-8 years. Initially, 35 technologies were reviewed and a matrix was prepared considering economics, technological soundness and maturity, environmental aspects, process performance, and technical and economic risks. Then, a two-step down selection was performed to choose scenarios to be evaluated in a more detailed economic analysis. In the first screening, the lignocellulosic ethanol process was selected because it is well studied and portions of the process have been tested at pilot scales. In the second screening, seven scenarios of process variations were selected: four variations involved pretreatment (dilute acid, two-stage dilute acid, hot water, and ammonia fiber explosion) and three variations involved downstream processes (pervaporation, separate 5-carbon and 6-carbon sugar fermentation, and on-site enzyme production). Each of these scenarios was examined in detail. Given the time needed for design, construction, and startup of large process plants, plants operating in the 5-8 year timeframe would likely need to be based on recent experimental data. For this work, process designs were constrained to public data published in 2007 or earlier, without projecting for future process improvements. Economic analysis was performed for an “nth plant” (mature technology) to obtain total investment and product value (PV) (defined as value of the product needed for a net present value of zero with a 10% internal rate of return). The final selection among the scenarios was performed primarily based on the PV. Sensitivity analysis was performed on PV to assess the impact of variations in process and economic parameters. Results show that the modeled dilute acid pretreatment process without any downstream process variation had the lowest PV of $3.40/gal of ethanol (which is $5.15/gallon of gasoline equivalent, GGE) in 2007 dollars. Sensitivity analysis shows that PV is most sensitive to feedstock and enzyme costs.
The cellulosic ethanol process is a new technology, for which a pioneer plant is expected to be significantly more expensive than the nth plant. To assess the impact of technology maturity on pioneer plant cost, a cost growth analysis was performed following a method documented in a RAND Corporation report. This methodology attempts to incorporate added expenses and start-up time for a new process. There is some subjectivity in choosing the parameters for the pioneer plant analysis, so a range of parameters was used to estimate pioneer plant costs for three scenarios: optimistic, most probable, and pessimistic. The PV obtained from cost-growth analysis is substantially larger for a pioneer plant, increasing from $3.40/gal (which is $5.15/GGE), before including added expenses, to $5.01/gal ($7.59/GGE), $5.76/gal ($8.72/GGE), and $7.08/gal ($10.71/GGE) for the optimistic, most probable, and pessimistic scenarios, respectively.
The PV obtained from the 2007 published data is much higher than the market gasoline price. Also, published technological data may not be adequate to accurately project a competitive PV from a commercial plant of 2000 MT/day capacity. However, this analysis identifies some of the more cost intensive operations and areas. The current process can only reach approximately 4.5% ethanol in the fermentor beer, which is a third of what grain ethanol plants are achieving today. The analysis also assumed an enzyme price as $0.69/gal of ethanol produced. Based on this analysis, we believe that high-performance enzymes at a cheaper price are required and that more research is needed to achieve higher ethanol concentration in the fermentor for this process to compete in the current energy market.

vi
Table of Contents Foreword ..................................................................................................................................................... iiiList of Acronyms ........................................................................................................................................ ivExecutive Summary .................................................................................................................................... vTable of Contents ....................................................................................................................................... viList of Figures ........................................................................................................................................... viiList of Tables ............................................................................................................................................. viiMethodology ................................................................................................................................................ 1
Summary of the Down-Selection Process ..................................................................................1Project Assumptions ..................................................................................................................3Process Description and Flow Diagram .....................................................................................4Process Variations ......................................................................................................................5
Dilute Acid Pretreatment .....................................................................................................5Two-Stage Dilute Acid Pretreatment ...................................................................................6Hot Water Pretreatment .......................................................................................................8AFEX Pretreatment ..............................................................................................................8Separate C5 and C6 Fermentation .......................................................................................9Ethanol Separation Using Pervaporation ...........................................................................10On-Site Enzyme Production ..............................................................................................12
Methodology for Economic Analysis ......................................................................................13Methodology for Discounted Cash Flow Analysis for nth Plant ........................................13Pioneer Plant Analysis .......................................................................................................14
Results and Discussion ............................................................................................................................ 18nth Plant Cost Analysis .............................................................................................................18Sensitivity Analysis .................................................................................................................21Pioneer Plant Analysis Results ................................................................................................24
Comparison with Previous Studies ......................................................................................................... 25Conclusions ............................................................................................................................................... 27References ................................................................................................................................................. 28Appendices ................................................................................................................................................ 31
Appendix A - Assumptions for Techno-economic Studies of Biochemical Conversion Processes ............................................................................................................................31Plant Size, Location, and Construction ..............................................................................31Units ...................................................................................................................................31Feedstock and Enzymes .....................................................................................................31Material and Energy Balance .............................................................................................32Equipment Design, Material of Construction, and Costing ...............................................33Chemical Costing ...............................................................................................................34Operating Cost ...................................................................................................................34Wastewater Treatment Plant ..............................................................................................34Greenhouse Emissions and Control ...................................................................................35Cost Analysis .....................................................................................................................35
Appendix B - Sensitivity Parameters and Values ....................................................................37Appendix C - Sensitivity Results .............................................................................................39Appendix D - Cost Analysis Result Summary ........................................................................43Appendix E - Equipment List and Costs, Installation Factors, and Installed Equipment Costs
for Dilute Acid Pretreatment Processes .............................................................................51
vii
Appendix F - Process Operating Summaries ...........................................................................62Appendix G - General Process Description .............................................................................78Appendix H - Cost By Area Of Process Scenarios ..................................................................81Appendix I - Down Selection Matrix .......................................................................................85Appendix J - Analysis: Cost Growth Variables And Results ..................................................90
List of Figures
Figure 1. Overall process block diagram of a typical cellulosic ethanol process plant (based on NREL’s 2002 design report and modified to 2007 EVD) .................................................. 5
Figure 2. Process flow diagram for dilute acid pretreatment .......................................................... 6Figure 3. Process flow diagram for two-stage dilute acid pretreatment/hydrolysis and
fermentation ........................................................................................................................ 7Figure 4. Process flow diagram for base case pretreatment, enzymatic hydrolysis, and
fermentation ........................................................................................................................ 7Figure 5. Hot water pretreatment process flow diagram ................................................................. 8Figure 6. AFEX process flow diagram ........................................................................................... 9Figure 7. Separate C5 and C6 fermentation configuration ........................................................... 10Figure 8. Base case distillation configuration ............................................................................... 11Figure 9. Pervaporation separation process .................................................................................. 12Figure 10. On-site enzyme production process flow diagram ...................................................... 13Figure 11. Impact of pretreatment parameters on PV ................................................................... 21Figure 12. Impact of saccharification parameters on PV .............................................................. 22Figure 13. Impact of overall process/economic parameters on PV (dilute acid pretreatment) ..... 23Figure 14. Ethanol cost estimations from previous techno-economic studies. ............................. 25Figure G-1. Wastewater treatment section (Area 600) ................................................................. 79Figure G-2. Steam and power generation section (Area 800) ...................................................... 80 List of Tables
Table 1. Plant Performance and Cost Growth Variables for Dilute Acid Pretreatment Processes ........................................................................................................................... 16
Table 2. Product Value for Various Pretreatment and Downstream Process Variations .............. 18Table 3. Comparison of Dilute Acid Pretreatment Results from Lab- and Pilot-Scale Data ....... 19Table 4. Costs by Area of the Dilute Acid Pretreatment Process Scenario .................................. 20Table 5. Pioneer Plant Analysis Results for the Dilute Acid Pretreatment Process Scenario ...... 24Table A-1. Corn Stover Feedstock Composition .......................................................................... 32Table B-1. Sensitivity Parameters for Pretreatment and Saccharification (AREA 200) .............. 37Table B-2. Sensitivity Parameters for Overall Process ................................................................. 38Table C-1. Impact of Pretreatment Parameters on PV .................................................................. 39Table C-2. Impact of Overall Process and Economic Parameters on PV ..................................... 42Table D-1. Cost Analysis Result Summary for Dilute Acid Pretreatment Processes ................... 43Table D-2. Cost Analysis Result Summary for Dilute Acid Pretreatment (High Solids)
Processes ........................................................................................................................... 44
viii
Table D-3. Cost Analysis Result Summary for Hot Water Pretreatment Process ........................ 45Table D-5. Cost Analysis Result Summary for AFEX Pretreatment Processes ........................... 47Table D-6. Cost Analysis Result Summary for On-site Enzyme Production Processes .............. 48Table D-7. Cost Analysis Result Summary for Pervaporation Purification Processes ................. 49Table D-8. Cost Analysis Result Summary for Separate C5 and C6 Fermentation Processes ..... 50Table E-1. Equipment Lists and Costs for Dilute Acid Pretreatment Processes .......................... 51Table F-1. Operating Summary for Dilute Acid Pretreatment Processes ..................................... 62Table F-2. Operating Summary for Dilute Acid Pretreatment (Pilot) Processes .......................... 64Table F-3. Operating Summary for Two-Stage Dilute Acid Pretreatment Processes .................. 66Table F-4. Operating Summary for Hot Water Pretreatment Processes ....................................... 68Table F-5. Operating Summary for AFEX Pretreatment Processes ............................................. 70Table F-6. Operating Summary for Separate C5 & C6 Fermentation Processes .......................... 72Table F-7. Operating Summary for Pervaporation Two-Stage Dilute Acid Pretreatment
Processes ........................................................................................................................... 74Table F-8. Operating Summary for On-site Enzyme Production Processes ................................. 76Table H-1. Costs by Area of the Dilute Acid Pretreatment (High Solids) Scenario .................... 81Table H-2. Costs by Area of the 2-Stage Dilute Acid Pretreatment Scenario .............................. 81Table H-3. Costs by Area of the Hot Water Pretreatment Scenario ............................................. 82Table H-4. Costs by Area of the AFEX Pretreatment Scenario ................................................... 82Table H-5. Costs by Area of the Separate C-5 and C-6 Fermentation Process Scenario ............. 83Table H-6. Costs by Area of the Pervaporation Process Scenario ................................................ 83Table H-7. Costs by Area of the On-site Enzyme Production Processes Scenario ...................... 84Table I-1. Process Down-Selection Matrix ................................................................................... 85Table J-1. Plant Performance and Cost Growth Variables for Dilute Acid Pretreatment (High
Solids Loading) Processes ................................................................................................ 90Table J-2. Plant Performance and Cost Growth Variables for Hot water Pretreatment
Processes ........................................................................................................................... 90Table J-3. Plant Performance and Cost Growth Variables for Two-Stage Dilute Acid
Pretreatment Processes ...................................................................................................... 91Table J-4. Plant Performance and Cost Growth Variables for AFEX Pretreatment Processes .... 91Table J-5. Plant Performance and Cost Growth Variables for On-Site Enzyme Production
Processes ........................................................................................................................... 92Table J-6. PV from Cost Growth Analysis for Various Process Scenarios .................................. 92

1
Methodology
The objective of this study was to select a biochemical conversion process from published literature to produce a second generation liquid biofuel from lignocellulosic biomass. The studies involved several steps defining the objective and scope of the project. They started with a review of various biochemical processes published in journals and reports and then applied two steps of screening to make the final selection. The cost analysis is performed assuming nth plant technology (mature technology) and then subjected to cost growth analysis for a pioneer plant. The following steps explain the basic methodology for performing the techno-economic analysis:
• Search literature for technologies under consideration
• Perform down selection with criteria to narrow to a few scenarios
• Design process models using AspenPlus process simulation using available experimental data
• Size and cost equipment using traditional methods such as literature references and vendor quotations
• Determine project investments and perform discounted cash flow analysis
• Adjust sensitivity parameters and document results
• Perform pioneer plant cost growth and performance analysis.
Summary of the Down-Selection Process Thirty-five biochemical fuel production technologies were initially selected for consideration (Table I-1). Each technology option was evaluated based on economic and technical feasibility, environmental performance, and uncertainty criteria to determine, at a high level, the technologies with the greatest overall promise in the 5-8 year timeframe. For a plant to be operating at commercial levels in this timeframe, the plant would likely need to be designed based on current data because of the time needed for design, construction, and startup of a plant. A matrix of techno-economic studies was developed for “down selecting” the most promising fuels and processes. Major process and economic parameters such as feedstock, capital expenditure, operating cost, yield, capacity factor, complexity of the process, level of technology development, and internal rate of return were included in the matrix. These parameters cover the major process aspects that reflect the overall economics of the processes. This evaluation was conducted using past models, if they existed. It was also conducted through publicly available literature in 2007. If quantitative numbers were available for the matrix, they were used. But since the technologies are not mature, many matrix entries were qualitative.
Both butanol and ethanol processes were initially considered. Butanol has properties such as higher energy density and immiscibility with water that may make it a better transportation fuel. However, butanol production processes are currently at the lab scale or very early pilot stage of development, and published data on butanol-producing organisms indicate low yields relative to ethanol production. Therefore, only ethanol technologies were adopted for analysis.
2
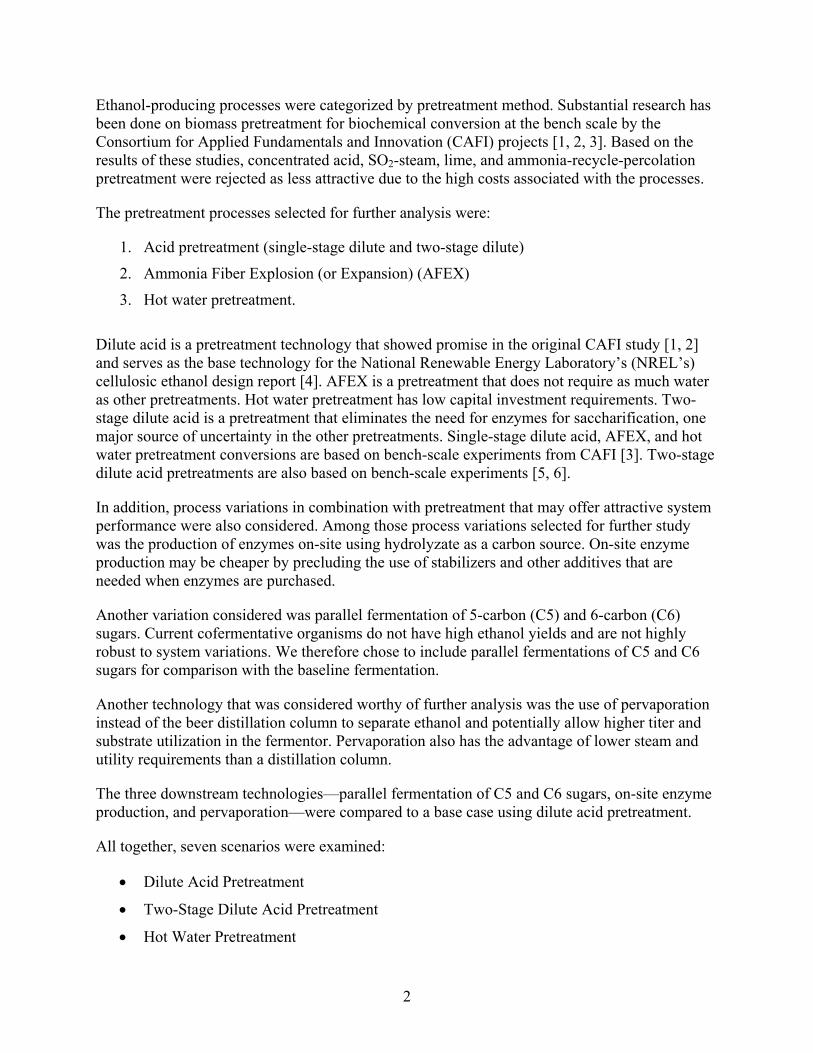
Ethanol-producing processes were categorized by pretreatment method. Substantial research has been done on biomass pretreatment for biochemical conversion at the bench scale by the Consortium for Applied Fundamentals and Innovation (CAFI) projects [1, 2, 3]. Based on the results of these studies, concentrated acid, SO2-steam, lime, and ammonia-recycle-percolation pretreatment were rejected as less attractive due to the high costs associated with the processes.
The pretreatment processes selected for further analysis were:
1. Acid pretreatment (single-stage dilute and two-stage dilute)
2. Ammonia Fiber Explosion (or Expansion) (AFEX)
3. Hot water pretreatment.
Dilute acid is a pretreatment technology that showed promise in the original CAFI study [1, 2] and serves as the base technology for the National Renewable Energy Laboratory’s (NREL’s) cellulosic ethanol design report [4]. AFEX is a pretreatment that does not require as much water as other pretreatments. Hot water pretreatment has low capital investment requirements. Two-stage dilute acid is a pretreatment that eliminates the need for enzymes for saccharification, one major source of uncertainty in the other pretreatments. Single-stage dilute acid, AFEX, and hot water pretreatment conversions are based on bench-scale experiments from CAFI [3]. Two-stage dilute acid pretreatments are also based on bench-scale experiments [5, 6].
In addition, process variations in combination with pretreatment that may offer attractive system performance were also considered. Among those process variations selected for further study was the production of enzymes on-site using hydrolyzate as a carbon source. On-site enzyme production may be cheaper by precluding the use of stabilizers and other additives that are needed when enzymes are purchased.
Another variation considered was parallel fermentation of 5-carbon (C5) and 6-carbon (C6) sugars. Current cofermentative organisms do not have high ethanol yields and are not highly robust to system variations. We therefore chose to include parallel fermentations of C5 and C6 sugars for comparison with the baseline fermentation.
Another technology that was considered worthy of further analysis was the use of pervaporation instead of the beer distillation column to separate ethanol and potentially allow higher titer and substrate utilization in the fermentor. Pervaporation also has the advantage of lower steam and utility requirements than a distillation column.
The three downstream technologies—parallel fermentation of C5 and C6 sugars, on-site enzyme production, and pervaporation—were compared to a base case using dilute acid pretreatment.
All together, seven scenarios were examined:
• Dilute Acid Pretreatment
• Two-Stage Dilute Acid Pretreatment
• Hot Water Pretreatment
3
• AFEX Pretreatment
• On-site Enzyme Production with Dilute Acid Pretreatment
• Ethanol Separation using Pervaporation with Dilute Acid Pretreatment
• Separate C5 and C6 Fermentation with Dilute Acid Pretreatment.
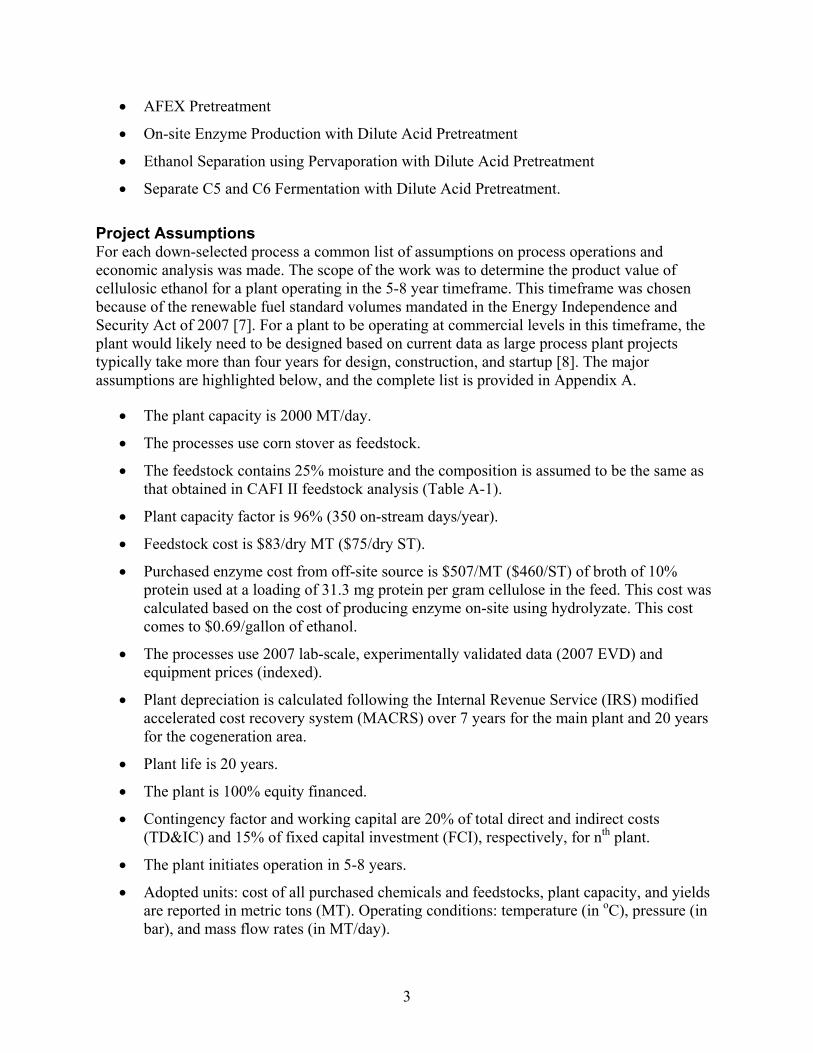
Project Assumptions For each down-selected process a common list of assumptions on process operations and economic analysis was made. The scope of the work was to determine the product value of cellulosic ethanol for a plant operating in the 5-8 year timeframe. This timeframe was chosen because of the renewable fuel standard volumes mandated in the Energy Independence and Security Act of 2007 [7]. For a plant to be operating at commercial levels in this timeframe, the plant would likely need to be designed based on current data as large process plant projects typically take more than four years for design, construction, and startup [8]. The major assumptions are highlighted below, and the complete list is provided in Appendix A.
• The plant capacity is 2000 MT/day.
• The processes use corn stover as feedstock.
• The feedstock contains 25% moisture and the composition is assumed to be the same as that obtained in CAFI II feedstock analysis (Table A-1).
• Plant capacity factor is 96% (350 on-stream days/year).
• Feedstock cost is $83/dry MT ($75/dry ST).
• Purchased enzyme cost from off-site source is $507/MT ($460/ST) of broth of 10% protein used at a loading of 31.3 mg protein per gram cellulose in the feed. This cost was calculated based on the cost of producing enzyme on-site using hydrolyzate. This cost comes to $0.69/gallon of ethanol.
• The processes use 2007 lab-scale, experimentally validated data (2007 EVD) and equipment prices (indexed).
• Plant depreciation is calculated following the Internal Revenue Service (IRS) modified accelerated cost recovery system (MACRS) over 7 years for the main plant and 20 years for the cogeneration area.
• Plant life is 20 years.
• The plant is 100% equity financed.
• Contingency factor and working capital are 20% of total direct and indirect costs (TD&IC) and 15% of fixed capital investment (FCI), respectively, for nth plant.
• The plant initiates operation in 5-8 years.
• Adopted units: cost of all purchased chemicals and feedstocks, plant capacity, and yields are reported in metric tons (MT). Operating conditions: temperature (in oC), pressure (in bar), and mass flow rates (in MT/day).

4
Process Description and Flow Diagram The different scenarios detailed above were generated by modifying the NREL 2002 production process [4]. Appendix G contains a general description of the process steps that have not been altered from previous NREL studies. Appendix F contains details of operating conditions for the major process steps. The basic cellulosic ethanol production process, modified from NREL’s 2002 design report [4], comprises nine sections as shown in Figure 1 and listed below.
• Feed Handling (Area 100)
• Pretreatment and Detoxification (Area 200)
• Enzymatic Hydrolysis and Fermentation (Area 300)
• On-site Enzyme Production (Area 400)
• Product Recovery (Area 500)
• Wastewater Pretreatment (Area 600)
• Storage (Area 700)
• Burner/Boiler Turbo-Generator (Area 800)
• Utilities (Area 900) sections.
The AspenPlus Process Simulator is used in process modeling. Current technological data are used in the simulation and described as the 2007 experimentally validated data (2007 EVD). In the pretreatment area, data for AFEX and hot water 2007 EVD are obtained from CAFI II research [1, 2, 3]. Two-stage dilute acid data are based on available literature [5, 6]. Dilute acid pretreatment data are taken from both CAFI II and NREL research. For all other areas, 2007 EVD conversion data are obtained from NREL research [9]. The overall process block diagram is shown in Figure 1. Operating conditions of the major unit operations of each area and mass flow rates are included in Figure 1.

5
AREA 100
FEED HANDLING(T = 20 oC; P = 1.01 bar)
AREA 200
PRETREATMENT & CONDITIONING
(T = 190 oC; P = 13.17 bar)
AREA 600
WASTEWATER TREATMENT
(T=21.1 oC, P=1.01 bar)
AREA 700
STORAGE
AREA 800
BURNER/BOILER TURBOGENERATOR(T=510 oC, P=97.5 bar)
AREA 900
UTILITIES
FEEDSTOCK
WASHED & SHREDDED STOVER (3085 MT/d)
ACID(199 MT/d)
LIME(147 MT/day)
GYPSUM(332MT/d)
HYDRO-LYZATE
NUTRIENTS(109 MT/d)
ENZYME (209 MT/d)
BR
OTH
VE
NT
VENT (445 MT/d)
EtO
H P
RO
DU
CT
STILL SOLIDS (1137 MT/day)
EVAP SYRUP (1882 MT/day)
EVAPORATOR CONDENSATE (435 MT/d)
STEAM(1205 MT/d)
WASTE WATER (1085 MT/d)
VAPOR TO ATM. (485 MT/d)
STEAM (5026 MT/d)ELECTRICITY
BO
ILE
R B
LOW
DO
WN
ANAEROBIC CH4 (7 MT/day)
2667 MT/d(25% Moisture)
WASH WATER(755 MT/d)
NUTRIENTS (1MT/d)
WATER
To CLARIFIER
AIR OUT(118 MT/d)AIR IN
(112 MT/d)
(9987 MT/d)AREA 300
SACCHARIFICATION &CO-FERMENTATION(T = 32 oC, P = 1.01 bar)
SC
RU
BB
ER
BO
TTO
M(4
36 M
T/d)
AREA 500
DISTILLATION DEHYDRATION
SCRUBBER EVAPORATOR
(T=100 oC, P=1.89 bar)
(103
01 M
T/d)
(440
MT/
d)
(2361 MT/d)
RE
CY
CLE
WA
TER
(439
3 M
T/d)
RE
CY
CLE
CO
ND
(238
1 M
T/d)
RECYCLE WATER(1530 MT/d)
(457
MT/
day)
(155
MT/
d)
DIGESTOR SOLIDS (3 MT/day)
TRE
ATE
D
WA
STE
WA
TER
(203
7 M
T/d)
GAS TO STACK(10544 MT/d)
COMBUSTION AIR
(7794 MT/d)
BOILER FEED WATER
(5181 MT/d)
ASH(297 MT/d)
COOLING TOWER BLOWDOWN
(379 MT/d)
AIR (477 MT/d)
RECYCLE WATER(2037 MT/d)
VAPOR TO ATMOSPHERE (37937 MT/d)
MAKEUP WATER(50854 MT/d)
WATER RETURN(7754 MT/d)
TO PROCESS
AIR OUT (148 MT/d)
AIR IN (142 MT/d)
Figure 1. Overall process block diagram of a typical cellulosic ethanol process plant (based on NREL’s 2002 design report and modified to 2007 EVD)
Process Variations This section includes a description of each of the process scenarios. Results from the seven process variations are shown in Table 2 of the Results and Discussion section.
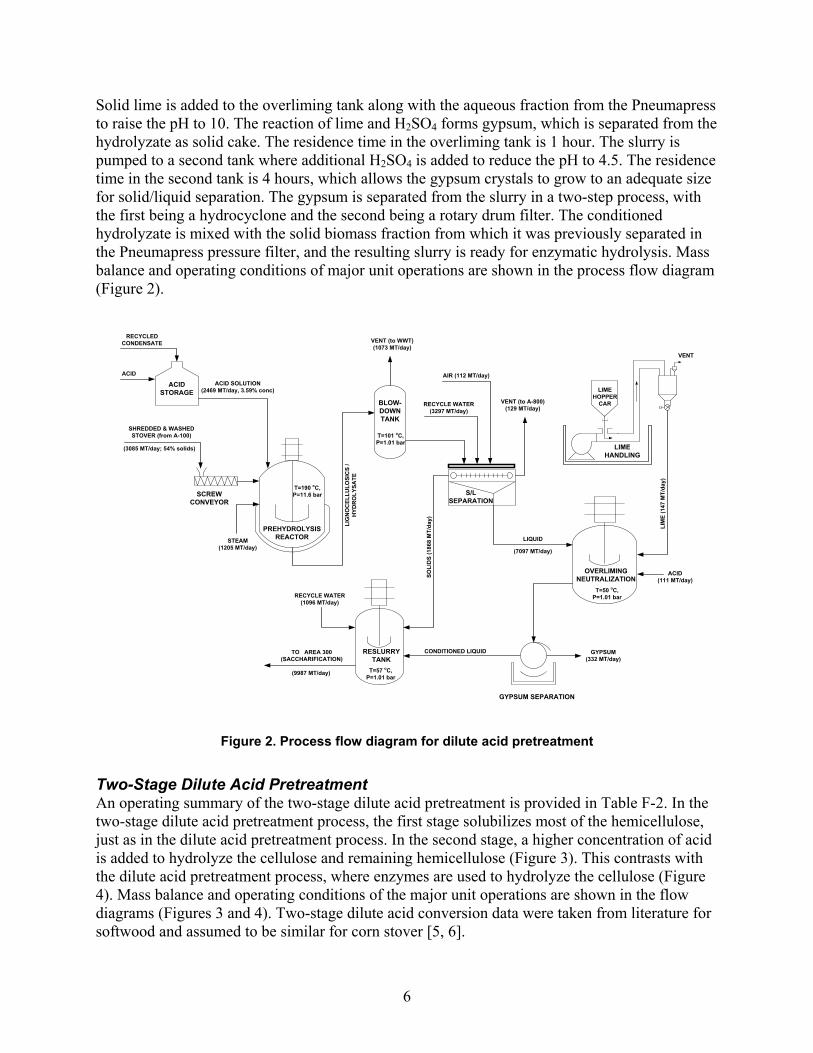
Dilute Acid Pretreatment Table F-1 includes a summary of the dilute acid operating conditions and model parameters. The biomass from Area 100 is fed by a screw feeder to the presteamer, where low pressure steam (163°C, 4.46 bar) is added to maintain a temperature of around 100°C. The presteamer allows a portion of the pretreatment heat requirement to be met with low pressure steam. The biomass then enters the pretreatment reactor, where high pressure steam (268°C, 13.17 bar) is added as shown in Figure 2. Sulfuric acid, diluted with process water, is added to the reactor at a rate necessary to achieve 1.9 wt% of the liquid phase in the reactor. The reactor temperature, pressure, and residence time are maintained at 190°C, 11.6 bar, and 2 minutes, respectively. The biomass slurry is then flashed to 1.0 bar in the blow-down tank. The solid fraction is separated from the slurry in a Pneumapress pressure filter. In order to reduce toxicity to the fermentation organisms downstream, a liming step is added to neutralize excess H2SO4 in the hydrolyzate.
6
Solid lime is added to the overliming tank along with the aqueous fraction from the Pneumapress to raise the pH to 10. The reaction of lime and H2SO4 forms gypsum, which is separated from the hydrolyzate as solid cake. The residence time in the overliming tank is 1 hour. The slurry is pumped to a second tank where additional H2SO4 is added to reduce the pH to 4.5. The residence time in the second tank is 4 hours, which allows the gypsum crystals to grow to an adequate size for solid/liquid separation. The gypsum is separated from the slurry in a two-step process, with the first being a hydrocyclone and the second being a rotary drum filter. The conditioned hydrolyzate is mixed with the solid biomass fraction from which it was previously separated in the Pneumapress pressure filter, and the resulting slurry is ready for enzymatic hydrolysis. Mass balance and operating conditions of major unit operations are shown in the process flow diagram (Figure 2).
ACID
RECYCLED CONDENSATE
ACIDSTORAGE
STEAM(1205 MT/day)
VENT (to WWT)(1073 MT/day)
SOLI
DS
(186
8 M
T/da
y)
LIQUID
ACID(111 MT/day)
GYPSUM(332 MT/day)
RECYCLE WATER(1096 MT/day)
TO AREA 300 (SACCHARIFICATION)
RECYCLE WATER(3297 MT/day)
CONDITIONED LIQUID
PREHYDROLYSIS REACTOR
BLOW-DOWNTANK
S/L SEPARATION
OVERLIMINGNEUTRALIZATION
RESLURRY TANK
GYPSUM SEPARATION
LIM
E (1
47 M
T/da
y)
ACID SOLUTION(2469 MT/day, 3.59% conc)
LIG
NO
CEL
LULO
SIC
S /
HYD
RO
LYSA
TE
SCREW CONVEYOR
(3085 MT/day; 54% solids)
AIR (112 MT/day)
T=190 oC, P=11.6 bar
T=101 oC, P=1.01 bar
VENT (to A-800)(129 MT/day)
T=50 oC, P=1.01 bar
T=57 oC, P=1.01 bar
(7097 MT/day)
LIME HANDLING
LIME HOPPER
CAR
VENT
SHREDDED & WASHED STOVER (from A-100)
(9987 MT/day)
Figure 2. Process flow diagram for dilute acid pretreatment
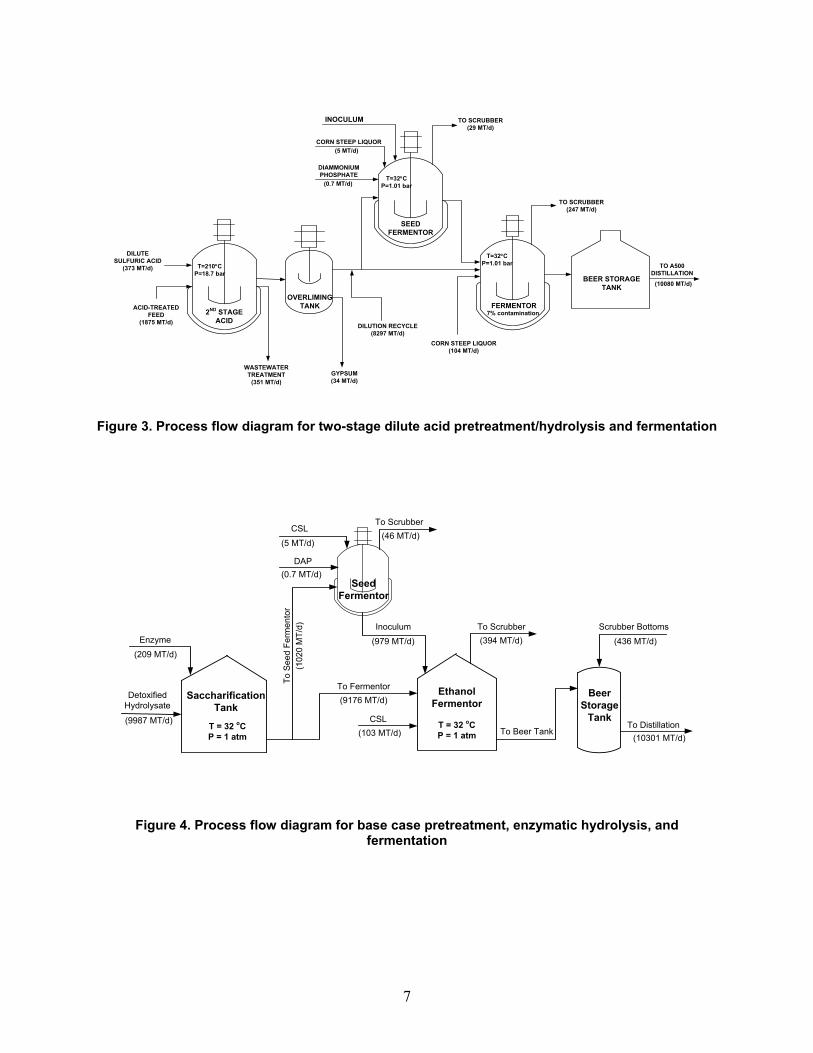
Two-Stage Dilute Acid Pretreatment An operating summary of the two-stage dilute acid pretreatment is provided in Table F-2. In the two-stage dilute acid pretreatment process, the first stage solubilizes most of the hemicellulose, just as in the dilute acid pretreatment process. In the second stage, a higher concentration of acid is added to hydrolyze the cellulose and remaining hemicellulose (Figure 3). This contrasts with the dilute acid pretreatment process, where enzymes are used to hydrolyze the cellulose (Figure 4). Mass balance and operating conditions of the major unit operations are shown in the flow diagrams (Figures 3 and 4). Two-stage dilute acid conversion data were taken from literature for softwood and assumed to be similar for corn stover [5, 6].
7
2ND STAGEACID
DILUTE SULFURIC ACID
(373 MT/d)
ACID-TREATED FEED
(1875 MT/d)
FERMENTOR
CORN STEEP LIQUOR(104 MT/d)
BEER STORAGE TANK
TO A500DISTILLATION
SEEDFERMENTOR
TO SCRUBBER(247 MT/d)
OVERLIMINGTANK
GYPSUM(34 MT/d)
T=210°CP=18.7 bar
T=32°CP=1.01 bar
7% contamination
(0.7 MT/d)
T=32°CP=1.01 bar
(10080 MT/d)
WASTEWATER TREATMENT
(351 MT/d)
TO SCRUBBER(29 MT/d)
DILUTION RECYCLE(8297 MT/d)
INOCULUM
(5 MT/d)CORN STEEP LIQUOR
DIAMMONIUM PHOSPHATE
Figure 3. Process flow diagram for two-stage dilute acid pretreatment/hydrolysis and fermentation
Detoxified Hydrolysate
Enzyme
(209 MT/d)
(9987 MT/d)
Saccharification Tank
T = 32 oCP = 1 atm
Ethanol Fermentor
T = 32 oCP = 1 atm
CSL(103 MT/d)
To Fermentor(9176 MT/d)
To S
eed
Ferm
ento
r(1
020
MT/
d)
DAP(0.7 MT/d)
CSL
(5 MT/d)
(979 MT/d)
Inoculum
To Scrubber(46 MT/d)
To Scrubber(394 MT/d)
To Beer Tank
Beer Storage
Tank
Scrubber Bottoms
(436 MT/d)
To Distillation(10301 MT/d)
Seed Fermentor
Figure 4. Process flow diagram for base case pretreatment, enzymatic hydrolysis, and fermentation

8
Hot Water Pretreatment Table F-3 contains a summary of model parameters for hot water pretreatment. The chopped and washed biomass from Area 100 is mixed with recycled hot water from Area 500. The slurry is fed to a plug flow pretreatment reactor. The reactor pressure is maintained at 12.7 bar and the temperature is held constant at 190°C. The residence time in the pretreatment reactor is 5 minutes. The slurry is then cooled to 65°C and flashed to 1.0 bar in the flash tank. Ammonia is added to the reactor to neutralize acetic acid formed during the pretreatment process. The xylose and cellulose pretreatment yields are shown in Table F-3. Mass flow rates and operating conditions of reactor and major units are shown in the process flow diagram (Figure 5).
CONDENSATE
VENT
TO AREA 300 (SACCHARIFICATION)
BLOW-DOWNTANK
T=65 oCP=12.4 bar
STEAM
LIG
NO
CEL
LULO
SIC
S /
HYD
RO
LYSA
TE
SCREW CONVEYOR
PREHYDROLYSIS REACTOR(T = oC, P = 12.43 bar)
AMMONIAAMMONIA
TANK
CONDENSATE
AMMONIA
(9973 MT/day)
(13083 MT/d)
T=20 oC, P=17.23 bar
AMMONIA NEUTRALIZER
T=80 oC, P=1.01 bar
SHREDDED & WASHED STOVER (from A-100)
(3078 MT/day; 54.4% solids)
(130
51 M
T/d)
(32 MT/day)
(0 MT/d)
Figure 5. Hot water pretreatment process flow diagram
AFEX Pretreatment A summary of operating parameters for AFEX pretreatment can be found in Table F-4. In the AFEX pretreatment process, the biomass is treated with liquid anhydrous ammonia under high pressure (17.2 bar) and 60°C for about 5 minutes [10]. The pressure is rapidly released, causing the fibers to explode and increasing the access of enzymes to cellulose. Most of the ammonia is recovered from the blow-down tank. Residual ammonia is recovered from the solids by a flash followed by fractionation from other volatiles. Recovered ammonia vapor is then compressed, condensed, and recycled back into the AFEX reactor [10]. The pretreated biomass is slurried into a holding tank to be sent to Area 300 for enzymatic hydrolysis (Figure 6).

9
Liquid Ammonia
Shredded Stover
AMMONIA STORAGE
Steam
Recycle Water
To Area 300 (Saccharification)
Biomass Slurry
BLOW-DOWNTANK
Liquid Ammonia
Lignocellulosics/Hydrolysate
SCREW CONVEYOR
AMMONIA RECYCLE
COMPRESSOR
AFEX REACTOR
Compressed Ammonia
FLASHDRUM
AMMONIARECOVERY
Am
mon
ia V
apor
Ammonia Vent
3078.55 MT/d(53.5% Solids)
1610.78 MT/day
713.67 MT/day
897.
1 M
T/da
y
(10461.26 MT/day)
4138.17 MT/day
40.2 MT/day
Lignocellulosics/Hydrolysate
1736
.91
MT/
day
4851.84 MT/day
(2401.25 MT/day)
1.5 MT/day
121.79 MT/day
(8061 MT/day)
839.80 MT/day
Condensate3201.84 MT/d
To Recycle (Acid/Other
Volatiles/Water)HOLDING TANK
Figure 6. AFEX process flow diagram
Separate C5 and C6 Fermentation Separate solid and liquid processing (C6 and C5 sugars respectively) takes advantage of enhanced yields where xylose is fermented separately using Zymomonas mobilis and glucose is fermented separately with yeast (Saccharomyces cerevisiae or Saccharomyces pastorianus). This avoids the issue of lower xylose to ethanol yields seen in the current cofermenting organisms. One disadvantage of separate processing is that more water is needed to dilute the solids stream because the best yields are achieved at low solids loading. The additional water increases ethanol recovery costs. The process shown in Figure 7 attempts to mitigate the water issue by using the product stream from the liquor (xylose) fermentation to dilute the stream prior to saccharification. Table F-5 contains a summary of operating parameters for the separate C5 and C6 fermentation scenario, based on work by Dutta et al. [11].

10
ACID
RECYCLED CONDENSATE
ACIDSTORAGE
STEAM(1217 MT/d)
VENT (to WWT)(1068 MT/d)
LIQUID
RECYCLE WATER(3289 MT/d)
PREHYDROLYSIS REACTOR
BLOW-DOWNTANK
NH4OH (61.9%)
ACID SOLUTION(2443 MT/d, 3.63% conc)
LIG
NO
CEL
LULO
SIC
S /
HYD
RO
LYSA
TE
SCREW CONVEYOR
AIR (112 MT/d)
T=190 oC, P=11.6 bar
T=101 oC, P=1.01 bar
VENT (to A-800)(118 MT/day)
(7083 MT/d)
SHREDDED & WASHED STOVER (from A-100)
(673
9 M
T/d)
(5671 MT/d)To WWT(11 MT/d)
SEPARATOR
(319 MT/d)
H2SO4 (100%)(203 MT/d)
(740
2 M
T/d)
Seed Fermentor
C-5 Sugar Fermentor
T = 32 oCP = 1.01 bar
RECYCLE WATER
(1627 MT/d)
To SCRUBBER (17 MT/d)
SEPARATOR
(93 MT/d)CSL
Sacchari-fication/
FermentorT = 32 oC
P = 1.01 bar
(209 MT/d)WATER
(3079 MT/d; 54.4% solids)
YEAST
CSL
C-6 Sugar Fermentor
T = 32 oCP = 1.01 bar
SEPARATOR
(16 MT/d)
(114 MT/d)
(113
79 M
T/d)
To SCRUBBER(304 MT/d)
To BEER STORAGE TANK
(11075 MT/d)
T=32 oCP=1.01bar
SEPA-RATOR
(912
MT/
d)
(923 MT/d)
(929 MT/d)
DAP(0.7 MT/d)
CSL(5 MT/d)
(8310 MT/d)(9
315
MT/
d)
To SCRUBBER (134 MT/d)
(918
0 M
T/d)
(1860 MT/d)
(11249 MT/d)
REACIDI-FICATION
TANK
T=63 oC, P=1.01 bar
NEUTRA-LIZATION
TANK
T=30 oC, P=1.01 bar
S/L SEPARATION
Figure 7. Separate C5 and C6 fermentation configuration
Ethanol Separation Using Pervaporation Pervaporation refers to separation using a membrane with liquid feed on one side and a low-pressure, gaseous permeate output on the other side. Components in the liquid feed preferentially permeate through the membrane and then evaporate into the gaseous phase. Because pervaporation does not involve a large heat input, the process could save on costs associated with the heat and steam needed for the reboiler of a conventional distillation column. A summary of operating parameters for the pervaporation separation scenario is located in Table F-6.
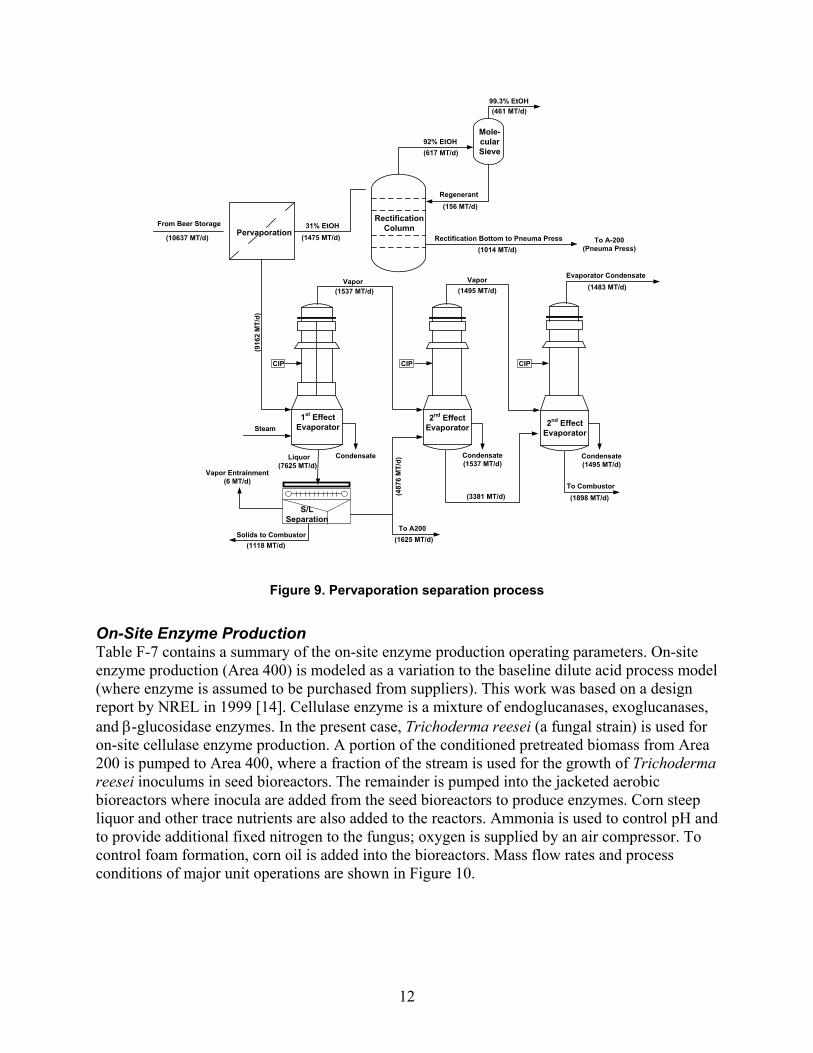
In contrast to the base case distillation configuration (Figure 8), the pervaporation variation modifies the distillation section of the dilute acid model by inserting a pervaporation system in place of the beer column (Figure 9). The pervaporation system output is calculated from a separation factor and a total material flux needed to achieve the same separation as in the beer column [12]. The separation factors and material fluxes are based on literature [12]. In the base case dilute acid model, the beer column also serves to separate carbon dioxide from the ethanol stream. In the pervaporation model, a flash tank is added to separate out CO2 at 110°C and a heat exchanger cools the stream to 41°C. The separation of CO2 is assumed to be easier than what is modeled here, so neither the capital nor utility costs of the flash tank and heat exchanger are included in the economic analysis. The membrane system costs $200/m2 in 1999 dollars, with a replacement needed every five years at a cost of $100/m2 [13].

11
(10301 MT/d)
P-378From Beer Storage
Beer Storage Tank
To Scrubber(14 MT/d)
Rectification Column
99.5% EtOH(457 MT/d)
93% EtOH
(612 MT/d)
Steam
Vapor
1st Effect Evaporator 2nd Effect
Evaporator2nd Effect
Evaporator
S/L Separation
Solids to Combustor
VaporEvaporator Condensate
(1426 MT/d)
To Combustor(1882 MT/d)
(1335 MT/d) (878 MT/d)
(155 MT/d)Regenerant
Mole-cular Sieve
Rectification Bottom to Pneuma Press
(7467 MT/d)
(3308 MT/d)
Liquor
CIP CIPCIP
(1137 MT/d)
To A-200 (Pneuma Press)
(474
3 M
T/d)
Vapor Entrainment(6 MT/d)
(1581 MT/d)
Condensate(1484 MT/d)
Condensate
To A200
(895
1 M
T/d)
(1484 MT/d) (1435 MT/d)
Condensate(1435 MT/d)
Figure 8. Base case distillation configuration
12
(10637 MT/d)
P-358
From Beer StoragePervaporation
Rectification Column
99.3% EtOH(461 MT/d)
92% EtOH(617 MT/d)
Steam
Vapor
1st Effect Evaporator
2nd Effect Evaporator 2nd Effect
Evaporator
S/L Separation
Solids to Combustor
Vapor Evaporator Condensate(1483 MT/d)
To Combustor(1898 MT/d)
(1475 MT/d)(1014 MT/d)
(156 MT/d)Regenerant
Mole-cular Sieve
Rectification Bottom to Pneuma Press
(7625 MT/d)
(3381 MT/d)(487
6 M
T/d)Liquor
CIP CIPCIP
31% EtOH
To A-200 (Pneuma Press)
(1118 MT/d)
Vapor Entrainment (6 MT/d)
Condensate Condensate(1537 MT/d)
Condensate(1495 MT/d)
(1537 MT/d)
(916
2 M
T/d)
To A200(1625 MT/d)
(1495 MT/d)
Figure 9. Pervaporation separation process
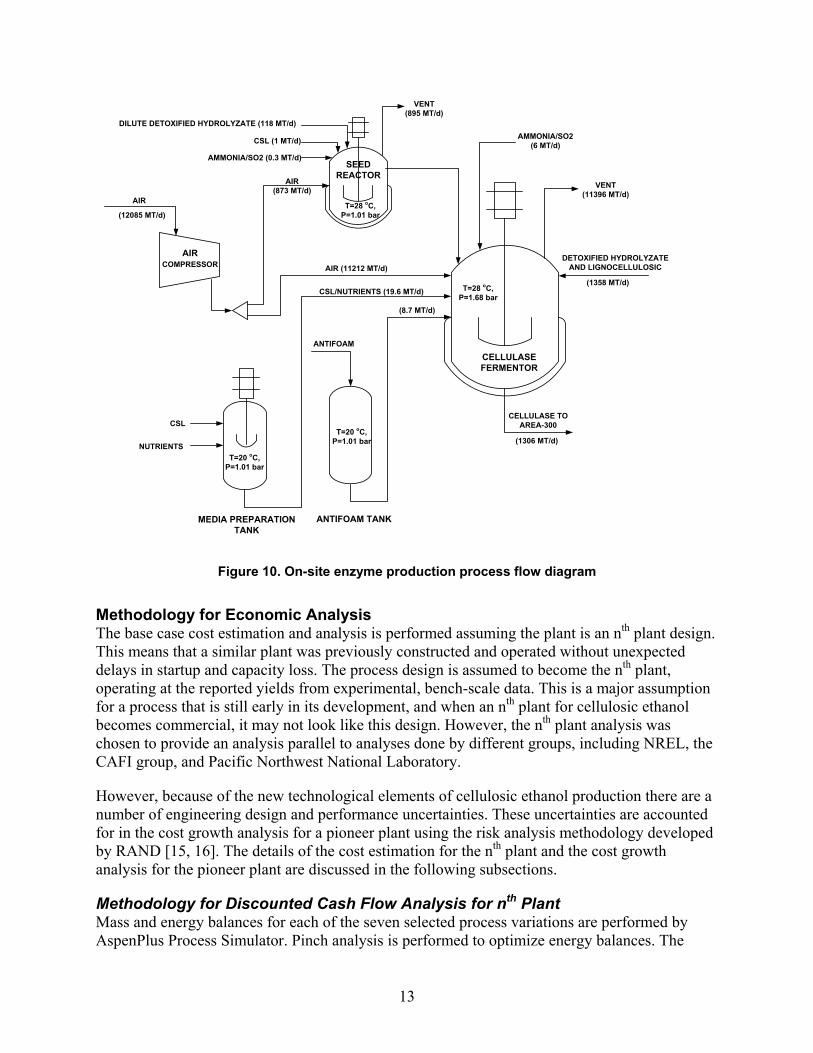
On-Site Enzyme Production Table F-7 contains a summary of the on-site enzyme production operating parameters. On-site enzyme production (Area 400) is modeled as a variation to the baseline dilute acid process model (where enzyme is assumed to be purchased from suppliers). This work was based on a design report by NREL in 1999 [14]. Cellulase enzyme is a mixture of endoglucanases, exoglucanases, and β-glucosidase enzymes. In the present case, Trichoderma reesei (a fungal strain) is used for on-site cellulase enzyme production. A portion of the conditioned pretreated biomass from Area 200 is pumped to Area 400, where a fraction of the stream is used for the growth of Trichoderma reesei inoculums in seed bioreactors. The remainder is pumped into the jacketed aerobic bioreactors where inocula are added from the seed bioreactors to produce enzymes. Corn steep liquor and other trace nutrients are also added to the reactors. Ammonia is used to control pH and to provide additional fixed nitrogen to the fungus; oxygen is supplied by an air compressor. To control foam formation, corn oil is added into the bioreactors. Mass flow rates and process conditions of major unit operations are shown in Figure 10.
13
(1306 MT/d)
CSL (1 MT/d)
SEED REACTOR
DILUTE DETOXIFIED HYDROLYZATE (118 MT/d)
CSL
NUTRIENTS
ANTIFOAM
ANTIFOAM TANKMEDIA PREPARATION TANK
CELLULASE FERMENTOR
AMMONIA/SO2(6 MT/d)
VENT(895 MT/d)
DETOXIFIED HYDROLYZATE AND LIGNOCELLULOSIC
VENT(11396 MT/d)
CSL/NUTRIENTS (19.6 MT/d)
AIR(873 MT/d)
AIR (11212 MT/d)
T=28 oC, P=1.01 bar
(8.7 MT/d)
T=28 oC, P=1.68 bar
T=20 oC, P=1.01 bar
T=20 oC, P=1.01 bar
AIRCOMPRESSOR
(1358 MT/d)
CELLULASE TO AREA-300
AIR
(12085 MT/d)
AMMONIA/SO2 (0.3 MT/d)
Figure 10. On-site enzyme production process flow diagram
Methodology for Economic Analysis The base case cost estimation and analysis is performed assuming the plant is an nth plant design. This means that a similar plant was previously constructed and operated without unexpected delays in startup and capacity loss. The process design is assumed to become the nth plant, operating at the reported yields from experimental, bench-scale data. This is a major assumption for a process that is still early in its development, and when an nth plant for cellulosic ethanol becomes commercial, it may not look like this design. However, the nth plant analysis was chosen to provide an analysis parallel to analyses done by different groups, including NREL, the CAFI group, and Pacific Northwest National Laboratory.
However, because of the new technological elements of cellulosic ethanol production there are a number of engineering design and performance uncertainties. These uncertainties are accounted for in the cost growth analysis for a pioneer plant using the risk analysis methodology developed by RAND [15, 16]. The details of the cost estimation for the nth plant and the cost growth analysis for the pioneer plant are discussed in the following subsections.
Methodology for Discounted Cash Flow Analysis for nth Plant Mass and energy balances for each of the seven selected process variations are performed by AspenPlus Process Simulator. Pinch analysis is performed to optimize energy balances. The

14
stream flow rates, from AspenPlus simulations, are used to size unit operations. The costs for most of the equipment are obtained from previous vendor quotes obtained by NREL. Individual equipment is scaled and the scaled cost is estimated following exponential correlations as described in Appendix A. The scaled cost is then indexed to a year 2007 dollar value using the Chemical Engineering Plant Cost Index [17]. Separate installation factors are used for each of the unit operations to obtain individual installed equipment costs. The installation factors are obtained from the vendors who provided equipment quotes. The cost analysis is performed following NREL’s approach [4] and that found in Peters et al. [18], with modified terminologies. Total installed cost (TIC) is defined as the sum of total installed equipment cost, warehouse, and site development costs.
Engineering and supervision costs, construction expenses, and legal and contractor’s fees are assumed to be 32%, 34%, and 23% of purchased equipment cost, respectively. Total direct and indirect costs (TD&IC) is the sum of total installed cost and indirect costs. Contingency is assumed to be 20% of TD&IC, and working capital is 15% of fixed capital investment (FCI). FCI is the sum of TD&IC and contingency, and the total capital investment is the sum of FCI and working capital.
The manufacturing costs include raw materials costs (such as corn stover), variable costs (such as process chemicals, enzyme, nutrients) and fixed operating costs (employee salaries, overhead, insurance, and maintenance). The feedstock cost is assumed to be $83/dry MT ($75/dry ST) (Appendix A). The chemical and nutrients costs are obtained from NREL’s previous quotes from suppliers and are indexed to 2007 dollar values following the Inorganic Chemical Index of the SRI International Economics Handbook, Economic Environment of the Chemical Industry [19]. NREL estimated the required number of employees and their salaries in their 2002 design report [4]. In the present study, the same number of employees is required for the same plant capacity, and the salaries are indexed to 2007 dollar values following the labor index from the Bureau of Labor Statistics [20].
In the present analysis, the process and steam generation plants are assumed to depreciate in 7 and 20 years, respectively, following IRS MACRS, and the plant life is 20 years. The project is assumed to be 100% equity financed and internal rate of return is 10%. For the present cost analysis, the capital investment is spread over 3 years at a rate of 8%, 60%, and 32% in the first, second, and third years, respectively. The product value (PV) of ethanol is calculated by iterating to reach a net present value of $0 with a 10% internal rate of return.
Pioneer Plant Analysis The pioneer plant analysis is performed using a method developed by Merrow et al. of RAND Corporation [15]. This methodology considers two sources of production cost growth in pioneer plants: less than expected plant performance and low capital cost estimation. These sources are regressed with two multi-factor ordinary least squares correlations to estimate the unexpected reduced plant performance (Equation 1) and capital cost growth (Equation 2) associated with pioneer plants.
Equation 1 estimates pioneer plant performance as a percentage of design capacity in the second 6 months after startup.

15
Plant Performance = 85.77 – 9.69×NEWSTEPS + 0.33×BALEQS – 4.12×WASTE – 17.91×SOLIDS (Eq. 1) Where,
NEWSTEPS ≡ The number of steps in the process that have not been proven commercially.
BALEQS ≡ The percentage of mass and energy balance equations used in plant design that are validated with commercial-scale data. The RAND report also mentions that some weight is given to rigorous theoretical models.
WASTE ≡ Potential problems that may be associated with waste handling. A 0-5 scale is used, with 0 meaning no waste handling issues and 5 meaning significant waste handling issues.
SOLIDS: The scale used is 0 or 1. If the process handles solids then the value is 1; otherwise it’s 0.
Equation 2 estimates the capital cost growth, defined as the ratio of estimated to actual costs.
Cost Growth = 1.12196 – 0.00297×PCTNEW – 0.02125×IMPURITIES – 0.01137×COMPLEXITY + 0.00111×INCLUSIVENESS – C1×PROJECT DEFINITION (Eq. 2) Where,
PCTNEW ≡ The installed cost of all commercially undemonstrated equipment as percentage of total installed equipment cost.
IMPURITIES: Represents the potential process issues that may arise due to impurity buildup from recycle streams or problems due to equipment corrosion. The value ranges from 0 to 5, with 0 being given to processes with no impurity buildup or corrosion issues.
COMPLEXITY ≡ The number of continuously linked process steps. INCLUSIVENESS ≡ The percentage of three factors: pre-startup personnel costs, pre-
startup inventory cost, and land purchase. For example, if two of these factors have been rigorously considered, the variable would be given a value of 67%.
C1: C1 is 0.06361 if the design is at pre-development/exploratory or research and development stage and 0.04011 if the design is in commercial or pre-commercial stage. For the present studies C1 is assumed to be 0.06361.
PROJECT DEFINITION: Includes commitment of funds to define the plant scope, basic plant layout, and process flow conditions. Most major equipment is defined and examination of site begins at this point. The amount of work involved here depends on how much information is already available from previous project experience. Often some critical level of engineering (heat and mass balances, equipment need, and so forth) and site-specific information (on-site and off-site unit configurations, soils and hydrology data, health and safety requirements, and environmental requirements) is completed here. A numerical value is assigned to define the level of engineering completed at the time of estimation, following the

16
level of completeness: (1) engineering completed, (2) moderate or extensive engineering, (3) limited engineering, and (4) screening design stage. Similarly, a value for site-specific information is assigned by the following: (1) definitive or completed work, (2) preliminary or limited work, (3) assumed or implicit analysis, and (4) not used in the cost estimation at all. The range of values given to project definition is 2 (for maximum definition) to 8 (for no definition).
Cost growth analysis for all seven process variations was performed. There was some subjectivity in choosing the parameters for the pioneer plant analysis, so a range of parameters was used to estimate pioneer plant costs for three scenarios: optimistic, most probable, and pessimistic. For the dilute acid pretreatment process the selected variable values of Equations 1-2 are shown in Table 1; the selection justification is discussed below. For all other process variations, the variable values are shown in Appendix J.
Table 1. Plant Performance and Cost Growth Variables for Dilute Acid Pretreatment Processes
Plant Performance (Equation 1) Cost Growth (Equation 2)
Variables Values
Variables Values
Opti-mistic
Most Probable
Pessi-mistic
Opti-mistic
Most Probable
Pessi-mistic
NEWSTEPSa 6 6 6 PCTNEW 61.76 61.76 61.76 BALEQS 50 40 30 IMPURITIES 0 3 5 WASTE 1 2 3 COMPLEXITYb 6 6 6
SOLIDS 1 1 1 INCLUSIVE-NESS 33 0 0
PROJECT DEFINITION 6 6 7
Plant Performance (%) 22.10 14.68 7.26 Cost Growth 0.53 0.42 0.32
a New steps/units: Feedstock Handling, Pretreatment, Saccharification, Cofermentation, Beer Column, and Combustor. b Continuously linked steps: Feedstock Handling, Pretreatment, Saccharification, Cofermentation, Distillation, and Steam/Power Generation. Justification of Correlation Variable Value Selection for Plant Performance (Equation 1) For all three scenarios, the operations considered new steps/units are feedstock handling, pretreatment, saccharification, cofermentation, beer column, and the fluidized bed combustor (for converting lignin to heat and power), resulting in a value of 6 for NEWSTEPS.
Some of the steps and units are being used commercially, so the BALEQS variable is assigned a value of 50, 40, and 30 for optimistic, most probable, and pessimistic scenarios, respectively.
The wastewater contains a small amount of furfural that may not be degraded by the anaerobic or aerobic treatments used in the model, meaning that an additional chemical treatment may be necessary. No additional complications with waste are foreseen. The WASTE variable was assigned a value of 2 for the most probable case. Values of 1 and 3 were assigned for the optimistic and pessimistic cases, respectively.

17
These variable values are used in Equation 1 to calculate the percentage of Plant Performance for the three cases (Table 1).
Justification of Correlation Variable Value Selection for Cost Growth (Equation 2) The feedstock handling area, pretreatment area, saccharification, cofermentation, beer column, and fluidized bed combustor are selected as new technologies/units to calculate the parameter PCTNEW for all three of the cases.
Some of the degradation products inhibit the saccharification and fermentation process, and buildup of those inhibitors in the process may result in yield loss. For the most probable case, the assigned value for the variable IMPURITIES is 3. For the optimistic and pessimistic cases the assigned values are 0 and 5, respectively.
The process design has six continuously linked process steps, which include feedstock handling, pretreatment, saccharification, cofermentation, distillation, and steam/power generation. Therefore, the value for the variable COMPLEXITY is assigned as 6 for all three cases.
Some of the initial plant inventory is included in the base case cost estimate, although it is not validated in a commercial plant. So, for the optimistic scenario a value of 33% is assigned for the variable INCLUSIVENESS. The value of 0% is assigned for both pessimistic and most probable cases.
A plant site has not been chosen, so none of the site-specific information has been procured. Some level of engineering has been completed. Therefore, a value of 6 is assigned for most probable and optimistic cases for the variable PROJECT DEFINITION and the pessimistic case is assigned a 5.
The assigned variable values are used in Equation 2 to calculate the percentage of cost growth as shown in Table 1. The base case nth plant TCI is divided by the cost growth, obtained from Equation 2 (Table 1), to obtain an estimate for the pioneer plant TCI. The contingency factor is increased to 30%, compared with 20% for an nth plant, to account for additional construction uncertainties. The plant performance, obtained from Equation 1 (Table 1), is multiplied by the first year ethanol sales to account for the reduced production of a pioneer plant. For the discounted cash flow analysis, plant performance is increased by 20% per year until design capacity is reached.
18
Results and Discussion
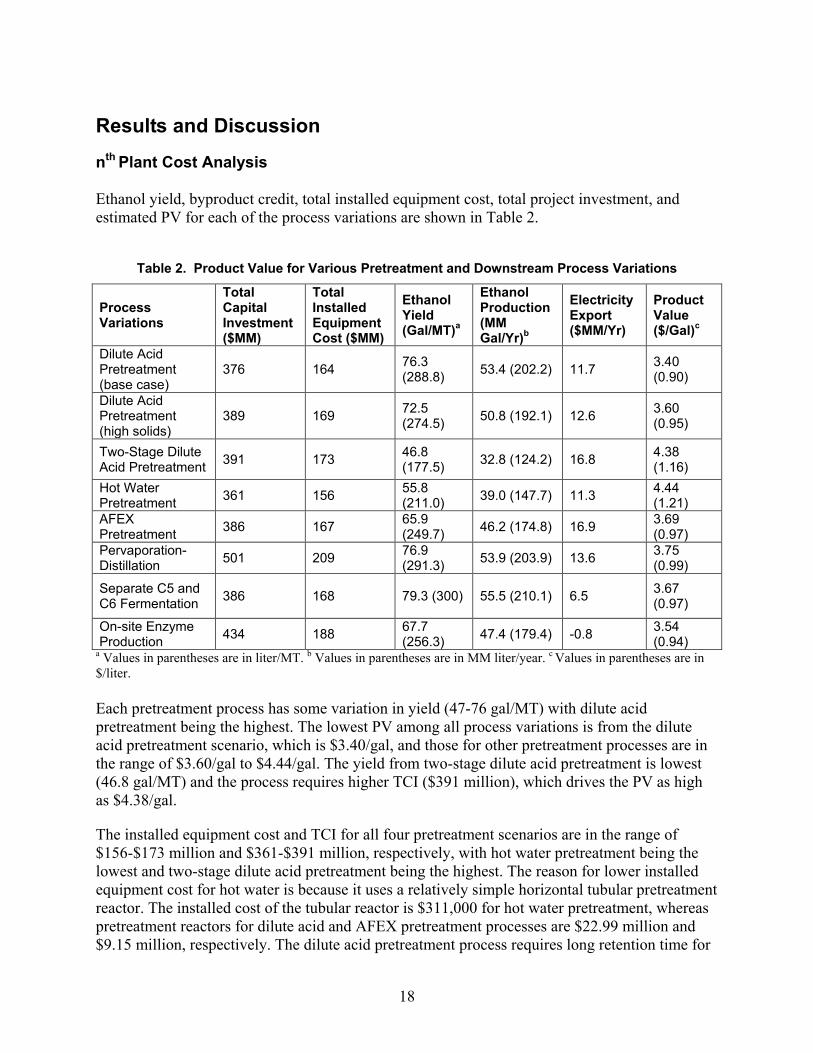
nth Plant Cost Analysis Ethanol yield, byproduct credit, total installed equipment cost, total project investment, and estimated PV for each of the process variations are shown in Table 2.
Table 2. Product Value for Various Pretreatment and Downstream Process Variations
Process Variations
Total Capital Investment ($MM)
Total Installed Equipment Cost ($MM)
Ethanol Yield (Gal/MT)a
Ethanol Production (MM Gal/Yr)b
Electricity Export ($MM/Yr)
Product Value ($/Gal)c
Dilute Acid Pretreatment (base case)
376 164 76.3 (288.8) 53.4 (202.2) 11.7 3.40
(0.90)
Dilute Acid Pretreatment (high solids)
389 169 72.5 (274.5) 50.8 (192.1) 12.6 3.60
(0.95)
Two-Stage Dilute Acid Pretreatment 391 173 46.8
(177.5) 32.8 (124.2) 16.8 4.38 (1.16)
Hot Water Pretreatment 361 156 55.8
(211.0) 39.0 (147.7) 11.3 4.44 (1.21)
AFEX Pretreatment 386 167 65.9
(249.7) 46.2 (174.8) 16.9 3.69 (0.97)
Pervaporation-Distillation 501 209 76.9
(291.3) 53.9 (203.9) 13.6 3.75 (0.99)
Separate C5 and C6 Fermentation 386 168 79.3 (300) 55.5 (210.1) 6.5 3.67
(0.97)
On-site Enzyme Production 434 188 67.7
(256.3) 47.4 (179.4) -0.8 3.54 (0.94)
a Values in parentheses are in liter/MT. b Values in parentheses are in MM liter/year. c Values in parentheses are in $/liter. Each pretreatment process has some variation in yield (47-76 gal/MT) with dilute acid pretreatment being the highest. The lowest PV among all process variations is from the dilute acid pretreatment scenario, which is $3.40/gal, and those for other pretreatment processes are in the range of $3.60/gal to $4.44/gal. The yield from two-stage dilute acid pretreatment is lowest (46.8 gal/MT) and the process requires higher TCI ($391 million), which drives the PV as high as $4.38/gal.
The installed equipment cost and TCI for all four pretreatment scenarios are in the range of $156-$173 million and $361-$391 million, respectively, with hot water pretreatment being the lowest and two-stage dilute acid pretreatment being the highest. The reason for lower installed equipment cost for hot water is because it uses a relatively simple horizontal tubular pretreatment reactor. The installed cost of the tubular reactor is $311,000 for hot water pretreatment, whereas pretreatment reactors for dilute acid and AFEX pretreatment processes are $22.99 million and $9.15 million, respectively. The dilute acid pretreatment process requires long retention time for

19
overliming, which requires large expensive vessels. Although the AFEX reactor cost is lower than the dilute acid pretreatment reactor, the AFEX pretreatment process has additional expensive unit operations (such as the ammonia compressor) that increase the total installed equipment cost to slightly more than that of dilute acid pretreatment processes.
For the comparison of pretreatment technologies, lab-scale experimental data at low solids loading (25%) were used in the model [3]. In order to understand how process scale-up may impact ethanol production cost, a process model was developed using data from experiments conducted at NREL at higher solids loading (40%). Table 3 presents a summary comparison of the results from the dilute acid pretreatment models.
Table 3. Comparison of Dilute Acid Pretreatment Results from Lab- and Pilot-Scale Data
Base Case (2007 EVD) High Solids
Solids Loading 25% 40%
PV ($/gal) 3.40 3.60
Ethanol Yield (gal/MT) 76.3 72.5
Installed Equipment Cost (MM$) 164.1 169.4
Fixed Capital Investment (MM$) 326.8 337.8
Total Capital Investment (MM$) 375.9 388.5
Lang Factor 3.44 3.43 The PV of the model using high solids loading is $0.20/gal higher than that of the base case model. This is primarily due to the decreased ethanol production caused by lower yields of monosaccharides at higher solids loadings.
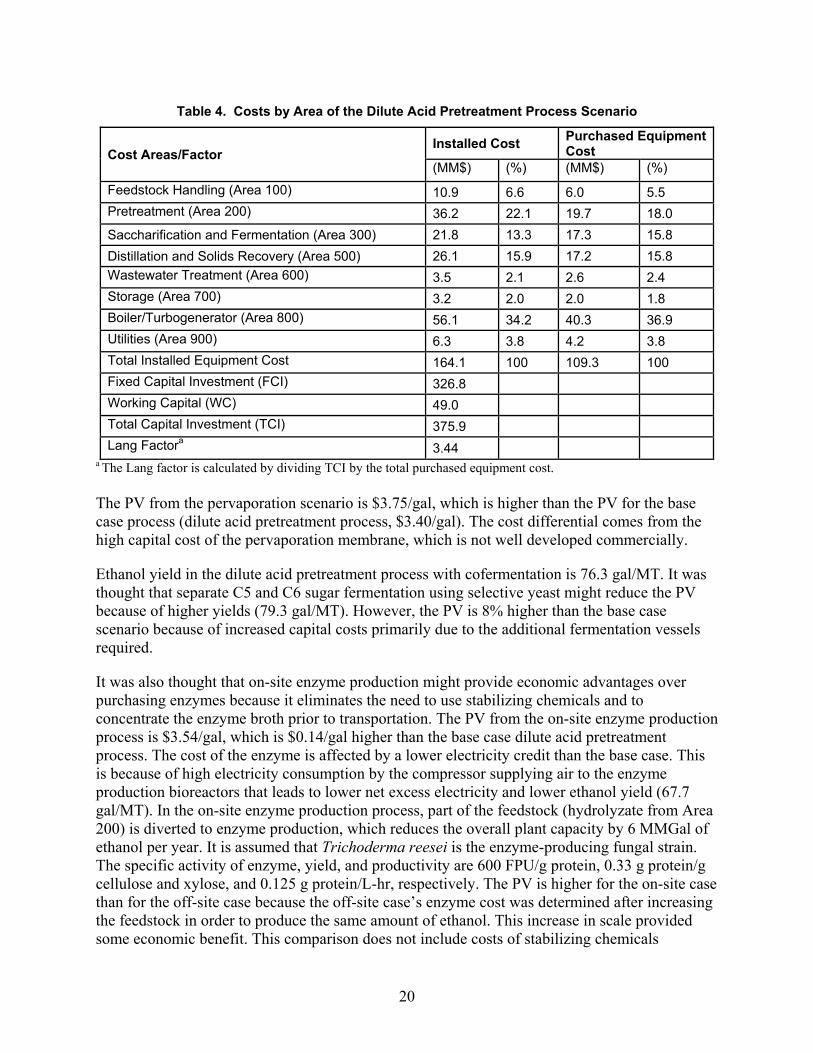
The costs of each process area for the dilute acid pretreatment scenario are presented in Table 4; costs for other scenarios are given in Appendix H. The expensive areas of the dilute acid pretreatment scenario are the pretreatment, saccharification and fermentation, distillation and solids recovery, and boiler and turbo-generator sections. Among these, the boiler and turbo-generator section is the most expensive area, accounting for 56% of the total installed equipment costs.
20
Table 4. Costs by Area of the Dilute Acid Pretreatment Process Scenario
Cost Areas/Factor Installed Cost Purchased Equipment
Cost (MM$) (%) (MM$) (%)
Feedstock Handling (Area 100) 10.9 6.6 6.0 5.5 Pretreatment (Area 200) 36.2 22.1 19.7 18.0 Saccharification and Fermentation (Area 300) 21.8 13.3 17.3 15.8 Distillation and Solids Recovery (Area 500) 26.1 15.9 17.2 15.8 Wastewater Treatment (Area 600) 3.5 2.1 2.6 2.4 Storage (Area 700) 3.2 2.0 2.0 1.8 Boiler/Turbogenerator (Area 800) 56.1 34.2 40.3 36.9 Utilities (Area 900) 6.3 3.8 4.2 3.8 Total Installed Equipment Cost 164.1 100 109.3 100 Fixed Capital Investment (FCI) 326.8 Working Capital (WC) 49.0 Total Capital Investment (TCI) 375.9 Lang Factora 3.44
a The Lang factor is calculated by dividing TCI by the total purchased equipment cost. The PV from the pervaporation scenario is $3.75/gal, which is higher than the PV for the base case process (dilute acid pretreatment process, $3.40/gal). The cost differential comes from the high capital cost of the pervaporation membrane, which is not well developed commercially.
Ethanol yield in the dilute acid pretreatment process with cofermentation is 76.3 gal/MT. It was thought that separate C5 and C6 sugar fermentation using selective yeast might reduce the PV because of higher yields (79.3 gal/MT). However, the PV is 8% higher than the base case scenario because of increased capital costs primarily due to the additional fermentation vessels required.
It was also thought that on-site enzyme production might provide economic advantages over purchasing enzymes because it eliminates the need to use stabilizing chemicals and to concentrate the enzyme broth prior to transportation. The PV from the on-site enzyme production process is $3.54/gal, which is $0.14/gal higher than the base case dilute acid pretreatment process. The cost of the enzyme is affected by a lower electricity credit than the base case. This is because of high electricity consumption by the compressor supplying air to the enzyme production bioreactors that leads to lower net excess electricity and lower ethanol yield (67.7 gal/MT). In the on-site enzyme production process, part of the feedstock (hydrolyzate from Area 200) is diverted to enzyme production, which reduces the overall plant capacity by 6 MMGal of ethanol per year. It is assumed that Trichoderma reesei is the enzyme-producing fungal strain. The specific activity of enzyme, yield, and productivity are 600 FPU/g protein, 0.33 g protein/g cellulose and xylose, and 0.125 g protein/L-hr, respectively. The PV is higher for the on-site case than for the off-site case because the off-site case’s enzyme cost was determined after increasing the feedstock in order to produce the same amount of ethanol. This increase in scale provided some economic benefit. This comparison does not include costs of stabilizing chemicals

21
associated with purchased enzymes, so the enzyme cost continues to be uncertain. However, the comparison of an on-site case helps demonstrate what yields and electricity tradeoffs occur when enzyme is produced on-site.
Sensitivity Analysis Process-specific sensitivity analysis of pretreatment and saccharification operations was performed on all pretreatment process scenarios. This analysis showed the impact of process operation parameters including operating temperature, retention time, acid concentrations, and yields on PV. The results are shown in Figures 11 and 12 (the detailed parameter values and results are tabulated in Table B-1 and Table C-1, respectively). PV is most sensitive to pretreatment solid consistency, retention time, and xylan and cellulose conversions. When the retention time of the dilute acid pretreatment reactor is increased from 2 to 10 minutes, an increase in PV of 16% is observed (Figure 11). When the conversion of xylan to xylose in the pretreatment reactor is reduced from 82.5% (2007 EVD) to 33%, the PV increases by 6%. And when the solid consistency in the hot water pretreatment reactor is increased from 13% to 20%, the PV is reduced by 10%. Xylose and cellulose conversions in the pretreatment reactor of the two-stage dilute acid scenario showed significant impact on PV. The PV increased by 44% and is reduced by 10% when xylan to xylose conversion is reduced from 82.5% to 33% and cellulose to glucose conversion is increased from 6.3% to 23%, respectively. The impact of other pretreatment parameters on PV is not so significant.
Figure 11. Impact of pretreatment parameters on PV
22
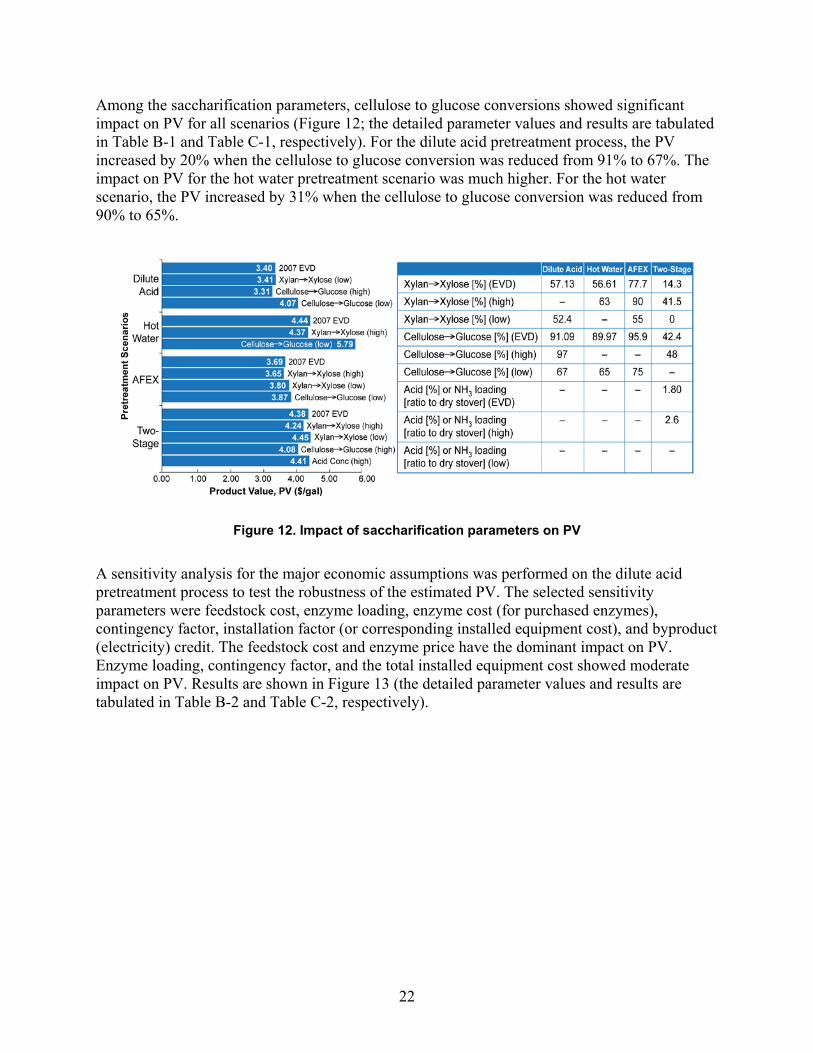
Among the saccharification parameters, cellulose to glucose conversions showed significant impact on PV for all scenarios (Figure 12; the detailed parameter values and results are tabulated in Table B-1 and Table C-1, respectively). For the dilute acid pretreatment process, the PV increased by 20% when the cellulose to glucose conversion was reduced from 91% to 67%. The impact on PV for the hot water pretreatment scenario was much higher. For the hot water scenario, the PV increased by 31% when the cellulose to glucose conversion was reduced from 90% to 65%.
Figure 12. Impact of saccharification parameters on PV
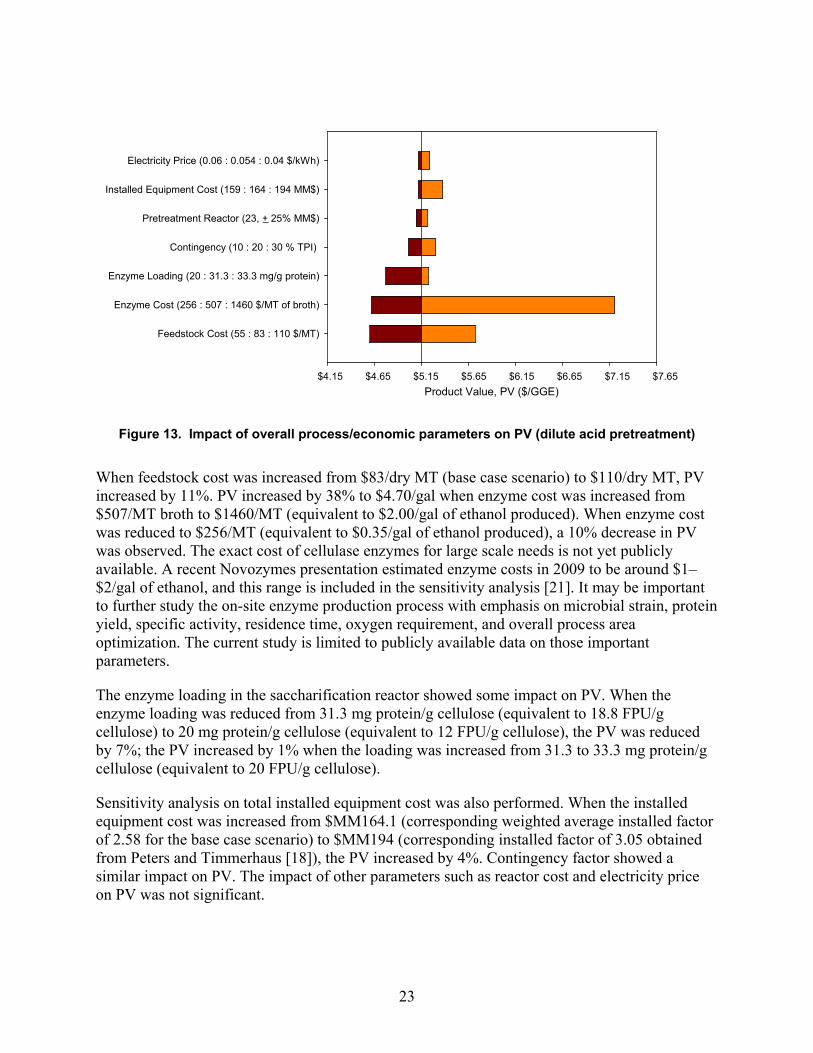
A sensitivity analysis for the major economic assumptions was performed on the dilute acid pretreatment process to test the robustness of the estimated PV. The selected sensitivity parameters were feedstock cost, enzyme loading, enzyme cost (for purchased enzymes), contingency factor, installation factor (or corresponding installed equipment cost), and byproduct (electricity) credit. The feedstock cost and enzyme price have the dominant impact on PV. Enzyme loading, contingency factor, and the total installed equipment cost showed moderate impact on PV. Results are shown in Figure 13 (the detailed parameter values and results are tabulated in Table B-2 and Table C-2, respectively).
23
Product Value, PV ($/GGE)
Feedstock Cost (55 : 83 : 110 $/MT)
Enzyme Cost (256 : 507 : 1460 $/MT of broth)
Enzyme Loading (20 : 31.3 : 33.3 mg/g protein)
Contingency (10 : 20 : 30 % TPI)
Pretreatment Reactor (23, + 25% MM$)
Installed Equipment Cost (159 : 164 : 194 MM$)
Electricity Price (0.06 : 0.054 : 0.04 $/kWh)
$4.15 $4.65 $5.15 $5.65 $6.15 $6.65 $7.15 $7.65
_
Figure 13. Impact of overall process/economic parameters on PV (dilute acid pretreatment)
When feedstock cost was increased from $83/dry MT (base case scenario) to $110/dry MT, PV increased by 11%. PV increased by 38% to $4.70/gal when enzyme cost was increased from $507/MT broth to $1460/MT (equivalent to $2.00/gal of ethanol produced). When enzyme cost was reduced to $256/MT (equivalent to $0.35/gal of ethanol produced), a 10% decrease in PV was observed. The exact cost of cellulase enzymes for large scale needs is not yet publicly available. A recent Novozymes presentation estimated enzyme costs in 2009 to be around $1–$2/gal of ethanol, and this range is included in the sensitivity analysis [21]. It may be important to further study the on-site enzyme production process with emphasis on microbial strain, protein yield, specific activity, residence time, oxygen requirement, and overall process area optimization. The current study is limited to publicly available data on those important parameters.
The enzyme loading in the saccharification reactor showed some impact on PV. When the enzyme loading was reduced from 31.3 mg protein/g cellulose (equivalent to 18.8 FPU/g cellulose) to 20 mg protein/g cellulose (equivalent to 12 FPU/g cellulose), the PV was reduced by 7%; the PV increased by 1% when the loading was increased from 31.3 to 33.3 mg protein/g cellulose (equivalent to 20 FPU/g cellulose).
Sensitivity analysis on total installed equipment cost was also performed. When the installed equipment cost was increased from $MM164.1 (corresponding weighted average installed factor of 2.58 for the base case scenario) to $MM194 (corresponding installed factor of 3.05 obtained from Peters and Timmerhaus [18]), the PV increased by 4%. Contingency factor showed a similar impact on PV. The impact of other parameters such as reactor cost and electricity price on PV was not significant.

24
Pioneer Plant Analysis Results Table 5 shows the pioneer-plant PV results for all three cases. The PV for the most-probable case is $5.76/gal, and that for the optimistic and pessimistic cases is $5.01/gal and $7.08/gal, respectively. The PV for the most probable, optimistic, and pessimistic cases is 69%, 47%, and 108% more, respectively, than the PV estimated for the nth plant. The cost growth analysis shows that the TCI and Lang factor increased significantly from the base case nth plant. For the most probable cost growth scenario, the TCI and Lang factor are MM$886.4 and 8.11, respectively, which are an increase of 136% from the base case nth plant values.
Table 5. Pioneer Plant Analysis Results for the Dilute Acid Pretreatment Process Scenario
Cost Item Cost Growth (Pioneer Plant)
Most Probable Optimistic Pessimistic
PV ($/gal) 5.76 5.01 7.08 Fixed Capital Investment (MM$) 833 674 1,111
Total Capital Investment (MM$) 886 727 1,164
Lang Factor 8.11 6.65 10.65

25
Comparison with Previous Studies
The results of this study deviate considerably from a number of previous techno-economic analyses of cellulosic ethanol production. There are many contributing factors to this deviation, and an explanation of the most significant of these factors is discussed here. Figure 14 presents a plot of estimated ethanol prices from seven previous studies as a function of feedstock price. The ethanol and feedstock prices were updated to 2007 dollars using the Consumer Price Index. The solid line on the plot represents the PV for the dilute acid pretreatment scenario using the model developed in this study as a function of feedstock price.
Figure 14. Ethanol cost estimations from previous techno-economic studies. (1) Short term technology—Simultaneous saccharification and fermentation (SSF). (2) Middle term
technology—Simultaneous saccharification and cofermentation (SSCF). (3) Long term technology—Consolidated bioprocessing (CBP). (4) Separate hydrolysis and fermentation (SHF). (5) SSF. (6) CBP. (7)
SSCF. After updating the feedstock and ethanol prices to 2007 dollars, much of the difference from previous studies can be explained by the clear correlation that exists between feedstock price and ethanol price. However, all of the studies except that of Nguyen and Saddler [22] remain lower than the line derived from this study. The study by Hamelinck et al. [23] represents a significant outlier from the apparent correlation between feedstock price and ethanol price. The three ethanol price estimates are for short-term (5 years from time of study), middle-term (10–15 years), and long-term (20+ years) technology implementation. The short-term estimate is closest to the time frame considered in this study. However, it also deviates from the trend of other studies. The assumptions for the short-term estimate—including feedstock input, rate of return, and reaction conversions—are quite similar to those used in this study, and the TCI (updated to 2007 dollars) is nearly equal as well. The most significant difference from this study is the non-feedstock operating cost, which is approximately $0.32/gal ethanol (EtOH) compared to

26
$1.68/gal. This is partly due to lower costs for corn steep liquor, cellulase, and other raw materials. This factor accounts for most of the discrepancy between ethanol price estimates.
The ethanol price from the study published by Sendich et al. [24] is also slightly lower than the apparent correlation of feedstock and ethanol price. The lowest estimate in that study assumes the use of consolidated bioprocessing, which is an advanced technology also modeled in the long-term estimate from Hamelinck et al. [23]. The higher ethanol price estimate of $1.03/gal is from a model using simultaneous saccharification and cofermentation (SSCF). SSCF is a more advanced technology than was considered in this study; this factor results in lower capital and operating costs by combining enzymatic saccharification and fermentation. A new AFEX pretreatment scheme was also employed, which may have contributed to lower capital and operating costs of pretreatment.
The enzyme cost used in this study is much higher than that used in other studies. Because enzyme cost is such a significant fraction of the PV, it contributes significantly to the discrepancy between the current study and previous studies. For example, the enzyme prices used in the prior studies of Wingren et al. (2003), Wingren et al. (2004), and Aden et al. [25, 26, 4] are approximately 30%, 30%, and 17% of the price used in this study, respectively.

27
Conclusions
The present study is based on published technological and economical data that in many ways lacks specifics and details. Thus, a list of assumptions was developed. Sensitivity analysis on those assumptions was performed, and their impact on TCI and PV was wide. The studies identify the strengths and weaknesses of the technology. The major strength of the technology is its pre-commercial maturity. Several pilot-scale cellulosic ethanol plants are in development today. The U.S. Department of Energy has funded 10 pioneer plant projects producing biofuels using a biochemical pathway [27]. However, technological and economic data from these pilot and demo plants are not publically available for use in this study.
The published data in 2007 shows that the technology can reach 4.5% of ethanol concentration in the fermented beer, which is approximately one-third of what commercial grain ethanol plants are achieving. The enzyme and feedstock costs are two major cost contributors. In our studies, cellulase price is assumed to be nearly $0.70/gal of ethanol produced and its loading is 18.8 FPU/g of cellulose. The high cost of enzymes represents a significant opportunity to reduce the PV through improved biotechnology. The current feedstock cost is assumed to be $83/MT. However, the cost is likely to be location sensitive. It is important to critically estimate the feedstock cost, which may limit the plant locations to certain areas. Published improvements in process technology since 2007 have not been considered in this work, and these improvements would likely decrease PV for a project being designed today.

28
References
1. Eggeman, T.; Elander, R.T. “Process and Economic Analysis of Pretreatment Technologies.” Bioresource Technology; Vol. 96(18), 2005; pp. 2019-2025.
2. Elander, R.; Eggeman, T. Alternative Pretreatment (CAFI)—Inital Data And Economic Analysis. Report. Golden, CO: National Renewable Energy Laboratory, 2004.
3. Wyman, C.E.; Dale, B.E.; Elander, R.T.; Holtzapple, M.; Ladish, M.R.; Lee, Y.Y. “Comparative Sugar Recovery Data from Laboratory Scale Application of Leading Pretreatment Technologies to Corn Stover.” Bioresource Technology; Vol. 96, 2005; pp. 2026-2032.
4. Aden, A.; Ruth, M; Ibsen, K.; Jechura, J.; Neeves, K.; Sheehan, J.; Wallace, B.; Montague, L.; Slayton, A.; Likes, J. Lignocellulosic Biomass to Ethanol Process Design and Economics Utilizing Co-Current Dilute Acid Prehydrolysis and Enzymatic Hydrolysis for Corn Stover. Report No. NREL/TP-510-32438. Golden, CO: National Renewable Energy Laboratory, 2002.
5. Neeves, K.; Ibsen, K. Lignocellulosic Biomass-to-Ethanol Process Design and Economics Using Two-Stage Dilute Acid Hydrolysis. Report. Golden, CO: National Renewable Energy Laboratory, 2000.
6. Nguyen, Q.A.; Tucker, M.P.; Keller, F.A.; Eddy, F.P. “Two-Stage Dilute-Acid Pretreatment of Softwoods.” Applied Biochemistry and Biotechnology; Vol. 84-86, 2000; pp. 561-576.
7. The Energy Independence and Security Act of 2007. Public Law 110-140; 121, 1491. Available at http://frwebgate.access.gpo.gov/cgi-bin/getdoc.cgi?dbname=110_cong_bills&docid=f:h6enr.txt.pdf.
8. Myers, C.W.; Shangraw, R.F.; Devey, M.R.; Hayashi, T. Understanding Process Plant Schedule Slippate and Startup Costs. Report No. R-3215-PSSP/RC. Santa Monica, CA: RAND Corp., June 1986.
9. Aden, A. Biochemical Production of Ethanol from Corn Stover: 2007 State of Technology Model. Report No. NREL/TP-510-43205. Golden, CO: National Renewable Energy Laboratory, 2008.
10. Teymouri, F.; Laureano-Perez, L.; Alizadeh, H.; Dale, B.E. “Optimization of the Ammonia Fiber Explosion (AFEX) Treatment Parameters for Enzymatic Hydrolysis of Corn Stover.” Bioresource Technology; 96, 2005; pp. 2014-2018.
11. Dutta, A.; Dowe, N.; Ibsen, K.; Schell, D.; Aden, A. “Comparison of Biochemical Conversion Process Configurations for the Production of Cellulosic Ethanol.” Biotechnology Progress; Vol. 26(1), 2009; pp. 64-72. DOI: 10.1002/btpr.311.

29
12. Hsu, D. Process Economics of Pervaporation Membrane Separation of Ethanol and Water in the Biochemical Design Report. Technical Memo. Golden, CO: National Renewable Energy Laboratory, 2008.
13. O’Brien, D.J.; Roth, L.H.; McAloon, A.J. “Ethanol Production by Continuous Fermentation-Pervaporation: A Preliminary Economic Analysis.” Journal of Membrane Science; Vol. 166(1), 2000; pp. 105-111.
14. Wooley, R.; Ruth, M.; Sheehan, J.; Ibsen, K.; Majdeski, H.; Galvez, A. Lignocellulosic Biomass to Ethanol Process Design and Economics Utilizing Co-current Dilute Acid Prehydrolysis and Enzymatic Hydrolysis Current and Futuristic Scenarios. Report No. NREL/TP-580-26157. Golden, CO: National Renewable Energy Laboratory, 1999.
15. Merrow, W.E.; Phillips, K.E.; Myers, C.W. (1981). Understanding Cost Growth and Performance Shortfalls in Pioneer Process Plants. Report No. RAND/R-2569-DOE. Santa Monica, CA: The Rand Corporation, 1981.
16. Wallace, B. Cost Estimation for a Lignocellulosic Biomass to Ethanol Pioneer Plant. NREL Technical Memo. Golden, CO: National Renewable Energy Laboratory, 2003.
17. “Chemical Engineering Plant Cost Index.” Chemical Engineering. November 2008.
18. Peters, M.S.; Timmerhaus, K.D.; West, R.E. Plant Design and Economics For Chemical Engineers. Fifth Edition. New York: McGraw Hill, 2004.
19. “Inorganic Chemical Index.” SRI International Economics Handbook, Economic Environment Of The Chemical Industry. 2008 Menlo Park, CA: SRI Consulting, 2008.
20. “Labor Index.” Washington, DC: U.S. Bureau of Labor Statistics, 2008.
21. Bryant, C. “Step Change in Cellulosic Ethanol – The Future is Moving Closer.” Presented at the National Ethanol Conference, San Antonio, TX, 2009.
22. Nguyen, Q.A.; Saddler, J.N. “An Integrated Model for The Technical and Economic Evaluation of an Enzymatic Biomass Conversion Process.” Bioresource Technology; Vol. 35(3), 1991; pp. 275-282.
23. Hamelinck, C.N.; van Hooijdonk, G.; Faaij, A.P.C. “Ethanol from Lignocellulosic Biomass: Techno-Economic Performance in Short-, Middle- and Long-Term.” Biomass and Bioenergy; Vol. 28, 2005; pp. 384-410.
24. Sendich, E.N.; Laser, M.; Kim, S.; Alizadeh, H.; Laureano-Perez, L.; Dale, B.; Lynd, L. “Recent Process Improvements for the Ammonia Fiber Expansion (AFEX) Process and Resulting Reductions in Minimum Ethanol Selling Price.” Bioresource Technology; Vol. 99, 2009; pp. 8429-8435.

30
25. Wingren, A.; Galbe, M.; Zacchi, G. “Techno-Economic Evaluation of Producing Ethanol from Softwood: Comparison of SSF and SHF and Identification of Bottlenecks.” Biotechnology Progress; Vol. 19, 2003; pp. 1109-1117.
26. Wingren, A.; Soderstrom, J.; Galbe, M.; Zacchi, G. “Process Considerations and Economic Evaluation of Two-Step Steam Pretreatment for Production of Fuel Ethanol from Softwood.” Biotechnology Progress; Vol. 20, 2004; pp. 1421-1429.
27. “Major DOE Biofuels Project Locations.” Washington, DC: U.S. Department of Energy, 2008. Available at http://www.energy.gov/media/Major_DOE_Biofuels_Project_Locations.pdf; accessed January 27, 2010.

31
Appendices
Appendix A - Assumptions for Techno-economic Studies of Biochemical Conversion Processes Plant Size, Location, and Construction
• Optimum plant size is regarded as economically feasible plant size, which would be a plant with capacity of 2000 MT/day (dry feedstock).
• The plant produces EtOH (as product) and electricity (as byproduct).
• The plant is considered to be located in the middle of corn farmland.
• 25% of the land will be tied up in infrastructure (roads and buildings).
• 75% of the farm land plants corn.
• The plant will be designed based on the state of the technology (as of 2007), and it would be the nth plant of its kind. RAND/risk analysis will inflate price from mature nth plant to immature pioneer plant.
• The online time would be 350 days per year (equivalent capacity factor of 96%).
• Construction time of 24 months is considered.
• Startup period would be 25% of the construction time (6 months).
• During this period, an average of 50% production will be achieved with expenditure of about 75% of variable expenses and 100% of fixed expenses.
Units • Plant capacity, mass flow, and yields are based on metric tons (MT) per day.
• Feedstock cost and purchased chemicals costs are based on short tons (ST).
• Ethanol sale price is in $/gallon, and byproduct credit (electricity) is in $/kWh.
• Process operating conditions are:
o Temperature in oC
o Pressure in bar
o Mass flow rates in MT/day.
Feedstock and Enzymes • Corn stover (composed of stalks, leaves, cobs, and husks) is considered as feedstock.
o The feedstock will be delivered to the feed handling area of the plant.
o Moisture content in the feedstock is 25% (wet basis).
o Feed composition is assumed to be the same as CAFI II analysis results. Table A-1 displays feedstock composition.
o Feedstock is delivered in bales.
o The feedstock transportation and management protocol are not considered.

32
o Feed cost is assumed to be $83/MT ($75/dry short ton) at the gate.
• 72 hours of on-site storage (corn stover bales) is considered, and long term storage costs are not included in the analysis.
• Stover is washed of dirt and metal is removed; no biomass is lost in washing.
• Enzyme will be purchased or produced on-site through purchase/licensing agreements with enzyme suppliers.
o Enzyme loading is assumed as 31.3 mg protein/g cellulose in original feed.
o Enzyme cost is $507/MT broth when purchased from off-site sources.
Table A-1. Corn Stover Feedstock Composition
Components Composition (%) Components Composition
(%) Extractives 8.26 Lignin 10.69 Cellulose 33.43 Ash 5.93 Xylan 22.16 Acetate 5.44 Galactan 1.36 Protein 2.24
Arabinan 4.08 Soluble Solids 5.83
Mannan 0.58 Moisture 25 Material and Energy Balance Material Balance
• Reactions and conversions of hemicellulose carbohydrates (arabinan, mannan, galactan) are assumed to have the same value as xylan in the pretreatment hydrolyzer (depends on pretreatment).
• A total of 7% of fermenting sugars is assumed to be lost to contamination, which may be regarded as bad batches (the bad batches are dumped and regarded as loss).
• The total amount of water from the pressure filter (bottom product of the first distillation column) that is directly recycled is set to be 25% (to minimize contaminant buildup in the stream).
• Boiler blow down is considered to be 3% of steam production.
• Carbon efficiency can be calculated based on carbohydrate carbon content, as follows:
• Cooling tower windage is 0.1% of the total flow to the tower.
o The tower blow down is 10% of the of the sum of the evaporative loss plus windage.
• Well water will be used as process makeup water (lost to evaporation, blow down, windage, in solid waste).
% 100
33
Energy Balance • Heat loss from the reactor will not be accounted for in energy balance calculations.
• Heat loss from the combustor is accounted for, totaling about 2.2%.
• Electricity will be generated by burning lignin and waste (process waste and pressed solids from wastewater treatment), which will be used in the plant, and the net surplus will be sold to grid at a price of $0.054/kW (2007 dollar value).
Equipment Design, Material of Construction, and Costing Equipment Design
• The reactors will be modeled using experimentally determined conversions of specific reactions (kinetic expressions will be not used because of the level of their development).
• If the size of any equipment is known to change linearly with the inlet flow, that information can be used for equipment scaling (a characteristic of the size might be the heat duty for a heat exchanger if the log-mean temperature difference is known not to change).
• For some equipment, nothing can be easily related to the size, in which case the unit will be resized with each process change (for example heat exchangers with varying temperature profiles; in this case, the heat exchanger area will be calculated each time the model will be run and the cost will be scaled using the ratio of the new and original areas).
Material of Construction • The materials of construction for all equipment (except the pretreatment reactor, flash
tank, and Pneumapress equipment) will be as follows (Delta-T/NREL experience):
o SS316 for flash tank (for the solid-liquid separation equipment)
o Incoloy 825-clad steel for continuous pretreatment reactor and its parts in contact with acid, and SS316L for most other parts including presteamer.
Costing • All pumps, tanks, screw conveyors, agitators, heat exchangers, and surge tanks will be
estimated using ICARUS Process Evaluator and NREL database.
• Large vessels (saccharification tank, fermentors, seed hold tanks), boiler feed water softening equipment, anaerobic and aerobic digesters, and filter press will be estimated from quotation.
• Smaller vessels (seed fermentor) and coil coolers will be estimated by ICARUS and NREL database.
• If process changes are made and the equipment size changes, the equipment will be re-costed following the exponential scaling expression:
*or characteristic linearly related to the size
Cost New sizeOriginal size

34
o The scaling exponents are obtained from NREL’s vendor quote database.
• The purchased equipment cost obtained in a particular year (before 2007) will be indexed to the year of 2007 using the Chemical Engineering Index.
• Installation factors (from Delta-T/NREL experience for aqueous-based process) will be applied to purchased equipment costs to determine the installation cost (not ICARUS).
Chemical Costing • Cost of acids and other chemicals, including boiler feed water softening chemical cost,
will be obtained from quotation.
o The cost of the chemicals will also be indexed following Industrial Inorganic Chemical Index (from SRI) to estimate the cost of the chemicals in the year of 2007.
Operating Cost • Working capital is assumed to be 15% of fixed capital investment.
o It is assumed that the product will be made and shipped and payment received in 30 days.
• Annual maintenance materials will be 2% of the total installed equipment cost.
• Employee salaries will be indexed, if required, to the year 2007 following the data of the Bureau of Labor Statistics.
• Salaries of the yard employees will not include benefits and will be covered in the general overhead category.
o General overhead will be a factor of 60% applied to the total salaries and covers items such as safety, general engineering, general plant maintenance, payroll overhead (including benefits), plant security, janitorial and similar services, phone, light, heat, and plant communications.
Wastewater Treatment Plant • The process will be designed for zero discharge to a municipal treatment plant in a
steady-state mode, and the treated water will be suitable for recycling to the process.
• Any process upset (sudden increase of solids in the wastewater) will not be considered in the model.
• Rain and snow run-off, equipment washing, and other non-process waters are assumed to flow to the municipal wastewater treatment system; other intermittent loads (process spills) will not be considered in the design.
• No insoluble components (cellulose, xylan) will be included in the chemical-oxygen-demand (COD) calculations because of uncertainty of their reactivity.
• Biological oxygen demand in the anaerobic digester is assumed to be 70% of the COD.
o COD reduction in both digesters is considered as 99.4%.

35
Greenhouse Emissions and Control • All of the sulfur entering into the combustor is converted to SO2.
o 1% of the generated SO2 is converted to sulfuric acid.
o Flue gas temp will be kept above the dew point of sulfuric acid.
• Carbon monoxide is assumed to be generated at a rate of 0.31 kg/MWhr.
o Unburned carbon (char) in the ash is low at 1%.
• NOx is generated at 0.31 kg/MWhr.
• Baghouse efficiency is taken as 98.8% (from Foster Wheeler Energy Limited experience) and will control the emission level below new source performance standard limit.
• The nitrogen level in the combined feed to the combustor is similar to coal when ammonia species are included, but more like untreated biomass when they are not.
o Impact of global warming potential of NOx is small relative to global warming potential of CO2 emission from the process.
Cost Analysis • The total plant investment cost will be determined by applying overhead and contingency
factors (NREL, ConocoPhillips Company experience and literature) to installed equipment costs.
o 20% (of total direct and indirect cost) contingency is assumed for nth plant, and 30% for pioneer plant.
• Warehouse cost is 1.5% of total installed equipment cost, and site development cost is 9% of the installed cost of process equipment areas (A100, A200, A300 and A500) (Delta-T/NREL/published data).
o The estimates are location sensitive.
• Total installed cost (TIC) includes total installed equipment cost, warehouse cost, and site development cost.
• Indirect cost involves:
o Engineering and supervision (32% of purchased equipment cost)
o Construction expenses (34% of purchased equipment cost)
o Legal and contractor’s fees (23% of purchased equipment cost).
• Total direct and indirect cost (TD&IC) includes TIC and indirect costs.
• Working capital is assumed as 15% of FCI (FCI is the sum of TD&IC and contingency).
• Total capital investment is the sum of FCI and working capital.
• To determine the product value per gallon of ethanol (PV), a discounted cash flow analysis will be used (after knowing the major three costs areas: (i) total capital investment, (ii) variable operating costs, and (iii) fixed operating cost).

36
o A 10% discounted cash flow rate of return will be used over a 20-year plant life.
o The plant is considered 100% equity financed.
• For federal tax return purposes, depreciation will be determined as follows :
o IRS modified accelerated cost recovery system, which includes general depreciation system, will be followed that allows both the 200% and 150% declining balance (DB) methods of depreciation.
o This allows the shortest recovery period and the largest deductions.
o According to the IRS, the steam production plant should use a 20-year recovery period (depreciated over 20 years).
o Any other property not specifically described in the publication should be depreciated using a 7-year recovery period.
o Property listed with a recovery period less than 10 years will use the 200% DB depreciation method and a 20-year recovery period property will use the 150% DB depreciation.
o State tax will not be considered for the calculation (because the location of the plant is not specified).
• Return on investment will be calculated on a per gallon basis. Income tax will be averaged over the plant life and that average will be calculated on a per gallon basis.

37
Appendix B - Sensitivity Parameters and Values
Table B-1. Sensitivity Parameters for Pretreatment and Saccharification (AREA 200)
Parameters Dilute Acid (2007 EVD) 2-Stage Dilute acid Hot Water AFEX Base Case (50%)
Sensitivity (0-100%)
Base Case (50%) Sensitivity (0-100%) Base Case (50%)
Sensitivity (0-100%)
Base Case (50%)
Sensitivity (0-100%) 1st Stage 2nd Stage 1st Stage 2nd Stage
Pretreatment Temperature (oC) 190 190-200 190 210 180 190 190-200 108 90-110 Pressure (atm) 11.6 12 18.5 12.6 12.6-15.4 18.7 Retention time (min) 2 1-10 2 15 15-5 5 5 Catalyst (Acid/NH3) conc (%) 1.9 0.71-2.4 1.64 1.80 0.5-2.66 2.6 0 N/A 1.1 0.5-1.3
Solid consistency (%) 29.6 18-29.6% 30 30 12.9 12.9-20 48 20-70 Conversion (%) Cellulose → Glucose 6.3 6.3-23 6.3 42.4 23 48 0.32 2-2.5 0 N/A Xylan → Xylose oligomer 2.7 2.7 0 0 N/A 0.5 N/A Xylan → Xylose 82.5 33-89.7 82.5 14.3 33-89.7 0-41.5 2.4 7.3-25 0 N/A Saccharification Conversion (%) Cellulose → Glucose 91.09 67-97 89.97 65 95.9 75 Xylan → Xylose 57.13 52.4 56.61 63 77.7 55-90
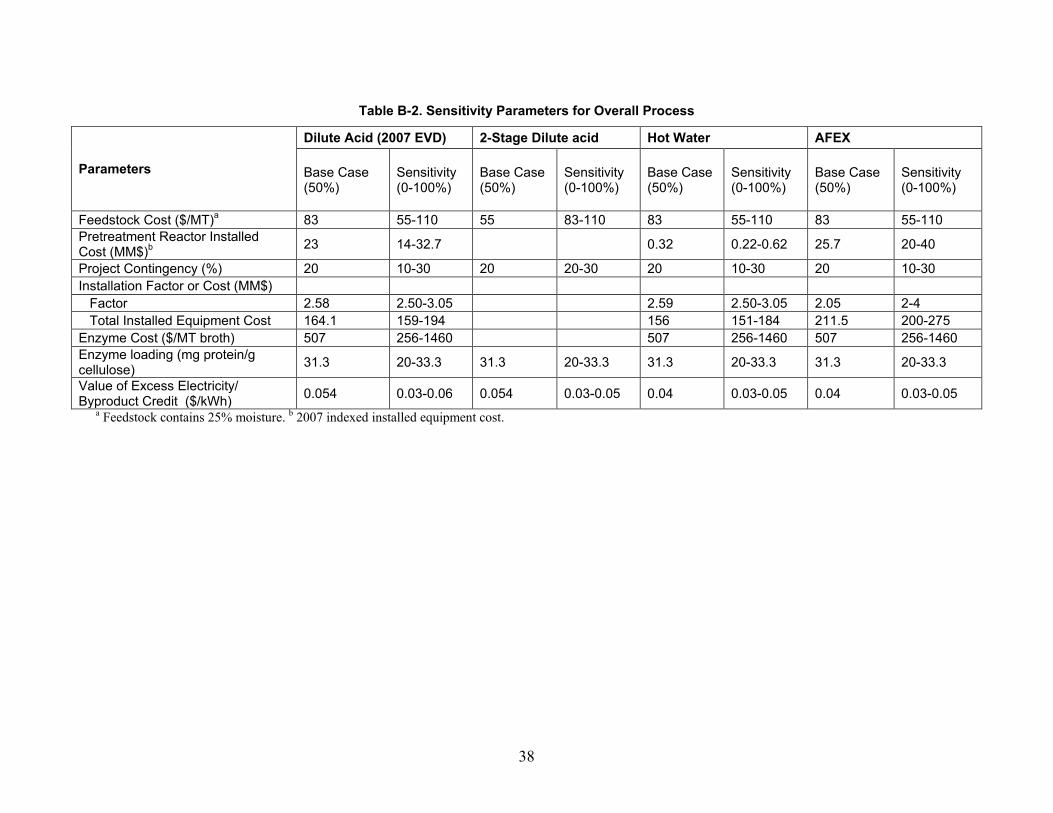
38
Table B-2. Sensitivity Parameters for Overall Process
Parameters
Dilute Acid (2007 EVD) 2-Stage Dilute acid Hot Water AFEX
Base Case (50%)
Sensitivity (0-100%)
Base Case (50%)
Sensitivity (0-100%)
Base Case (50%)
Sensitivity (0-100%)
Base Case (50%)
Sensitivity (0-100%)
Feedstock Cost ($/MT)a 83 55-110 55 83-110 83 55-110 83 55-110 Pretreatment Reactor Installed Cost (MM$)b 23 14-32.7 0.32 0.22-0.62 25.7 20-40
Project Contingency (%) 20 10-30 20 20-30 20 10-30 20 10-30 Installation Factor or Cost (MM$) Factor 2.58 2.50-3.05 2.59 2.50-3.05 2.05 2-4 Total Installed Equipment Cost 164.1 159-194 156 151-184 211.5 200-275 Enzyme Cost ($/MT broth) 507 256-1460 507 256-1460 507 256-1460 Enzyme loading (mg protein/g cellulose) 31.3 20-33.3 31.3 20-33.3 31.3 20-33.3 31.3 20-33.3
Value of Excess Electricity/ Byproduct Credit ($/kWh) 0.054 0.03-0.06 0.054 0.03-0.05 0.04 0.03-0.05 0.04 0.03-0.05
a Feedstock contains 25% moisture. b 2007 indexed installed equipment cost.

39
Appendix C - Sensitivity Results
Table C-1. Impact of Pretreatment Parameters on PV
Sensitivity
Production (MMGal/Yr)
PV
Parameter Values ($/Gal) Change (%)a
Dilute Acid Pretreatment — 2007 EVD Scenario
Base Case 53.4 3.40
Pretreatment
Highb Scenarios
Reactor temperature (oC)
200.0 53.4 3.40 0
Residence time (min) 10 53.4 3.93 15.6
Acid concentration (%)
2.4 53.4 3.40 0
Cellulose to Glucose (% conv)
23 53.4 3.42 0.6
Xyl to Xylose (% conv) 89.7 53.9 3.37 -0.9
Lowb Scenarios
Residence time (min) 1 53.4 3.34 -1.8
Solid consistency (%)
18.0 53.4 3.47 2.1
Acid concentration (%)
0.71 53.4 3.40 0
Xyl to Xylose (% conv) 33 50.1 3.61 6.2
Saccharification
High Scenarios
Cellulose to Glucose (% conv)
97 54.9 3.31 -2.6
Low Scenarios
Cellulose to Glucose (% conv)
67 44.6 4.07 19.7
Xylan to Xylose (% conv)
52.4 53.3 3.41 0.3
Two-Stage Dilute Acid Pretreatment — 2007 EVD Scenario
Base Case 42.5 4.38
1st Stage Acid Pretreatment (Pretreatment)
High Scenarios
Cellulose to Glucose (% conv)
23 47.3 3.93 -10.3
Xylan to Xylose (% conv)
89.7 44.4 4.19 -4.3
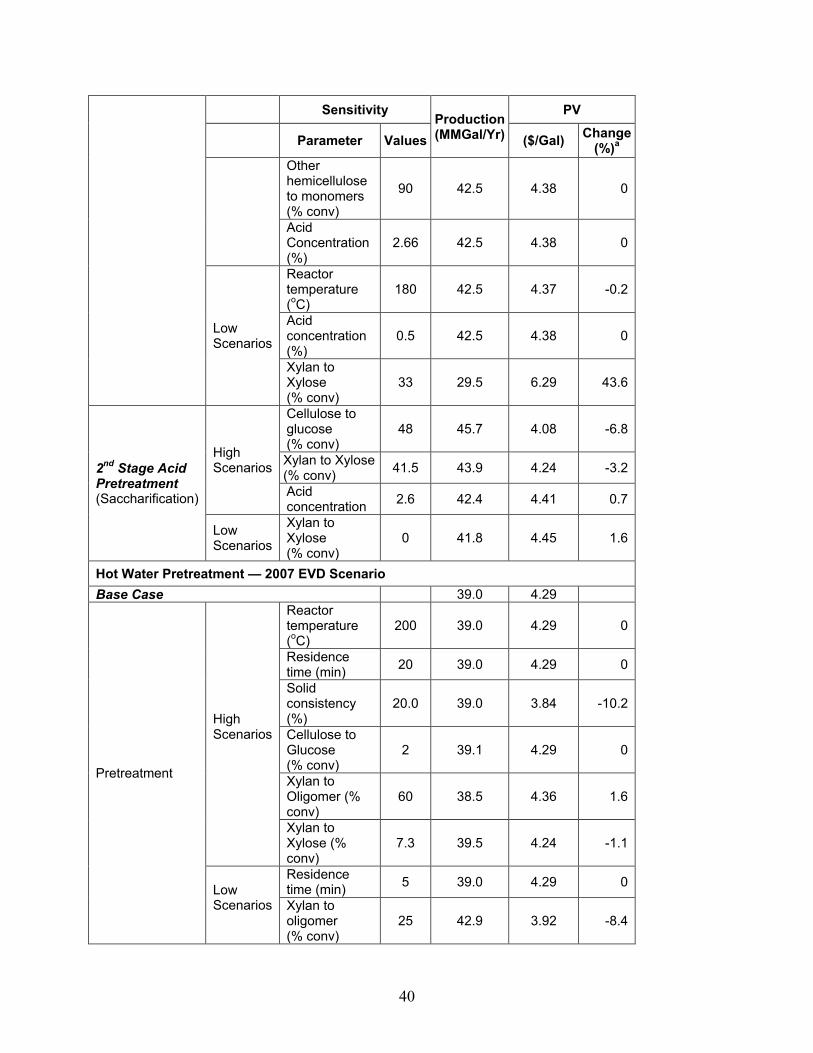
40
Sensitivity
Production (MMGal/Yr)
PV
Parameter Values ($/Gal) Change (%)a
Other hemicellulose to monomers (% conv)
90 42.5 4.38 0
Acid Concentration (%)
2.66 42.5 4.38 0
Low Scenarios
Reactor temperature (oC)
180 42.5 4.37 -0.2
Acid concentration (%)
0.5 42.5 4.38 0
Xylan to Xylose (% conv)
33 29.5 6.29 43.6
2nd Stage Acid Pretreatment (Saccharification)
High Scenarios
Cellulose to glucose (% conv)
48 45.7 4.08 -6.8
Xylan to Xylose (% conv) 41.5 43.9 4.24 -3.2
Acid concentration 2.6 42.4 4.41 0.7
Low Scenarios
Xylan to Xylose (% conv)
0 41.8 4.45 1.6
Hot Water Pretreatment — 2007 EVD Scenario Base Case 39.0 4.29
Pretreatment
High Scenarios
Reactor temperature (oC)
200 39.0 4.29 0
Residence time (min) 20 39.0 4.29 0
Solid consistency (%)
20.0 39.0 3.84 -10.2
Cellulose to Glucose (% conv)
2 39.1 4.29 0
Xylan to Oligomer (% conv)
60 38.5 4.36 1.6
Xylan to Xylose (% conv)
7.3 39.5 4.24 -1.1
Low Scenarios
Residence time (min) 5 39.0 4.29 0
Xylan to oligomer (% conv)
25 42.9 3.92 -8.4

41
Sensitivity
Production (MMGal/Yr)
PV
Parameter Values ($/Gal) Change (%)a
Xylan to Xylose (% conv)
63 39.6 4.23 -1.4
Saccharification
High Scenarios
Cell Cellulose to Glucose (% conv)
65 29.7 5.61 30.7
Low Scenarios
Cellulose to Glucose (% conv)
65 29.7 5.61 30.7
AFEX — 2007 EVD Scenario Base Case 46.2 3.69
Pretreatment
High Scenarios
Reactor temperature (oC)
110 46.1 3.69 0
Solids consistency (%)
70 46.2 4.16 12.7
Xylan to Oligomer (%conv)
20 46.2 3.69 0
Ammonia loading (ratio to dry stover)
1:0.8 46.2 3.69 0
Low Scenarios
Reactor temperature (oC)
80 46.0 3.68 -0.3
Solid consistency (%)
20 46.2 3.31 -10.3
Xylan to Xylose (%conv)
90 46.9 3.65 -1.1
Ammonia loading (ratio to dry stover)
1:1.3 46.2 3.70 0.3
Saccharification
High Scenarios
Xylan to Xylose (%conv)
55 45.8 3.80 3.0
Low Scenarios
Cellulose to Glucose (%conv)
75 43.2 3.87 4.9
a Percentage change of PV from 2007 EVD scenarios. b High and low refer to the value of each parameter with respect to the base case. Not all parameters were tested at both high and low scenarios.

42
Table C-2. Impact of Overall Process and Economic Parameters on PV
Sensitivity Parameters Base Case Low High
Value PV ($/gal) Value PV
($/gal) Value PV ($/gal)
Feedstock Cost ($/MT) 83 3.40 55 3.04 110 3.77 Pretreatment Reactor (MM$) 23 3.40 14 3.34 32.7 3.47 Installed Equipment Cost (MM$) 164.1 3.40 159 3.38 194.0 3.55 (Corresponding Installation factor) (2.58) (2.5) (3.05) Enzyme Cost ($/MT of broth) 507 3.40 256 3.05 1460 4.73 Electricity Price ($/kWh) 0.054 3.40 0.06 3.38 0.03 3.50 Enzyme Loading (mg/g protein) 31.3 3.40 20 3.15 33.3 3.45 Contingency (%) 20 3.40 10 3.31 30 3.50

43
Appendix D - Cost Analysis Result Summary
Table D-1. Cost Analysis Result Summary for Dilute Acid Pretreatment Processes
Ethanol Production Process Engineering Analysis UCR Dilute Acid - Corn Stover, Current Case
Dilute Acid Prehydrolysis with Saccharification and Cofermentation All Values in 2007$
Product Value $3.40 Ethanol Production (MM Gal. / Year) 53.4 Ethanol at 68°F
Ethanol Yield (Gal / Dry Metric Ton Feedstock) 76.3 Feedstock Cost $/Dry MetricTon $83
Internal Rate of Return (After-Tax) 10% Equity Percent of Total Investment 100%
Capital Costs Operating Costs (cents/gal ethanol) Feed Handling $10,900,000 Feedstock 108.4 Pretreatment $36,200,000 Biomass to Boiler 0.0 Saccharification & Fermentation $21,800,000 CSL 16.0 Distillation and Solids Recovery $26,100,000 Cellulase 69.5 Wastewater Treatment $3,500,000 Other Raw Materials 17.8 Storage $3,200,000 Waste Disposal 12.7 Boiler/Turbogenerator $56,100,000 Electricity -21.9 Utilities $6,300,000 Fixed Costs 18.5 Total Installed Equipment Cost $164,100,000 Capital Depreciation 30.5 Average Income Tax 26.7 Added Costsa $211,800,000 Average Return on Investment 62.2 (% of TCI) 56% Operating Costs ($/yr) Working Capital 49,030,000 Feedstock $57,900,000 Total Capital Investment $375,900,000 Biomass to Boiler $0 CSL $8,500,000 Installed Equipment Cost/Annual Gallon $3.07 Cellulase $37,100,000 Total Project Investment/Annual Gallon $7.04 Other Raw Matl. Costs $9,500,000 Waste Disposal $6,800,000 Loan Rate N/A Electricity -$11,700,000 Term (years) N/A Fixed Costs $9,900,000 Capital Charge Factor 0.170 Capital Depreciation $16,300,000 Average Income Tax $14,300,000 Denatured Fuel Prod. (MMgal / yr) 55.9 Average Return on Investment $33,300,000 Denatured Fuel Min. Sales Price $3.29 Excess Electricity (KWH/gal) 4.06 Denaturant Cost ($/gal denaturant) $0.739 Plant Electricity Use (KWH/gal) 2.23 Plant Steam Use (kg steam/gal) 17.5 Maximum Yields (100% of Theoretical) Boiler Feed–LHV (Btu/lb) 2,209 Ethanol Production (MM Gal/yr) 82.5 Boiler Feed–Water Fraction 0.542 Theoretical Yield (Gal/ton) 106.9 Specific Operating Conditions Current Yield (Actual/Theoretical) 65% Enzyme Loading (mg/g cellulose) 33.5 Saccharification Time (days) 5.0 Conversion Cellulose-->Glucose 0.9109 Fermentation Time (days) 2.0 a Added costs include indirect costs (engineering and supervision, construction expenses, legal and contractor fees) and contingency.

44
Table D-2. Cost Analysis Result Summary for Dilute Acid Pretreatment (High Solids) Processes
a Added costs include indirect costs (engineering and supervision, construction expenses, legal and contractor fees) and contingency.
Ethanol Production Process Engineering Analysis UCR Dilute Acid - Pretreatment yields based on NREL FY08 SOT Dilute Acid Prehydrolysis with Saccharification and Cofermentation
All Values in 2007$ Product Value $3.60
Ethanol Production (MM Gal. / Year) 50.8 Ethanol at 68°F Ethanol Yield (Gal / Dry Metric Ton Feedstock) 72.5
Feedstock Cost $/Dry Metric Ton $83 Internal Rate of Return (After-Tax) 10% Equity Percent of Total Investment 100%
Capital Costs Operating Costs (cents/gal ethanol) Feed Handling $10,900,000 Feedstock 114.0 Pretreatment $38,000,000 Biomass to Boiler 0.0 Saccharification & Fermentation $21,800,000 CSL 16.5 Distillation and Solids Recovery $25,700,000 Cellulase 73.1 Wastewater Treatment $5,800,000 Other Raw Materials 18.8 Storage $3,100,000 Waste Disposal 13.0 Boiler/Turbogenerator $57,600,000 Electricity -24.8 Utilities $6,600,000 Fixed Costs 19.8 Total Installed Equipment Cost $169,400,000 Capital Depreciation 33.3 Average Income Tax 29.0 Added Costsa $219,100,000 Average Return on Investment 67.5 (% of TCI) 56% Operating Costs ($/yr) Working Capital 50,670,000 Feedstock $57,900,000 Total Capital Investment $388,500,000 Biomass to Boiler $0 CSL $8,400,000 Installed Equipment Cost/Annual Gallon $3.34 Cellulase $37,100,000 Total Project Investment/Annual Gallon $7.65 Other Raw Matl. Costs $9,600,000 Waste Disposal $6,600,000 Loan Rate N/A Electricity -$12,600,000 Term (years) N/A Fixed Costs $10,100,000 Capital Charge Factor 0.169 Capital Depreciation $16,900,000 Average Income Tax $14,700,000 Denatured Fuel Prod. (MMgal / yr) 53.1 Average Return on Investment $34,200,000 Denatured Fuel Min. Sales Price $3.47 Denaturant Cost ($/gal denaturant) $0.739 Excess Electricity (KWH/gal) 4.58 Plant Electricity Use (KWH/gal) 2.39 Maximum Yields (100% of Theoretical) Ethanol Production (MM Gal/yr) 82.5 Plant Steam Use (kg steam/gal) 18.2 Theoretical Yield (Gal/ton) 106.9 Boiler Feed -- LHV (Btu/lb) 2,286 Current Yield (Actual/Theoretical) 62% Boiler Feed -- Water Fraction 0.539 Specific Operating Conditions Enzyme Loading (mg/g cellulose) 35.1 Saccharification Time (days) 5.0 Conversion Cellulose --> Glucose 0.9109 Fermentation Time (days) 2.0

45
Table D-3. Cost Analysis Result Summary for Hot Water Pretreatment Process
Ethanol Production Process Engineering Analysis Hot Water - Corn Stover, Current Case
Hot Water Prehydrolysis with Saccharification and Cofermentation All Values in 2007$
Product Value $4.44 Ethanol Production (MM Gal. / Year) 39.0 Ethanol at 68°F
Ethanol Yield (Gal / Dry Metric Ton Feedstock) 55.7 Feedstock Cost $/Dry MetricTon $83
Internal Rate of Return (After-Tax) 10% Equity Percent of Total Investment 100%
Capital Costs Operating Costs (cents/gal ethanol) Feed Handling $10,900,000 Feedstock 148.4 Pretreatment $6,700,000 Biomass to Boiler 0.0 Saccharification & Fermentation $30,200,000 CSL 28.5 Distillation and Solids Recovery $30,900,000 Cellulase 95.1 Wastewater Treatment $1,900,000 Other Raw Materials 5.1 Storage $3,300,000 Waste Disposal 3.5 Boiler/Turbogenerator $65,800,000 Electricity -29.0 Utilities $6,700,000 Fixed Costs 24.5 Total Installed Equipment Cost $156,300,000 Capital Depreciation 40.2 Average Income Tax 36.3 Added Costsa $204,800,000 Average Return on Investment 90.9 (% of TCI) 57% Operating Costs ($/yr) Working Capital 47,100,000 Feedstock $57,900,000 Total Capital Investment $361,100,000 Biomass to Boiler $0 CSL $11,100,000 Installed Equipment Cost/Annual Gallon $4.01 Cellulase $37,100,000 Total Project Investment/Annual Gallon $9.26 Other Raw Matl. Costs $2,000,000 Waste Disposal $1,400,000 Loan Rate N/A Electricity -$11,300,000 Term (years) N/A Fixed Costs $9,600,000 Capital Charge Factor 0.181 Capital Depreciation $15,700,000 Average Income Tax $14,200,000 Denatured Fuel Prod. (MMgal / yr) 40.8 Average Return on Investment $35,500,000 Denatured Fuel Min. Sales Price $4.27 Denaturant Cost ($/gal denaturant) $0.739 Excess Electricity (KWH/gal) 5.37 Plant Electricity Use (KWH/gal) 3.30 Maximum Yields (100% of Theoretical) Ethanol Production (MM Gal/yr) 82.5 Plant Steam Use (kg steam/gal) 40.7 Theoretical Yield (Gal/ton) 106.9 Boiler Feed -- LHV (Btu/lb) 2,354 Current Yield (Actual/Theoretical) 47% Boiler Feed -- Water Fraction 0.529 Specific Operating Conditions Enzyme Loading (mg/g cellulose) 33.1 Saccharification Time (days) 5.0 Conversion Cellulose --> Glucose 0.8997 Fermentation Time (days) 2.0 a Added costs include indirect costs (engineering and supervision, construction expenses, legal and contractor fees) and contingency.

46
Table D-4. Cost Analysis Result Summary for Two-Stage Dilute Acid Pretreatment Processes Ethanol Production Process Engineering Analysis
Corn Stover Design Report Case: 2020 Market Target Case (2002 Design Report Target Case) Dilute Acid Prehydrolysis and Hydrolysis
All Values in 2007$ Product Value $4.38
Ethanol Production (MM Gal. / Year) 32.8 Ethanol at 68°F Ethanol Yield (Gal / Dry Metric Ton Feedstock) 46.9
Feedstock Cost $/Dry Metric Ton $83 Internal Rate of Return (After-Tax) 10% Equity Percent of Total Investment 100%
Capital Costs Operating Costs (cents/gal ethanol) Feed Handling $10,900,000 Feedstock 176.4 Pretreatment $44,900,000 Biomass to Boiler 0.0 Saccharification & Fermentation $9,700,000 CSL 26.2 Distillation and Solids Recovery $26,700,000 Cellulase 0.0 Wastewater Treatment $4,600,000 Other Raw Materials 32.3 Storage $2,800,000 Waste Disposal 22.0 Boiler/Turbogenerator $66,200,000 Electricity -51.3 Utilities $6,900,000 Fixed Costs 31.0 Total Installed Equipment Cost $172,700,000 Capital Depreciation 51.8 Average Income Tax 45.8 Added Costsa $218,300,000 Average Return on Investment 103.5 (% of TCI) 56% Operating Costs ($/yr) Working Capital (WC) 51,000,000 Feedstock $57,900,000 Total Capital Investment $391,000,000 Biomass to Boiler $0 CSL $8,600,000 Installed Equipment Cost/Annual Gallon $5.26 Cellulase $0 Total Project Investment/Annual Gallon $11.92 Other Raw Matl. Costs $10,600,000 Waste Disposal $7,200,000 Loan Rate N/A Electricity -$16,800,000 Term (years) N/A Fixed Costs $10,200,000 Capital Charge Factor 0.169 Capital Depreciation $17,000,000 Average Income Tax $15,000,000 Denatured Fuel Prod. (MMgal / yr) 34.3 Average Return on Investment $34,000,000 Denatured Fuel Min. Sales Price $4.21 Denaturant Cost ($/gal denaturant) $0.739 Excess Electricity (KWH/gal) 9.50 Plant Electricity Use (KWH/gal) 3.46 Plant Steam Use (kg steam/gal) 35.4 Maximum Yields (100% of Theoretical) Boiler Feed -- LHV (Btu/lb) 2,379 Ethanol Production (MM Gal/yr) 82.5 Boiler Feed -- Water Fraction 0.521 Theoretical Yield (Gal/ton) 106.9 Specific Operating Conditions Current Yield (Actual/Theoretical) 40% Feed rate (dry tonnes/day) 2,000 Feed rate (dry tons/day) 2,205 Lignin Residue (dry tonnes/day) 979 Lignin Residue (dry tons/day) 1,079 Pretreatment Total Solids (wt%) 30 Saccharification Total Solids (wt%) 34 a Added costs include indirect costs (engineering and supervision, construction expenses, legal and contractor fees) and contingency.

47
Table D-5. Cost Analysis Result Summary for AFEX Pretreatment Processes
Ethanol Production Process Engineering Analysis Corn Stover Design Report Case: 2020 Market Target Case (2002 Design Report Target Case)
AFEX with Saccharification and Cofermentation All Values in 2007$
Product Value $3.69 Ethanol Production (MM Gal. / Year) 46.2 Ethanol at 68°F
Ethanol Yield (Gal / Dry Metric Ton Feedstock) 66.0 Feedstock Cost $/Dry Metric Ton $83 Internal Rate of Return (After-Tax) 10% Equity Percent of Total Investment 100%
Capital Costs Operating Costs (cents/gal ethanol) Feed Handling $10,900,000 Feedstock 125.3 Pretreatment $30,800,000 Biomass to Boiler 0.0 CSL 19.4 Saccharification & Fermentation $23,500,000 Cellulase 80.4 Distillation and Solids Recovery $27,500,000 Other Raw Materials 14.1 Wastewater Treatment $1,600,000 Waste Disposal 2.9 Storage $2,800,000 Electricity -36.7 Boiler/Turbogenerator $62,000,000 Fixed Costs 21.6 Utilities $8,400,000 Capital Depreciation 36.4 Total Installed Equipment Cost $167,400,000 Average Income Tax 32.0 Average Return on Investment 73.4 Added Costsa $218,600,000 Operating Costs ($/yr) (% of TCI) 57% Feedstock $57,900,000 Working Capital 50,350,000 Biomass to Boiler $0 Total Capital Investment $386,000,000 CSL $8,900,000 Cellulase $37,100,000 Installed Equipment Cost/Annual Gallon $3.63 Other Raw Matl. Costs $6,500,000 Total Project Investment/Annual Gallon $8.36 Waste Disposal $1,400,000 Electricity -$16,900,000 Loan Rate N/A Fixed Costs $10,000,000 Term (years) N/A Capital Depreciation $16,800,000 Capital Charge Factor 0.170 Average Income Tax $14,800,000 Average Return on Investment $33,900,000 Denatured Fuel Prod. (MMgal / yr) 48.3 Excess Electricity (KWH/gal) 5.23 Denatured Fuel Min. Sales Price $3.56 Plant Electricity Use (KWH/gal) 2.57 Denaturant Cost ($/gal denaturant) $0.739 Plant Steam Use (kg steam/gal) 35.9 Boiler Feed -- LHV (Btu/lb) 2,295 Maximum Yields (100% of Theoretical) Boiler Feed -- Water Fraction 0.538 Ethanol Production (MM Gal/yr) 82.5 Specific Operating Conditions Theoretical Yield (Gal/ton) 106.9 Feed rate (dry tonnes/day) 2,000 Current Yield (Actual/Theoretical) 56% Feed rate (dry tons/day) 2,205 Lignin Residue (dry tonnes/day) 730 Lignin Residue (dry tons/day) 804 Pretreatment Total Solids (wt%) 48 Saccharification Total Solids (wt%) 20 a Added costs include indirect costs (engineering and supervision, construction expenses, legal and contractor fees) and contingency.

48
Table D-6. Cost Analysis Result Summary for On-site Enzyme Production Processes
Ethanol Production Process Engineering Analysis UCR Dilute Acid - Corn Stover, Current Case
Dilute Acid Prehydrolysis with Saccharification and Cofermentation (On-site Enzyme Production) All Values in 2007$
Product Value $3.54 Ethanol Production (MM Gal. / Year) 47.4 Ethanol at 68°F
Ethanol Yield (Gal / Dry Metric Ton Feedstock) 67.7 Feedstock Cost $/Dry Metric Ton $83
Internal Rate of Return (After-Tax) 10% Equity Percent of Total Investment 100%
Capital Costs Operating Costs (cents/gal ethanol) Feed Handling $10,900,000 Feedstock 122.1 Pretreatment $36,200,000 Biomass to Boiler 0.0 On-site Enzyme Production $23,700,000 CSL 19.8 Saccharification & Fermentation $21,800,000 Cellulase 0.0 Distillation and Solids Recovery $25,400,000 Other Raw Materials 20.4 Wastewater Treatment $3,500,000 Waste Disposal 14.3 Storage $2,500,000 Electricity 1.6 Boiler/Turbogenerator $57,200,000 Fixed Costs 22.7 Utilities $6,800,000 Capital Depreciation 39.9 Total Installed Equipment Cost $187,800,000 Average Income Tax 34.0 Average Return on Investment 79.2 Added Costsa $246,400,000 Operating Costs ($/yr) (% of TCI) 57% Feedstock $57,900,000 Working Capital 56,630,000 Biomass to Boiler $0 Total Capital Investment $434,200,000 CSL $9,400,000 Cellulase $0 Installed Equipment Cost/Annual Gallon $3.96 Other Raw Matl. Costs $9,700,000 Total Project Investment/Annual Gallon $9.16 Waste Disposal $6,800,000 Electricity $800,000 Loan Rate N/A Fixed Costs $10,700,000 Term (years) N/A Capital Depreciation $18,900,000 Capital Charge Factor 0.167 Average Income Tax $16,100,000 Average Return on Investment $37,500,000 Denatured Fuel Prod. (MMgal / yr) 49.6 Denatured Fuel Min. Sales Price $3.42 Excess Electricity (KWH/gal) -0.30 Denaturant Cost ($/gal denaturant) $0.739 Plant Electricity Use (KWH/gal) 7.63 Plant Steam Use (kg steam/gal) 19.7 Boiler Feed -- LHV (Btu/lb) 2,239 Maximum Yields (100% of Theoretical) Boiler Feed -- Water Fraction 0.538 Ethanol Production (MM Gal/yr) Specific Operating Conditions Theoretical Yield (Gal/ton) 82.5 Enzyme Loading (mg/g cellulose) 0.0 Current Yield (Actual/Theoretical) 106.9 Saccharification Time (days) 5.0 57% Conversion Cellulose --> Glucose 0.9109 Fermentation Time (days) 2.0 a Added costs include indirect costs (engineering and supervision, construction expenses, legal and contractor fees) and contingency.

49
Table D-7. Cost Analysis Result Summary for Pervaporation Purification Processes
Ethanol Production Process Engineering Analysis Corn Stover Design Report Case: 2020 Market Target Case (2002 Design Report Target Case) Dilute Acid Prehydrolysis with Saccharification and Cofermentation (Pervaporation Separation)
All Values in 2007$ Product Value $3.75
Ethanol Production (MM Gal. / Year) 53.9 Ethanol at 68°F Ethanol Yield (Gal / Dry Metric Ton Feedstock) 77.0
Feedstock Cost $/Dry MetricTon $83 Internal Rate of Return (After-Tax) 10% Equity Percent of Total Investment 100%
Capital Costs Operating Costs (cents/gal ethanol) Feed Handling $10,900,000 Feedstock 107.5 Pretreatment $36,200,000 Biomass to Boiler 0.0 CSL 15.8 Saccharification & Fermentation $21,900,000 Cellulase 68.9 Distillation and Solids Recovery $70,800,000 Other Raw Materials 18.4 Wastewater Treatment $3,300,000 Waste Disposal 12.6 Storage $3,300,000 Electricity -25.3 Boiler/Turbogenerator $55,900,000 Fixed Costs 21.4 Utilities $7,000,000 Capital Depreciation 40.5 Total Installed Equipment Cost $209,200,000 Average Income Tax 34.1 Average Return on Investment 81.0 Added Costsa $226,500,000 Operating Costs ($/yr) (% of TCI) 52% Feedstock $57,900,000 Working Capital $65,350,000 Biomass to Boiler $0 Total Capital Investment $501,000,000 CSL $8,500,000 Cellulase $37,100,000 Installed Equipment Cost/Annual Gallon $3.88 Other Raw Matl. Costs $9,900,000 Total Project Investment/Annual Gallon $8.09 Waste Disposal $6,800,000 Electricity -$13,600,000 Loan Rate N/A Fixed Costs $11,500,000 Term (years) N/A Capital Depreciation $21,800,000 Capital Charge Factor 0.192 Average Income Tax $18,400,000 Average Return on Investment $43,600,000 Denatured Fuel Prod. (MMgal / yr) 56.4 Excess Electricity (KWH/gal) 4.68 Denatured Fuel Min. Sales Price $3.61 Plant Electricity Use (KWH/gal) 2.25 Denaturant Cost ($/gal denaturant) $0.739 Plant Steam Use (kg steam/gal) 11.9 Maximum Yields (100% of Theoretical) Boiler Feed -- LHV (Btu/lb) 2,193 Ethanol Production (MM Gal/yr) 82.5 Boiler Feed -- Water Fraction 0.543 Theoretical Yield (Gal/ton) 106.9 Specific Operating Conditions Current Yield (Actual/Theoretical) 65% Feed rate (dry tonnes/day) 2,000 Feed rate (dry tons/day) 2,205 Lignin Residue (dry tonnes/day) 626 Lignin Residue (dry tons/day) 690 Pretreatment Total Solids (wt%) 30 Saccharification Total Solids (wt%) 20 a Added costs include indirect costs (engineering and supervision, construction expenses, legal and contractor fees) and contingency.

50
Table D-8. Cost Analysis Result Summary for Separate C5 and C6 Fermentation Processes
Ethanol Production Process Engineering Analysis Corn Stover Design Case: 2005 Post Enzyme-Subcontract Case - 90% Cellulose in 7 days @ 1.9X loading Dilute Acid Prehydrolysis with Saccharification and Cofermentation (Separate C5 & C6 Sugar fermentation)
All Values in 2007$ Product Value $3.67
Ethanol Production (MM Gal. / Year) 55.5 Ethanol at 68°F Ethanol Yield (Gal / Dry Metric Ton Feedstock) 79.3
Feedstock Cost $/Dry MetricTon $83 Internal Rate of Return (After-Tax) 10% Equity Percent of Total Investment 100%
Capital Costs Operating Costs (cents/gal ethanol) Feed Handling $11,400,000 Feedstock 104.3 Pretreatment $34,200,000 Biomass to Boiler 0.0 CSL 33.1 Saccharification & Fermentation $29,600,000 Cellulase 66.9 Distillation and Solids Recovery $27,300,000 Other Raw Materials 35.9 Wastewater Treatment $3,100,000 Waste Disposal 2.6 Storage $5,100,000 Electricity -11.6 Boiler/Turbogenerator $50,900,000 Fixed Costs 18.0 Utilities $6,200,000 Capital Depreciation 30.3 Total Installed Equipment Cost $167,800,000 Average Income Tax 26.0 Average Return on Investment 61.6 Added Costsa $218,000,000 Operating Costs ($/yr) (% of TCI) 57% Feedstock $57,900,000 Working Capital $50,320,000 Biomass to Boiler $0 Total Capital Investment $385,800,000 CSL $18,400,000 Cellulase $37,100,000 Installed Equipment Cost/Annual Gallon $3.02 Other Raw Matl. Costs $19,900,000 Total Project Investment/Annual Gallon $6.95 Waste Disposal $1,400,000 Electricity -$6,500,000 Loan Rate N/A Fixed Costs $10,000,000 Term (years) N/A Capital Depreciation $16,800,000 Capital Charge Factor 0.170 Average Income Tax $14,400,000 Average Return on Investment $34,200,000 Denatured Fuel Prod. (MMgal / yr) 58.1 Denatured Fuel Min. Sales Price $3.54 Excess Electricity (KWH/gal) 2.16 Denaturant Cost ($/gal denaturant) $0.739 Plant Electricity Use (KWH/gal) 2.33 Plant Steam Use (kg steam/gal) 19.9 Boiler Feed -- LHV (Btu/lb) 1,489 Maximum Yields (100% of Theoretical) Boiler Feed -- Water Fraction 0.547 Ethanol Production (MM Gal/yr) 82.5 Specific Operating Conditions Theoretical Yield (Gal/ton) 106.9 Enzyme Loading (mg/g cellulose) 33.4 Current Yield (Actual/Theoretical) 67% Saccharification Time (days) 5.0 Conversion Cellulose --> Glucose 0.9109 Fermentation Time (days) 2.0
a Added costs include indirect costs (engineering and supervision, construction expenses, legal and contractor fees) and contingency.

51
Appendix E - Equipment List and Costs, Installation Factors, and Installed Equipment Costs for Dilute Acid Pretreatment Processes
Table E-1. Equipment Lists and Costs for Dilute Acid Pretreatment Processes
Equip-ment ID
Number Required
Spares Nos Equipment Name
Scaling Stream Flow
(Kg/hr)
New Stream Flow
Size Ratio
Original Equip Cost (per unit)
Base Year
Total Original
Equip Cost (Req'd & Spare) in Base Year
Scaling Expo-nent
Scaled Cost in Base Year
Installa-tion
Factor
Installed Cost in Base Year
Installed Cost in 2007$
C-101 2 Bale Transport Conveyor 98,040 111,111 1.13 $400,000 2000 $800,000 0.6 $862,388 1.62 $1,397,068 $1,862,521
C-102 2 Bale Unwrapping Conveyor 98,040 111,111 1.13 $150,000 2000 $300,000 0.6 $323,395 1.19 $384,840 $513,056
C-103 1 Belt Press Discharge Conveyor 98,040 111,111 1.13 $50,000 2000 $50,000 0.6 $53,899 1.89 $101,870 $135,809
C-104 4 Shredder Feed Conveyor 98,040 111,111 1.13 $60,000 2000 $240,000 0.6 $258,716 1.38 $357,028 $475,978
M-101 2 Truck Scales 98,040 111,111 1.13 $34,000 2000 $68,000 0.6 $73,303 2.47 $181,058 $241,380
M-102 4 1 Truck Unloading Forklift 98,040 111,111 1.13 $18,000 2000 $90,000 1 $101,999 1 $101,999 $135,982
M-103 4 Bale Moving Forklift 98,040 111,111 1.13 $18,000 2000 $72,000 1 $81,599 1 $81,599 $108,785
M-104 2 Corn Stover Wash Table 98,040 111,111 1.13 $104,000 2000 $208,000 0.6 $224,221 2.39 $535,888 $714,426
M-105 4 Shredder 98,040 111,111 1.13 $302,000 2000 $1,208,000 0.6 $1,302,205 1.38 $1,797,043 $2,395,754
M-106 1 Concrete Feedstock-Storage Slab
98,040 111,111 1.13 $450,655 2000 $450,655 1 $510,738 2.2 $1,123,624 $1,497,976
M-107 1 Polymer Feed System 98,040 111,111 1.13 $30,000 2000 $30,000 0.6 $32,340 2.28 $73,734 $98,300
P-101 2 1 Wash Table Pump 98,040 111,111 1.13 $20,000 2000 $60,000 0.79 $66,236 3.87 $256,332 $341,732
P-102 2 1 Wash Water Pump 98,040 111,111 1.13 $15,000 2000 $45,000 0.79 $49,677 5.19 $257,822 $343,719
P-103 1 1 Clarifier Underflow Pump 98,040 111,111 1.13 $6,000 2000 $12,000 0.79 $13,247 13.41 $177,644 $236,828
P-104 1 1 Clarified Water Pump 98,040 111,111 1.13 $15,000 2000 $30,000 0.79 $33,118 7.07 $234,143 $312,151
P-105 1 1 Belt Press Sump Pump 98,040 111,111 1.13 $19,000 2000 $38,000 0.79 $41,949 2.92 $122,492 $163,301
S-101 1 Clarifier Thickener 98,040 111,111 1.13 $135,000 2000 $135,000 0.6 $145,528 1.51 $219,747 $292,959

52
Equip-ment ID
Number Required
Spares Nos Equipment Name
Scaling Stream Flow
(Kg/hr)
New Stream Flow
Size Ratio
Original Equip Cost (per unit)
Base Year
Total Original
Equip Cost (Req'd & Spare) in Base Year
Scaling Expo-nent
Scaled Cost in Base Year
Installa-tion
Factor
Installed Cost in Base Year
Installed Cost in 2007$
S-102 1 Belt Press 98,040 111,111 1.13 $100,000 2000 $100,000 0.6 $107,798 1.25 $134,748 $179,641
S-103 1 Magnetic Separator 159,948 111,111 0.69 $13,863 1998 $13,863 0.6 $11,141 1.3 $14,483 $19,537
T-101 1 Wash Water Tank 98,040 111,111 1.13 $50,000 2000 $50,000 0.51 $53,296 2.8 $149,227 $198,945
T-102 1 Clarifier Thickener Tank 98,040 111,111 1.13 $135,000 2000 $135,000 0.51 $143,898 3.04 $437,450 $583,192
A100 Subtotal $4,135,518 $4,490,691 1.81 $8,139,839 $10,851,970
A-201 1 In-line Sulfuric Acid Mixer 55,308 102,884 1.86 $1,900 1997 $1,900 0.48 $2,559 1 $2,559 $3,479
A-205 1 Hydrolyzate Mix Tank Agitator 358,810 236,880 0.66 $36,000 1997 $36,000 0.51 $29,129 1.2 $34,955 $47,517
A-209 1 Overliming Tank Agitator 167,050 301,831 1.81 $19,800 1997 $19,800 0.51 $26,773 1.3 $34,805 $47,313
A-224 1 Reacidification Tank Agitator 167,280 306,440 1.83 $65,200 1997 $65,200 0.51 $88,782 1.2 $106,539 $144,827
A-232 1 Reslurrying Tank Agitator 358,810 416,118 1.16 $36,000 1997 $36,000 0.51 $38,826 1.2 $46,591 $63,335
C-201 1 Hydrolyzate Screw Conveyor 225,140 236,880 1.05 $59,400 1997 $59,400 0.78 $61,802 1.3 $80,343 $109,217
C-202 1 Hydrolyzate Washed Solids Belt Conveyor
91,633 77,862 0.85 $80,000 2000 $80,000 0.76 $70,686 1.45 $102,495 $136,643
C-225 1 Lime Solids Feeder $3,900 1997 $3,900 $3,900 1.3 $5,070 $6,892
H-200 1 Hydrolyzate Cooler 1,988 2,288 1.15 $45,000 1997 $45,000 0.51 $48,340 2.1 $101,515 $137,997
H-201 2 1 Beer Column Feed Economizer 12,532 12,217 0.97 $132,800 1997 $398,400 0.68 $391,574 2.1 $822,304 $1,117,823
H-205 1 Pneumapress Vent Condensor 120 176 1.46 $15,385 2000 $15,385 0.68 $19,940 2.1 $41,874 $55,825
H-244 2 1 Waste Vapor Condensor 12,532 1,710 0.14 $132,800 1997 $398,400 0.68 $102,824 2.1 $215,931 $293,532
M-202 3 Prehydrolysis/Screw Feeder/Reactor 271,313 281,602 1.04 $2,454,982 2000 $7,364,947 0.6 $7,531,285 2.29 $17,246,643 $22,992,607
P-201 1 1 Sulfuric Acid 1,647 8,300 5.04 $4,800 1997 $9,600 0.79 $34,446 2.8 $96,450 $131,112
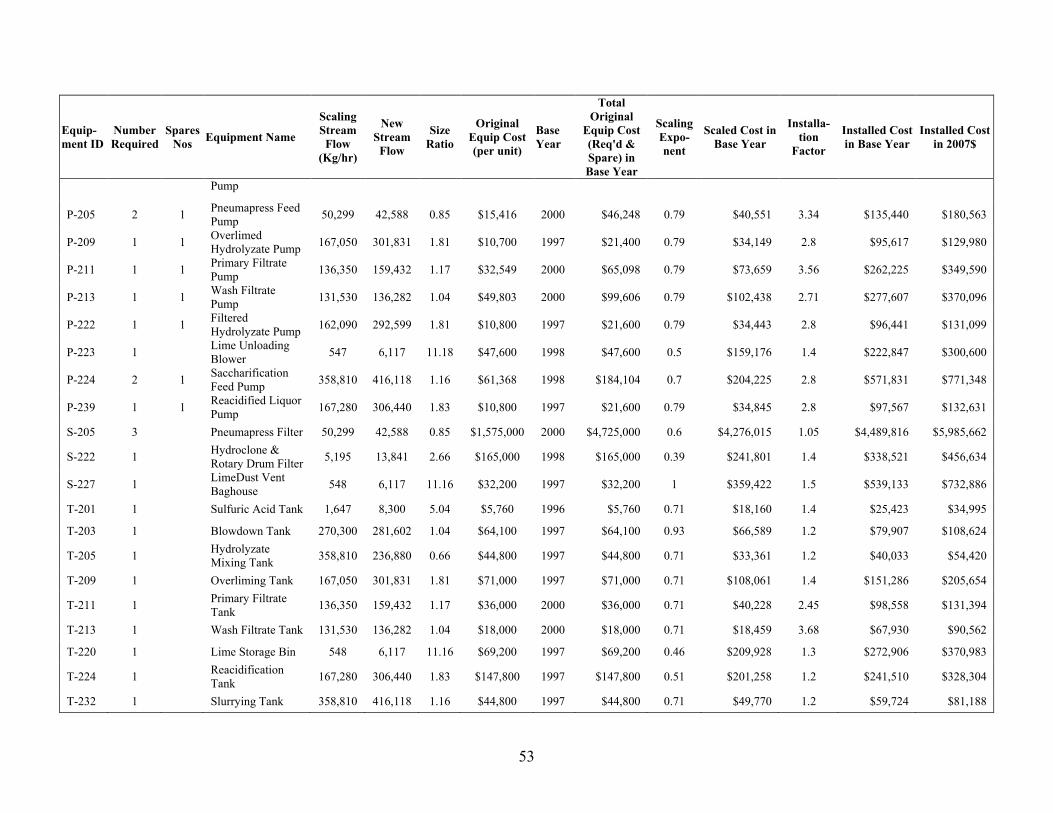
53
Equip-ment ID
Number Required
Spares Nos Equipment Name
Scaling Stream Flow
(Kg/hr)
New Stream Flow
Size Ratio
Original Equip Cost (per unit)
Base Year
Total Original
Equip Cost (Req'd & Spare) in Base Year
Scaling Expo-nent
Scaled Cost in Base Year
Installa-tion
Factor
Installed Cost in Base Year
Installed Cost in 2007$
Pump
P-205 2 1 Pneumapress Feed Pump 50,299 42,588 0.85 $15,416 2000 $46,248 0.79 $40,551 3.34 $135,440 $180,563
P-209 1 1 Overlimed Hydrolyzate Pump 167,050 301,831 1.81 $10,700 1997 $21,400 0.79 $34,149 2.8 $95,617 $129,980
P-211 1 1 Primary Filtrate Pump 136,350 159,432 1.17 $32,549 2000 $65,098 0.79 $73,659 3.56 $262,225 $349,590
P-213 1 1 Wash Filtrate Pump 131,530 136,282 1.04 $49,803 2000 $99,606 0.79 $102,438 2.71 $277,607 $370,096
P-222 1 1 Filtered Hydrolyzate Pump 162,090 292,599 1.81 $10,800 1997 $21,600 0.79 $34,443 2.8 $96,441 $131,099
P-223 1 Lime Unloading Blower 547 6,117 11.18 $47,600 1998 $47,600 0.5 $159,176 1.4 $222,847 $300,600
P-224 2 1 Saccharification Feed Pump 358,810 416,118 1.16 $61,368 1998 $184,104 0.7 $204,225 2.8 $571,831 $771,348
P-239 1 1 Reacidified Liquor Pump 167,280 306,440 1.83 $10,800 1997 $21,600 0.79 $34,845 2.8 $97,567 $132,631
S-205 3 Pneumapress Filter 50,299 42,588 0.85 $1,575,000 2000 $4,725,000 0.6 $4,276,015 1.05 $4,489,816 $5,985,662
S-222 1 Hydroclone & Rotary Drum Filter 5,195 13,841 2.66 $165,000 1998 $165,000 0.39 $241,801 1.4 $338,521 $456,634
S-227 1 LimeDust Vent Baghouse 548 6,117 11.16 $32,200 1997 $32,200 1 $359,422 1.5 $539,133 $732,886
T-201 1 Sulfuric Acid Tank 1,647 8,300 5.04 $5,760 1996 $5,760 0.71 $18,160 1.4 $25,423 $34,995
T-203 1 Blowdown Tank 270,300 281,602 1.04 $64,100 1997 $64,100 0.93 $66,589 1.2 $79,907 $108,624
T-205 1 Hydrolyzate Mixing Tank 358,810 236,880 0.66 $44,800 1997 $44,800 0.71 $33,361 1.2 $40,033 $54,420
T-209 1 Overliming Tank 167,050 301,831 1.81 $71,000 1997 $71,000 0.71 $108,061 1.4 $151,286 $205,654
T-211 1 Primary Filtrate Tank 136,350 159,432 1.17 $36,000 2000 $36,000 0.71 $40,228 2.45 $98,558 $131,394
T-213 1 Wash Filtrate Tank 131,530 136,282 1.04 $18,000 2000 $18,000 0.71 $18,459 3.68 $67,930 $90,562
T-220 1 Lime Storage Bin 548 6,117 11.16 $69,200 1997 $69,200 0.46 $209,928 1.3 $272,906 $370,983
T-224 1 Reacidification Tank 167,280 306,440 1.83 $147,800 1997 $147,800 0.51 $201,258 1.2 $241,510 $328,304
T-232 1 Slurrying Tank 358,810 416,118 1.16 $44,800 1997 $44,800 0.71 $49,770 1.2 $59,724 $81,188

54
Equip-ment ID
Number Required
Spares Nos Equipment Name
Scaling Stream Flow
(Kg/hr)
New Stream Flow
Size Ratio
Original Equip Cost (per unit)
Base Year
Total Original
Equip Cost (Req'd & Spare) in Base Year
Scaling Expo-nent
Scaled Cost in Base Year
Installa-tion
Factor
Installed Cost in Base Year
Installed Cost in 2007$
A200 Subtotal $14,464,848 $14,757,407 1.84 $27,102,397 $36,235,330
A-300 12 Ethanol Fermentor Agitator $19,676 1996 $236,112 $236,112 1.2 $283,334 $390,002
A-301 1 Seed Hold Tank Agitator 41,777 40,806 0.98 $12,551 1996 $12,551 0.51 $12,401 1.2 $14,882 $20,484
A-304 2 4th Seed Vessel Agitator 41,777 40,806 0.98 $11,700 1997 $23,400 0.51 $23,121 1.2 $27,745 $37,716
A-305 2 5th Seed Vessel Agitator 41,777 40,806 0.98 $10,340 1996 $20,680 0.51 $20,433 1.2 $24,520 $33,751
A-306 2 Beer Surge Tank Agitator 381,700 429,208 1.12 $48,700 1998 $97,400 0.51 $103,405 1.2 $124,086 $167,381
A-310 30 Saccharification Tank Agitator $19,676 1996 $590,280 $590,280 1.2 $708,336 $975,006
F-300 6 Ethanol Fermentor $493,391 1998 $2,960,346 $2,960,346 1.2 $3,552,415 $4,791,884
F-301 2 1st Seed Fermentor $14,700 1997 $29,400 $29,400 2.8 $82,320 $111,904
F-302 2 2nd Seed Fermentor $32,600 1997 $65,200 $65,200 2.8 $182,560 $248,168
F-303 2 3rd Seed Fermentor $81,100 1997 $162,200 $162,200 2.8 $454,160 $617,376
F-304 2 4th Seed Fermentor 41,777 40,806 0.98 $39,500 1997 $79,000 0.93 $77,291 1.2 $92,749 $126,081
F-305 2 5th Seed Fermentor 41,777 40,806 0.98 $147,245 1998 $294,490 0.51 $290,978 1.2 $349,174 $471,004
H-300 6 1 Fermentation Cooler 67,820 129,602 1.91 $4,000 1997 $28,000 0.78 $46,402 2.1 $97,444 $132,463
H-301 1 1 Hydrolyzate Heater 256 376 1.47 $22,400 2001 $44,800 0.68 $58,229 2.1 $122,282 $162,939
H-302 3 Saccharified Slurry Cooler 3,765 0 0.00 $25,409 1998 $76,227 0.78 $0 2.1 $0 $0
H-304 1 4th Seed Fermentor Coil 0.1380 0.2846 2.06 $3,300 1997 $3,300 0.83 $6,017 1.2 $7,220 $9,815
H-305 1 5th Seed Fermentor Coil 0.1380 0.2846 2.06 $18,800 1997 $18,800 0.98 $38,208 1.2 $45,849 $62,326
H-310 15 1 Saccharification Cooler 67,820 1,696 0.03 $4,000 1997 $64,000 0.78 $3,603 2.1 $7,566 $10,286

55
Equip-ment ID
Number Required
Spares Nos Equipment Name
Scaling Stream Flow
(Kg/hr)
New Stream Flow
Size Ratio
Original Equip Cost (per unit)
Base Year
Total Original
Equip Cost (Req'd & Spare) in Base Year
Scaling Expo-nent
Scaled Cost in Base Year
Installa-tion
Factor
Installed Cost in Base Year
Installed Cost in 2007$
P-300 6 1 Fermentation Recirc/Transfer Pump
67,737 129,602 1.91 $8,000 1997 $56,000 0.79 $93,497 2.8 $261,792 $355,875
P-301 1 1 Seed Hold Transfer Pump 41,777 40,806 0.98 $22,194 1998 $44,388 0.7 $43,663 1.4 $61,128 $82,457
P-302 2 Seed Transfer Pump 41,777 40,806 0.98 $54,088 1998 $108,176 0.7 $106,409 1.4 $148,973 $200,951
P-306 1 1 Beer Transfer Pump 381,701 429,208 1.12 $17,300 1997 $34,600 0.79 $37,960 2.8 $106,287 $144,484
P-310 15 1 Saccharification Recirc/Transfer Pump
67,737 1,696 0.03 $8,000 1997 $128,000 0.79 $6,952 2.8 $19,465 $26,461
T-301 1 Seed Hold Tank 41,777 40,806 0.98 $161,593 1998 $161,593 0.51 $159,666 1.2 $191,599 $258,450
T-306 1 Beer Storage Tank 381,700 429,208 1.12 $237,700 1998 $237,700 0.71 $258,345 1.2 $310,014 $418,181
T-310 15 Saccharification Tank $493,391 1998 $7,400,865 $7,400,865 1.2 $8,881,038 $11,979,711
A300 Subtotal $12,977,508 $12,830,984 1.3 $16,156,940 $21,835,156
A400 Subtotal $0 $0 $0 $0
A-530 1 Recycled Water Tank Agitator 179,446 263,502 1.47 $5,963 1998 $5,963 0.51 $7,254 1.3 $9,430 $12,720
C-501 1 Lignin Wet Cake Screw 99,199 47,373 0.48 $31,700 1997 $31,700 0.78 $17,811 1.4 $24,936 $33,897
D-501 1 Beer Column 17 20 1.17 $478,100 1998 $478,100 0.68 $531,355 2.1 $1,115,846 $1,505,174
D-502 1 Rectification Column 56,477 62,095 1.10 $525,800 1996 $525,800 0.68 $560,821 2.1 $1,177,724 $1,621,105
E-501 2 1st Effect Evaporation 22,278 32,408 1.45 $544,595 1996 $1,089,190 0.68 $1,405,364 2.1 $2,951,265 $4,062,339
E-502 1 2nd Effect Evaporation 22,278 32,408 1.45 $435,650 1996 $435,650 0.68 $562,112 2.1 $1,180,436 $1,624,839
E-503 2 3rd Effect Evaporation 22,278 32,408 1.45 $435,650 1996 $871,300 0.68 $1,124,224 2.1 $2,360,871 $3,249,677
H-501 1 1 Beer Column Reboiler
-28.3092 -32 1.14 $158,374 1996 $316,748 0.68 $346,704 2.1 $728,079 $1,002,181

56
Equip-ment ID
Number Required
Spares Nos Equipment Name
Scaling Stream Flow
(Kg/hr)
New Stream Flow
Size Ratio
Original Equip Cost (per unit)
Base Year
Total Original
Equip Cost (Req'd & Spare) in Base Year
Scaling Expo-nent
Scaled Cost in Base Year
Installa-tion
Factor
Installed Cost in Base Year
Installed Cost in 2007$
H-502 1 Rectification Column Reboiler -3.5547 -4 0.99 $29,600 1997 $29,600 0.68 $29,382 2.1 $61,702 $83,876
H-504 1 Beer Column Condenser 1.0002 0 0.45 $29,544 1996 $29,544 0.68 $17,260 2.1 $36,246 $49,892
H-505 1 Start-up Rect. Column Condenser 17.6595 19 1.06 $86,174 1996 $86,174 0.68 $89,788 2.1 $188,555 $259,542
H-512 1 1 Beer Column Feed Interchanger 909 914 1.01 $19,040 1996 $38,080 0.68 $38,214 2.1 $80,250 $110,462
H-517 1 1 Evaporator Condenser 24 33 1.35 $121,576 1996 $243,152 0.68 $297,600 2.1 $624,959 $860,240
M-503 1 Molecular Sieve (9 pieces) 20,491 19,052 0.93 $2,700,000 1998 $2,700,000 0.7 $2,565,867 1 $2,565,867 $3,461,120
P-501 1 1 Beer Column Bottoms Pump 5,053 6,003 1.19 $42,300 1997 $84,600 0.79 $96,938 2.8 $271,425 $368,970
P-503 1 1 Beer Column Reflux Pump 1.0002 0.4537 0.45 $1,357 1998 $2,714 0.79 $1,454 2.8 $4,070 $5,490
P-504 1 1 Rectification Column Bottoms Pump
31,507 36,584 1.16 $4,916 1998 $9,832 0.79 $11,064 2.8 $30,978 $41,787
P-505 1 1 Rectification Column Reflux Pump
18 19 1.06 $4,782 1998 $9,564 0.79 $10,030 2.8 $28,084 $37,883
P-511 2 1 1st Effect Pump 278,645 311,140 1.12 $19,700 1997 $59,100 0.79 $64,481 2.8 $180,547 $245,432
P-512 1 1 2nd Effect Pump 91,111 137,819 1.51 $13,900 1997 $27,800 0.79 $38,551 2.8 $107,944 $146,736
P-513 2 1 3rd Effect Pump 48,001 78,409 1.63 $8,000 1997 $24,000 0.79 $35,365 2.8 $99,022 $134,608
P-514 1 1 Evaporator Condensate Pump 140,220 181,051 1.29 $12,300 1997 $24,600 0.79 $30,104 2.8 $84,290 $114,582
P-515 1 Scrubber Bottoms Pump 15,377 18,179 1.18 $2,793 1998 $2,793 0.79 $3,188 2.8 $8,926 $12,040
P-530 1 1 Recycled Water Pump 179,446 263,502 1.47 $10,600 1997 $21,200 0.79 $28,718 2.8 $80,409 $109,306
S-505 4 Pneumapress Filter 26,601 18,737 0.70 $1,418,750 2000 $5,675,000 0.6 $4,598,800 1.04 $4,782,752 $6,376,193
T-503 1 Beer Column Relfux Drum 1.0002 0 0.45 $11,900 1997 $11,900 0.93 $5,706 2.1 $11,982 $16,288
T-505 1 Rectification Column Reflux 17.6627 19 1.06 $45,600 1997 $45,600 0.72 $47,621 2.1 $100,005 $135,944

57
Equip-ment ID
Number Required
Spares Nos Equipment Name
Scaling Stream Flow
(Kg/hr)
New Stream Flow
Size Ratio
Original Equip Cost (per unit)
Base Year
Total Original
Equip Cost (Req'd & Spare) in Base Year
Scaling Expo-nent
Scaled Cost in Base Year
Installa-tion
Factor
Installed Cost in Base Year
Installed Cost in 2007$
Drum
T-512 1 Vent Scrubber 18,523 18,916 1.02 $99,000 1998 $99,000 0.78 $100,635 2.1 $211,335 $285,071
T-514 1 Evaporator Condensate Drum 164,760 181,051 1.10 $37,200 1998 $37,200 0.93 $40,609 2.1 $85,279 $115,034
T-530 1 Recycled Water Tank 179,446 263,502 1.47 $14,515 1998 $14,515 0.745 $19,325 1.4 $27,055 $36,495
A500 Subtotal $13,030,419 $12,726,345 1.51 $19,220,269 $26,118,926
A-602 1 Equalization Basin Agitator 188,129 85,599 0.46 $28,400 1997 $28,400 0.51 $19,007 1.2 $22,808 $31,005
A-606 1 Anaerobic Agitator 810,250 401,778 0.50 $30,300 1997 $30,300 0.51 $21,188 1.2 $25,425 $34,562
A-608 16 Aerobic Lagoon Agitator 812 108 0.13 $31,250 1998 $500,000 0.51 $178,402 1.4 $249,763 $336,908
C-614 1 Aerobic Sludge Screw 978 112 0.11 $5,700 1997 $5,700 0.78 $1,051 1.4 $1,471 $2,000
H-602 1 Anaerobic Digestor Feed Cooler
7,627 3,155 0.41 $128,600 1997 $128,600 0.74 $66,913 2.1 $140,518 $191,017
M-604 1 Nutrient Feed System $31,400 1998 $31,400 $31,400 2.58 $81,012 $109,278
M-606 1 Biogas Emergency Flare 2,572 292 0.11 $20,739 1998 $20,739 0.6 $5,620 1.68 $9,442 $12,737
M-612 1 Filter Precoat System $3,000 1998 $3,000 $3,000 1.4 $4,200 $5,665
P-602 1 1 Anaerobic Reactor Feed Pump 188,129 85,599 0.46 $11,400 1997 $22,800 0.79 $12,240 2.8 $34,271 $46,587
P-606 1 1 Aerobic Digestor Feed Pump 185,782 85,335 0.46 $10,700 1997 $21,400 0.79 $11,574 2.8 $32,408 $44,055
P-608 1 Aerobic Sludge Recycle Pump 5,862 679 0.12 $11,100 1997 $11,100 0.79 $2,022 1.4 $2,831 $3,848
P-610 1 Aerobic Sludge Pump 5,862 679 0.12 $11,100 1997 $11,100 0.79 $2,022 1.4 $2,831 $3,848
P-611 1 1 Aerobic Digestion Outlet Pump 187,827 85,560 0.46 $10,700 1997 $21,400 0.79 $11,498 2.8 $32,196 $43,766
P-614 1 1 Sludge Filtrate Recycle Pump 4,885 567 0.12 $6,100 1997 $12,200 0.79 $2,226 2.8 $6,234 $8,474

58
Equip-ment ID
Number Required
Spares Nos Equipment Name
Scaling Stream Flow
(Kg/hr)
New Stream Flow
Size Ratio
Original Equip Cost (per unit)
Base Year
Total Original
Equip Cost (Req'd & Spare) in Base Year
Scaling Expo-nent
Scaled Cost in Base Year
Installa-tion
Factor
Installed Cost in Base Year
Installed Cost in 2007$
P-616 1 1 Treated Water Pump 181,965 84,881 0.47 $10,600 1997 $21,200 0.79 $11,607 2.8 $32,498 $44,178
S-600 1 Bar Screen 188,129 85,599 0.46 $117,818 1991 $117,818 0.3 $93,028 1.2 $111,634 $162,338
S-614 1 Belt Filter Press 438 58 0.13 $650,223 1998 $650,223 0.72 $151,646 1.8 $272,963 $368,203
T-602 1 Equalization Basin 188,129 85,599 0.46 $350,800 1998 $350,800 0.51 $234,772 1.42 $333,376 $449,694
T-606 1 Anaerobic Digestor 810,250 401,778 0.50 $881,081 1998 $881,081 0.51 $616,103 1.04 $640,747 $864,309
T-608 1 Aerobic Digestor 19,506,756 8,960,675 0.46 $635,173 1998 $635,173 1 $291,775 1 $291,775 $393,578
T-610 1 Clarifier 185,782 85,335 0.46 $174,385 1998 $174,385 0.51 $117,272 1.96 $229,852 $310,050
A600 Subtotal $3,678,819 $1,884,366 1.36 $2,558,255 $3,466,097
A-701 1 Denaturant In-line Mixer 19,436 19,838 1.02 $1,900 1997 $1,900 0.48 $1,919 1 $1,919 $2,608
A-720 1 CSL Storage Tank Agitator 41,777 4,488 0.11 $12,551 1996 $12,551 0.51 $4,023 1.2 $4,828 $6,645
A-760 1 CSL/DAP Day Tank Agitator 1,400 4,488 3.21 $12,795 2001 $12,795 0.51 $23,177 1.2 $27,813 $37,060
C-755 1 DAP Solids Feeder $3,900 1997 $3,900 $3,900 1.3 $5,070 $6,892
P-701 2 1 Ethanol Product Pump 18,549 19,052 1.03 $7,500 1997 $22,500 0.79 $22,981 2.8 $64,347 $87,472
P-703 1 1 Sulfuric Acid Pump 1,647 8,300 5.04 $8,000 1997 $16,000 0.79 $57,411 2.8 $160,750 $218,520
P-704 1 1 Firewater Pump 6,823 7,008 1.03 $18,400 1997 $36,800 0.79 $37,585 2.8 $105,238 $143,059
P-710 1 1 Gasoline Pump 887 786 0.89 $4,500 1997 $9,000 0.79 $8,181 2.8 $22,907 $31,139
P-720 1 1 CSL Pump 2,039 4,488 2.20 $8,800 1997 $17,600 0.79 $32,824 2.8 $91,908 $124,937
P-750 1 1 Cellulase Pump 6,823 8,712 1.28 $18,400 1997 $36,800 0.79 $44,637 2.8 $124,983 $169,900
P-755 1 DAP Unloading Blower 154 30 0.19 $47,600 1998 $47,600 0.5 $20,922 1.4 $29,291 $39,511
P-760 1 1 CSL/DAP Pump 2,039 4,488 2.20 $8,800 1997 $17,600 0.79 $32,824 2.8 $91,908 $124,937
S-755 1 DAP Vent Baghouse 548 30 0.05 $32,200 1997 $32,200 1 $1,748 1.5 $2,622 $3,565

59
Equip-ment ID
Number Required
Spares Nos Equipment Name
Scaling Stream Flow
(Kg/hr)
New Stream Flow
Size Ratio
Original Equip Cost (per unit)
Base Year
Total Original
Equip Cost (Req'd & Spare) in Base Year
Scaling Expo-nent
Scaled Cost in Base Year
Installa-tion
Factor
Installed Cost in Base Year
Installed Cost in 2007$
T-701 2 Ethanol Product Storage Tank 18,549 19,052 1.03 $165,800 1997 $331,600 0.51 $336,159 1.4 $470,623 $639,755
T-703 1 Sulfuric Acid Storage Tank 1,647 8,300 5.04 $42,500 1997 $42,500 0.51 $96,961 1.2 $116,353 $158,168
T-704 1 Firewater Storage Tank 6,822 7,008 1.03 $166,100 1997 $166,100 0.51 $168,392 1.4 $235,748 $320,472
T-709 1 Propane Storage Tank 15 16 1.04 $24,834 2001 $24,834 0.72 $25,580 1.4 $35,812 $47,719
T-710 1 Gasoline Storage Tank 887 786 0.89 $43,500 1997 $43,500 0.51 $40,902 1.4 $57,262 $77,841
T-720 1 CSL Storage Tank 2,039 4,488 2.20 $88,100 1997 $88,100 0.79 $164,307 1.4 $230,030 $312,699
T-750 2 Cellulase Storage Tank 9,234 8,712 0.94 $125,900 2001 $251,800 0.79 $240,483 1.4 $336,676 $448,617
T-755 1 DAP Storage Bin 154 30 0.19 $33,384 2001 $33,384 0.44 $16,195 1.3 $21,054 $28,054
T-760 1 CSL/DAP Day Tank 1,400 4,488 3.21 $30,084 2001 $30,084 0.79 $75,512 1.4 $105,717 $140,866
A700 Subtotal $1,279,148 $1,456,624 1.6 $2,342,860 $3,170,437
H-801 1 Burner Combustion Air Preheater
24.0337 13 0.56 $1,049,900 1997 $1,049,900 0.6 $739,305 1.5 $1,108,957 $1,507,493
H-811 1 BFW Preheater 415 226 0.54 $58,400 1997 $58,400 0.68 $38,647 2.1 $81,159 $110,325
M-803 1 Fluidized Bed Combustion Reactor
341,270 209,403 0.61 24,900,000 1998 $24,900,000 0.75 $17,262,891 1.3 $22,441,758 $30,271,886
M-804 1 Combustion Gas Baghouse 652,517 450,947 0.69 $2,536,300 1998 $2,536,300 0.58 $2,047,058 1.5 $3,070,587 $4,141,941
M-811 1 Turbine/Generator 281,179 209,403 0.74 10000000 1998 $10,000,000 0.71 $8,111,862 1.5 $12,167,793 $16,413,244
M-820 1 Hot Process Water Softener System 225,889 192,701 0.85 $1,381,300 1999 $1,381,300 0.82 $1,212,546 1.3 $1,576,310 $2,120,311
M-830 1 Hydrazine Addition Pkg. 229,386 215,880 0.94 $19,000 1994 $19,000 0.6 $18,321 1 $18,321 $26,150
M-832 1 Ammonia Addition Pkg 229,386 215,880 0.94 $19,000 1994 $19,000 0.6 $18,321 1 $18,321 $26,150

60
Equip-ment ID
Number Required
Spares Nos Equipment Name
Scaling Stream Flow
(Kg/hr)
New Stream Flow
Size Ratio
Original Equip Cost (per unit)
Base Year
Total Original
Equip Cost (Req'd & Spare) in Base Year
Scaling Expo-nent
Scaled Cost in Base Year
Installa-tion
Factor
Installed Cost in Base Year
Installed Cost in 2007$
M-834 1 Phosphate Addition Pkg. 229,386 215,880 0.94 $19,000 1994 $19,000 0.6 $18,321 1 $18,321 $26,150
P-804 2 Condensate Pump 61,471 136,035 2.21 $7,100 1997 $14,200 0.79 $26,596 2.8 $74,470 $101,233
P-811 2 Turbine Condensate Pump 39,524 59,037 1.49 $7,800 1997 $15,600 0.79 $21,419 2.8 $59,972 $81,525
P-824 2 Deaerator Feed Pump 293,605 192,701 0.66 $9,500 1997 $19,000 0.79 $13,623 2.8 $38,145 $51,853
P-826 5 BFW Pump 564,626 215,880 0.38 $52,501 1998 $262,505 0.79 $122,821 2.8 $343,900 $463,890
P-828 2 Blowdown Pump 6,613 6,476 0.98 $5,100 1997 $10,200 0.79 $10,033 2.8 $28,093 $38,189
P-830 1 Hydrazine Transfer Pump 229,386 215,880 0.94 $5,500 1997 $5,500 0.79 $5,243 2.8 $14,679 $19,955
T-804 1 Condensate Collection Tank 228,862 136,035 0.59 $7,100 1997 $7,100 0.71 $4,907 1.4 $6,870 $9,339
T-824 1 Condensate Surge Drum 222,360 192,701 0.87 $49,600 1997 $49,600 0.72 $44,742 1.7 $76,062 $103,397
T-826 1 Deaerator 266,213 215,880 0.81 $165,000 1998 $165,000 0.72 $141,890 2.8 $397,292 $535,911
T-828 1 Blowdown Flash Drum 6,563 6,476 0.99 $9,200 1997 $9,200 0.72 $9,112 2.8 $25,515 $34,684
T-830 1 Hydrazine Drum 229,386 215,880 0.94 $12,400 1997 $12,400 0.93 $11,720 1.7 $19,923 $27,083
A800 Subtotal $40,553,205 $29,879,378 1.4 $41,586,447 $56,110,709
M-902 1 Cooling Tower System
147.9600 105 0.71 $1,659,000 1998 $1,659,000 0.78 $1,265,253 1.2 $1,518,304 $2,048,054
M-904 2 1 Plant Air Compressor 98,040 111,111 1.13 $278,200 2000 $834,600 0.34 $870,881 1.3 $1,132,145 $1,509,336
M-910 1 CIP System 63 63 1.00 $95,000 1995 $95,000 0.6 $95,036 1.2 $114,043 $157,225
P-902 1 1 Cooling Water Pump
18290000
12,447,929 0.68 $332,300 1997 $664,600 0.79 $490,386 2.8 $1,373,081 $1,866,538
P-912 1 1 Make-up Water Pump 244,160 211,894 0.87 $10,800 1997 $21,600 0.79 $19,312 2.8 $54,073 $73,506
P-914 2 1 Process Water Circulating Pump 352,710 254,604 0.72 $11,100 1997 $33,300 0.79 $25,741 2.8 $72,073 $97,975
S-904 1 1 Instrument Air Dryer 159,950 111,111 0.69 $15,498 1999 $30,996 0.6 $24,910 1.3 $32,383 $43,558

61
Equip-ment ID
Number Required
Spares Nos Equipment Name
Scaling Stream Flow
(Kg/hr)
New Stream Flow
Size Ratio
Original Equip Cost (per unit)
Base Year
Total Original
Equip Cost (Req'd & Spare) in Base Year
Scaling Expo-nent
Scaled Cost in Base Year
Installa-tion
Factor
Installed Cost in Base Year
Installed Cost in 2007$
T-902 3 Prehydrolysis Filter Air Receiver 5,259 4,687 0.89 $17,000 2000 $51,000 0.72 $46,942 1.2 $56,331 $75,098
T-904 1 Plant Air Receiver 159,950 111,111 0.69 $13,000 1997 $13,000 0.72 $10,000 1.3 $13,001 $17,673
T-905 4 Product Recovery Filter Air Receiver 5,700 5,921 1.04 $17,000 2000 $68,000 0.72 $69,887 1.2 $83,865 $111,806
T-914 1 Process Water Tank 352,710 254,604 0.72 $195,500 1997 $195,500 0.51 $165,560 1.4 $231,784 $315,082
A900 Subtotal $3,666,596 $3,083,909 1.5 $4,681,083 $6,315,850
Equipment Cost $93,786,061 $81,109,704 1.50 $121,788,091 $164,104,477

62
Appendix F - Process Operating Summaries
Table F-1. Operating Summary for Dilute Acid Pretreatment Processes
Pretreatment Saccharification Fermentation Acid Conc (wt%) 0.0190 Enzyme Loading (mg/g cell) 35.1 Total Solids (wt%) 20.1% Acid Loading (g acid/g dry biomass) 0.0445 Total Solids (wt%) 20.0% Insoluble Solids (wt%) 4.3% Total Solids (wt%) 0.2956 Insoluble Solids (wt%) 10.0% Temperature (°C) 32 Temperature (°C) 190 Temperature (°C) 32 Pressure (atm) 1.0 Pressure (atm) 11.5 Pressure (atm) 1.0 Residence Time (days) 2 Residence Time (min.) Residence Time (days) 5 Conversions: Conversions: Conversions: Glucose to Ethanol 0.95 Cellulose to Glucolig 0.003 Cellulose to Glucolig 0 Glucose to Zymo 0.02 Cellulose to Cellobiose 0 Cellulose to Cellobiose 0 Glucose to Glycerol 0.004 Cellulose to Glucose 0.099 Cellulose to Glucose 0.9109 Glucose to Succinic Acid 0.006 Cellulose to HMF 0.003 Glucolig to Cellobiose 0 Glucose to Acetic Acid 0.015 Xylan to Oligomer 0.21 Glucolig to Glucose 0 Glucose to Lactic Acid 0.002 Xylan to Xylose 0.6 Cellobiose to Glucose 0 Xylose to Ethanol 0.756 Xylan to Furfural 0.11 Xylan to Oligomer 0 Xylose to Zymo 0.019 Xylan to Tar 0 Xylan to Xylose 0.5713 Xylose to Glycerol 0.003 Mannan to Oligomer 0.21 Xylose Oligomer to Xylose 0 Xylose to Xylitol 0.046 Mannan to Mannose 0.6 Xylan to Tar 0 Xylose to Succinic Acid 0.009 Mannan to HMF 0.08 Arabinan to Oligomer 0.5713 Xylose to Acetic Acid 0.014 Galactan to Oligomer 0.21 Arabinan to Arabinose 0 Xylose to Lactic Acid 0.002 Galactan to Galactose 0.6 Galactan to Oligomer 0 Arabinose to Ethanol 0 Galactan to HMF 0.08 Galactan to Galactose 0.5713 Arabinose to Zymo 0 Arabinan to Oligomer 0.21 Galactose Oligomer to Galactose 0 Arabinose to Glycerol 0 Arabinan to Arabinose 0.6 Mannan to Oligomer 0 Arabinose to Succinic Acid 0 Arabinan to Furfural 0.08 Mannan to Mannose 0.5713 Arabinose to Acetic Acid 0 Arabinan to Tar 0 Mannose Oligomer to Mannose 0 Arabinose to Lactic Acid 0 Acetate to Oligomer 0 Sugar & Solids Flow Rates (kg/hr) Galactose to Ethanol 0 Acetate to Acetic Acid 1 Soluble Sugars From PT 22,989 Galactose to Zymo 0 Furfural to Tar 1 Other Soluble Solids From PT 18,543 Galactose to Glycerol 0 HMF to Tar 1 Soluble Sugars in Purchased Cellulase 0 Galactose to Succinic Acid 0 Lignin to Soluble Lignin 0.1 Other Sol Solids in Purchased Cellulase 0 Galactose to Acetic Acid 0

63
Pretreatment, cont. Saccharification, cont. Fermentation, cont. S/L Separation Soluble Sugars in Produced Cellulase 0 Galactose to Lactic Acid 0 Water/Hydrolyzate Ratio (kg/kg) 0.58 Other Sol Solids in Produced Cellulase 0 Mannose to Ethanol 0 Water to S/L Separator (kg/hr) 131,829 Mannose to Zymo 0 Dilution Water (kg/hr) 52,436 Soluble Sugars From Sacc 44,457 Mannose to Glycerol 0 Conditioning Other Soluble Solids From Sacc 16,688 Mannose to Succinic Acid 0 Ca(OH)2 to Gypsum 0.145 Soluble Sugars From Seed Train 880 Mannose to Acetic Acid 0 Sugar Conversion to TAR: Other Soluble Solids From Seed Train 1,955 Mannose to Lactic Acid 0 Xylose 0.13 Soluble Sugars From DAP 0 Arabinose 0.2 Other Soluble Solids From DAP 0 Contamination Loss 7.0% Glucose 0.12 Soluble Sugars From CSL 0 Galactose 0.28 Other Soluble Solids From CSL 2,095 Ethanol Out of Fermenters (wt%) 4.7% Mannose 0 Cellobiose 0.36

64
Table F-2. Operating Summary for Dilute Acid Pretreatment (Pilot) Processes
Pretreatment Saccharification Fermentation Acid Conc (wt%) 0.0190 Enzyme Loading (mg/g cell) 35.1 Total Solids (wt%) 20.1% Acid Loading (g acid/g dry biomass) 0.0445 Total Solids (wt%) 20.0% Insoluble Solids (wt%) 4.3% Total Solids (wt%) 0.2956 Insoluble Solids (wt%) 10.0% Temperature (°C) 32 Temperature (°C) 190 Temperature (°C) 32 Pressure (atm) 1.0 Pressure (atm) 11.5 Pressure (atm) 1.0 Residence Time (days) 2 Residence Time (min.) Residence Time (days) 5 Conversions: Conversions: Conversions: Glucose to Ethanol 0.95 Cellulose to Glucolig 0.003 Cellulose to Glucolig 0 Glucose to Zymo 0.02 Cellulose to Cellobiose 0 Cellulose to Cellobiose 0 Glucose to Glycerol 0.004 Cellulose to Glucose 0.099 Cellulose to Glucose 0.9109 Glucose to Succinic Acid 0.006 Cellulose to HMF 0.003 Glucolig to Cellobiose 0 Glucose to Acetic Acid 0.015 Xylan to Oligomer 0.21 Glucolig to Glucose 0 Glucose to Lactic Acid 0.002 Xylan to Xylose 0.6 Cellobiose to Glucose 0 Xylose to Ethanol 0.756 Xylan to Furfural 0.11 Xylan to Oligomer 0 Xylose to Zymo 0.019 Xylan to Tar 0 Xylan to Xylose 0.5713 Xylose to Glycerol 0.003 Mannan to Oligomer 0.21 Xylose Oligomer to Xylose 0 Xylose to Xylitol 0.046 Mannan to Mannose 0.6 Xylan to Tar 0 Xylose to Succinic Acid 0.009 Mannan to HMF 0.08 Arabinan to Oligomer 0.5713 Xylose to Acetic Acid 0.014 Galactan to Oligomer 0.21 Arabinan to Arabinose 0 Xylose to Lactic Acid 0.002 Galactan to Galactose 0.6 Galactan to Oligomer 0 Arabinose to Ethanol 0 Galactan to HMF 0.08 Galactan to Galactose 0.5713 Arabinose to Zymo 0 Arabinan to Oligomer 0.21 Galactose Oligomer to Galactose 0 Arabinose to Glycerol 0 Arabinan to Arabinose 0.6 Mannan to Oligomer 0 Arabinose to Succinic Acid 0 Arabinan to Furfural 0.08 Mannan to Mannose 0.5713 Arabinose to Acetic Acid 0 Arabinan to Tar 0 Mannose Oligomer to Mannose 0 Arabinose to Lactic Acid 0 Acetate to Oligomer 0 Galactose to Ethanol 0 Acetate to Acetic Acid 1 Sugar & Solids Flow Rates (kg/hr) Galactose to Zymo 0 Furfural to Tar 1 Soluble Sugars From PT 22,989 Galactose to Glycerol 0 HMF to Tar 1 Other Soluble Solids From PT 18,543 Galactose to Succinic Acid 0 Lignin to Soluble Lignin 0.1 Soluble Sugars in Purchased Cellulase 0 Galactose to Acetic Acid 0 Other Sol Solids in Purchased Cellulase 0 Galactose to Lactic Acid 0 Soluble Sugars in Produced Cellulase 0 Mannose to Ethanol 0 Other Sol Solids in Produced Cellulase 0 Mannose to Zymo 0

65
Pretreatment, cont. Saccharification, cont. Fermentation, cont. S/L Separation Soluble Sugars From Sacc 44,457 Mannose to Glycerol 0 Water/Hydrolyzate Ratio (kg/kg) 0.58 Other Soluble Solids From Sacc 16,688 Mannose to Succinic Acid 0 Water to S/L Separator (kg/hr) 131,829 Soluble Sugars From Seed Train 880 Mannose to Acetic Acid 0 Dilution Water (kg/hr) 52,436 Other Soluble Solids From Seed Train 1,955 Mannose to Lactic Acid 0 Conditioning Soluble Sugars From DAP 0 Ca(OH)2 to Gypsum 0.145 Other Soluble Solids From DAP 0 Contamination Loss 7.0% Sugar Conversion to TAR: Soluble Sugars From CSL 0 Xylose 0.13 Other Soluble Solids From CSL 2,095 Ethanol Out of Fermenters (wt%) 4.7% Arabinose 0.2 Glucose 0.12 Galactose 0.28 Mannose 0 Cellobiose 0.36

66
Table F-3. Operating Summary for Two-Stage Dilute Acid Pretreatment Processes
Pretreatment Saccharification Fermentation Acid Conc (wt%) 0.0190 Enzyme Loading (mg/g cell) N/A Total Solids (wt%) 19.7% Acid Loading (g acid/g dry biomass) 0.0443 Total Solids (wt%) 34.2% Insoluble Solids (wt%) 7.1% Total Solids (wt%) 0.2956 Insoluble Solids (wt%) 28.6% Temperature (°C) 32 Temperature (°C) 190 Temperature (°C) 144.0873 Pressure (atm) 1.0 Pressure (atm) 11.5 Pressure (atm) 4.0 Residence Time (days) 2 Residence Time (min.) Residence Time (days) 0 Conversions: Conversions: Conversions: Glucose to Ethanol 0.95 Cellulose to Glucolig 0 Cellulose to Glucolig N/A Glucose to Zymo 0.02 Cellulose to Cellobiose 0 Cellulose to Cellobiose N/A Glucose to Glycerol 0.004 Cellulose to Glucose 0.0626 Cellulose to Glucose N/A Glucose to Succinic Acid 0.006 Cellulose to HMF 0 Glucolig to Cellobiose N/A Glucose to Acetic Acid 0.015 Xylan to Oligomer 0.0265 Glucolig to Glucose N/A Glucose to Lactic Acid 0.002 Xylan to Xylose 0.8249 Cellobiose to Glucose N/A Xylose to Ethanol 0.756 Xylan to Furfural 0 Xylan to Oligomer N/A Xylose to Zymo 0.019 Xylan to Tar 0 Xylan to Xylose N/A Xylose to Glycerol 0.003 Mannan to Oligomer 0.0265 Xylose Oligomer to Xylose N/A Xylose to Xylitol 0.046 Mannan to Mannose 0.8249 Xylan to Tar N/A Xylose to Succinic Acid 0.009 Mannan to HMF 0 Arabinan to Oligomer N/A Xylose to Acetic Acid 0.014 Galactan to Oligomer 0.0265 Arabinan to Arabinose N/A Xylose to Lactic Acid 0.002 Galactan to Galactose 0.8249 Galactan to Oligomer N/A Arabinose to Ethanol 0 Galactan to HMF 0 Galactan to Galactose N/A Arabinose to Zymo 0 Arabinan to Oligomer 0.0265 Galactose Oligomer to Galactose N/A Arabinose to Glycerol 0 Arabinan to Arabinose 0.8249 Mannan to Oligomer N/A Arabinose to Succinic Acid 0 Arabinan to Furfural 0 Mannan to Mannose N/A Arabinose to Acetic Acid 0 Arabinan to Tar 0 Mannose Oligomer to Mannose N/A Arabinose to Lactic Acid 0 Acetate to Oligomer 0 Sugar & Solids Flow Rates (kg/hr) Galactose to Ethanol 0 Acetate to Acetic Acid 1 Soluble Sugars From PT 0 Galactose to Zymo 0 Furfural to Tar 1 Other Soluble Solids From PT 13,600 Galactose to Glycerol 0 HMF to Tar 1 Soluble Sugars in Purchased Cellulase 0 Galactose to Succinic Acid 0 Lignin to Soluble Lignin 0.1 Other Sol Solids in Purchased Cellulase 0 Galactose to Acetic Acid 0 S/L Separation Soluble Sugars in Produced Cellulase 0 Galactose to Lactic Acid 0 Water/Hydrolyzate Ratio (kg/kg) 0.58 Other Sol Solids in Produced Cellulase 0 Mannose to Ethanol 0 Water to S/L Separator (kg/hr) 137,458 Mannose to Zymo 0

67
Pretreatment, cont. Saccharification, cont. Fermentation, cont. Conditioning Soluble Sugars From Sacc 33,169 Mannose to Glycerol 0 Ca(OH)2 to Gypsum 0.183 Other Soluble Solids From Sacc 16,462 Mannose to Succinic Acid 0 Sugar Conversion to TAR: Soluble Sugars From Seed Train 881 Mannose to Acetic Acid 0 Xylose 0.13 Other Soluble Solids From Seed Train 1,934 Mannose to Lactic Acid 0 Arabinose 0.2 Soluble Sugars From DAP 0 Glucose 0.12 Other Soluble Solids From DAP 0 Contamination Loss 7.0% Galactose 0.28 Soluble Sugars From CSL 0 Mannose 0 Other Soluble Solids From CSL 2,159 Ethanol Out of Fermenters (wt%) 3.1% Cellobiose 0.36

68
Table F-4. Operating Summary for Hot Water Pretreatment Processes
Pretreatment Saccharification Fermentation Total Solids (wt%) 17.2% Enzyme Loading (mg/g cell) 33.1 Total Solids (wt%) 16.5% Total Insoluble Solids (wt%) 12.9% Total Solids (wt%) 16.0% Insoluble Solids (wt%) 3.9% Temperature (°C) 190.0 Insoluble Solids (wt%) 9.2% Temperature (°C) 32 Pressure (atm) 12.3 Temperature (°C) 32 Pressure (atm) 1.0 Conversions: Pressure (atm) 1.0 Residence Time (days) 2 Cellulose to Glucolig 0.053 Residence Time (days) 5 Conversions: Cellulose to Cellobiose 0 Conversions: Glucose to Ethanol 0.95 Cellulose to Glucose 0.0032 Cellulose to Glucolig 0 Glucose to Zymo 0.02 Cellulose to HMF 0 Cellulose to Cellobiose 0 Glucose to Glycerol 0.004 Xylan to Oligomer 0.554 Cellulose to Glucose 0.8997 Glucose to Succinic Acid 0.006 Xylan to Xylose 0.0239 Glucolig to Cellobiose 0 Glucose to Acetic Acid 0.015 Xylan to Furfural 0 Glucolig to Glucose 0 Glucose to Lactic Acid 0.002 Xylan to Tar 0 Cellobiose to Glucose 0 Xylose to Ethanol 0.756 Mannan to Oligomer 0.554 Xylan to Oligomer 0 Xylose to Zymo 0.019 Mannan to Mannose 0.0239 Xylan to Xylose 0.5661 Xylose to Glycerol 0.003 Mannan to HMF 0 Xylose Oligomer to Xylose 0 Xylose to Xylitol 0.046 Galactan to Oligomer 0.554 Xylan to Tar 0 Xylose to Succinic Acid 0.009 Galactan to Galactose 0.0239 Arabinan to Oligomer 0.5661 Xylose to Acetic Acid 0.014 Galactan to HMF 0 Arabinan to Arabinose 0 Xylose to Lactic Acid 0.002 Arabinan to Oligomer 0.554 Galactan to Oligomer 0 Arabinose to Ethanol 0 Arabinan to Arabinose 0.0239 Galactan to Galactose 0.5661 Arabinose to Zymo 0 Arabinan to Furfural 0 Galactose Oligomer to Galactose 0 Arabinose to Glycerol 0 Arabinan to Tar 0 Mannan to Oligomer 0 Arabinose to Succinic Acid 0 Acetate to Oligomer 0 Mannan to Mannose 0.5661 Arabinose to Acetic Acid 0 Acetate to Acetic Acid 1 Mannose Oligomer to Mannose 0 Arabinose to Lactic Acid 0 Furfural to Tar 1 Sugar & Solids Flow Rates (kg/hr) Galactose to Ethanol 0 HMF to Tar 1 Soluble Sugars From PT 19,745 Galactose to Zymo 0 Lignin to Soluble Lignin 0.05 Other Soluble Solids From PT 18,174 Galactose to Glycerol 0 Glucose to HMF 0.5 Soluble Sugars in Purchased Cellulase 0 Galactose to Succinic Acid 0 Mannose to HMF 0.5 Other Sol Solids in Purchased Cellulase 0 Galactose to Acetic Acid 0 Galactose to HMF 0.5 Soluble Sugars in Produced Cellulase 0 Galactose to Lactic Acid 0 Xylose to Furfural 0.5 Other Sol Solids in Produced Cellulase 0 Mannose to Ethanol 0 Arabinose to Furfural 0.5 Mannose to Zymo 0

69
Pretreatment, cont. Saccharification, cont. Fermentation, cont. Soluble Sugars From Sacc 47,147 Mannose to Glycerol 0 S/L Separation Other Soluble Solids From Sacc 16,357 Mannose to Succinic Acid 0 Water/Hydrolyzate Ratio (kg/kg) #N/A Soluble Sugars From Seed Train 2,176 Mannose to Acetic Acid 0 Water to S/L Separator (kg/hr) #N/A Other Soluble Solids From Seed Train 1,954 Mannose to Lactic Acid 0 Dilution Water (kg/hr) #N/A Soluble Sugars From DAP 0 Conditioning Other Soluble Solids From DAP 0 Contamination Loss 7.0% Ca(OH)2 to Gypsum 0.000 Soluble Sugars From CSL 0 Sugar Conversion to TAR: Other Soluble Solids From CSL 2,792 Ethanol Out of Fermenters (wt%) 2.7% Xylose 0 Arabinose 0 Glucose 0 Galactose 0 Mannose 0 Cellobiose 0

70
Table F-5. Operating Summary for AFEX Pretreatment Processes
Pretreatment Saccharification Fermentation Acid Conc (wt%) 0.0000 Enzyme Loading (mg/g cell) 31.3 Total Solids (wt%) 20.5% Acid Loading (g acid/g dry biomass) 0.0000 Total Solids (wt%) 20.0% Insoluble Solids (wt%) 3.6% Total Solids (wt%) 0.4808 Insoluble Solids (wt%) 11.6% Temperature (°C) 32 Temperature (°C) 108.1302 Temperature (°C) 32 Pressure (atm) 1.0 Pressure (atm) 18.7 Pressure (atm) 1.0 Residence Time (days) 2 Residence Time (min.) Residence Time (days) 5 Conversions: Conversions: Conversions: Glucose to Ethanol 0.95 Cellulose to Glucolig Cellulose to Glucolig 0 Glucose to Zymo 0.02 Cellulose to Cellobiose Cellulose to Cellobiose 0 Glucose to Glycerol 0.004 Cellulose to Glucose Cellulose to Glucose 0.959 Glucose to Succinic Acid 0.006 Cellulose to HMF Glucolig to Cellobiose 0 Glucose to Acetic Acid 0.015 Xylan to Oligomer 0.5 Glucolig to Glucose 0 Glucose to Lactic Acid 0.002 Xylan to Xylose Cellobiose to Glucose 1 Xylose to Ethanol 0.756 Xylan to Furfural Xylan to Oligomer 0 Xylose to Zymo 0.019 Xylan to Tar Xylan to Xylose 0.777 Xylose to Glycerol 0.003 Mannan to Oligomer 0.5 Xylose Oligomer to Xylose 0 Xylose to Xylitol 0.046 Mannan to Mannose Xylan to Tar 0 Xylose to Succinic Acid 0.009 Mannan to HMF Arabinan to Oligomer 0.777 Xylose to Acetic Acid 0.014 Galactan to Oligomer 0.5 Arabinan to Arabinose 0 Xylose to Lactic Acid 0.002 Galactan to Galactose Galactan to Oligomer 0 Arabinose to Ethanol 0 Galactan to HMF Galactan to Galactose 0.777 Arabinose to Zymo 0 Arabinan to Oligomer 0.5 Galactose Oligomer to Galactose 0 Arabinose to Glycerol 0 Arabinan to Arabinose Mannan to Oligomer 0 Arabinose to Succinic Acid 0 Arabinan to Furfural Mannan to Mannose 0.777 Arabinose to Acetic Acid 0 Arabinan to Tar Mannose Oligomer to Mannose 0 Arabinose to Lactic Acid 0 Acetate to Oligomer Sugar & Solids Flow Rates (kg/hr) Galactose to Ethanol 0 Acetate to Acetic Acid Soluble Sugars From PT 15,980 Galactose to Zymo 0 Furfural to Tar Other Soluble Solids From PT 21,338 Galactose to Glycerol 0 HMF to Tar Soluble Sugars in Purchased Cellulase 0 Galactose to Succinic Acid 0 Lignin to Soluble Lignin 0.33 Other Sol Solids in Purchased Cellulase 0 Galactose to Acetic Acid 0 S/L Separation Soluble Sugars in Produced Cellulase 0 Galactose to Lactic Acid 0 Water/Hydrolyzate Ratio (kg/kg) N/A Other Sol Solids in Produced Cellulase 0 Mannose to Ethanol 0

71
Pretreatment, cont. Saccharification, cont. Fermentation, cont. Water to S/L Separator (kg/hr) N/A Mannose to Zymo 0 Dilution Water (kg/hr) N/A Soluble Sugars From Sacc 50,400 Mannose to Glycerol 0 Conditioning Other Soluble Solids From Sacc 19,205 Mannose to Succinic Acid 0 Ca(OH)2 to Gypsum #N/A Soluble Sugars From Seed Train 1,962 Mannose to Acetic Acid 0 Sugar Conversion to TAR: Other Soluble Solids From Seed Train 2,242 Mannose to Lactic Acid 0 Xylose #N/A Soluble Sugars From DAP 0 Arabinose #N/A Other Soluble Solids From DAP 0 Contamination Loss 7.0% Glucose #N/A Soluble Sugars From CSL 0 Galactose #N/A Other Soluble Solids From CSL 2,242 Ethanol Out of Fermenters (wt%) 3.9% Mannose #N/A Cellobiose #N/A
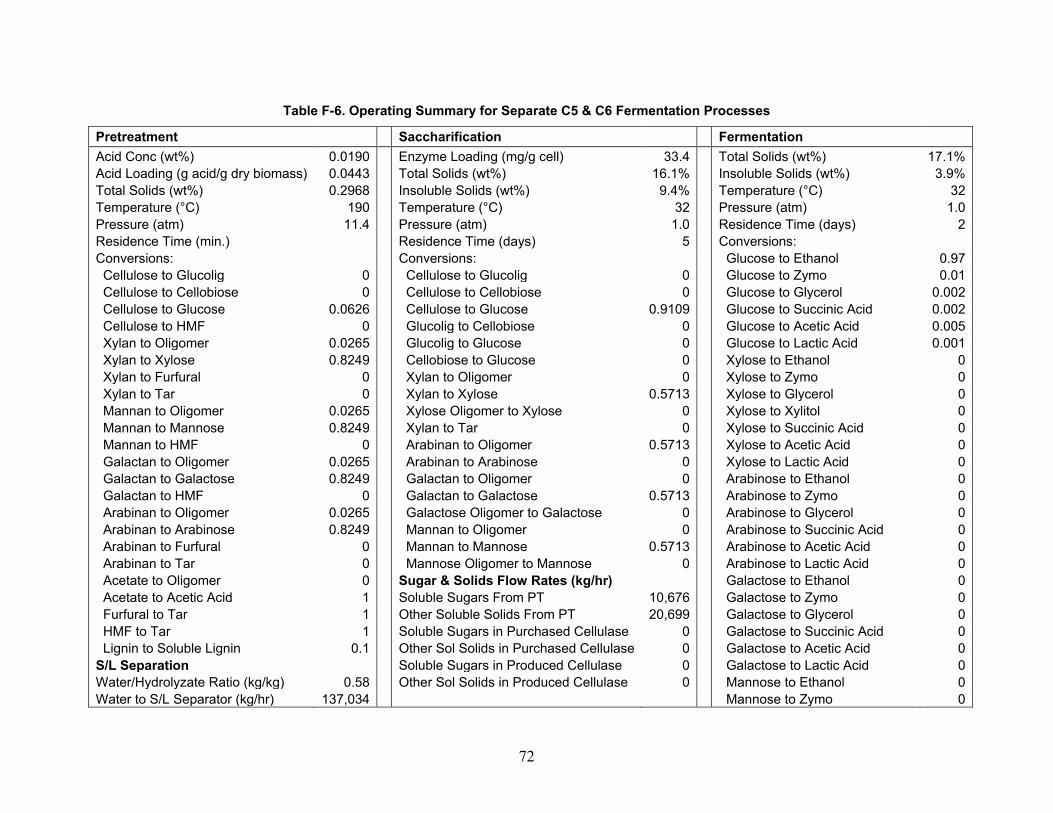
72
Table F-6. Operating Summary for Separate C5 & C6 Fermentation Processes
Pretreatment Saccharification Fermentation Acid Conc (wt%) 0.0190 Enzyme Loading (mg/g cell) 33.4 Total Solids (wt%) 17.1% Acid Loading (g acid/g dry biomass) 0.0443 Total Solids (wt%) 16.1% Insoluble Solids (wt%) 3.9% Total Solids (wt%) 0.2968 Insoluble Solids (wt%) 9.4% Temperature (°C) 32 Temperature (°C) 190 Temperature (°C) 32 Pressure (atm) 1.0 Pressure (atm) 11.4 Pressure (atm) 1.0 Residence Time (days) 2 Residence Time (min.) Residence Time (days) 5 Conversions: Conversions: Conversions: Glucose to Ethanol 0.97 Cellulose to Glucolig 0 Cellulose to Glucolig 0 Glucose to Zymo 0.01 Cellulose to Cellobiose 0 Cellulose to Cellobiose 0 Glucose to Glycerol 0.002 Cellulose to Glucose 0.0626 Cellulose to Glucose 0.9109 Glucose to Succinic Acid 0.002 Cellulose to HMF 0 Glucolig to Cellobiose 0 Glucose to Acetic Acid 0.005 Xylan to Oligomer 0.0265 Glucolig to Glucose 0 Glucose to Lactic Acid 0.001 Xylan to Xylose 0.8249 Cellobiose to Glucose 0 Xylose to Ethanol 0 Xylan to Furfural 0 Xylan to Oligomer 0 Xylose to Zymo 0 Xylan to Tar 0 Xylan to Xylose 0.5713 Xylose to Glycerol 0 Mannan to Oligomer 0.0265 Xylose Oligomer to Xylose 0 Xylose to Xylitol 0 Mannan to Mannose 0.8249 Xylan to Tar 0 Xylose to Succinic Acid 0 Mannan to HMF 0 Arabinan to Oligomer 0.5713 Xylose to Acetic Acid 0 Galactan to Oligomer 0.0265 Arabinan to Arabinose 0 Xylose to Lactic Acid 0 Galactan to Galactose 0.8249 Galactan to Oligomer 0 Arabinose to Ethanol 0 Galactan to HMF 0 Galactan to Galactose 0.5713 Arabinose to Zymo 0 Arabinan to Oligomer 0.0265 Galactose Oligomer to Galactose 0 Arabinose to Glycerol 0 Arabinan to Arabinose 0.8249 Mannan to Oligomer 0 Arabinose to Succinic Acid 0 Arabinan to Furfural 0 Mannan to Mannose 0.5713 Arabinose to Acetic Acid 0 Arabinan to Tar 0 Mannose Oligomer to Mannose 0 Arabinose to Lactic Acid 0 Acetate to Oligomer 0 Sugar & Solids Flow Rates (kg/hr) Galactose to Ethanol 0 Acetate to Acetic Acid 1 Soluble Sugars From PT 10,676 Galactose to Zymo 0 Furfural to Tar 1 Other Soluble Solids From PT 20,699 Galactose to Glycerol 0 HMF to Tar 1 Soluble Sugars in Purchased Cellulase 0 Galactose to Succinic Acid 0 Lignin to Soluble Lignin 0.1 Other Sol Solids in Purchased Cellulase 0 Galactose to Acetic Acid 0 S/L Separation Soluble Sugars in Produced Cellulase 0 Galactose to Lactic Acid 0 Water/Hydrolyzate Ratio (kg/kg) 0.58 Other Sol Solids in Produced Cellulase 0 Mannose to Ethanol 0 Water to S/L Separator (kg/hr) 137,034 Mannose to Zymo 0

73
Pretreatment, cont. Saccharification, cont. Fermentation, cont. Dilution Water (kg/hr) 67,796 Soluble Sugars From Sacc 39,360 Mannose to Glycerol 0 Conditioning Other Soluble Solids From Sacc 20,699 Mannose to Succinic Acid 0 Ca(OH)2 to Gypsum #N/A Soluble Sugars From Seed Train 0 Mannose to Acetic Acid 0 Sugar Conversion to TAR: Other Soluble Solids From Seed Train 0 Mannose to Lactic Acid 0 Xylose 0.018 Soluble Sugars From DAP 0 Arabinose 0.018 Other Soluble Solids From DAP 0 Contamination Loss 7.0% Glucose 0.006 Soluble Sugars From CSL 0 Galactose 0.006 Other Soluble Solids From CSL 2,371 Ethanol Out of Fermenters (wt%) 4.3% Mannose 0.006 Cellobiose 0.006
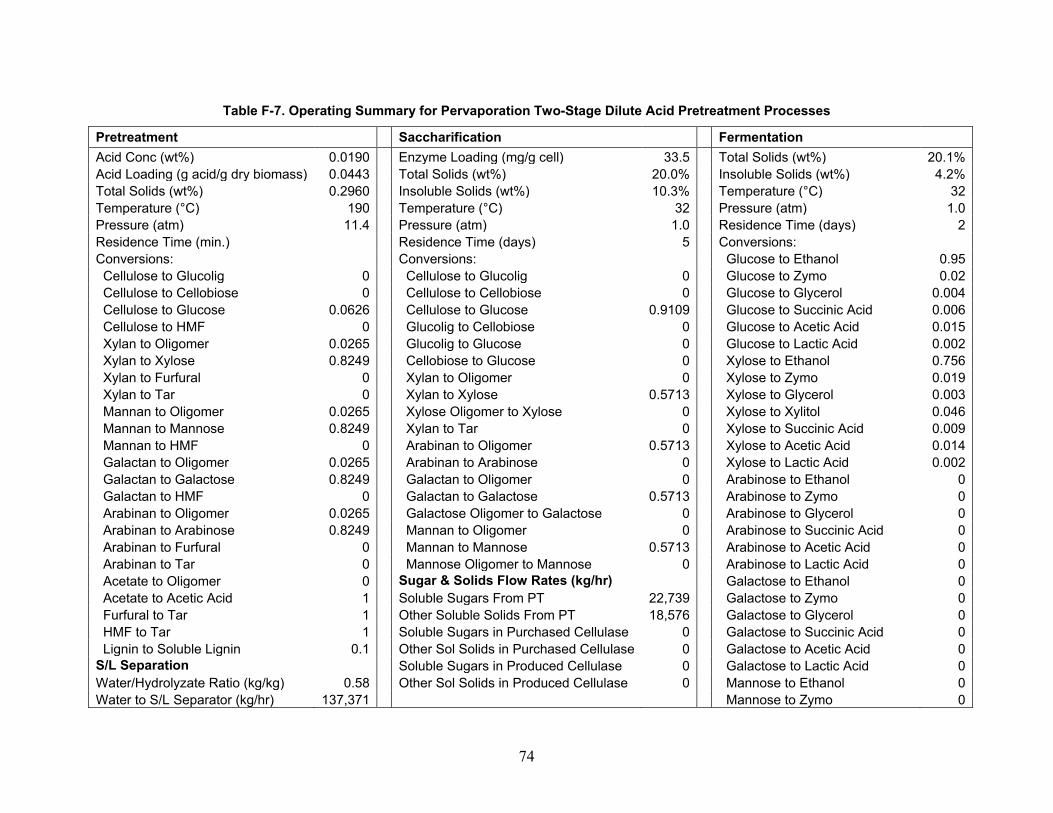
74
Table F-7. Operating Summary for Pervaporation Two-Stage Dilute Acid Pretreatment Processes
Pretreatment Saccharification Fermentation Acid Conc (wt%) 0.0190 Enzyme Loading (mg/g cell) 33.5 Total Solids (wt%) 20.1% Acid Loading (g acid/g dry biomass) 0.0443 Total Solids (wt%) 20.0% Insoluble Solids (wt%) 4.2% Total Solids (wt%) 0.2960 Insoluble Solids (wt%) 10.3% Temperature (°C) 32 Temperature (°C) 190 Temperature (°C) 32 Pressure (atm) 1.0 Pressure (atm) 11.4 Pressure (atm) 1.0 Residence Time (days) 2 Residence Time (min.) Residence Time (days) 5 Conversions: Conversions: Conversions: Glucose to Ethanol 0.95 Cellulose to Glucolig 0 Cellulose to Glucolig 0 Glucose to Zymo 0.02 Cellulose to Cellobiose 0 Cellulose to Cellobiose 0 Glucose to Glycerol 0.004 Cellulose to Glucose 0.0626 Cellulose to Glucose 0.9109 Glucose to Succinic Acid 0.006 Cellulose to HMF 0 Glucolig to Cellobiose 0 Glucose to Acetic Acid 0.015 Xylan to Oligomer 0.0265 Glucolig to Glucose 0 Glucose to Lactic Acid 0.002 Xylan to Xylose 0.8249 Cellobiose to Glucose 0 Xylose to Ethanol 0.756 Xylan to Furfural 0 Xylan to Oligomer 0 Xylose to Zymo 0.019 Xylan to Tar 0 Xylan to Xylose 0.5713 Xylose to Glycerol 0.003 Mannan to Oligomer 0.0265 Xylose Oligomer to Xylose 0 Xylose to Xylitol 0.046 Mannan to Mannose 0.8249 Xylan to Tar 0 Xylose to Succinic Acid 0.009 Mannan to HMF 0 Arabinan to Oligomer 0.5713 Xylose to Acetic Acid 0.014 Galactan to Oligomer 0.0265 Arabinan to Arabinose 0 Xylose to Lactic Acid 0.002 Galactan to Galactose 0.8249 Galactan to Oligomer 0 Arabinose to Ethanol 0 Galactan to HMF 0 Galactan to Galactose 0.5713 Arabinose to Zymo 0 Arabinan to Oligomer 0.0265 Galactose Oligomer to Galactose 0 Arabinose to Glycerol 0 Arabinan to Arabinose 0.8249 Mannan to Oligomer 0 Arabinose to Succinic Acid 0 Arabinan to Furfural 0 Mannan to Mannose 0.5713 Arabinose to Acetic Acid 0 Arabinan to Tar 0 Mannose Oligomer to Mannose 0 Arabinose to Lactic Acid 0 Acetate to Oligomer 0 Sugar & Solids Flow Rates (kg/hr) Galactose to Ethanol 0 Acetate to Acetic Acid 1 Soluble Sugars From PT 22,739 Galactose to Zymo 0 Furfural to Tar 1 Other Soluble Solids From PT 18,576 Galactose to Glycerol 0 HMF to Tar 1 Soluble Sugars in Purchased Cellulase 0 Galactose to Succinic Acid 0 Lignin to Soluble Lignin 0.1 Other Sol Solids in Purchased Cellulase 0 Galactose to Acetic Acid 0 S/L Separation Soluble Sugars in Produced Cellulase 0 Galactose to Lactic Acid 0 Water/Hydrolyzate Ratio (kg/kg) 0.58 Other Sol Solids in Produced Cellulase 0 Mannose to Ethanol 0 Water to S/L Separator (kg/hr) 137,371 Mannose to Zymo 0

75
Pretreatment, cont. Saccharification, cont. Fermentation, cont. Dilution Water (kg/hr) 45,921 Soluble Sugars From Sacc 46,152 Mannose to Glycerol 0 Conditioning Other Soluble Solids From Sacc 16,718 Mannose to Succinic Acid 0 Ca(OH)2 to Gypsum 0.174 Soluble Sugars From Seed Train 839 Mannose to Acetic Acid 0 Sugar Conversion to TAR: Other Soluble Solids From Seed Train 1,960 Mannose to Lactic Acid 0 Xylose 0.13 Soluble Sugars From DAP 0 Arabinose 0.2 Other Soluble Solids From DAP 0 Contamination Loss 7.0% Glucose 0.12 Soluble Sugars From CSL 0 Galactose 0.28 Other Soluble Solids From CSL 2,138 Ethanol Out of Fermenters (wt%) 4.8% Mannose 0 Cellobiose 0.36

76
Table F-8. Operating Summary for On-site Enzyme Production Processes
Pretreatment Saccharification Fermentation Acid Conc (wt%) 0.0190 Enzyme Loading (mg/g cell) 0.0 Total Solids (wt%) 20.1% Acid Loading (g acid/g dry biomass) 0.0442 Total Solids (wt%) 20.0% Insoluble Solids (wt%) 4.7% Total Solids (wt%) 0.2959 Insoluble Solids (wt%) 10.2% Temperature (°C) 32 Temperature (°C) 190 Temperature (°C) 32 Pressure (atm) 1.0 Pressure (atm) 11.4 Pressure (atm) 1.0 Residence Time (days) 2 Residence Time (min.) Residence Time (days) 5 Conversions: Conversions: Conversions: Glucose to Ethanol 0.95 Cellulose to Glucolig 0 Cellulose to Glucolig 0 Glucose to Zymo 0.02 Cellulose to Cellobiose 0 Cellulose to Cellobiose 0 Glucose to Glycerol 0.004 Cellulose to Glucose 0.0626 Cellulose to Glucose 0.9109 Glucose to Succinic Acid 0.006 Cellulose to HMF 0 Glucolig to Cellobiose 0 Glucose to Acetic Acid 0.015 Xylan to Oligomer 0.0265 Glucolig to Glucose 0 Glucose to Lactic Acid 0.002 Xylan to Xylose 0.8249 Cellobiose to Glucose 0 Xylose to Ethanol 0.756 Xylan to Furfural 0 Xylan to Oligomer 0 Xylose to Zymo 0.019 Xylan to Tar 0.085 Xylan to Xylose 0.5713 Xylose to Glycerol 0.003 Mannan to Oligomer 0.0265 Xylose Oligomer to Xylose 0 Xylose to Xylitol 0.046 Mannan to Mannose 0.8249 Xylan to Tar 0 Xylose to Succinic Acid 0.009 Mannan to HMF 0 Arabinan to Oligomer 0.5713 Xylose to Acetic Acid 0.014 Galactan to Oligomer 0.0265 Arabinan to Arabinose 0 Xylose to Lactic Acid 0.002 Galactan to Galactose 0.8249 Galactan to Oligomer 0 Arabinose to Ethanol 0 Galactan to HMF 0 Galactan to Galactose 0.5713 Arabinose to Zymo 0 Arabinan to Oligomer 0.0265 Galactose Oligomer to Galactose 0 Arabinose to Glycerol 0 Arabinan to Arabinose 0.8249 Mannan to Oligomer 0 Arabinose to Succinic Acid 0 Arabinan to Furfural 0 Mannan to Mannose 0.5713 Arabinose to Acetic Acid 0 Arabinan to Tar 0.085 Mannose Oligomer to Mannose 0 Arabinose to Lactic Acid 0 Acetate to Oligomer 0 Sugar & Solids Flow Rates (kg/hr) Galactose to Ethanol 0 Acetate to Acetic Acid 1 Soluble Sugars From PT 20,317 Galactose to Zymo 0 Furfural to Tar 1 Other Soluble Solids From PT 16,259 Galactose to Glycerol 0 HMF to Tar 1 Soluble Sugars in Purchased Cellulase 0 Galactose to Succinic Acid 0 Lignin to Soluble Lignin 0.1 Other Sol Solids in Purchased Cellulase 0 Galactose to Acetic Acid 0 S/L Separation Soluble Sugars in Produced Cellulase 545 Galactose to Lactic Acid 0 Water/Hydrolyzate Ratio (kg/kg) 0.58 Other Sol Solids in Produced Cellulase 2,781 Mannose to Ethanol 0 Water to S/L Separator (kg/hr) 137,416 Mannose to Zymo 0

77
Pretreatment, cont. Saccharification, cont. Fermentation, cont. Dilution Water (kg/hr) 19,186 Soluble Sugars From Sacc 41,246 Mannose to Glycerol 0 Conditioning Other Soluble Solids From Sacc 17,136 Mannose to Succinic Acid 0 Ca(OH)2 to Gypsum 0.175 Soluble Sugars From Seed Train 783 Mannose to Acetic Acid 0 Sugar Conversion to TAR: Other Soluble Solids From Seed Train 2,003 Mannose to Lactic Acid 0 Xylose 0.13 Soluble Sugars From DAP 0 Arabinose 0.2 Other Soluble Solids From DAP 0 Contamination Loss 7.0% Glucose 0.12 Soluble Sugars From CSL 0 Galactose 0.28 Other Soluble Solids From CSL 2,056 Ethanol Out of Fermenters (wt%) 4.5% Mannose 0 Cellobiose 0.36

78
Appendix G - General Process Description Area 100
The feedstock handling area receives the corn stover in bales. After being unwrapped, stover is washed to remove dirt before being passed through a magnetic separator to remove tramp metal and then conveyed to the shredders for size reduction.
Area 200
In the pretreatment area, biomass undergoes a physical and/or chemical treatment, which allows for improved exposure of the cellulose during enzymatic hydrolysis. The details of the four pretreatment processes are discussed under the Pretreatment Variation section of process variations in the results section.
Area 300
Enzymatic saccharification followed by fermentation of sugars occurs in this area. The pretreatment hydrolyzate from Area 200 is pumped into 18 parallel saccharification vessels (each has a capacity of 1 MM gal) where enzyme is added (enzyme loading of 31.3 mg protein/g cellulose) either from purchased stock preparation or from the on-site enzyme production section (Area 400). The residence time for saccharification is 5 days. Note that for two-stage dilute acid treatment, acid is used in place of enzyme to hydrolyze the cellulose and xylan.
A small fraction of the hydrolyzate leaving the saccharification vessel is sent to one of two sequenced batch fermentation seed vessel trains to be used as a carbon source for the growth of the fermentative organism, Zymomonas mobilis. Nutrients such as CSL and diammonium phosphate are also added into the bio-reactors.
The bulk of the hydrolyzate from the saccharification vessels is pumped to one of eight parallel sequenced batch fermentation reactors, where Zymomonas mobilis is introduced from the seed reactors. A 2 day residence time is used for fermentation. Vent gas from the fermentors is scrubbed to collect escaped ethanol in the scrubber and sent to the beer column along with fermented beer from the fermentors.
Area 500
Ethanol is separated and recovered from water and residual solids in this section. Fermented beer is distilled in two distillation columns: beer column and rectification column. The beer column removes dissolved CO2 and vapor generating a concentrated ethanol stream. The rectification column purifies the ethanol to about 95 wt% concentration. Nearly all of the remaining water is removed in a molecular sieve adsorption column. The stillage from the beer column is pumped to the 1st-effect evaporator where water content is reduced, followed by dewatering in a Pneumapress filter and screw press to separate most of the insoluble solids, comprising mainly lignin, from the aqueous stream. The liquid fraction from the screw press is concentrated in the 2nd- and the 3rd-effect evaporators to high concentration syrup of soluble solids. The evaporator syrup and the dewatered solid fraction from the screw press are used as boiler fuel in the fluidized bed combustor.

79
Boiler Blowdown
Evaporator Condensate(435 MT/d)
(155 MT/d)
Equalizing Basin
T = 35 oCP = 1 atm
To Scrubber(7 MT/d)
Nutrient Feed
System
(477 MT/d)
Pretreatment Flash(1073 MT/d)
T = 35 oCP = 1 atm
Cooling Tower Blowdown(379 MT/d)
S/L Sep Vent Condensate(12 MT/d)
Aerobic Digester
AirVapor to
Atmosphere(485 MT/d)
Aerobic Digester
Nutrient(0.7 MT/d)
Was
tew
ater
Wastewater(2048 MT/d)
ClarifierT = 21.1 oCP = 1 atm
To Process Water Inlet(2037 MT/d)
Sludge To Combustor(2.7 MT/d)
S/L Separation
Water Return(14 MT/d)
(16 MT/d)Solid Suspension
To Clarifier(2053 MT/d)
Area 600
Wastewater is treated in anaerobic and aerobic digesters. In the anaerobic digester, a small amount of urea, phosphoric acid, and micronutrients are added as nutrients for the anaerobic organisms. Biogas from the anaerobic digester is used as boiler fuel. The wastewater is further treated aerobically. It is then held in a clarifying tank where the settled solids are separated from the water. The solids are dewatered in a belt filter press, with a polymer being added to aid in dewatering, followed by a screw press. The resulting sludge is used as boiler fuel. The water from the clarifying tank is recycled as process water.
Figure G-1. Wastewater treatment section (Area 600)

80
Lignin (1137 MT/d)
To Deareator
Steam to Evaporator
Evaporator Syrup(1882 MT/d)
Digester Solids (3 MT/d)
Biogas (7 MT/d)
Boiler Feed Water (5181 MT/d)
Preheated Air (7794 MT/d)
Blowdown to WWT (155 MT/d)
Steam to Area 200, 300, 500, 800 & 900
Flue Gas
Generator
To Plant
To Grid
Super heated Steam
Boiler
Turbine
Ash (279 MT/d)
To Stack
(10544 MT/d)Bag-
house
To Pretreatment Reactor(906 MT/d)
(2361 MT/d)
(129 MT/d)
(5026 MT/d)
(1630 MT/d)
Area 800
Cogeneration of steam for process heat and electricity occurs in Area 800. Evaporator syrup, insoluble solids from the Pneumapress, wastewater treatment sludge, and biogas are used as fuel in the fluidized bed combustor. Superheated steam is generated in the boiler and exits the multi-stage turbine at three different conditions needed in the process.
Figure G-2. Steam and power generation section (Area 800)
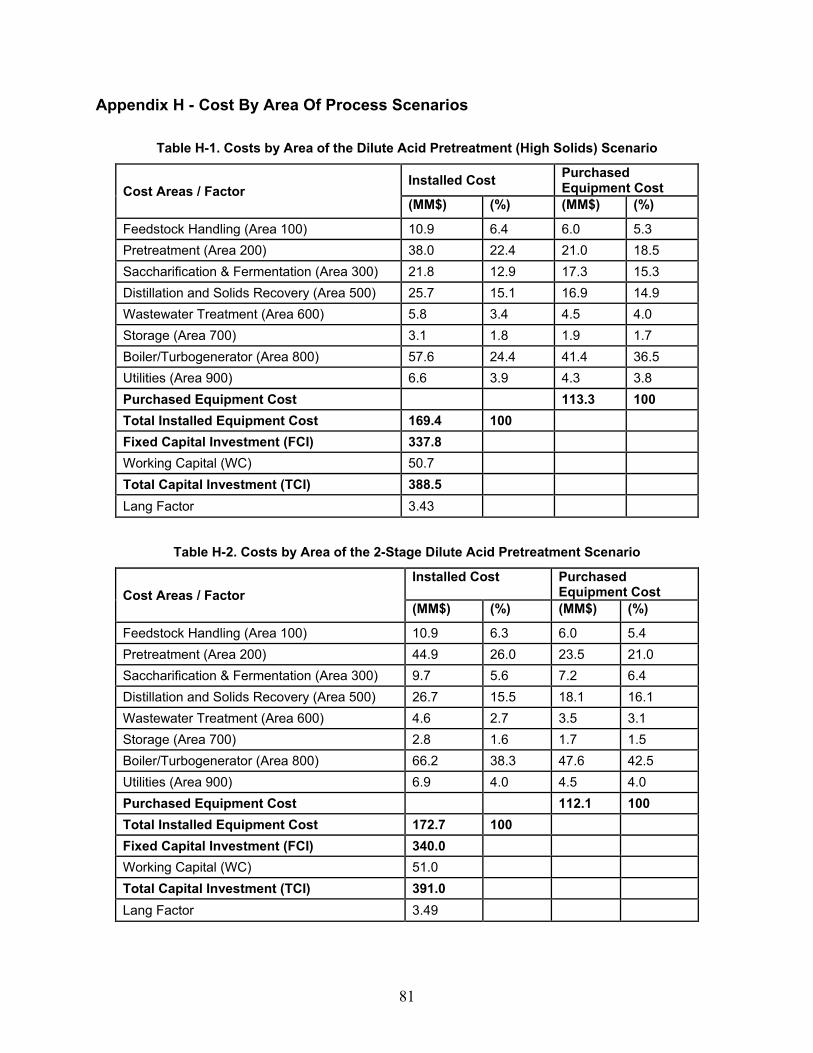
81
Appendix H - Cost By Area Of Process Scenarios
Table H-1. Costs by Area of the Dilute Acid Pretreatment (High Solids) Scenario
Cost Areas / Factor Installed Cost Purchased
Equipment Cost (MM$) (%) (MM$) (%)
Feedstock Handling (Area 100) 10.9 6.4 6.0 5.3 Pretreatment (Area 200) 38.0 22.4 21.0 18.5 Saccharification & Fermentation (Area 300) 21.8 12.9 17.3 15.3 Distillation and Solids Recovery (Area 500) 25.7 15.1 16.9 14.9 Wastewater Treatment (Area 600) 5.8 3.4 4.5 4.0 Storage (Area 700) 3.1 1.8 1.9 1.7 Boiler/Turbogenerator (Area 800) 57.6 24.4 41.4 36.5 Utilities (Area 900) 6.6 3.9 4.3 3.8 Purchased Equipment Cost 113.3 100 Total Installed Equipment Cost 169.4 100 Fixed Capital Investment (FCI) 337.8 Working Capital (WC) 50.7 Total Capital Investment (TCI) 388.5 Lang Factor 3.43
Table H-2. Costs by Area of the 2-Stage Dilute Acid Pretreatment Scenario
Cost Areas / Factor Installed Cost Purchased
Equipment Cost (MM$) (%) (MM$) (%)
Feedstock Handling (Area 100) 10.9 6.3 6.0 5.4 Pretreatment (Area 200) 44.9 26.0 23.5 21.0 Saccharification & Fermentation (Area 300) 9.7 5.6 7.2 6.4 Distillation and Solids Recovery (Area 500) 26.7 15.5 18.1 16.1 Wastewater Treatment (Area 600) 4.6 2.7 3.5 3.1 Storage (Area 700) 2.8 1.6 1.7 1.5 Boiler/Turbogenerator (Area 800) 66.2 38.3 47.6 42.5 Utilities (Area 900) 6.9 4.0 4.5 4.0 Purchased Equipment Cost 112.1 100 Total Installed Equipment Cost 172.7 100 Fixed Capital Investment (FCI) 340.0 Working Capital (WC) 51.0 Total Capital Investment (TCI) 391.0 Lang Factor 3.49
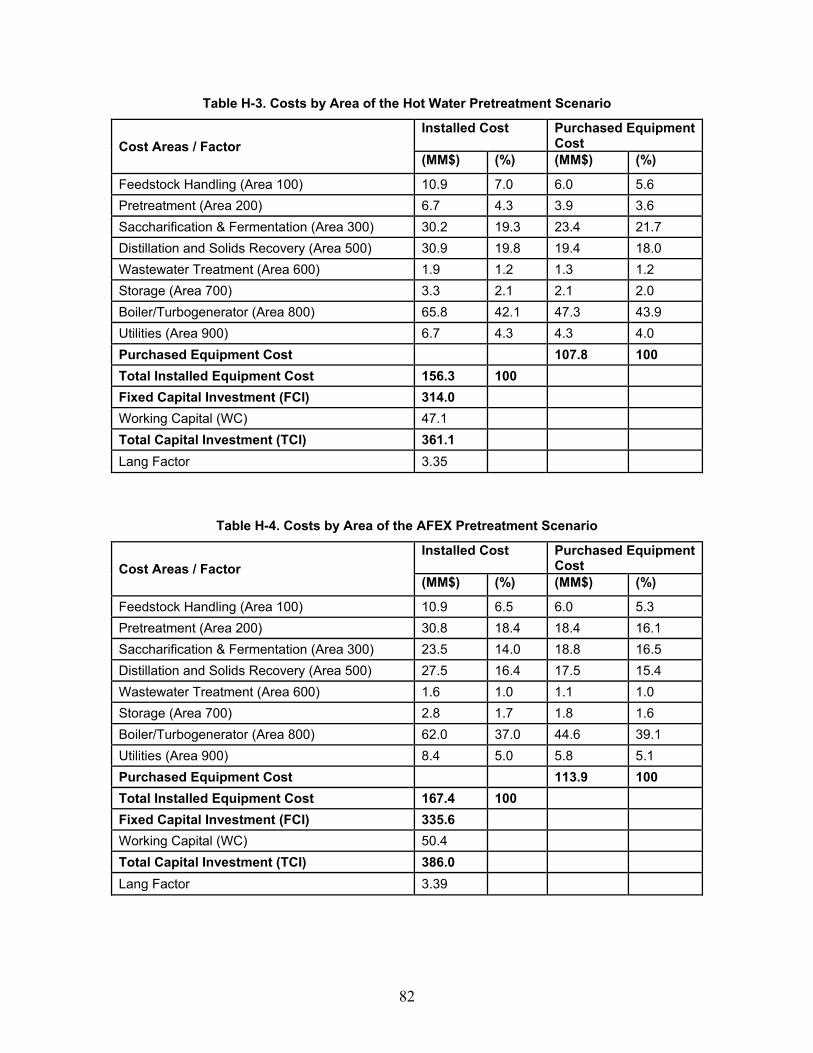
82
Table H-3. Costs by Area of the Hot Water Pretreatment Scenario
Cost Areas / Factor Installed Cost Purchased Equipment
Cost (MM$) (%) (MM$) (%)
Feedstock Handling (Area 100) 10.9 7.0 6.0 5.6 Pretreatment (Area 200) 6.7 4.3 3.9 3.6 Saccharification & Fermentation (Area 300) 30.2 19.3 23.4 21.7 Distillation and Solids Recovery (Area 500) 30.9 19.8 19.4 18.0 Wastewater Treatment (Area 600) 1.9 1.2 1.3 1.2 Storage (Area 700) 3.3 2.1 2.1 2.0 Boiler/Turbogenerator (Area 800) 65.8 42.1 47.3 43.9 Utilities (Area 900) 6.7 4.3 4.3 4.0 Purchased Equipment Cost 107.8 100 Total Installed Equipment Cost 156.3 100 Fixed Capital Investment (FCI) 314.0 Working Capital (WC) 47.1 Total Capital Investment (TCI) 361.1 Lang Factor 3.35
Table H-4. Costs by Area of the AFEX Pretreatment Scenario
Cost Areas / Factor Installed Cost Purchased Equipment
Cost (MM$) (%) (MM$) (%)
Feedstock Handling (Area 100) 10.9 6.5 6.0 5.3 Pretreatment (Area 200) 30.8 18.4 18.4 16.1 Saccharification & Fermentation (Area 300) 23.5 14.0 18.8 16.5 Distillation and Solids Recovery (Area 500) 27.5 16.4 17.5 15.4 Wastewater Treatment (Area 600) 1.6 1.0 1.1 1.0 Storage (Area 700) 2.8 1.7 1.8 1.6 Boiler/Turbogenerator (Area 800) 62.0 37.0 44.6 39.1 Utilities (Area 900) 8.4 5.0 5.8 5.1 Purchased Equipment Cost 113.9 100 Total Installed Equipment Cost 167.4 100 Fixed Capital Investment (FCI) 335.6 Working Capital (WC) 50.4 Total Capital Investment (TCI) 386.0 Lang Factor 3.39

83
Table H-5. Costs by Area of the Separate C-5 and C-6 Fermentation Process Scenario
Cost Areas / Factor Installed Cost Purchased Equipment
Cost (MM$) (%) (MM$) (%)
Feedstock Handling (Area 100) 11.4 6.8 6.2 5.5 Pretreatment (Area 200) 34.2 20.4 18.4 16.4 Saccharification & Fermentation (Area 300) 29.6 17.6 23.7 21.1 Distillation and Solids Recovery (Area 500) 27.3 16.3 17.8 15.8 Wastewater Treatment (Area 600) 3.1 1.8 2.3 2.0 Storage (Area 700) 5.1 3.0 3.4 3.0 Boiler/Turbogenerator (Area 800) 50.9 30.3 36.5 32.5 Utilities (Area 900) 6.2 3.7 4.1 3.6 Purchased Equipment Cost 112.4 100 Total Installed Equipment Cost 167.8 100 Fixed Capital Investment (FCI) 335.4 Working Capital (WC) 50.3 Total Capital Investment (TCI) 385.8 Lang Factor 3.43
Table H-6. Costs by Area of the Pervaporation Process Scenario
Cost Areas / Factor Installed Cost Purchased Equipment
Cost (MM$) (%) (MM$) (%)
Feedstock Handling (Area 100) 10.9 5.2 6.0 3.9 Pretreatment (Area 200) 36.2 17.3 19.7 12.7 Saccharification & Fermentation (Area 300) 21.9 10.5 17.4 11.2 Distillation and Solids Recovery (Area 500) 70.8 33.8 62.9 40.5 Wastewater Treatment (Area 600) 3.3 1.6 2.4 1.5 Storage (Area 700) 3.3 1.6 2.1 1.4 Boiler/Turbogenerator (Area 800) 55.9 26.7 40.1 25.8 Utilities (Area 900) 7.0 3.3 4.6 3.0 Purchased Equipment Cost 155.2 100 Total Installed Equipment Cost 209.2 100 Fixed Capital Investment (FCI) 435.7 Working Capital (WC) 65.4 Total Capital Investment (TCI) 501.0 Lang Factor 3.23

84
Table H-7. Costs by Area of the On-site Enzyme Production Processes Scenario
Cost Areas / Factor Installed Cost Purchased Equipment
Cost (MM$) (%) (MM$) (%)
Feedstock Handling (Area 100) 10.9 5.8 6.0 4.7 Pretreatment (Area 200) 36.2 19.3 19.7 15.5 Saccharification & Fermentation (Area 300) 21.8 11.6 17.3 13.6 On-site Enzyme Production (Area 400) 23.7 12.6 17.9 14.0 Distillation and Solids Recovery (Area 500) 25.3 13.5 16.8 13.2 Wastewater Treatment (Area 600) 3.4 1.9 2.6 2.0 Storage (Area 700) 2.5 1.3 1.6 1.2 Boiler/Turbogenerator (Area 800) 57.2 30.4 41.1 32.3 Utilities (Area 900) 6.8 3.6 4.4 3.5 Purchased Equipment Cost 127.4 100 Total Installed Equipment Cost 187.8 100 Fixed Capital Investment (FCI) 377.5 Working Capital (WC) 56.6 Total Capital Investment (TCI) 434.2 Lang Factor 3.41
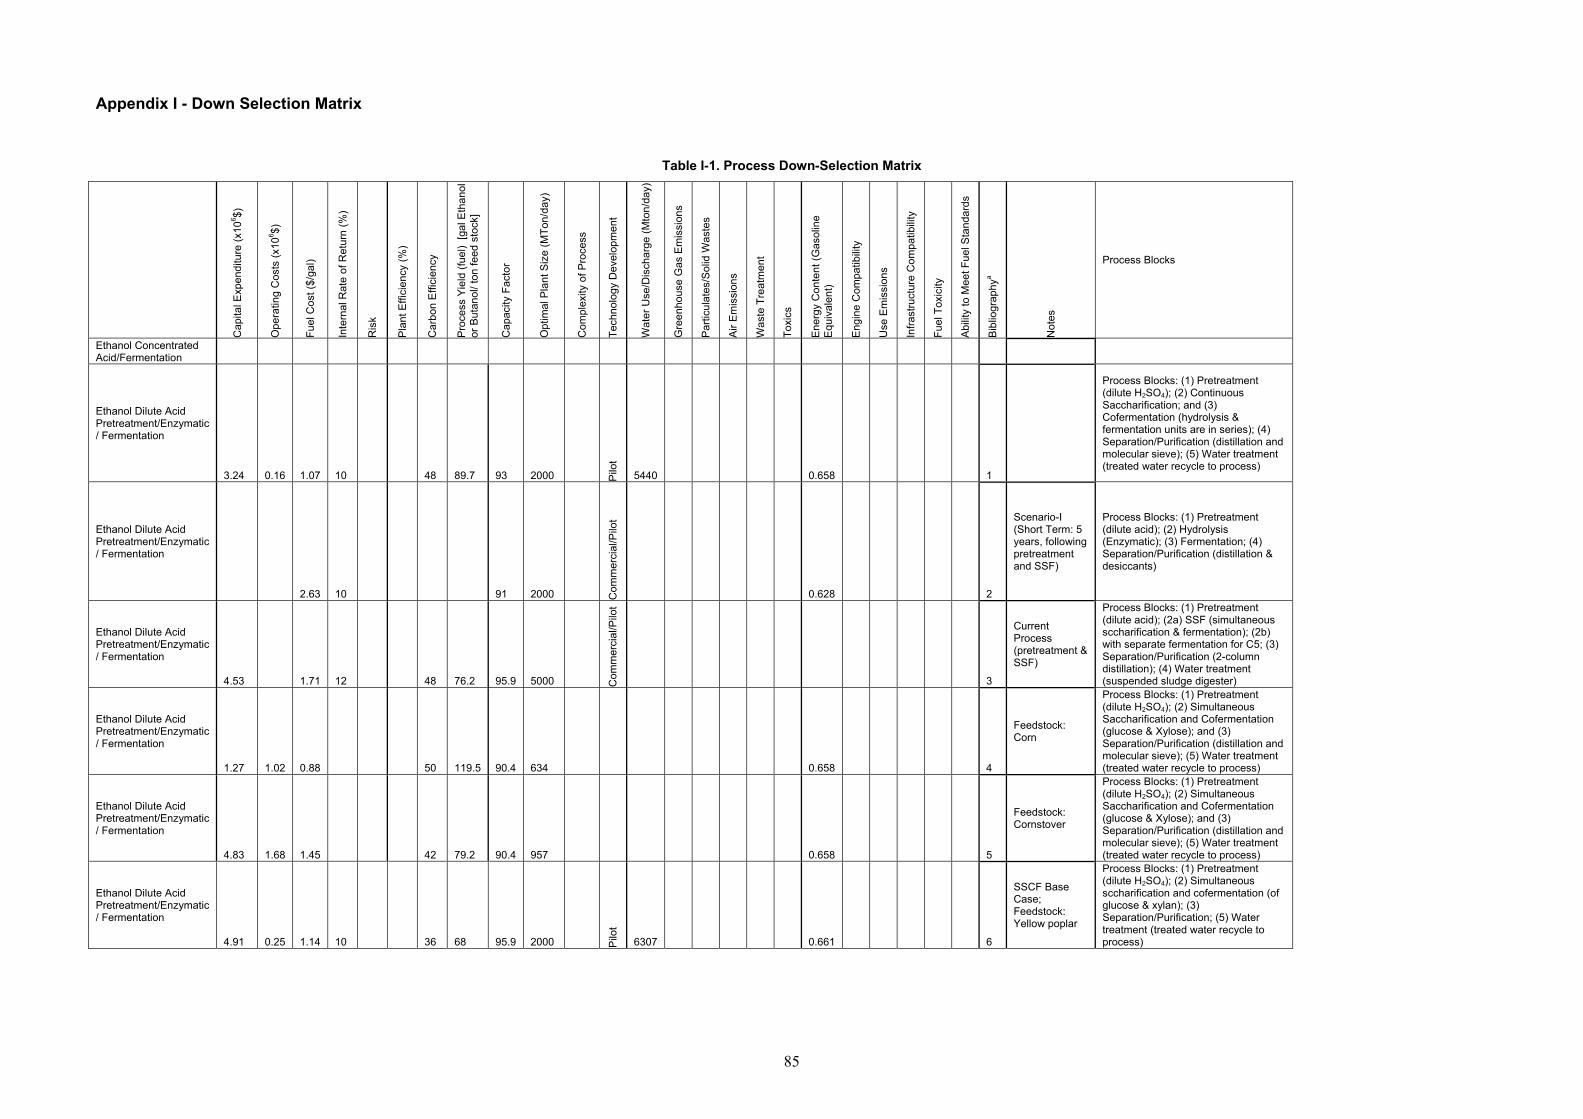
85
Appendix I - Down Selection Matrix
Table I-1. Process Down-Selection Matrix
Cap
ital E
xpen
ditu
re (x
106 $)
Ope
ratin
g C
osts
(x10
6 $)
Fuel
Cos
t ($/
gal)
Inte
rnal
Rat
e of
Ret
urn
(%)
Ris
k
Pla
nt E
ffici
ency
(%)
Car
bon
Effi
cien
cy
Pro
cess
Yie
ld (f
uel)
[gal
Eth
anol
or
But
anol
/ ton
feed
sto
ck]
Cap
acity
Fac
tor
Opt
imal
Pla
nt S
ize
(MTo
n/da
y)
Com
plex
ity o
f Pro
cess
Tech
nolo
gy D
evel
opm
ent
Wat
er U
se/D
isch
arge
(Mto
n/da
y)
Gre
enho
use
Gas
Em
issi
ons
Par
ticul
ates
/Sol
id W
aste
s
Air
Em
issi
ons
Was
te T
reat
men
t
Toxi
cs
Ene
rgy
Con
tent
(Gas
olin
e E
quiv
alen
t)
Eng
ine
Com
patib
ility
Use
Em
issi
ons
Infra
stru
ctur
e C
ompa
tibili
ty
Fuel
Tox
icity
Abi
lity
to M
eet F
uel S
tand
ards
Bib
liogr
aphy
a
Not
es
Process Blocks
Ethanol Concentrated Acid/Fermentation
Ethanol Dilute Acid Pretreatment/Enzymatic / Fermentation
3.24 0.16 1.07 10 48 89.7 93 2000 Pilo
t
5440 0.658 1
Process Blocks: (1) Pretreatment (dilute H2SO4); (2) Continuous Saccharification; and (3) Cofermentation (hydrolysis & fermentation units are in series); (4) Separation/Purification (distillation and molecular sieve); (5) Water treatment (treated water recycle to process)
Ethanol Dilute Acid Pretreatment/Enzymatic / Fermentation
2.63 10 91 2000 Com
mer
cial
/Pilo
t 0.628 2
Scenario-I (Short Term: 5 years, following pretreatment and SSF)
Process Blocks: (1) Pretreatment (dilute acid); (2) Hydrolysis (Enzymatic); (3) Fermentation; (4) Separation/Purification (distillation & desiccants)
Ethanol Dilute Acid Pretreatment/Enzymatic / Fermentation
4.53 1.71 12 48 76.2 95.9 5000 Com
mer
cial
/Pilo
t
3
Current Process (pretreatment & SSF)
Process Blocks: (1) Pretreatment (dilute acid); (2a) SSF (simultaneous sccharification & fermentation); (2b) with separate fermentation for C5; (3) Separation/Purification (2-column distillation); (4) Water treatment (suspended sludge digester)
Ethanol Dilute Acid Pretreatment/Enzymatic / Fermentation
1.27 1.02 0.88 50 119.5 90.4 634 0.658 4
Feedstock: Corn
Process Blocks: (1) Pretreatment (dilute H2SO4); (2) Simultaneous Saccharification and Cofermentation (glucose & Xylose); and (3) Separation/Purification (distillation and molecular sieve); (5) Water treatment (treated water recycle to process)
Ethanol Dilute Acid Pretreatment/Enzymatic / Fermentation
4.83 1.68 1.45 42 79.2 90.4 957 0.658 5
Feedstock: Cornstover
Process Blocks: (1) Pretreatment (dilute H2SO4); (2) Simultaneous Saccharification and Cofermentation (glucose & Xylose); and (3) Separation/Purification (distillation and molecular sieve); (5) Water treatment (treated water recycle to process)
Ethanol Dilute Acid Pretreatment/Enzymatic / Fermentation
4.91 0.25 1.14 10 36 68 95.9 2000 Pilo
t
6307 0.661 6
SSCF Base Case; Feedstock: Yellow poplar
Process Blocks: (1) Pretreatment (dilute H2SO4); (2) Simultaneous sccharification and cofermentation (of glucose & xylan); (3) Separation/Purification; (5) Water treatment (treated water recycle to process)

86
Cap
ital E
xpen
ditu
re (x
106 $)
Ope
ratin
g C
osts
(x10
6 $)
Fuel
Cos
t ($/
gal)
Inte
rnal
Rat
e of
Ret
urn
(%)
Ris
k
Pla
nt E
ffici
ency
(%)
Car
bon
Effi
cien
cy
Pro
cess
Yie
ld (f
uel)
[gal
Eth
anol
or
But
anol
/ ton
feed
sto
ck]
Cap
acity
Fac
tor
Opt
imal
Pla
nt S
ize
(MTo
n/da
y)
Com
plex
ity o
f Pro
cess
Tech
nolo
gy D
evel
opm
ent
Wat
er U
se/D
isch
arge
(Mto
n/da
y)
Gre
enho
use
Gas
Em
issi
ons
Par
ticul
ates
/Sol
id W
aste
s
Air
Em
issi
ons
Was
te T
reat
men
t
Toxi
cs
Ene
rgy
Con
tent
(Gas
olin
e E
quiv
alen
t)
Eng
ine
Com
patib
ility
Use
Em
issi
ons
Infra
stru
ctur
e C
ompa
tibili
ty
Fuel
Tox
icity
Abi
lity
to M
eet F
uel S
tand
ards
Bib
liogr
aphy
a
Not
es
Process Blocks
Ethanol Dilute Acid Pretreatment/Enzymatic / Fermentation
3.85 1.16 10 40 76 95.9 2000 Pilo
t
6307 0.661 7
SSCF Near Term; Feedstock: Yellow poplar
Ethanol Dilute Acid Pretreatment/Enzymatic / Fermentation
2.98 0.94 10 42 81 95.9 2000 Pilo
t
6307 0.661 8
SSCF 2005; Feedstock: Yellow poplar
Ethanol Dilute Acid Pretreatment/Enzymatic / Fermentation
2.37 0.82 10 49 94 95.9 2000 Pilo
t
6307 0.661 9
SSCF 2010; Feedstock: Yellow poplar
Ethanol Dilute Acid Pretreatment/Enzymatic / Fermentation
2.29 0.76 10 52 99 95.9 2000 Pilo
t
6307 0.661 10
SSCF 2015; Feedstock: Yellow poplar
Ethanol Dilute Acid Pretreatment/Enzymatic / Fermentation
8.67 1.76 1.25 15 78 33 100 4360 Pilo
t 11
SHF (TVA process); High profit from co-products: furfural
Process Blocks: (1) Pretreatment (dilute H2SO4); (2) Hydrolysis (Enzymatic); (3) Fermentation (Hexose & Pentose in separate vessels); (4) Separation/Purification (distillation); (5) Waste treatment
Ethanol SO2-Steam Pretreatment/Enzymatic / Fermentation
5.58 0.45 0.98 25 42 78.5 100 500 12
SO2 & NaOH in 2-step preteratment; Rate of return on working capital
Process Blocks: (1) Pretreatment (SO2, Steam); (2) Hydrolysis (Enzymatic); (3a) Fermentation, and (3b) fermentation of C5 sugars in separate vessels; (4) Seperation; (5) water treatment
Ethanol SO2-Steam Pretreatment/Enzymatic / Fermentation
13.61 0.75 5 36 69.6 91.2 586.8 lab 552 0.624 13
SHF process; SO2 is used for pretreatment; Total Investment is 1184 MSKR
Process Blocks: (1) Pretreatment (Stake Tech: SO2 & Steam); (2) Hydrolysis (Enzymatic); (3) Fermentation; (4) Separation/Purification (distillation & drying)
Ethanol SO2-Steam Pretreatment/Enzymatic / Fermentation
9.18 0.83 5 41 79.2 91.2 586.8 lab 586 0.618 14
SSF process; SO2 is used for pretreatment; Total Investment is 910 MSKR
Process Blocks: (1) Pretreatment (Stake Tech: SO2 & Steam); (2) SSF (Simultaneous Saccharification & Fermentation); (3) Separation/Purification (distillation & drying)
Ethanol SO2-Steam Pretreatment/Enzymatic / Fermentation
8.63 2.24 6 40 76.8 91.2 600 lab 0.621 15
SSF process; SO2 is used for pretreatment; One-Step Pretreatment; Total Investment is 847 MSKR
Process Blocks: (1) Pretreatment (Stake Tech: SO2 & Steam); (2) SSF (Simultaneous Saccharification & Fermentation; feed batch); (3) Separation/Purification (2-separate stripper & rectifier operations)
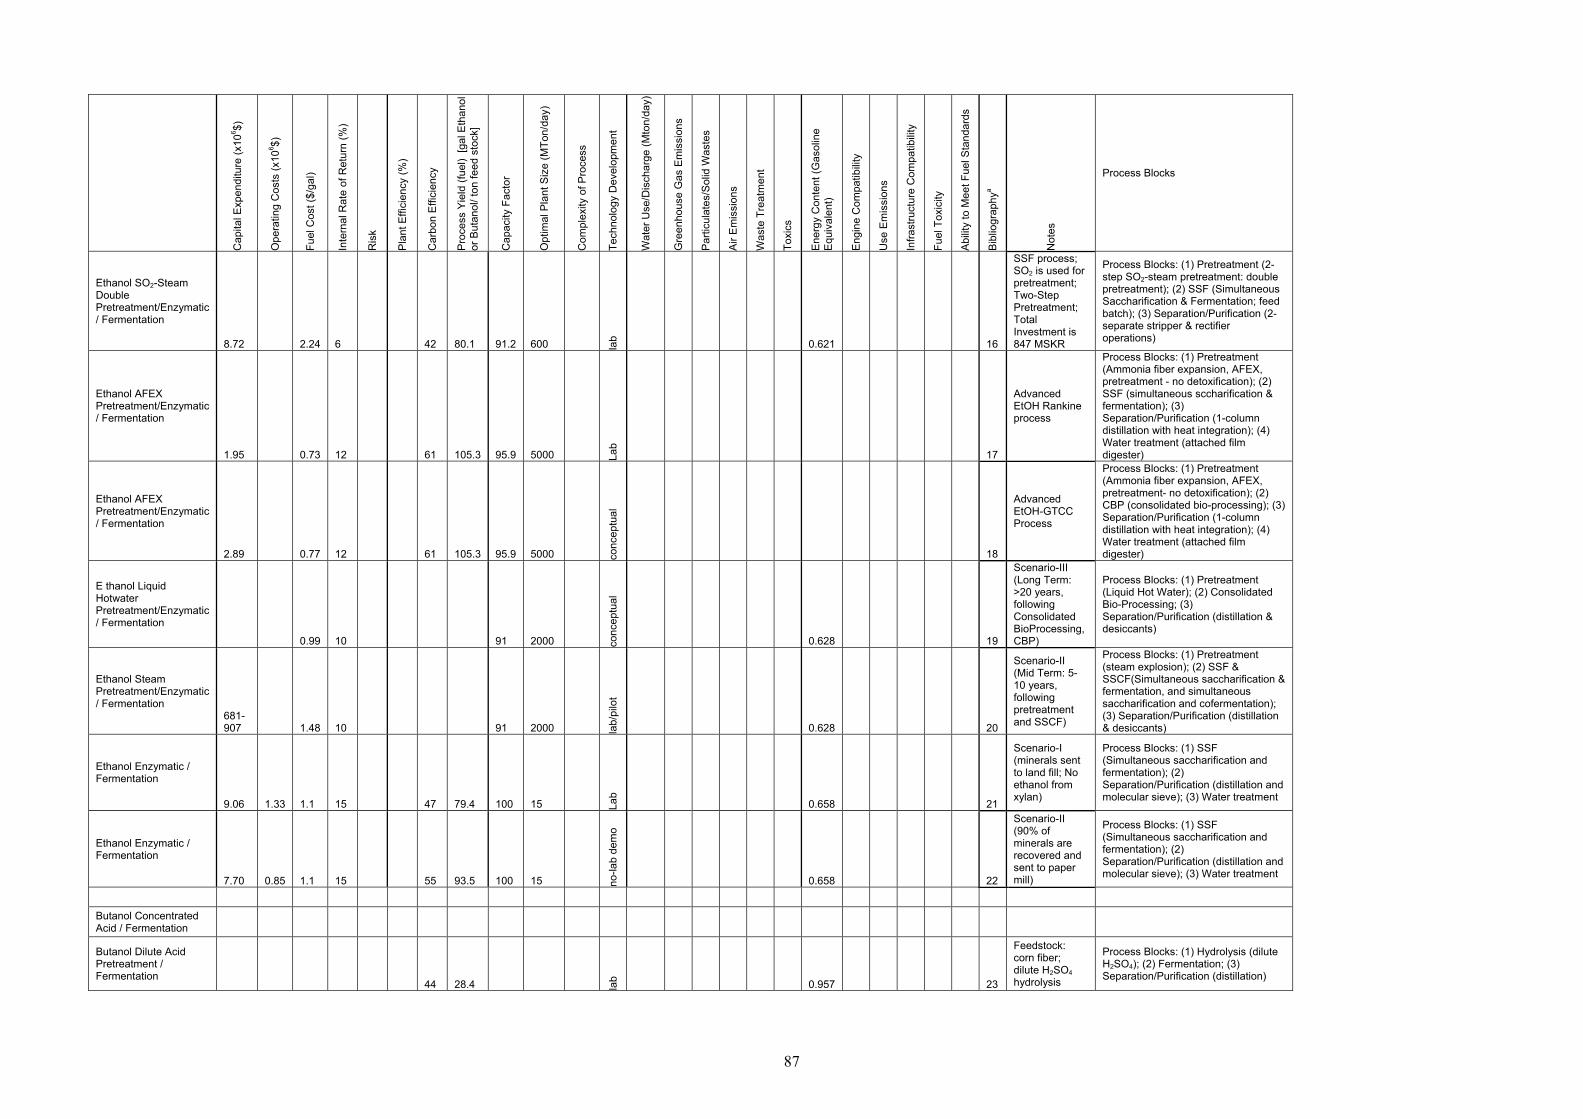
87
Cap
ital E
xpen
ditu
re (x
106 $)
Ope
ratin
g C
osts
(x10
6 $)
Fuel
Cos
t ($/
gal)
Inte
rnal
Rat
e of
Ret
urn
(%)
Ris
k
Pla
nt E
ffici
ency
(%)
Car
bon
Effi
cien
cy
Pro
cess
Yie
ld (f
uel)
[gal
Eth
anol
or
But
anol
/ ton
feed
sto
ck]
Cap
acity
Fac
tor
Opt
imal
Pla
nt S
ize
(MTo
n/da
y)
Com
plex
ity o
f Pro
cess
Tech
nolo
gy D
evel
opm
ent
Wat
er U
se/D
isch
arge
(Mto
n/da
y)
Gre
enho
use
Gas
Em
issi
ons
Par
ticul
ates
/Sol
id W
aste
s
Air
Em
issi
ons
Was
te T
reat
men
t
Toxi
cs
Ene
rgy
Con
tent
(Gas
olin
e E
quiv
alen
t)
Eng
ine
Com
patib
ility
Use
Em
issi
ons
Infra
stru
ctur
e C
ompa
tibili
ty
Fuel
Tox
icity
Abi
lity
to M
eet F
uel S
tand
ards
Bib
liogr
aphy
a
Not
es
Process Blocks
Ethanol SO2-Steam Double Pretreatment/Enzymatic / Fermentation
8.72 2.24 6 42 80.1 91.2 600 lab 0.621 16
SSF process; SO2 is used for pretreatment; Two-Step Pretreatment; Total Investment is 847 MSKR
Process Blocks: (1) Pretreatment (2-step SO2-steam pretreatment: double pretreatment); (2) SSF (Simultaneous Saccharification & Fermentation; feed batch); (3) Separation/Purification (2-separate stripper & rectifier operations)
Ethanol AFEX Pretreatment/Enzymatic / Fermentation
1.95 0.73 12 61 105.3 95.9 5000 Lab
17
Advanced EtOH Rankine process
Process Blocks: (1) Pretreatment (Ammonia fiber expansion, AFEX, pretreatment - no detoxification); (2) SSF (simultaneous sccharification & fermentation); (3) Separation/Purification (1-column distillation with heat integration); (4) Water treatment (attached film digester)
Ethanol AFEX Pretreatment/Enzymatic / Fermentation
2.89 0.77 12 61 105.3 95.9 5000 conc
eptu
al
18
Advanced EtOH-GTCC Process
Process Blocks: (1) Pretreatment (Ammonia fiber expansion, AFEX, pretreatment- no detoxification); (2) CBP (consolidated bio-processing); (3) Separation/Purification (1-column distillation with heat integration); (4) Water treatment (attached film digester)
E thanol Liquid Hotwater Pretreatment/Enzymatic / Fermentation
0.99 10 91 2000 conc
eptu
al
0.628 19
Scenario-III (Long Term: >20 years, following Consolidated BioProcessing, CBP)
Process Blocks: (1) Pretreatment (Liquid Hot Water); (2) Consolidated Bio-Processing; (3) Separation/Purification (distillation & desiccants)
Ethanol Steam Pretreatment/Enzymatic / Fermentation
681-907 1.48 10 91 2000 la
b/pi
lot
0.628 20
Scenario-II (Mid Term: 5-10 years, following pretreatment and SSCF)
Process Blocks: (1) Pretreatment (steam explosion); (2) SSF & SSCF(Simultaneous saccharification & fermentation, and simultaneous saccharification and cofermentation); (3) Separation/Purification (distillation & desiccants)
Ethanol Enzymatic / Fermentation
9.06 1.33 1.1 15 47 79.4 100 15 Lab
0.658 21
Scenario-I (minerals sent to land fill; No ethanol from xylan)
Process Blocks: (1) SSF (Simultaneous saccharification and fermentation); (2) Separation/Purification (distillation and molecular sieve); (3) Water treatment
Ethanol Enzymatic / Fermentation
7.70 0.85 1.1 15 55 93.5 100 15 no-la
b de
mo
0.658 22
Scenario-II (90% of minerals are recovered and sent to paper mill)
Process Blocks: (1) SSF (Simultaneous saccharification and fermentation); (2) Separation/Purification (distillation and molecular sieve); (3) Water treatment
Butanol Concentrated Acid / Fermentation
Butanol Dilute Acid Pretreatment / Fermentation
44 28.4 lab 0.957 23
Feedstock: corn fiber; dilute H2SO4 hydrolysis
Process Blocks: (1) Hydrolysis (dilute H2SO4); (2) Fermentation; (3) Separation/Purification (distillation)

88
Cap
ital E
xpen
ditu
re (x
106 $)
Ope
ratin
g C
osts
(x10
6 $)
Fuel
Cos
t ($/
gal)
Inte
rnal
Rat
e of
Ret
urn
(%)
Ris
k
Pla
nt E
ffici
ency
(%)
Car
bon
Effi
cien
cy
Pro
cess
Yie
ld (f
uel)
[gal
Eth
anol
or
But
anol
/ ton
feed
sto
ck]
Cap
acity
Fac
tor
Opt
imal
Pla
nt S
ize
(MTo
n/da
y)
Com
plex
ity o
f Pro
cess
Tech
nolo
gy D
evel
opm
ent
Wat
er U
se/D
isch
arge
(Mto
n/da
y)
Gre
enho
use
Gas
Em
issi
ons
Par
ticul
ates
/Sol
id W
aste
s
Air
Em
issi
ons
Was
te T
reat
men
t
Toxi
cs
Ene
rgy
Con
tent
(Gas
olin
e E
quiv
alen
t)
Eng
ine
Com
patib
ility
Use
Em
issi
ons
Infra
stru
ctur
e C
ompa
tibili
ty
Fuel
Tox
icity
Abi
lity
to M
eet F
uel S
tand
ards
Bib
liogr
aphy
a
Not
es
Process Blocks
Butanol AFEX Pretreatment / Enzymatic / Fermentation
Butanol Hotwater Pretreatment / Enzymatic / Fermentation
65 57.6 Lab
0.957 24
Feedstock: Saccharified Liquefied Cornstarch (SLCS) with moisture content of approximately 60%
Process Blocks: (1) Hydrolysis (enzymatic hydrolysis of LCS to SLCS); (2) Fermentation; (3) Separation/Purification
Butanol Hotwater Pretreatment / Fermentation
60 54 Lab
0.957 25
Feedstock: Liquefied Cornstarch (LCS) with moisture content of approximately 60%
Process Blocks: (1) Simultaneous saccharification and Fermentation; (2) Separation/Purification
Butanol Enzyme / Fermentation
0.81 0.07 0.74
10-30 66 89.84 95.9 1469 la
b 0.949 26
Feedstock: corn (14% moisture); Hydrolysis + Immobilized Cell Continuous Fermentation & pervaporative recovery, ICCFPR process
Process Blocks: (1) Hydrolysis (enzymatic); (2) Fermentation (contineous); (3) Separation/Purification (pervaporation & distillation)
Butanol Fermentation
1.31 0.15 0.81 15 58 5.52 100 2268 lab 0.957 27
Feedstock: Whey permeat (4.5% lactose); Fibrous Bed Reactor, FBR; Process: 2 step fermentation
Process Blocks: (1) 2-step Fermentation (i. fermentation of lactose to butyric acid, ii. Fermentation of butyric acis to butanil); (3) Separation/Purification (adsorption, desorption, distillation);
Butanol Fermentation
57 114 lab 0.957
Feedstock: Glucose; 2-step fermentation, FBR
Process Blocks: (1) hydrolysis of lignocellulosics/starch to fermentable sugars; (2) 2-step Fermentation of glucose (i. fermentation of lactose to butyric acid, ii. Fermentation of butyric acis to butanil); (3) Separation/Purification (adsorption, desorption, distillation);
Butanol Fermentation
2.37 0.22 1.68 20 65 89.79 95.9 1469 Pilo
t
0.947 28
Feedstock: corn (14% moisture)
Process Blocks: (1) Simultaneous saccharification and Fermentation; (2) Separation/Purification (distillation); (3) Wastewater treatment (recycling to process)
Butanol Fermentation
1.00 0.09 0.95
10-30 66 89.84 95.9 1469 P
ilot
0.949 29
Feedstock: corn (14% moisture); Batch Fermentation & pervaporative recovery, BFPR process
Process Blocks: (1) Simultaneous saccharification and Fermentation; (2) Separation/Purification (pervaporation & distillation)

89
Cap
ital E
xpen
ditu
re (x
106 $)
Ope
ratin
g C
osts
(x10
6 $)
Fuel
Cos
t ($/
gal)
Inte
rnal
Rat
e of
Ret
urn
(%)
Ris
k
Pla
nt E
ffici
ency
(%)
Car
bon
Effi
cien
cy
Pro
cess
Yie
ld (f
uel)
[gal
Eth
anol
or
But
anol
/ ton
feed
sto
ck]
Cap
acity
Fac
tor
Opt
imal
Pla
nt S
ize
(MTo
n/da
y)
Com
plex
ity o
f Pro
cess
Tech
nolo
gy D
evel
opm
ent
Wat
er U
se/D
isch
arge
(Mto
n/da
y)
Gre
enho
use
Gas
Em
issi
ons
Par
ticul
ates
/Sol
id W
aste
s
Air
Em
issi
ons
Was
te T
reat
men
t
Toxi
cs
Ene
rgy
Con
tent
(Gas
olin
e E
quiv
alen
t)
Eng
ine
Com
patib
ility
Use
Em
issi
ons
Infra
stru
ctur
e C
ompa
tibili
ty
Fuel
Tox
icity
Abi
lity
to M
eet F
uel S
tand
ards
Bib
liogr
aphy
a
Not
es
Process Blocks
Butanol Fermentation
0.93 0.08 0.81
10-30 66 89.84 95.9 1469 P
ilot
0.949 30
Feedstock: corn (14% moisture); Fed-batch Fermentation & pervaporative recovery, FBFPR process
Process Blocks: (1) Simultaneous saccharification and Fermentation; (2) Separation/Purification (pervaporation & distillation)
Zeachem Process
a Bibliography references:
1. Aden, A., et al. (2002). NREL Report NREL/TP-510-32438. 2. Hamelinck, C.N., et al. (2005). Biomass & Bioenergy, vol. 28, pp. 384-410. 3. Laser, M., et al. (2009). Biofuels Bioproducts & Biorefining, vol. 3, pp. 195-218. 4. Wallace, R., et al. (2005). NREL Report TP-510-37092. 5. Wallace, R., et al. (2005). NREL Report TP-510-37092. 6. Wooley, R., et al. (1999). NREL Report TP-580-26157. 7. Wooley, R., et al. (1999). NREL Report TP-580-26157. 8. Wooley, R., et al. (1999). NREL Report TP-580-26157. 9. Wooley, R., et al. (1999). NREL Report TP-580-26157. 10. Wooley, R., et al. (1999). NREL Report TP-580-26157. 11. Kaylen, M., et al. (2000). Bioresource Technology, vol. 72, pp. 19-32. 12. Nguyen, Q.A., Saddler, J.N. (1991). Bioresource Technology, vol. 35(3), pp. 275-282. 13. Wingen, A., et al. (2003). Biotechnology Progress, vol. 19(4), pp. 1109-1117. 14. Wingen, A., et al. (2003). Biotechnology Progress, vol. 19(4), pp. 1109-1117. 15. Wingen, A., et al. (2004). Biotechnology Progress, vol. 20(5), pp. 1421-1429. 16. Wingen, A., et al. (2004). Biotechnology Progress, vol. 20(5), pp. 1421-1429. 17. Laser, M., et al. (2009). Biofuels Bioproducts & Biorefining, vol. 3, pp. 247-270. 18. Laser, M., et al. (2009). Biofuels Bioproducts & Biorefining, vol. 3, pp. 247-270. 19. Hamelinck, C.N., et al. (2005). Biomass & Bioenergy, vol. 28, pp. 384-410. 20. Hamelinck, C.N., et al. (2005). Biomass & Bioenergy, vol. 28, pp. 384-410. 21. Fan, Z., Lynd, L.R. (2007). Bioprocess and Biosystems Engineering, vol. 30(1), pp. 35-45. 22. Fan, Z., Lynd, L.R. (2007). Bioprocess and Biosystems Engineering, vol. 30(1), pp. 35-45. 23. Ezeji, C.T., et al. (2007). Biotechnology and Bioengineering, vol. 97(6), pp. 1460-1469. 24. Ezeji, C.T., et al. (2007). Journal of Industrial Microbiology & Biotechnology, vol. 34(12), pp. 771-777. 25. Ezeji, C.T., et al. (2007). Journal of Industrial Microbiology & Biotechnology, vol. 34(12), pp. 771-777. 26. Quereshi, N., Blaschek, H.P. (2001). Bioprocess and Biosystems Engineering, vol. 24, pp. 219-226. 27. Ramney, D., Yang, S-T. (2004). Final Report, DOE; Ramey, D., Edward, D. (1998). US Patent No. 5753474; Yang, S-T. (1996). US Patent No. 5563069. 28. Quereshi, N., Blaschek, H.P. (2000). Trans I Chem E, vol. 78(C), pp. 139-144. 29. Quereshi, N., Blaschek, H.P. (2001). Bioprocess and Biosystems Engineering, vol. 24, pp. 219-226. 30. Quereshi, N., Blaschek, H.P. (2001). Bioprocess and Biosystems Engineering, vol. 24, pp. 219-226.

90
Appendix J - Analysis: Cost Growth Variables And Results
Table J-1. Plant Performance and Cost Growth Variables for Dilute Acid Pretreatment (High Solids Loading) Processes
Plant Performance (Equation 1) Cost Growth (Equation 2)
Variables
Values
Variables
Values
Opti-mistic
Most Prob-able
Pessi-mistic
Opti-mistic
Most Probable
Pessi-mistic
NEWSTEPSa 6 6 6 PCTNEW 61.4 61.4 61.4 BALEQS 50 40 30 IMPURITIES 0 3 5 WASTE 1 2 3 COMPLEXITYb 6 6 6 SOLIDS 1 1 1 INCLUSIVENESS 33 0 0
PROJECT DEFINITION 6 6 7
Plant Performance (%) 22.1 14.7 7.3 Cost Growth (%) 52.6 42.6 32.0
a New steps/units: Feedstock handling, Pretreatment, Saccharification, Cofermentation, Beer Column, and Combustor. b Continuously linked steps: Feedstock Handling, Pretreatment, Saccharification, Cofermentation, Distillation, Steam/Power Generation.
Table J-2. Plant Performance and Cost Growth Variables for Hot water Pretreatment Processes
Plant Performance (Equation 1) Cost Growth (Equation 2)
Variables
Values
Variables
Values
Opti-mistic
Most Prob-able
Pessi-mistic
Opti-mistic
Most Probable
Pessi-mistic
NEWSTEPSa 6 6 6 PCTNEW 53.6 53.6 53.6 BALEQS 50 40 30 IMPURITIES 0 3 5 WASTE 1 2 3 COMPLEXITYb 6 6 6 SOLIDS 1 1 1 INCLUSIVENESS 33 0 0
PROJECT DEFINITION 6 6 7
Plant Performance (%) 22.1 14.7 7.3 Cost Growth (%) 55.0 44.9 34.3 a New steps/units: Feedstock handling, Pretreatment, Saccharification, Cofermentation, Beer Column, and Combustor. b Continuously linked steps: Feedstock Handling, Pretreatment, Saccharification, Cofermentation, Distillation, Steam/Power Generation.

91
Table J-3. Plant Performance and Cost Growth Variables for Two-Stage Dilute Acid Pretreatment Processes
Plant Performance (Equation 1) Cost Growth (Equation 2)
Variables
Values
Variables
Values
Opti-mistic
Most Prob-able
Pessi-mistic
Opti-mistic
Most Probable
Pessi-mistic
NEWSTEPSa 6 6 6 PCTNEW 60.8 60.8 60.8 BALEQS 50 40 30 IMPURITIES 0 3 5 WASTE 1 2 3 COMPLEXITYb 6 6 6 SOLIDS 1 1 1 INCLUSIVENESS 33 0 0
PROJECT DEFINITION 6 6 7
Plant Performance (%) 22.1 14.7 7.3 Cost Growth (%) 50.8 42.8 32.2 a New steps/units: Feedstock Handling, Pretreatment, Saccharification, Cofermentation, Beer Column, and Combustor. b Continuously linked steps: Feedstock Handling, Pretreatment, Saccharification, Cofermentation, Distillation, Steam/Power Generation.
Table J-4. Plant Performance and Cost Growth Variables for AFEX Pretreatment Processes
Plant Performance (Equation 1) Cost Growth (Equation 2)
Variables
Values
Variables
Values
Opti-mistic
Most Prob-able
Pessi-mistic
Opti-mistic
Most Probable
Pessi-mistic
NEWSTEPSa 7 7 7 PCTNEW 60.38 60.38 60.38 BALEQS 50 40 30 IMPURITIES 0 3 5 WASTE 1 2 2 COMPLEXITYb 7 7 7 SOLIDS 1 1 1 INCLUSIVENESS 33 0 0
PROJECT DEFINITION 6 6 7
Plant Performance (%) 12.4 5.0 1.7 Cost Growth (%) 51.8 41.8 31.2 a New steps/units: Feedstock Handling, Pretreatment, Saccharification, Cofermentation, Ammonia Separation, Beer Column, and Combustor. b Continuously linked steps: Feedstock Handling, Pretreatment, Saccharification, Cofermentation, Ammonia recovery, Distillation, Steam/Power Generation.

92
Table J-5. Plant Performance and Cost Growth Variables for On-Site Enzyme Production Processes
Plant Performance (Equation 1) Cost Growth (Equation 2)
Variables
Values
Variables
Values
Opti-mistic
Most Prob-able
Pessi-mistic
Opti-mistic
Most Probable
Pessi-mistic
NEWSTEPSa 7 7 7 PCTNEW 66.9 66.9 66.9 BALEQS 50 40 30 IMPURITIES 0 3 5 WASTE 1 2 3 COMPLEXITYb 7 7 7 SOLIDS 1 1 1 INCLUSIVENESS 33 0 0
PROJECT DEFINITION 6 6 7
Plant Performance (%) 12.4 5.0 0 Cost Growth (%) 49.9 39.8 29.2 a New steps/units: Feedstock handling, Pretreatment, Saccharification, Cofermentation, Beer Column, Combustor, and Enzyme Production. b Continuously linked steps: Feedstock Handling, Pretreatment, Saccharification, Cofermentation, Distillation, Steam/Power Generation, and Enzyme Production.
Table J-6. PV from Cost Growth Analysis for Various Process Scenarios
Cost Item Cost Growth (Pioneer Plant)a
Most Probable Optimistic Pessimistic
Dilute Acid Pretreatment Processes (Pilot) PV ($/Gal) 6.11 5.27 7.59
Total Capital Investment (MM$) 913.9 750.1 1,198.8
Lang Factor 8.06 6.62 10.58
Hot Water Pretreatment Processes PV ($/Gal) 7.32 6.41 8.87
Total Capital Investment (MM$) 808.3 619.0 1,042.5
Lang Factor 7.50 6.21 9.67
2-Stage Dilute Acid Pretreatment Processes PV ($/Gal) 8.36 7.10 10.56
Total Capital Investment (MM$) 916.2 752.6 1,200.2
Lang Factor 8.17 6.71 10.70
AFEX Pretreatment Processes PV ($/Gal) 6.84 5.85 8.41
Total Capital Investment (MM$) 925.2 756.5 1,221.7
Lang Factor 8.12 6.64 10.72
On-site Enzyme Production Processes PV ($/Gal) 7.21 6.04 9.21
Total Capital Investment (MM$) 1,088.1 881.4 1460.9
Lang Factor 8.54 6.92 11.47 a 30% contingency is used for pioneer plant cost analysis.

F1147-E(10/2008)
REPORT DOCUMENTATION PAGE Form Approved OMB No. 0704-0188
The public reporting burden for this collection of information is estimated to average 1 hour per response, including the time for reviewing instructions, searching existing data sources, gathering and maintaining the data needed, and completing and reviewing the collection of information. Send comments regarding this burden estimate or any other aspect of this collection of information, including suggestions for reducing the burden, to Department of Defense, Executive Services and Communications Directorate (0704-0188). Respondents should be aware that notwithstanding any other provision of law, no person shall be subject to any penalty for failing to comply with a collection of information if it does not display a currently valid OMB control number. PLEASE DO NOT RETURN YOUR FORM TO THE ABOVE ORGANIZATION. 1. REPORT DATE (DD-MM-YYYY)
June 2010 2. REPORT TYPE
Technical report 3. DATES COVERED (From - To)
4. TITLE AND SUBTITLE
Techno-Economic Analysis of Biochemical Scenarios for Production of Cellulosic Ethanol
5a. CONTRACT NUMBER DE-AC36-08-GO28308
5b. GRANT NUMBER
5c. PROGRAM ELEMENT NUMBER
6. AUTHOR(S) F. Kabir Kazi, J. Fortman, R. Anex, G. Kothandaraman, D. Hsu, A, Aden, and A. Dutta
5d. PROJECT NUMBER NREL/TP-6A2-46588
5e. TASK NUMBER BB07.7510
5f. WORK UNIT NUMBER
7. PERFORMING ORGANIZATION NAME(S) AND ADDRESS(ES) National Renewable Energy Laboratory 1617 Cole Blvd. Golden, CO 80401-3393
8. PERFORMING ORGANIZATION REPORT NUMBER NREL/TP-6A2-46588
9. SPONSORING/MONITORING AGENCY NAME(S) AND ADDRESS(ES)
10. SPONSOR/MONITOR'S ACRONYM(S) NREL
11. SPONSORING/MONITORING AGENCY REPORT NUMBER
12. DISTRIBUTION AVAILABILITY STATEMENT National Technical Information Service U.S. Department of Commerce 5285 Port Royal Road Springfield, VA 22161
13. SUPPLEMENTARY NOTES
14. ABSTRACT (Maximum 200 Words) A techno-economic analysis on the production of cellulosic ethanol by fermentation was conducted to understand the viability of liquid biofuel production processes within the next 5-8 years. Initially, 35 technologies were reviewed, then a two-step down selection was performed to choose scenarios to be evaluated in a more detailed economic analysis. The lignocellulosic ethanol process was selected because it is well studied and portions of the process have been tested at pilot scales. Seven process variations were selected and examined in detail. Process designs were constrained to public data published in 2007 or earlier, without projecting for future process improvements. Economic analysis was performed for an 'nth plant' (mature technology) to obtain total investment and product value (PV). Sensitivity analysis was performed on PV to assess the impact of variations in process and economic parameters. Results show that the modeled dilute acid pretreatment process without any downstream process variation had the lowest PV of $3.40/gal of ethanol ($5.15/gallon of gasoline equivalent) in 2007 dollars. Sensitivity analysis shows that PV is most sensitive to feedstock and enzyme costs.
15. SUBJECT TERMS cellulosic ethanol; biofuels; product value; fermentation; biochemical; feedstock; enzyme; process design; economic analysis; dilute acid pretreatment
16. SECURITY CLASSIFICATION OF: 17. LIMITATION OF ABSTRACT
UL
18. NUMBER OF PAGES
19a. NAME OF RESPONSIBLE PERSON a. REPORT
Unclassified b. ABSTRACT Unclassified
c. THIS PAGE Unclassified 19b. TELEPHONE NUMBER (Include area code)
Standard Form 298 (Rev. 8/98) Prescribed by ANSI Std. Z39.18