techniques for evaluating nutrient status in farm animals
TRANSCRIPT

Together with our clients, we integrate scientific know-how and practical experience to develop livestock concepts for the 21st century. With our expertise on innovative livestock systems, nutrition, welfare, genetics and environmental impact of livestockfarming and our state-of-the art research facilities, such as Dairy Campus and Swine Innovation Centre Sterksel, we support our customers to find solutions for current and future challenges.
The mission of Wageningen UR (University & Research centre) is ‘To explore the potential of nature to improve the quality of life’. Within Wageningen UR, nine specialised research institutes of the DLO Foundation have joined forces with Wageningen University to help answer the most important questions in the domain of healthy food and living environment. With approximately 30 locations, 6,000 members of staff and 9,000 students, Wageningen UR is one of the leading organisations in its domain worldwide. The integral approach to problems and the cooperation between the various disciplines are at the heart of the unique Wageningen Approach.
Wageningen UR Livestock ResearchP.O. Box 3386700 AH WageningenThe Netherlands T +31 (0)317 480 10 77E [email protected]/livestockresearch
Livestock Research Report 846
A.J.M. Jansman and M.F.W. te Pas
Techniques for evaluating nutrient status in farm animals
Techniques for evaluating nutrient status in farm animals
A.J.M. JansmanM.F.W. te Pas
Dit onderzoek is uitgevoerd als onderdeel van de publiek-private samenwerking (PPS) “Feed4Foodure”, en is medegefinancierd door het Ministerie van Economische Zaken, in het kader van het Beleidsondersteunend Onderzoek (projectnummer BO31.03-005-001).
Wageningen UR Livestock ResearchWageningen, March 2015
Livestock Research Report 846

A.J.M. Jansman, M.F.W. te Pas 2015. Techniques for evaluating nutrient status in farm animals,Wageningen UR (University & Research centre) Livestock Research, Livestock Research Report 846.
PrefaceThe present report is prepared in the framework of the Dutch Public Private Partnership Feed4Foodure (F4F). It presents a review of the literature on techniques for measuring nutrient status in farm animal species. Special emphasis is given to the use of omics technologies for measuring nutrient status. The authors thank the members of F4F project team MMM6 “New indicators for nutrient efficiency” for their valuable remarks during the compilation of the report.
Alfons JansmanMarinus te Pas
© 2015 Wageningen UR Livestock Research, P.O. Box 338, 6700 AH Wageningen, The Netherlands,T +31 (0)317 48 39 53, E [email protected], www.wageningenUR.nl/en/livestockresearch.Livestock Research is part of Wageningen UR (University & Research centre).
All rights reserved. No part of this publication may be reproduced and/or made public, whether by print, photocopy, microfilm or any other means, without the prior permission of the publisher or author.
The ISO 9001 certification by DNV underscores our quality level. All our research commissions are in line with the Terms and Conditions of the Animal Sciences Group. These are filed with the District Court of Zwolle.
Livestock Research Report 846

Table of contents
Summary 5
1 Introduction 7
2 Methods for measuring nutrient status 10
3 Techniques for measuring nutrient status in different species 12
4 Omics technologies to measure nutrient status 15
4.1 Background 154.2 Objective 164.3 Description of techniques 164.4 Concluding remarks on the use of omics technologies for measuring nutrient
status 31
References 32
Appendix 1 Overview of publications dealing with (new) technologies and techniquesfor measuring general nutrient and energy status and nutrient requirements of farm animals and man. 37
Appendix 2 Overview of publications dealing with (new) technologies and techniquesfor measuring protein status and nutrientrequirements of farm animals and man. 44
Appendix 3 Overview of publications dealing with (new) technologies and techniques for measuring mineral and vitamin status and nutrient requirements of farm animals and man. 46

Livestock Research Report 846 | 5
Summary
It was the aim of the study to present a literature review on methods and techniques for determining nutrient status of different farm animal species (ruminants, pigs and poultry). Nutrient status is defined as the balance between the nutrient supply of the diet and the nutrient requirements of an animal or a population of animals. The focus was on energy, protein/amino acids, and minerals as the main categories of nutrients. Specific attention was also given to the use of -omics techniques (e.g. proteomics, metabolomics and transcriptomics) for measuring nutrient status and for the development and determination of biomarkers for nutrient status in farm animals.
Generally, a wide variety of techniques is available to measure nutrient status in different animal species and in man. Classically, nutrient status is determined indirectly by measuring animal performance in dependence of the dietary supply. In addition, nutrient status is determined in nutrient balance studies comparing dietary nutrient supply with nutrient retention in the body or in milk or eggs, or indirectly via measuring losses in excreta (faeces and urine) or expired air. Other options for measuring nutrient status are to use measurements on physical body composition (energy), or biomarkers for nutrient status in specific tissues, blood or urine. There is no common technique or technology available or in development for the judgement of the status for energy, protein/amino acids, minerals and vitamins at the same time in either farm animal species. Most of the techniques focus on a specific nutrient and target on the use of specific sampling matrices or sampling points for the measurements. Although over recent decades technologies and methods for analysing biological samples have largely advanced, the development of more ready to use (e.g. dipstick) techniques to measure and judge nutrient status on farm is fairly limited. The study therefore focussed especially on the (new) options to determine nutrient status in farm animals from a research perspective and not on the possibilities for their practical application and related technical issues (robustness, sensitivity, variability and reliability of measurements under practical conditions in individual or groups of animals).
Over the past decades there is more emphasis on unravelling the complexity of the processes involved in nutrient metabolism and their utilization in the animal and in specific organs and tissues. These efforts have resulted in new information, pathways and metabolic routes in nutrient metabolism in the different farm animal species and their development with age. With increasing knowledge, also the potential number of biomarkers for nutrient status in a given animal species has increased. At the same time, however, their value as unique marker may be limited due to the increasing awareness of the large number of factors influencing the concentrations of biomarkers in relevant biological matrices (e.g. blood, urine and respiratory air).
Proteomics and metabolomics techniques can be used for determination of the protein and metabolite composition of livestock products (milk, eggs, meat), in body fluids such as blood and saliva, and in excrements (faeces, urine, breath). Comparing this information with data on the dietary (digestible) nutrient supply provides knowledge on the metabolic use, transformation and nutrient requirements of individual animals or groups of animals. Furthermore, information on biological pathways derived from bioinformatics and /or systems biology analyses provide information about the status of the metabolism and variations of it in the breed and/or the individual animal. Variation of the diet composition and dietary nutrient supply will lead to changes in nutrient metabolism at the fundamental level and may show variation in (minimum) nutrient requirements of animals.Bioinformatics and systems biology approaches can also provide information on the physiological status of the animal and its metabolism in relation to the dietary nutrient supply.

6 | Livestock Research Report 846
Livestock Research Report 846 | 7
1 Introduction
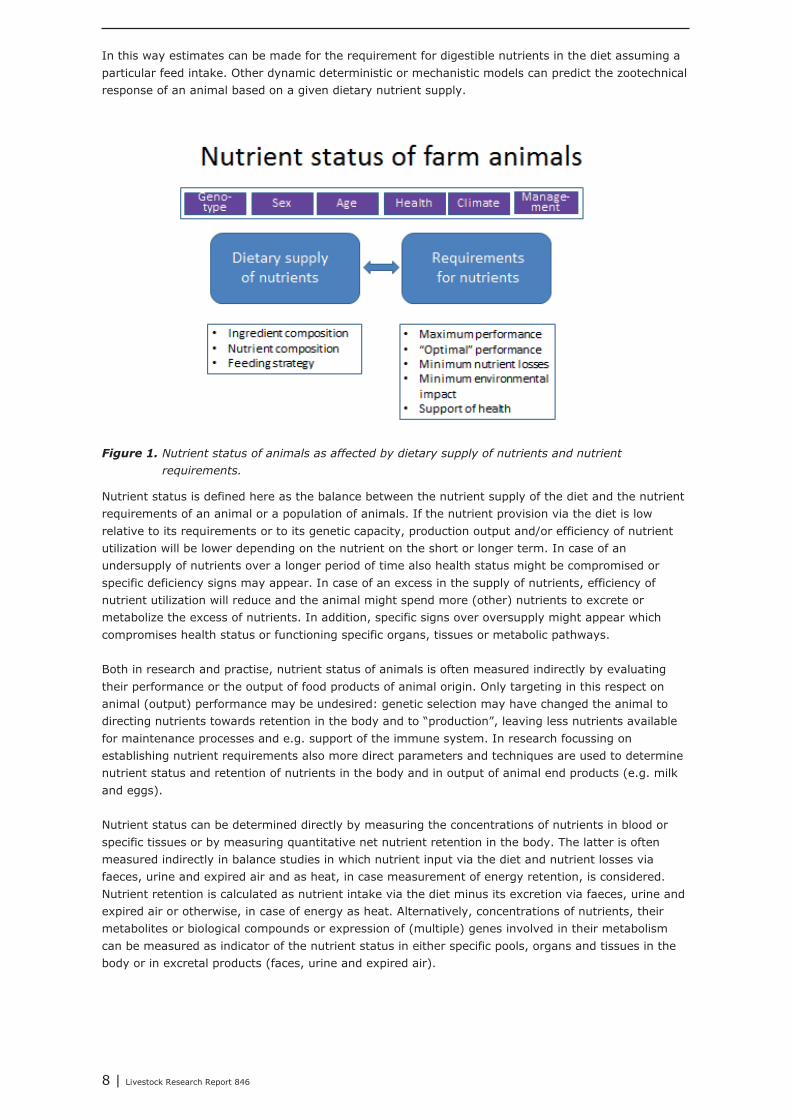
Efficiency of nutrient utilization is an important issue in farm animal production as it relates to animal productivity, environmental impact of animal production and also to the efficiency of use of nutrient resources and their competition in use for either feed, food or fuel. The efficiency of nutrient utilization in farm animals is related to the balance between nutrient supply via the diet and nutrient requirements for maintenance and production purposes (Figure 1). Nutrient supply is dependent on the supply of feed and/or voluntary feed intake (feeding strategy) and the nutrient composition of the diet or ration. The requirements for nutrients by an animal or population of animals are dependent on their requirements for maintenance processes and requirements for their zootechnical performance (output in terms of body weight gain, milk and egg production) and also relate to variation in genetic makeup and their interactions with environmental factors. The final output can be considered as the result of the dietary supply of nutrients, however, in reverse, nutrient supply can also be adjusted to achieve a defined animal performance. In relation to the latter, feeding strategies can be adopted to create a maximum animal performance, an optimal animal performance in the economic perspective or from a nutrient efficiency point of view. Choices to be made on the latter issue are dependent on the conditions in which the animal production system operates. Independent of the former, determination of the balance between the supply of nutrients via de diet and the requirements for nutrients by the animal is a key issue in animal nutrition.
It should be emphasised that both the supply of nutrients via the diet and the nutrient requirements of animals are not fixed factors. Both are dynamic and are influenced by a large number of factors. The dietary supply is affected by variation of composition in feed ingredients and their digestibility in the gastro-intestinal tract. In practice, diet composition varies from batch to batch as batches of ingredients are being used with a high turnover rate in the feed industry. The nutrient digestibility of feed ingredients is not measured for each batch of feedstuffs, but is derived from data in tables providing information on the “average” nutrient digestibility of individual feed ingredients for different animal species as reported in databases (e.g. CVB and NRC). Variation in nutrient digestibility as related to age of the animal and genotype are generally not considered. Also nutrient requirements of animals are not constant and dynamic of nature. Nutrient requirements are affected by production output (productivity) and by animal factors (e.g. age, genotype, and sex) and also influenced by health status, environmental conditions and animal and farm management. Various sources of information are available on nutrient requirements of farm animal species (CVB, NRC, management guides of animal breeding companies, information from feed additive producers). Diets in the feed industry are usually optimized using rather “fixed” data on nutrient requirements. The other influential factors mentioned are usually only considered to a limited extent. This is mainly due to a lack of actual information on the more precise nutrient requirements of the group or population of animals for which the formulated batch of feed is produced.
Nutrient requirement studies are often performed with a dose response design using a basal diet in which only the nutrient of interest is limited and to which increasing levels of the nutrient of study are supplemented. The animal response is measured for all treatment groups and the dose response relationship is determined. A requirement value is derived from the response curve being the value at which the maximum or proportion of the maximum performance or output is achieved. Alternatively, factorial approaches can be taken to estimate nutrient requirements. The latter approach calculates nutrient requirements for a particular animal with a defined zootechnical output considering nutrient use for deposition in the end product or in the whole animal, nutrient use for maintenance purposes and using (in)efficiency factors for transforming metabolically available nutrients for final deposition of the nutrient in the body or output. E.g. NRC (2012) uses models for the prediction of requirements for standardized ileal digestible amino acids and nitrogen, standardized total tract digestible phosphorus, and total calcium in growing finishing pigs, and gestating and lactating sows.
8 | Livestock Research Report 846
In this way estimates can be made for the requirement for digestible nutrients in the diet assuming a particular feed intake. Other dynamic deterministic or mechanistic models can predict the zootechnical response of an animal based on a given dietary nutrient supply.
Figure 1. Nutrient status of animals as affected by dietary supply of nutrients and nutrient requirements.
Nutrient status is defined here as the balance between the nutrient supply of the diet and the nutrient requirements of an animal or a population of animals. If the nutrient provision via the diet is low relative to its requirements or to its genetic capacity, production output and/or efficiency of nutrient utilization will be lower depending on the nutrient on the short or longer term. In case of an undersupply of nutrients over a longer period of time also health status might be compromised or specific deficiency signs may appear. In case of an excess in the supply of nutrients, efficiency of nutrient utilization will reduce and the animal might spend more (other) nutrients to excrete or metabolize the excess of nutrients. In addition, specific signs over oversupply might appear which compromises health status or functioning specific organs, tissues or metabolic pathways.
Both in research and practise, nutrient status of animals is often measured indirectly by evaluating their performance or the output of food products of animal origin. Only targeting in this respect on animal (output) performance may be undesired: genetic selection may have changed the animal to directing nutrients towards retention in the body and to “production”, leaving less nutrients available for maintenance processes and e.g. support of the immune system. In research focussing on establishing nutrient requirements also more direct parameters and techniques are used to determine nutrient status and retention of nutrients in the body and in output of animal end products (e.g. milk and eggs).
Nutrient status can be determined directly by measuring the concentrations of nutrients in blood or specific tissues or by measuring quantitative net nutrient retention in the body. The latter is often measured indirectly in balance studies in which nutrient input via the diet and nutrient losses via faeces, urine and expired air and as heat, in case measurement of energy retention, is considered. Nutrient retention is calculated as nutrient intake via the diet minus its excretion via faeces, urine and expired air or otherwise, in case of energy as heat. Alternatively, concentrations of nutrients, their metabolites or biological compounds or expression of (multiple) genes involved in their metabolism can be measured as indicator of the nutrient status in either specific pools, organs and tissues in the body or in excretal products (faces, urine and expired air).

Livestock Research Report 846 | 9
In research, information of nutrient status of farm animals is important in studies focussing on establishing requirement values for nutrients and for evaluating the effects of different feedingstrategies. In a more practical context, it would be important to measure nutrient status for a specific animal or population of animals in relation to the production output and the environment or condition they are housed in. This would allow to adjust the feeding strategy or dietary supply of nutrients in order to improve performance or efficiency of nutrient utilization. This would contribute largely to the further development of the concept of precision feeding, targeting at optimizing nutrition of specific groups of animals kept in defined conditions. In addition, this would allow to potentially take into consideration variation in nutrient requirements between individual animals within a population. Except for the feeding of dairy cows, the latter concept has not been applied so far, due to lack of tools to measure nutrient status and requirements of individual animals. For application in practice, new tools for measuring nutrient status should be rapid and cheap. New metabolomics tools may fulfil this need.
The former indicates that there is an increasing need for improvement of existing methods and development of new methods to measure nutrient status of farm animals in research settings as well as in practice.
It is the aim of the current study to present a literature review on methods and techniques for determining nutrient status of different farm animal species (ruminants, pigs and poultry). The focus will be on energy, protein/amino acids, and minerals as the main categories of nutrients. Specific attention will also be given to the use of new -omics techniques (e.g. proteomics, metabolomics and transcriptomics) for measuring nutrient status and for the development and determination of biomarkers for nutrient status in farm animals. As new developments on this issue often start in the human domain, developments in this area are also considered. The study focusses especially on the options to determine nutrient status in farm animals from a research perspective rather than on the possibilities for their practical application and related technical issues.

10 | Livestock Research Report 846
2 Methods for measuring nutrient status
Nutrient status has been defined as the difference between intake of nutrients via the dietary supply on the one hand and nutrient requirements for maintenance and production purposes on the other hand. Production can be the maximum production output within the genetic capacity of the animals under the specific conditions in which the animals are kept or a predefined production output based on previous performance or given by specific economic circumstances. It should be noted that the genotype of the animal also influences the balance between nutrient supply via the diet and nutrient requirements.The main groups of nutrients considered in animal nutrition and during diet formulation are:
1. Energy (in the form of carbohydrates, fats, protein and amino acids and short chain fatty acids)
2. Protein and amino acids3. Minerals (Ca, P, Cu, Zn and other trace minerals)4. Vitamins5. Essential fatty acids
In the present study emphasis will be given to the categories 1-3 as major variation in status will be encountered in farm animals in practise for these nutrients. In modern production systems, the requirements for vitamins and essential fatty acids are supposed to be adequately covered via the use of supplemented vitamin premixes and adequate formulation of the diet with regard to the levels of essential fatty acids.
Depending on the nutrient, its status can principally be determined directly or indirectly. In animal nutrition research, often measurements are performed indirectly. Both direct and indirect measurements can provide quantitative information on nutrient status/retention. Indirect quantitative information on net retention of nutrients in the body and output of valuable products (e.g. milk and eggs) is generated in nutrient balance measurements. Here, the total nutrient input via the diet is registered and the total quantitative nutrient output via faeces and urine and as heat (in case of energy) and via expired air and in milk or eggs, if applicable. The difference is the so called nutrient balance or nutrient retention and can be expressed in absolute terms per day or as a percentage of nutrient intake. Quantitative techniques for measuring nutrient status require facilities and equipment to quantitatively collect faeces, urine, expired air, and heat loss (for energy) mostly over a period of several days. These techniques are therefore time consuming and costly but generally provide proper estimates for nutrient retention. Alternatively, nutrient retention in the animal itself and in the animal end product can also be measured directly by analysing the nutrient of interest in homogenized sample of the whole body of small animals and, if applicable, in the mentioned end products. Also this approach is generally time consuming and costly, and in certain cases, such as in dairy cows and large ruminant species, not feasible given the size of the animal.
Livestock Research Report 846 | 11
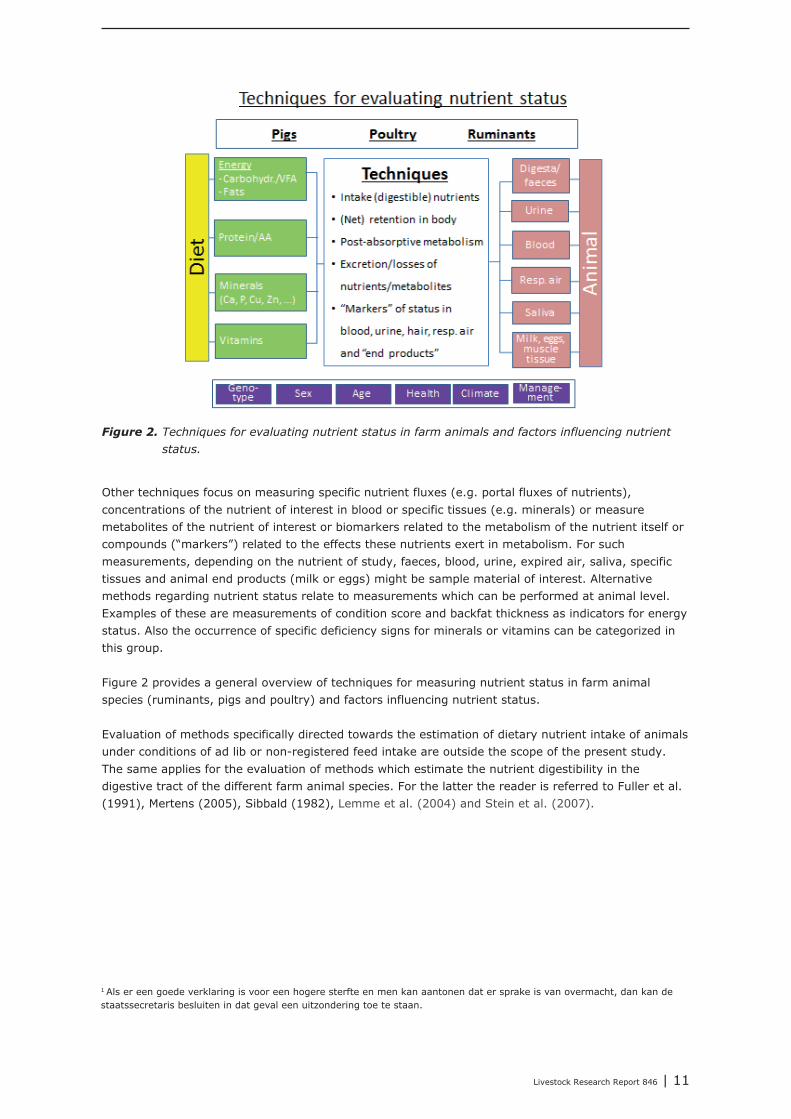
Figure 2. Techniques for evaluating nutrient status in farm animals and factors influencing nutrient status.
Other techniques focus on measuring specific nutrient fluxes (e.g. portal fluxes of nutrients), concentrations of the nutrient of interest in blood or specific tissues (e.g. minerals) or measure metabolites of the nutrient of interest or biomarkers related to the metabolism of the nutrient itself or compounds (“markers”) related to the effects these nutrients exert in metabolism. For such measurements, depending on the nutrient of study, faeces, blood, urine, expired air, saliva, specific tissues and animal end products (milk or eggs) might be sample material of interest. Alternative methods regarding nutrient status relate to measurements which can be performed at animal level. Examples of these are measurements of condition score and backfat thickness as indicators for energy status. Also the occurrence of specific deficiency signs for minerals or vitamins can be categorized in this group.
Figure 2 provides a general overview of techniques for measuring nutrient status in farm animal species (ruminants, pigs and poultry) and factors influencing nutrient status.
Evaluation of methods specifically directed towards the estimation of dietary nutrient intake of animals under conditions of ad lib or non-registered feed intake are outside the scope of the present study. The same applies for the evaluation of methods which estimate the nutrient digestibility in the digestive tract of the different farm animal species. For the latter the reader is referred to Fuller et al. (1991), Mertens (2005), Sibbald (1982), Lemme et al. (2004) and Stein et al. (2007).
1 Als er een goede verklaring is voor een hogere sterfte en men kan aantonen dat er sprake is van overmacht, dan kan de staatssecretaris besluiten in dat geval een uitzondering toe te staan.
12 | Livestock Research Report 846
3 Techniques for measuring nutrient status in different species
Studies evaluating nutrient status and nutrient requirement in farm animal species have been performed over more than 50 years. In many cases, measurements on (digestible) nutrient intake and/or measurement of the zootechnical performance (feed intake, body weight gain, milk or egg production and feed conversion efficiency) using different dietary treatments or feeding regimes formed the basis for judging nutrient status and nutrient requirements of animals. Later in time, nutrient balance/retention studies have been performed for this purpose. In these studies, the quantitative retention was determined mostly in an indirect way and were based on the quantitative intake of digestible nutrients and their losses via faeces and urine, or as energy lost as heat when energy retention was measured. Alternatively, retention can be measured directly by comparing intake of digestible nutrients via the diet and the quantitative deposition of nutrients in the body or in output in the form of milk or eggs.
In research focussed on man more recently the search for biomarkers for nutrient status was initiated. A nutritional biomarker can be any biological specimen that is an indicator of nutritional status with respect to intake or metabolism of dietary constituents. It can be a biochemical, functional or clinical index of status of an essential nutrient or other dietary constituent (Potischman and Freudenheim,2003). Biomarkers for nutrient status in farm animals would also be helpful in the animal production domain, both for implementation in research and for practical application. The recent developments of new -omics tools open new ways to identify biomarkers or indices of nutrient status and requirements in farm animals.
In Appendix 1-3 an overview is provided of recent literature related to (new) techniques and measurements for determining nutrient status and nutrient requirements of farm animals and man. The methods and techniques refer to nutrients in general and energy (Appendix 1), protein (Appendix 2) and minerals and vitamins (Appendix 3). The overview is not meant to be complete but rather provides an overview of the techniques considered and the directions of research on this topic.
The developments on the use of omics technologies in relation to nutrient status and nutrient requirements in farm animals are described separately in Chapter 4.
The results presented in Appendices 1-3 provide an overview with examples of a wide range of techniques used in both humans and animals to assess their nutrient status. Nutrient status can be considered at different levels. It can be considered in the short term (within a day) or be judged on the more long term over several days, weeks or months. The overview presented makes it clear that techniques cannot be generally adopted but should be carefully selected out of the range of options available.
An overview of the techniques applied in research and practice to evaluate nutrient status in animals and man are given in Table 1.

Livestock Research Report 846 | 13
Table 1. Overview of techniques for measuring nutrient status in animals and man.
Technique Nutrient Basis ApplicationCondition score Energy Whole body Man, animalImaging techniques (CT, MRI) Energy, minerals Whole body Man, animalBackfat thickness, fat depots Energy Whole body/body parts Animal, manNutrient balance (indirect) Energy, protein and
mineralsFaeces, urine, expired air Man, animal
Nutrient retention (direct) Energy, protein and minerals
Whole body, organs and tissues
Animal
Respiration measurements Energy Whole body Man, animalHeart rate Energy Heart rate measurement Man, animalElectronic nose General Expired air BiomedicalBlood metabolites Nutrients Blood Man, animalStable isotopes of nutrients + mass spectrometry
Nutrients Whole body or organs/tissues
Man, animal
Milk composition Protein and AA Milk Dairy cows, pigsHair composition Minerals Hair BiomedicalGene expression Nutrients Tissue Man, animalsProteomics Nutrients Blood, organs and tissues Man, animalsMetabolomics Nutrients Blood, urine Man, animalsQuestionnaires Nutrients Interview Man, medical
Generally, a wide variety of techniques is available to measure nutrient status in different animal species and in man. There is no common technique or technology available or in development for the judgement of the status for energy, protein/amino acids, minerals and vitamins in either farm animal species at the same time. Most of the techniques focus on a specific nutrient and target on the use of specific sampling matrices or sampling points for the measurements.
The following factors should be considered while selecting techniques for evaluating nutrient status:
- nature of the nutrient objectives for their use (research, practise, status of individual animal or group or population of animals)
- technology and technique involved- sample material needed to determine nutrient status (whole animal, blood, faeces, urine, resp. air,
saliva, milk, or tissue)- degree of validation of the technique- accuracy of the determination- frequency of measurement- costs involved
Over the past decades there is more emphasis on unravelling the complexity of the processes involved in nutrient metabolism and their utilization. These efforts have resulted in new information, pathways and metabolic routes in nutrient metabolism in the different farm animal species and their development with age. With increasing knowledge, also the potential number of biomarkers for nutrient status in a given animal species has increased. At the same time, however, their value as unique marker may be limited due to the increasing awareness of the large number of factors influencing the concentrations of biomarkers in relevant biological matrices (e.g. blood, urine and respiratory air).
Another point of consideration is the nature of the nutrient which is considered. As for some nutrients, such as minerals and vitamins, the animal generally has relatively large reserves in organs and tissues, it requires a longer period of time (up to several weeks) before levels of nutrients are changing in e.g. blood under conditions of a low or marginal dietary supply. In other cases, e.g. for protein and amino acids, effects on parameters indicating their nutrient status might change more instant. For this reason observations in the change in values for parameters predicting nutrient status might be more important than determining their absolute concentration, especially under conditions
14 | Livestock Research Report 846
where reference values are lacking. Also between animal variation in nutrient status within a population and variation in nutrient status related parameters within an animal determine the number of animals to be monitored as predictor for the herd’s nutrient status and the frequency of measurements over a day or period of time.
Although over recent decades technologies and methods for analysing biological samples have largely advanced, the development of more ready to use (e.g. dipstick) techniques to measure and judge nutrient status on farm is fairly limited. However, concepts such Blue4Green (Blue4Green, The Netherlands) are already available and allow to analyse calcium and magnesium concentrations in blood of dairy cows on farm in a few minutes time in a droplet of blood using small scale capillary electrophoresis. Similar techniques are likely to be developed at a larger scale in the near future for measuring health or nutrient status in animals in the animal production domain.
Techniques for measuring nutrient status in man are to a large extent focussed on measurement of status to prevent nutrient deficiencies and related to prevention of disease or measurement of status under conditions of disease or low health status. The approach for the application of measurement of nutrient status in animal production is often rather different as the focus is more directed to increasing or optimizing productivity and optimizing/maximizing output of animal products and to improvement of nutrient utilization and reduction of environmental excretion of nutrients and their metabolites.
Most techniques, however, which are currently considered are yet more suitable for research purposes than for on farm application. Techniques which could be used easily on farm, however, would be needed for measuring nutrient status of groups of farm animals and with the purpose of the subsequent adjustment of diet composition and feeding strategy. The latter would be a promising perspective to optimize animal productivity and nutrient utilization in future animal production.
Livestock Research Report 846 | 15
4 Omics technologies to measure nutrient status
4.1 Background
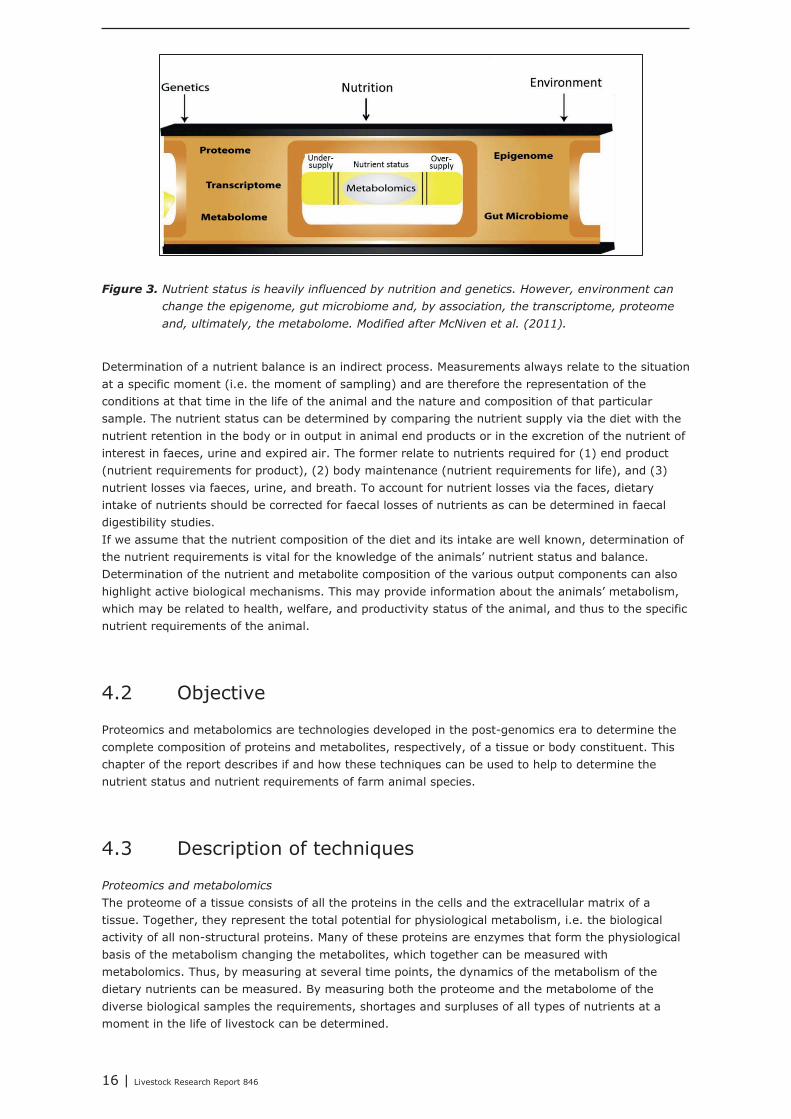
The nutrient status of livestock contributes to health and welfare of the animal, optimal productivity, and minimal environmental impact. The nutrient status is determined by the balance between nutrient supply via the feed and nutrient requirements of the animal (Figure 2). During life this balance may shift considerably since it is the net result of diverse factors such as age, productivity, health status, and welfare (stress) of the animal. Furthermore, animal-specific factors such as sex and genetic background (both breed-specific and individual variation) determine the specific nutrient requirements of the animal. The centre part of Figure 3 shows the nutrient status as the balance between under and over supply. Dietary nutrient intake levels and their absorption in the digestive tract determine the availability of nutrients for the metabolism of the animal and affect growth, productivity, and health traits of the animal. Metabolomics is the technology to measure the levels of nutrients and their metabolites in tissues and body fluids of the animal. Metabolites are small molecules, including amino acids, fatty acids, carbohydrates, vitamins, minerals, and all small molecular derivatives of these. The metabolism is the result of the activity of a large number of proteins, which are synthesized from the genome of the animal via mRNA. On the left side of Figure 3 the steps of the biological dogma (i.e. genomic DNA can replicate itself, and it produces the metabolism of the cell via RNA (transcriptome) and protein (proteome) synthesis)) are presented. The former relate to the omics technologies to measure these biological molecules (transcriptome: all RNA’s - transcriptomics, proteome: all proteins in a tissue - proteomics, metabolome: all metabolites - metabolomics). These processes are affected by environmental factors acting on the genomic DNA of the animal (the epigenome, affecting the transcription of the genes (transcriptome). E.g. Simple addition of vitamin C to the diet can alter the epigenome (Pera, 2013). Transcriptome, proteome, and metabolome are all directly affected by the interaction between the genotype and the environment, including dietary nutrient supply. The environment – including the diet composition – also affects the gut microbiome composition, which in turn affects the functioning of the body via the processes shown at the left side in Figure 3.The diverse biological molecule groups shown in Figure 3 (transcriptome, proteome, metabolome) relate to omics techniques (transcriptomics, proteomics, metabolomics) that can measure the levels of these molecules in tissues. These techniques can be used to highlight the metabolic / nutrient status of an animal because of a number of nutrient sensors that detect the nutrients and act to adjust the metabolism to the nutrient status. Proteins act together in pathways aiming at a specific physiological function, e.g. energy metabolism, fatty acid metabolism, amino acid metabolism. Although changes in individual protein’s expression or activity can affect entire pathways, often the expression and activity of several proteins and bioactive metabolites are affected simultaneously, indicating the changed reactions of the metabolism as a whole in selective tissues and organs to a change in dietary nutrient supply. Thus, the metabolism of an animal is flexible and reflects the nutrient status affected by the diet composition. Each of the changed expression levels and activities can be measured and used as biomarkers to predict and monitor the effect of changed diet composition and nutrient intake on the physiology of the animal, including its productivity.
16 | Livestock Research Report 846
Figure 3. Nutrient status is heavily influenced by nutrition and genetics. However, environment can change the epigenome, gut microbiome and, by association, the transcriptome, proteome and, ultimately, the metabolome. Modified after McNiven et al. (2011).
Determination of a nutrient balance is an indirect process. Measurements always relate to the situation at a specific moment (i.e. the moment of sampling) and are therefore the representation of the conditions at that time in the life of the animal and the nature and composition of that particular sample. The nutrient status can be determined by comparing the nutrient supply via the diet with the nutrient retention in the body or in output in animal end products or in the excretion of the nutrient of interest in faeces, urine and expired air. The former relate to nutrients required for (1) end product (nutrient requirements for product), (2) body maintenance (nutrient requirements for life), and (3) nutrient losses via faeces, urine, and breath. To account for nutrient losses via the faces, dietary intake of nutrients should be corrected for faecal losses of nutrients as can be determined in faecal digestibility studies.If we assume that the nutrient composition of the diet and its intake are well known, determination of the nutrient requirements is vital for the knowledge of the animals’ nutrient status and balance. Determination of the nutrient and metabolite composition of the various output components can also highlight active biological mechanisms. This may provide information about the animals’ metabolism, which may be related to health, welfare, and productivity status of the animal, and thus to the specific nutrient requirements of the animal.
4.2 Objective
Proteomics and metabolomics are technologies developed in the post-genomics era to determine the complete composition of proteins and metabolites, respectively, of a tissue or body constituent. This chapter of the report describes if and how these techniques can be used to help to determine the nutrient status and nutrient requirements of farm animal species.
4.3 Description of techniques
Proteomics and metabolomicsThe proteome of a tissue consists of all the proteins in the cells and the extracellular matrix of a tissue. Together, they represent the total potential for physiological metabolism, i.e. the biological activity of all non-structural proteins. Many of these proteins are enzymes that form the physiological basis of the metabolism changing the metabolites, which together can be measured with metabolomics. Thus, by measuring at several time points, the dynamics of the metabolism of the dietary nutrients can be measured. By measuring both the proteome and the metabolome of the diverse biological samples the requirements, shortages and surpluses of all types of nutrients at a moment in the life of livestock can be determined.

Livestock Research Report 846 | 17
Box 1A: Complexity of omics dataOmics technologies deliver complex results due to the size of the data: In genomics experiments all approximately 25,000 genes in a mammalian genome are investigated – often using (more then) 100,000 polymorphisms called single nucleotide polymorphisms (SNP) - , transcriptomics investigates the expression of all coding RNA’s in a tissue simultaneously – approximately 50,000 - , proteomics investigates the expression of all possible proteins in a tissue simultaneously –approximately 150,000, and metabolomics investigates the expression of all possible metabolites in a tissue – estimated to be more than 500,000 (too many to investigate simultaneously at this moment). Such data require thorough analysis. The data will almost always result in new hypotheses and unforeseen insights.
18 | Livestock Research Report 846
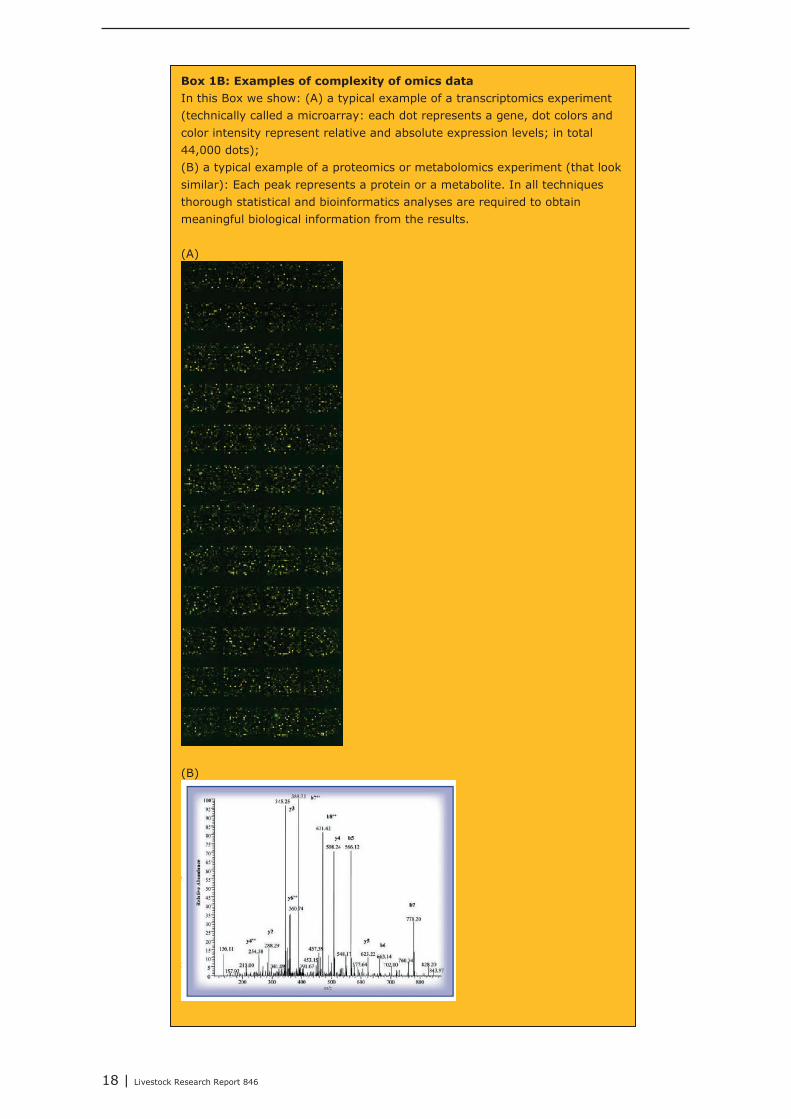
Box 1B: Examples of complexity of omics dataIn this Box we show: (A) a typical example of a transcriptomics experiment (technically called a microarray: each dot represents a gene, dot colors and color intensity represent relative and absolute expression levels; in total 44,000 dots); (B) a typical example of a proteomics or metabolomics experiment (that look similar): Each peak represents a protein or a metabolite. In all techniques thorough statistical and bioinformatics analyses are required to obtain meaningful biological information from the results.
(A)
(B)

Livestock Research Report 846 | 19
Measurement and analysis options
Important reviews are McNiven et al. (2011) and Favé et al. (2009) describing metabolomics for the field of nutrition. Among others, they mention studies investigating the exposure to nutrients and nutrient absorption and also mention the importance of genotype-metabolome studies. The comprehensive reviews of Gibney et al. (2005), Trujillo et al. (2006), and Zeisel (2007) describe the possibilities and uses of (nutri)genomics, proteomics, and metabolomics for nutritionists. The latter describes how metabolomics could be used in animal nutrition as well, although from a human perspective. Variation in the DNA sequence (genomic variation) is important. It may influence the functionality of the proteins through changes in the activity of the molecules, or via changes in the expression level of the proteins. Wishart (2008) describes how metabolomics can be used in (1) food component analysis; (2) food quality/authenticity assessment; (3) food consumption monitoring; and (4) physiological monitoring in food intervention or diet challenge studies. Especially the latter is of major relevance for the present study. The publication also provides dietary results for foods, e.g. bovine milk. This review is of major importance for the present report.
To determine the requirements for nutrients of livestock animals, determination of the specific nutrients in animal end products (muscle tissue, milk, eggs), blood, urine, faeces and breath is required. Numerous literature examples show that for all biological sample types measurement methods are available (Ang and Nice, 2010; Aura et al. 2008; Gao et al., 2009; Gu et al., 2007; Jacobs et al., 2008; Kim et al. 2009; LaRocque et al., 2008; Lichtman et al., 2013; Monleón et al. 2009; Saric et al., 2008; Nga et al., 2012; te Pas et al., 2013; Vitorino et al., 2004; Walsh et al., 2006; Wang et al., 2012; Wikoff et al., 2009; Zhang et al., 2008, 2012) and can be used to determine dietary nutrients and physiological processes in the animal. Below we will give examples of specific results and how such data can be used in livestock nutrition research. Furthermore, a number of databases provides detailed data on the proteome or the metabolome composition of tissue, mainly representing human and / or laboratory animals (e.g. urine proteome database, www.hkupp.org,Kentsis et al., 2009; the human metabolome database, e.g. Wishart et al., 2008).
Using the proteomics data the biological pathways present in the sample source can be determined with bioinformatics or systems biology studies. The metabolome will show whether the pathways are active or not, and if they are active the flux can be quantified. It should be noted that vitamins and minerals can be tightly linked to proteins making their measurement sometimes difficult. Bioinformatics can provide relevant data enabling a complete determination of the nutrient composition of various biological samples.
It is important to recognize that measurements are always related to points in time – i.e. the statusquo at the moment of sampling. To determine dynamic processes (e.g. in time (age of the animal) or due to differences in nutrient composition of the diet) repeated sampling and measurements are required. Balances between situations can only be calculated combining the results of the different sample types – For example, the difference between nutrient composition of the diet and the faecal nutrient composition determines the amount of (apparently) digestible nutrients available for post-absorptive metabolism. Comparison of the blood nutrient composition profiles with the composition of the urine provides information on the metabolic end products of the animal’s metabolism.
Box 2: BiomarkersBiomarkers are (often) molecules providing information about difficult or expensive to measure processes without the need to measure the processes themselves. Biomarkers need to be easily measurable at (relative) low cost, and need to be highly related to the trait to become predictive for that trait. They can be used to monitor the process, to take action in time to manage the process, or to predict the reaction of the process during an intervention.An example related to this study:If a nutrient is difficult or expensive to measure the consequences of changing the content of that nutrient in the feed may only become visible after a long time (e.g. as a consequence of long time undersupply). When a biomarker is available the reaction of the metabolism to the change of the feed composition can be followed in real time allowing to monitor the effect of the feed directly in the metabolism of the animal, which may allow the prediction of the long-term consequences, which can be used to manage the experiment.

20 | Livestock Research Report 846
Some examples from the literature
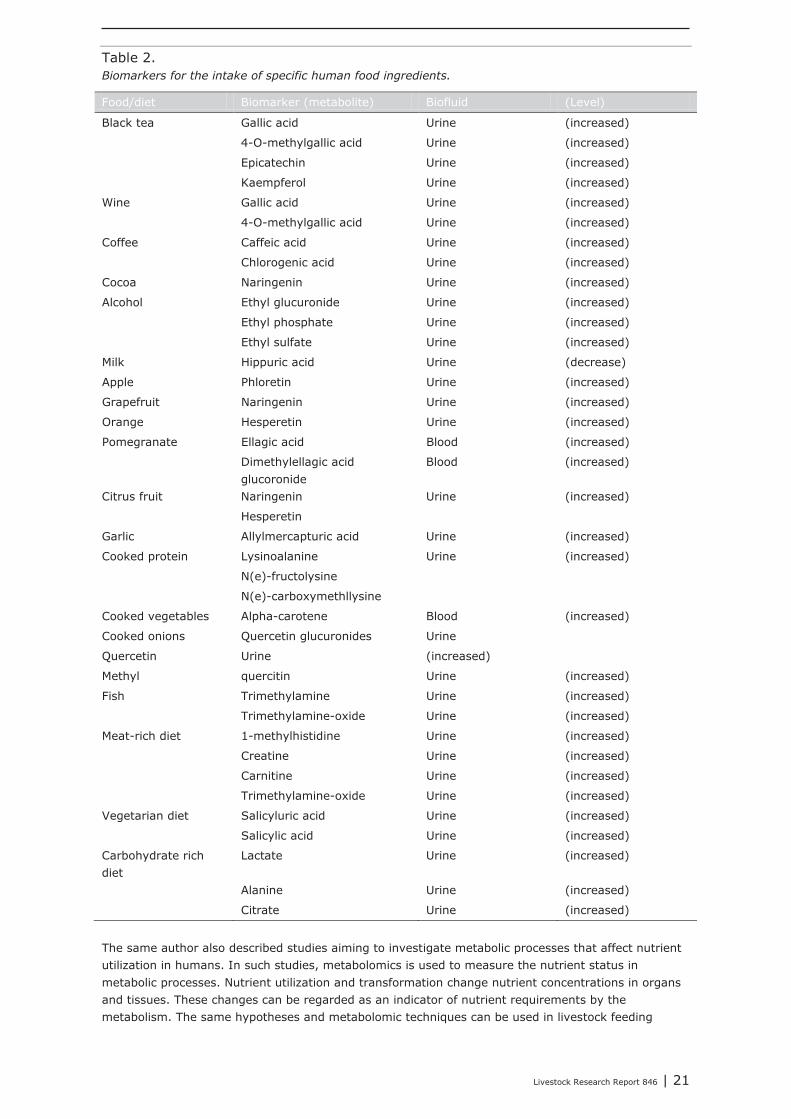
In human nutrition research, metabolomics is to estimate quantitative ingestion of food ingredients and nutrients. Unlike studies in the animal nutrition domain, in many human “field studies” quantitative food and nutrient intake are not registered. In these cases metabolomics can be used to estimate intake of specific food ingredients using markers which are specific for a particular food ingredient. Although the example given below is from human nutrition studies the same techniques and hypotheses may be used in livestock feeding studies where feed intake is not registered quantitatively on animal or group level. This can be the case under conditions where diets are fed ad libitum (e.g. the roughage part of the ration of dairy cows, in ad lib fed pigs and broilers) and information on the absolute feed and nutrient intake is required. Wishart (2008) shows that the intake of specific food ingredients can be measured via the analysis of specific metabolites (biomarkers) in urine or blood (Table 2).
Livestock Research Report 846 | 21
Table 2.Biomarkers for the intake of specific human food ingredients.
Food/diet Biomarker (metabolite) Biofluid (Level)
Black tea Gallic acid Urine (increased)
4-O-methylgallic acid Urine (increased)
Epicatechin Urine (increased)
Kaempferol Urine (increased)
Wine Gallic acid Urine (increased)
4-O-methylgallic acid Urine (increased)
Coffee Caffeic acid Urine (increased)
Chlorogenic acid Urine (increased)
Cocoa Naringenin Urine (increased)
Alcohol Ethyl glucuronide Urine (increased)
Ethyl phosphate Urine (increased)
Ethyl sulfate Urine (increased)
Milk Hippuric acid Urine (decrease)
Apple Phloretin Urine (increased)
Grapefruit Naringenin Urine (increased)
Orange Hesperetin Urine (increased)
Pomegranate Ellagic acid Blood (increased)
Dimethylellagic acid glucoronide
Blood (increased)
Citrus fruit Naringenin Urine (increased)
Hesperetin
Garlic Allylmercapturic acid Urine (increased)
Cooked protein Lysinoalanine Urine (increased)
N(e)-fructolysine
N(e)-carboxymethllysine
Cooked vegetables Alpha-carotene Blood (increased)
Cooked onions Quercetin glucuronides Urine
Quercetin Urine (increased)
Methyl quercitin Urine (increased)
Fish Trimethylamine Urine (increased)
Trimethylamine-oxide Urine (increased)
Meat-rich diet 1-methylhistidine Urine (increased)
Creatine Urine (increased)
Carnitine Urine (increased)
Trimethylamine-oxide Urine (increased)
Vegetarian diet Salicyluric acid Urine (increased)
Salicylic acid Urine (increased)
Carbohydrate rich diet
Lactate Urine (increased)
Alanine Urine (increased)
Citrate Urine (increased)
The same author also described studies aiming to investigate metabolic processes that affect nutrient utilization in humans. In such studies, metabolomics is used to measure the nutrient status in metabolic processes. Nutrient utilization and transformation change nutrient concentrations in organs and tissues. These changes can be regarded as an indicator of nutrient requirements by the metabolism. The same hypotheses and metabolomic techniques can be used in livestock feeding

22 | Livestock Research Report 846
studies. In Table 3, examples are given for compounds analysed in specific biological samples as indicators (biomarkers) for specific metabolic processes or risk for diseases.
Table 3. Metabolic indicators for specific metabolic processes or risk for diseases.
Compound Biofluid (level) Indication
8-isoprostane F2A Urine (increased) Lipid peroxidation
Oxidative stress
8-hydroxy-2-deoxyguanosine Lymphocytes/Urine
(increased) DNA oxidative damage
Malondialdehyde (MDA) Urine (increased) Oxidative stress
Glutathione (reduced) Plasma (decreased) Oxidative stress
Hydrogen peroxide Urine (increased) Oxidative stress
LDL Plasma (increased) Increased risk for CVD
HDL Plasma (decreased) Increased risk for CVD
Triacylglycerol (TAG) Plasma (increased) Increased risk for CVD
Homocysteine Plasma (increased) Increased risk for CVD
Total cholesterol Plasma (increased) Increased risk for CVD
Alpha-tocopherol (Vit E) Plasma (decreased) Decreased anti-oxidant potential
Ascorbic acid (Vit C) Plasma (decreased) Decreased anti-oxidant potential
Thromboxane B2 Plasma (increased) Inflammation
Leukotriene B4 Plasma (increased) Inflammation
Prostaglandin E2 Plasma (increased) Inflammation
Uric acid Plasma (increased) Inflammation; oxidative stress
Ashton et al. (2009) describes that whole-blood selenium, plasma selenoprotein P, and plasma, platelet, and whole-blood glutathione peroxidase activity respond to changes in selenium intake. These changes can be measured and used as indicators for selenium uptake, which is difficult to measure itself since plasma selenium levels are still changing 60 days after changed feed selenium content.
Hambridge (2003) describes the measurement of metallothionein mRNA in lymphocytes as a biomarker of zinc status, and the potential of plasma-soluble transferrin receptor concentrations as the biomarker of choice for the detection of early functional iron deficiency. Deficiencies of these ions have large consequences for healthy body metabolism but may be difficult to measure, while these biomarkers can be easily and cheaply measured. While Hambridge (2003) reported only plasma biomarkers to be reliable, Lowe et al. (2009) concluded that in healthy individuals, plasma, urinary, and hair zinc are reliable biomarkers of zinc status. They concluded further that high-quality studies for determining nutrient status using these biomarkers are required, particularly in infants, adolescents, and immigrant population groups for which limited data exist. Studies are also required to fully assess a range of additional potential zinc biomarkers.

Livestock Research Report 846 | 23
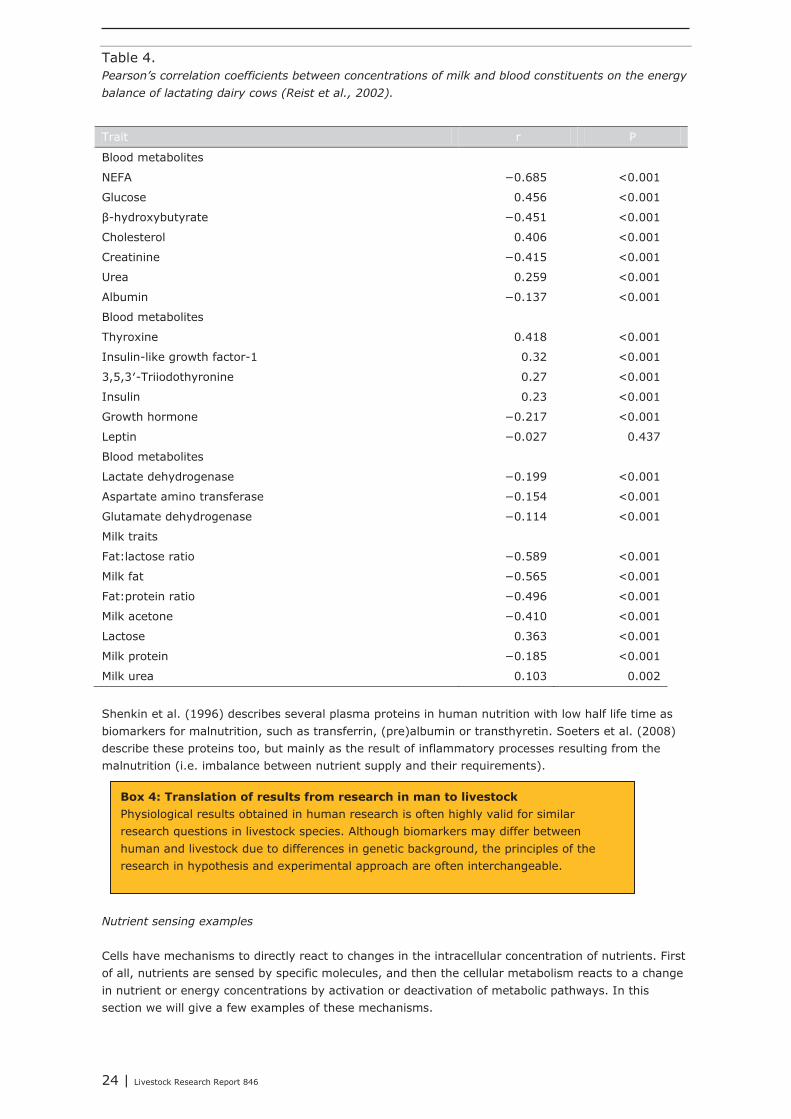
Reist et al. (2002) showed that concentrations of glucose, cholesterol, urea, insulin, insulin-like growth factor- 1, triiodothyronine, and thyroxine (T4) in blood plasma and of lactose and urea in milk were positively correlated with energy balance, whereas concentrations of nonesterified fatty acids (NEFA), creatinine, albumin, β-hydroxybutyrate, and growth hormone and enzyme activities in blood, and concentrations of fat, protein, fat:lactose ratio, and acetone in milk were negatively correlated with energy balance. These components can be fast and easily measured with proteomic and metabolomic methods. In Table 4, Pearson’s correlations of blood and milk traits with the animal’s energy balance, taken from Reist et al. (2002) show that these blood metabolites can be used as biomarkers for the energy balance in (lactating) livestock without performing energy balance studies.
Box 3: Conclusions biomarkers for mineral and energy balance studiesWhile it is possible to measure trace minerals such as selenium and zinc using metabolomics technologies, such measurements are often time consuming and require expensive special equipment. Instead it is possible to measure the expression of proteins that require to bind to these metals to become functional, or the mRNA expression of these proteins to measure the regulation of these proteins, which is related to the availability of these minerals in metabolism. The examples showed that such measurements can develop valuable biomarkers for the status of trace elements. These are just examples, and similar data exist for other trace elements.Please note that this means that the hypotheses and the techniques are available, but the biomarkers for specific livestock species need to be developed. If relevant samples with physiological data are available, development and validation of relevant biomarkers may still require a period of 1-2 years.Below we will give a similar example about energy balance biomarkers. While energy metabolism requires many measurements these biomarkers can provide fast insights in the energy balance of the animal. Such biomarkers should be developed for each livestock species, and may be genotype / breed specific.
24 | Livestock Research Report 846
Table 4. Pearson’s correlation coefficients between concentrations of milk and blood constituents on the energy balance of lactating dairy cows (Reist et al., 2002).
Trait r P
Blood metabolites
NEFA −0.685 <0.001
Glucose 0.456 <0.001
β-hydroxybutyrate −0.451 <0.001
Cholesterol 0.406 <0.001
Creatinine −0.415 <0.001
Urea 0.259 <0.001
Albumin −0.137 <0.001
Blood metabolites
Thyroxine 0.418 <0.001
Insulin-like growth factor-1 0.32 <0.001
3,5,3′-Triiodothyronine 0.27 <0.001
Insulin 0.23 <0.001
Growth hormone −0.217 <0.001
Leptin −0.027 0.437
Blood metabolites
Lactate dehydrogenase −0.199 <0.001
Aspartate amino transferase −0.154 <0.001
Glutamate dehydrogenase −0.114 <0.001
Milk traits
Fat:lactose ratio −0.589 <0.001
Milk fat −0.565 <0.001
Fat:protein ratio −0.496 <0.001
Milk acetone −0.410 <0.001
Lactose 0.363 <0.001
Milk protein −0.185 <0.001
Milk urea 0.103 0.002
Shenkin et al. (1996) describes several plasma proteins in human nutrition with low half life time as biomarkers for malnutrition, such as transferrin, (pre)albumin or transthyretin. Soeters et al. (2008) describe these proteins too, but mainly as the result of inflammatory processes resulting from the malnutrition (i.e. imbalance between nutrient supply and their requirements).
Nutrient sensing examples
Cells have mechanisms to directly react to changes in the intracellular concentration of nutrients. First of all, nutrients are sensed by specific molecules, and then the cellular metabolism reacts to a change in nutrient or energy concentrations by activation or deactivation of metabolic pathways. In this section we will give a few examples of these mechanisms.
Box 4: Translation of results from research in man to livestockPhysiological results obtained in human research is often highly valid for similar research questions in livestock species. Although biomarkers may differ between human and livestock due to differences in genetic background, the principles of the research in hypothesis and experimental approach are often interchangeable.

Livestock Research Report 846 | 25
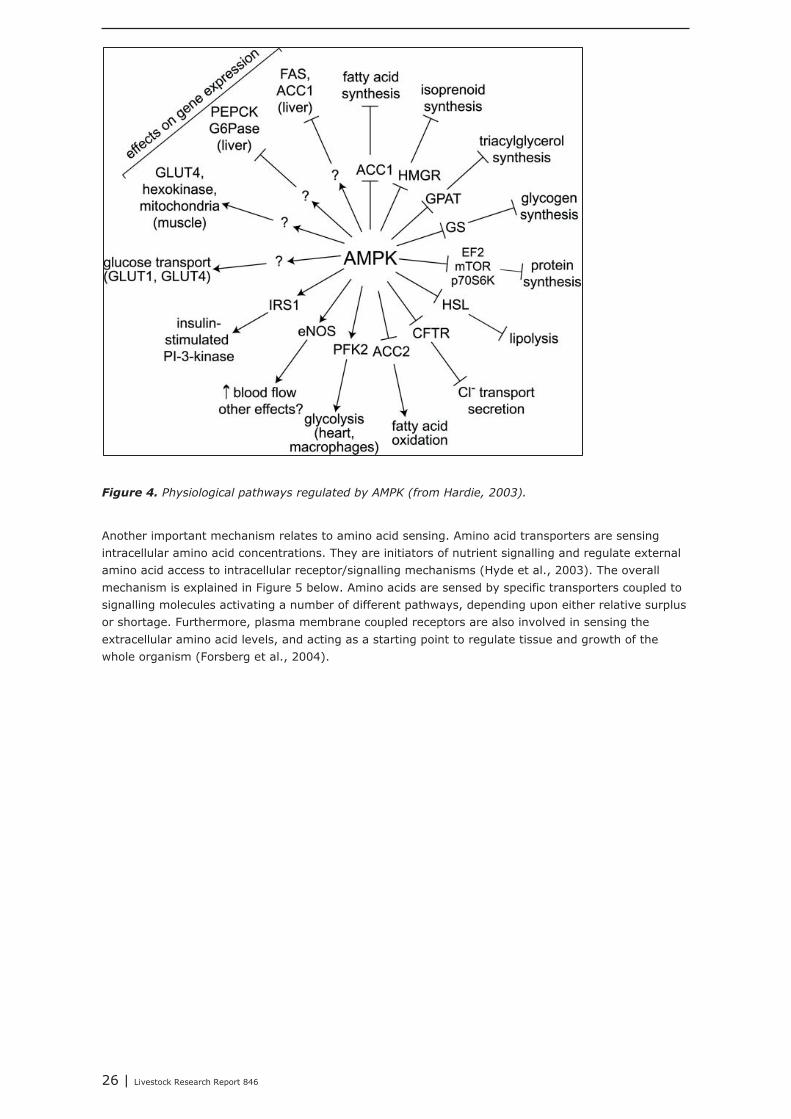
The intracellular AMPK protein senses the energy status of the cell. The latter is affected by the dietary energy supply. Any decline in cellular energy status is accompanied by a rise in the cellular AMP : ATP ratio. This activates AMPK. AMPK activates catabolic pathways that generate ATP, while inhibiting cell growth and biosynthesis and other processes that consume ATP maintaining whole body energy balance (Hardie et al., 2006). As a consequence AMPK regulates many different physiological reactions related to energy metabolism (see Figure 4, Hardie, 2003). Although best known for its effects on cellular nutrient metabolism, AMPK has many other functions, including regulation of mitochondrial biogenesis and disposal, autophagy, cell polarity, and cell growth and proliferation. Both tumour cells and viruses establish mechanisms to down-regulate AMPK, allowing them to escape its restraining influences on all levels of growth, from whole body growth to growth of cells (Hardie 2011).
Box 5A: Nutrient sensorsNutrient sensors detect nutrients in cells, tissues, and body fluids enabling body metabolism to have information on their concentrations and to adjust the activity of metabolism to the actual nutrient concentrations. Therefore, regulation of productivity of livestock via feeding and nutrition is directly related to the activity of these metabolic nutrient sensors. They can be regarded as the direct intermediates between the dietary nutrient supply and the nutrient requirements by the animal. Nutrient balance studies in farm animals, and studies on the regulation of the adjustment of diet composition to cover nutrient requirements of livestock may largely benefit from measurements on intra- and extracellular nutrient sensors and cellular
Box 5B: Suggestions for candidate genes: direct links between dietary nutrient supply, expression of genes and synthesis of proteinsThe results and conclusions from Box 3 and Box 5A show that there are direct links between diet composition and dietary nutrient supply and the expression levels of a number of proteins. Differences in the expression levels may relate to genetics, but also to diet composition itself. Effects may be species and / or breed specific. Using omics technologies the species- / breed-specific genes and proteins can be found. This research is highly feasible. Some species-specific genes or proteins are known, but it is recommended that a breed-specific investigation is performed
26 | Livestock Research Report 846
Figure 4. Physiological pathways regulated by AMPK (from Hardie, 2003).
Another important mechanism relates to amino acid sensing. Amino acid transporters are sensing intracellular amino acid concentrations. They are initiators of nutrient signalling and regulate external amino acid access to intracellular receptor/signalling mechanisms (Hyde et al., 2003). The overall mechanism is explained in Figure 5 below. Amino acids are sensed by specific transporters coupled to signalling molecules activating a number of different pathways, depending upon either relative surplus or shortage. Furthermore, plasma membrane coupled receptors are also involved in sensing the extracellular amino acid levels, and acting as a starting point to regulate tissue and growth of the whole organism (Forsberg et al., 2004).
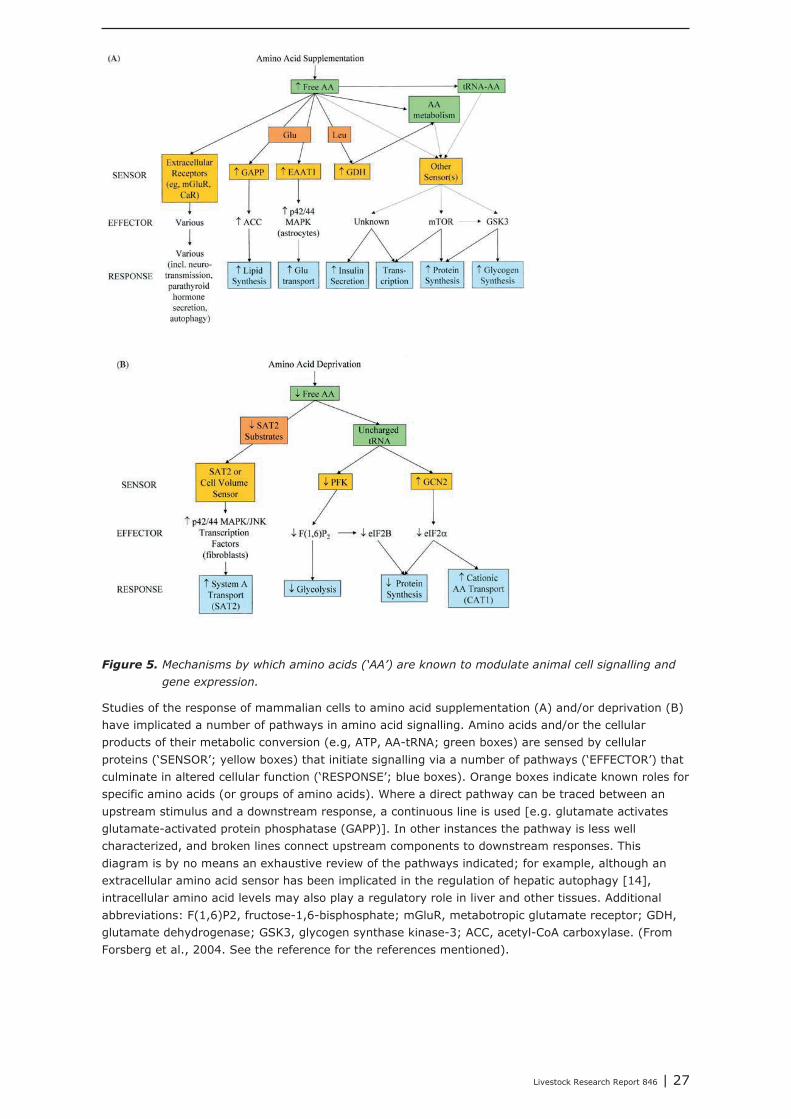
Livestock Research Report 846 | 27
Figure 5. Mechanisms by which amino acids (‘AA’) are known to modulate animal cell signalling and gene expression.
Studies of the response of mammalian cells to amino acid supplementation (A) and/or deprivation (B) have implicated a number of pathways in amino acid signalling. Amino acids and/or the cellular products of their metabolic conversion (e.g, ATP, AA-tRNA; green boxes) are sensed by cellular proteins (‘SENSOR’; yellow boxes) that initiate signalling via a number of pathways (‘EFFECTOR’) that culminate in altered cellular function (‘RESPONSE’; blue boxes). Orange boxes indicate known roles for specific amino acids (or groups of amino acids). Where a direct pathway can be traced between an upstream stimulus and a downstream response, a continuous line is used [e.g. glutamate activates glutamate-activated protein phosphatase (GAPP)]. In other instances the pathway is less well characterized, and broken lines connect upstream components to downstream responses. This diagram is by no means an exhaustive review of the pathways indicated; for example, although an extracellular amino acid sensor has been implicated in the regulation of hepatic autophagy [14], intracellular amino acid levels may also play a regulatory role in liver and other tissues. Additional abbreviations: F(1,6)P2, fructose-1,6-bisphosphate; mGluR, metabotropic glutamate receptor; GDH, glutamate dehydrogenase; GSK3, glycogen synthase kinase-3; ACC, acetyl-CoA carboxylase. (From Forsberg et al., 2004. See the reference for the references mentioned).
28 | Livestock Research Report 846
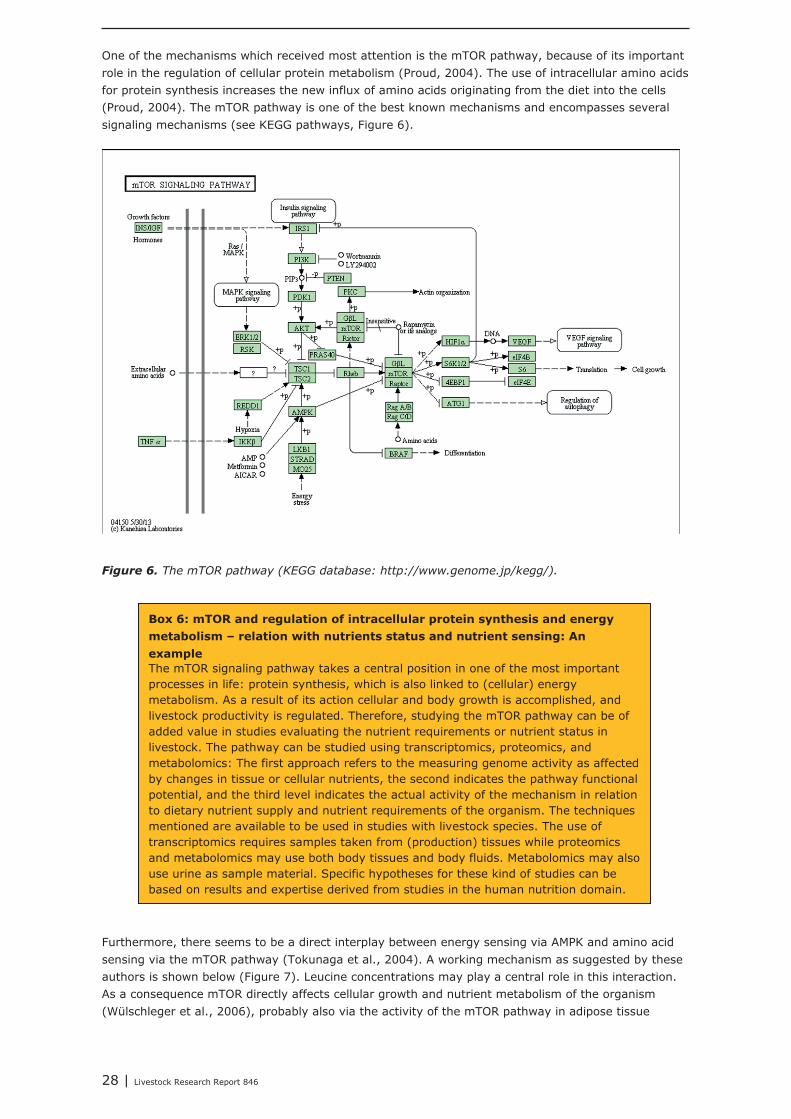
One of the mechanisms which received most attention is the mTOR pathway, because of its important role in the regulation of cellular protein metabolism (Proud, 2004). The use of intracellular amino acids for protein synthesis increases the new influx of amino acids originating from the diet into the cells (Proud, 2004). The mTOR pathway is one of the best known mechanisms and encompasses several signaling mechanisms (see KEGG pathways, Figure 6).
Figure 6. The mTOR pathway (KEGG database: http://www.genome.jp/kegg/).
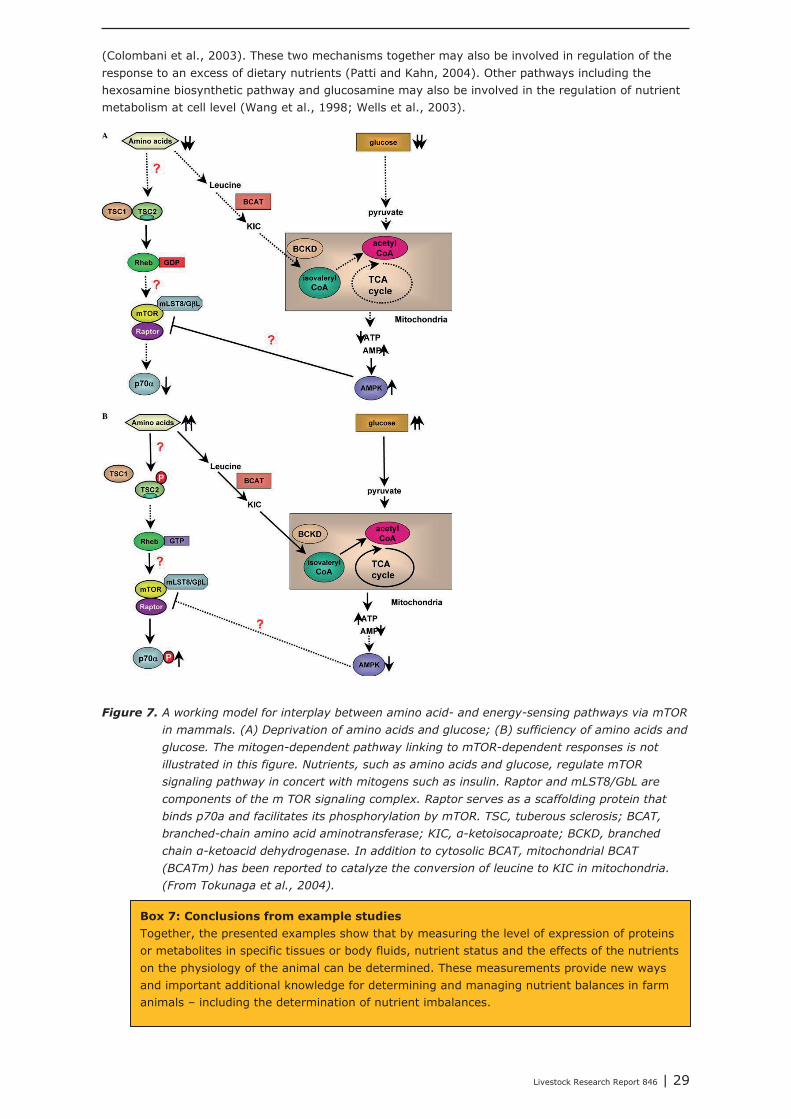
Furthermore, there seems to be a direct interplay between energy sensing via AMPK and amino acidsensing via the mTOR pathway (Tokunaga et al., 2004). A working mechanism as suggested by these authors is shown below (Figure 7). Leucine concentrations may play a central role in this interaction. As a consequence mTOR directly affects cellular growth and nutrient metabolism of the organism (Wülschleger et al., 2006), probably also via the activity of the mTOR pathway in adipose tissue
Box 6: mTOR and regulation of intracellular protein synthesis and energy metabolism – relation with nutrients status and nutrient sensing: An exampleThe mTOR signaling pathway takes a central position in one of the most important processes in life: protein synthesis, which is also linked to (cellular) energy metabolism. As a result of its action cellular and body growth is accomplished, and livestock productivity is regulated. Therefore, studying the mTOR pathway can be of added value in studies evaluating the nutrient requirements or nutrient status in livestock. The pathway can be studied using transcriptomics, proteomics, and metabolomics: The first approach refers to the measuring genome activity as affected by changes in tissue or cellular nutrients, the second indicates the pathway functional potential, and the third level indicates the actual activity of the mechanism in relation to dietary nutrient supply and nutrient requirements of the organism. The techniques mentioned are available to be used in studies with livestock species. The use of transcriptomics requires samples taken from (production) tissues while proteomics and metabolomics may use both body tissues and body fluids. Metabolomics may also use urine as sample material. Specific hypotheses for these kind of studies can be based on results and expertise derived from studies in the human nutrition domain.
Livestock Research Report 846 | 29
(Colombani et al., 2003). These two mechanisms together may also be involved in regulation of the response to an excess of dietary nutrients (Patti and Kahn, 2004). Other pathways including the hexosamine biosynthetic pathway and glucosamine may also be involved in the regulation of nutrient metabolism at cell level (Wang et al., 1998; Wells et al., 2003).
Figure 7. A working model for interplay between amino acid- and energy-sensing pathways via mTOR in mammals. (A) Deprivation of amino acids and glucose; (B) sufficiency of amino acids and glucose. The mitogen-dependent pathway linking to mTOR-dependent responses is not illustrated in this figure. Nutrients, such as amino acids and glucose, regulate mTOR signaling pathway in concert with mitogens such as insulin. Raptor and mLST8/GbL are components of the m TOR signaling complex. Raptor serves as a scaffolding protein that binds p70a and facilitates its phosphorylation by mTOR. TSC, tuberous sclerosis; BCAT, branched-chain amino acid aminotransferase; KIC, α-ketoisocaproate; BCKD, branchedchain α-ketoacid dehydrogenase. In addition to cytosolic BCAT, mitochondrial BCAT (BCATm) has been reported to catalyze the conversion of leucine to KIC in mitochondria.(From Tokunaga et al., 2004).
Box 7: Conclusions from example studiesTogether, the presented examples show that by measuring the level of expression of proteins or metabolites in specific tissues or body fluids, nutrient status and the effects of the nutrients on the physiology of the animal can be determined. These measurements provide new ways and important additional knowledge for determining and managing nutrient balances in farm animals – including the determination of nutrient imbalances.

30 | Livestock Research Report 846
Figure 8. Omics sciences in nutrition research.
The top part of Figure 8 shows how the diet is composed of many individual nutrients. The bottom part of the figure shows a cell. It should be noted that no specific cell type is indicated, it is just a general representation of a cell. The cells contain sensor molecules for the detection and quantification of various nutrients for metabolism. The nutrient sensors signal this information to the cellular metabolism, thereby activating or depressing physiological and biochemical pathways. Some pathways are regulated by a single nutrient or nutrient sensor couple, while others are regulated by severalnutrients. For some of the nutrient sensors, we have insufficient fundamental physiological and biochemical information to understand their mode of action and their metabolic and regulatory functions. At a next higher level, the metabolic reactions of these metabolic pathways are integrated in a network of pathways. Some examples of these steps are outlined in the text indicating how energy supplying nutrients regulate energy sensors that signal to regulate energy metabolism.Similarly, amino acids regulate protein synthesis and degradation. The integration of these pathways in joint energy and protein metabolism has been indicated. Similar mechanisms exist for fatty acid metabolism, and probably for other nutrients with still unknown sensor molecules. Some of these nutrient sensors may just bind the nutrient such as has been described for metal binding proteins. These proteins bind metal ions to transport them to sites of action, as signalling and transporter molecules, to become active, or for other purposes such as storage. Finally, via these metabolic reactions the cell genome is regulated. As a result, methylation and demethylation of the DNA mayoccur, and gene expression may be changed via several mechanisms, which can be measured via transcriptomic, proteomic, and metabolomic methods.

Livestock Research Report 846 | 31
4.4 Concluding remarks on the use of omics technologies for measuring nutrient status
The results show that it is possible to use proteomics and metabolomics for determination of the protein and metabolite composition of livestock products (milk, eggs, meat), in body fluids such as blood and saliva, and in excrements (faeces, urine, breath). Comparing this information with data on the dietary (digestible) nutrient supply will provide knowledge on the metabolic use, transformation and nutrient requirements of individual animals or groups of animals. Furthermore, information on biological pathways derived from bioinformatic and /or systems biology analyses will provide information about the status of the metabolism and variations of it in the breed and the individual animal. . Bioinformatics and systems biology approaches can also provide information on the physiological status of the animal and its metabolism in relation to the dietary nutrient supply.
Bioinformatic analyses and systems biology analysis can also use the measurements to determine the physiological status of the metabolism in relation to the dietary nutrient supply. It will be interesting to know what the physiological reaction is to changing the dietary nutrient inputs. This will probably impact productivity, maintenance, and nutrient losses. Therefore, the process to optimize the dietary nutrient composition for optimal productivity and minimal nutrient losses may not be a straightforward linear process requiring experimental determination of the requirements for all nutrients.
Box 9: Overall conclusionsIn the omics part of this report we have described the use of several omics techniques including transcriptomics, proteomics, and metabolomics for use in nutrition research in livestock species. While examples of the use of these techniques for such studies in livestock are very limited, especially the results of the use of these techniques in human dietary intervention studies are very promising. As a consequence we can conclude that the use of these omics techniques in livestock feeding studies is technically feasible, and that the hypotheses for such studies can be translated from similar human studies.Such omics studies also result in biomarkers that can be used to monitor, manage, and predict the outcome of studies aiming to optimize diet composition and dietary nutrient supply in defined populations of livestock species or in individual animals.
Box 8: Conclusions about the use of technologies for diet composition effect studies – some ongoing examplesIt can be concluded that the required omics technologies are available and can be used for the species- and breed-specific regulation of the effects of dietary nutrient supply. This will deliver candidate genes for the development of biomarkers of nutrient status of an animal kept under a particular condition.
Some ongoing examples:1. Proteomics and metabolomics investigations are being performed to elucidate that
livestock production under so-called “organic” conditions are indeed fed diets classified as organic diets. Dietary ingredient and nutrient composition is reflected in the composition of livestock products.
2. Similar to (1) it is possible to show whether livestock was kept indoor or allowed to go outside based on the composition of livestock products.
3. Metabolomics investigations into the composition of cattle milk show that both genotype of the animals, and the interaction with diet composition affect the metabolite composition of the milk. Furthermore, animal-specific effects appear in such studies.
These examples show the potential of omics research in relation to diet composition and dietary nutrient supply on livestock productivity.
32 | Livestock Research Report 846
References
Altmann, M., E.von Borell (2007). Leptin as an indicator for carcass composition in farm animals. Animal Science Journal, 78 (5), 449 - 459.
Ang, C-S., and Nice, E.C. (2010).Targeted In-Gel MRM: A Hypothesis Driven Approach for Colorectal Cancer Biomarker Discovery in Human Feces. J. Prot. Res. 9, 4346–4355.
Arab, L. (2003). Biomarkers of fat and fatty acid intake. The Journal of nutrition, 133, 925S-932S.Ashton, K., L. Hooper, L. J. Harvey, R. Hurst, A. Casgrain & S. J. Fairweather-Tait (2009). Methods of
assessment of selenium status in humans: a systematic review. The American journal of clinical nutrition, 89, 2025S-2039S.
Aura, A-M., Mattila, I., Seppänen-Laakso, T., Miettinen, J., Oksman-Caldentey, K-M., and Orešic, M. (2008). Microbial metabolism of catechin stereoisomers by human faecal microbiota: Comparison of targeted analysis and a non-targeted metabolomics method. Phytochem. Lett. 1, 18–22.
Barb, C.R., G.J. Hausman, C.A. Lents, Energy metabolism and leptin: effects on neuroendocrine regulation of reproduction in the gilt and sow, Reprod. Domest. Anim. 43 (2008). 324–330.
Baroncelli, G. I. (2008). Quantitative ultrasound methods to assess bone mineral status in children: technical characteristics, performance, and clinical application. Pediatric research, 63, 220-228.
Bewley, J., A. Peacock, O. Lewis, R. Boyce, D. Roberts, M. Coffey, S. Kenyon & M. Schutz (2008).Potential for estimation of body condition scores in dairy cattle from digital images. Journal Dairy Science, 91, 3439-3453.
Bingham, S. A. (2003). Urine nitrogen as a biomarker for the validation of dietary protein intake. The Journal of Nutrition, 133, 921S-924S.
Bjerre-Harpøth, V., N. Friggens, V. M. Thorup, T. Larsen, B. M. Damgaard, K. L. Ingvartsen & K. Moyes (2012). Metabolic and production profiles of dairy cows in response to decreased nutrient density to increase physiological imbalance at different stages of lactation. Journal Dairy Science, 95, 2362-2380.
Brosh, A. (2007). Heart rate measurements as an index of energy expenditure and energy balance in ruminants: A review. Journal of Animal Science, 85, 1213-1227.
Carling, D. (2004). The AMP-activated protein kinase cascade - a unifying system for energy control. Trends Biochem. Sci. 29, 18–24.
Colombani, J., Raisin, S., Pantalacci, S., Radimerski, T., Montagne, J., and Léopold, P. (2003). A Nutrient Sensor Mechanism Controls Drosophila Growth. Cell 114, 739–749.
Danzeisen, R., M. Araya, B. Harrison, C. Keen, M. Solioz, D. Thiele & H. J. McArdle (2007). How reliable and robust are current biomarkers for copper status? British Journal of Nutrition, 98, 676-683.
Darmaun, D. & N. Mauras (2005). Use of stable isotopes to assess protein and amino acid metabolism in children and adolescents: A brief review. Hormone Research, 64, 32-37.
Estienne, M. J., Harper, A. F., Kozink, D. M., & Knight, J. W. (2003).. Serum and milk concentrations of leptin in gilts fed a high-or low-energy diet during gestation. Animal Reproduction Science, 75(1), 95-105.
Favé, G., Beckmann, M.E., Draper, J.H., and Mathers, J.C. (2009). Measurement of dietary exposure: a challenging problem which may be overcome thanks to metabolomics? Genes Nutr. 4, 135–141.
Forsberg, H., Gilstring, C.F., Zargari, A., Martínez, P., and Ljungdahl, P.O. (2004). The role of the yeast plasma membrane SPS nutrient sensor in the metabolic response to extracellular amino acids. Mol. Microbiol. 42, 215–228.
Fuller, M. (1991).. Methodologies for the measurement of digestion. Pages 273–288 in Digestive Physiology in Pigs. Proc. 5th Intl. Symp. M. W. A. Verstegen, J. Huisman, and L. A. den Hartog, ed. Wageningen Academic Publishers, Wageningen, the Netherlands.
Gao, X., Pujos-Guillot, E., Martin, J-F., Galan, P., Juste, C., Jia, W., and Sebedio, J-L. (2009).Metabolite analysis of human fecal water by gas chromatography/mass spectrometry with ethyl chloroformate derivatization. Anal. Biochem. 393, 163–175.

Livestock Research Report 846 | 33
Gibney, M.J., Walsh, M., Brennan, L., Roche, H.M., German, B., and Van Ommen, B. (2005).Metabolomics in human nutrition: opportunities and challenges. Am. J. Clin. Nutr. 82, 497–503.
Goncalves, F. M., E. D. Ribeiro, P. Montagner, M. S. Lopes, M. A. Anciuti, F. P. Gentilini, F. A. B. del Pino & M. N. Correa (2010). Serum Levels of Liver Enzymes in Laying Hens before and during the Peak of Egg Production. Acta Scientiae Veterinariae, 38, 311-314.
Gu, H., Chen, H., Pan, Z., Jackson, A.U., Talaty, N., Xi, B., Kissinger, C., Duda, C., Mann, D., Raftery, D., and Cooks, R.G. (2007) Monitoring Diet Effects via Biofluids and Their Implications for Metabolomics Studies. Anal. Chem. 79, 89-97.
Hagmuller, W. & J. E. Aurich (2004). Subclinical ketosis: sensitivity and specificity of the Ketostix((R)) urine test. Praktische Tierarzt, 85, 266.
Hambidge, M. (2003). Biomarkers of trace mineral intake and status. The Journal of nutrition, 133, 948S-955S.
Hambly, C. & C. C. Voigt (2011). Measuring energy expenditure in birds using bolus injections of C-13-labelled Na-bicarbonate. Comparative Biochemistry and Physiology a-Molecular & Integrative Physiology, 158, 323-328.
Hardie, D.G. (2003). The AMP-Activated Protein Kinase Cascade: The Key Sensor of Cellular Energy Status. Endocrinology 144, 5179–5183.
Hardie, D.G. (2011). AMP-activated protein kinase--an energy sensor that regulates all aspects of cell function. Genes Dev. 25, 1895-1908.
Hardie, D.G., Hawley, S.A., and Scott, J.W. (2006). AMP-activated protein kinase – development of the energy sensor concept. J. Physiol. 574, 7–15.
Hyde, R., Taylor, P.M., and Hundal, H.S. (2003). Amino acid transporters: roles in amino acid sensing and signalling in animal cells. Biochem. J. 373, 1–18
Jacobs, D.M., Deltimple, N., Van Velzen, E., Van Dorsten, F.A., Bingham, M., Vaughan, E.E., and Van Duynhoven, J. (2008). 1H NMR metabolite profiling of feces as a tool to assess the impact of nutrition on the human microbiome. NMR Biomed. 21, 615–626.
Kentsis, A., Monigatti, F., Dorff, K., Campagne, F., Bachur, R., and Steen, H. (2009). Urine proteomics for profiling of human disease using high accuracy mass spectrometry. Proteomics Clin. Appl. 3, 1052-1061.
Kida, K. (2003). Relationships of metabolic profiles to milk production and feeding in dairy cows. J Vet Med Sci, 65, 671-7.
Kim, K., Aronov, P., Zakharkin, S.O., Anderson, D., Perroud, D., Thompson, I.M., and Weiss, R.H. (2009). Urine Metabolomics Analysis for Kidney Cancer Detection and Biomarker Discovery. Mol. Cell. Prot. 8, 558–570.
Lamers, Y. (2011). Indicators and methods for folate, vitamin B-12, and vitamin B-6 status assessment in humans. Current Opinion in Clinical Nutrition and Metabolic Care, 14, 445-454.
LaRocque, R.C., Krastins, B., Harris, J.B., Lebrun, L.M., Parker, K.C., Chase, M., Ryan, E.T., Qadri, F., Sarracino, D., and Calderwood, S.B. (2008). Proteomic Analysis of Vibrio cholerae in Human Stool. Infect. Immun. 76, 4145-4151.
Lauridsen, C., U. Halekoh, T. Larsen, and S. K. Jensen (2010). Reproductive performance and bone status markers of gilts and lactating sows supplemented with two different forms of vitamin D. J. Anim. Sci. 88:202–213.
Lee, S. Y., & Gallagher, D. (2008). Assessment methods in human body composition. Current opinion in Clinical Nutrition and Metabolic Care, 11, 566.
Lemme, A., Ravindran, V., & Bryden, W. L. (2004). Ileal digestibility of amino acids in feed ingredients for broilers. World's Poultry Science Journal, 60 (4), 423-438.
Lichtman, J.S., Marcobal, A., Sonnenburg, J., and Elias, J.E. (2013). Host-centric proteomics of stool: A novel strategy focused on intestinal responses to the gut microbiota. MCP Papers in Press. Manuscript M113.029967.
Likhodii, S. S., Musa, K., & Cunnane, S. C. (2002). Breath acetone as a measure of systemic ketosis assessed in a rat model of the ketogenic diet. Clinical chemistry, 48, 115-120.
Livingstone, M. B. E. & A. E. Black (2003). Markers of the validity of reported energy intake. The Journal of Nutrition, 133, 895S-920S.
Lowe, N. M., K. Fekete & T. Decsi (2009). Methods of assessment of zinc status in humans: a systematic review. The American journal of clinical nutrition, 89, 2040S-2051S.

34 | Livestock Research Report 846
Lunardi, C. C., R. M. Lima, R. W. Pereira, T. K. M. Leite, A. B. M. Siqueira & R. J. Oliveira (2013).Association between polymorphisms in the TRHR gene, fat-free mass, and muscle strength in older women. Age, 35, 2477-2483.
Maes, D. G. D., Janssens, G. P. J., Delputte, P., Lammertyn, A., & de Kruif, A. (2004). Back fat measurements in sows from three commercial pig herds: relationship with reproductive efficiency and correlation with visual body condition scores. Livestock Production Science, 91, 57-67.
McGuire, M. A., D. K. Beede, M. A. Delorenzo, C. J. Wilcox, G. B. Huntington, C. K. Reynolds & R. J. Collier (1989). Effects of thermal stress and level of feed intake on portal plasma flow and netfluxes of metabolites in lactating Holstein cows. Journal of Animal Science, 67, 1050-1060.
McNiven, E.M.S., German, J.B., Slupsky, C.M. (2011). Analytical metabolomics: nutritional opportunities for personalized health. J. Nutr. Biochem. 22, 995–1002.
Mertens, D. R. (2005). Rate and extent of digestion. Quantitative aspects of ruminant digestion and metabolism, 2, 13-47.
Miller, L. M., Q. Wang, R. J. Smith, H. Zhong, D. Elliott & J. Warren (2007). A new sample substrate for imaging and correlating organic and trace metal composition in biological cells and tissues. Analytical and Bioanalytical Chemistry, 387, 1705-1715.
Monleón, D., Morales, J.M., Barrasac, A., López, J.A., Vázquezc, C., and Celda, B. (2009). Metabolite profiling of fecal water extracts from human colorectal cancer. NMR Biomed. 22, 342–348.
Moreira, V., L. Zeringue, C. Williams, C. Leonardi & M. McCormick (2009). Influence of calcium and phosphorus feeding on markers of bone metabolism in transition cows. Journal Dairy Science, 92, 5189-5198.
Mullan,B. P., Williams,I. H. (1990). The chemical composition of sows during their first lactation. J. Anim. Sci. 51, 375-387.
NRC (2012). Nutrient requirements of swine. 11th rev. ed. Natl. Acad. Press, Washington, DC.Ndlovu, T., M. Chimonyo, A. Okoh, V. Muchenje, K. Dzama & J. Raats (2007). Assessing the nutritional
status of beef cattle: current practices and future prospects. African Journal of Biotechnology, 6.Nga, J.S.Y., Ryana, U., Trengoveb, R.D. , Maker, G.L. (2012). Development of an untargeted
metabolomics method for the analysis of human faecal samples using Cryptosporidium-infected samples. Mol. Biochem. Parasit. 185, 145– 150.
Onyango, E., P. Hester, R. Stroshine & O. Adeola (2003). Bone densitometry as an indicator of percentage tibia ash in broiler chicks fed varying dietary calcium and phosphorus levels. Poultry Science, 82, 1787-1791.
Patti, M-E., and Kahn, B.B. (2004). Nutrient sensor links obesity with diabetes risk. Nature Med. 10, 1049-1050.
Pera, M.F. (2013). Epigenetics, vitamin supplements and cellular reprogramming. Nature Genet. 45, 1412-1413.
Potischman N, Freudenheim JL (2003). Biomarkers of nutritional exposure and nutritional status: an overview. J Nutr.;133:873S–874S.
Proud, C.G. (2004). mTOR-mediated regulation of translation factors by amino acids. Biochem. Biophys. Res. Comm. 313, 429–436.
Reist, M., D. Erdin, D. von Euw, K. Tschuenperlin, H. Leuenberger, Y. Chilliard, M. Hammond, C. Morel, C. Philipona, Y. Zbinden, N. Kuenzi, and J. W. Blum. 2002. Estimation of energy balance at the individual and herd level using blood and milk traits in highyielding cows. Journal Dairy Science 85:3314–3327.
Robert C, Palin M.F., Coulombe N., Roberge, C., Silversides F.G., Benkel B.F., McKay, R.M., Pelletier G.(1998). Backfat thickness in pigs is positively associated with leptin mRNA levels. Canadian J Anim Sci 78, 473–482.
Saric, J., Wang, Y., Li, J., Coen, M., Utzinger, J., Marchesi, J.R., Keiser, J., Veselkov, K., Lindon, J.C., Nicholson, J.K., and Holmes, E. (2008). Species Variation in the Fecal Metabolome Gives Insight into Differential Gastrointestinal Function. J. Prot. Res. 7, 352–360.
Sarr, O., I. Louveau, C. Kalbe, C. Metges, C. Rehfeldt & F. Gondret (2010). Prenatal exposure to maternal low or high protein diets induces modest changes in the adipose tissue proteome of newborn piglets. Journal Animal Science, 88, 1626-1641.
Schierbeek, H., C. H. P. van den Akker, L. B. Fay & J. B. van Goudoever (2012). High-precision mass spectrometric analysis using stable isotopes in studies of children. Mass Spectrometry Reviews, 31, 312-330.

Livestock Research Report 846 | 35
Schröder, U. J., & Staufenbiel, R. (2006). Invited Review: Methods to Determine Body Fat Reserves in the Dairy Cow with Special Regard to Ultrasonographic Measurement of Backfat Thickness. Journal of Dairy Science, 89(1), 1-14.
Shenkin, A, Cederblad, G., Elia, M. Isaksson, B. (1996). Laboratory assessment of protein-energy status. Clinica Chimica Acta, 253, S5-S59.
Shiina, Y., Homma, Y. (2013). Relationships between the Visceral Fat Area on CT and Coronary Risk Factor Markers. Internal Medicine, 52,1775-1780
Sibbald, I. R. (1982). Measurement of bioavailable energy in poultry feedingstuffs: a review. Canadian Journal of Animal Science, 62(4), 983-1048.
Siegert, S., Z. H. Yu, R. Wang-Sattler, T. Illig, J. Adamski, J. Hampe, S. Nikolaus, S. Schreiber, M. Krawczak, M. Nothnagel & U. Nothlings (2013). Diagnosing Fatty Liver Disease: A Comparative Evaluation of Metabolic Markers, Phenotypes, Genotypes and Established Biomarkers. Plos One, 8.
Soeters P.B, Reijven P.L.M., van Bokhorst - de van der Schueren M.A.E. (2008). A rational approach to nutritional assessment. Clin Nutr. 2008;27(5):706-716.
Spek, J. W., Dijkstra, J., Van Duinkerken, G., & Bannink, A. (2013). A review of factors influencing milk urea concentration and its relationship with urinary urea excretion in lactating dairy cattle. The Journal of Agricultural Science, 151, 407-423.
Stein, H. H., Sève, B., Fuller, M. F., Moughan, P. J., & De Lange, C. F. M. (2007). Invited review: Amino acid bioavailability and digestibility in pig feed ingredients: Terminology and application. Journal of Animal Science, 85 (1), 172-180.
Swennen, Q., C. Laroye, G. Janssens, K. Verbeke, E. Decuypere & J. Buyse (2007). Rate of metabolicdecarboxylation of leucine as assessed by a L 1-C-13(1) leucine breath test combined with indirect calorimetry of broiler chickens fed isocaloric diets with different protein : fat ratio. Journal of Animal Physiology and Animal Nutrition, 91, 347-354.
Szabo, Cs, Babinszky, L., Verstegen, M. W. A., Vangen, O., Jansman, A. J. M., Kanis, E. (1999). The application of digital imaging techniques in the in vivo estimation of the body composition of pigs: a review. Livestock Production Science, 60, 1-11.
Tauson, A. H., A. Ali, K. Kanska, K. Sobczynska & A. Chwalibog (2000). Breath test measurements in combination with indirect calorimetry for estimation of C-13-leucine oxidation in mink (Mustela vison). Thermochimica Acta, 349, 53-59.
Te Pas, M.F.W., Kruijt, L., Koopmans, S. J., and Smits M.A. (2013). Plasma Proteome profiles associated with diet-induced metabolic syndrome and the early onset of metabolic syndrome in a pig model. PLoS ONE 8 Issue 9, e73087.
Tokunaga, C., Yoshino, K., and Yonezawa, K. (2004). mTOR integrates amino acid- and energy-sensing pathways. Biochem. Biophys. Res. Comm. 313, 443–446.
Trujillo, E., Davis, C., and Milner, J. (2006). Nutrigenomics, Proteomics, Metabolomics, and the Practice of Dietetics. J. Am. Diet. Assoc. 106, 403-413.
Van Venrooij, L., R. De Vos, A. Borgmeijer-Hoelen, H. Kruizenga, C. Jonkers-Schuitema & B. de Mol (2007). Quick-and-easy nutritional screening tools to detect disease-related undernutrition in hospital in-and outpatient settings: A systematic review of sensitivity and specificity. e-SPEN, the European e-Journal of Clinical Nutrition and Metabolism, 2, 21-37.
Vitorino, R., Lobo, M.J.C., Ferrer-Correira, A.J., Dubin, J.R., Tomer, K.B., Domingues, P.M., and Amado, F.M.L. (2004). Identification of human whole saliva protein components using proteomics. Proteomics 4, 1109–1115.
Walsh, M.C., Brennan, L., Malthouse, J.P.G., Roche, H.M, and Gibney, M.J. (2006). Effect of acute dietary standardization on the urinary, plasma, and salivary metabolomic profiles of healthy humans. Am. J. Clin. Nutr. 84, 531–539.
Wang, C. T., W. T. Chang & T. L. Yang (2006). Study of the concentrations of calcium, copper, iron, magnesium and zinc in the hair of breast cancer patients. Trace Elements and Electrolytes, 23, 281-286.
Wang, J., L. Chen, D. Li, Y. Yin, X. Wang, P. Li, L. J. Dangott, W. Hu & G. Wu (2008). Intrauterine growth restriction affects the proteomes of the small intestine, liver, and skeletal muscle in newborn pigs. J. Nutr.,138, 60-66.
Wang, J., Liu, R., Hawkins, M., Barzilai, N., and Rossetti, L. (1998). A nutrient-sensing pathway regulates leptin gene expression in muscle and fat. Nature 393, 684-688.
36 | Livestock Research Report 846
Wang, X., Zhang, A., Han,Y., Wang, P., Sun, H., Song, G., Dong, T., Yuan, Y., Yuan, X., Zhang, M., Xie, N., Zhang, H., Dong, H., and Dong, W. (2012). Urine Metabolomics Analysis for Biomarker Discovery and Detection of Jaundice Syndrome in Patients With Liver Disease. Mol. Cell. Prot. 11, 370–380.
Wells, L., Vosseller, K.and Hart, G.W. (2003). A role for N-acetylglucosamine as a nutrient sensor and mediator of insulin resistance. CMLS, Cell. Mol. Life Sci. 60, 222–228.
Whitehead, C. C., Hood, R. L., Heard, G. S., & Pym, R. A. E. (1984). Comparison of plasma very low density lipoproteins and lipogenic enzymes as predictors of fat content and food conversion efficiency in selected lines of broiler chickens. British Poultry Science, 25, 277-286.
Wikoff, W.R., Anfor, A.T., Liu, J., Schultz, P.G., Lesley, S.A., Peters, E.C., and Siuzdak, G. (2009).Metabolomics analysis reveals large effects of gut microflora on mammalian blood metabolites. Proc. Natl. Acad. Sci. 106, 3698–3703.
Wilson, A. D., & Baietto, M. (2011). Advances in electronic-nose technologies developed for biomedical applications. Sensors, 11, 1105-1176.
Wishart, D.S. (2008). Metabolomics: applications to food science and nutrition research. Trends Food Sci. Technol. 19, 482-493.
Wüllschleger, S., Loewith, R., and Hall, M.N. (2006). TOR Signaling in Growth and Metabolism. Cell 124, 471-484.
Yde, C. C., J. A. Westerhuis, H. C. Bertram & K. E. B. Knudsen (2012). Application of NMR-based metabonomics suggests a relationship between betaine absorption and elevated creatine plasma concentrations in catheterised sows. British Journal of Nutrition, 107, 1603-1615.
Zeisel, S.H. (2007). Nutrigenomics and metabolomics will change clinical nutrition and public health practice: insights from studies on dietary requirements for choline. Am. J. Clin. Nutr. 86, 542–548.
Zhang, A., Sun, H., Wu, X., and Wang, X. (2012). Urine metabolomics. Clin. Chim. Acta 414, 65–69.Zhang, X., Jin, M., Wu, H., Nadasdy, T., Nadasdy, G., Harris, N., Green-Church, K., Nagaraja, H.,
Birmingham, D. J., Yu, C-Y., Hebert, L.A., and Rovin, B.H. (2008). Biomarkers of lupus nephritis determined by serial urine proteomics. Kidney Int. 74, 799–807.
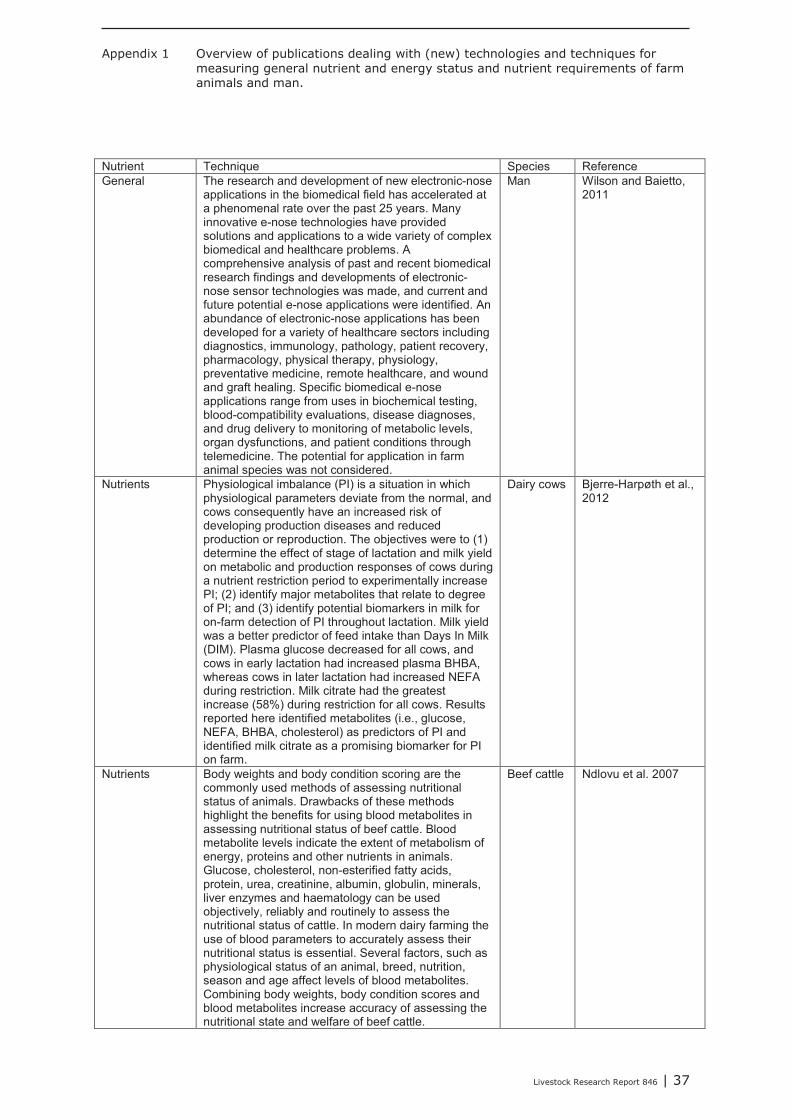
Livestock Research Report 846 | 37
Overview of publications dealing with (new) technologies and techniques for Appendix 1measuring general nutrient and energy status and nutrient requirements of farm animals and man.
Nutrient Technique Species ReferenceGeneral The research and development of new electronic-nose
applications in the biomedical field has accelerated at a phenomenal rate over the past 25 years. Many innovative e-nose technologies have provided solutions and applications to a wide variety of complex biomedical and healthcare problems. A comprehensive analysis of past and recent biomedical research findings and developments of electronic-nose sensor technologies was made, and current and future potential e-nose applications were identified. An abundance of electronic-nose applications has been developed for a variety of healthcare sectors including diagnostics, immunology, pathology, patient recovery, pharmacology, physical therapy, physiology, preventative medicine, remote healthcare, and wound and graft healing. Specific biomedical e-nose applications range from uses in biochemical testing, blood-compatibility evaluations, disease diagnoses, and drug delivery to monitoring of metabolic levels, organ dysfunctions, and patient conditions through telemedicine. The potential for application in farm animal species was not considered.
Man Wilson and Baietto, 2011
Nutrients Physiological imbalance (PI) is a situation in which physiological parameters deviate from the normal, and cows consequently have an increased risk of developing production diseases and reduced production or reproduction. The objectives were to (1) determine the effect of stage of lactation and milk yield on metabolic and production responses of cows during a nutrient restriction period to experimentally increase PI; (2) identify major metabolites that relate to degree of PI; and (3) identify potential biomarkers in milk for on-farm detection of PI throughout lactation. Milk yield was a better predictor of feed intake than Days In Milk (DIM). Plasma glucose decreased for all cows, and cows in early lactation had increased plasma BHBA, whereas cows in later lactation had increased NEFA during restriction. Milk citrate had the greatest increase (58%) during restriction for all cows. Results reported here identified metabolites (i.e., glucose, NEFA, BHBA, cholesterol) as predictors of PI and identified milk citrate as a promising biomarker for PI on farm.
Dairy cows Bjerre-Harpøth et al., 2012
Nutrients Body weights and body condition scoring are the commonly used methods of assessing nutritional status of animals. Drawbacks of these methods highlight the benefits for using blood metabolites in assessing nutritional status of beef cattle. Blood metabolite levels indicate the extent of metabolism of energy, proteins and other nutrients in animals. Glucose, cholesterol, non-esterified fatty acids, protein, urea, creatinine, albumin, globulin, minerals, liver enzymes and haematology can be used objectively, reliably and routinely to assess the nutritional status of cattle. In modern dairy farming the use of blood parameters to accurately assess their nutritional status is essential. Several factors, such as physiological status of an animal, breed, nutrition,season and age affect levels of blood metabolites. Combining body weights, body condition scores and blood metabolites increase accuracy of assessing the nutritional state and welfare of beef cattle.
Beef cattle Ndlovu et al. 2007

38 | Livestock Research Report 846
Nutrients The aim of this study was to assess the practicality of the metabolic profile test (MPT) for feeding evaluation in dairy cattle. Significant explanatory variables were determined by forward set-up selection, among the deviated values from the reference values of 10 blood metabolites and body condition score, to predict dependent variables, i.e., milk production and the rate of feeding to nutrient requirements, in each or all lactation stages and the dry period. The milk production model of the all-lactation stage showed the greatest goodness-of-fit with high positive regression coefficients for serum cholesterol, magnesium, urea nitrogen and albumin, and negative for glucose and calcium. In the feeding models, goodness-of-fit of crude protein was relatively high (R2=0.072, p<0.0001) with a positive relationship to blood urea nitrogen.
Dairy cows Kida, 2003
Nutrients The use of stable isotopes combined with mass spectrometry (MS) provides insight into metabolic processes within the body. Herein, an overview on the relevance of stable isotope methodology in pediatric research is presented. Applications for the use of stable isotopes with MS cover carbohydrate, fat, and amino acid metabolism as well as body composition, energy expenditure, and the synthesis of specificpeptides and proteins, such as glutathione and albumin. The main focus of these studies is on the interactions between nutrients and the endogenous metabolism within the body and how these factors affect the health of a growing infant.
Man Schierbeek et al., 2012
Nutrients Comparison of the proteomic profiles of three organs (jejunum, liver and gastrocnemius muscle) of piglets subjected to intra-uterine growth restriction and normal birth weight. Results indicate that intra uterine growth restriction decreased the levels of proteins that regulate immune function (immunoglobulins and annexin A1), oxidative defense (peroxiredoxin 1, transferrin, and z-crystallin), intermediary metabolism (creatine kinase, alcohol dehydrogenase, L-lactate dehydrogenase, prostaglandin F synthase, apolipoprotein AI, catecho O-ethyltransferase, and phosphoglycerate kinase 1), protein synthesis (eukaryotic translation initiation factor-3), and tissue growth (β-actin, desmin, and keratin 10) in a tissue-specific manner, whereas proteins involved in proteolysis and response to oxidative stress seem to be overexpressed as a consequence of the growth restriction and may be considered as relevant candidate biomarkers to reduced growth and development.
Foetal piglets
Wang et al., 2008
Energy The doubly labelled water technique. The doubly labelled water (DLW) technique is the gold standard for measuring energy expenditure (EE) under free-living conditions. The subject is given a dose of water enriched with the stable isotopes deuterium (2H) and oxygen 18 (18O). Urine samples are collected at baseline before administration of the dose and subsequently either daily or at the beginning and end of the measurement period. The urine samples are analysed by isotope ratio mass spectrometry to determine the rate of disappearance of each isotope from the body. Deuterium is lost in water only, whereas oxygen 18 is lost in both water and carbon dioxide. The rates of disappearance measure the body’s water and water-plus-carbon dioxide turnover rates, from which carbon dioxide production can be calculated by difference. The total EE is calculated from carbon dioxide production by applying the classical indirect calorimetric equations. The measurement period is most usually 14 d in adults, but periods from 7 to 21 d have been used.
Man Livingstone and Black, 2003
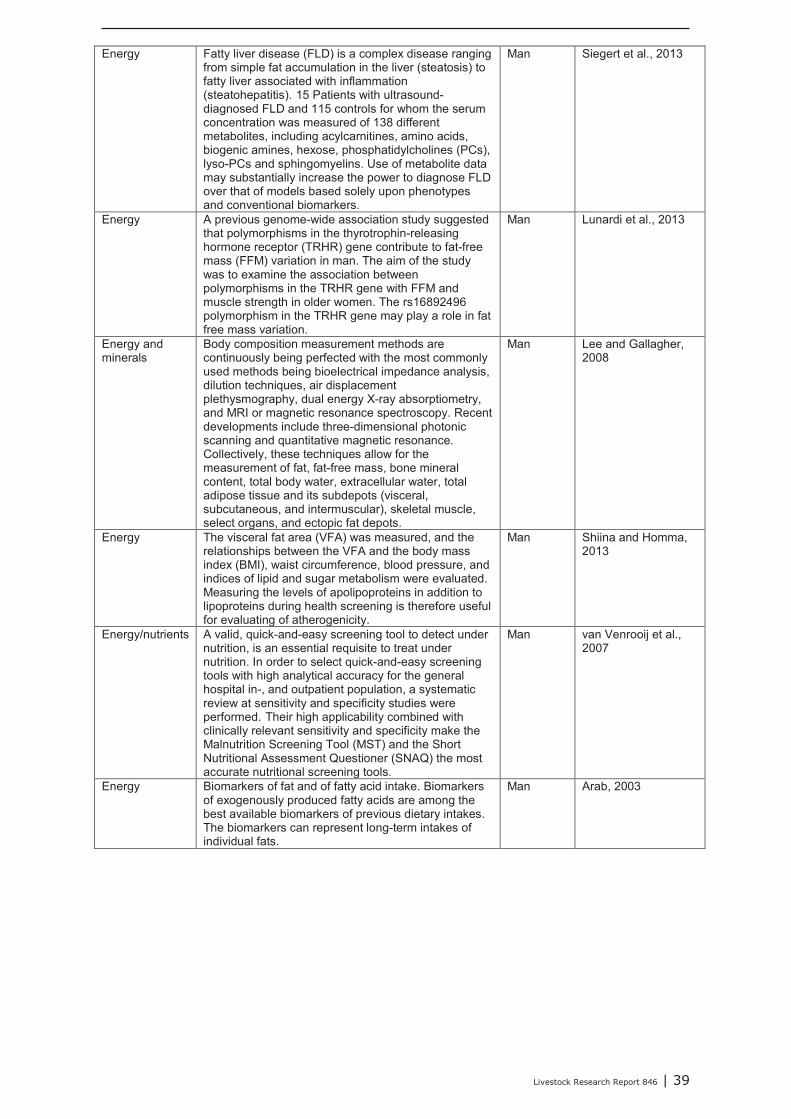
Livestock Research Report 846 | 39
Energy Fatty liver disease (FLD) is a complex disease ranging from simple fat accumulation in the liver (steatosis) to fatty liver associated with inflammation (steatohepatitis). 15 Patients with ultrasound-diagnosed FLD and 115 controls for whom the serum concentration was measured of 138 different metabolites, including acylcarnitines, amino acids, biogenic amines, hexose, phosphatidylcholines (PCs), lyso-PCs and sphingomyelins. Use of metabolite data may substantially increase the power to diagnose FLD over that of models based solely upon phenotypes and conventional biomarkers.
Man Siegert et al., 2013
Energy A previous genome-wide association study suggested that polymorphisms in the thyrotrophin-releasing hormone receptor (TRHR) gene contribute to fat-free mass (FFM) variation in man. The aim of the study was to examine the association between polymorphisms in the TRHR gene with FFM and muscle strength in older women. The rs16892496 polymorphism in the TRHR gene may play a role in fat free mass variation.
Man Lunardi et al., 2013
Energy and minerals
Body composition measurement methods are continuously being perfected with the most commonly used methods being bioelectrical impedance analysis, dilution techniques, air displacement plethysmography, dual energy X-ray absorptiometry, and MRI or magnetic resonance spectroscopy. Recent developments include three-dimensional photonic scanning and quantitative magnetic resonance. Collectively, these techniques allow for the measurement of fat, fat-free mass, bone mineral content, total body water, extracellular water, total adipose tissue and its subdepots (visceral, subcutaneous, and intermuscular), skeletal muscle, select organs, and ectopic fat depots.
Man Lee and Gallagher, 2008
Energy The visceral fat area (VFA) was measured, and the relationships between the VFA and the body mass index (BMI), waist circumference, blood pressure, and indices of lipid and sugar metabolism were evaluated.Measuring the levels of apolipoproteins in addition to lipoproteins during health screening is therefore useful for evaluating of atherogenicity.
Man Shiina and Homma, 2013
Energy/nutrients A valid, quick-and-easy screening tool to detect under nutrition, is an essential requisite to treat under nutrition. In order to select quick-and-easy screening tools with high analytical accuracy for the general hospital in-, and outpatient population, a systematic review at sensitivity and specificity studies were performed. Their high applicability combined with clinically relevant sensitivity and specificity make the Malnutrition Screening Tool (MST) and the Short Nutritional Assessment Questioner (SNAQ) the most accurate nutritional screening tools.
Man van Venrooij et al., 2007
Energy Biomarkers of fat and of fatty acid intake. Biomarkers of exogenously produced fatty acids are among the best available biomarkers of previous dietary intakes.The biomarkers can represent long-term intakes of individual fats.
Man Arab, 2003
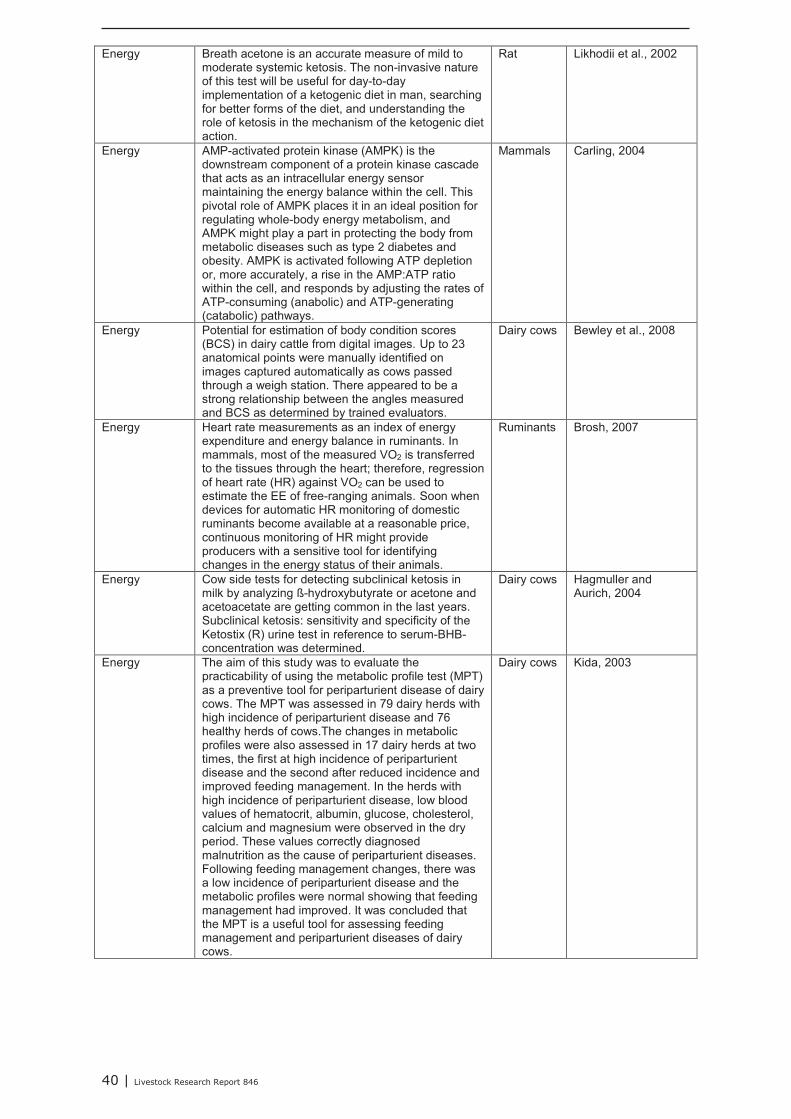
40 | Livestock Research Report 846
Energy Breath acetone is an accurate measure of mild to moderate systemic ketosis. The non-invasive nature of this test will be useful for day-to-day implementation of a ketogenic diet in man, searching for better forms of the diet, and understanding the role of ketosis in the mechanism of the ketogenic diet action.
Rat Likhodii et al., 2002
Energy AMP-activated protein kinase (AMPK) is the downstream component of a protein kinase cascade that acts as an intracellular energy sensor maintaining the energy balance within the cell. This pivotal role of AMPK places it in an ideal position for regulating whole-body energy metabolism, and AMPK might play a part in protecting the body from metabolic diseases such as type 2 diabetes and obesity. AMPK is activated following ATP depletion or, more accurately, a rise in the AMP:ATP ratio within the cell, and responds by adjusting the rates of ATP-consuming (anabolic) and ATP-generating (catabolic) pathways.
Mammals Carling, 2004
Energy Potential for estimation of body condition scores (BCS) in dairy cattle from digital images. Up to 23 anatomical points were manually identified on images captured automatically as cows passed through a weigh station. There appeared to be a strong relationship between the angles measured and BCS as determined by trained evaluators.
Dairy cows Bewley et al., 2008
Energy Heart rate measurements as an index of energy expenditure and energy balance in ruminants. In mammals, most of the measured VO2 is transferred to the tissues through the heart; therefore, regression of heart rate (HR) against VO2 can be used to estimate the EE of free-ranging animals. Soon when devices for automatic HR monitoring of domestic ruminants become available at a reasonable price, continuous monitoring of HR might provide producers with a sensitive tool for identifying changes in the energy status of their animals.
Ruminants Brosh, 2007
Energy Cow side tests for detecting subclinical ketosis in milk by analyzing ß-hydroxybutyrate or acetone andacetoacetate are getting common in the last years. Subclinical ketosis: sensitivity and specificity of the Ketostix (R) urine test in reference to serum-BHB-concentration was determined.
Dairy cows Hagmuller and Aurich, 2004
Energy The aim of this study was to evaluate the practicability of using the metabolic profile test (MPT) as a preventive tool for periparturient disease of dairy cows. The MPT was assessed in 79 dairy herds with high incidence of periparturient disease and 76 healthy herds of cows.The changes in metabolic profiles were also assessed in 17 dairy herds at two times, the first at high incidence of periparturient disease and the second after reduced incidence and improved feeding management. In the herds with high incidence of periparturient disease, low blood values of hematocrit, albumin, glucose, cholesterol, calcium and magnesium were observed in the dry period. These values correctly diagnosed malnutrition as the cause of periparturient diseases. Following feeding management changes, there was a low incidence of periparturient disease and the metabolic profiles were normal showing that feeding management had improved. It was concluded that the MPT is a useful tool for assessing feeding management and periparturient diseases of dairy cows.
Dairy cows Kida, 2003
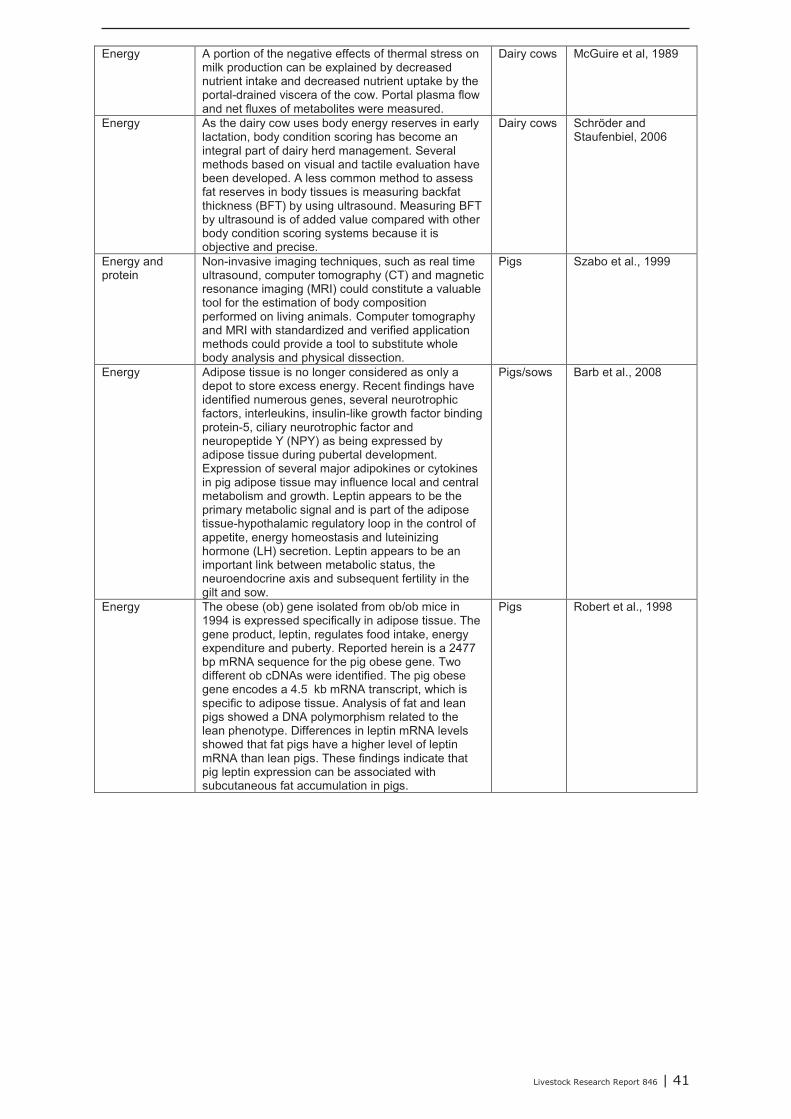
Livestock Research Report 846 | 41
Energy A portion of the negative effects of thermal stress on milk production can be explained by decreased nutrient intake and decreased nutrient uptake by the portal-drained viscera of the cow. Portal plasma flow and net fluxes of metabolites were measured.
Dairy cows McGuire et al, 1989
Energy As the dairy cow uses body energy reserves in early lactation, body condition scoring has become an integral part of dairy herd management. Several methods based on visual and tactile evaluation have been developed. A less common method to assess fat reserves in body tissues is measuring backfat thickness (BFT) by using ultrasound. Measuring BFT by ultrasound is of added value compared with other body condition scoring systems because it is objective and precise.
Dairy cows Schröder and Staufenbiel, 2006
Energy and protein
Non-invasive imaging techniques, such as real time ultrasound, computer tomography (CT) and magnetic resonance imaging (MRI) could constitute a valuable tool for the estimation of body composition performed on living animals. Computer tomography and MRI with standardized and verified application methods could provide a tool to substitute whole body analysis and physical dissection.
Pigs Szabo et al., 1999
Energy Adipose tissue is no longer considered as only a depot to store excess energy. Recent findings have identified numerous genes, several neurotrophic factors, interleukins, insulin-like growth factor binding protein-5, ciliary neurotrophic factor and neuropeptide Y (NPY) as being expressed by adipose tissue during pubertal development. Expression of several major adipokines or cytokines in pig adipose tissue may influence local and central metabolism and growth. Leptin appears to be the primary metabolic signal and is part of the adipose tissue-hypothalamic regulatory loop in the control of appetite, energy homeostasis and luteinizing hormone (LH) secretion. Leptin appears to be an important link between metabolic status, the neuroendocrine axis and subsequent fertility in the gilt and sow.
Pigs/sows Barb et al., 2008
Energy The obese (ob) gene isolated from ob/ob mice in 1994 is expressed specifically in adipose tissue. The gene product, leptin, regulates food intake, energy expenditure and puberty. Reported herein is a 2477bp mRNA sequence for the pig obese gene. Two different ob cDNAs were identified. The pig obese gene encodes a 4.5 kb mRNA transcript, which is specific to adipose tissue. Analysis of fat and lean pigs showed a DNA polymorphism related to the lean phenotype. Differences in leptin mRNA levels showed that fat pigs have a higher level of leptin mRNA than lean pigs. These findings indicate that pig leptin expression can be associated with subcutaneous fat accumulation in pigs.
Pigs Robert et al., 1998

42 | Livestock Research Report 846
Energy The function of leptin in livestock species has been intensively studied during recent years. Due to the associations between plasma leptin concentrations and body fat, leptin could be used as an indicator for the in vivo evaluation of carcass composition in breeding programs. This review specifically discusses leptin mRNA expression in several fat tissues, the relationship between plasma leptin and body fat and the influence of fasting on this association. It also refers to the limitations of the use of plasma leptin concentrations as a predictor for selection purposes in breeding animals. Furthermore, single nucleotide polymorphisms in the leptin gene have some effects on carcass traits and the leptin gene is considered to be a candidate gene for a marker-assisted selection. However, these results are very inconsistent across various populations and need to be confirmed in future studies before leptin can be used efficiently in breeding programs and management.
Pigs and other species
Altmann and von Borrell, 2007
Energy Concentrations of leptin in serum and milk were assessed in gilts fed diets during gestation that differed in energy level. Beginning at day 45 and continuing throughout pregnancy, gilts received either a high-energy (6882 kcal metabolizable energy (ME) per day) or low-energy (5221 kcal ME per day) diet. Within 24 h after farrowing, gilts fed the high-energy diet had greater levels of leptin in serum and milk than gilts that consumed the low-energy diet during gestation (P<0.07); Across treatments, backfat thickness and leptin levels in serum were positively correlated (r2=0.51; P=0.03). At weaning, backfat thickness (P<0.07), but not body weights or serum and milk levels of leptin (P>0.1), were greater for gilts fed the high-energy, versus the low-energy, diet during gestation. Gilts that were fed the low-energy diet during gestation consumed more feed during week 2 of lactation (P=0.06). Results suggest that altering the level of energy in the diets of gestating swine can influence circulating and milk concentrations of leptin, as well as feed consumption, during lactation.
Pigs/gilts Estienne et al., 2003
Energy Investigate back fat levels in sows of commercial pig herds in relation to reproductive efficiency. The correlation between back fat measurements and visual scoring of the body condition was also assessed. Back fat measurements and visual scoring of the body condition of the sows were only moderately correlated (r=0.30-0.60). The study showed that back fat measurements constitute a valuable tool to monitor and improve the productivity and efficiency of high producing pig herds.
Sows Maes et al., 2004
Energy and protein
The body composition of the sow during the first lactation can be accurately predicted from live weight and depth of backfat.
Sows Mullan and Williams, 1990
Energy Activities of lipogenic enzymes and plasma very low density lipoprotein (VLDL) concentrations were measured in lines of chickens with large differences in feed conversion efficiency (FCE) and body fat. Hepatic activities of malate dehydrogenase and ATP citrate lyase were correlated with the proportion of both abdominal and total body fat (r = 0.50) but were poorly correlated with gain:feed ratio. Activities of MD and CL in plasma were low and variable and were not correlated with any other characteristics. Plasma VLDL concentration was significantly correlated with the proportion of abdominal and total body fat (r = 0.59), and gain: feed ratio (r = 0.36).
Broilers Whitehead et al. 1984

Livestock Research Report 846 | 43
Energy Measuring energy expenditure in birds using bolus injections of 13C-labelled Na-bicarbonate. This technique is suitable for measuring energy expenditure over short-term activities. The major advantage of this technique is that it can be applied without the animal having to wear a respirometry mask or being enclosed in a respirometry chamber.
Broilers Hambly & Voigt, 2013

44 | Livestock Research Report 846
Overview of publications dealing with (new) technologies and techniques for Appendix 2measuring protein status and nutrient requirements of farm animals and man.
Protein Current tracer approaches in children and adolescents utilize stable isotopes, ‘heavier’ forms of elements that have one or several extra neutrons in the nucleus. Such isotopes are already present at low, but significant, levels in all tissues and foodstuffs, are not radioactive and are devoid of any known side-effects when present in small amounts. L-[1- 13 C] labelled leucine, given as a 4- to 6-hintravenous infusion, has become the method of choice to assess whole-body protein kinetics.Attempts have also been made to measure amino acid/protein metabolism in selected body compartments, and to measure the kinetics of specific tissue proteins, for example, muscle, gut, or plasma proteins.
Man Darmaunand Mauras, 2005
Protein When validated for completeness, 24-h urine nitrogen obtained from repeated 24-h urine collections has provided useful insights into the validity of dietary assessments, underreporting behaviors and the structure of measurement errors that are associated with different methods. This is particularly so when nitrogen is combined with another marker in 24-h urine samples, potassium. Although the collection of 24-h urine is a tedious procedure, the method is readily accessible and comparatively inexpensive. Other markers of dietary intake and intermediate risk markers may also be measured in the 24-h urine that is obtained.
Man Bingham, 2003
Protein Milk urea nitrogen (MUN) concentration in dairy cows may serve as an on-farm indicator to guide nutritional strategies and to help reduce emissions of nitrogen (N) to the environment. Excretion of urinary urea nitrogen (UUN) is positively related to MUN, but the relationship is highly variable. The accuracy of MUN as a predictor of UUN may improve when various factors that affect this relationship can be taken into account. Factors related to variation in water intake, urine production, dietary protein level, body weight (BW) and time and frequency of feeding and milking are shown to affect MUN and its relationship with UUN. Accounting for mentioned factors in the relationship between MUN and UUN might substantially improve the applicability and accuracy of MUN as a predictor of protein utilization efficiency and protein status and UUN.
Dairy cows Spek et al., 2013
Protein The proteome of the subcutaneous adipose tissue in piglets born from sows subjected to low, high and normal protein diets, throughout gestation, was evaluated by 2DE with protein identification using MALDI TOF/TOF. The results showed a different proteome profile between the three experimental groups with piglets obtained from sows fed on low protein diets to have higher expression levels of proteins related to glucose and fatty acid metabolism, lipid transport and the regulation of apoptosis, whereas piglets obtained from sows fed on high protein diets show a higher expression of proteins related to amino acid metabolism and protein turnover.
Foetal piglets
Sarr et al., 2010

Livestock Research Report 846 | 45
Protein Liver enzymes in laying hens give evidence about metabolic disorders caused by diseases or nutritional deficiency that influence the hepatic activity. It was concluded that en increasing feeding level in the pre peak period causes increasing serum levels ofserum glutamic oxaloacetic transaminase (AST) andgamma glutamyl transpeptidase (GGT) produced in the liver.
Laying hens
Goncalves et al., 2010
Protein Use of a methodology for a 1-C-13(1)-leucine breath test combined with indirect calorimetry using broiler diets known to induce differences in protein retention. LP fed broilers had an improved protein retention compared with the HP fed birds.
Broilers Swennen et al., 2007
Protein Gas exchange measurements by indirect calorimetry used to calculate quantitative oxidation of 13Clabelled leucine in mink in response to feeding and fasting.
Mink Tauson et al., 2000

46 | Livestock Research Report 846
Overview of publications dealing with (new) technologies and techniques for Appendix 3measuring mineral and vitamin status and nutrient requirements of farm animals and man.
Minerals Concentrations of calcium, copper, iron, magnesium and zinc in the hair of breast cancer patients. Particularly, when comparing Cu/Zn and Cu/Fe ratios, a significant difference appeared. It was concluded that changes of calcium, copper, iron, magnesium and zinc concentrations in hair may have a certain relationship with breast cancer. The ratios of Ca/Mg, Cu/Zn and Cu/Fe could be used as biochemical markers in these patients.
Man Wang et al., 2006
Minerals Measurement of bone mineral status may be a usefultool in identifying the children who could be exposed to an increased risk of osteoporosis in adulthood. Dual energy x-ray absorptiometry and peripheral quantitative computed tomography may be used to this purpose, but the exposure to ionizing radiation is a limiting factor for preventive studies in large populations of children. Quantitative ultrasound (QUS) methods have been developed to assess bone mineral status in some peripheral skeletal sites such as calcaneus, phalanges of the hand, and tibia. QUS techniques are safe, easy to use, radiation-free, and devices are portable. This review described the main methodological principles of ultrasounds and the QUS variables derived from their application to bone tissue, technical differences and performance of QUS methods, factors influencing QUS measurements, normative data and results obtained in children with disturbances of growth or affected by disorders of bone and mineral metabolism.
Man Baroncelli, 2008
Trace minerals Synchrotron-based infrared (IR) and X-ray fluorescence (XRF) microscopes are becomingincreasingly popular tools for imaging the organic and trace metal compositions of biological materials, respectively, without the need for extrinsic labels or stains.
Man Miller et al. 2007
Copper The reliability and robustness of current biomarkers for copper status were reviewed. Some blood markers may indicate moderate and severe Cu deficiency (Cp, erythrocyte SOD1, PAM, DAO). There is no good marker for Cu excess, even at a level where symptoms such as acute nausea and abdominal pain are reported. Many of the potential markers of Cu status have not been tested yet. Rather than testing each of the cupro-enzymes, Cu-binding proteins or Cu chaperones for potential use as a Cu biomarker, the advent of high-throughput technologies has made it possible to screen for potential biomarkers in the whole proteome of a cell.Such a screening allows to search for a whole group of proteins that, in combination, reflect Cu status.
Man Danzeisen et al. 2007
Se Methods of assessment of selenium status in humans were reviewed. It revealed that plasma, erythrocyte, and whole-blood selenium, plasma selenoprotein P, and plasma, platelet, and whole-blood glutathione peroxidase activity respond to changes in selenium intake. For all potentially useful biomarkers, more information is needed to evaluate their strengths and limitations in different population groups, including the effects of varying intakes, the duration of intervention, baseline selenium status, and possible confounding effects of genotype.
Man Ashton et al., 2009

Livestock Research Report 846 | 47
Zn The search for a reliable, sensitive, and specific index of zinc status has been the subject of considerable research, which has resulted in the identification of a number of potentially usefulbiomarkers. This systematic review confirms that in healthy individuals, plasma, urinary, and hair zinc are reliable biomarkers of zinc status.
Man Lowe et al., 2009
Trace minerals Evolving strategies of considerable potential include molecular techniques such as the measurement of metallothionein mRNA in lymphocytes as a biomarker of zinc status, an assay that can now be performed with a dried blood spot. The application of tracer techniques also has a role in advancing the quality of zinc biomarkers. Also of special current interest is full definition of the potential of plasma-soluble transferrin receptor concentrations as the biomarker of choice for the detection of early functional iron deficiency.
Man Hambidge, 2003
Ca and P Influence of calcium and phosphorus feeding on markers of bone metabolism in transition cows. The effects of dietary Ca and P levels were determined on production, digestibility, and serum bone metabolism biomarkers in dairy cows. Osteocalcin is a metabolite of protein synthesis by osteoblasts, which can be used as a marker for bone formation. Pyridinoline is a biomarker of bone resorption that can also be found in collagen type I from skin but can be safely detected in serum. There was no significant effect of Ca or P on osteocalcin measurements. Pyridinoline concentrations were affected by dietary Ca levels and tended to have a significant dietary Ca × dietary P interaction.
Dairy cows Moreira et al., 2009
Ca and P Samples of blood plasma of lactating sows fed diets with different forms of vitamin D were analysed for osteocalcin, bone-specific alkaline phosphatase (BAP), tartrate-resistant acid phosphatase, crosslaps (degradation products of bone collagens), haptoglobin, alkaline phosphatase (AP), inorganic P (iP), and Ca. The bone status markers analysed in sows were influenced by physiological state rather than nutrition. The lactation stage of sows and the age of the suckling piglets influenced the bone status markers in piglets measured.
Sows and piglets
Lauridsen et al., 2010
Ca and P Bone densitometry as an indicator of percentage tibia ash in broiler chicks fed varying dietary calcium and phosphorus levels. It was concluded that in broiler chicks, tibia ash, tibia bone mineral content (BMC) and bone radiographic density (BMD) may be more sensitive than shear force as indicators of dietary Ca and P concentrations and that BMD as measured by dual energy x-ray absorptiometry may be used to predict percentage of tibia ash.
Broilers Onyango et al., 2003
Betaine Plasma samples were collected from the mesenteric artery and the portal vein to determine different absorption phases by 1H NMR spectroscopy-based metabolomics. The use of NMR spectroscopy for measuring nutrient uptake elucidated the relationship between betaine uptake and elevated creatine plasma concentrations.
Pigs Yde et al. 2012
Vitamin B6 and B12
With the increasing availability and more user-friendly configuration of liquid chromatograph-tandem mass spectrometers (LC-MS/MS), numerous analytical methods for determination of B-vitamin indicators by LC-MS/MS have been developed over the last years. These methods include folate assays for multaneous determination of numerous folate forms at their specific reduction level.
Man Lamers, 2011

Together with our clients, we integrate scientific know-how and practical experience to develop livestock concepts for the 21st century. With our expertise on innovative livestock systems, nutrition, welfare, genetics and environmental impact of livestockfarming and our state-of-the art research facilities, such as Dairy Campus and Swine Innovation Centre Sterksel, we support our customers to find solutions for current and future challenges.
The mission of Wageningen UR (University & Research centre) is ‘To explore the potential of nature to improve the quality of life’. Within Wageningen UR, nine specialised research institutes of the DLO Foundation have joined forces with Wageningen University to help answer the most important questions in the domain of healthy food and living environment. With approximately 30 locations, 6,000 members of staff and 9,000 students, Wageningen UR is one of the leading organisations in its domain worldwide. The integral approach to problems and the cooperation between the various disciplines are at the heart of the unique Wageningen Approach.
Wageningen UR Livestock ResearchP.O. Box 3386700 AH WageningenThe Netherlands T +31 (0)317 480 10 77E [email protected]/livestockresearch
Livestock Research Report 846
A.J.M. Jansman and M.F.W. te Pas
Techniques for evaluating nutrient status in farm animals