technical report tr 03-8 - colorado state university
TRANSCRIPT
Technical Report TR 03-8 Agric ultural Experiment Station
Cooperative Extension
2002 RESEARCH REPORTS
Arkansas Valley Researc h Center
October 2003
ARiiANSAS VALLEY RESEARCH CENTER ............. bal888
Koeky Ford, 6»lorado
COLORADO AGRICIJLTIJH.t\L EXPEHIMElft' STA'DON Voi.CXV

Gordon T. Mickle 1946-1961
Frank C. Schweissing 1961-2003
THE
ENTOMOLOGISTS
•
Wm. M . Hantsbarger 1961-1983
Whitney S. Cranshaw 1983-
Colorado State University Photographic Archives
Cover Story
The first annual report of this Research Center' in 1888 by Superintendent Frank Watrous was a planning outline for research to be carried out in 1889. One of the last comments he made in the report was "an especially thorough observation of insect pests relative to their extermination" should be made. In the annual reports of the twelve subsequent years, through 1900, there were 45 references to insect pests and problems they caused at the Research Center. Many of them are still familiar insect pests today.
Early work on~ pests, through the mid-1930's, in this area was mostly in the form of identification services and communication to the Superintendent on how to deal with a particular problem from entomologists based at Fort Collins.
It is likely the first entomologist to carry out research, on site, at this Research Center was John L. Hoerner, who was a native of Las Animas and very familiar with the area. He began his career with Colorado State College in about 1937 and through the years carried out several research projects in the Arkansas Valley. This included work with onion thrips, squash bugs and cutworms. His last project here dealt with the tomato fruitworm after it had caused devastating losses to growers and the canning companies during the 1950's. He developed an effective method of detecting eggs of this pest in the field, determined economic injury levels, and evaluated insecticides for use against this pest.
Gordon T. Mickle, State Extension Entomologist, was instrumental in initiating field plot research to deal with severe mite infestations on com in the Arkansas Valley. He tested a number ofacaricides for control of this pest, but more importantly was the first in Colorado to use a systemic acaricide, as a com seed treatment. This method provided excellent mite control. He carried out on-farm demonstration plots to educate growers as to it's effectiveness.
The State Extension Entomologist, William M. Hantsbarger continued to develop effective educational programs for growers in our area on the management of mites on com, thrips on onions, weevil in alfalfa and later greenbug on sorghum, using results of research carried out at this Research Center.
Frank C. Schweissing was employed as the entomologist at this Research Center in 1961. The Colorado Growers and Shippers Assn.(Arkansas Valley Onion Growers) and the Canning Companies were instrumental in obtaining this position. The initial work was with onion thrips, various tomato insects and an insect survey through the Valley. Research quickly expanded to the alfalfa weevil and spotted alfalfa aphid on alfalfa, Banks grass mite on com and later the greenbug on sorghum and the southwestern com borer on com although other insect pests were dealt with on a more limited basis. Studies have, over the years, included evaluation of new insecticides and acaricides, insect migration patterns, cultural practices to reduce insect damage, host plant resistance and tolerance and the integration of these methods to manage insect pest problems. He was particularly involved with obtaining registrations for new acaricides which were effective against the Banks grass mite. The mite was the major arthropod pest of com in the Arkansas Valley, but it was only a minor pest when considering the total com production in the United States. New registrations for mites were not a high priority in industry and extra effort was necessary to obtain these relatively few registrations.
Vegetable crop insects are the specialty of Whitney S. Cranshaw and he has carried out extensive studies at this Research Center on the onion thrips including insecticide evaluation, varietal tolerance, cross resistance between insecticides to thrips within chemical groups and the effect of fungicides on insecticide performance. He has also carried out research on various other vegetable insects including the striped cucumber beetle, psyllid and squash bug .
. It is interesting to note that, within the last 60 years, several insect pests have migrated from other areas into the Arkansas Valley or their biological habits changed. The alfalfa weevil was a foreign introduction that has been on the Western Slope of Colorado since the early 1900's but was not detected here until1956. The spotted alfalfa aphid was a foreign introduction to the U.S. in the 1950's and quickly moved into the Arkansas Valley. The greenbug, also a foreign introduction, for many years infested winter small grains during the cooler parts of the season. However, in 1968, a new biotype was found infesting sorghum in the heat of the summer. The Russian wheat aphid is a foreign introduction found in our area in the 1980's. The southwestern corn borer was thought not to winter in Colorado, north of a line running through Baca County, but on two occasions, in the early 1970's and late 1990's, after a series of mild winters, became a pest of corn throughout the Valley. The onion thrips and Banks grass mite are the two major arthropod pests that seem to have a long history in the Arkansas Valley.
'This Research Center was started as the Bent Agricultural Experiment Station in 1888. Bent County divided into several smaller entities and in 1889 the Center was renamed the Arkansas Valley Agricultural Experiment Station subsequently called the Rocky Ford Substation, Arkansas Valley Branch Station and finally, to date, the Arkansas Valley Research Center.
Cover Photograph Credits Department ofBioagricultural Science & Pest Management W. S. Cranshaw J. C. Owens F. C. Schweissing
Frank C. Schweissing Michael E. Bartolo Marvin A. Wallace Kevin J. Tanabe
Arkansas Valley Research Center Rocky Ford, Colorado
Staff
(719) 254-6312
Cooperators
Superintendent-Entomologist Vegetable Crops Scientist Farm Technician Research Associate
Jessica Davis, C.S.U., Ext. Soil Specialist, Department of Soil and Crop Sciences
Orren Doss, Graduate Research Assistant, C.S.U., Department of Soil and Crop Sciences
Tim Damato, Res. Associate, C.S.U., Department ofBioagricultural Sciences and Pest Management
David Gent, Graduate Research Assistant, C.S.U., Dept. OfBioagricultural Sciences and Pest Management
Jim Hain, Res. Associate, C.S.U., Department of Soil and Crop Sciences
Ardell Halvorson, Soil Scientist, USDA-ARS
Jerry Johnson, Crop Scientist, C.S.U., Department of Soil and Crop Sciences
Kevin Larson, Crop Scientist, C.S.U., Plainsman Research Center and Dept. of Soil & Crop Sciences
Scott Nissen, Weed Scientist, C.S.U., Department ofBioagricultural Sciences and Pest Management
Curtis Reule, Soil Scientist, USDA-ARS
Howard Schwartz, Plant Pathologist, C.S.U., Dept. ofBioagricultural Sciences and Pest Management
Philip Westra, Weed Scientist, C.S.U., Department ofBioagricultural Sciences and Pest Management
i
S. Lee Gray, Head
Colorado State University Fort Collins, Colorado
Agricultural Experiment Station Administration
Lee E. Sommers Director, Agricultural Experiment Station
491-5371
Department of Agricultural and Resource Economics 491-6325
J. Daryl Tatum, Head Department of Animal Sciences 491-6672
Thomas 0. Holtzer, Head Department ofBioagricultural Sciences and Pest Management 491-5261
Stephen J. Wallner, Head Department of Horticulture & Landscape Architecture 491-7019
James S. Quick, Head Department of Soil and Crop Sciences 491-6517
ii

county
Bent
Crowley
El Paso
Huerfano
Las Animas
Otero
Prowers
Pueblo
*Research
Bent Crowley El Paso Huerfano Las ~.imas Otero Prowers Pueblo
NRCS
Term Exeires
2003 Vice Ch:cn. 2004 2005
2003 2004 2005
2003 2004 2005
2003 ~004 2005
2003 2004 2005
2003 2004 2005
2003 2004 2005
Committee
Chairman
Member
Secretary
2003 Advisory Council Members ARKANSAS VALLEY RESEARCH CENTER
ROCKY FORD, COLORADO
Name and Address
*Kim Siefkas, 32470 Cty. Rd. 10, Las Animas, _co 81054 Ed Blackburn, 6619 Hwy. 194, Las Animas, CO 81054 Bill Elder, 13500 Hwy. 50, Las Animas, CO 81054
Matt Heimerich, 5325 Ln. 9 1/2, Olney Sps., CO 81062 Dean Rusher, 7995 Co. Ln. 10, Olney Sps., CO .81062
*John Tomky, 4413 Lane 8.5, Olney Sps.·, CO 81062
Glen Ermel, 10465 REA Road, Fountain, CO 80817 *Toby Wells, 11120 Old Pueblo Road, Fountain, CO 80817 Jay Frost, 18350 Hanover Rd., Pueblo, CO 81008
Allen Nicoi, Box 63, Hoehne, co 81046 *Paul E. Philpott, Box 3, Hoehne, CO 81046
Hans Hansen, 36606 Road JJ, La Junta, CO 81050 *Dennis Caldwell, 25026 Road 19, Rocky Ford, CO 81067 Robert Gerler, 25320 Road BB, La Junta, CO 81050
Leonard Rink, 21971 Hwy. 196, Bristol, co 81028 Jim Ellenberger, 36101 Rd. 11 1/2, Lamar, CO 81052
*Robert Jensen, 23485 Co. Rd. GG.S, Granada, CO 81041
Clay Fitzsimmons, 36038 so. Rd., Pueblo, CO 81006 Dan Genova, 33200 South Rd, Pueblo, co 81006
*Robert Wiley, 52699 Olson Rd., Boone, CO 81025
Extension Agents
Fair Grounds, Las Animas, co 81054 Bi~~ Hancock, Courthouse Annex, Ordway, CO 81063 Jonathan Vrabec, 305 S. Union, CO. Sps., CO 80910 Jim Conley, 401 Main, Suite 101, Walsenburg, CO 81089 Dean Oatman, 200 E. 1st, _Rm. 101, Trinidad, CO 81082 Bill Hancock, Box 190, Rocky Ford, CO 81067 Tim Macklin, 1001 S. Main, Lamar, CO 81052 Frank Sobolik, Courthouse, Pueblo, CO 81003
John Knapp, 29563 Road 18, Rocky Ford, CO 81067 Lorenz Sutherland, 318 Lacy, La Junta, CO 81050
iii
2002 Climatic Conditions Arkansas Valley Research Center
Colorado State University Rocky Ford, Colorado
Frank C. Schweissing, Superintendent
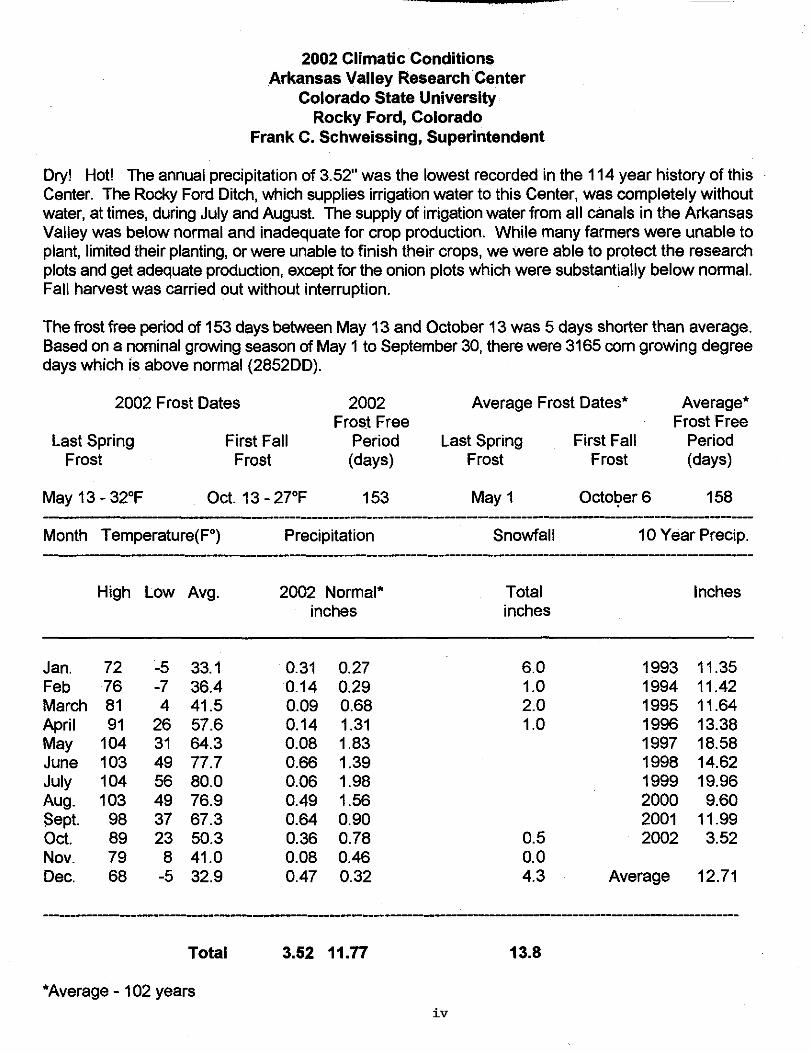
Dry! Hot! The annual precipitation of 3.52" was the lowest recorded in the 114 year history of this Center. The Rocky Ford Ditch, which supplies irrigation water to this Center, was completely without water, at times, during July and August. The supply of irrigation water from all canals in the Arkansas Valley was below normal and inadequate for crop production. While many farmers were unable to plant, limited their planting, or were unable to finish their crops, we were able to protect the research plots and get adequate production, except for the onion plots which were substantially below normal. Fall harvest was carried out without interruption.
The frost free period of 153 days between May 13 and October 13 was 5 days shorter than average. Based on a nominal growing season of May 1 to September 30, there were 3165 com growing degree days which is above normal (2852DD).
2002 Frost Dates 2002 Frost Free
Last Spring First Fall Period Frost Frost (days)
May 13- 32°F Oct. 13- 27°F 153
Month Temperature(F0)
High Low Avg.
Jan. 72 -5 33.1 Feb 76 -7 36.4 March 81 4 41.5 April 91 26 57.6 May 104 31 64.3 June 103 49 77.7 July 104 56 80.0 Aug. 103 49 76.9 Sept. 98 37 67.3 Oct. 89 23 50.3 Nov. 79 8 41.0 Dec. 68 -5 32.9
Precipitation
2002 Normal* inches
0.31 0.27 0.14 0.29 0.09 0.68 0.14 1.31 0.08 1.83 0.66 1.39 0.06 1.98 0.49 1.56 0.64 0.90 0.36 0.78 0.08 0.46 0.47 0.32
Average Frost Dates* Average*
Last Spring Frost
May 1
Snowfall
Total inches
6.0 1.0 2.0 1.0
0.5 0.0 4.3
Frost Free First Fall Period
Frost (days)
Octot,>er 6 158
10 Year Precip.
Inches
1993 11.35 1994 11.42 1995 11.64 1996 13.38 1997 18.58 1998 14.62 1999 19.96 2000 9.60 2001 11.99 2002 3.52
Average 12.71
------------------------------------------------------------------------------------------------------------------------------
Total 3.52 11.77 13.8
*Average- 102 years iv
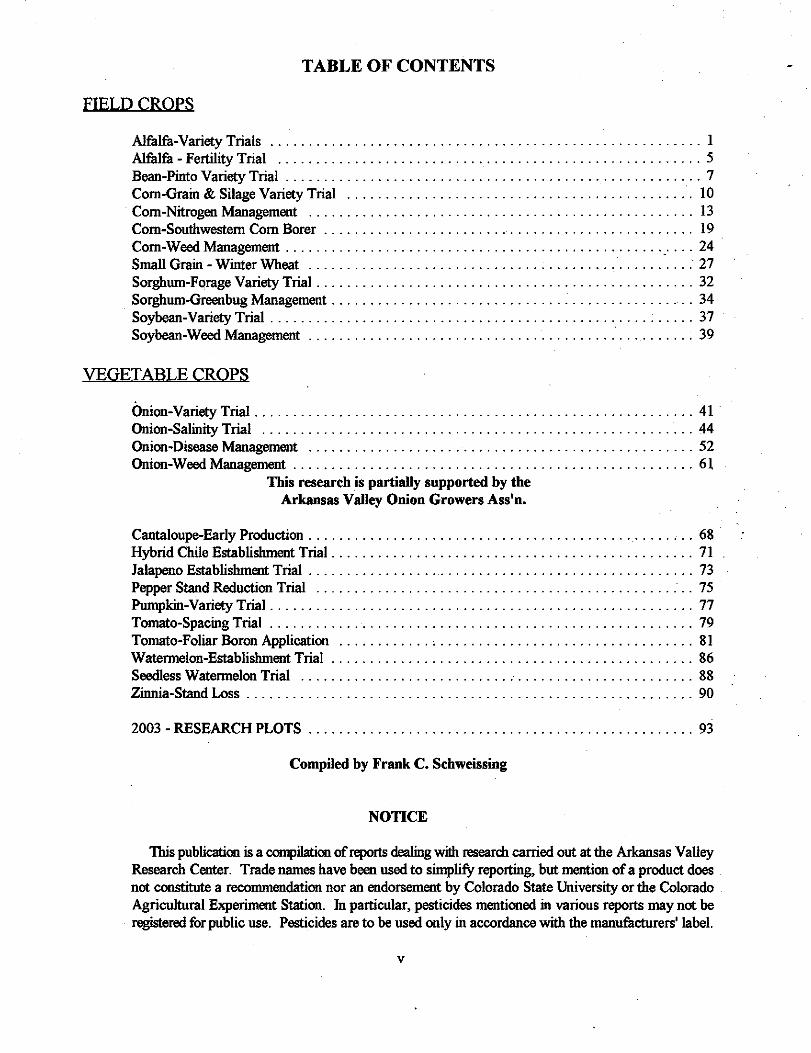
TABLE OF CONTENTS
FIELD CROPS
Alfalfa-Variety Trials ........................................................ 1 Alfalfa- Fertility Trial ....................................................... 5 Bean-Pinto Variety Trial ...................................................... 7 Com-Grain & Silage Variety Trial ............................................. 10 Com-Nitrogen Management . . . . . . . . . . . . . . . . . . . . . . . . . . . . . . . . . . . . . . . . . . . . . . . . . . 13 Com-Southwestern Com Borer ................................................ 19 Com-Weed Management .................................................. · ... 24 Small Grain - Winter Wheat .................................................. 27 Sorghum-Fqrage Variety Trial ................................................. 32 Sorghum-Greenbug Management ............................................... 34 Soybean-Variety Trial ....................................................... 37 Soybean-Weed Management .................................................. 39
VEGETABLE CROPS
Onion-Variety Trial ......................................................... 41 Onion-Salinity Trial ........................................................ 44 Onion-Disease Management .................................................. 52 Onion-Weed Management .................................................... 61
This research is partially supported by the Arkansas Valley Onion Growers Ass'n.
Cantaloupe-Early Production . . . . . . . . . . . . . . . . . . . . . . . . . . . . . . . . . . . . . . . . . . . . . . . . . . 68 Hybrid Chile Establishment Trial ............................................... 71 Jalapeno Establishment Trial .................................................. 73 Pepper Stand Reduction Trial . . . . . . . . . . . . . . . . . . . . . . . . . . . . . . . . . . . . . . . . . . . . . . . . . 75 Pumpkin-Variety Trial ....................................................... 77 Tomato-Spacing Trial . . . . . . . . . . . . . . . . . . . . . . . . . . . . . . . . . . . . . . . . . . . . . . . . . . . . . . . 79 Tomato-Foliar Boron Application ............ , . . . . . . . . . . . . . . . . . . . . . . . . . . . . . . . . . 81 Watermelon-Establishment Trial ............................................... 86 Seedless Watermelon Trial ................................................... 88 Zinnia-Stand Loss . . . . . . . . . . . . . . . . . . . . . . . . . . . . . . . . . . . . . . . . . . . . . . . . . . . . . . . . . . 90
2003 - RESEARCH PLOTS . . . . . . . . . . . . . . . . . . . . . . . . . . . . . . . . . . . . . . . . . . . . . . . . . . 93
Compiled by Frank C. Schweissing
NOTICE
This publication is a compilation of reports dealing with research carried out at the Arkansas Valley Research Center. Trade names have been used to simplifY reporting, but mention of a product does not constitute a recommendation nor an endorsement by Colorado State University or the Colorado . Agricultural Experiment Station. In particular, pesticides mentioned in various reports may not be registered for public use. Pesticides are to be used only in accordance with the manufacturers' label.
v
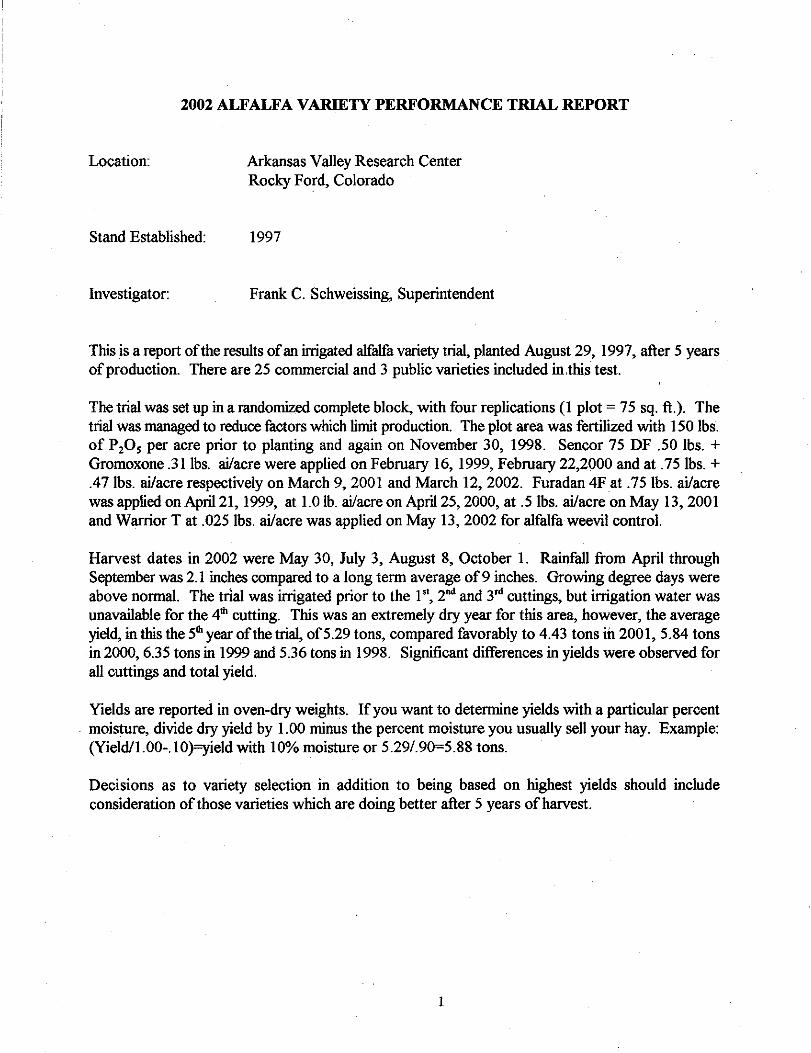
2002 ALFALFA VARIETY PERFORMANCE TRIAL REPORT
Location:
Stand Established:
Investigator:
Arkansas Valley Research Center Rocky Ford, Colorado
1997
Frank C. Schweissing, Superintendent
This is a report of the results of an irrigated alfalfa variety trial, planted August 29, 1997, after 5 years of production. There are 25 commercial and 3 public varieties included in .this test.
The trial was set up in a randomized complete block, with four replications (1 plot= 75 sq. ft.). The trial was managed to reduce factors which limit production. The plot area was fertilized with 150 lbs. of P20 5 per acre prior to planting and again on November 30, 1998. Sencor 75 DF .50 lbs. + Gromoxone .31lbs. ai/acre were applied on February 16, 1999, February 22,2000 and at .75lbs. + .47lbs. ai/acre respectively on March 9, 2001 and March 12, 2002. Furadan 4F at .751bs. ai/acre was applied on April21, 1999, at 1.0 lb. ai/acre on April25, 2000, at .5 lbs. ai/acre on May 13, 2001 and Warrior T at .025 lbs. ai/acre was applied on May 13, 2002 for alfalfa weevil control.
Harvest dates in 2002 were May 30, July 3, August 8, October 1. Rainfall from April through September was 2.1 inches compared to a long term average of9 inches. Growing degree days were above normal. The trial was irrigated prior to the 1 '', 2nd and 3n1 cuttings, but irrigation water was unavailable for the 4th cutting. This was an extremely dry year for this area, however, the average yield, in this the 5th year of the trial, of5.29 tons, compared favorably to 4.43 tons in 2001, 5.84 tons in 2000, 6.35 tons in 1999 and 5.36 tons in 1998. Significant differences in yields were observed for all cuttings and total yield.
Yields are reported in oven-dry weights. If you want to determine yields with a particular percent . moisture, divide dry yield by 1.00 minus the percent moisture you usually sell your hay. Example:
(Yield/1.00-.10)=yield with 10% moisture or 5.29/.90=5.88 tons.
Decisions as to variety selection in addition to being based on highest yields should include consideration of those varieties which are doing better after 5 years of harvest.
1
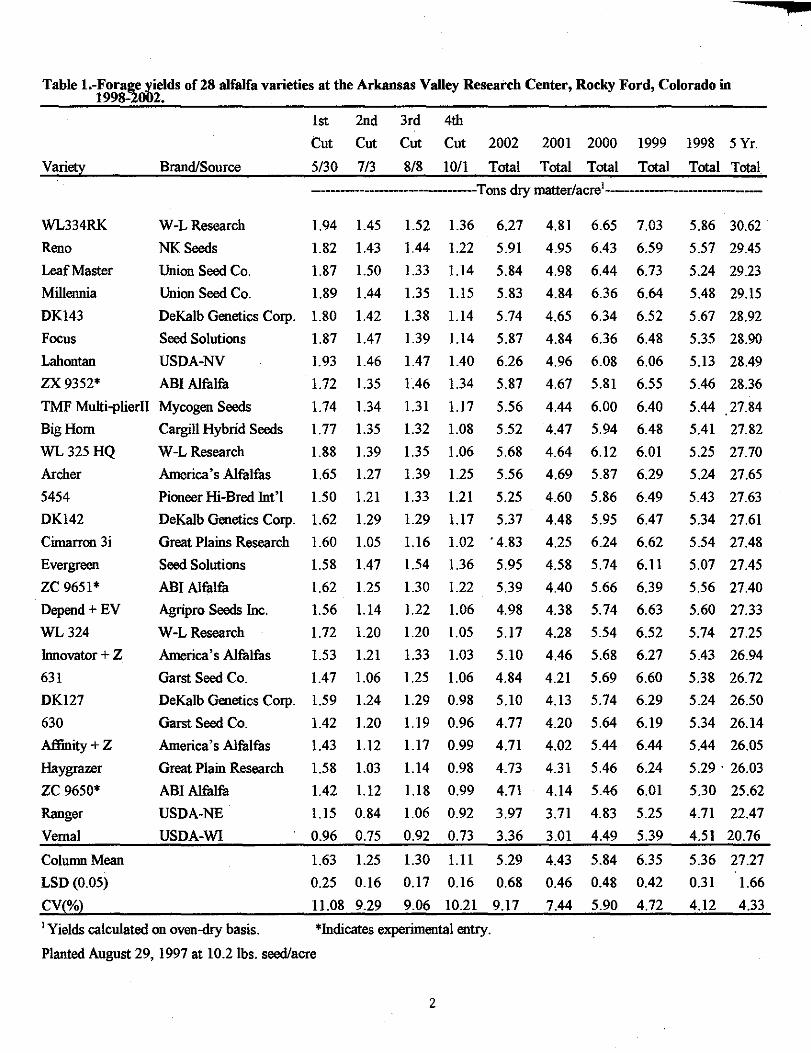
Table 1.-Forage yields of 28 alfalfa varieties at the Arkansas Valley Research Center, Rocky Ford, Colorado io 199S.:2002.
1st 2nd 3rd 4th
Variety Brand/Source
Cut Cut Cut Cut 2002 2001 2000 1999 1998 5 Yr.
5/30 7/3 8/8 1011 Total Total Total Total Total Total
----------------------------Tons dry matter/acre'-----------------------
WL334RK
Reno
Leaf Master
Millennia
DK143
Focus
Lahontao
ZX9352*
W-L Research
NKSeeds
Union Seed Co.
1.94 1.45
1.82 1.43
1.87 1.50
Union Seed Co. 1.89
DeKalb Genetics Corp. 1.80
Seed Solutions 1.87
USDA-NV 1.93
ABI Alfalfa 1.72
TMF Multi-plierll Mycogen Seeds 1.74
1.44
1.42
1.47
1.46
1.35
1.34
Big Hom Cargill Hybrid Seeds 1. 77 1.35
WL 325 HQ W-L Research 1.88 1.39
Archer America's Alfalfas 1.65 1.27
5454 Pioneer Hi-Bred Int'l 1.50 1.21
DK142 DeKalb Genetics Corp. 1.62 1.29
Cimarron 3i Great Plains Research 1. 60 1. 05
Evergreen Seed Solutions 1.58 1.47
ZC 9651* ABI Alfalfa 1.62 1.25
Depend + EV Agripro Seeds Joe. 1.56 1.14
WL324 W-LResearch 1.72 1.20
Ionovator + Z Aroerica's Alfalfas 1.53 1.21
631 Garst Seed Co. 1.47 1.06
DK127 DeKalb Genetics Corp. 1.59 1.24
630 Garst Seed Co. 1.42 1.20
Affinity+ z Hay grazer
zc 9650*
Ranger
Vernal
America's Alfalfas 1.43 1.12
Great Plain Research 1.58 1.03
ABI Alfalfa
USDA-NE
USDA-WI
1.42 1.12
1.15 0.84
0.96 0.75
1.63 1.25
1.52 1.36 6.27 4.81 6.65 7.03
1.44 1.22 5.91 4.95 6.43 6.59
1.33 1.14 5.84 4.98 6.44 6.73
1.35 1.15 5.83
1.38 1.14 5.74
1.39 1.14 5.87
1.47 1.40 6.26
1.46 1.34 5.87
1.31 1.17 5.56
1.32 1.08 5.52
1.35 1.06 5.68
1.39 1.25 5.56
1.33 1.21 5.25
1.29 1.17 5.37
1.16 1.02 . 4.83
1.54 1.36 5.95
1.30 1.22 5.39
1.22 1.06 4.98
1.20 1.05 5.17
1.33 1.03 5.10
1.25 1.06 4.84
1.29 0.98 5.10
1.19 0.96 4.77
1.17 0.99 4.71
1.14 0.98 4.73
1.18 0.99 4.71
1.06 0.92 3.97
0.92 0.73 3.36
1.30 1.11 5.29
4.84 6.36 6.64
4.65 6.34 6.52
4.84 6.36 6.48
4.96 6.08 6.06
4.67 5.81 6.55
4.44 6.00 6.40
4.47 5.94 6.48
4.64 6.12 6.01
4.69 5.87 6.29
4.60 5.86 6.49
4.48 5.95 6.47
4.25 6.24 6.62
4.58 5.74 6.11
4.40 5.66 6.39
4.38 5. 74 6.63
4.28 5.54 6.52
4.46 5.68 6.27
4.21 5.69 6.60
4.13 5.74 6.29
4.20 5.64 6.19
4.02 5.44 6.44
4.31 5.46 6.24
4.14 5.46 6.01
3.71 4.83 5.25
3.01 4.49 5.39
Column Mean
LSD (0.05)
CV(%)
0.25 0.16 0.17 0.16 0.68
11.08 9.29 9.06 10.21 9.17
4.43 5.84 6.35
0.46 0.48 0.42
7.44 5.90 4.72 1 Yields calculated on oven-dry basis. *Iodicates experimental entry.
Planted August 29, 1997 at 10.21bs. seed/acre
2
5.86 30.62
5.57 29.45
5.24 29.23
5.48 29.15
5.67 28.92
5.35 28.90
5.13 28.49
5.46 28.36
5.44 27.84
5.41 27.82
5.25 27.70
5.24 27.65
5.43 27.63
5.34 27.61
5.54 27.48
5.07 27.45
5.56 27.40
5.60 27.33
5.74 27.25
5.43 26.94
5.38 26.72
5.24 26.50
5.34 26.14
5.44 26.05
5.29. 26.03
5.30 25.62
4.71 22.47
4.51 20.76
5.36 27.27
0.31 1.66
4.12 4.33

2002 Alfalfa Variety Performance Trial Report
Location:
Stand Established:
Investigator:
Arkansas Valley Research Center Rocky Ford, Colorado 81067
2000
Frank C. Schweissing, Superintendent
This is a report of the results of an irrigated alfalfa variety trial, planted September 1, 2000, after two years of production. There are 22 commercial and 2 public varieties included in this test.
The trial was set up as a randomized complete block, with four replications (1 plot= 75 sq. ft.). The trial is managed to reduce factors which limit production. The plot area was fertilized with 100 lbs. ofP 2 0 5 + 21 lbs. ofN per acre prior to planting. Sencor DF . 75 lbs. + Gramoxone Extra .47lbs. ai/acre was applied March 12, 2002 to control winter annual weeds. Warrior T .025 lbs. ai/acre was applied May 13, 2002 to control the alfalfa weevil.
Harvest dates in 2002 were May 29, July 2, August 7 and October 1. Rainfall from April through September was 2.1 inches compared to a long term average of 9 inches. The trial was irrigated prior to the 1'', 2"d and 3n1 cuttings but not the 4th cutting due to the lack of irrigation water. This was an extremely dry year but the average trial yield of 7. 26 tons/acre was substantially better than the first years production of 4. 95 tons.
Yields are reported in oven-dry weights. If you want to determine yields with a particular percent moisture, divide dry yield by 1. 00 minus the percent moistur~ you usually sell your hay. Example: (Yield/1.00-.10) =yield with 10% moisture or 7.26/.90 = 8.07 tons per acre.
Decision as to value of a particular variety for production in our area needs to be based on several year's results. We have had situations where a variety would do very well for 2-3 years and then production would rapidly drop off in succeeding years.
3
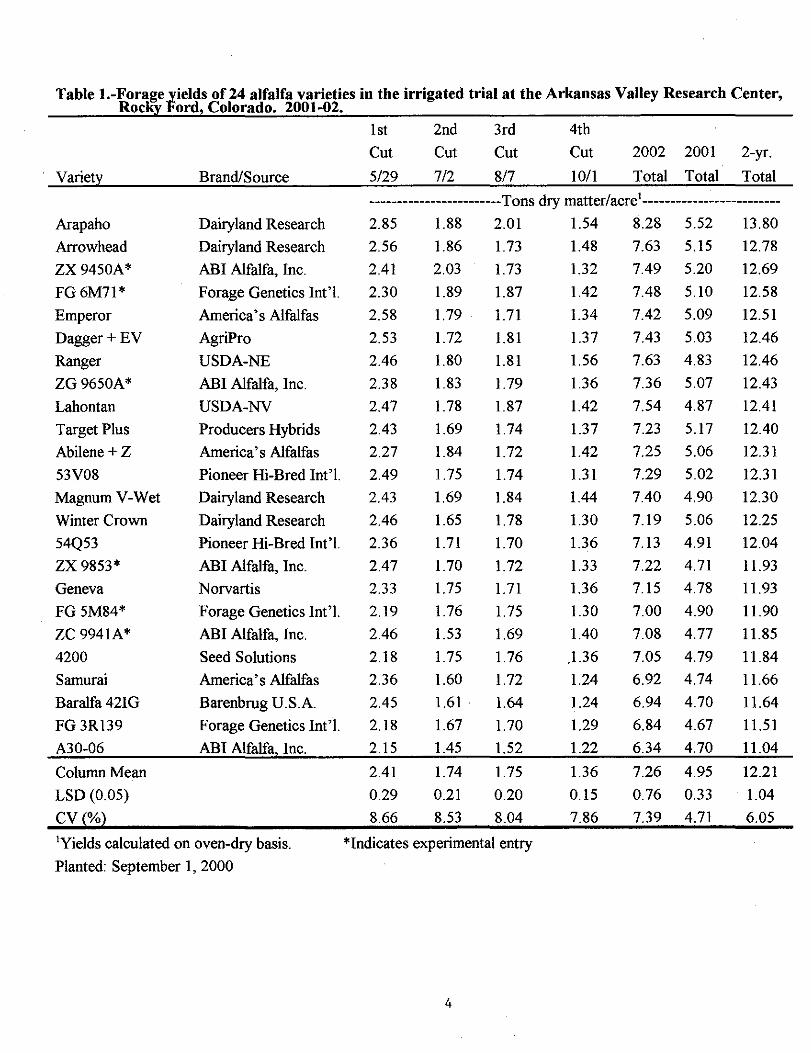
Table 1.-ForageFields of24 alfalfa varieties in the irrigated trial at the Arkansas Valley Research Center, Rocl{y ord, Colorado. 2001-02.
1st 2nd 3rd 4th
Cut Cut Cut Cut 2002 2001 2-yr.
Varie!Y Brand/Source 5/29 7/2 8/7 10/1 Total Total Total
------------------------Tons dry matter/acre'-------------------------
Arapaho Dairyland Research 2.85 1.88 2.01 1.54 8.28 5.52 13.80
Arrowhead Dairyland Research 2.56 1.86 1.73 1.48 7.63 5.15 12.78
ZX9450A* ABI Alfalfa, Inc. 2.41 2.03 1.73 1.32 7.49 5.20 12.69
FG6M71* Forage Genetics Int' I. 2.30 1.89 1.87 1.42 7.48 5.10 12.58
Emperor America's Alfalfas 2.58 1.79 1.71 1.34 7.42 5.09 12.51
Dagger+EV AgriPro 2.53 1.72 1.81 1.37 7.43 5.03 12.46
Ranger USDA-NE 2.46 1.80 1.81 1.56 7.63 4.83 12.46
ZG9650A* ABI Alfalfa, Inc. 2.38 1.83 1.79 1.36 7.36 5.07 12.43
Lahontan USDA-NV 2.47 1.78 1.87 1.42 7.54 4.87 12.41
Target Plus Producers Hybrids 2.43 1.69 1.74 1.37 7.23 5.17 12.40
Abilene+ Z America's Alfalfas 2.27 1.84 1.72 1.42 7.25 5.06 12.31
53V08 Pioneer Hi-Bred Int'l. 2.49 1.75 1.74 1.31 7.29 5.02 12.31
Magnum V-Wet Dairyland Research 2.43 1.69 1.84 1.44 7.40 4.90 12.30
Winter Crown Dairyland Research 2.46 1.65 1.78 1.30 7.19 5.06 12.25
54Q53 Pioneer Hi-Bred Int'l. 2.36 1.71 1.70 1.36 7.13 4.91 12.04
zx 9853* ABI Alfalfa, Inc. 2.47 1.70 1.72 1.33 7.22 4.71 11.93
Geneva Norvartis 2.33 1.75 1.71 1.36 7.15 4.78 11.93
FG5M84* Forage Genetics Int'l. 2.19 1.76 1.75 1.30 7.00 4.90 11.90
ZC 9941A* ABI Alfalfa, Inc. 2.46 1.53 1.69 1.40 7.08 4.77 11.85
4200 Seed Solutions 2.18 1.75 1.76 1.36 7.05 4.79 11.84
Samurai America's Alfalfas 2.36 1.60 1.72 1.24 6.92 4.74 11.66
Baralfa 42IG Barenbrug U.S.A. 2.45 1.61 1.64 1.24 6.94 4.70 11.64
FG3Rl39 Forage Genetics Int'l. 2.18 1.67 1.70 1.29 6.84 4.67 11.51
A30-06 ABI Alfalfa Inc. 2.15 1.45 1.52 1.22 6.34 4.70 11.04
Column Mean 2.41 1.74 1.75 1.36 7.26 4.95 12.21
LSD (0.05) 0.29 0.21 0.20 0.15 0.76 0.33 1.04
CV~%l 8.66 8.53 8.04 7.86 7.39 4.71 6.05
'Yields calculated on oven-dry basis. *Indicates experimental entry
Planted: September 1, 2000
4
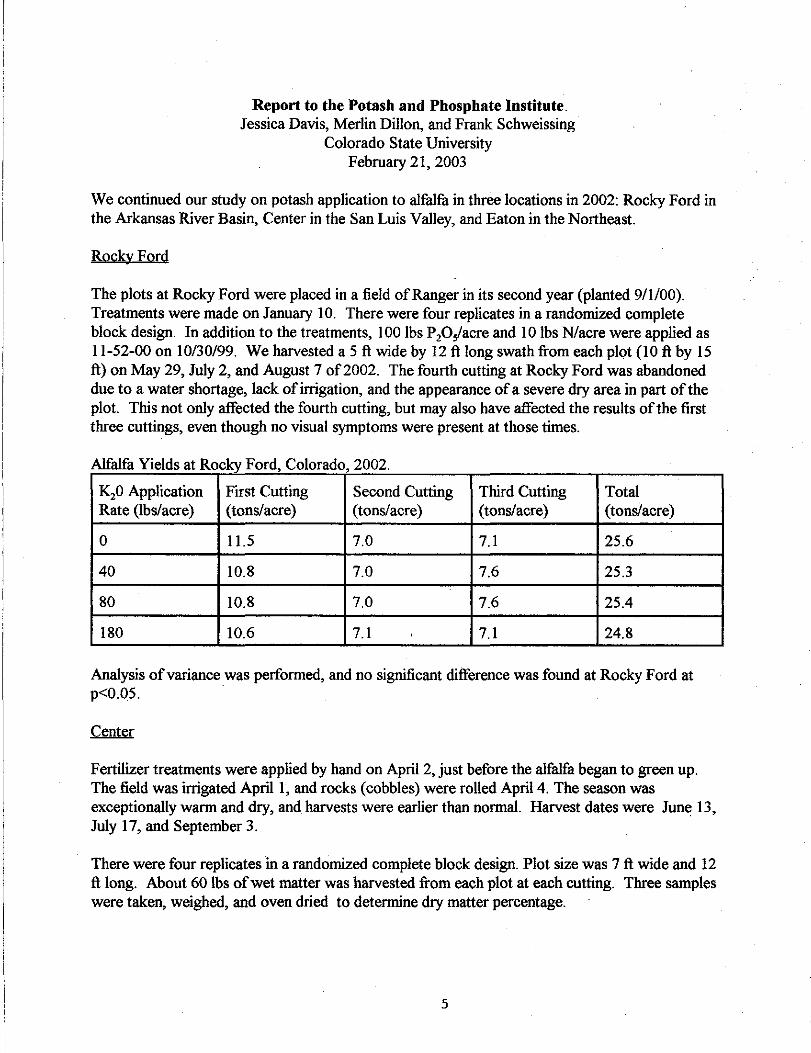
Report to the Potash and Phosphate Institute. Jessica Davis, Merlin Dillon, and Frank Schweissing
Colorado State University February 21, 2003
We continued our study on potash application to alfalfa in three locations in 2002: Rocky Ford in the Arkansas River Basin, Center in the San Luis Valley, and Eaton in the Northeast.
Rocky Ford
The plots at RockyFord were placed in a field of Ranger in its second year (planted 9/1/00). Treatments were made on January 10. There were four replicates in a randomized complete block design. In addition to the treatments, 100 lbs P20/acre and 10 lbs N/acre were applied as 11-52-00 on 10/30/99. We harvested a 5 ft wide by 12ft long swath from each plot {10ft by 15 ft) on May 29, July 2, and August 7 of2002. The fourth cutting at Rocky Ford was abandoned due to a water shortage, lack of inigation, and the appearance of a severe dry area in part of the plot. This not only affected the fourth cutting, but may also have affected the results of the first three cuttings, even though no visual symptoms were present at those times.
Alfalfa Yields at Rocky Ford Colorado 2002 , ,
K20 Application First Cutting Second Cutting Third Cutting Total Rate (lbs/acre) (tons/acre) (tons/acre) (tons/acre) (tons/acre)
0 11.5 7.0 7.1 25.6
40 10.8 7.0 7.6 25.3
80 10.8 7.0 7.6 25.4
180 10.6 7.1 7.1 24.8
Analysis of variance was performed, and no significant difference was found at Rocky Ford at p<0.05. .
Center
Fertilizer treatments were applied by hand on April2, just before the alfalfa began to green up. The field was inigated April!, and rocks (cobbles) were rolled April4. The season was exceptionally warm and dry, and harvests were earlier than normal. Harvest dates were June 13, July 17, and September 3.
There were four replicates in a randomized complete block design. Plot size was 7ft wide and 12 ft long. About 60 lbs of wet matter was harvested from each plot at each cutting. Three samples were taken, weighed, and oven dried to determine dry matter percentage.
5
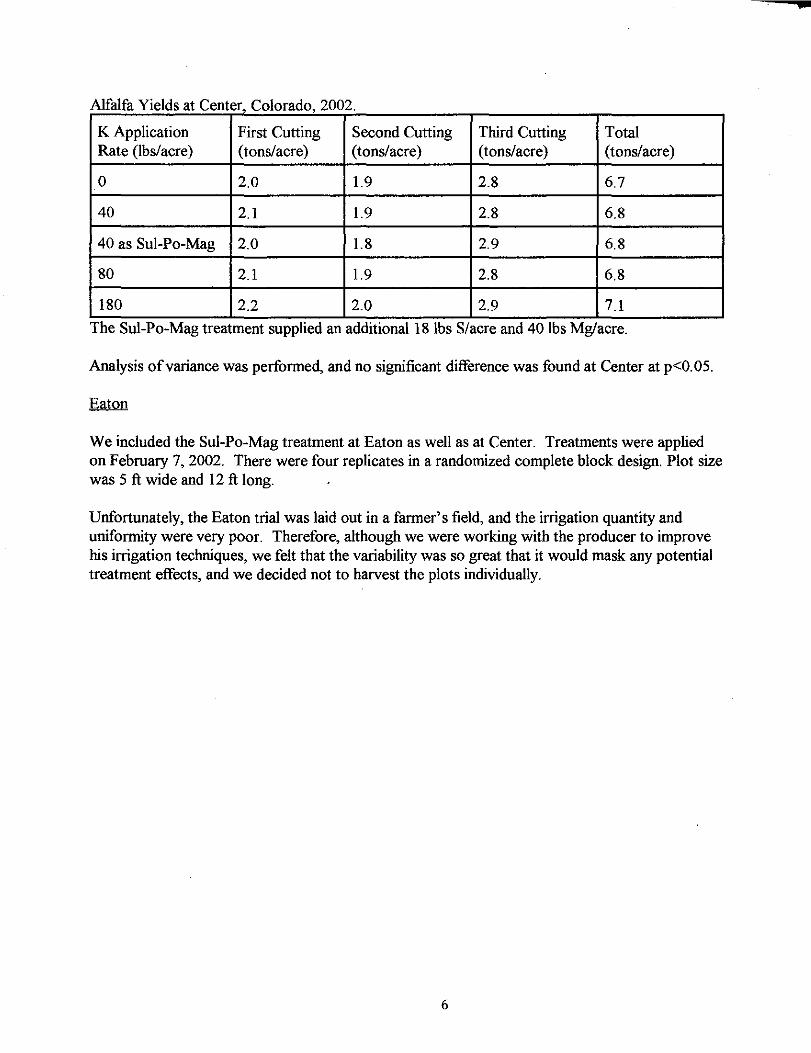
Alfalfa Yields at Center Colorado 2002 ,
K Application First Cutting Second Cutting Third Cutting Total Rate (lbsl acre) (tons/acre) (tons/acre) (tons/acre) (tons/ acre)
0 2.0 1.9 2.8 6.7
40 2.1 1.9 2.8 6.8
40 as Sul-Po-Mag 2.0 1.8 2.9 6.8
80 2.1 1.9 2.8 6.8
180 2.2 2.0 2.9 7.1 . .
The Sul-Po-Mag treatment supphed an additiOnal 18 lbs S/acre and 40 lbs Mg/acre .
Analysis of variance was performed, and no significant difference was found at Center at p<O.OS.
We included the Sul-Po-Mag treatment at Eaton as well as at Center. Treatments were applied on February 7, 2002. There were four replicates in a randomized complete block design. Plot size was 5 ft wide and 12 ft long.
Unfortunately, the Eaton trial was laid out in a farmer's field, and the irrigation quantity and uniformity were very poor. Therefore, although we were working with the producer to improve his irrigation techniques, we felt that the variability was so great that it would mask any potential treatment effects, and we decided not to harvest the plots individually.
6
..
2002 Pinto Bean Trials Arkansas Valley Research Center
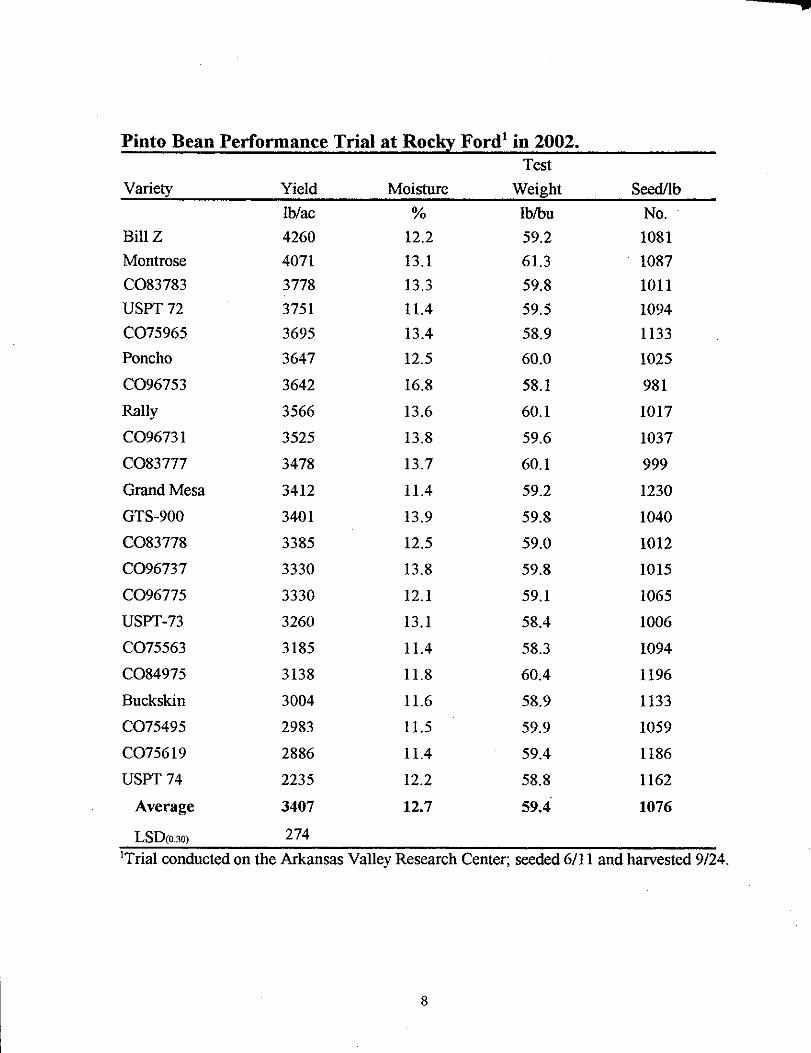
This is the tthirteenth year a variety trial has been carried out at this Center in recent times. The overall trial yield average was very good considering the short water supply and high daily temperatures of this season. This years trial average was 3407 lbs./acre compared to 3020 Ibs./acre in 2001, 3664lbs./acre in 2000, 2749lbs./acre in 1999, 2134lbs./acre in 1998, 2461lbs./acre in 1997, 3419lbs./acre in 1996, 1599lbs./acre in 1995, 3129lbs./acre in 1994, 3760 lbs./acre in 1993, 2541 lbs./acre in 1992, 236llbs./acre in 1991 and 2848lbs./acre in 1990.
Precipitation for the year was 3.52", which is the lowest recorded amount in the 114 year history of the Center. Irrigation water was not available at times in July and most of August.
Test Plot Information
Purpose - To evaluate the inherent genetic ability of selected pinto bean varieties to yield under · irrigated conditions of the Arkansas Valley. ·
Data - 1. Yields 2. TesfWeight 3. Seeds/ lb.
Plot- 32' X 10'(4 rows)
Design - Randomized complete blocks (3 replications)
Varieties - 20 entries
Fertilizer- 75lbs. P20 5 + 10 lbs. N/acre as 11-52-0 - 11/7/01 64 lbs N/ Acre as NH3 - chiseled in - 12/3/0 I
Herbicide- Eptam 3 lbs. + Treflan .751bs. AI/ Acre -incorporated 6117/02 Basagran .75lbs. AI/ Acre- 7/l/02
Insecticide - none Fungicide - none
Plant - June II, 2002
Irrigate- 6/12, 717, 7/24, 8/3, 8/31. The last 2 irrigations were very short -less than 8 hrs.
Harvest- Cut- 9/18; Lift-9/24; Thresh- 9/24-3 rows, 32' long Self propelled plot combine.
Jerry J. Johnson James P. Hain Frank C. Schweissing
7
•
Pinto Bean Performance Trial at Rocky Ford1 in 2002. Test
Variety Yield Moisture Weight Seed/lb
lb/ac % lb/bu No.
BillZ 4260 12.2 59.2 1081
Montrose 4071 13.1 61.3 1087
C083783 3778 13.3 59.8 1011
USPT72 3751 11.4 59.5 1094
C075965 3695 13.4 58.9 1133
Poncho 3647 12.5 60.0 1025
C096753 3642 16.8 58.1 981
Rally 3566 13.6 60.1 1017
C096731 3525 13.8 59.6 1037
C083777 3478 13.7 60.1 999
Grand Mesa 3412 11.4 59.2 1230
GTS-900 3401 13.9 59.8 1040
C083778 3385 12.5 59.0 1012
C096737 3330 13.8 59.8 1015
C096775 3330 12.1 59.1 1065
USPT-73 3260 13.1 58.4 1006
C075563 3185 11.4 58.3 1094
C084975 3138 11.8 60.4 1196
Buckskin 3004 11.6 58.9 1133
C075495 2983 11.5 59.9 1059
C075619 2886 11.4 59.4 1186
USPT74 2235 12.2 58.8 1162
Average 3407 12.7 59.4 1076
LSD<o3oJ 274 1Trial conducted on the Arkansas Valley Research Center; seeded 6/11 and harvested 9/24.
8

Pinto Bean Varietal Descriptions
Bill Z A medium maturity (95 d) variety release by Colorado State University in 1985. It has a vine growth habit with resistance to bean common mosaic virus and moderate tolerance to bacterial brown spot. It is a productive variety, however it is susceptible to white mold and rust.
Buckskin A variety from released by Syngenta Seeds, Inc. (RNKIOI). It is a vine Type III growth habit with resistance to bean common mosaic virus, susceptible to white mold and rust, with medium maturity (95 d).
CO Experimental lines from Colorado State University.
Grand Mesa A medium maturity (94 d) from Colorado State University (CO 75511) released in 2001, with resistance to rust, bean common mosaic virus and semi-upright architecture. It has field tolerance to white mold.
GTS-900 A full season (99 to 102 d) variety from Gentec Seed Co. with resistance to rust and upright architecture. It has some field tolerance to white mold.
Montrose A medium maturity (95 d) released from Colorado State University in 1999 (CO 51715) with resistance to rust, bean common mosaic and has high yield potential and excellent seed quality. It has prostrate vine type growth habit and is highly susceptible to white mold.
Poncho A medium maturity (96 d) from Rogers/Syngenta Seed, Inc. with resistance to bean common mosaic and has high yield poteotial and excellent seed quality. It has semi upright type growth habit and is susceptible rust.
Rally A full season (98 to 1 02) variety from Gentec Seed Co. with resistance to rust and upright architecture. It has some field tolerance to white mold.
USPT-72 An experimental line from USDA-ARS, Prosser, WA, with resistance to rust, bean common mosaic and has high yield potential.
USPT-73 An experimental line from USDA-ARS, Prosser, W A., with resistance to rust, bean common mosaic and has high yield poteotial.
USPT-74 An experimental line from USDA-ARS, Prosser, WA, with resistance to rust, bean common mosaic and has high yield potential.
9
2002 Corn Grain and Silage Variety Trial Arkansas Valley Research Center
The average grain yield in this trial was 184 bushels per acre compared to 2001-206 bu., 2000-233 bu., 1999-206bu., 1998-200bu., 1997-206bu., 1996-219bu., 1995-197bu., 1994-230bu., 1993-178 bu., 1991-209 bu. and 1990-183 bu. The average silage yield was 31 tons per acre compared to 2001-34T., 2000-39T., 1999-33T., 1998-40T., 1997-32T., 1996-36T., 1995-35T., 1994-33T., 1993-27T., 1992-41 T., 1991-37T., and 1990-31 T. The average silking date for the grain trial was 4 days earlier and for the forage trial 6 days earlier than in 2001. Grain yields were adjusted to 15.5% moisture and 56 pound bushels while silage yields were adjusted to 70% moisture. This allows direct comparison between varieties, but actual harvest moistures and silking dates indicate maturity and should be considered when choosing a variety. This was a water short year.
Test Plot Informati{)n
Purpose- To evaluate the inherent genetic ability of selected com varieties to yield grain and silage under irrigated conditions in the Arkansas Valley.
Data - 1. Grain yields 2. Forage yields 3. Growth factors
Plots- Grain- 32' X 10' (4rows) Harvest 2 rows Silage- 32' X 5' (2 rows)
Design - Randomized complete blocks (3 replications)
Varieties- Grain-25 entries Silage-21 entries
Fertilizer- 50 lbs. P20 5 + lllbs. N/Acre- 11/7/01 175 lbs. N as urea- 12/5/01
Herbicide - Bladex 90 DF 1. 0 lbs. All Acre - 4/15/02 Dual Magnum 1.14 lbs. All Acre - 4/23/02
IS0-8 entries
2,4D .25 lbs. + Clarity .25 lbs. All Acre - 6/17/02
Insecticide - Capture . 08 lbs. All Acre - 7/26/02
Soil- Silty, clay loam, 1-1.5% o.m., pH ca. 7.8
Plant - April 25, 2002
Irrigate- 4/26, 5/20, 6/21, 7/2, 7117, 7/24, 8/3, 8/31 -The last 3 irrigations were shorter than 8 hrs.
Harvest - Silage - September 13, 2002 - Forage harvester Grain- October 10, 2002 - Self-propelled two row plot combine
10
Jerry J. Johnson James P. Hain Frank C. Schweissing
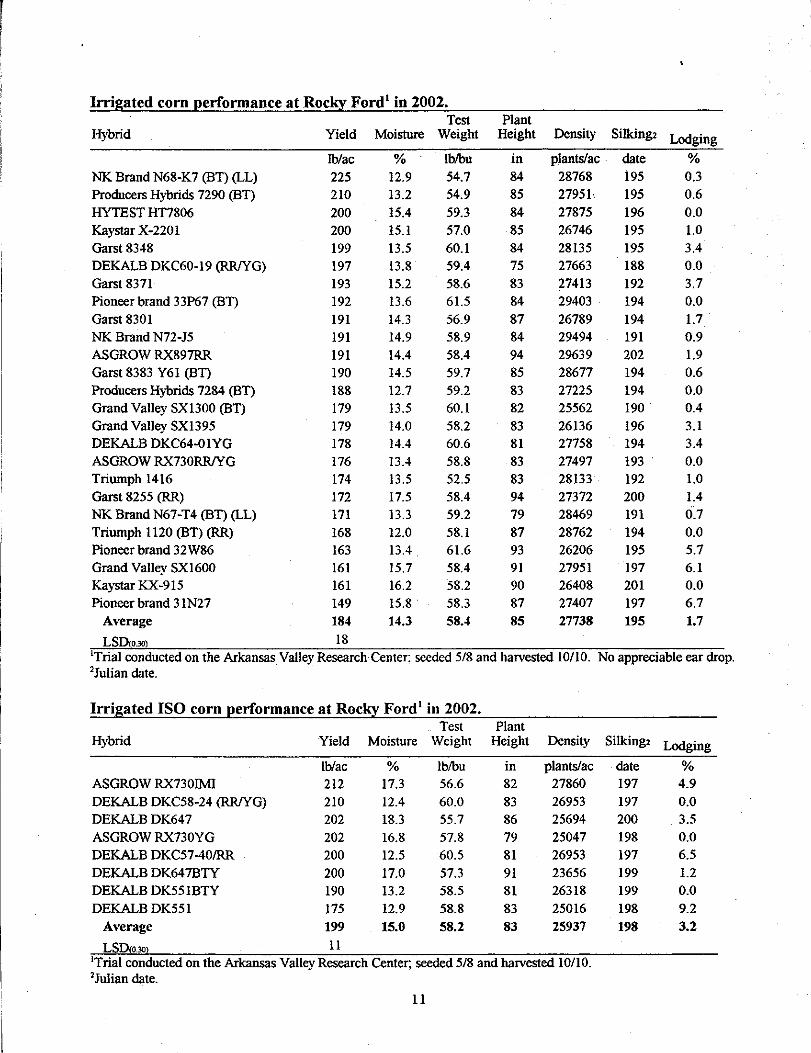
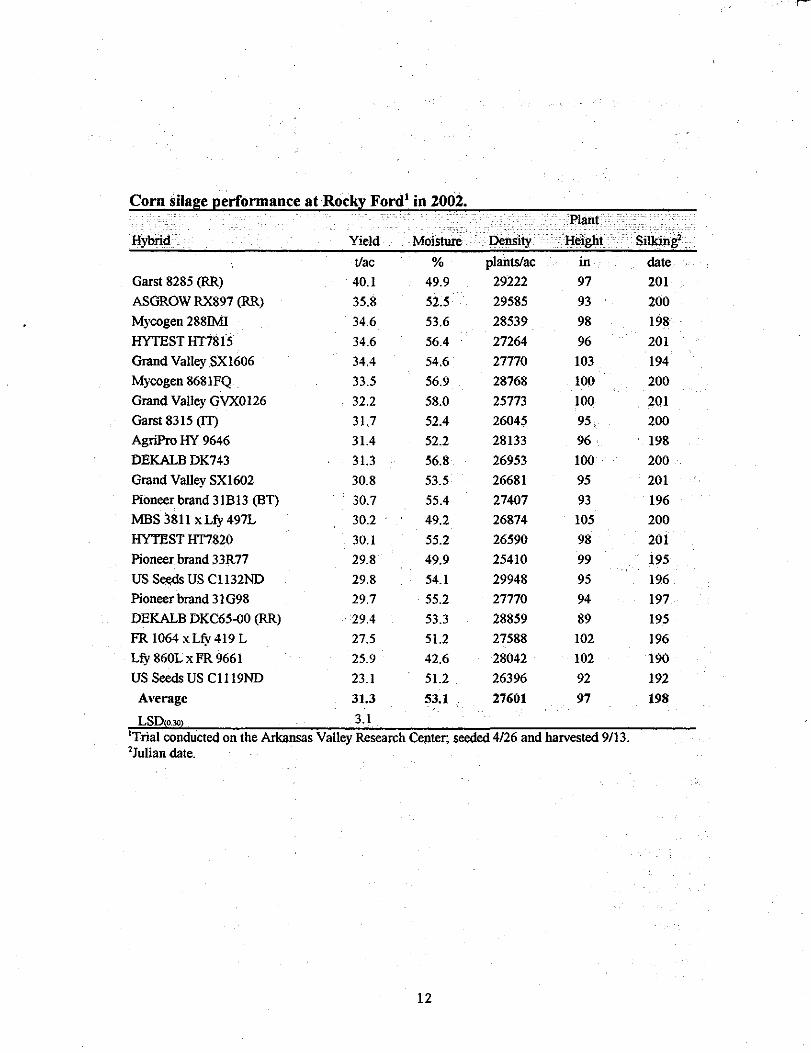
Corn silage performance at Rocky Ford1 in 2002.
Hybrid Yield Moisture Si!kingl •· t/ac % plants/ac in date
Garst 8285 (RR) 40.1 49.9 29222 97 201
ASGROW RX897 (RR) 35.8 52.5 29585 93 200
Mycogen 2881Ml 34.6 53.6 28539 98 198
HYTESTHT781S 34.6 56.4 27264 96 201
Grand Valley SX1606 34.4 54.6 27770 103 194
Mycogen 8681FQ 33.5 56.9 28768 100 200
Grand Valley GVX0126 32.2 58.0 25773 100 201
Garst 8315 (IT) 31.7 52.4 26045 95 200
AgriPro HY 9646 31.4 52.2 28133 96 198
DEKALB DK743 31.3 56.8 26953 100 200 .
Grand Valley SX1602 30.8 53.5 26681 95 201
Pioneer brand 31B 13 (BT) 30.7 55.4 27407 93 196
MBS 3811 xLfy 497L 30.2 49.2 26874 105 200
HYTJ'lST Hr7820 30.1 55.2 26590 98 201
Pioneer brand 33R77 29.8 49.9 25410 99 195
US Seeds US Cll32ND 29.8 54.1 29948 95 196
Pioneer brand 31 G98 29.7 . 55.2 27770 94 197
DEKALB DKC65-00 (RR) 29.4 53.3 28859 89 195
FR 1064 xLfy419 L 27.5 51.2 27588 102 196
Lfy 860L X FR 9661 25.9 42.6 28042 102 190
US Seeds US Cll19ND 23.1 51.2 26396 92 192
A\•erage 31.3 53.1 ' 27601 97 198
LSDo.,. 3.1
'Trial conducted on the Arkansas Valley Research Center; seeded 4/26 and harvested 9/13. 'Julian date.
12
l
Nitrogen Fertilization oflrrigated Corn Following Alfalfa and Watermelon at AVRC
Ardell Halvorson1, Frank Schweissing2
, and Curtis Reule1
1USDA-ARS, Fort Collins, CO and 2 A VRC, Rocky Ford, CO email: [email protected]; phone: (970) 490-8230
The U.S. Department of Agriculture. Agricultural Research Service, Northern Plains Area is an equal opportunity/affinnative action employer and all agency services are available without discrimination.
SUMMARY
This study evaluated the effects ofN fertilizer rate and N source (urea and Polyon®3) on com yields for 3 years following 5 years of alfalfa and one year of watermelon production. Com grain yields were not increased by N fertilization in 2000, but were increased by increasing residual soil N levels in 2001, and by N fertilization in 2002. Nitrogen source did not significantly effect com yields in 2000 and 2001, but Po lyon® had slightly higher yields than urea in 2002. When averaged over 3 years, com grain yields were near maximum with the application of75 lb N/a per year. Silage yields generally increased with increasing N rate each of the years. Soil residual NOrN levels were increased with increasing N fertilizer rate in 2000. Residual soil N levels declined following the 2001 com crop. In :2002, irrigation water was limited and became unavailable due to drought conditions the first week of August. Therefore, the 2002 com crop suffered from drought stress and reduced yields. Thus total N uptake was lower than in the previous two com crops. The 3 year average N fertilizer use efficiency was 64% at the lowest fertilizer N rate and less than 40% at the higher N rates. Thus, N fertilizer application to com in Arkansas River Valley produced in rotation with vegetable crops and alfalfa may need to be reduced to prevent NOrN contamination of groundwater in this area. Based on this study, it appears that a minimal amount (50 to 75 lb N/a) of N fertilizer may be needed to maintain high grain and silage com yields in the Valley in rotation with vegetable crops and alfalfa. Fertilizer N appears to be moving out of the root zone with downward movement of irrigation water. Residual soil N03-N levels declined with each additional com crop in the check (noN added) treatment.
PROBLEM
High nitrate-N (NOrN) levels have been reported in groundwater in the Arkansas River Valley in Colorado, which is a major producer of melons, onions, and other vegetable crops grown in rotation with alfalfa, com, sorghum, winter wheat, and soybeans. Relatively high rates of N fertilizer are used to optimize crop yields and quality, generally without regard to soil testing. Vegetable crops generally have shallow rooting depths and require frequent irrigation to maintain
®Registered Trade Mark of Pursell Technologies Inc., Sylacauga, AL.
3Trade names and company names are included for the benefit of the reader and do not imply any endorsement or preferential treatment of the product by the authors or the USDA, Agricultural Research Service.
13
market quality. High residual soil N03-N levels, high N fertilization rates to shallow-rooted crops, shallow water tables, and excess water application to control soil salinity all contribute to a high N03-
N leaching potential. Application of slow-release fertilizers to crops in the Arkansas Valley could potentially
increase nitrogen use efficiency (NUE) and reduce nitrate-N leaching potential. Nitrogen management research is needed to develop improved NUE and N management practices for furrow irrigated crops in this area. Improved N management practices for crops in the Arkansas River Valley should optimize crop yields while minimizing N fertilizer impacts on ground water quality.
Objectives of this research were to determine N fertilizer needs for optimizing furrowirrigated com yields in a high residual soil N environment in Arkansas River Valley, evaluate the effects of a slow-release N fertilizer on N fertilizer use efficiency by com, and evaluate the influence ofN management on residual soil NOrN and potential for groundwater contamination.
AN fertilizer rate and source study was initiated under conventional till, furrow irrigated com on a calcareous Rocky Ford silty clay loam soil at the Arkansas Valley Research Center (A VRC) in 2000. The plot area had previously been in alfalfa for 5 years, before being plowed up on 20 October 98. Two applications of 150 lb PP/a as 11-52-0 added 64lb N/a during the five years of alfalfa production. Watermelon was produced on the plot area in 1999 with 21 lb N/a added with the phosphate fertilizer. Six broadcast N rates were established (0, 50, 100, 150,200, and 250 lb N/a) in 2000, however, theN rates were reduced (0, 25, 50, 75, 100, and 125 lb N/a) in 2002 because of a large amount of residual soil N following the 2000 N application. NoN fertilizer was applied in 2001. Two N sources, urea and Po lyon® (a slow-release urea fertilizer), were applied at each N rate. The N fertilizer was broadcast and incorporated with a harrow before com planting. In the fall of 2000, 2001, and 2002, 11 lb N/a was applied with the phosphate fertilizer just prior to plowing.
Com (Pioneer 33A14 hybrid) was planted on April27, 2000 at a seeding rate of about 28,400 seeds per acre. The 2001 com (DeKalb 642RR hybrid) crop was planted on April24 at a seeding rate of about 40,000 seeds per acre. The 2002 com (Garst 8559 Bt/RR) was planted on April 23rd at a seeding rate of about 39,000 seeds/acre.
Soil NOrN levels in the 0-6 ft profile have been monitored since the spring of 1999. TheN fertilizer rates were not reapplied in 2001 because of high levels of residual soil N03-N following fertilization of the 2000 com crop.
In 2002, the plot area was irrigated 10 times with approximately 26 inches of total water applied. The last irrigation occurred on August 2nd, shortly after pollination was completed. Due to limited availability of irrigation water, normal full length irrigations were not possible in 2002. The N level in the irrigation water was monitored by A VRC throughout each growing season. The irrigation water contained an average of2.5 ppm N03-N in 2000,2.8 ppm N03-N in 2001, and 2.4 ppm N03-N in 2002. The N contribution from the irrigation water to the plot area would have amounted to about 6 lb N/a in 1999 while irrigating the watermelon, about 15 lb N/a in 2000, about 141b N/a in 2001, and about 14lbN/a in 2002 while irrigating the com crops. Assuming a 50% irrigation efficiency, about 7 to 8 lbs of N may have entered the soil each year. Growing season precipitation was 2.1 inches from April through September.
14
-
RESULTS
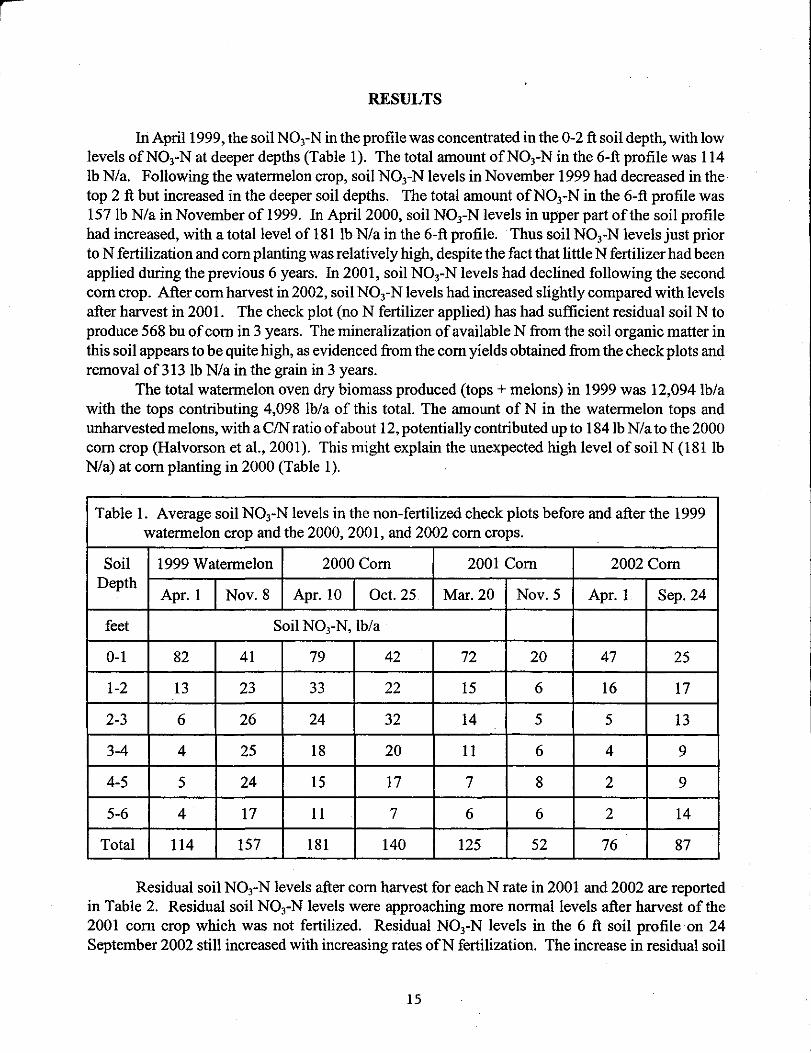
In Aprill999, the soil NOrN in the profile was concentrated in the 0-2 ft soil depth, with low levels ofN03-N at deeper depths (Table 1). The total amonnt ofNOrN in the 6-ft profile was 114 lb N/a. Following the watermelon crop, soil NOrN levels in November 1999 had decreased in the top 2ft but increased in the deeper soil depths. The total amonnt ofNOrN in the 6-ft profile was 157 lb N/a in November of 1999. In April 2000, soil NOrN levels in upper part of the soil profile had increased, with a total level of 181 lb N/a in the 6-ft profile. Thus soil NOrN levels just prior toN fertilization and corn planting was relatively high, despite the fact that little N fertilizer had been applied during the previous 6 years. In 2001, soil NOrN levels had declined following the second corn crop. After corn harvest in 2002, soil NOr N levels had increased slightly compared with levels after harvest in 2001. The check plot (noN fertilizer applied) has had sufficient residual soil N to produce 568 bu of corn in 3 years. The mineralization of available N from the soil organic matter in this soil appears to be quite high, as evidenced from the corn yields obtained from the check plots and removal of 313 lb N/a in the grain in 3 years.
The total watermelon oven dry biomass produced (tops+ melons) in 1999 was 12,094 lb/a with the tops contributing 4,098 lb/a of this total. The amonnt of N in the watermelon tops and unharvested melons, with a C/N ratio of about 12, potentially contributed up to 184lb N/a to the 2000 corn crop (Halvorson eta!., 2001). This might explain the unexpected high level of soil N (181 lb N/a) at corn planting in 2000 (Table 1 ).
Table 1. Average soil N03-N levels in the non-fertilized check plots before and after the 1999 watermelon crop and the 2000,2001, and 2002 corn crops.
Soil 1999 Watermelon 2000 Corn 2001 Corn 2002 Corn Depth
Apr. 1 Nov. 8 Apr. 10 Oct. 25 Mar. 20 Nov. 5 Apr.l Sep. 24
feet Soil NOrN, lb/a
0-1 82 41 79 42 72 20 47 25
1-2 13 23 33 22 15 6 16 17
2-3 6 26 24 32 14 5 5 13
3-4 4 25 18 20 11 6 4 9
4-5 5 24 15 17 7 8 2 9
5-6 4 17 11 7 6 6 2 14
Total 114 157 181 140 125 52 76 87
Residual soil N03-N levels after corn harvest for each N rate in 2001 and 2002 are reported in Table 2. Residual soil N03-N levels were approaching more normal levels after harvest of the 2001 corn crop which was not fertilized. Residual NOrN levels in the 6 ft soil profile on 24 September 2002 still increased with increasing rates ofN fertilization. The increase in residual soil
15
- 200 -3 .D 190 -"C a; 180
> 170 c '!! 160
~ 150
8 140
0
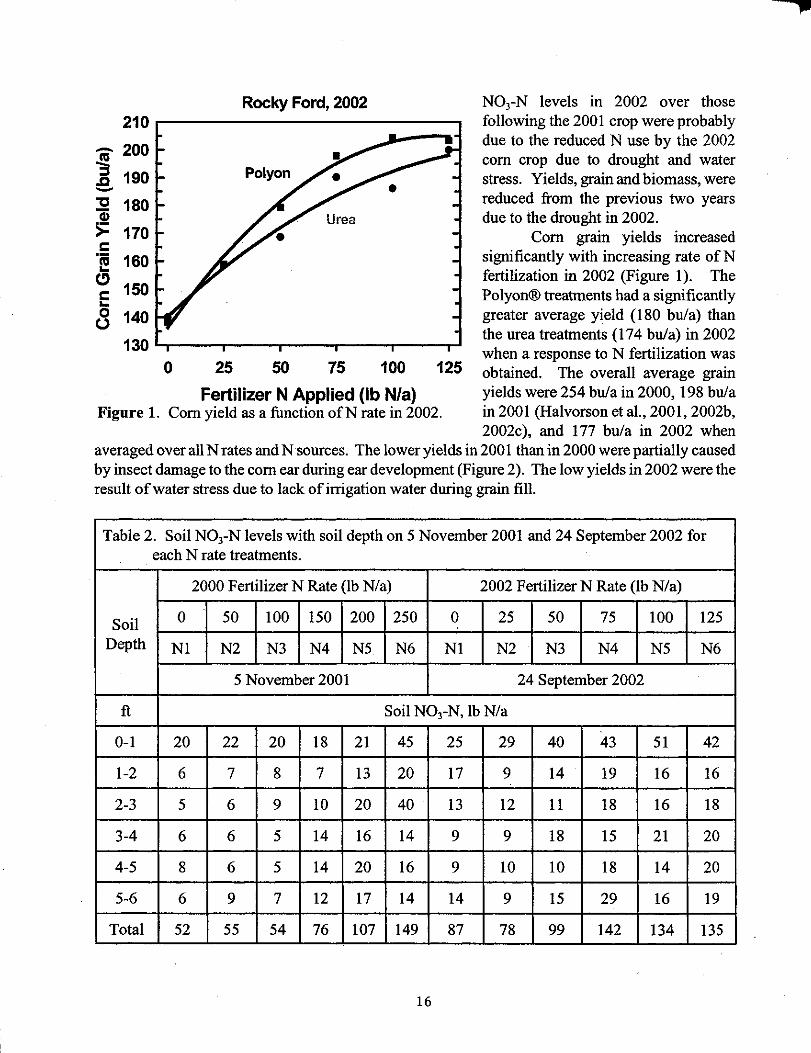
Rocky Ford, 2002
25 50 75 100
NO,-N levels in 2002 over those following the 2001 crop were probably due to the reduced N use by the 2002 com crop due to drought and water stress. Yields, grain and biomass, were reduced from the previous two years due to the drought in 2002.
Com grain yields increased significantly with increasing rate of N fertilization in 2002 (Figure 1 ). The Po lyon® treatments had a significantly greater average yield (180 bu/a) than the urea treatments ( 1 7 4 bu/ a) in 2002 when a response to N fertilization was
125 obtained. The overall average grain yields were 254 bu/a in 2000, 198 bu/a in 2001 (Halvorson eta!., 2001, 2002b, 2002c), and 177 bu/a in 2002 when
Fertilizer N Applied (lb N/a) Figure 1. Com yield as a function ofN rate in 2002.
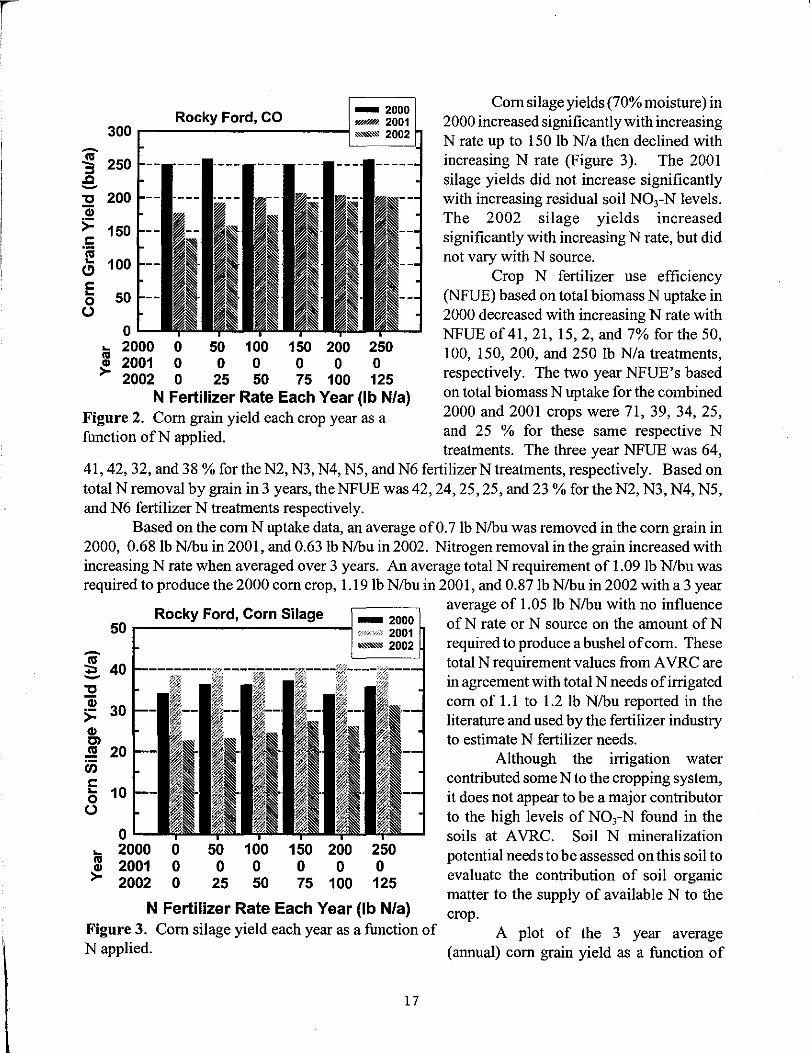
averaged over all N rates and N sources. The lower yields in 200 I than in 2000 were partially caused by insect damage to the com ear during ear development (Figure 2). The low yields in 2002 were the result of water stress due to lack of irrigation water during grain fill.
Table 2. Soil NO,-N levels with soil depth on 5 November 2001 and 24 September 2002 for each N rate treatments.
2000 Fertilizer N Rate (lb N/a) 2002 Fertilizer N Rate (lb N/a)
Soil 0 50 100 !50 200 250 0 25 50 75 100 125
Depth Nl N2 N3 N4 N5 N6 Nl N2 N3 N4 N5 N6
5 November 2001 24 September 2002
ft Soil N03-N, lb N/a
0-1 20 22 20 18 21 45 25 29 40 43 51 42
1-2 6 7 8 7 13 20 17 9 14 19 16 16
2-3 5 6 9 10 20 40 13 12 11 18 16 18
3-4 6 6 5 14 16 14 9 9 18 15 21 20
4-5 8 6 5 14 20 16 9 10 10 18 14 20
5-6 6 9 7 12 17 14 14 9 15 29 16 19
Total 52 55 54 76 107 149 87 78 99 142 134 135
16
,.
r
- 2000 Rocky Ford, CO "'"'"" 2001 300 .------------\ ~""""" 2002
~ 250 .c ~
, 200 (ij
>= 150 r:: ·e (!) 100
E 0 ()
50
0 ... 2000 0 50 100 150 200 250 ~ 2001 0 0 0 0 0 0
2002 0 25 50 75 100 125 N Fertilizer Rate Each Year (lb N/a)
Figure 2. Com grain yield each crop year as a function ofN applied.
Com silage yields (70% moisture) in 2000 increased significantly with increasing N rate up to 150 lb N/a then declined with increasing N rate (Figure 3 ). The 200 I silage yields did not increase significantly with increasing residual soil NOrN levels. The 2002 silage yields increased significantly with increasing N rate, but did not vary with N source.
Crop N fertilizer use efficiency (NFUE) based on total biomass N uptake in 2000 decreased with increasing N rate with NFUE of 41, 21, 15, 2, and 7% for the 50, 100, 150, 200, and 250 lb N/a treatments, respectively. The two year NFUE's based on total biomass N uptake for the combined 2000 and 2001 crops were 71, 39, 34, 25, and 25 % for these same respective N treatments. The three year NFUE was 64,
41, 42, 32, and 38% for the N2, N3, N4, N5, and N6 fertilizerN treatments, respectively. Based on total N removal by grain in 3 years, the NFUE was 42, 24, 25, 25, and 23% for the N2, N3, N4, N5, and N6 fertilizer N treatments respectively.
Based on the com N uptake data, an average of0.71b N/bu was removed in the com grain in 2000, 0.681b N/bu in 2001, and 0.631b N/bu in 2002. Nitrogen removal in the grain increased with increasing N rate when averaged over 3 years. An average total N requirement of 1.09 lb N/bu was required to produce the 2000 com crop, 1.19lb N/bu in 2001, and 0.87lb N/bu in 2002 with a3 year
Rocky Ford, Corn Silage 50 r---------......;--1 = ~gg~
to&.~ 2002 -tel 40 <:.
~ , (ij >= 30 Ill Cl .!!! 20 ii) r:: ... 10 0 ()
0 ... 2000 0 50 100 150 200 250
"' 2001 0 0 0 0 0 0 ~ 2002 0 25 50 75 100 125
N Fertilizer Rate Each Year (lb N/a) Figure 3. Com silage yield each year as a function of N applied.
17
average of 1.05 lb N/bu with no influence of N rate or N source on the amount of N required to produce a bushel of com. These total N requirement values from A VRC are in agreement with total N needs of irrigated com of 1.1 to 1.2 lb N/bu reported in the literature and used by the fertilizer industry to estimate N fertilizer needs.
Although the irrigation water contributed some N to the cropping system, it does not appear to be a major contributor to the high levels of N03-N found in the soils at A VRC. Soil N mineralization potential needs to be assessed on this soil to evaluate the contribution of soil organic matter to the supply of available N to the crop.
A plot of the 3 year average (annual) com grain yield as a function of
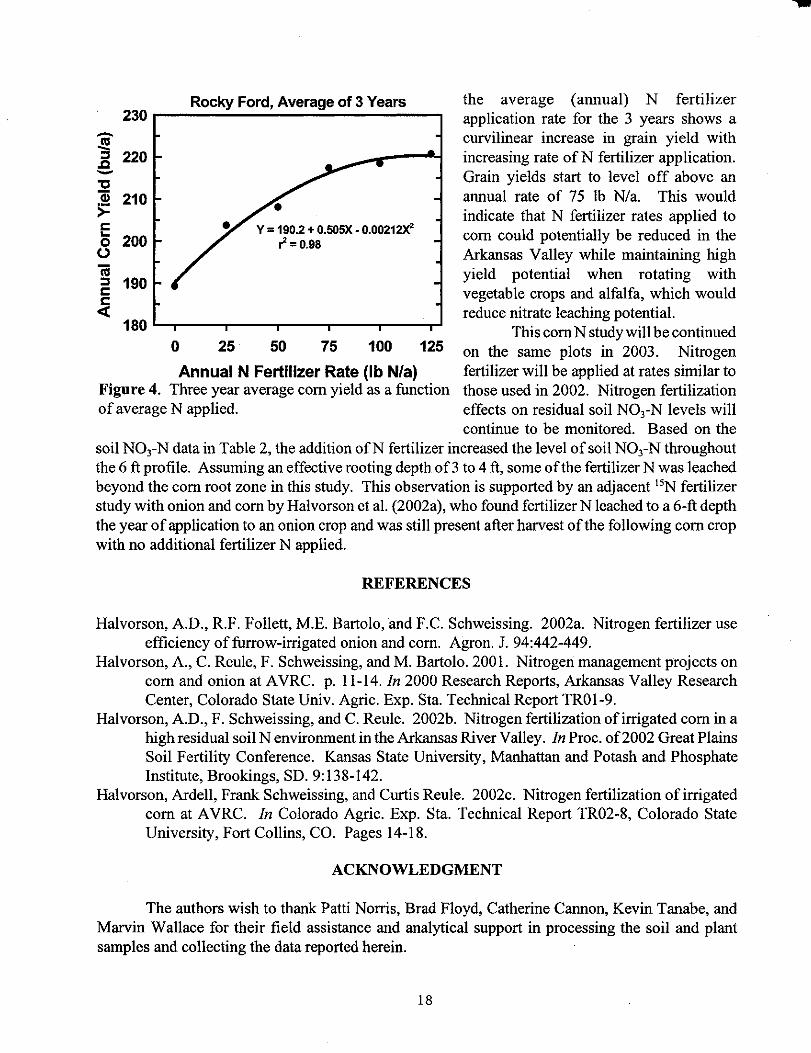
Rocky Ford, Average of 3 Years 230r------------------------.
210
E 8 200 Y = 190.2 + 0.505X- 0.00212X'
r' = 0.98
iii :I 190 c:: ~ 180~~--~--~--~--~----r
the average (annual) N fertilizer application rate for the 3 years shows a curvilinear increase in grain yield with increasing rate of N fertilizer application. Grain yields start to level off above an annual rate of 75 lb N/a. This would indicate that N fertilizer rates applied to corn could potentially be reduced in the Arkansas Valley while maintaining high yield potential when rotating with vegetable crops and alfalfa, which would reduce nitrate leaching potential.
This corn N study will be continued 0 25 50 75 100 125 on the same plots in 2003. Nitrogen
fertilizer will be applied at rates similar to those used in 2002. Nitrogen fertilization effects on residual soil NOrN levels will
Annual N Fertilizer Rate (lb N/a) Figure 4. Three year average corn yield as a function of average N applied.
continue to be monitored. Based on the soil NOrN data in Table 2, the addition ofN fertilizer increased the level of soil NOrN throughout the 6 ft profile. Assuming an effective rooting depth of 3 to 4 ft, some of the fertilizer N was leached beyond the corn root zone in this study. This observation is supported by an adjacent 15N fertilizer study with onion and corn by Halvorson eta!. (2002a), who found fertilizer N leached to a 6-ft depth the year of application to an onion crop and was still present after harvest of the following corn crop with no additional fertilizer N applied.
REFERENCES
Halvorson, A.D., R.F. Follett, M.E. Bartolo, and F.C. Schweissing. 2002a. Nitrogen fertilizer use efficiency of furrow-irrigated onion and corn. Agron. J. 94:442-449.
Halvorson, A., C. Reule, F. Schweissing, and M. Bartolo. 2001. Nitrogen management projects on corn and onion at AVRC. p. 11-14. In 2000 Research Reports, Arkansas Valley Research Center, Colorado State Univ. Agric. Exp. Sta. Technical Report TROl-9.
Halvorson, A.D., F. Schweissing, and C. Reule. 2002b. Nitrogen fertilization of irrigated corn in a high residual soil N environment in the Arkansas River Valley. In Proc. of2002 Great Plains Soil Fertility Conference. Kansas State University, Manhattan and Potash and Phosphate Institute, Brookings, SD. 9:138-142.
Halvorson, Ardell, Frank Schweissing, and Curtis Reule. 2002c. Nitrogen fertilization of irrigated corn at A VRC. In Colorado Agric. Exp. Sta. Technical Report TR02-8, Colorado State University, Fort Collins, CO. Pages 14-18.
ACKNOWLEDGMENT
The authors wish to thank Patti Norris, Brad Floyd, Catherine Cannon, Kevin Tanabe, and Marvin Wallace for their field assistance and analytical support in processing the soil and plant samples and collecting the data reported herein.
18

Evaluation of Corn Borer Resistant (Bt) Hybrids to the Southwestern Corn Borer - 2002
Arkansas Valley Research Center
Twenty one com hybrids, including 19 Bt and 2 non-Bt hybrids, were evaluated for resistance to the southwestern com borer (SWCB), Diatraea grandiosella Dyar. ·The yield of one non-Bt variety was the lowest in the trial, however the yield of the other non-Bt variety, 2725, was not significantly different from the top yielding Bt variety (Table 1). Infestations of the SWCB were very low and yields were influenced more by agronomic characteristics than insect resistance. The com earworm (CEW), Helicoverpa zia Boddie was not a factor in this test.
The infestation (SWCB) rate for the non-Bt variety Mycogen 2725 was 4%, below the 2001 rate of 23%, the 2000 rate of 77% and the 1999 rate of 8% as measured by broken/lodged plants. The low infestation rate in 2002 could be due to a combination of factors caused by the drouth resulting in substantially reduced com acreage and the increasing percentage of acreage planted to Bt com varieties. The overwintering (2001-2002) survival rate ofSWCB larvae in the non-Bt varieties was 44% of the infested stalks which comprised 60% of the total number of stalks checked. Twenty six percent of the total number of stalks checked had live SWCB larvae in the spring of2002.
Test Plot Information
Date - I. Yields - grain 2. Broken/lodged stalks
Plot- 32' X 10' (4 rows) Harvest - 2 rows
Design - Randomized complete blocks ( 4 replications)
Varieties - 21 entries
Fertilizer- 75 lbs. P20 5 + 16lbs. N/Acre as 11-52-00- 11/7/01 217lbs. N/A as NH3 - 12/3/01
Herbicide- Bladex 4L lib. AI/ Acre- 4/19/02 Dual Magnum 1.14lbs. + Gramoxone .3llbs. AI/ Acre- 5/7/02 Clarity .25 lbs. + 2,4D .25 lbs. AI/ Acre- 6/19/02
Acaricide - Co mite 1.69 lbs. AI/ Acre - 7/8/02
Soil- Silty, clay loam, 1-1.5% o.m., pH ca. 7.8
Plant - May 8, 2002
Irrigate- 5/8, 5/29, 6/28, 7/15, 8/1 -last irrigation less than 8 hours.
Harvest - October I 0, 2002 - self-propelled two row plot combine
Frank C. Schweissing 19
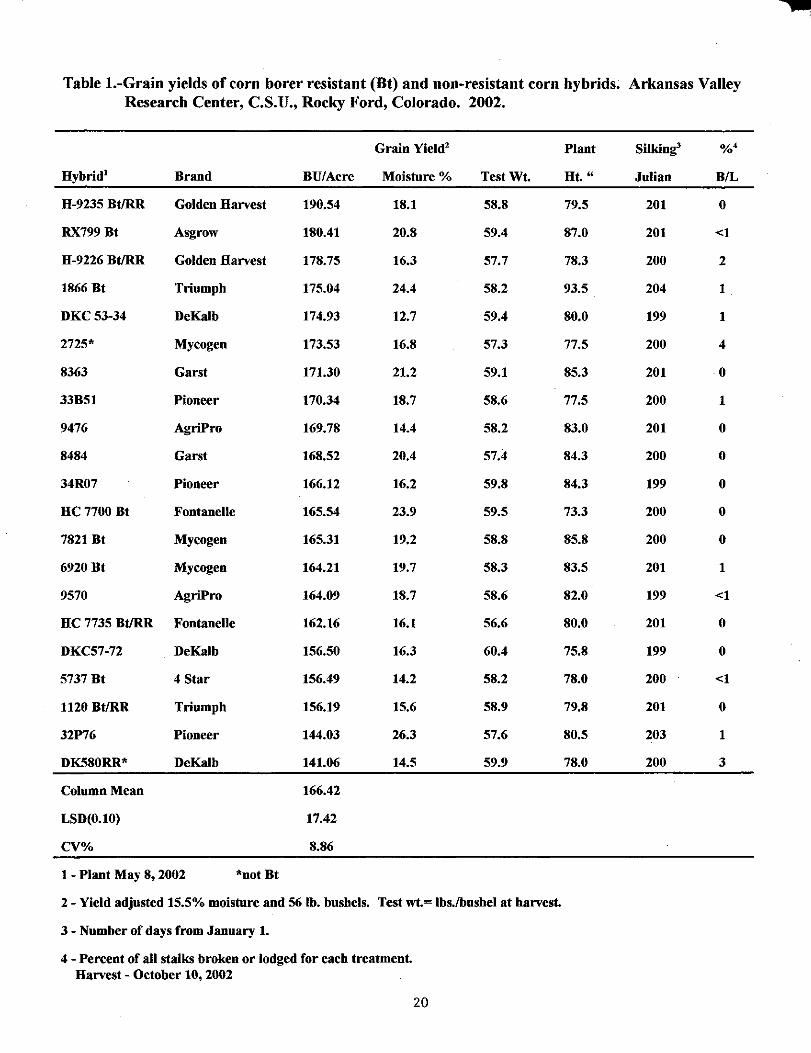
Table I.-Grain yields of corn borer resistant (Bt) and non-resistant corn hybrids. Arkansas Valley Research Center, C.S.U., Rocky Ford, Colorado. 2002.
Grain Yield' Plant Silking' %"
Hybrid' Brand BU/Acre Moisture% TestWt. Ht." Julian BIL
H-9235 Bt/RR Golden Harvest 190.54 18.1 58.8 79.5 201 0
RX799Bt Asgrow 180.41 20.8 59.4 87.0 201 <1
H-9226 Bt/RR Golden Harvest 178.75 16.3 57.7 78.3 200 2
1866 Bt Triumph 175.04 24.4 58.2 93.5 204 1
DKC53-34 DeKalb 174.93 12.7 59.4 80.0 199 1
2725* Mycogen 173.53 16.8 57.3 77.5 200 4
8363 Garst 171.30 21.2 59.1 85.3 201 0
33B51 Pioneer 170.34 18.7 58.6 77.5 200 1
9476 AgriPro 169.78 14.4 58.2 83.0 201 0
8484 Garst 168.52 20.4 57.4 84.3 200 0
34R07 Pioneer 166.12 16.2 59.8 84.3 199 0
HC7700 Bt Fontanelle 165.54 23.9 59.5 73.3 200 0
7821 Bt My cog en 165.31 19.2 58.8 85.8 200 0
6920 Bt Mycogen 164.21 19.7 58.3 83.5 201 1
9570 AgriPro 164.09 18.7 58.6 82.0 199 <1
HC 7735 Bt!RR Fontanelle 162.16 16.1 56.6 80.0 201 0
DKC57-72 DeKalb 156.50 16.3 60.4 75.8 199 0
5737 Bt 4 Star 156.49 14.2 58.2 78.0 200 <1
1120 Bt!RR Triumph 156.19 15.6 58.9 79.8 201 0
32P76 Pioneer 144.03 26.3 57.6 80.5 203 1
DK580RR* DeKalb 141.06 14.5 59.9 78.0 200 3
Column Mean 166.42
LSD(0.10) 17.42
CV% 8.86
1 - Plant May 8, 2002 *not Bt
2 - Yield adjusted 15.5% moisture and 56 lb. bushels. Test wt.= lhs.lbushel at harvest.
3 - Number of days from January 1.
4 -Percent of all stalks broken or lodged for each treatment. Harvest - October 10, 2002
20
Chemical Control of the Southwestern Corn Borer - 2002 Arkansas VaHey Research Center
Rocky Ford, Colorado Frank C. Schweissing
This was a hot dry production year with substantially above average growing degree days (3165), well below average annual rainfall (3.52") and a lack of irrigation water particularly in August. However, we were able to maintain good production in the trial by reserving as much water as possible for the plots combined with a low southwestern corn borer (SWCB) infestation level.
The infestation level ofthis pest was the lowest since this trial was initiated two years ago, possibly due to reduced corn production in the area and drouth. Insecticide control of the SWCB can be an important alternative to Bt varieties in the management of this pest.
Methods and Materials - Supporting information relating to the test plots is given on page 2.
The two row plots were separated by four rows of corn which served as a buffer between plots to reduce the effect of chemical drift and maintain pest population pressure on the various treatments.
The insecticides were applied August 1 and a second time on August 15 on half of each plot. Silwet L-77 at 10 oz./acre was added to each treatment. The insecticides were applied with a compressed air sprayer, mounted on a Hahn Hi-Boy sprayer at 38 p.s.i. at the rate of 25 g.p.a.
Broken or lodged plants for each plot were counted on October 4, 2002. Corn was harvested for grain on October 10, 2002.
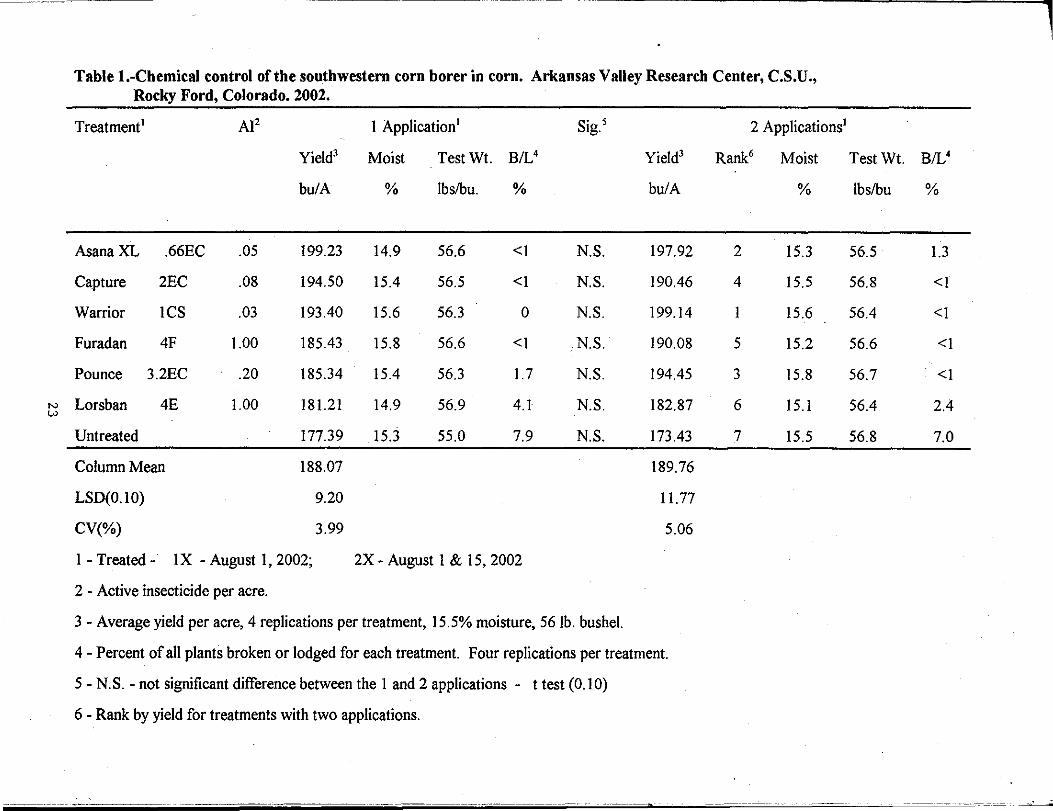
Results and Discussion - There are two points of interest in this trial. There was no significant difference in yield between one and two applications for any of the treatments and the Asana treatment provided as good or better yields than any other treatment for either one or two applications.
The trials of the past two years resulted in Warrior, Capture and Furadan providing substantially better yields than Asana, Pounce and Lorsban with one application and there was no significant difference between one and two applications of the first three mentioned treatments. If two applications were made Asana and Pounce could provide control comparable to Warrior, Capture and Furadan. This trial would indicate that Asana could provide control that compared to the first three under much reduced infestation levels.
If it becomes necessary to use an insecticide to manage the SWCB at moderate to high infestation levels Warrior, Capture and Furadan should be the insecticides of choice. In addition, with proper timing one application of these insecticides can do the job.
21
Test Plot Information - 2002 Arkansas Valley Researcll Center
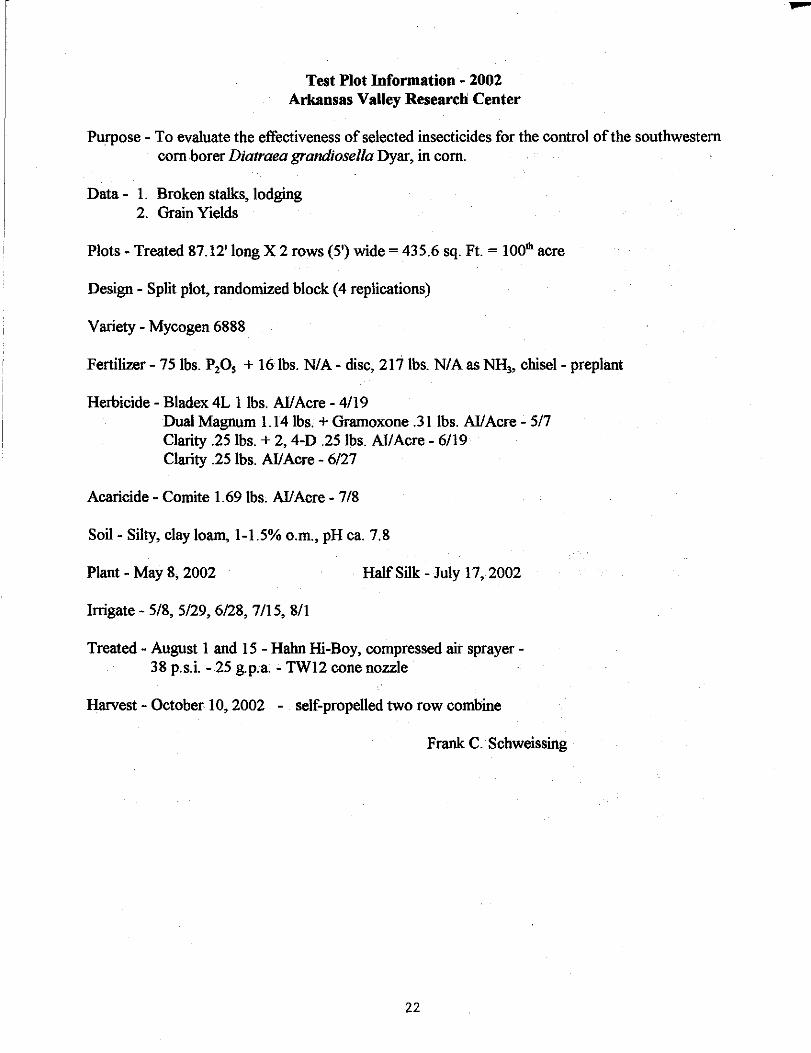
Purpose - To evaluate the effectiveness of selected insecticides for the control of the southwestern corn borer Diatraea grandiosella Dyar, in corn.
Data - 1. Broken stalks, lodging 2. Grain Yields
Plots- Treated 87.I2' long X 2 rows (5') wide= 435.6 sq. Ft. = IOOth acre
Design- Split plot, randomized block (4 replications)
Variety- Mycogen 6888
Fertilizer- 75 lbs. P20 5 + I6lbs. N/A- disc, 2I7lbs. N/A as NH3, chisel- preplant
Herbicide - Bladex 4L I lbs. All Acre - 4/I9 Dual Magnum I.l4 lbs. + Grarnoxone .3I lbs. All Acre - 517 Clarity .25 lbs. + 2, 4-D .25 lbs. All Acre- 6/I9 Clarity .25 lbs. All Acre - 6/27
Acaricide - Comite 1. 69 lbs. All Acre - 7/8
Soil- Silty, clay loam, I-1.5% o.m., pH ca. 7.8
Plant - May 8, 2002 Half Silk - July I7, 2002
Irrigate - 5/8, 5/29, 6/28, 7/I5, 8/1
Treated - August I and 15 - Halm Hi-Boy, compressed air sprayer-38 p.s.i. -25 g.p.a - TWI2 cone nozzle
Harvest- October IO, 2002 - self-propelled two row combine
Frank C. Schweissing
22
~-~-~~-~~-~~~--------~·
N w
Table I.-Chemical control of the southwestern corn borer in corn. Arkansas Valley Research Center, C.S.U., Rocky Ford, Colorado. 2002.
Treatmene
AsanaXL .66EC
Capture 2EC
Warrior ICS
Furadan 4F
Pounce 3.2EC
Lorsban 4E
Untreated
Column Mean
LSD(O.IO)
CV(%)
AI2
.05
.08
.03
1.00
.20
1.00
Yield3
bu/A
I99.23
I94.50
I93.40
185.43
185.34
I81.21
177.39
188.07
9.20
3.99
1 -Treated- 1 X - August I, 2002;
2 - Active insecticide per acre.
I Application'
Moist TestWt. B/14
% lbslbu. %
I4.9 56.6 <I
I5.4 56.5 <I
15.6 56.3 0
15.8 56.6 <1
15.4 56.3 1.7
14.9 56.9 4.1
15.3 55.0 7.9
2X- August 1 & I5, 2002
S. 5 tg.
N.S.
N.S.
N.S.
N.S.
N.S.
N.S.
N.S.
3- Average yield per acre, 4 replications per treatment, 15.5% moisture, 56 lb. bushel.
Yield3
bu/A
197.92
190.46
199.14
190.08
194.45
182.87
173.43
189.76
11.77
5.06
4 -Percent of all plants broken or lodged for each treatment. Four replications per treatment.
5- N.S.- not significant difference between the 1 and 2 applications - t test (0. IO)
6 - Rank by yield for treatments with two applications.
2 Applications'
Rank6 Moist
%
2 15.3
4 15.5
I 15.6
5 15.2
3 15.8
6 15.1
7 15.5
~
1
Test Wt. B/14
lbs/bu %
56.5 1.3
56.8 <I
56.4 <I
56.6 <1
56.7 <]
56.4 2.4
56.8 7.0
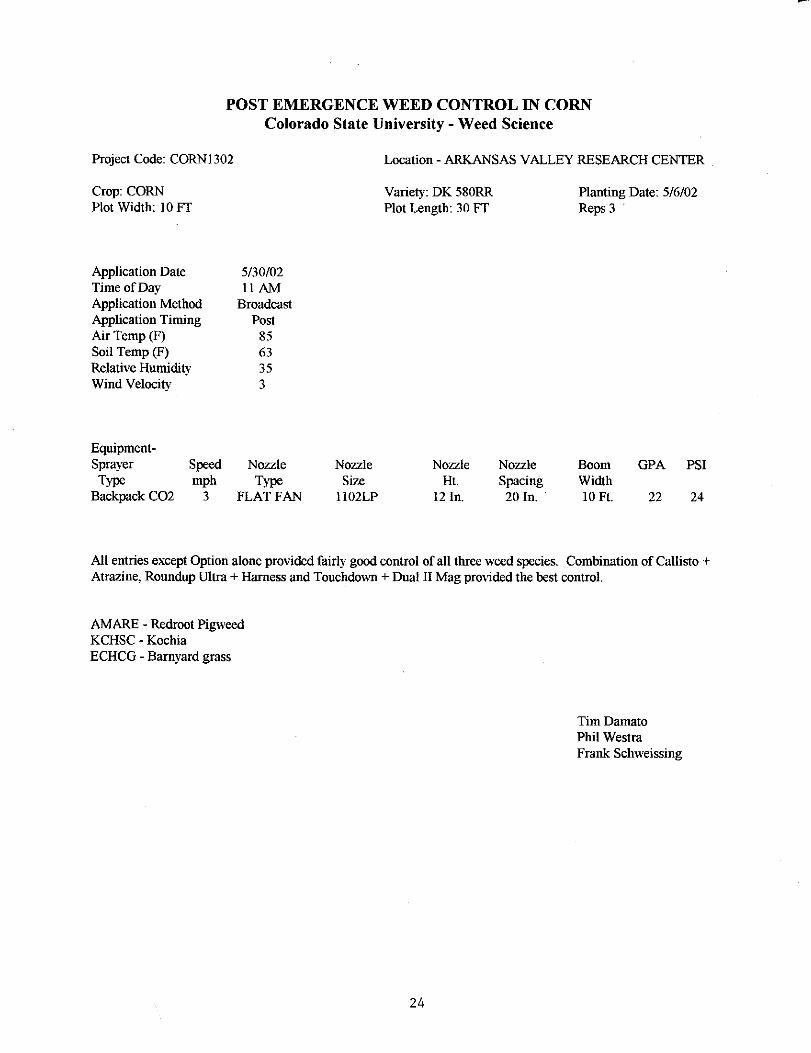
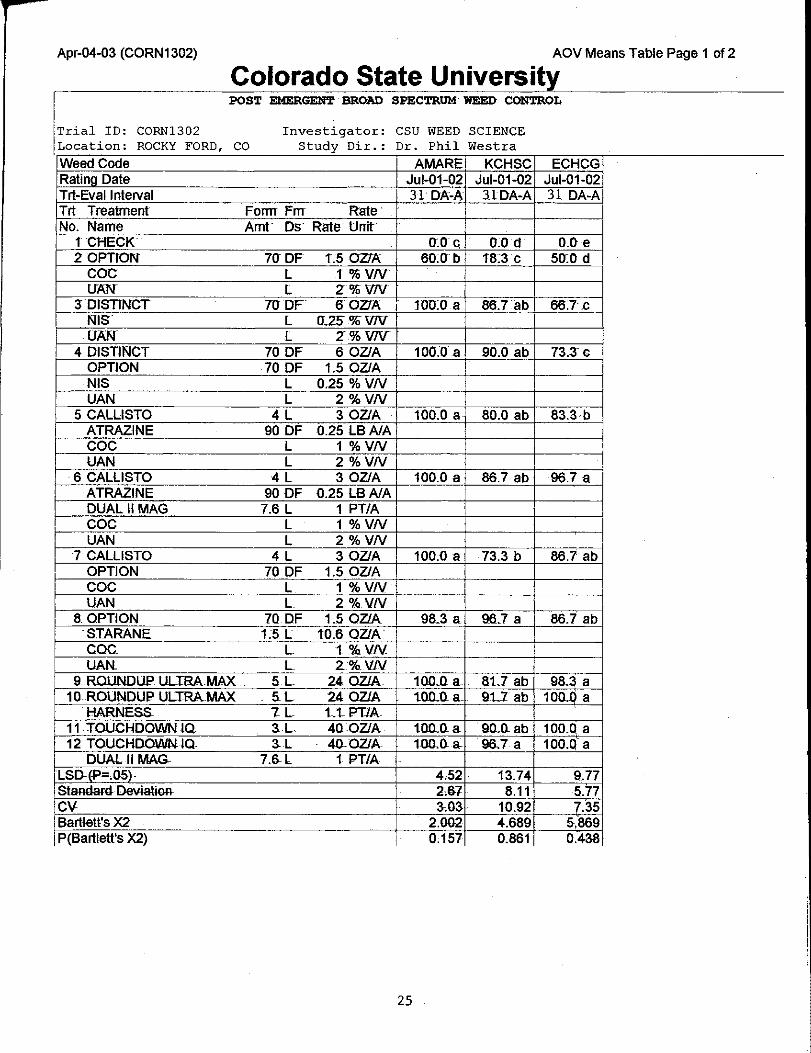
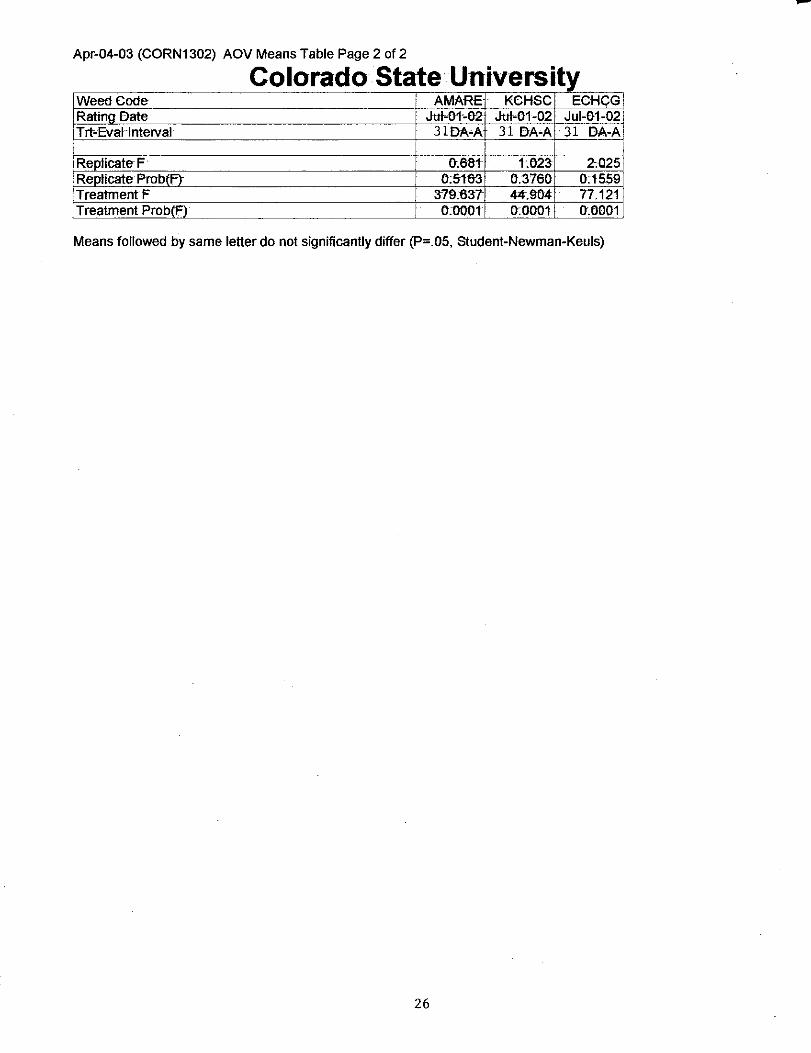
POST EMERGENCE WEED CONTROL IN CORN Colorado State University- Weed Science
Project Code: CORNJ302
Crop: CORN Plot Width: I 0 FT
Application Date TimeofDay Application Method Application Timing Air Temp (F) Soil Temp (F) Relative Hnntidity Wind Velocity
EquipmentSprayer Type
Backpack C02
Speed mph
3
5/30/02 llAM
Broadcast Post
85 63 35 3
Nozzle Type
FLAT FAN
Nozzle Size
1102LP
Location - ARKANSAS VALLEY RESEARCH CENTER
Variety: DK 580RR Plot Length: 30 FT
Nozzle Ht.
12 In.
Nozzle Spacing 20 In. ·
Planting Date: 5/6/02 Reps 3
Boom Width 10Ft.
GPA
22
PSI
24
All entries except Option alone provided fairly good control of all three weed species. Combination of Callisto + Atrazine, Ronndup Ultra+ Harness and Touchdown + Dual II Mag provided the best control.
AMARE - Redroot Pigweed KCHSC - Kochia ECHCG -Barnyard grass
24
Tim Damato Phil Westra Frank Schweissing
Apr-04-03 (CORN1302) AOV Means Table Page 1 of 2
Colorado State University I
POST EMERGENT" BROAD SPECTRUM WEED CONTROL
Trial ID: CORN1302 Investigator: CSU WEED SCIENCE Location: ROCKY FORD, CO st.,dy Dir.: Dr. Phil Westra
IWeedCode 1=,.,1-l,.,...,
I Ratin!l Date ... u,-u ·~u.<: ... u,-u 1-u..: ~ '" 1 lll·t:v•u 31 DA:-A JlDA-A 31 DA-A ITrt T: Form Frrr Rate~
No. Name Amt Ds Rate tJrrit 1 O.Oc. 0.0 d O.Oe 2 .. 7(} DF 1.5 OZ!A 6(l0b 18:3 c 50:0 d
coc 1%VN lJAN Z%VN
3 Ul<:> I ll'lv I NDF 60ZTA mo:oa 86.7ab 66.7" .c NIS 0.25%VN
AN Z%VN 4 "~T 70 DF 6 OZ/A 100.0 ~ 90.0 ab 73.Zc
( . IIUI'I 70 DF 1.5 OZ/A NIS 0.25 o/o VN UAN %VN
5 :AL~ 4 OZ/A 100.0 a 80.0 ab 83.3b 90 DF 0.2~ LB A/A
:oc l 1 o/o VN UAN 2 o/o VN
· 6 '"'AI I IRTO 4 3 OZ/A 100.0 a 86.7 ab 96.7 a AT~ .711\1~ 90 DF 0.2~ A/A )UA .II MAG 7.6 "lA ;oc VN JAN 2 o/o VN
7 CAlliSTO 4 3 OZ/A 100.0 a 73.3 b 86.7 ab UI"'IIUN 70 DF 1.! OZ/A coc 1 o/o VN
8~UJ'I l o/o VN 70 DF 1.5 OZJA 98 .. 3 a 96.7 a 86.7 ab 1:5 L to.6 OZ/A
coc L t%VN UAN. L ~%VN
' 9 ~Ill TI"U. UAY 5.L 2o OZJA 100..0. a 81.7 ab 98.~ a 10 MAX 5.L 2• OZJA 1000" 9Uab 10o..Q a
7 UPT/A 11 . Tni lf':l-lnn\1111\1 10. 3L 40 OZ/A tOQOa ·90 .. 0ab 100.Q a 12 rn1 3 ~ ~OZ/A 1000a 96..7 a 100.0- a
DUAL II MAG- 7.~L 1 PT/A 4.52 13.74 9.77 2J~7 8.11 5.77
ICV lo03 10.92 '.35 ;X2 2.002 4RAQ 5, 869
P(Bartlett's X2) 0,157 0.861 0.438
25
-Apr-04-03 (CORN1302) AOV Means Table Page 2 of 2
Colorado State-University WeedCocle ' A MARE K-GHSC ECHCGI
I Rating Date I .1!*•01--6-2 M-01-02 Jul-&1-02 Trt-Evallntervat 31DA•A 31 DA-A 31 DA-A
I I I
I Replicate- F o-.681 1:023 2-;025 Repticate Prob(F)- 0:5163- 0.3760• 0:1-559 TreatmentF 379:637 44.904 77.121 Treatment Prob(F) 0:0001 0:0001 o-.0001 [
Means followed by same letter do not significantly differ (P=.05, Student-Newman-Keuls)
26
Winter Wheat Variety Trial- 2001-2002 Arkansas Valley Research Center
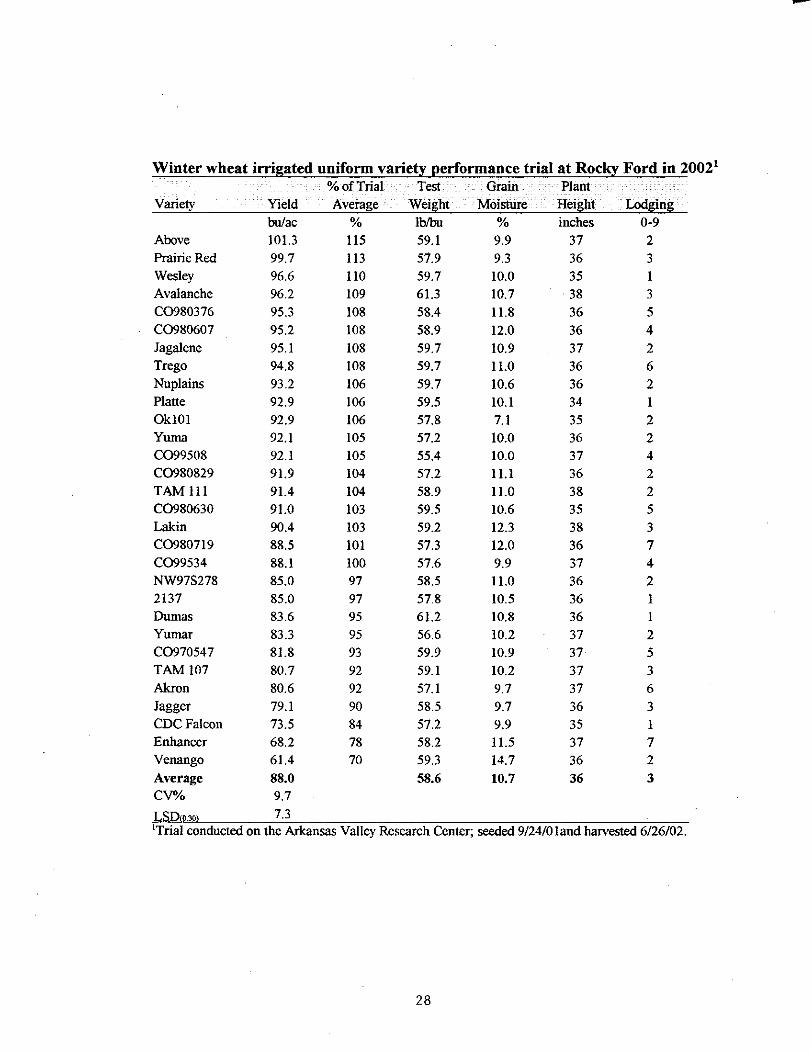
Thirty cultivars, including eight experimental lines, from the Colorado State University Wheat Breeding Project were entered in this years trial. The average yield of 88.0 bushels per acre is somewhat higher than the previous year (2000). The 2001 trial was hailed out. The range in yield was 61.4 bu. To 101.3 bu. Per acre. The extremely dry weather from the fall of2001 through 2002 had less effect on the wheat than other crops due to an adequate irrigation water supply throughout the trial.
Test Plot Information
Data - 1. Grain yields 2. Growth factors
Plots- 30' X 5' ( 4 rows), Harvest 5' X 24'
Design - Randomized complete block (3 replications)
Variety - 30 cultivars, including 8 experimental lines
Fertilizer- 71.5 lbs. N03-N in soil test 50 lbs. P 20 5 - 11/7/00 61 lbs. N as urea in irrigation water - 4/22/02
Herbicide - Bronate 1 lb. All Acre - 3/13/02
Insecticide- DiSyston 8E . 75 lbs. All Acre- 4/22/02
Plant - September 24, 2001 1,000,000 seeds/acre
Irrigate - 9/25, 10/9, 4/8, 4/22, 5/8, 5/26
Harvest - June 26, 2002 - small plot combine
6-8 hrs./run
27
Jerry J. Johnson James P. Hain Frank C. Schweissing
-
Winter wheat irrigated uniform variety J!erformance trial at Rocky Ford in 20021
%ofTrial Test Grain Plant Variety Yield Average Weight Moisture Hei/;\ht Lodging
bu/ac % lblbu % inches 0-9 Above 101.3 115 59.1 9.9 37 2 Prairie Red 99.7 113 57.9 9.3 36 3 Wesley 96.6 110 59.7 10.0 35 I Avalanche 96.2 109 61.3 10.7 38 3 C0980376 95.3 108 58.4 11.8 36 5 C0980607 95.2 108 58.9 12.0 36 4 Jagalene 95.1 108 59.7 10.9 37 2 Trego 94.8 108 59.7 ll.O 36 6 Nuplains 93.2 106 59.7 10.6 36 2 Platte 92.9 106 59.5 10.1 34 I OklO I 92.9 106 57.8 7.1 35 2 Yuma 92.1 105 57.2 10.0 36 2 C099508 92.1 105 55.4 10.0 37 4 C0980829 91.9 104 57.2 ll.l 36 2 TAM Ill 91.4 104 58.9 11.0 38 2 C0980630 91.0 103 59.5 10.6 35 5 Lakin 90.4 103 59.2 12.3 38 3 C0980719 88.5 101 57.3 12.0 36 7 C099534 88.1 100 57.6 9.9 37 4 NW97S278 85.0 97 58.5 ll.O 36 2 2137 85.0 97 57.8 10.5 36 I Dumas 83.6 95 61.2 10.8 36 I Yumar 83.3 95 56.6 10.2 37 2 C0970547 81.8 93 59.9 10.9 37 5 TAM 107 80.7 92 59.1 10.2 37 3 Akron 80.6 92 57.1 9.7 37 6 Jagger 79.1 90 58.5 9.7 36 3 CDC Falcon 73.5 84 57.2 9.9 35 I Enhancer 68.2 78 58.2 11.5 37 7 Venango 61.4 70 59.3 14.7 36 2
Average 88.0 58.6 10.7 36 3 CV% 9.7
Do.30 7.3 1Trial conducted on the Arkansas Valley Research Center; seeded 9/24/0 land harvested 6/26/02.
28
N
""
f-"''"""
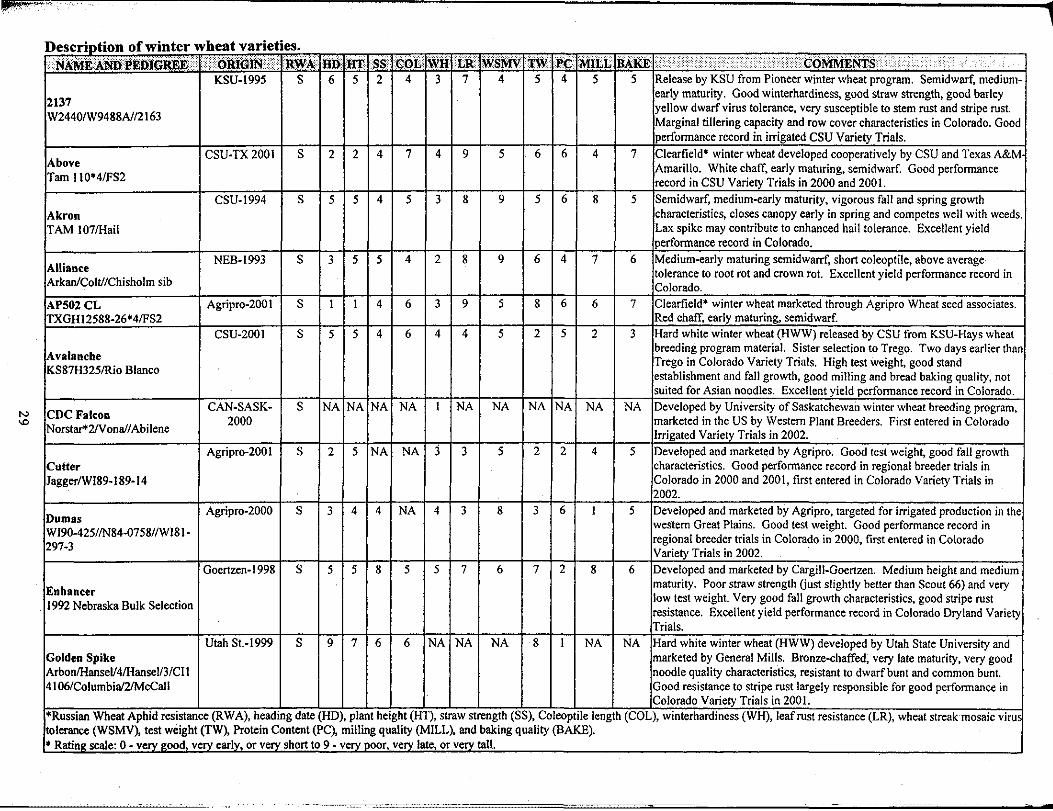
Description of winter wheat vartettes . .• NA'M£.:.\N!iiiii\btG.ii.l\l\? oattitN ? RWA iili ,HT ss b.dL wii •'tlt wsl\4v T:W. ii¢ MILL JIAK:E ·•·••·•·•·• i)•·•····•·. • \ .•····· .·· .. ,· .. · ··
. KSU-1995 S 6 5 2 4 3 7 4 5 4 5 5 ReleasebyKSUfromPioneerwinterwheatprogram. Semidwarf,mediumearly maturity. Good winterhardiness, good straw strength, good barley
2137 yellow dwarf virus tolerance, very susceptible to stem rust and stripe rust. W2440/W9488A//2163 Marginal tillering capacity and row cover characteristics in Colorado. Good
performance record in irrigated CSU Variety Trials. CSU-TX2001 S 2 2 4 7 4 9 5 6 6 4 7 Clearfield*winterwheatdevelopedcooperativelybyCSUandTexasA&M
Above Amarillo. White chaff, early maturing, semidwarf. Good performance Tam 110*4/FS2 record in CSU Variety Trials in 2000 and 2001.
CSU-1994 S 5 5 4 5 3 8 9 5 6 8 5 Semidwarf, medium-early maturity, vigorous fall and spring growth Akron characteristics, closes canopy early in spring and competes well with weeds. TAM 107/Hail Lax spike may contribute to enhanced hail tolerance. Excellent yield
performance record in Colorado. . NEB-1993 S 3 5 5 4 2 8 9 6 4 7 6 Medium-early maturing semidwarrf, short coleoptile, above average
Alhance tolerance to root rot and crown rot. Excellent yield performance record in Arkan!Colti/Chisholm sib Colorado.
AP502 CL Agripro-2001 S I I 4 6 3 9 5 8 6 6 7 Clearfield* winter wheat marketed through Agripro Wheat seed associates. TXGH12588-26*41FS2 Red chaff, early maturing, semidwarf.
CSU-2001 S 5 5 4 6 4 4 5 2 5 2 3 Hard white winter wheat (HWW) released by CSU from KSU-Hays wheat breeding program material. Sister selection to Trego. Two days earlier than
Avalanche . Trego in Colorado Variety Trials. High test weight, good stand KS87H325/Rto Blanco establishment and fall growth, good milling and bread baking quality, not
suited for Asian noodles. Excellent yield performance record in Colorado. CAN-SASK- S NA NA NA NA I NA NA NA NA NA NA Developed by University of Saskatchewan winter wheat breeding program,
CDC Falcon . 2000 marketed in the US by Western Plant Breeders. First entered in Colorado Norstar*2Nonai/Ab1lene Irrigated Variety Trials in 2002.
Agripro-200 I S 2 5 NA NA 3 3 5 2 2 4 5 Developed and marketed by Agripro. Good test weight, good fall growth Cutter characteristics. Good performance record in regional breeder trials in Jagger/WI89-189-14 Colorado in 2000 and 2001, first entered in Colorado Variety Trials in
. 2002.
Agripro-2000 S 3 4 4 NA 4 3 8 3 6 I 5 Developed and marketed by Agripro, targeted for irrigated production in the, Dumas western Great Plains. Good test weight. Good performance record in WI90-425//N84-0758//WI81- regional breeder trials in Colorado in 2000, first entered in Colorado 297-3 Variety Trials in 2002. · !
Goertzen-1998 S 5 5 8 5 5 7 6 7 2 8 6 Developed and marketed by Cargiii-Goertzen. Medium height and medium maturity. Poor straw strength Gust slightly better than Scout 66) and very
Enhancer . low test weight. Very good fall growth characteristics, good stripe rust 1992 Nebraska Bulk Selectton resistance. Excellent yield performance record in Colorado Dry land Variety
Trials. Utah St.-1999 S 9 7 6 6 NA NA NA 8 I NA NA Hard white winter wheat (HWW) developed by Utah State University and
Golden Spike marketed by General Mills. Bronze-chaffed, very late maturity, very good Arbon/Hansei/4/Hansei/3/Cil noodle quality characteristics, resistant to dwarf bunt and common bunt. 4106/Columbia/2/McCall Good resistance to stripe rust largely responsible for good performance in
Colorado Variety Trials in 2001. *Russian Wheat Aphid resistance (RWA), heading date (HD), plant height (HT), straw strength (SS), Coleoptile length (COL), winterhardiness (WH), leaf rust resistance (LR), wheat streak mosaic virus tolerance (WSMV), test weight (TW), Protein Content (PC), milling quality (MILL), and baking quality (BAKE). • Ratin2 scale: 0- verv 2ood very early, or very short to 9 • very poor, very late, or very tall.
..., 0
----- - - --------
'wll -----
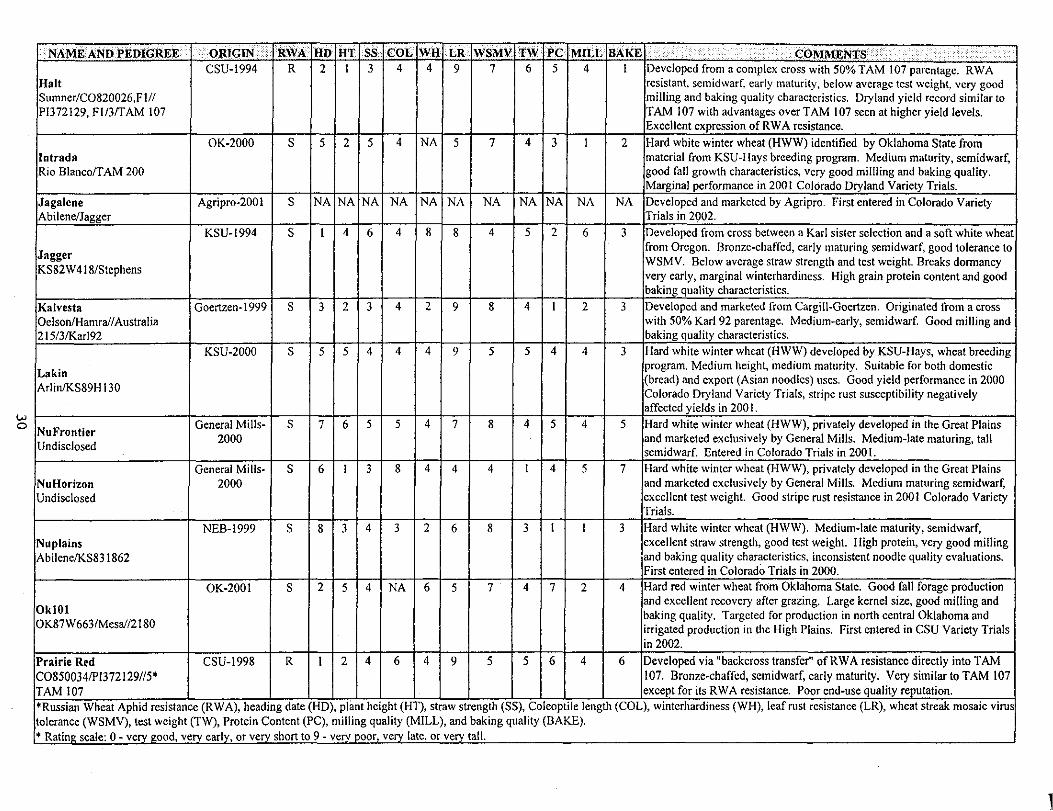
NAMEAND l'EDIGREE ORIGIN RWA HlJ HT ss COL LR WSMV TW l'C MILL BAKE . ·.·•····· ····. .·. .·•.· COMMENTS ..... ·.·
... ··.···.• .
CSU-I994 R 2 I 3 4 4 9 7 6 5 4 I Developed from a complex cross with 50% TAM 107 parentage. RWA Halt resistant, semidwarf, early maturity, below average test weight, very good Sumner/C0820026,FI// milling and baking quality characteristics. Dry land yield record similar to PI372I29, Fl/3ffAM 107 TAM I 07 with advantages overT AM I 07 seen at higher yield levels.
Excellent expression of RWA resistance. OK-2000 s 5 2 5 4 NA 5 7 4 3 I 2 Hard white winter wheat (HWW) identified by Oklahoma State from
Intrada material from KSU-Hays breeding program. Medium maturity, semidwarf, Rio Biancorr AM 200 good fall growth characteristics, very good millling and baking quality.
Marginal performance in 2001 Colorado Dryland Variety Trials. Jagalene Agripro-200I s NA NA NA NA NA NA NA NA NA NA NA Developed and marketed by Agripro. First entered in Colorado Variety Abilene/Jagger Trials in 2002.
KSU-1994 s l 4 6 4 8 8 4 5 2 6 3 Developed from cross between a Karl sister selection and a soft white wheat
Jagger from Oregon. Bronze-chaffed, early maturing semi dwarf, good tolerance to WSMV. Below average straw strength and test weight. Breaks dormancy
KS82W 418/Stephens very early, marginal wintcrhardincss. High grain protein content and good baking quality characteristics.
Kalvesta Goertzen-I999 s 3 2 3 4 2 9 8 4 I 2 3 Developed and marketed from Cargill-Goertzen. Originated from a cross Oelson/Hamra//Australia with 50% Karl 92 parentage. Medium-early, semi dwarf. Good milling and· 215/3/Karl92 baking quality characteristics.
KSU-2000 s 5 5 4 4 4 9 5 5 4 4 3 Hard white winter wheat (HWW) developed by KSU-Hays, wheat breeding
Lakin program. Medium height, medium maturity. Suitable for both domestic
Arlin/KS89H 130 (bread) and export (Asian noodles) uses. Good yield performance in 2000 Colorado Dryland Variety Trials, stripe rust susceptibility negatively affected yields in 200 I.
NuFrontier General Mills- s 7 6 5 5 4 7 8 4 5 4 5 Hard white winter wheat (HWW), privately developed in the Great Plains
Undisclosed 2000 and marketed exclusively by General Mills. Medium-late maturing, tall
. semidwarf. Entered in Colorado Trials in 200 I .
General Mills- s 6 l 3 8 4 4 4 I 4 5 7 Hard white winter wheat (HWW), privately developed in the Great Plains NuHorizon 2000 and marketed exclusively by General Mills. Medium maturing semidwarf, Undisclosed excellent test weight. Good stripe rust resistance in 2001 Colorado Variety
Trials. NEB-I999 s 8 3 4 3 2 6 8 3 I I 3 !lard white winter wheat (HWW). Medium-late maturity, semidwarf,
Nuplains excellent straw strength, good test weight. High protein, very good milling Abilene/KS83I862 and baking quality characteristics, inconsistent noodle quality evaluations.
First entered in Colorado Trials in 2000. OK-200I s 2 5 4 NA 6 5 7 4 7 2 4 Hard red winter wheat from Oklahoma State. Good fall forage production
OklO I and excellent recovery after grazing. Large kernel size, good milling and baking quality. Targeted for production in north central Oklahoma and
OK87W6631Mesa//2I80 irrigated production in the High Plains. First entered in CSU Variety Trials in 2002.
l'rairie Red CSU-1998 R I 2 4 6 4 9 5 5 6 4 6 Developed via "backcross transfer" ofRWA resistance directly into TAM C0850034/PI372129//5* 107. Bronze-chaffed, semidwarf, early maturity. Very similar to TAM 107 TAM 107 except for its R W A resistance. Poor end-use quality reputation. *Russian Wheat Aphid resistance (R W A), heading date (HD), plant height (HT), straw strength (SS), Coleoptile length (COL), winterhardiness (WH), leaf rust resistance (LR), wheat streak mosaic virus tolerance (WSMV), test weight (TW), Protein Content (PC), milling quality (MILL), and baking quality (BAKE). * Rating scale: 0 - very good, very early, or very short to 9 - very poor, very late, or very tall.
l
w ....
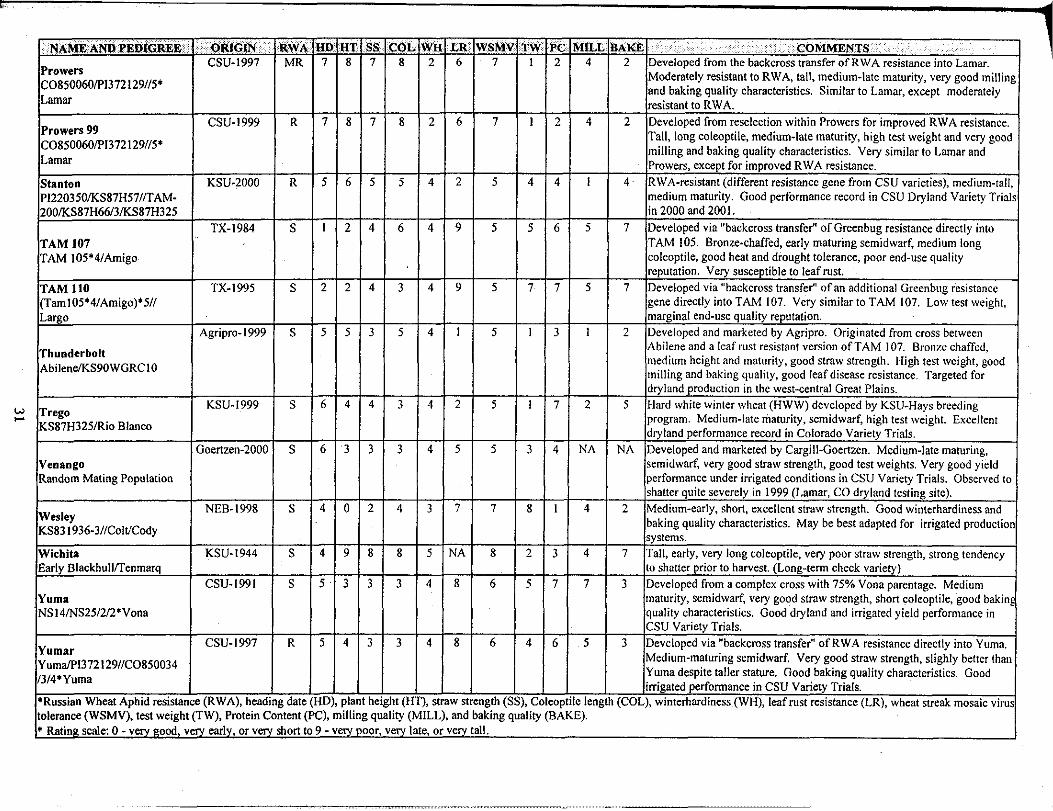
NAME.Al'lii l'EDtGIUl&.t ······.·•·oRIGIN ·. RWA Hl! .llT $$ COL wil ur WSMV TW Jib .MiLL BAKE . ... . .... ·.·· .... ·COMMENTS. < ••·•·· • ~ CSU-1997 MR 7 8 7 8 2 6 7 I 2 4 2 Developed from the backcross transfer of R W A resistance into Lamar.
Prowers Moderately resistant toR W A, tall, medium· late maturity, very good millin~ C0850060/PI372!29//5* and baking quality characteristics. Similar to Lamar, except moderately Lamar resistant to R W A.
CSU-1999 R 7 8 7 8 2 6 7 I 2 4 2 Developed from resclection within Prowers for improved RWA resistance. Prowers 99 Tall, long coleoptile, medium-late maturity, high test weight and very good C0850060/PI372!29//5* milling and baking quality characteristics. Very similar to Lamar and Lamar Prowers, except for improved R W A resistance.
Stanton KSU-2000 R 5 6 5 5 4 2 5 4 4 I 4 RWA-resistant (different resistance gene from CSU varieties), medium-tall, Pl220350/KS87H57 /IT AM· medium maturity. Good performance record in CSU Dryland Variety Trial! 200/KS87H66/3/KS87H325 in 2000 and 2001.
TX-1984 s I 2 4 6 4 9 5 5 6 5 7 Developed via 11 backcross transfer11 of Greenbug resistance directly into TAM 107 TAM I 05. Bronze-chaffed, early maturing semi dwarf, medium long TAM !05*4/Amigo colcoptile, good heat and drought tolerance, poor end-use quality
reputation. Very susceptible to leaf rust. TAM 110 TX-1995 s 2 2 4 3 4 9 5 7 7 5 7 Developed via "backcross transfer" of an additional Greenbug resistance (Tam I 05*4/Amigo)• 5// gene directly into TAM 107. Very similar to TAM 107. Low test weight, Largo marginal end-use quality reputation.
Agripro-1999 s 5 5 3 5 4 I 5 I 3 I 2 Developed and marketed by Agripro. Originated from cross between
Thunderbolt Abilene and a leaf rust resistant version of TAM I 07. Bronze chaffed, medium height and maturity, good straw strength. lligh test weight, good
Abilene!KS90WGRC 10 milling and baking quality, good leaf disease resistance. Targeted for dry land production in the west-central Great Plains.
KSU-1999 s 6 4 4 3 4 2 5 I 7 2 5 !·lard white winter wheat (HWW) developed by KSU-Hays breeding Trego program. Medium-late nlaturity, semidwarf, high test weight. Excellent KS87H325/Rio Blanco dryland performance record in Colorado Variety Trials.
Goertzen-2000 s 6 3 3 3 4 5 5 3 4 NA NA Developed and marketed by Cargiii-Goertzen. Medium-late maturing, Venango semidwarf, very good straw strength, good test weights. Very good yield Random Mating Population performance under irrigated conditions in CSU Variety Trials. Observed to
shatter quite severely in 1999 (Lamar, CO dryland testing site). NEB-1998 s 4 0 2 4 3 7 7 8 I 4 2 Medium-early, short, excellent straw strength. Good winterhardiness and
Wesley baking quality characteristics. May be best adapted for irrigated productioc KS83!936-3//Colt!Cody systems. Wichita KSU-1944 s 4 9 8 8 5 NA 8 2 3 4 7 Tall, early, very long coleoptile, very poor straw strength, strong tendency Early Blackhuii/Tenmarq to shatter prior to harvest. (Long-term check variety}
CSU-1991 s 5 3 3 3 4 8 6 5 7 7 3 Developed from a complex cross with 75% Vona parentage. Medium Yuma maturity, semidwarf, very good straw strength, short coleoptile, good bakinf NS 14/NS25/2/2 'Vona quality characteristics. Good dry land and irrigated yield perfonnance in
CSU Variety Trials. CSU-1997 R 5 4 3 3 4 8 6 4 6 5 3 Developed via "backcross transfer" ofRWA resistance directly into Yuma. Yumar
Medium-maturing semidwarf. Very good straw strength, slighly better than Yuma!PI3 72129//C0850034 /3/4*Yuma
Yuma despite taller stature. Good baking quality characteristics. Good irrigated performance in CSU Variety Trials.
*Russian Wheat Aphid resistance (R WA), heading date (HD), plant height (HT), straw strength (SS), Coleoptile length (COL), winterhardiness (WH), leaf rust resistance (LR), wheat streak mosaic virus tolerance (WSMV), test weight (TW), Protein Content (PC), milling quality (MILL), and baking quality (BAKE). • Rating scale: 0- very good very early, or very short to 9- verv ooor, very late, or verv tall.
- ------·· --··------~

Irrigated Forage Sorghum Hybrid Performance Test at Rocky Ford, 2002.
INVESTIGATOR: Frank C. Schweissing, Superintendent, Arkansas Valley Research Center, Rocky Ford, Colorado.
PURPOSE: To identifY high yielding hybrids under irrigated conditions.
PLOT: Two rows with 30" spacing, 32' long. SEEDING DENSITY: 96,800 Seed/A PLANTED: June 13. HARVESTED: September 12.
EMERGENCE DATE: ca. 10-!Sdays after planting1 SOIL TEMP: 69° F.
IRRIGATION': Four furrow irrigations: June 15, July 10, July 29, August 31, total applied 12 acre-in/ A
PEST CONTROL: Preemmergence Herbicide: bifenox 2 lbs. AI! A Postemergence Herbicide: Clarity .25 lbs. AI! A Insecticide: none.
Summary: Growing Season Predpitation and Temperature/1 Arkansas Valley Research Center, Rocky Ford, Otero County.
Month Rainfall GDD/2 >90F >100F DAP/3
in. o.ofdays
June 0.04 433 16 6 17 July 0.06 801 29 13 48 August 0.49 733 27 4 79 September 0.43 254 9 0 91
Total 1.02 2221 81 23 91
/1 Growing season from June 13 (planting) to September 1 ~ (harvest). /2 GOD: Growing Degree Days for sorghum. /3 DAP: Days After Planting.
CULTURAL PRACTICES: Previous crop: com. Field Preparation: plow, disc, roller pack, float. Cultivation: I X.
SOIL: silty-clay loam, 1-1.5% O.M., pH-ca. 7.8. l'ERTILIZER: 75lbs. P,05 and 196lbs. N/Acre.
COMMENTS: Excessively dry and hot. Late planting in dry soil. Forage yields below average.
1Emergence very uneven due to inability of water to sub out in dry powdery soil.
'No irrigation water in August until very last day. The last two irrigation runs were very short (2-3 hrs.) and rainfall from April through September was 2.1" compared to a long term average of 9".
32
...
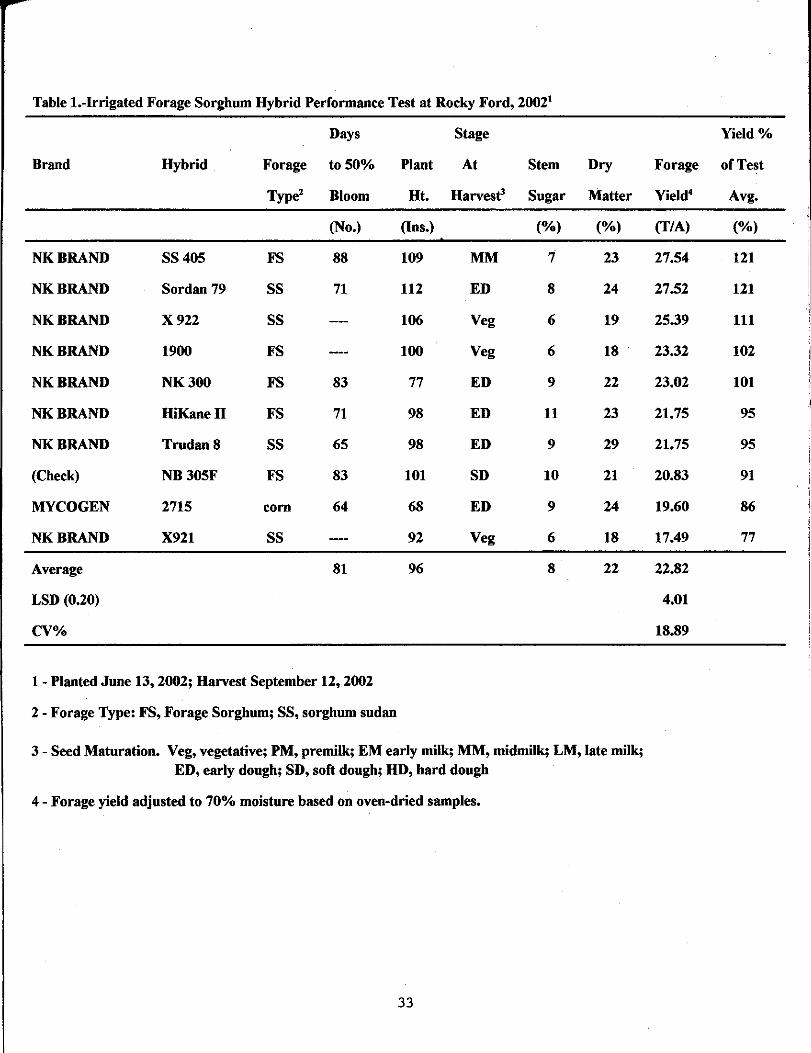
Table 1.-Irrigated Forage Sorghum Hybrid Performance Test at Rocky Ford, 20021
Days Stage Yield%
Brand Hybrid Forage to 50% Plant At Stem Dry Forage of Test
Type' Bloom Ht. Harvest' Sugar Matter Yield' Avg.
(No.) (Ins.) (%) (%) (T/A) (%)
NKBRAND SS405 FS 88 109 MM 7 23 27.54 121
NKBRAND Sordan 79 ss 71 112 ED 8 24 27.52 121
NKBRAND X922 ss 106 Veg 6 19 25.39 111
NKBRAND 1900 FS 100 Veg 6 18 23.32 102
NKBRAND NK300 FS 83 77 ED 9 22 23.02 101
NKBRAND HiKanell FS 71 98 ED 11 23 21.75 95
NKBRAND Trudan8 ss 65 98 ED 9 29 21.75 95
(Check) NB305F FS 83 101 SD 10 21 20.83 91
MY COG EN 2715 com 64 68 ED 9 24 19.60 86
NKBRAND X921 ss 92 Veg 6 18 17.49 77
Average 81 96 8 22 22.82
LSD (0.20) 4.01
CV% 18.89
1 - Planted June 13, 2002; Harvest September 12, 2002
2 - Forage Type: FS, Forage Sorghum; SS, sorghum sudan
3- Seed Maturation. Veg, vegetative; PM, premilk; EM early milk; MM, midmilk; LM, late milk; ED, early dough; SD, soft dough; HD, hard dough
4 - Forage yield adjusted to 70% moisture based on oven-dried samples.
33
Chemical Control of Green bugs on Sorghum - 2002 Arkansas Valley Research Center
Colorado State University Rocky Ford, Colorado
Weather for the season could be defined as hot and dry. Precipitation from April through September was 2.1 inches compared to a long tenn average of9 inches. Accumulated growing degree days (50° - 86°F) from May 1 to September 20 was 3165, higher than any one of the previous 20 growing seasons and substantially above the 21 year average of2852. Irrigation water was in short supply in July and was not available in August.
Greenbug populations were generally low in the plots but did allow for differential counts between treatments. Two years ago biotype identification (2000), by Gerald Wilde, Kansas State University, showed biotype I to be about 80%ofthe sample and biotype K 20%. Insecticide resistance, in that year, varied from 11 to 18% in the samples. We can't be sure what biotype changes have occurred, but due to very little insecticide use, because of low greenbug populations, the past two years insecticide resistance probably remained the same or is lower.
Methods and Materials - Supporting infonnation relating to the test plots is given on page 3.
Four row plots, 36' long were planted with various treated and untreated seed (Pioneer 8500) and each treatment was replicated four times. Four foot alleys were cut between blocks effectively reducing the plots to 32' in length.
The various insecticide seed treatments (Table I) were applied by Syngenta on May 22, 2002 and Counter CR was banded over the row at planting. Concep III (herbicide protection) and Apron, Allegiance, Captan, Maxim (disease protection) were all applied by Syngenta, as indicated in Table I, on May 22, 2002.
Greenbug counts were taken from two whole plants per plot at each counting date August 13, 20 and 27. This amounts to 8 plants per treatment from 4 replications per date in each test.
Results and Discussion-This trial was carried out under the adverse conditions described previously and greenbug populations were relatively low when compared to previous trials. Leaf damage was limited and grain loss to birds was high so grain harvest was not carried out. The different treatments probably would not have resulted in yield differences with the untreated plots.
However, it appears, that after two months Gaucho provides as good or better control of greenbugs than the other insecticide seed treatments and Counter CR.
Frank C. Schweissing
34
-
Test Plot Information - 2002 Arkansas Valley Research Center
Purpose- To evaluate the effectiveness of various seed treatment insecticides for the control of greenbugs, Schizaphis graminum (Ro11dani), on sorghum. The greenbugs were likely to be biotype I with very little insecticide resistance.
Data - 1. Aphid populations
Plots- Treated- 43.56' X 4 rows (5') wide= 435.6 sq. ft. = 1 OOih acre.
Design - Randomized block, 4 replications
Variety - Pioneer 8500
Fertilizer -75lbs. P20 5 + 16lbs. N AI/ Acre as 11-50-00; 11-7-01 196lbs. N as NH3 chisel and roll; 12-3-01
Herbicide - Clarity .25 lbs. AI/ Acre - 7/1 & 7/9
Soil- Silty-clay loam, 1-1.5% o.m., pH-ca. 7.8.
Plant - June 13, 2002 79,805 seeds/acre ca. 5.5 lbs./acre
Irrigate- 6/15, 7/10, 7/30,8/31
Treated - Seed - 5-22-02 Syngenta Counter- 6-13-02 over row at planting
Harvest - none
35
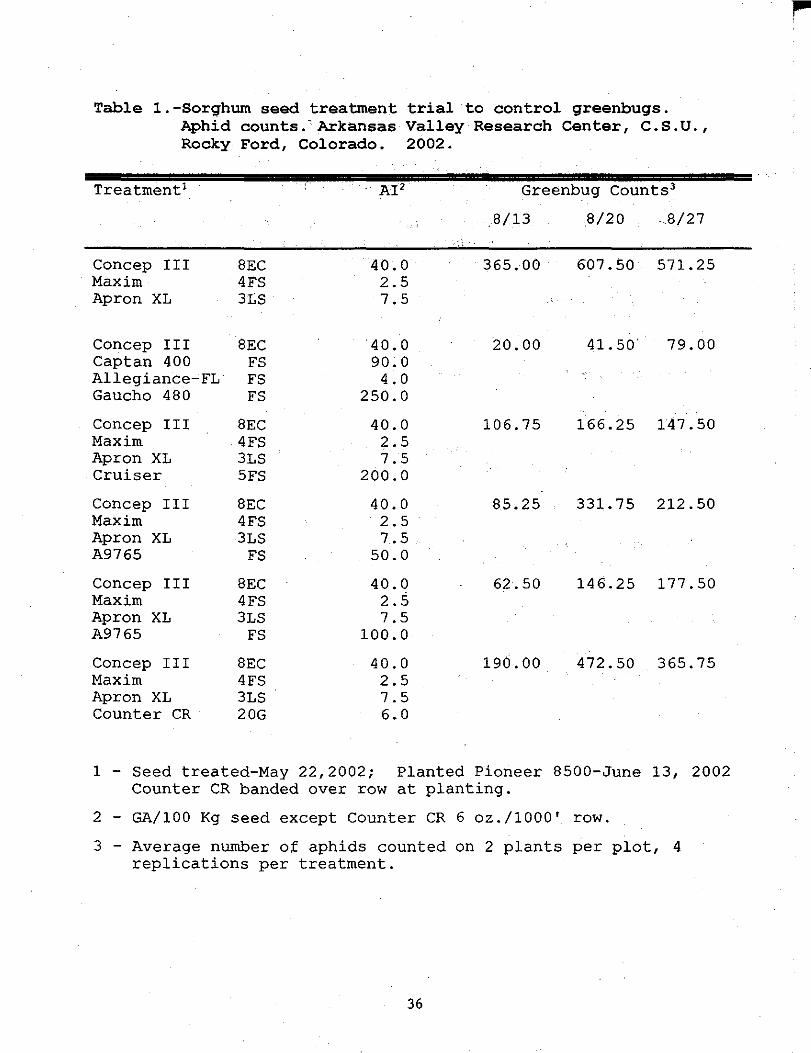
Table 1.-Sor~hum seed treatment trial to control ~reenbu~s. Aphid counts.'Arkansas Valley Research Center, c.s.u. I
Rocky Ford, Colorado. 2002.
Treatment1 · AI 2 Greenbug Counts3
8/13 S/20 .S/27 ,·,\
Concep III SEC 40.0 365.00 607.50 571.25 Maxim 4FS 2.5 Apron XL 3LS 7.5
Concep III SEC 40.0 20.00 41. so· 79.00 Captan 400 FS 90.0 Allegiance-FL. FS 4.0 Gaucho 4SO FS 250.0
Concep III SEC 40.0 106.75 166.25 147.50 Maxim 4FS 2.5 Apron XL 3LS 7.5 Cruiser 5FS 200.0
Concep III SEC 40.0 S5.25 331.75 212.50 Maxim 4FS 2.5 Apron XL 3LS 7.5 A9765 FS 50.0
Concep III SEC 40.0 62.50 146.25 177.50 Maxim 4FS 2.5 Apron XL 3LS 7.5 A9765 FS 100.0
Concep III SEC 40.0 190.00 472.50 365.75 Maxim 4FS 2.5 Apron XL 3LS 7.5 Counter CR 20G 6.0
1 - Seed treated-May 22,2002; Planted Pioneer SSOO-June 13, 2002 Counter CR banded over row at planting.
2 - GA/100 Kg seed except Counter CR 6 oz./1000' row.
3 - Average number of aphids counted on 2 plants per plot, 4 replications per treatment.
36
Soybean Variety Trial- 2002 Arkansas Valley Research Center
This is the fourth soybean trial at this Center in recent years. Trials were initiated in 1999 due to a renewed interest in oil crops. Precipitation for the year (3 .52") was the lowest in the recorded history (114 years) of the Center. Irrigation water was limited but except for August when the R.F. Ditch was out, we were able to irrigate the plots. Trial yields averaged 75.9 bushels per acre for the trial compared to 68.8 bu. per acre in 2001, 66.0 bu. per acre in 2000 and 53.7 bu. per acre in 1999. Yields ranged from 62.8 to 88.6 bu. per acre.
Test Plot Information
Purpose- To evaluate the inherent genetic ability of selected soybean varieties to yield under irrigated conditions in the Arkansas Valley.
Data - 1. Yields 2. Growth factors
Plots- 32' X 10' (4 rows) Harvest-2 rows
Design - Randomized complete blocks (3 replications)
Variety- 15 entries
Fertilizer- 751bs. P20,1A + 16lbs. N/acre as 11-52-0 - 11/7/01 Equivalent of 15 oz. of soybean innoculant/300 lbs. of seed
Herbicide- Basagran 1.0 lb. +Blazer .25 lbs. + Poast .28lbs. All Acre- 6/17 Basagran .75lbs. All Acre- 7111
Insecticide - none
Soil- Silty, clay loam, 1-1.5 o.m., pH- ca. 7.8
Plant- May 16,2002 ·
Irrigate- 5/16, 5/28, 7/7, 7/29, 9/1 Harvest- October 7, 2002 Self-propelled two row plot combine
37
Jerry Johnson Jim Hain Frank Schweissing
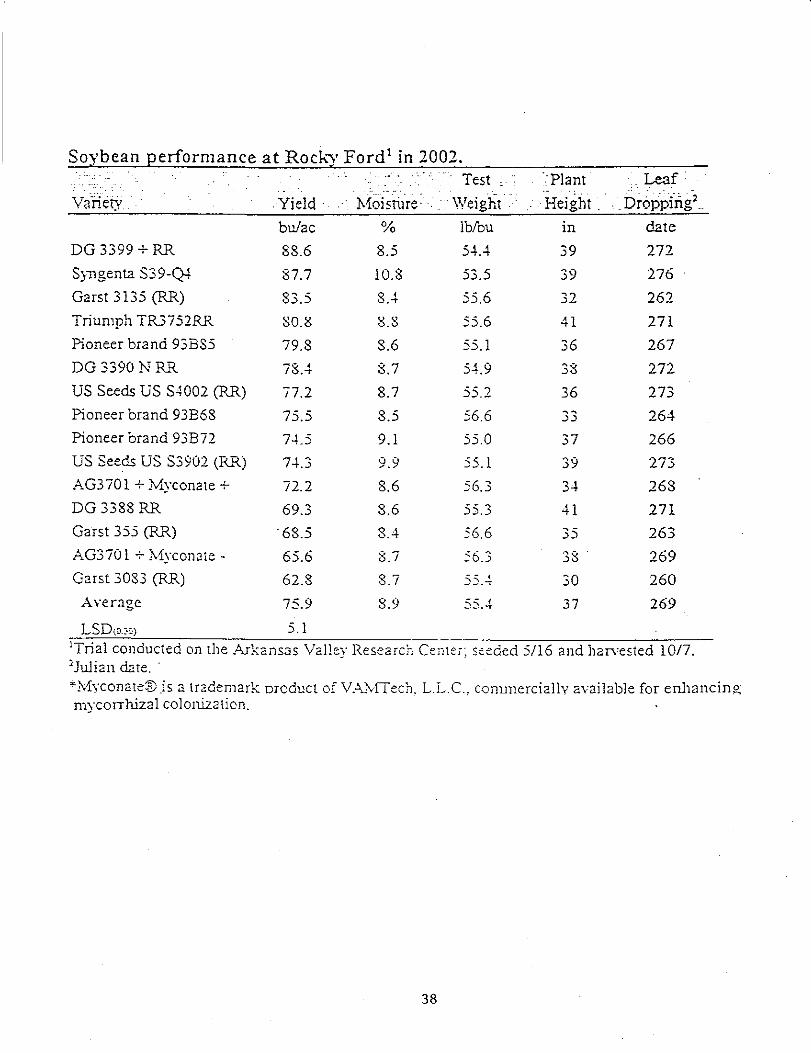
Soj:'bean Qerformance at Rocky Ford1 in 2002. . . .
Test Plant . . Leaf • .
Vaiiet}' Yield · Moisrilre ···\\'eight .. ·· Height. . . Di-OpJ)i-flg2 ___
bu!ac % lbfou 1n date
DG 3399 +RR 88.6 8.5 5-U 39 272
S;ngenta S39-Q4 87.7 10.8 53.5 39 276
Garst 3135 (RR) 83.5 8.-+ 55.6 32 262
Triumph TR3752RR ~0.:5 :5.8 55.6 41 271
Pioneer brand 93B85 79.8 8.6 55.1 36 267
DG3390NRR 78.4 8.7 54.9 38 272
US Seeds US S4002 (RR) 77.2 8.7 -- ? :J:J,_ 36 273
Pioneer brand 93B68 75.5 8.5 56.6 '' 264 .).)
Pioneer brand 93B72 7-U 9.1 55.0 37 266
US Seeds US S3902 (RR) 74.3 9.9 55.1 39 273
AG3701 + Myconate + 72.2 8.6 56.3 34 268
DG3388 RR 69.3 8.6 55.3 41 271 Garst 355 (RR) '68.5 8.4 56.6 35 263
AG370 1 + ;'-'iyconate- 65.6 8.7 56.3 38 269 Garst 3083 (RR) 62.8 8.7 -- <
.) .) --:' 30 260 Averaoc , 75.9 8.9 55.4 37 269
'Trial conducted on the .Au-kansas Valley Research Center; seeded 5/16 and harYested 10/7. 'Julian date. · *Myconate:ID .is a tr2demark oroduct of V..'>uviTech, L.L.C., conunercially available for enhancing mycorrhizal colonization.
38

WEED CONTROL IN SOYBEANS Colorado State University- Weed Science
Project Code: SOYB-0 I Location - ARKANSAS VALLEY RESEARCH CENTER
Crop: SOYBEAN Plot Width: 10 Fr
Application Date TimeofDay Application Method Application Timing Air Temp (F) Soil Temp (F) Relative Humidity Wind Velocity
EquipmentSprayer
Type Backpack C02
Speed mph
3
5/30/02 12 Noon Broadcast
Post 85 63 35 3
·Nozzle
Type FLAT FAN
Nozzle Size
1102LP
Variety: AG 3701RR Plot Length: 30 Fr
Nozzle Ht.
12 In.
Nozzle Spacing 20 In.
Planting Date: 5/16/02 Reps3
Boom Width 10Ft.
GPA
22
PSI
24
Roundnp and Touchdown + combinations provided excellent control of the weed species in this test. Other entries were effective against some but not all species.
AMARE - Redroot Pigweed KCHSC - Kochia V Mallow - Venice Mallow ECHCG - Barnyard grass
39
Tim Damato Phil Westra Frank Schweissing
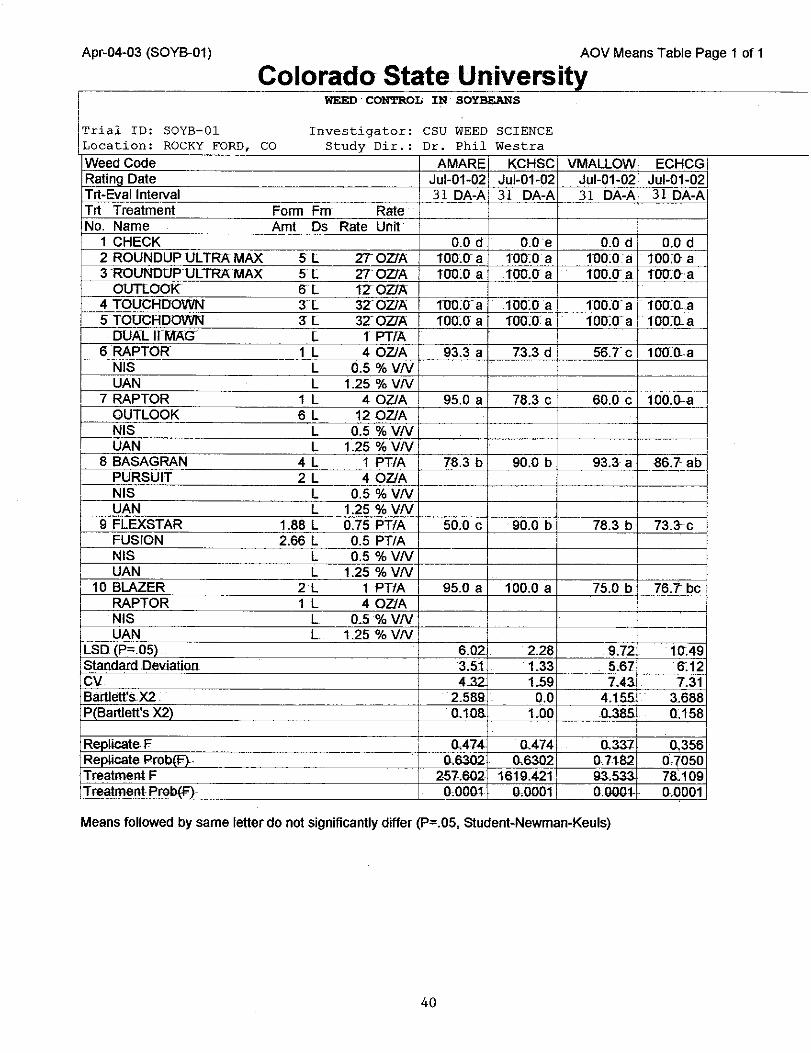
Apr-04-03 (SOYB-01) AOV Means Table Page 1 of 1
Colorado State University WEED CONTROL IN SOYBSANS
Trial ID: SOYB-01 Investigator: CSU WEED SCIENCE Location: ROCKY FORD, co Study Dir.: Dr. Phil Westra Weed Code A MARE KCHSC VMALLOW ECHCG RatinoDate Jul-01-02 Jul-01-02 Jul-01-02 Jul-01-02 Trt-Evallnterval 31 DA-A 31 DA-A 31 DA-A 31 DA-A Trt Treatment Form Fm Rate· No. Name Amt Ds Rate Unit
1 CHECK 0.0 d 0.0 e 0.0 d 0.0 d 2 ROUNDUP UlTRA MAX 5[ 2/0ztA roo. a a 100:0 a 100.0 a roo:o- a 3 "ROIJNDUPUL TRA MAX 5[ 2/0ztA i roo:o a roo:cr a roo:cr a roo:o-a
OUTLOOK E>l 'IZOZ!A I 4TOUCHDOWN :n 3ZOZJA roo:a-a 100.0 a rcro.o· a 1 roo:o..a 5 TOUCR!JOWN 3l 370ZfA 100.0" a roo:oa roo:a- a 100:!L.a
DUAL II M"AG [ f PTTA I 6 RAPTOR 1 L 4 OZ/A 93.3 a 73.3 d 56.Tc 11JO"_O..a
NIS L 0.5 %VN UAN L 1.25% VN
7 RAPTOR 1 L 4 OZ/A 95.0 a 78.3 c 60.0 c 100.CH! OUTLOOK 6L 12 OZ/A NIS L 0.5 %VN UAN L 1.25% VN
8 BASAGRAN 4 L 1 PT/A 78.3 b 90.0 b 93.3 a -86.7 ab PURSUIT 2 L 4 OZ/A NIS L 0.5 %VN UAN L 1.25 %VN
9 FLEXSTAR 1.88 L 0.75 PTfA 50.0 c ·90.0 b 78.3 b 73.3-c FUSION 2.66 L 0.5 PTIA NIS L 0.5 %VN UAN L 1.25% VN
10 BLAZER 2L 1 PTIA 95.0 a 100.0 a 75.0 b 76.7 be RAPT OR 1 L 4 OZJA I
I NIS L 0.5 %VN UAN L 1.25 %VN
LSD7P-.05\ 6.02 2.28 .9.72 10".49 Standard Deviation 3.51 1.33 . 5.67 6:12 cv 4.32 1.59 7.43 7.31 Bartlett's X2 . 2.589. ·. 0.0 4.155. 3.688 PIBartlett's X2l 0.108. 1.00 0.385 0.158
ReDiicateF 0.474 0..474 0.331 0,356 ReDUCate Prob{F).. 0,6302 0..6302 0..71.82 0,1050 Treatment-F 257.602 1.6-19-.421 ~533 78.109 Treatment Prob(F).- 0,0001 0,0001 0.0001. 0.0001
Means followed by same letter do not significantly differ (P=.05, Student-Newman-Keuls)
40
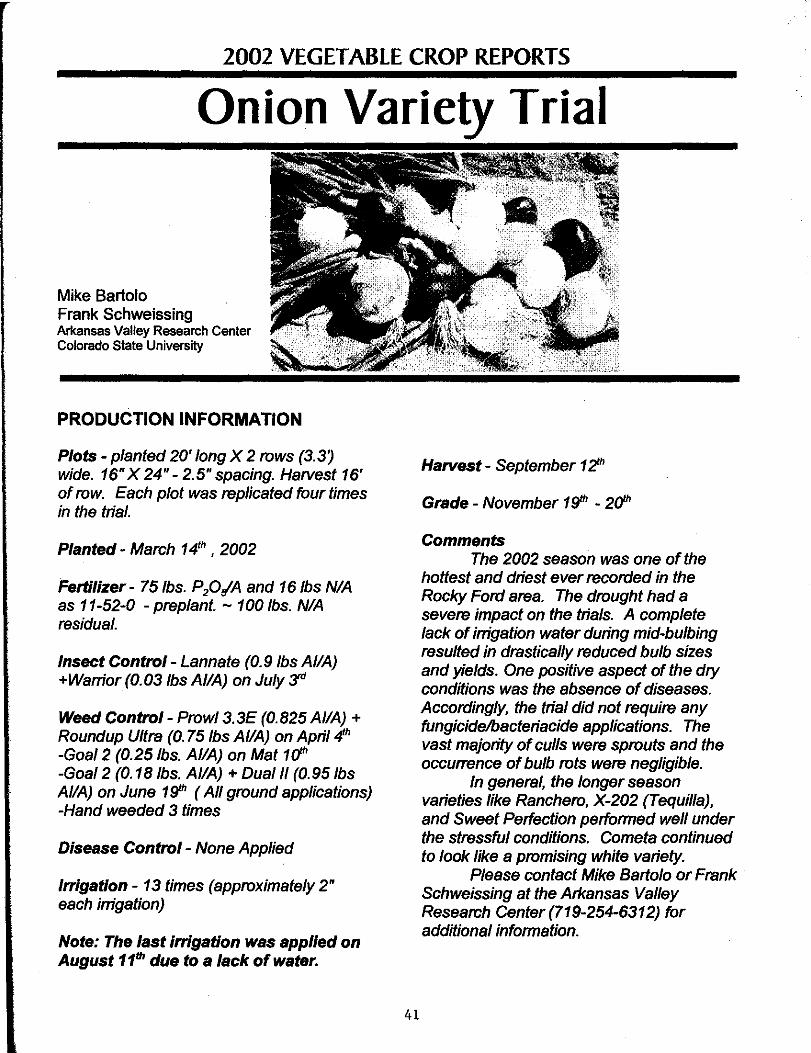
2002 VEGETABLE CROP REPORTS
Mike Bartolo Frank Schweissing Arkansas Valley Research Center Colorado Slate University
PRODUCTION INFORMATION
Plots- planted 20' long X 2 rows (3.37 wide. 16" X 24"- 2.5" spacing. Harvest 16' of row. Each plot was replicated four times in the trial.
Planted- March 141h, 2002
Fertilizer- 75/bs. P20,/A and 16 lbs NIA as 11-52-0 -prep/ant. - 100 lbs. NIA residual.
Insect Control- Lannate (0.9/bs AliA) +Warrior(0.03/bs AliA) on July JFr1
Weed Control- Prow/3.3E (0.825 AliA)+ Roundup Ultra (0. 75 lbs AliA) on April .tfh -Goal 2 (0.25/bs. AliA) on Mat 1dh -Goa/2 (0.18/bs. AliA) +Dual /I (0.95/bs AliA) on June 1gt/' (All ground applications) -Hand weeded 3 times
Disease Control- None Applied
Irrigation- 13 times (approximately 2" each irrigation)
Note: The last irrigation was applied on August 11th due to a lack of water.
41
Harvest- September 1 ~
Grade- November 1gt/' - 2dh
Comments The 2002 season was one of the
hottest and driest ever recorded in the Rocky Ford area. The drought had a severe impact on the trials. A complete lack of irrigation water during mid-bulbing resulted in drastically reduced bulb sizes and yields. One positive aspect of the dry conditions was the absence of diseases. Accordingly, the trial did not require any fungicidelbacteriacide applications. The vast majority of culls were sprouts and the occurrence of bulb rots were negligible.
In general, the longer season varieties like Ranchero, X-202 (Tequilla), and Sweet Pelfection performed well under the stressful conditions. Cometa continued to look like a promising white variety.
Please contact Mike Bartolo or Frank Schweissing at the Arkansas Valley Research Center (719-254-6312) for additional information.
'
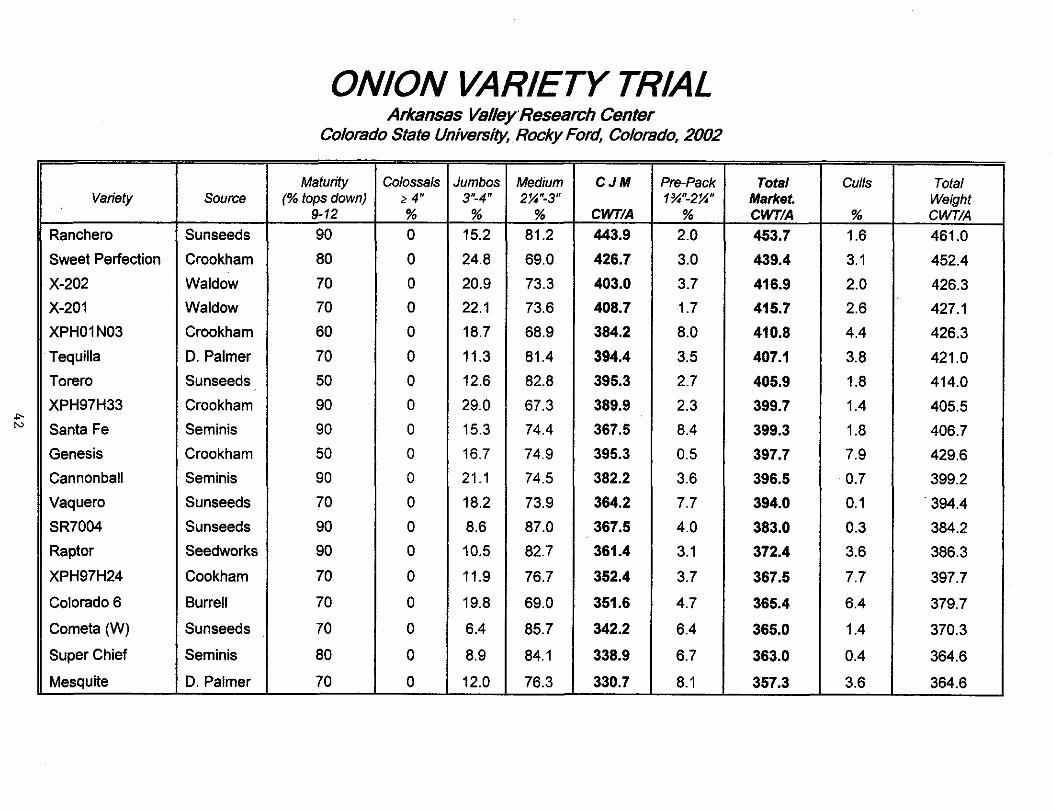
..,.. N
Variety
Ranchero
Sweet Perfection
X-202
X-201
XPH01N03
Tequilla
Torero
XPH97H33
Santa Fe
Genesis
Cannonball
Vaquero
SR7004
Rapt or
XPH97H24
Colorado 6
Cometa (W)
Super Chief
Mesquite
Source
Sunseeds
Crookham
Waldow
Waldow
Crookham
D. Palmer
Sunseeds
Crookham
Seminis
Crookham
Seminis
Sunseeds
Sunseeds
Seedworks
Cookham
Burrell
Sunseeds
Seminis
D. Palmer
ONION VARIETY TRIAL Arkansas ValleyResearch Center
Colorado State University, Rocky Ford, Colorado, 2002
Maturity Colossals Jumbos Medium CJM Pre-Pack (% tops down) ;? 4" 3"-4" 2~'-3" 1%"-2'!4"
9-12 % % % CWT!A %
90 0 15.2 81.2 443.9 2.0
80 0 24.8 69.0 426.7 3.0
70 0 20.9 73.3 403.0 3.7
70 0 22.1 73.6 408.7 1.7
60 0 18.7 68.9 384.2 8.0
70 0 11.3 81.4 394.4 3.5
50 0 12.6 82.8 395.3 2.7
90 0 29.0 67.3 389.9 2.3
90 0 15.3 74.4 367.5 8.4
50 0 16.7 74.9 395.3 0.5
90 0 21.1 74.5 382.2 3.6
70 0 18.2 73.9 364.2 7.7
90 0 8.6 87.0 367.5 4.0
90 0 10.5 82.7 361.4 3.1
70 0 11.9 76.7 352.4 3.7
70 0 19.8 69.0 351.6 4.7
70 0 6.4 85.7 342.2 6.4
80 0 8.9 84.1 338.9 6.7
70 0 12.0 76.3 330.7 8.1 -
Total Culls Total Market. Weight CWT/A % CWT/A
453.7 1.6 461.0
439.4 3.1 452.4
416.9 2.0 426.3
415.7 2.6 427.1
410.8 4.4 426.3
407.1 3.8 421.0
405.9 1.8 414.0
399.7 1.4 405.5
399.3 1.8 406.7
397.7 7.9 429.6
396.5 0.7 399.2
394.0 0.1 . 394.4
383.0 0.3 384.2
372.4 3.6 386.3
367.5 7.7 397.7
365.4 6.4 379.7
365.0 1.4 370.3
363.0 0.4 364.6
357.3 3.6 364.6
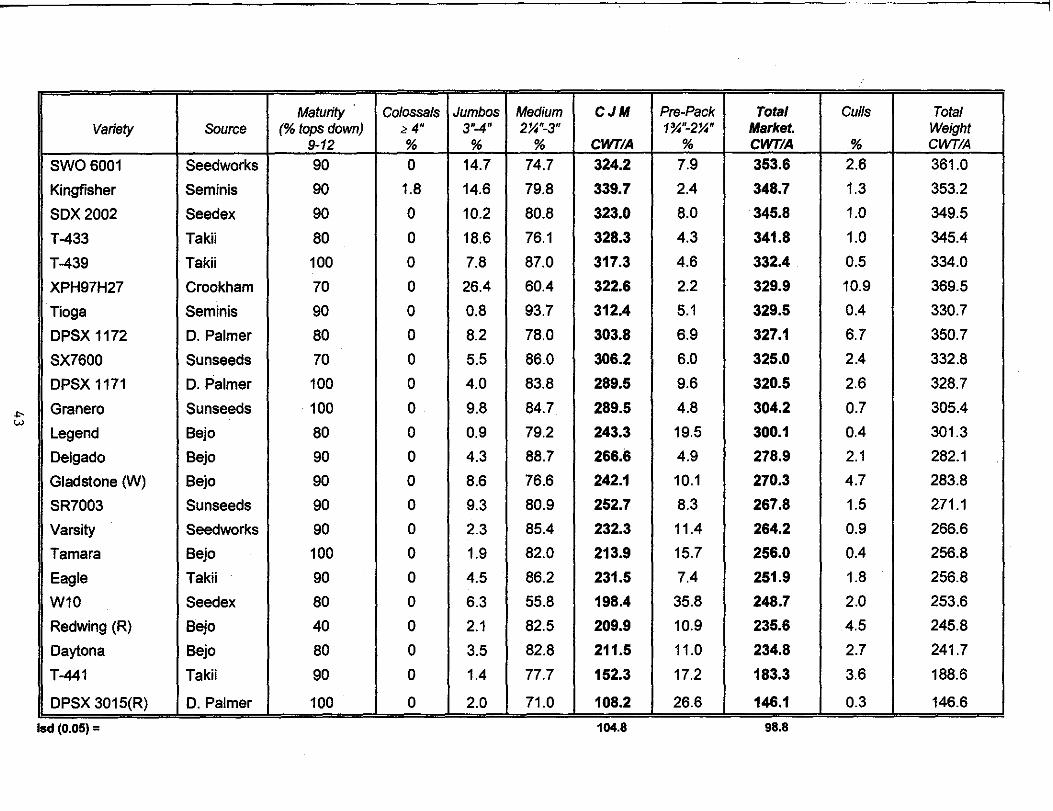
..,. w
Variety
SW06001
Kingfisher
sox 2002
T-433
T-439
XPH97H27
Tioga
DPSX 1172
SX7600
DPSX 1171
Granero
Legend
Delgado
Gladstone (W)
SR7003
Varsity
Tamara
Eagle
W10
Redwing (R)
Daytona
T-441
DPSX 3015(R)
lsd (0.05) =
Source
Seedworks
Seminis
Seed ex
Takii
Takii
Crookham
Seminis
D. Palmer
Sunseeds
D. Palmer
Sunseeds
Bejo
Bejo
Bejo
Sunseeds
Seedworks
Bejo
Takii
Seed ex
Bejo
Bejo
Takii
D. Palmer
Maturity Colossals Jumbos (% tops down) ~4" 3"-4"
9-12 % %
90 0 14.7
90 1.8 14.6
90 0 10.2
80 0 18.6
100 0 7.8
70 0 26.4
90 0 0.8
80 0 8.2
70 0 5.5
100 0 4.0
100 0 9.8
80 0 0.9
90 0 4.3
90 0 8.6
90 0 9.3
90 0 2.3
100 0 1.9
90 0 4.5
80 0 6.3
40 0 2.1
80 0 3.5
90 0 1.4
100 0 2.0
------ I
Medium CJM Pre-Pack Total Culls Total 2~"-3" 1*"-2~" Market. Weight
% CWTIA % CWTIA % CWTIA
74.7 324.2 7.9 353.6 2.6 361.0
79.8 339.7 2.4 348.7 1.3 353.2
80.8 323.0 8.0 345.8 1.0 349.5
76.1 328.3 4.3 341.8 1.0 345.4
87.0 317.3 4.6 332.4 0.5 334.0
60.4 322.6 2.2 329.9 10.9 369.5
93.7 312.4 5.1 329.5 0.4 330.7
78.0 303.8 6.9 327.1 6.7 350.7
86.0 306.2 6.0 325.0 2.4 332.8
83.8 289.5 9.6 320.5 2.6 328.7
84.7 289.5 4.8 304.2 0.7 305.4
79.2 243.3 19.5 300.1 0.4 301.3
88.7 266.6 4.9 278.9 2.1 282.1
76.6 242.1 10.1 270.3 4.7 283.8
80.9 252.7 8.3 267.8 1.5 271.1
85.4 232.3 11.4 264.2 0.9 266.6
82.0 213.9 15.7 256.0 0.4 256.8
86.2 231.5 7.4 251.9 1.8 256.8
55.8 198.4 35.8 248.7 2.0 253.6
82.5 209.9 10.9 235.6 4.5 245.8
82.8 211.5 11.0 234.8 2.7 241.7
77.7 152.3 17.2 183.3 3.6 188.6
71.0 108.2 26.6 146.1 0.3 146.6
104.8 98.8
Interactions between Salinity and Onion Production Practices in the Arkansas Valley, Colorado
Orren C. Doss, Michael E. Bartolo, Jessica G. Davis, and Grant E. Cardon Colorado State University, Arkansas Valley Research Center, Rocky Ford, Colorado 81067
In the Arkansas Valley of Colorado, onions are often grown in areas with saline soils and low quality irrigation water. Variety and irrigation experiments were conducted in 2000 and 2001 to evaluate the response of onions to soil salinity. The first experiment investigated three rates of magnesium sulfate applied to five onion varieties. The second experiment compared the impact of furrow and drip irrigation on onion yield and salt distribution in the soil profile. In both years, Colorado 6 and Vision varieties had the highest total marketable weight. In 2001, the magnesium sulfate application rates were doubled to increase the probability of achieving a yield reduction. In both years, however, salinity level had no significant (p ~ 0.05) effect on the yield or
grade of individual varieties. In the irrigation experiments, drip irrigation gave rise to higher electrical conductivity (ECe) in the furrow and lower ECe in the middle of the double-row bed. Furrow irrigation gave rise to a salt distribution pattern inverse of the drip irrigation results. As drip irrigation in the Arkansas Valley becomes more widely adopted, the location of the drip tape in relation to the seed row will need to be optimized to better manage water use and salt distribution in the soil profile.
Materials and Methods
Varietv Trial This field trial was conducted in two years on a Rocky Ford silty clay loam at
Colorado State University's Arkansas Valley Research Center. Five onion cultivars were sown from seed on March 7, 2000 and March 8, 2001. These onion cultivars include: Blanco Duro (Sunseeds, white), Colorado 6 (Burrell Seeds, yellow), Daytona (Bejo Seeds, yellow), Redwing (Bejo Seeds, red), and Vision (Seminis Seeds, yellow).
The experiment was a randomized split block design with four replications and three treatments as main plots and five onion varieties as sub-plots. In 2000, the main treatments included a single application of either 0 kg ha-1
, 4710 kg ha-1, or 9420 kg
ha-1 of agricultural grade magnesium sulfate applied prior to planting on March 6, 2000. In 2001, the same rates were applied twice, March 7 and June 20, 2001. Two
applications were made in 2001 to increase the potential for a significant plant response compared to the previous year. The single application in 2000 and the first application in 2001 were broadcast over the plots and incorporated with a rotary hoe. The second application in 2001 was incorporated with a cultivator.
The onion seeds were planted in a double row bed with 112 em between irrigation furrows, 46 em between seed rows, and an in-row spacing of 7 em. Each plot (1.1 by 7.6 m) contained two seed rows. Pests were controlled using established methods (Schwartz and Bartolo, 1995). The crops were irrigated 13 times each season with approximately 2 X 1 05 liter (two acre-in/acre) of water per irrigation event.
44
In each year, soil samples were taken prior to planting at a depth of 0 to 30 em from the furrow, seed row, and middle of the bed. Additional samples were taken were taken at 0 to 10 em, 10 to 20 em, 20 to 30 em, and 30 to 60 em at two times in the middle of the season and one time after harvest. Soil samples were taken to the laboratory for analysis. The saturated soil paste electrical conductivity (ECe) was evaluated using a Hach CO 150 electrical conductivity meter and conductivity cup (Rhoades et al., 1989).
The onion plots were harvested on September 19, 2000 and September 20, 2001. Onions from each plot were weighed and graded into individual market classes.
Irrigation Trial These studies were carried out in field trials at the Arkansas Valley Research
Center, Rocky Ford, Colorado, on a Rocky Ford silty clay loam. In both years, seeds of X-202 (Waldow Seeds), a long-day, Sweet Spanish type, were sown in early March on a double row bed (46 em between rows) with a 112 em space between irrigation furrows. Each plot (27 m X 3.3 m) contained a total of six rows of onions. The two outer rows served as a border. Water for furrow irrigation was delivered by gated pipe. Water for drip irrigation was delivered by drip tubing (T-Tape, TSX-508-30-340) buried 5 em deep in the middle of the bed and 23 em from the seed row. There was112 em between each drip line. Other production practices were carried out according to established recommendations (Schwartz and Bartolo, 1995).
The experiment was a randomized block design with four replications. The furrow irrigation plots received approximately 8.6 X 10⁶ 1iters (7.0 acre-ftlacre) of water during the 2000 season and 8.4 X 10⁶ liters (6.8 acre-ftlacre) of water during the 2001 season. The drip irrigation plots received approximately 1.55 X 10⁶ 1iters (1.26 acreftlacre) of water during the 2000 season and approximately 1.63 X 10⁶ liters (1.32 acreftlacre) of water during the 2001 season. These amounts reflect the total water applied and include runoff and deep percolation losses. The EC of the irrigation water averaged approximately 1.0 dS m-1 for both years.
In each year, soil samples were taken prior to planting to a depth of 0 to 30 em from the furrow, seed row, and middle of the bed. Additional samples were taken at 0 to 15 em and 15 to 30 em two times in the middle of the season and one time after harvest. Soil samples were taken to the laboratory for analysis. The saturated soil paste electrical conductivity (ECe) was evaluated using a Hach CO 150 electrical conductivity meter and conductivity cup (Rhoades et al., 1989).
The onion plots were harvested on September 19, 2000 and September 20, 2001. Onions from each plot were weighed and graded into individual market classes.
Results and Discussion
Varietv Trial Although there was a slight trend for the higher salinity treatments to depress
yields in most varieties, there was not a significant (P5. 0.05) variety by salt treatment interaction in either 2000 (Figure 1) or 2001 (Figure 2). As might be expected, there were significant yield differences between varieties. These differences were generally consistent with yield trials conducted in previous years.
45
There were significant salinity distribution differences in the soil between salt treatments throughout the field season. The interactions between salt treatments and salinity distribution within four depth increments were significantly different for the April, June, and September 2000 sampling dates. The interactions between salt treatment and location, salt treatment and sample depth, and sample depth by treatments were significant for the May, July, and October 2001 sampling dates. A typical salinity pattern for the onion seed row is illustrated in Figure 3. Overall, the salts exhibited a specific pattern of distribution. Salt concentration was similar to what others found (Bernsten and Fireman, 1957), that is, highest in the middle of the bed and lowest in the irrigation furrow.
The onion varieties were exposed to salinity conditions well above those reported to cause yield reductions (Maas and Hoffman, 1977). Adequately irrigated onions may be able to overcome some of the effects of high soil salinity by growing into regions of the soilless affected by salt accumulation (data not shown). In addition, the complement of individual ions may contribute to varied responses to salinity stress. In the Arkansas Valley, most salts contain Ca and Mg as opposed to the Na salts examined in the literature.
Irrigation Trial In both years, there was not a significant difference in onion yield between the
drip and furrow-irrigated treatments (Table 1). The drip irrigation treatment had significantly higher ECe in the middle of the bed as compared to furrow irrigation. There were significant differences in ECe in the seed rows within the drip and furrow-irrigated plots. (Tables 2-6). The irrigation treatments as a whole resulted in significantly different salt distribution patterns. Despite this and the fact that the drip irrigation treatment received approximately 6.9 X 10⁶ liters (5.6 acre-ft/acre) less water than the furrow irrigation treatment, onion yields were not significantly different. We suspect that onion yields may be increased if the distance between the drip line and seed row decreased. Correct placement of the drip line (distance from the seed row) could increase yields and water use efficiency while mitigating harmful salt accumulation. We will continue to test the optimum drip line configuration for onion production under saline conditions.
References Bernstein, L. and M. Fireman. 1957. Laboratory studies on salt distribution in furrowirrigated soil with special reference to the pre-emergence period. Soil Sci. 83:249-263.
Maas, E.V. and G.J. Hoffman. 1977. Crop salt tolerance-current assessment. J. of lrr. and Drain. Div., American Society of Civil Engineers 103:115-135
Rhoades, J.D., N.A. Manteghi, P.J. Shouse, and W.J. Alves. 1989. Estimating soil salinity from saturated soil-paste electrical conductivity. Soil Sci. Soc. Am. J. 53:428-433.
Schwartz, H.F. and M.E. Bartolo. 1995. Colorado onion production and integrated pest management bulletin. Colorado State Univ. Coop. Ext. Bul. 547A.
46
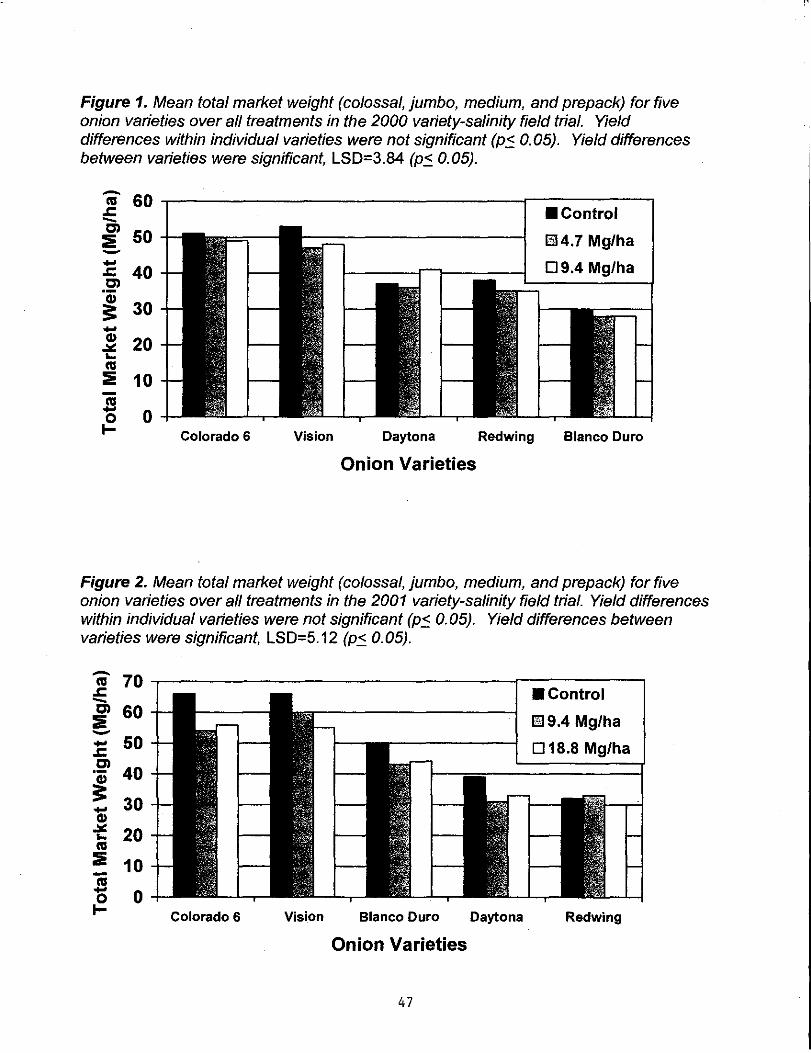
Figure 1. Mean total market weight (colossal, jumbo, medium, and prepack) for five onion varieties over all treatments in the 2000 variety-salinity field trial. Yield differences within individual varieties were not significant (P5. 0.05). Yield differences between varieties were significant, LSD=3.84 (P5. 0.05).
- 60 I'll .c -~ 50 -...
40 .c en
~ 30 ... Q)
20 ..:.:: ... I'll
:!!!: 10 -I'll ... 0 0
1- Colorado 6 Vision Daytona
Onion Varieties
Redwing
•control
El4.7 Mglha
09.4 Mglha
Blanco Duro
Figure 2. Mean total market weight (colossal, jumbo, medium, and prepack) for five onion varieties over all treatments in the 2001 variety-salinity field trial. Yield differences within individual varieties were not significant (P5. 0.05). Yield differences between varieties were significant, LSD=5.12 (P5. 0.05).
- 70 I'll .c -en 60 :!!!: -... 50 .c en
40 ·a; 3: 30 ... Q)
..:.:: 20 ... I'll
:!!!: - 10 I'll ...
0 0 1- Colorado 6 Vision Blanco Duro
Onion Varieties
47
Daytona
•control
1'39.4 Mglha
018.8 Mglha
Redwing
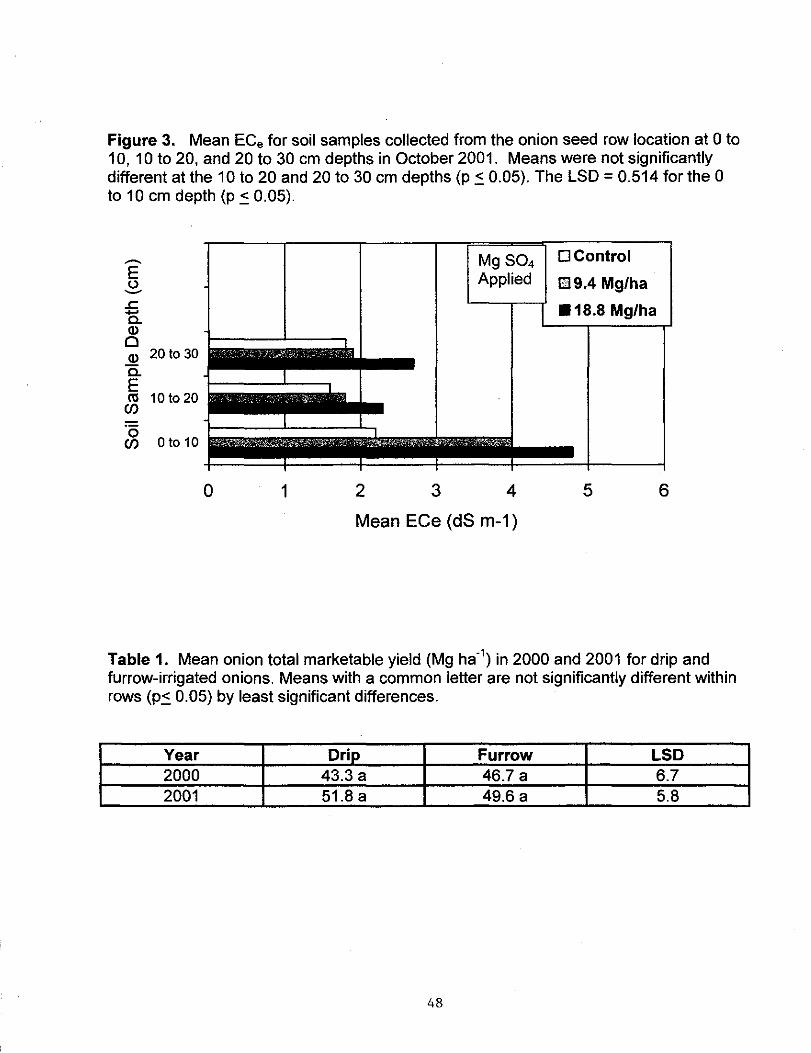
Figure 3. Mean ECe for soil samples collected from the onion seed row location at 0 to 10, 10 to 20, and 20 to 30 em depths in October 2001. Means were not significantly different at the 10 to 20 and 20 to 30 em depths (p ~ 0.05). The LSD= 0.514 for the 0 to 10 em depth (p ~ 0.05).
Mg so4 D Control
Applied llll9.4 Mg/ha
•18.8 Mg/ha
0 1 2 3 4 5 6
Mean ECe (dS m-1)
Table 1. Mean onion total marketable yield (Mg ha-1) in 2000 and 2001 for drip and
furrow-irrigated onions. Means with a common letter are not significantly different within rows (p~ 0.05) by least significant differences.
Year Drip Furrow LSD 2000 43.3 a 46.7 a 6.7 2001 51.8 a 49.6 a 5.8
48
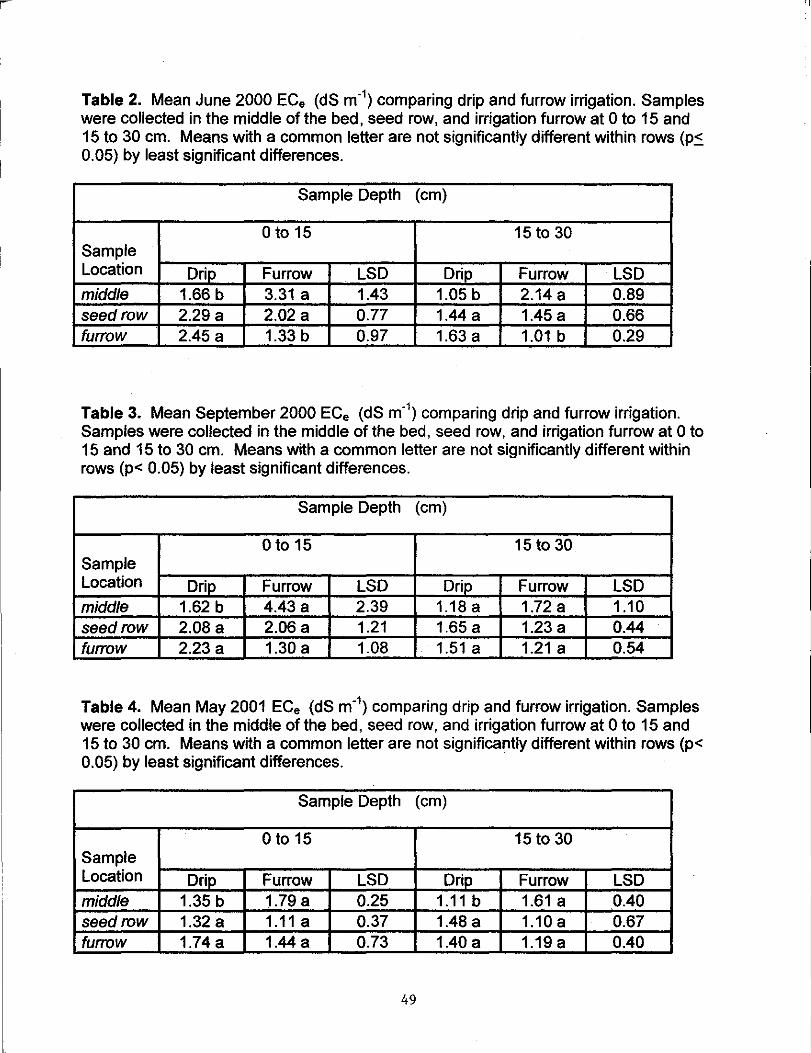
Table 2. Mean June 2000 ECe (dS m·1) comparing drip and furrow irrigation. Samples were collected in the middle of the bed, seed row, and irrigation furrow at 0 to 15 and 15 to 30 em. Means with a common letter are not significantly different within rows (p~ 0.05) by least significant differences.
Sample Depth (em)
0 to 15 15 to 30 Sample Location Drip Furrow LSD Drip Furrow LSD middle 1.66 b 3.31 a 1.43 1.05 b 2.14 a 0.89 seed row 2.29 a 2.02 a 0.77 1.44 a 1.45a 0.66 furrow 2.45 a 1.33 b 0.97 1.63 a 1.01 b 0.29
Table 3. Mean September 2000 ECe (dS m·1) comparing drip and furrow irrigation.
Samples were collected in the middle of the bed, seed row, and irrigation furrow at 0 to 15 and 15 to 30 em. Means with a common letter are not significantly different within rows (p< 0.05) by least significant differences.
Sample Depth (em)
0 to 15 15 to 30 Sample Location Drip Furrow LSD Drip Furrow LSD middle 1.62 b 4.43a 2.39 1.18 a 1.72 a 1.10 seed row 2.08 a 2.06a 1.21 1.65 a 1.23 a 0.44 furrow 2.23 a 1.30 a 1.08 1.51 a 1.21 a 0.54
Table 4. Mean May 2001 ECe (dS m·1) comparing drip and furrow irrigation. Samples were collected in the middle of the bed, seed row, and irrigation furrow at 0 to 15 and 15 to 30 em. Means with a common letter are not significantly different within rows (p< 0.05) by least significant differences.
Sample Depth (em)
0 to 15 15 to 30 Sample Location Drip Furrow LSD Drip Furrow LSD middle 1.35 b 1.79 a 0.25 1.11 b 1.61 a 0.40 seed row 1.32 a 1.11 a 0.37 1.48 a 1.10 a 0.67 furrow 1.74 a 1.44 a 0.73 1.40 a 1.19 a 0.40
49
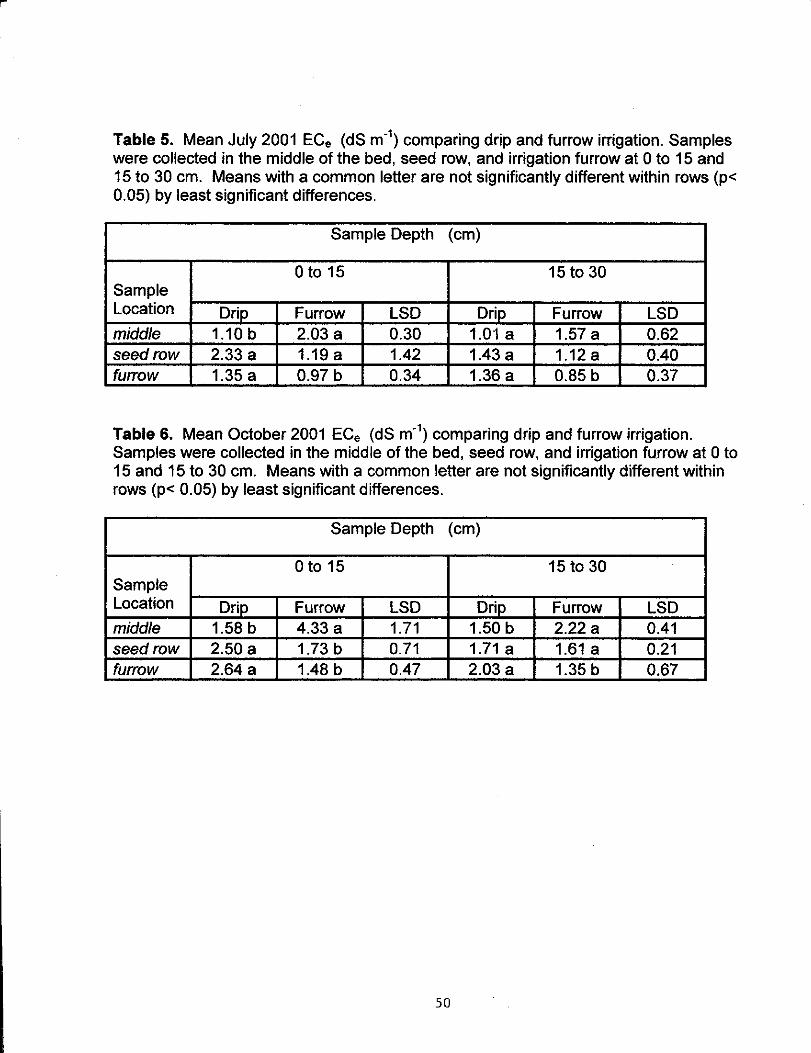
Table 5. Mean July 2001 ECe (dS m·1) comparing drip and furrow irrigation. Samples
were collected in the middle of the bed, seed row, and irrigation furrow at 0 to 15 and 15 to 30 em. Means with a common letter are not significantly different within rows (p< 0.05) by least significant differences.
Sample Depth (em)
0 to 15 15 to 30 Sample Location Drip Furrow LSD Drip Furrow LSD middle 1.10 b 2.03 a 0.30 1.0·1 a 1.57 a 0.62 seed row 2.33a 1.19 a 1.42 1.43 a 1.12 a 0.40 furrow 1.35 a 0.97 b 0.34 1.36 a 0.85 b 0.37
Table 6. Mean October 2001 ECe (dS m·1) comparing drip and furrow irrigation.
Samples were collected in the middle of the bed, seed row, and irrigation furrow at 0 to 15 and 15 to 30 em. Means with a common letter are not significantly different within rows (p< 0.05) by least significant differences.
Sample Depth (em)
0 to 15 15 to 30 Sample Location Drip Furrow LSD Drip Furrow LSD middle 1.58 b 4.33 a 1.71 1.50 b 2.22a 0.41 seed row 2.50a 1.73 b 0.71 1.71 a 1.61 a 0.21 furrow 2.64 a 1.48 b 0.47 2.03a 1.35 b 0.67
50
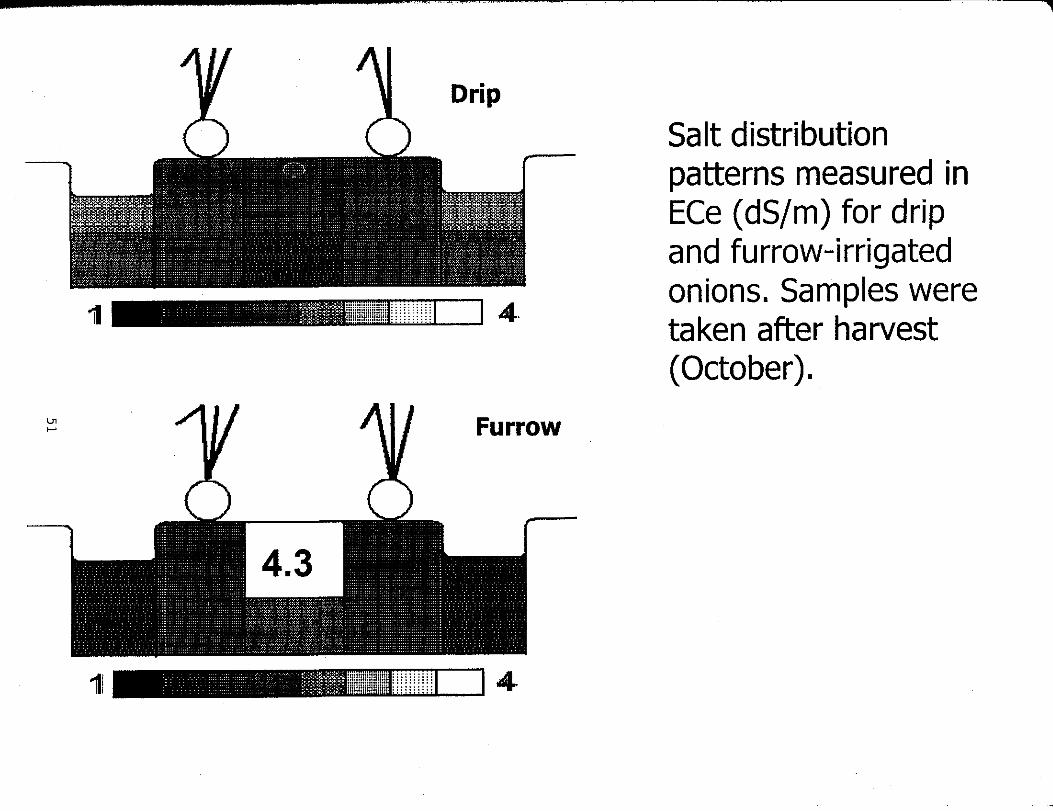
Ln ,...
1
1f
Drip
' .... -. ...... = ~:::r::~::r:~::: 4.
Furrow
4.3
··-······--- ~:::~::i;:;~:::~s:t 4.
Salt distribution patterns measured in ECe ( dS/m) for drip and furrow-irrigated onions. Samples were taken after harvest (October).
2002 Onion - Bactericide Screening Study October 28, 2002
Dr. Howard F. Schwartz and David H. Gent, Dept. of Bioagricultural Sciences and Pest Management, Colorado State University, Fort Collins, CO 80523-1177
Objective: The objective of this study was to evaluate the effectiveness of various fungicides and bactericides in controlling the primary bacterial diseases in Colorado, including Xanthomonas Leaf Blight (Xanthomonas campestris), Sour Skin (Burkholderia cepacia), Slippery Skin (B. gladioli pv. a//iicola), Bacterial Soft Rot (Erwinia carotovora subsp. carotovora), and Pantoea blight/Soft Rot (Pantoea ananitas).
Experimental Desim: Direct seeded onion plots were established at ARDEC in Fort Collins with the yellow onion variety 'Vantage'. All treatments were applied in 25 gallons of water per acre with a C02
backpack at 32 psi pressure, using Teejet 8002 flat-fan nozzles (2 per bed of 2 onion lines). Plots were 2 rows 30" wide by 25 feet in length with an untreated spreader row separating each treatment. The experiment was a randomized complete block design with 4 replicates.
This study was replicated at the Arkansas Valley Research Center in Rocky Ford with the yellow variety 'X202'. Plots at this site were 40" wide by 25 feet in length, separated by a single untreated spreader row. All treatments were applied in 25 gallons per acre water at 32 psi with 8002 flat-fan nozzles (3 per bed of2 onion lines). The experiment was a randomized complete block design with 4 replicates.
Both fields were furrow irrigated and grown according to local recommendations.
Rocky Ford and ARDEC Protocol:
Treatments: 1. Untreated Control 2. Dithane DF + Kocide 2000 3. Cuprofix MZ DF 4. NuCop 50 DF + Dithane DF + Latron 5. NuCop 3L + Dithane DF + Latron
Treatment Application Dates:
ARDEC (1) 29 July (2) 5 August (3) 12 August (4) 19 August (5) 25 August ( 6) 1 September (7) 9 September (8) 18 September (9) 23 September
Rocky Ford (1) 1 July (2) 8 July (3) 16 July (4) 23 July (5) 30 July (6) 6 August (7) 14 August (8) 20 August (9) 27 August
Disease Notes and Evaluations:
Product/ Acre (unless otherwise stated):
3.361b/A + 1.5 lb/A 7.25 lb/A 2 lb/A + 3.361b/A + 0.5% (v/v) 2.67 pt!A + 3.36lb/A + 0.5%(v/v)
Plot Inoculations: I 08cfulml Xanthomonas campestris
ARDEC (1) 24 August (2) 29 August
Rocky Ford (1) 13 August (2) 26 August
9/2/02 Rocky Ford, First disease evaluation. Percent foliage infected or killed from bacterial disease complex and/or phytotoxicity
9117101 Rocky Ford, 20 bulbs from each plot were collected and stored at 70°F for curing and later storage rot evaluation.
52
Results: Yields were not measured at Rocky Ford or ARDEC because d,isease pressure was not intel\se enough to separate the effects of bactericide treatments. Severe drought conditions unfavorable to disease development dominated most of the season at ARDEC and Rocky Ford slid allowed little secondary spread ofXanthomonas. No treatment resulted in any visible'phytotoxicity or growth effects.
ACKNOWLEDGEMENTS: We gratefully acknowledge: the assistance of Mike Bartolo and Frank Schweissing at Rocky Ford and ARDEC staff. Partial financial assistance from the CSU Agr; Experiment Station, Arkansas Valley Growers and Shippers Associaiionj Colorado Onion Association, Cerexagri and MicroFio Company, LLC is also'ackhowledged and appreciated.
.;:
53
2002 Onion- Bactericide Spray Timing Study October 29, 2002
Dr. Howard F. Schwartz and David H. Gent, Dept. of Bioagricultural Sciences and Pest Management, Colorado State University, Fort Collins, CO 80523-1177
Objective: The objective of this study was to evaluate the effectiveness of new fungicides and bactericides in controlling the primary bacterial diseases in Colorado, including Xanthomonas Leaf Blight (Xanthomonas campestris), Sour Skin (Burkholderia cepacia), Slippery Skin (B. gladioli pv. al/iicola), Bacterial Soft Rot (Erwinia carotovora subsp. carotovora), and Pantoea blight/Soft Rot (Pantoea ananitas).
Experimental Design: This study was conducted at the Arkansas Valley Research Center in Rocky Ford with the yellow variety 'X202'. Plots at this site were 40" wide by 60 feet in length, separated by a single untreated spreader row. All treatments were applied in 25 gallons per acre water at 32 psi with 8002 flatfan nozzles (2 per bed of 2 onion lines). The experiment was a randomized split-block design with 4 replicates. The main plot received 1.5 lb/A Kocide 2000 and the subplots, each 15 feet in length, received 0.5, 1.0, or 2.0 lb/A Maneb 75 DF. Sprays programs were initiated on a weekly staggered scheduled that began 4 weeks pre-bulbing to 2 weeks post-bulbing. The field was furrow irrigated and grown according to local recommendations.
Spray Protocol:
Treatments Treatment Application Dates 6/24 7/1 7/8 7/16 7/23 7/30 8/6 8/14 8/20 Total
Snravs I. Untreated Control X X X X X 5
(Maneb only)* 2. 4 weeks ore-bulb X X X X X X X X X 9 3. 3 weeks ore-bulb X X X X X X X X 8 4. 2 weekSPre-bulb X X X X X X X 7 5. 1 week ore-bulb X X X X X X 6 6. BulbiM X X X X X 5 7. 1 week post-bulb X X X X 4 8. 2 week oost-bulb X X X 3 *Treatments 2 to 8 mcluded Koc1de 2000 at 1.5 lb/ A
Results: No natural epidemics of bacterial leaf blights developed in 2002. Therefore, no inferences can be made about either the timing of sprays or the effect of maneb rate on Kocide 2000 enhancement of bacterial disease suppression. This study will be repeated in 2003.
ACKNOWLEDGEMENTS: We gratefully acknowledge the assistance of Mike Bartolo and Frank Schweissing at Rocky Ford and ARDEC staff. Partial fmancial assistance from the CSU Agr. Experiment Station, Arkansas Valley Growers and Shippers Association, and the Colorado Onion Association is also acknowledged and appreciated.
54
2002 Onion- New and Biological Bactericide Study October 29, 2002
Dr. Howard F. Schwartz and David H. Gent, Dept. of Bioagricultural Sciences and Pest Management, Colorado State University, Fort Collins, CO 80523-1177
Objective: The objective of this study was to evaluate the effectiveness of new fungicides and bactericides in controlling the primary bacterial diseases in Colorado, including Xanthomonas Leaf Blight (Xanthomonas campestris), Sour Skin (Burkholderia cepacia), Slippery Skin (B. gladioli pv. alliicola), Bacterial Soft Rot (Erwinia carotovora subsp. carotovora), and Pantoea blight/Soft Rot (Pantoea ananitas).
Exoerimental Design: Direct seeded onion plots were established at ARDEC in Fort Collins with the yellow onion variety 'Vantage'. All treatments were applied in 25 gallons of water per acre with a C02
backpack at 32 psi pressure, using Teejet 8002 flat-fan nozzles (2 per bed of 2 onion lines). Plots were 2 rows 30" wide by 30 feet in length with an untreated spreader row separating each treatroent.The experiment was a randomized split-block design with 4 replicates. ManKocide at 2 lb/A was applied to the sub-plot beginning two weeks prebulbing.
This study was replicated at the Arkansas Valley Research Center in Rocky Ford with the yellow variety 'X202'. Plots at this site were 40" wide by 30 feet in length, separated by a single untreated spreader row. All treatments were applied in 25 gallons per acre water at 32 psi with 8002 flat-fan nozzles (3 per bed of 2 onion lines). The experiment was a randomized split-block design with 4 replicates. ManKocide at 2 lb/A was applied to the sub-plot beginning two weeks prebulbing.
Both fields were furrow irrigated and grown according to local reconunendations. All treatments were applied according to label reconunendations.
Rocky Ford and ARDEC Protocol:
Application Dates: Main Plot Treatments: Rocky Ford ARDEC I. Untreated Control (-) H 2. Kocide 2000 7/I, 7/8, 7/16, 7123, 7/8, 7129, 8/5, 8/12,
7/30, 8/6, 8/14, 8/20, 8/19, 8125, 9/I, 9/9, 8127 9/18, 9123
3. ZnS04 7/1, 7/8, 7/16, 7123, 7/8, 7/29, 8/5, 8112, 7/30, 8/6, 8/14, 8/20, 8/19, 8125, 9/1, 9/9, 8127 9/18, 9123
4. FeCI (6H20) 7/1, 7/8, 7/I6, 7/23, 718, 7/29, 8/5, 8/12, 7/30, 8/6, 8/I 4, 8/20, 8/I9, 8125, 9/I, 919, 8/27 9/18, 9123
5. Messenger 514, 5/I7, 6/1, 6/15, 6/29, 7/I5, 7129, 8/12, 6/24, 7/8, 7/16, 7123, 8/25, 9/9, 9/23 8/6, 8120, 8127
6. Actigard 7/I, 7/8, 71l6, 7/23, 7/8, 7/29, 8/5, 8/12, 7/30, 8/6, 8/14, 8/20, 8/19, 8125, 9/I, 9/9, 8/27 9/18,9/23
7. Milsana 7/1,7/8, 7/I6, 7123, 6/24, 7/8, 7129, 8/5, 7/30, 8/6, 8/14, 8120, 8/12, 8/19, 8/25, 9/I, 8127 9/9,9/18,9123
8. Plant Growth 514,6124 514, 7/29 Promoting Rhizobacter
55
Rate: (-) 1.5 lb/A
1.0 lb/A
22.9 g!A
6oz/A
0.75 oz/A
I pt/A
ARDEC: seed treatment and prebulb foliar spray at 1% Rocky Ford: seedling and prebulb foliar sprays at 1% (v/v)
9. Pantoea 7/1, 7/8, 7116 8/5, 8/25 108 cfu/ml agglomerans C9-t 10. Effersan 711, 7/8, 7116, 7/23, 7/8, 7/29, 8/5, 8/12, 200 ppm
7/30, 8/6, 8114, 8/20, 8119, 8/25,911, 919, 8/27 9/18, 9/23
Split Plot Treatments: 11. ManKocide 7/1, 7/8, 7116, 7/23, 7/8, 7/29, 8/5, 8/12, 2.0 lb/A
7/30, 8/6, 8114, 8/20, 8119,8/25,9/1,9/9, 8/27 9118,9/23
12. Kocide 2000 + 7/1, 7/8, 7116, 7/23, 7/8, 7/29, 8/5, 8/12, 1.5 lb/ A + 2.0 lb/ A ManKocide 7/30, 8/6, 8/14, 8/20, 8119, 8/25, 9/1, 9/9,
8/27 9118, 9/23 13. znso.+ 7/1, 7/8, 7116, 7/23, 7/8, 7/29, 8/5, 8/12, 1.0 lb/ A + 2.0 lb/ A ManKocide 7/30, 8/6, 8114, 8/20, 8119,8/25,9/1,9/9,
8/27 9118, 9/23 14. FeCI (6H20) + 7/1, 7/8, 7116, 7/23, 7/8, 7/29, 8/5, 8112, 22.9 gl A + 2.0 lb/ A ManKocide 7/30, 8/6, 8/14, 8/20, 8119,8/25,911,919,
8/27 9118, 9/23 15. Messenger+ 7/1, 7/8, 7116, 7/23, 7/8, 7/29, 8/5, 8/12, 6 oz!A + 2.0 lb/A ManKocide 7/30, 8/6, 8/14, 8/20, 8119,8/25,9/1,9/9,
8/27 9118, 9/23 16. Actigard + 7/1, 7/8, 7/16, 7/23, 7/8, 7/29, 8/5, 8/12, 0.75 oz!A + 2.0 lb/A ManKocide 7/30, 8/6, 8/14, 8/20, 8119,8/25.9/1,9/9,
8/27 9118, 9/23 17. Milsana + 7/1, 7/8, 7116, 7/23, 7/8, 7/29, 8/5, 8/12, I pt/A + 2.0 lb/A ManKocide 7/30, 8/6, 8114, 8/20, 8/19,8/25,9/1,9/9,
8/27 9118, 9/23 18. Plant Growth 7/1, 7/8, 7/16, 7/23, 7/8. 7/29, 8/5, 8/12, 1% v/v + 2.0 lb/A Promoting 7/30, 8/6, 8/14, 8/20, 8/19,8/25,9/1,9/9,
Rhizobacter + 8/27 9/18, 9/23 ManKocide 19. Pantoea 7/1, 7/8, 7116, 7/23, 718. 7/29, 8/5, 8/12, 1 o' cfu/ml + 2.0 lb/ A agglomerans C9-l 7/30, 8/6, 8114, 8/20, 8119.8/25,9/1,9/9,
+ ManKocide 8127 9118, 9/23 20. Effersan + 7/1, 7/8, 7/16, 7/23, 7/8. 7/29, 8/5, 8/12, 200 ppm + 2.0 lb/ A ManKocide 7/30, 8/6, 8/14, 8/20, 8119, 8/25, 9/1' 9/9,
8/27 9118, 9/23
Spreader Row Inoculations: I 08/ml bacterial cell suspension of Xanthomonas campestris
Rocky Ford (I) 8/13/02 (2) 8/26/02
ARDEC (I) 8/24/02 (2) 8/29/02 (3) 9/07/02
Disease Notes and Evaluations: 9/02/02 Rocky Ford, First disease evaluation. % foliage infected or killed from bacterial disease
complex and/or phytotoxicity
9/17/02
10/28/02
Rocky Ford, harvest, 2 lines x I 0' were topped, sorted according to market class, weighed as lbs/plot, and converted to cwt/ A. 20 bulbs from each plot were collected and stored at 70°C for curing and later storage rot evaluation.
ARDEC, harvest, 2 lines x I 0' were topped, sorted according to market class, weighed as lbs/plot, and converted to cwtl A. 20 bulbs from several plots were collected and stored at 1o•c for curing and later storage rot evaluation.
56
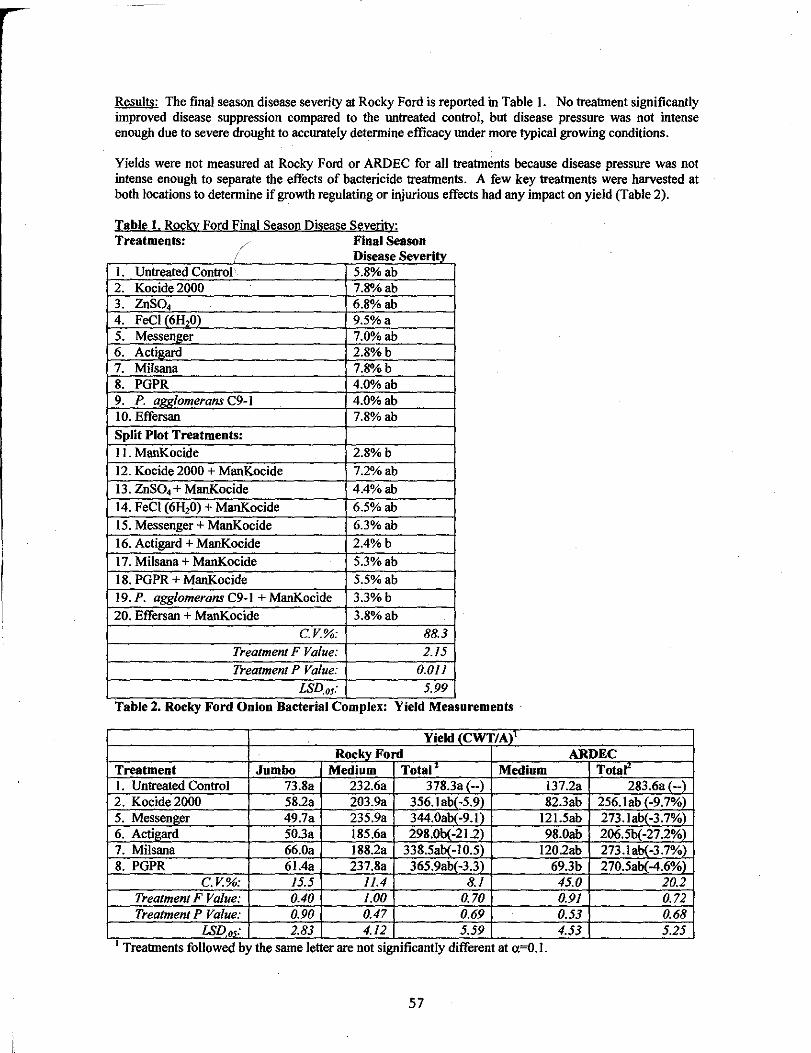
Results: The final season disease severity at Rocky Ford is reported in Table I. No treatment significantly improved disease suppression compared to the untreated control, but disease pressure was not intense enough due to severe drought to accurately detennine efficacy under more typical growing conditions.
Yields were not measured at Rocky Ford or ARDEC for all treatments because disease pressure was not intense enough to separate the effects of bactericide treatments. A few key treatments were harvested at both locations to detennine if growth regulating or ilijurious effects had any impact on yield (Table 2).
Table l. Rockv Ford Final Season Disease Severity: Treatments· Final Season
( Disease Severity I. Untreated Control 5.8%ab 2. Kocide2000 7.8"/o ab 3. znso. 6.8%ab 4. FeCI (6H20) 9.5%a 5. Messenger 7.0%ab 6. Actigard 2.8%b 7. Milsana 7.8%b 8. PGPR 4.0%ab 9. P. a~&lomerans C9-l 4.0%ab 10. Effersan 7.8%ab Split Plot Treatments: II. ManKocide 2.8%b 12. Kocide 2000 + ManKocide 7.2%ab 13. ZnS04 + ManKocide 4.4%ab 14. FeCI (6H20) + ManKocide 6.5% ab 15. Messenger+ ManKocide 6.3%ab 16. Actigard + ManKocide 2.4% b 17. Milsana + ManKocide 5.3%ab 18. PGPR + ManKocide 5.5%ab 19. P. agglomerans C9-I + ManKocide 3.3%b 20. Effersan + ManKocide 3.8%ab
C.V.%: 88.3 Treatment F Value: 2.15 Treatment P Value: 0.011
LSD.os: 5.99
Table 2. Rocky Ford Onton Bactertal Complex: Yteld Measurements ·
Yield (CWT/Aj1
Rocky Ford ARDEC Treatment Jumbo Medium Total, Medium Total' I. Untreated Control 73.8a 232.6a 378.3a_H 137.2a 283.6a (--) 2. Kocide 2000 58.2a 203.9a 356.Iab( -5.9) 82.3ab 256.lab (-9.7%) 5. Messenger 49.7a 235.9a 344.0ab(-9.1) 121.5ab 273.Iab(-3.7o/o}_ 6. Actigard 50.3a I85.6a 298.0b(-21.2) 98.0ab 206.5b(-27.2%) 7. Milsana 66.0a 188.2a 338.5ab(-10.5) 120.2ab 273.lab(-3.7%) 8. PGPR 61.4a 237.8a 365.9ab(-3.3l 69.3b 270.5ab{ -4.6%1_
C.V.%: 15.5 ll.4 8.1 45.0 20.2 Treatment F Value: 0.40 1.00 0.70 0.91 0.72 Treatment P Value: 0.90 0.47 0.69 0.53 0.68
LSD.os: 2.83 4.12 5.59 4.53 5.25 1 Treatments followed by the same letter are not stgntficantly dtfferent at a=O.I.
57
2 %yield increase over untreated control Discussion: Conditions unfavorable to disease development dominated most of tbe season at Rocky Ford and ARDEC and suppressed Xanthomonas leaf blight development in the plots. Less tban 1.6 inches of rain fell from I May to 30 September at Rocky Ford and less tban 6 inches at ARDEC during the same period. Average daily high temperatures varied from 81.9 to 94.9°F at Rocky Ford and 69.6 to 90.1°F at ARDEC from May through September.
ACKNOWLEDGEMENTS: We gratefully acknowledge tbe assistance of Mike Bartolo and Frank Schweissing at Rocky Ford and ARDEC staff. Partial fmancial assistance from tbe CSU Agr. Experiment Station, Arkansas Valley Growers and Shippers Association, and the Colorado Onion Association is also acknowledged and appreciated.
58
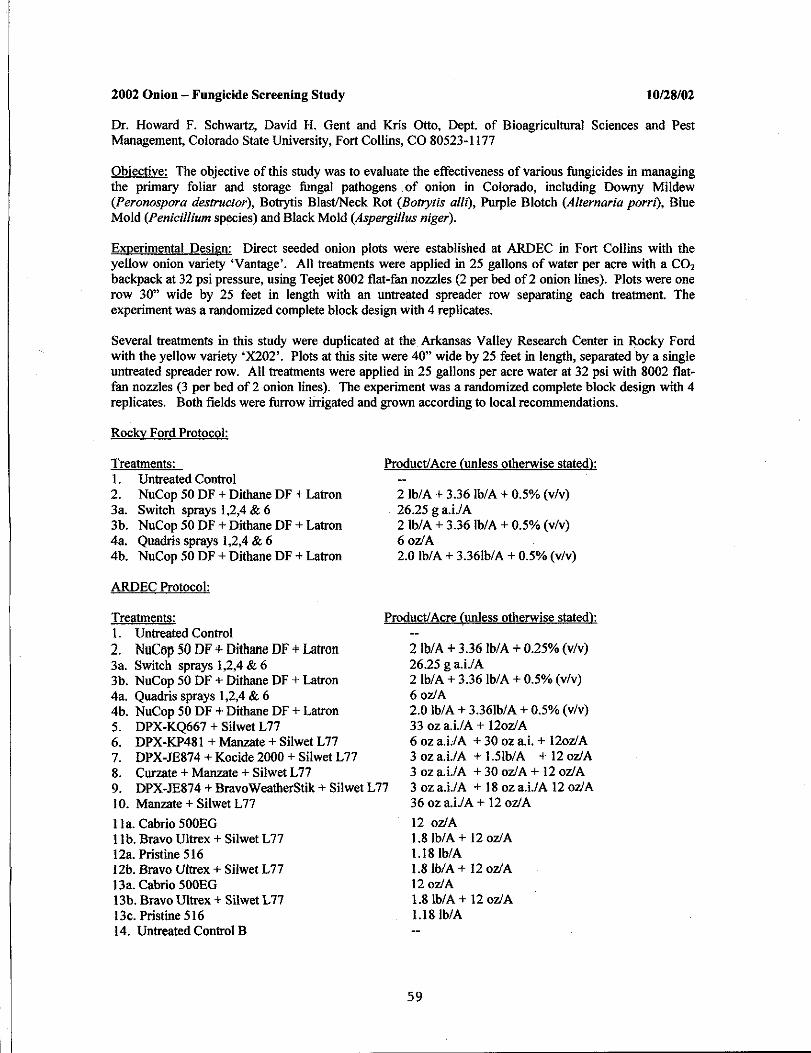
2002 Onion- Fungicide Screening Study 10/28/02
Dr. Howard F. Schwartz, David H. Gent and Kris Otto, Dept. of Bioagricultural Sciences and Pest Management, Colorado State University, Fort Collins, CO 80523-1177
Objective: The objective of this study was to evaluate the effectiveness of various fungicides in managing the primary foliar and storage fungal pathogens . of onion in Colorado, including Downy Mildew (Peronospora destructor), Botrytis Blast/Neck Rot (Botrytis alb), Purple Blotch (Alternaria pom), Blue Mold (Penicillium species) and Black Mold (Aspergillus niger).
Experimental Design: Direct seeded onion plots were established at ARDEC in Fort Collins with the yellow onion variety 'Vantage'. All treatments were applied in 25 gallons of water per acre with a C02
backpack at 32 psi pressure, using Teejet 8002 flat-fan nozzles (2 per bed of2 onion lines). Plots were one row 30" wide by 25 feet in length with an untreated spreader row separating each treatment. The experiment was a randomized complete block design with 4 replicates.
Several treatments in this study were duplicated at the Arkansas Valley Research Center in Rocky Ford with the yellow variety 'X202'. Plots at this site were 40" wide by 25 feet in length, separated by a single untreated spreader row. All treatments were applied in 25 gallons per acre water at 32 psi with 8002 flatfan nozzles (3 per bed of 2 onion lines). The experiment was a randomized complete block design with 4 replicates. Both fields were furrow irrigated and grown according to local recommendations.
Rocky Ford Protocol:
Treatments: I. Untreated Control 2. NuCop 50 DF + Dithane DF + Latron 3a. Switch sprays I ,2,4 & 6 3b. NuCop 50 DF + Dithane DF + Latron 4a. Quadris sprays 1,2,4 & 6 4b. NuCop 50 DF + Dithane DF + Latron
ARDEC Protocol:
Treatments: I. Untreated Control 2. NuCop 50 OF + Oithane OF+ Latron 3a. Switch sprays 1,2,4 & 6 3b. NuCop 50 DF + Dithane DF + Latron 4a. Quadris sprays 1,2,4 & 6 4b. NuCop 50 DF + Dithane DF + Latron 5. DPX-KQ667 + Silwet L77 6. DPX-KP481 + Manzate + Silwet L 77 7. DPX-JE874 + Kocide 2000 + Silwet L77 8. Curzate + Manzate + Silwet L 77
Product/Acre (unless otherwise stated):
2 lb/ A+ 3.36 lb/ A + 0.5% (v/v) 26.25 g a.i./A 2lb/A + 3.36lb/A + 0.5% (v/v) 6oz/A 2.0 lb/A + 3.36lb/A + 0.5% (v/v)
Product/Acre (unless otherwise stated):
2lb/A + 3.36lb/A + 0.25% (v/v) 26.25 g a.i./A 2 lb/A + 3.36lb/A + 0.5% (v/v) 6oz/A 2.0 lb/A + 3.36lb/A + 0.5% (v/v) 33 oz a.i./A + 12oz/A 6 oz a.L/A + 30 oz a.i. + 12oz/A 3 oz a.i./A + 1.5lb/A + 12 oz/A 3 oz a.i./A + 30 oz/A + 12 oz/A
9. DPX-JE874 + BravoWeatherStik + Silwet L77 10. Manzate + Silwet L77
3 oza.i./A + 18 oza.i./A 12 oz/A 36 oz a.i.IA + 12 oz/A
II a. Cabrio 500EG II b. Bravo Ultrex + Silwet L 77 12a. Pristine 516 12b. Bravo Ultrex + Silwet L77 13a. Cabrio 500EG 13b. Bravo Ultrex + Silwet L 77 13c. Pristine 516 14. Untreated Control B
12 oz/A 1.8lb/A + 12 oz/A 1.18lb/A 1.8lb/A + 12 oz/A 12 oz/A 1.8 lb/A + 12 oz/A 1.18lb/A
59
Treatment APPlication Dates:
Rocky Ford (I) 8/06/02 (2) 8114/02 (3) 8/20/02 (4) 8127/02
ARDEC (I) 8/12/02 (2) 8/19/02 (3) 8/25/02 (4) . 9/01102 (5) 9/09/02 (6) 9/19/02
Disease Notes and Evaluations:
Plot Inoculations: I 08/ml suspension of Botrytis alii and Alternaria porri
Rocky Ford (I) 8/13/02 (2) 9/10/02
ARDEC (I) 8/30/02
9/17/02 Rocky Ford, 20 bulbs from each plot were collected and stored at 1o•c for curing and later storage rot evaluation.
Results: Disease pressure was very light at Rocky Ford and ARDEC. Only trace amounts ofBotrytis (less than I% disease severity and incidence) were visible after inoculation, presumably because warm, dry conditions dominated throughout the entire season. Yields were not measured at Rocky Ford or ARDEC because disease pressure was not intense enough to separate the effects of fungicide treatments.
Treatments that included Silwet L 77 had visible phytotoxicity in the form ofleaf scalding and tip death after 2 applications, but the phytotoxicity was generally limited to 3 to 5% of the foliage. This is consistent with previous work we have conducted with high rates of organosilicone surfactants on onion.
Storage rot incidence was evaluated on 12-10-02, and there were no significant differences between treatments (average of I - 2 % ) ..
ACKNOWLEDGEMENTS: We gratefully acknowledge the assistance of Mike Bartolo and Frank Schweissing at Rocky Ford and ARDEC staff. Partial financial assistance from the CSU Agr. Experiment Station, Arkansas Valley Growers and Shippers Association, Colorado Onion Association, MicroFio, Dupont Crop Protection, and Syngenta Crop Protection and BASF is also acknowledged and appreciated.
60
'
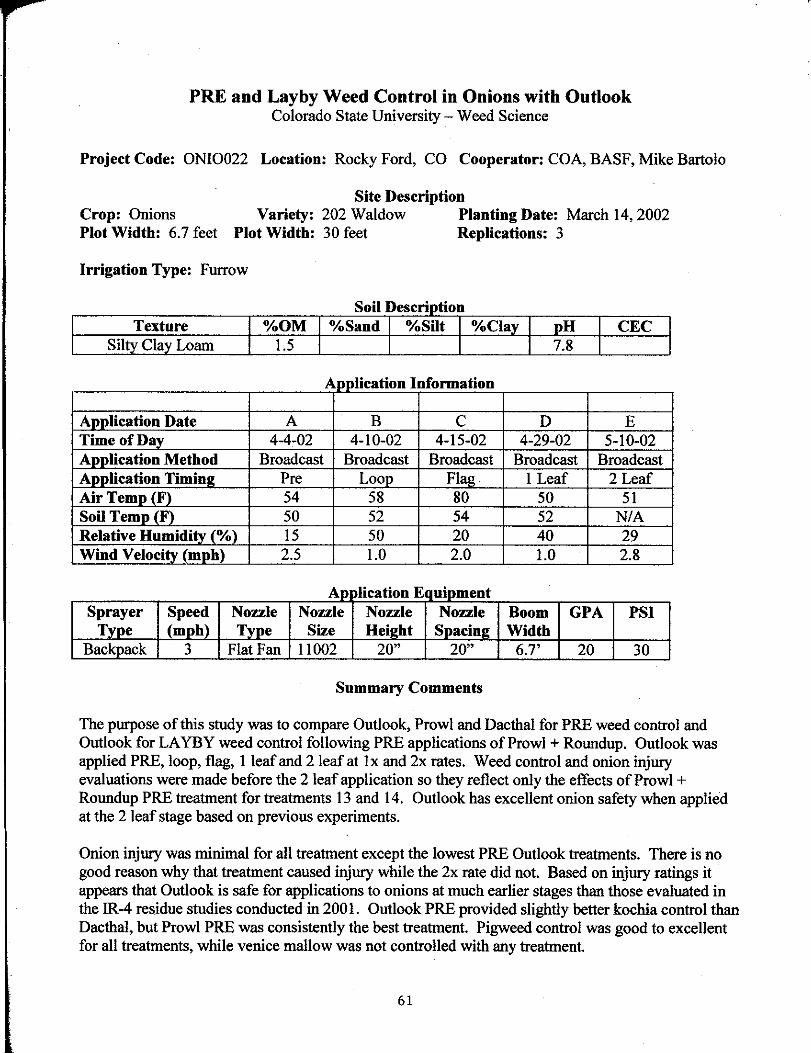
PRE and Layby Weed Control in Onions with Outlook Colorado State University- Weed Science
Project Code: ONI0022 Location: Rocky Ford, CO Cooperator: COA, BASF, Mike Bartolo
Site Description Crop: Onions Variety: 202 Waldow Planting Date: March 14,2002 Plot Width: 6.7 feet Plot Width: 30 feet Replications: 3
Irrigation Type: Furrow
Soil Description Texture %OM %Sand %Silt %Clay pH CEC
SiltY Clav Loam 1.5 7.8
Application I ti n ormation
Annlication Date A B c D E TimeofDav 4-4-02 4-10-02 4-15-02 4-29-02 5-10-02 Aonlication Method Broadcast Broadcast Broadcast Broadcast Broadcast Annlication Timinll Pre Loon Flag I Leaf 2 Leaf AirTemn IF) 54 58 80 50 51 Soil Temo (F) 50 52 54 52 N/A Relative Humiditv (%) 15 50 20 40 29 Wind Velocitv (mnh) 2.5 1.0 2.0 1.0 2.8
Ap lication Equipment Sprayer Speed Nozzle Nozzle Nozzle Nozzle Boom GPA PSI
Tvne (mph) Type Size Hei2ht Spacin2 Width Backpack 3 Flat Fan 11002 20" 20" 6.7' 20 30
Summary Comments
The purpose of this study was to compare Outlook, Prowl and Dacthal for PRE weed control and Outlook for LA YBY weed control following PRE applications of Prowl +Roundup. Outlook was applied PRE, loop, flag, 1 leaf and 2 leaf at lx and 2x rates. Weed control and onion injury evaluations were made before the 2 leaf application so they reflect only the effects of Prowl + Roundup PRE treatment for treatments 13 and 14. Outlook has excellent onion safety when applied at the 2 leaf stage based on previous experiments.
Onion injury was minimal for all treatment except the lowest PRE Outlook treatments. There is no good reason why that treatment caused injury while the 2x rate did not. Based on injury ratings it appears that Outlook is safe for applications to onions at much earlier stages than those evaluated in the IR-4 residue studies conducted in 2001. Outlook PRE provided slightly better kochia control than Dacthal, but Prowl PRE was consistently the best treatment. Pigweed control was good to excellent for all treatments, while venice mallow was not controlled with any treatment.
61
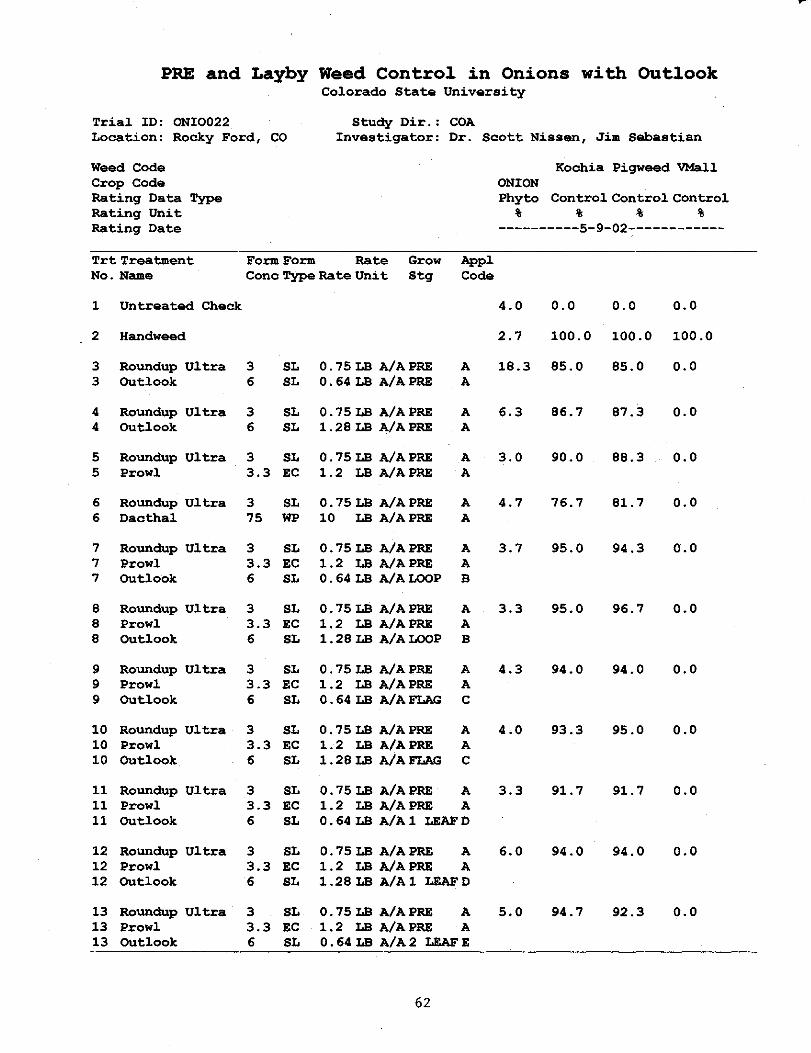
PRE and Layby Weed Contro~ in Onions with Out~ook Colorado State University
Study Dir. : COA Trial ID: ONI0022 Location: Rocky Ford, CO Investigator: Dr. Scott Nissen, Jim Sebastian
Weed Code Crop Code Rating Data Type Rating Unit Rating Date
Trt Treatment No. Name
1 Untreated Check
2 Handweed
Form Form Rate Cono Type Rate Unit
Grow Appl Stg Code
3 Roundup Ultra 3 3 Outlook 6
SL 0.75LB A/APRE SL 0.64LBA/APRE
A A
4 Roundup Ultra 3 4 Outlook 6
SL 0.75LB A/APRE SL 1.28 LB A/A PRE
A A
5 Roundup Ultra 3 SL 5 Prowl 3.3 EC
0. 75 LB A/A PRE 1.2 LB A/APRE
A A
6 Roundup Ultra 3 SL 0.75LB A/APRE 6 Daothal 75 WP 10 LB A/A PRE
A A
7 7 7
Roundup Ultra Prowl Outlook
8 Roundup Ultra 8 Prowl 8 Outlook
9 Roundup Ultra 9 Prowl 9 Outlook
10 Roundup Ultra 10 Prowl 10 Outlook
11 Roundup Ultra 11 Prowl 11 Outlook
12 Roundup Ultra 12 Prowl 12 Outlook
13 Roundup Ultra 13 Prowl 13 Outlook
3 SL 3.3 EC 6 SL
3 SL 3.3 EC 6 SL
3 SL 3.3 EC 6 SL
3 SL 3.3 EC 6 SL
3 SL 3.3 EC 6 SL
3 SL 3.3 EC 6 SL
3 SL 3.3 EC 6 SL
0.75LB A/APRE A 1.2 LB A/APRE A 0. 64 LB A/A LOOP B
0.75LB A/APRE A 1.2 LB A/APRE A 1.28LB A/ALOOP B
0.75LB A/APRE A 1.2 LB A/APRE A 0.64 LB A/A FLAG C
0. 75 LB A/A PRE A 1.2 LB A/APRE A 1.28LB A/AFLAG C
0.75LB A/APRE A 1.2 LB A/APRE A 0.64 LB A/Al LEAFD
0.75LB A/APRE A 1.2 LB A/APRE A 1.28 LB A/A 1 LEAF D
0.75LB A/APRE A 1.2 LB A/APRE A 0.64 LB A/A2 LEAFE
62
Koohia Pigweed VMall ONION Phyto Control Control Control
% % % % ----------5-9-02------------
4.0 0.0 0.0 o.o
2.7 100.0 100.0 100.0
18.3 85.0 85.0 o.o
6.3 86.7 87.3 o.o
3.0 90.0 88.3 o.o
4.7 76.7 81.7 0.0
3.7 95.0 94.3 0.0
3.3 95.0 96.7 o.o
4.3 94.0 94.0 0.0
4.0 93.3 95.0 0.0
3.3 91.7 91.7 0.0
6.0 94.0 94.0 o.o
5.0 94.7 92.3 0.0
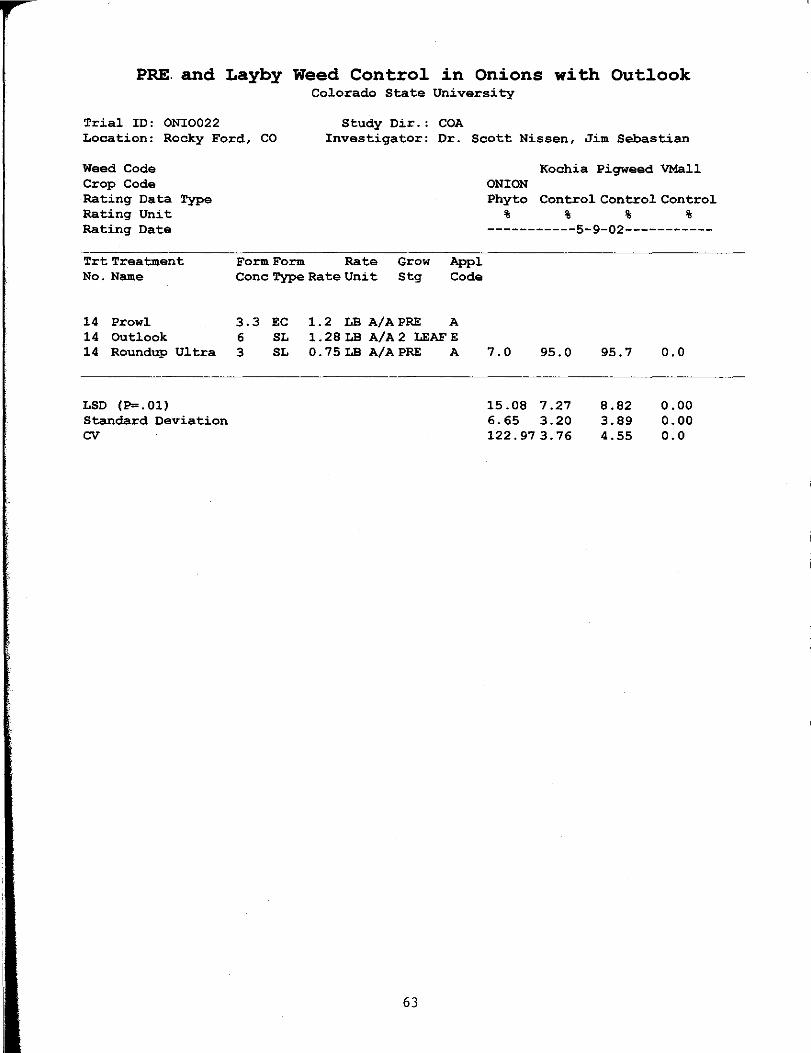
PRE. and Layby Weed Contro1 in Onions with Out1ook Colorado State University
Study Dir. : COA Trial ID: ONI0022 Location: Rocky Ford, CO Investigator: Dr. Scott Nissen, Jim Sebastian
Weed Code Crop Code Rating Data Type Rating Unit Rating Date
Trt Treatment No. Name
14 Prowl 14 Outlook 14 Roundup U1 tra
LSD (P=. 01) Standard Deviation cv
Form Form Rate Cone Type Rate Unit
Grow Appl Stg Code
3.3 EC 6 SL 3 SL
1. 2 LB A/ A PRE A 1. 28 LB A/A 2 LEAF E 0. 75 LB A/A PRE A
63
Kochia Pigweed VMall ONION Phyto Control Control Control
% % % % -----------5-9-02-----------
7.0 95.0
15.08 7.27 6.65 3.20 122.973.76
95.7
8.82 3.89 4.55
0.0
0.00 0.00 0.0
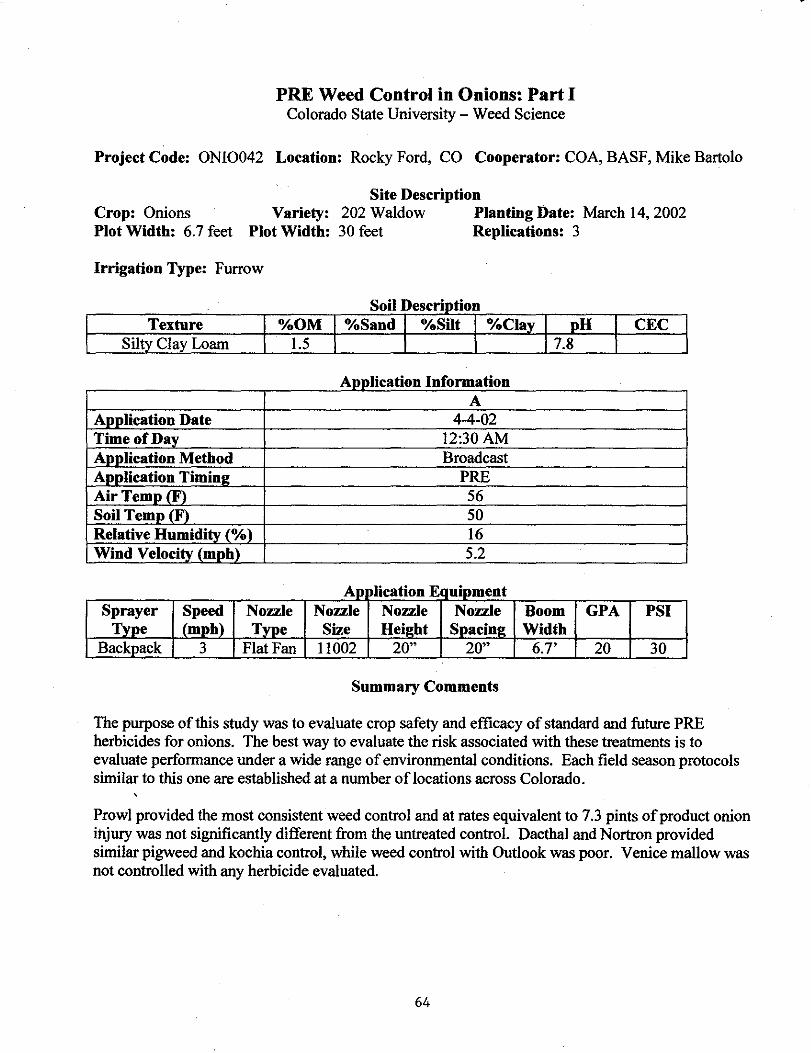
PRE Weed Control in Onions: Part I Colorado State University- Weed Science
Project Code: ONI0042 Location: Rocky Ford, CO Cooperator: COA, BASF, Mike Bartolo
Site Description Crop: Onions Variety: 202 Waldow Planting Date: March 14,2002 Plot Width: 6.7 feet Plot Width: 30 feet Replications: 3
Irrigation Type: Furrow
01 escnp11on S "I D . f Texture %OM %Sand %Silt %Clay pH CEC
Silty Clay Loam 1.5 7.8
>ppnca 10n n onna on Al"fifi ti .
A Application Date 4-4-02 TimeofDay !2:30AM Application Method Broadcast Application Timin2 PRE Air Temp (F) 56 Soil Temp (F) 50 Relative Humidity (%) 16 Wind Velocity (mph) 5.2
'PI JCa IOn A r f E qu1pment Sprayer Speed Nozzle Nozzle Nozzle Nozzle Boom GPA PSI _Type (m_ph) Type Size Height Spacing Width
Backpack 3 Flat Fan 11002 20" 20" 6.7' 20 30
Summary Comments
The purpose of this study was to evaluate crop safety and efficacy of standard and future PRE herbicides for onions. The best way to evaluate the risk associated with these treatments is to evaluate performance under a wide range of environmental conditions. Each field season protocols similar to this one are established at a number oflocations across Colorado.
Prowl provided the most consistent weed control and at rates equivalent to 7.3 pints of product onion injury was not significantly different from the untreated control. Dacthal and Nortron provided similar pigweed and kochia control, while weed control with Outlook was poor. Venice mallow was not controlled with any herbicide evaluated.
64
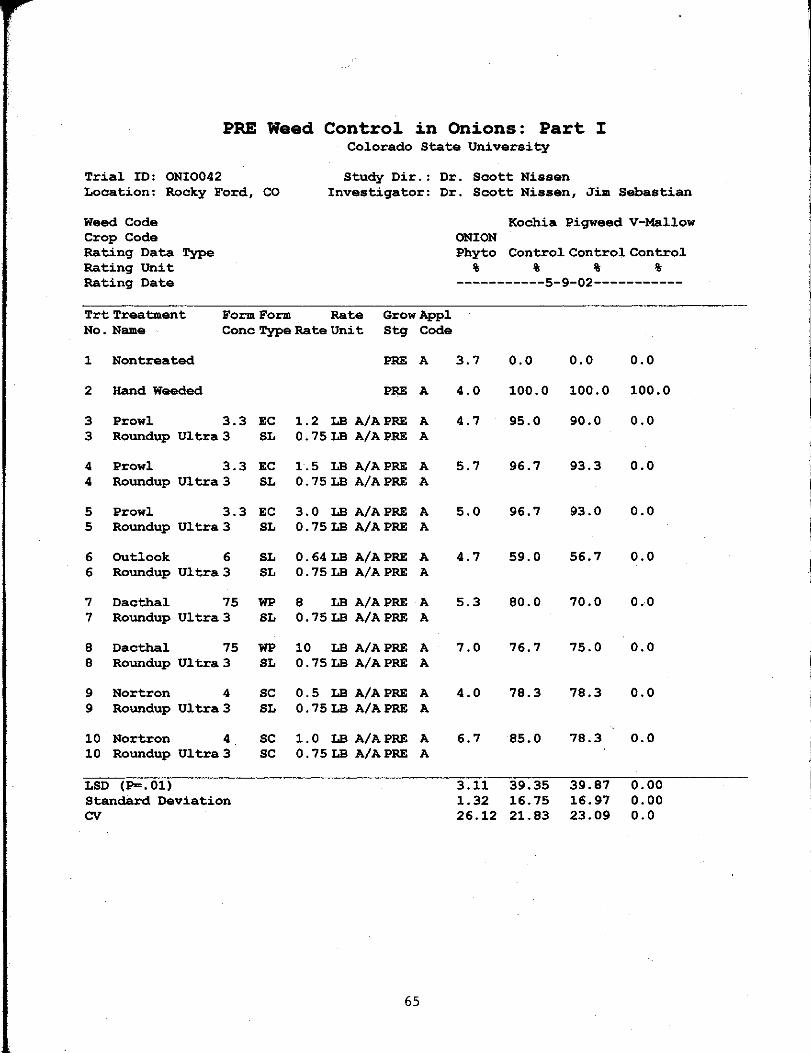
PRE Weed Control. in Onions: Part I Colorado State University
Trial ID: ONI0042 Study Dir.: Dr. Scott Nissen Location: Rocky Ford, co Investigator: Dr. Scott Nissen, Jim Sebastian
Weed Code Kochis Pigweed V-Mallow Crop Code ONION Rating Data Type Phyto Control Control Control Rating Unit % % % % Rating Date -----------5-9-02-----------
Trt Treatment Form Form Rate GrowAppl No. Name Cone Type Rate Unit Stg Code
1 Non treated PRE A 3.7 0.0 0.0 0.0
2 Hand Weeded PIU: A 4.0 100.0 100.0 100.0
3 Prowl 3.3 EC 1.2 LB A/APRE A 4.7 95.0 90.0 0.0 3 Roundup Ultra 3 SL 0.75LB A/APRE A
4 Prowl 3.3 EC 1.5 LB A/APRE A 5.7 96.7 93.3 0.0 4 Roundup Ultra 3 SL 0.75LB A/APRE A
5 Prowl 3.3 EC 3.0 LB A/A PRE A 5.0 96.7 93.0 0.0 5 Roundup Ultra3 SL 0. 75 LB A/A PRE A
6 OUtlook 6 SL 0. 64 LB A/A PRE A 4.7 59.0 56.7 0.0 6 Roundup Ultra 3 SL 0. 75 LB A/A PRE A
7 Dacthal 75 WP 8 LB A/APRE A 5.3 80.0 70.0 0.0 7 Roundup Ultra 3 SL 0. 75 LB A/A PRE A
8 Dacthal 75 WP 10 LB A/APRE A 7.0 76.7 75.0 o.o 8 Roundup Ultra 3 SL 0.75LB A/APRE A
9 Nortron 4 sc 0.5 LB A/A PRE A 4.0 78.3 78.3 0.0 9 Roundup Ultra 3 SL 0. 75 LB A/A PRE A
10 Nortron 4 sc 1.0 LB A/APRE A 6.7 85.0 78.3 0.0 10 Roundup Ultra3 sc 0.75LB A/APRE A
LSD (P=.01) 3.11 39.35 39.87 0.00 Standard Deviation 1.32 16.75 16.97 0.00 cv 26.12 21.83 23.09 0.0
65

Ca11isto Eva1uations for Weed Contro1 in Onions Colorado State University- Weed Science
Project Code: ONI0062 Location: Rocky Ford, CO Cooperator: COA, Mike Bartolo
Site Description Crop: Onions Variety: Plot Width: 6.7 feet Plot Width: 30 feet
Planting Date: 4-11-02 Replications: 3
Irrigation Type: Furrow
01 escnp1 on S"ID "ti Texture o/oOM %Sand %Silt %Clay pH CEC
Silty Clay Loam 1.5 7.8
lPPI ca IOn n onna on A lif Iti ti A B
Application Date 5-10-02 6-21-02 TimeofDay 7:00AM lO:OOAM Application Method Broadcast Broadcast Application Timin11; Post-2 Leaf 6Leaf AirTemp(F) 51 96 Soil Temp (F) - 75 Relative Humidity(%) 29 16 Wind Velocity (mph) 2.9 Average 2to4
•PI 1ca on u1pmen A r ti E t Sprayer Speed Nozzle Nozzle Nozzle Nozzle Boom GPA PSI
Type (mph) Type Size Hei11;ht Spacing_ Width Backpack 3 Flat Fan 11002 20" 20" 6.7' 20 30
Summary Comments
Callisto is a new PRE and POST applied herbicide being developed by Syngenta for weed control in corn. The purpose of this study was to evaluate Callisto as a potential POST product for weed control onions. Callisto controls a wide range ofbroadleafweeds and some grasses. In com, combinations of Atrazine + Callisto have provided excellent weed control. Since Atrazine is photosystem II inhibitor, this study evaluated Callisto alone and in combination with Buctril, another photosystem II inhibitor.
In this study, Callisto appeared to have some crop safety; however, from other locations and greenhouse research root absorption following rainfall can cause severe onion injury. The most interesting thing about this location was that combinations of Callisto + Buctril seemed to be less injurious. Callisto did seem to improve venice mallow control. The fact that Rocky Ford received very little precipitation during the growing season is one reason the onions survived.
66
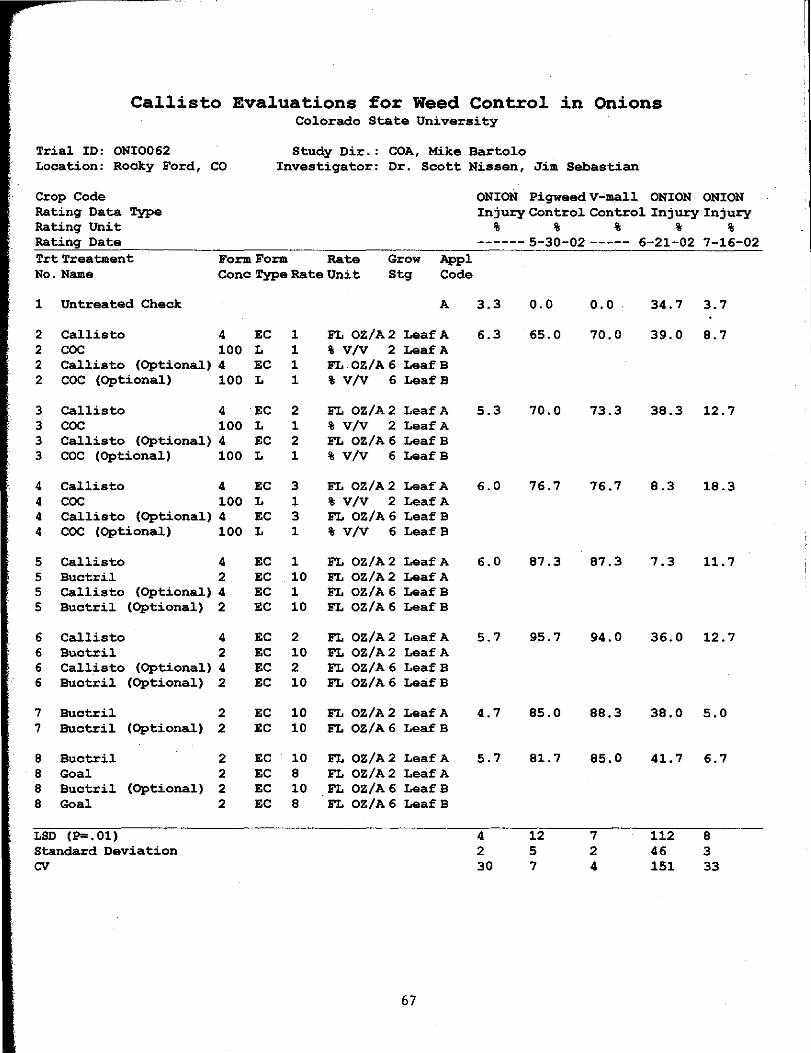
Cal.l.i.sto Eval.uati.ons for Weed Control. i.n Oni.ons Colorado State University
Trial ID: ONI0062 Study Dir.: COA, Mike Bartolo Location: Rocky Ford, co Investigator: Dr. Scott Nissen, Jim Sebastian
Crop Code ONION Pigweed V-mall ONION· ONION Rating Data Type Injury Control Control Injury Injury Rating Unit % % % % % Rating Date ------ 5-30-02 ----- 6-21-02 7-16-02 Trt Treatment Form Form Rate Grow Appl No. Name Cone Type Rate Unit Stg Code
1 Untreated Check A 3.3 0.0 0.0 34.7 3.7
2 Callisto 4 EC 1 FL OZ/A2 Leaf A 6.3 65.0 70.0 39.0 8.7 2 coc 100 L 1 % V/V 2 Leaf A 2 Callisto (Optional) 4 EC 1 FL OZ/A6 LeafB 2 coc (Optional) 100 L 1 % V/V 6 LeafB
3 Callisto 4 EC 2 FL OZ/A2 Leaf A 5.3 70.0 73.3 38.3 12.7 3 coc 100 L 1 % V/V 2 Leaf A 3 Callisto (Optional) 4 EC 2 FL OZ/A 6 LeafB 3 coc (Optional) 100 L 1 % V/V 6 LeafB
4 Callisto 4 EC 3 FL OZ/A2 Leaf A 6.0 76.7 76.7 8.3 18.3 4 coc 100 L 1 % V/V 2 Leaf A 4 Callisto (Optional) 4 EC 3 FL OZ/A 6 LeafB 4 coc (Optional) 100 L 1 % V/V 6 LeafB
5 Callisto 4• EC 1 FL OZ/A2 Leaf A 6.0 87.3 87.3 7.3 11.7 5 Buctril 2 EC 10 FL OZ/A2 Leaf A 5 callisto (Optional) 4 EC 1 FL OZ/A 6 LeafB 5 Buctril (Optional) 2 EC 10 FL OZ/A6 LeafB
6 Callisto 4 EC 2 FL OZ/A2 Leaf A 5.7 95.7 94.0 36.0 12.7 6 Buctril 2 EC 10 FL OZ/A2 Leaf A 6 Callisto (Optional) 4 EC 2 FL OZ/A 6 LeafB 6 Buctril (Optional) 2 EC 10 FL OZ/A6 LeafB
7 Buctril 2 EC 10 FL OZ/A2 Leaf A 4.7 85.0 88.3 38.0 5.0 7 Buctril (Optional) 2 EC 10 FL OZ/A6 LeafB
8 Buctril 2 EC 10 FL OZ/A2 Leaf A 5.7 81.7 85.0 41.7 6.7 8 Goal 2 EC 8 FL OZ/A2 Leaf A 8 Buctril (Optional) 2 EC 10 FL OZ/A6 LeafB 8 Goal 2 EC 8 FL OZ/A6 LeafB
LSD (P=. 01) 4 12 7 112 8 Standard Deviation 2 5 2 46 3 cv 30 7 4 151 33
67

2002 VEGETABLE CROP REPORTS
Mike Bartolo Arkansas Valley Research Center
Colorado State University
C antaloupe are one of the _mainstays of the Arkansas
Valley produce industry. The price for cantaloupe grown for road-side stands and other direct markets is consistently greater early in the season. Therefore, growers may benefit by expanding the traditional marketing period.
· As seen in previous studies, early hybrid varieties used in conjunction with plasticulture techniques can help expand the production period and improve yields for early market melons. This study was an expansion of those trials to determine how early cantaloupes can be produced in the Arkansas Valley using additional combinations of plastic mulches, row covers and hybrid varieties.
The 2002 season was extremely hot and dry. These conditions proved to be ideal for melon production. Yields and quality were some of the best recorded at the Arkansas Valley Research Center (AVRC).
Overall, a combination of clear plastic mulch, clear plastic row covers, fabric covers, and a transplanted early variety provided the earliest harvest with the first fruit being picked on June 28.
Methods This study was conducted at the
AVRC in Rocky Ford. Beds, 45 inches wide and 60 inches between centers, were shaped in early April. Drip lines were placed 1-2 inches from the center of the bed at a depth of 3 inches The test area was then sprayed with a combination of Prefar (Gowan Chemical) and Alanap (Uniroyal Chemical) for weed control. The beds were covered with. clear embossed plastic mulch (Mechanical Transplanter) on April19 using a one-bed mulch layer.
A fresh-market variety, "Earligold" (Hollar Seeds), and two western shipping types, "Nitro" and "Gold Rush" (Harris Moran) were used in these trials. Cantaloupe seeds or four-week-old transplants were set through holes in the plastic mulch in a single row down the center of the bed at an in-row spacing of 18 inches. Each plot was one bed wide (5 feet) and 18 feet long and was replicated three times.
The following twelve production methods were evaluated:
68
1. Earligold transplanted April 22 into clear mulch and covered with a spun-bound polyester fabric plus a perforated row cover.
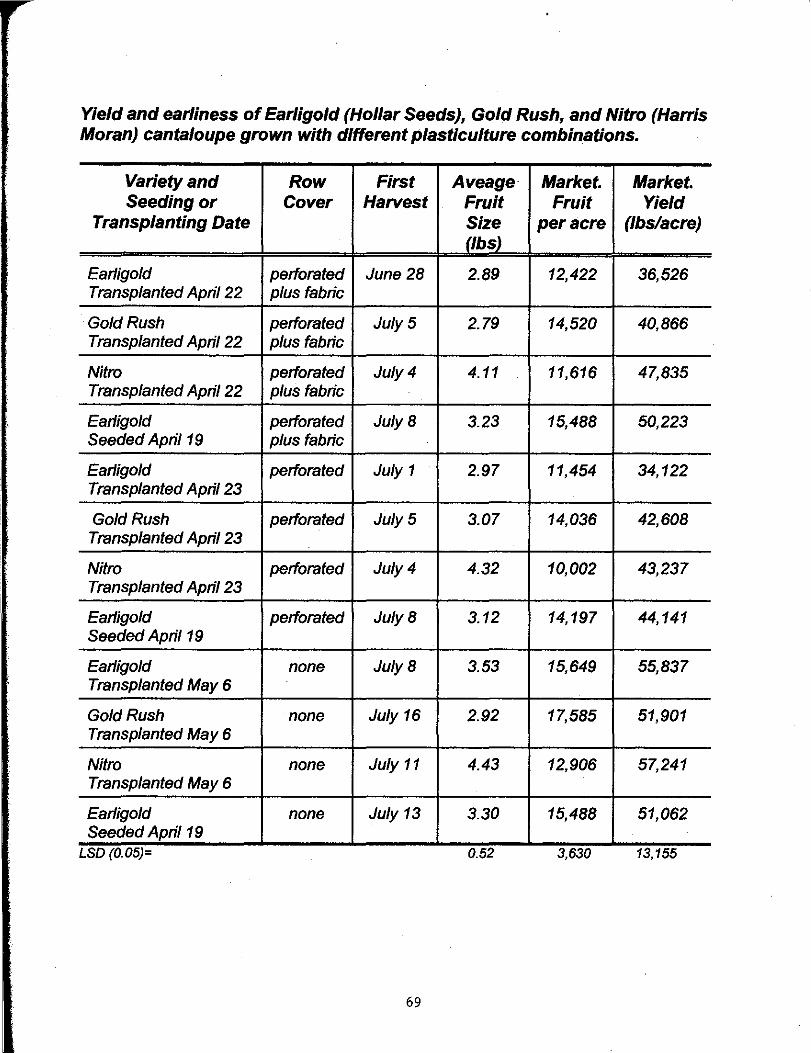
Yield and earliness of Earligold (Hollar Seeds), Gold Rush, and Nitro (Harris Moran) cantaloupe grown with different plasticulture combinations.
Variety and Row First Aveage Market. Market. Seeding or Cover Harvest Fruit Fruit Yield
Transplanting Date Size per acre (lbs/acre) (lbs)
Earligold perforated June28 2.89 12,422 36,526 Transplanted April 22 plus fabric
Gold Rush perforated July5 2.79 14,520 40,866 Transplanted April 22 plus fabric
Nitro perforated July4 4.11 11,616 47,835 Transplanted April 22 plus fabric
Earligold perforated July8 3.23 15,488 50,223 Seeded April19 plus fabric
Earligold perforated July 1 · 2.97 11,454 34,122 Transplanted April 23
Gold Rush perforated July5 3.07 14,036 42,608 Transplanted April 23
Nitro perforated July4 4.32 10,002 43,237 Transplanted April 23
Earligold perforated July8 3.12 14,197 44,141 Seeded April 19
Earligold none July8 3.53 15,649 55,837 Transplanted May 6
Gold Rush none July 16 2.92 17,585 51,901 Transplanted May 6
Nitro none July 11 4.43 12,906 57,241 Transplanted May 6
Earligold none July 13 3.30 15,488 51,062 Seeded April19
LSD (0.05)= 0.52 3,630 13,155
69
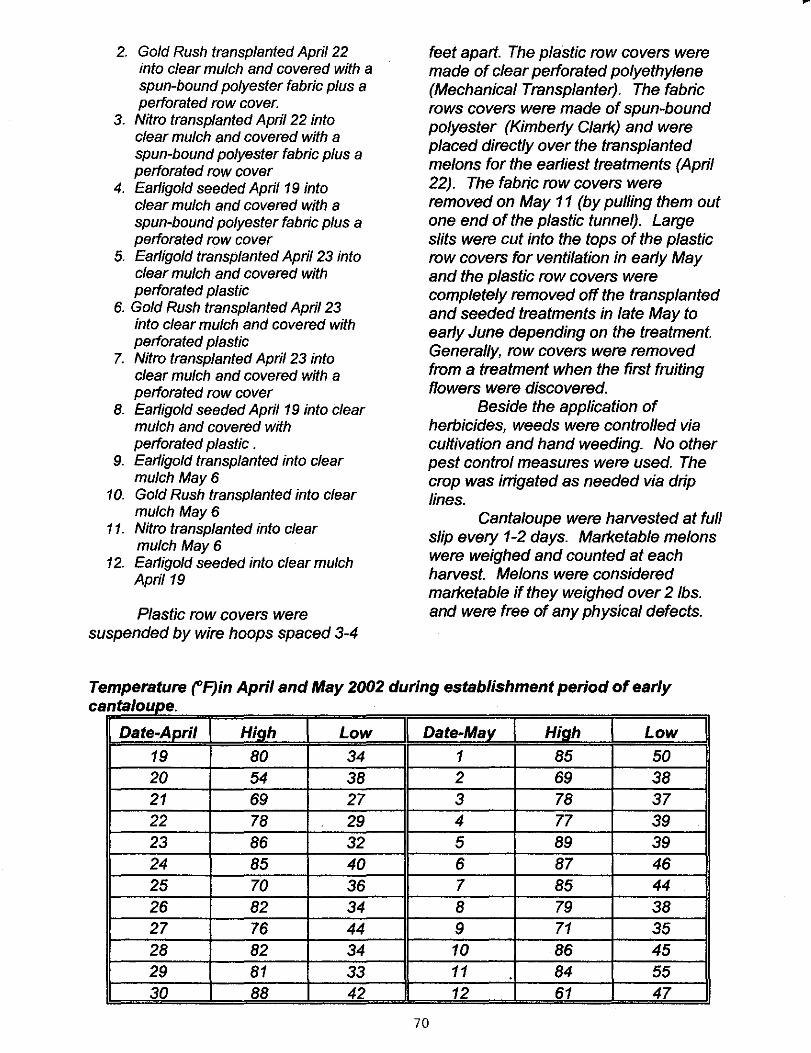
2. Gold Rush transplanted April 22 into clear mulch and covered with a spun-bound polyester fabric plus a perforated row cover.
3. Nitro transplanted April 22 into clear mulch and covered with a spun-bound polyester fabric plus a perforated row cover
4. Earligold seeded April19 into clear mulch and covered with a spun-bound polyester fabric plus a perforated row cover
5. Earligold transplanted April 23 into clear mulch and covered with perforated plastic
6. Gold Rush transplanted April 23 into clear mulch and covered with perforated plastic
7. Nitro transplanted April 23 into clear mulch and covered with a perforated row cover
8. Earligold seeded April 19 into clear mulch and covered with perforated plastic .
9. Earligold transplanted into clear mulch May6
10. Gold Rush transplanted into clear mulch May6
11. Nitro transplanted into clear mulch May6
12. Earligold seeded into clear mulch April19
Plastic row covers were suspended by wire hoops spaced 3-4
feet apart. The plastic row covers were made of clear perforated polyethylene (Mechanical Transplanter). The fabric rows covers were made of spun-bound polyester (Kimberly Clark) and were placed directly over the transplanted melons for the earliest treatments (April 22). The fabric row covers were removed on May 11 (by pulling them out one end of the plastic tunnel). Large slits were cut into the tops of the plastic row covers for ventilation in early May and the plastic row covers were completely removed off the transplanted and seeded treatments in late May to early June depending on the treatment. Generally, row covers were removed from a treatment when the first fruiting flowers were discovered.
Beside the application of herbicides, weeds were controlled via cultivation and hand weeding. No other pest control measures were used. The crop was irrigated as needed via drip lines.
Cantaloupe were harvested at full slip every 1-2 days. Marketable melons were weighed and counted at each harvest. Melons were considered marketable if they weighed over 2 lbs. and were free of any physical defects.
Temperature fF)in April and May 2002 during establishment period of early ca tal n oupe.
Date-April High Low I Date-Ma 'f. I HifJ.h I Low I 19 80 34 1 85 50 20 54 38 2 69 38 21 69 27 3 78 37 22 78 29 4 77 39 23 86 32 5 89 39 24 85 40 6 87 46 25 70 36 7 85 44 26 82 34 8 79 38 27 76 44 9 71 35 28 82 34 10 86 45 29 81 33 11 . 84 55 30 88 42 12 61 47
70
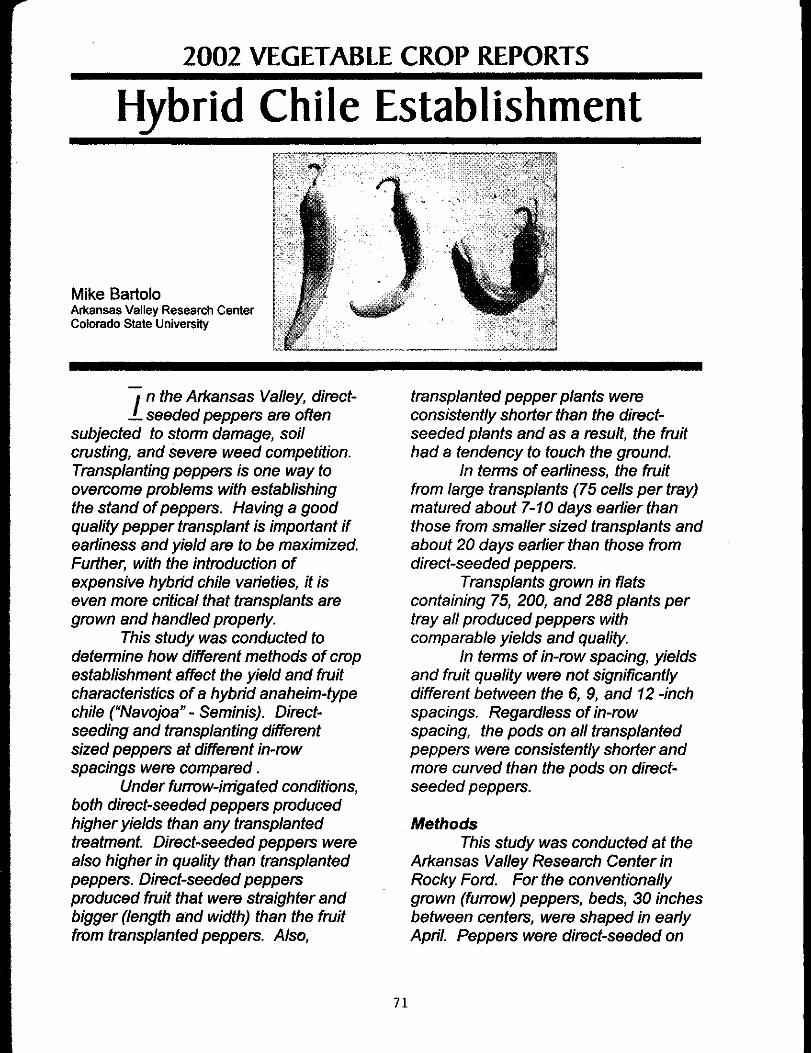
2002 VEGETABLE CROP REPORTS
Hybrid Chile Establishment
Mike Bartolo Arkansas Valley Research Center Colorado State University
f n the Arkansas Valley, direct- seeded peppers are often
subjected to storm damage, soil crusting, and severe weed competition. Transplanting peppers is one way to overcome problems with establishing the stand of peppers. Having a good quality pepper transplant is important if earliness and yield are to be maximized. Further, with the introduction of expensive hybrid chile varieties, it is even more critical that transplants are grown and handled properly.
This study was conducted to determine how different methods of crop establishment affect the yield and fruit characteristics of a hybrid anaheim-type chile ("Navojoa"- Seminis). Directseeding and transplanting different sized peppers at different in-row spacings were compared .
Under furrow-irrigated conditions, both direct-seeded peppers produced higher yields than any transplanted treatment. Direct-seeded peppers were also higher in quality than transplanted peppers. Direct-seeded peppers produced fruit that were straighter and bigger (length and width) than the fruit from transplanted peppers. Also,
transplanted pepper plants were consistently shorter than the directseeded plants and as a result, the fruit had a tendency to touch the ground.
In terms of earliness, the fruit from large transplants (75 cells per tray) matured about 7-10 days earlier than those from smaller sized transplants and about 20 days earlier than those from direct-seeded peppers.
Transplants grown in flats containing 75, 200, and 288 plants per tray all produced peppers with comparable yields and quality.
In terms of in-row spacing, yields and fruit quality were not significantly different between the 6, 9, and 12 -inch spacings. Regardless of in-row spacing, the pods on all transplanted peppers were consistently shorter and more curved than the pods on directseeded peppers.
. Methods
71
This study was conducted at the Arkansas Valley Research Center in Rocky Ford. For the conventionally grown (furrow) peppers, beds, 30 inches between centers, were shaped in early April. Peppers were direct-seeded on
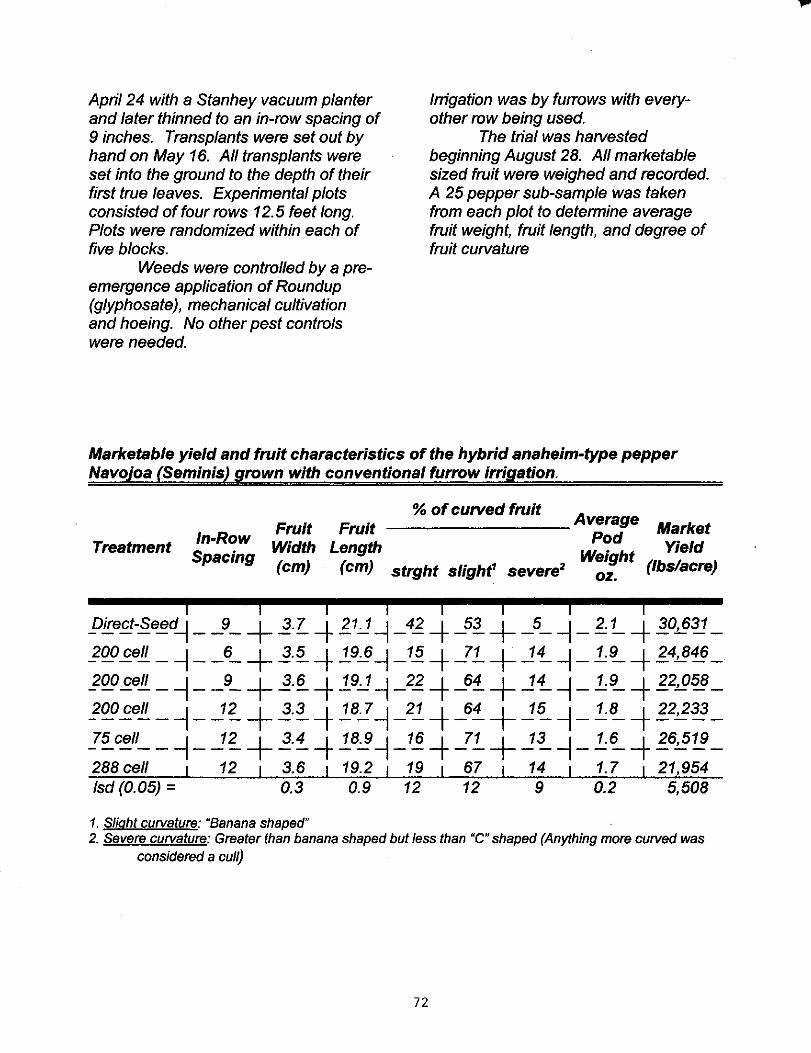
April 24 with a Stanhey vacuum planter and later thinned to an in-row spacing of 9 inches. Transplants were set out by hand on May 16. All transplants were set into the ground to the depth of their first true leaves. Experimental plots consisted of four rows 12.5 feet long. Plots were randomized within each of five blocks.
Weeds were controlled by a preemergence application of Roundup (glyphosate), mechanical cultivation and hoeing. No other pest controls we~e needed.
Irrigation was by furrows with everyother row being used.
The trial was harvested beginning August 28. All marketable sized fruit we~e weighed and ~ecorded. A 25 pepper sub-sample was taken from each plot to determine average fruit weight, fruit length, and degree of fruit curvatu~e
Marketable yield and fruit characteristics of the hybrid anaheim-type pepper Navojoa (Seminis) grown with conventional furrow irrigation.
Treatment In-Row Spacing
Fruit Width (em)
% of curved fruit Fruit _________ Av;r~ge Market
Length We~ght Yield (em) str,.ht slight1 severe2 (lbslacre)
~ oz.
pirect-Seed~ __ 9_ + 1·?..-+ 21~ ~ _42-+ _53+ _5_ ~ _ 2. ?_-+ 30,631_
JOO.E.ell -~--6-+1·5 -+_!.9.6~_15 -+_7.!.+..11...~_1~-+ 24,846_
JOOcell -~--9-+1·£.-+.1.9~~-22 -+-64 +..11...~_1:~-+ 22,058_
}00 .£_ell_~ _ _!?...+~-~-+ !_B. 7 ~ _21-+ _64 + _!~ ~ _ !..:8_-+ 22,233 _
J5 cell __ ~ _ _!?...+ ~-i.-+ :!._8.9 ~ _16-+ _!!.._ + _!~ ~ _ !..:6_-+ 26,519 _
288 cell 12 3.6 19.2 19 67 14 1. 7 21,954 lsd (0.05) = 0.3 0.9 12 12 9 0.2 5,508
1. Slight curvature: "Banana shaped" 2. Severe curvature: Greater than banana shaped but /ass than "C" shaped (Anything more curved was
considered a cu/Q
72
2002 VEGETABLE CROP REPORTS
Mike Bartolo Arkansas Valley Research Center Colorado State University
S ome of the new jalapeno _ varieties are extremely
productive, have a large size, and are resistant to several diseases. Unfortunately, being hybrids, these varieties are expensive. Therefore, growers must use seed sparingly to minimize costs. Precision planting and transplanting are common ways to reduce seed use. Of the two methods, transplanting has the added benefits of ensuring a good stand and allowing more weed control options. Even so, proper handling and placement of pepper transplants is important if yields are to be maximized. Further, when using transplants, it important to consider how transplanted peppers respond to harvesting. In many places, mechanical harvesting is becoming the only economical way to pick jalapeno peppers used for processing. Therefore, it is important to note if transplanting methods alter plant size, shape, and lodging characteristics.
This study, therefore, was conducted to detennine how different methods of crop establishment affect the yield, and fruit and plant characteristics of a hybrid jalapeno .
73
Direct-seeding and transplanting at different in-row spacings were compared.
In the 2002 trial, direct-seeded peppers had slightly higher yields and fruit size than transplanted peppers. Transplants set at a 6, 9, and 12 inch inrow spacing produced similar yields and fruit sizes. All transplants, regardless of in-row spacing, produced peppers plants of approximately the same height yet, significantly shorter than the directseeded peppers. In addition, the fruit were set closer to the ground in transplanted peppers compared to direct-seeded peppers. Unfortunately, shorter plants and fruit close to the ground make the transplanted peppers less amenable to mechanical harvest. Overall, there was no noticeable lodging in any treatment.
Methods This study was conducted at the
Arkansas Valley Research Center in Rocky Ford. Beds, 30 inches between centers, were shaped in early April. The jalapeno pepper, "Grande", (Seminis) was direct-seeded on April 24 with a Earthway hand planter and later thinned
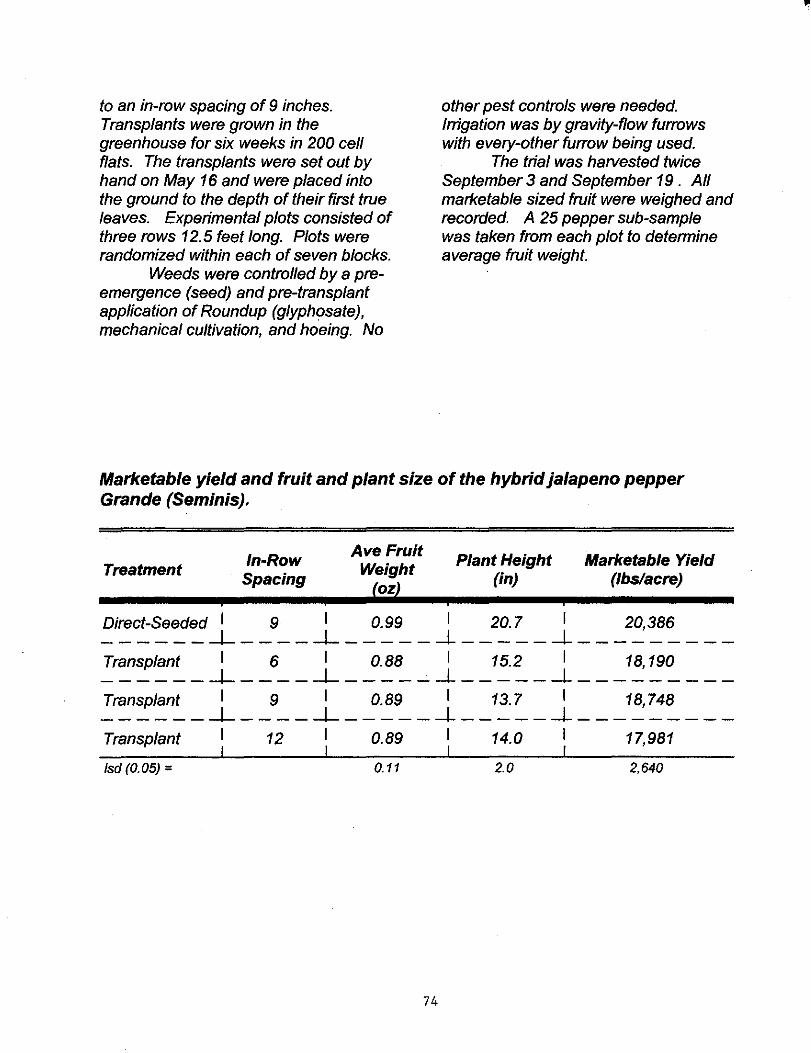
to an in-row spacing of 9 inches. Transplants were grown in the greenhouse for six weeks in 200 cell flats. The transplants were set out by hand on May 16 and were placed into the ground to the depth of their first true leaves. Experimental plots consisted of three rows 12.5 feet long. Plots were randomized within each of seven blocks.
Weeds were controlled by a preemergence (seed) and pre-transplant application of Roundup (glyphosate), mechanical cultivation, and hoeing. No
other pest controls were needed. Irrigation was by gravity-flow furrows with every-other furrow being used.
The trial was harvested twice September 3 and September 19 . All marketable sized fruit were weighed and recorded. A 25 pepper sub-sample was taken from each plot to determine average fruit weight.
Marketable yield and fruit and plant size of the hybrid jalapeno pepper Grande (Seminis).
Treatment In-Row
Spacing
Ave Fruit Weight
(oz)
Plant Height (in)
Marketable Yield (lbslacre)
Direct-Seeded I 9 0.99 20.7 I 20,386 ------ _J__-- _ _J_- ---- _J_---- _ _J__- -------Transplant I 6 I 0.88 I 15.2 I 18,190 ------ _J__ --- _J_ ----- _J_- --- _ _J_- --------Transplant I 9 I 0.89 I 13.7 I 18,748 ----- _ _J__--- _J__- --- _J_ ---- _ _J_--- ------Transplant I 12 I 0.89 I 14.0 I 17,981
lsd (0.05) = 0.11 2.0 2,640
74
2002 VEGETABLE CROP REPORTS
Pepper Stand Reduction Trial
Mike Bartolo Arkansas Valley Research Center Colorado State University
A number of environmental _ conditions can affect the
stand of peppers. Early season soil crusting, wind storms, pests, and diseases may all reduce pepper populations. It is not clear how the yield and market quality of peppers are impacted by changes in plant population.
This study was conducted to determine the yield and quality of a long green chile pepper subjected to different levels of stand reduction at different stages of plant development.
In 2002, the growing season was extremely hot and dry. A shortage of irrigation water in August was detrimental to all pepper treatments. Despite these stressful environmental conditions, pepper yields were good and there were significant differences between treatments.
In general, stand reduction at a later stage of plant development was more detrimental to yield than stand reduction at an early stage. Stand reduction up to 50% of the control still had fairly good yields. On the other hand, a 75% stand reduction severely reduced yields regardless of when the reduction occurred.
75
In terms of pepper pod quality, there was not a significant difference between treatments for pod length and pod weight. Pod width was generally greater in the 50% and 75% stand reduction treatments.
Methods The long green chile variety
"NuMex Joe E. Parker" (Burrell Seeds) was used in this study. Peppers were direct-seeded into 30 inch rows on April 2ZW with a Stanhay vacuum planter. Seeds were placed every 1.2 inches to ensure an adequate stand. Irrigation was by gravity-flow furrows and other production practices were standard for the area.
All treatments were thinned to a uniform in-row spacing of 6 inches on June 17'h. Each plot was 4 rows wide (1 0 ft) and 13 ft long and was replicated four times in the trial. On July !?', the "Early" stand treatments were thinned to remove either 25% , 50%, or 75% of the peppers. The same process occurred for the "Late" treatments on August 7'h . Standard production practices continued for the remainder of the season. Harvest was initiated on September 1 f1h and was completed on October :frl . All marketable pods were

picked and weighed. The weight of a 25 pod sub-sample was recorded to determine average pod weight. In addition, the length and width of five randomly selected pods from each plot were recorded.
This project was generously supported by the National Crop Insurance Services.
Pepper development at the times of stand reduction
Stage of Date Plant Height Developing Leaf number or Development (in) Pods leaf area
EARLY July 5 8-10 0 19-25 leaves per plant
LATE August7 20-25 6-8 2100-2500 cm2
Marketable yield and pod quality of chile peppers (var. NuMex Joe E. Parker) subjected to different levels of stand reduction at two stages of development.
Treatment Average Pod Average Pod Average Pod Marketable Width Length Weight Yield lcm) (em) (ozl (lbslacrel
Control - Early 4.55 19.15 2.43 29,687
25% Reduction - 4.50 19.20 2.46 25,130 Early
50% Reduction - 4.52 19.35 2.40 28,380 Early
75% Reduction- 4.77 19.40 2.48 22,852 Early
Control - Late 4.32 19.35 2.32 30,893
25% Reduction - 4.42 19.00 2.51 28,079 Late
50% Reduction - 4.70 19.05 2.51 26,537 Late
75% Reduction - 4.47 19.30 2.51 16,485 Late
lsd (0.05) 0.24 ns ns 3,696
. 76

2002 VEGETABLE CROP REPORTS
Mike Bartolo Arkansas Valley Research Center Colorado State University
Pumpkins ate an incteasingly important vegetable crop in Colorado. Most pumpkins ate shipped to tetail outlets or ditect-marl<eted through road-side stands or other types of on-farm sales. Almost all of the pumpkins grown in the state are for the decorative/Halloween marl<et.
Pumpkins ate consideted a fairly low input vegetable crop. Accordingly, openpollinated varieties like "Howden" ate sown on most of the acteage. New hybrid varieties, however, may help improve overall production and offer growers alternative strategies to combat powdery mildew.
Despite the sevete lack of adequate irrigation water in 2002, several pumpkin varieties performed exttemely well in the trial. Most notably, "Magic Lantern" (Harris Moran) had good yields and outstanding fruit quality. Further, "Magic Lantern" had good powdery mildew tolerance.
Methods This study was conducted at the
Arl<ansas Valley Research Center (AVRC) in Rocky Ford. Beds, 60 inches between centers, wete shaped in early May.
77
Irrigation was by gravity flow furrows spaced 60 inches apart as well. The test atea was pte-irrigated in late May and then cultivated to help with weed control.
Nine pumpkin varieties wete sown on June 12 with an Earthway hand planter. Each plot was four beds wide (20 feet) and 20 feet long and was teplicated four times.
At the 2-3 leaf stage, the pumpkins wete thinned down to 25 plants per plot for an in-row spacing of approximately 3 feet.
A single application of "Asana" was made to control squash bugs. No other pesticides wete used for the temainder of the season.
The plots wete fully irrigated thtee times and with one final and very brief irrigation in early August.
The pumpkins wete harvested on October 2. All pumpkins that wete less than 25% gteen, firm, and free of any physical defects wete consideted marl<etable. Total fruit weight and numbers wete tecorded.
Please contact the AVRC at (719)254-6312 with any questions concerning the tesults.
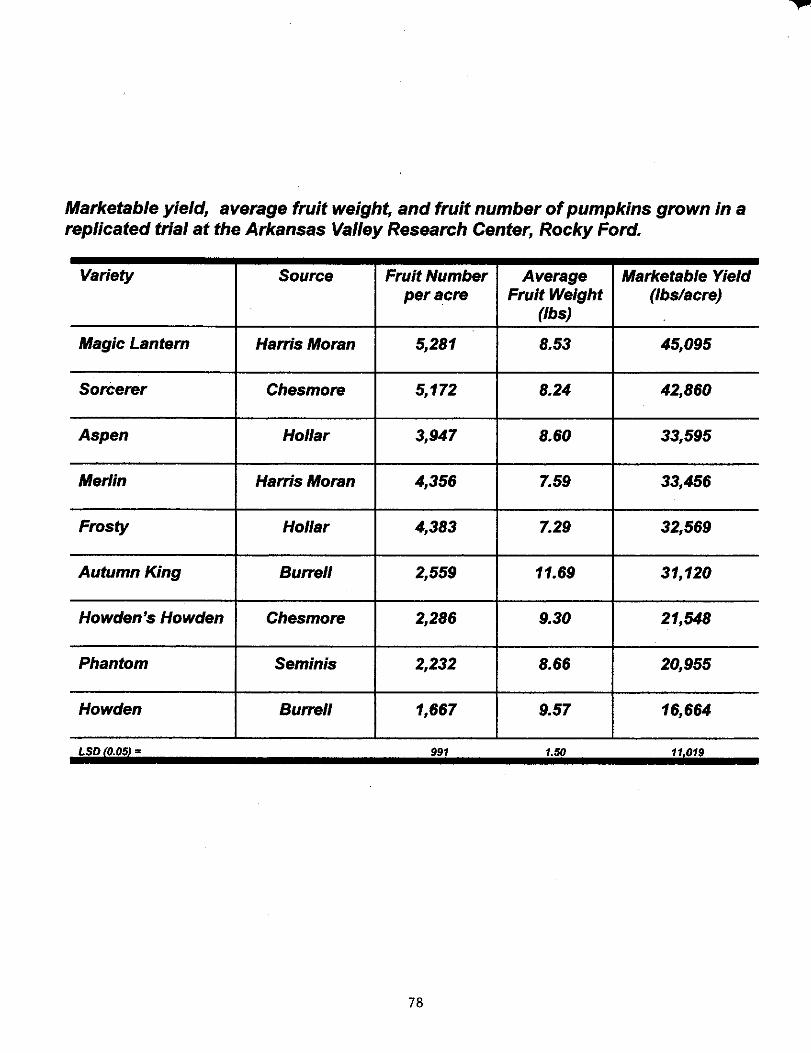
Marketable yield, average fruit weight, and fruit number of pumpkins grown in a replicated trial at the Arkansas Valley Research Center, Rocky Ford.
Variety Source Fruit Number Average Marketable Yield per acre Fruit Weight (lbslacre)
(lbs)
Magic Lantern Harris Moran 5,281 8.53 45,095
Sorcerer Chesmore 5,172 8.24 42,860
Aspen Hollar 3,947 8.60 33,595
Merlin Harris Moran 4,356 7.59 33,456
Frosty Hollar 4,383 7.29 32,569
Autumn King Burrell 2,559 11.69 31,120
Howden's Howden Chesmore 2,286 9.30 21,548
Phantom Seminis 2,232 8.66 20,955
Howden Burrell 1,667 9.57 16,664
LSD(0.05/ = 991 1.50 11,019
78
2002 VEGETABLE CROP REPORTS
Tomato Spacing Trial
Mike Bartolo Arkansas Valley Research Center Colorado State University
A number of hybrid tomato _ varieties have proven to be
vel}' productive in the Arkansas Valley. Locally, some tomatoes are still directseeded. However, the high cost of hybrid seed makes direct-seeding increasingly cost-prohibitive and transplanting more economical. Accordingly, it is important to know what are the optimum production conditions for transplanted hybrid tomatoes. This study, therefore, was conducted to determine how different plant populations affect the yield, earliness and fruit characteristics of a hybrid tomato grown under intensive production conditions.
Methods The tomato variety "Sunbrite"
(Seminis) was transplanted through black plastic mulch on May 14. Mulched beds were on 60 inch centers and had a covered surface of 32 inch. Tomatoes were placed in a single row down the center of the bed at either a 9 or an 18 in-row spacing. These spacings corresponded to 11616 and 5808 plants per acre.
79
The crop was irrigated via drip lines placed 3 inches below the soil surface and down the center of the bed. The tomatoes were pruned but were not staked. Each plot was 15 feet long and one bed (5 feet) wide and was replicated four times. The plots were harvested eight times, beginning on August 6 and ending September 2'. Tomatoes were considered marketable if they were at least 5 oz. and free of any physical defects (cracks, rots).
Results and Discussion The season, in general, was
extremely hot and dl}' and there was a significant infection by curly top virus. Despite the environmental conditions, the tomatoes grew fairly well.
Overall, marketable yields were not significantly different between the 9 and 18 inch in-row spacings. The 18-inch in-row spacings gave rise to slightly larger tomatoes, although the differences were not significant (P~0.05). Earliness was approximately the same in both treatments.
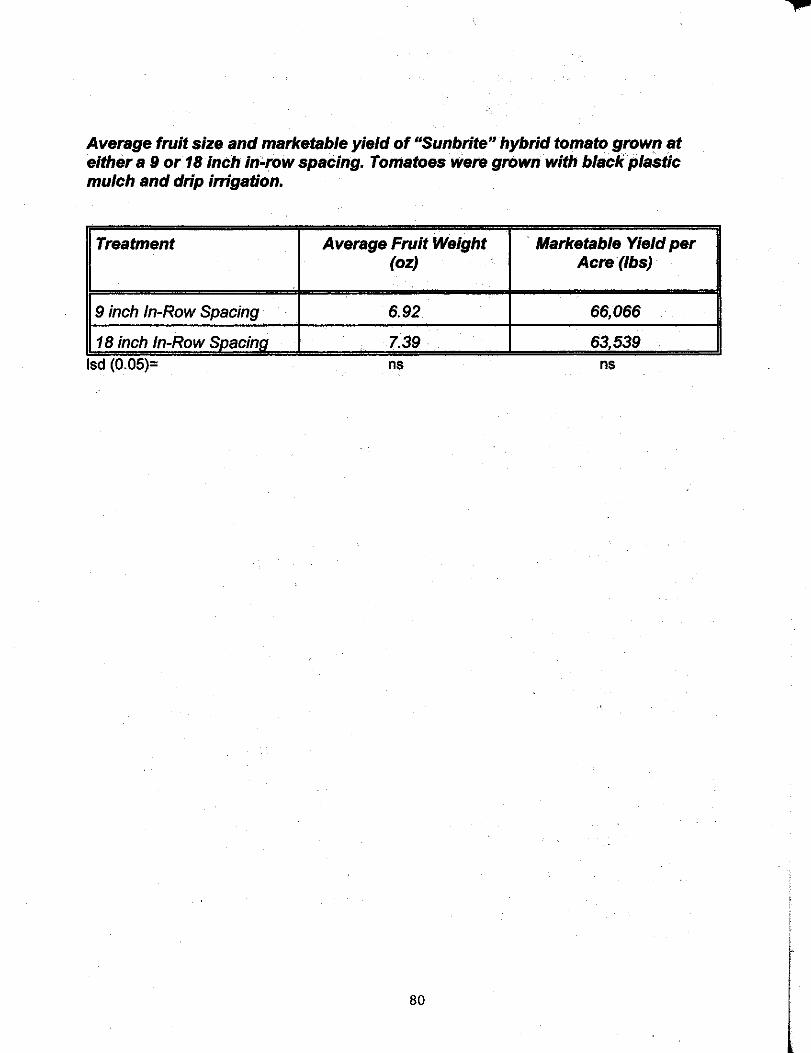
Average fruit size and marketable yield of "Sunbrite" hybrid tomato grown at either a 9 or 18 Inch ln~row spacing. Tomatoes were grown with black plastic mulch and drip irrigation.
Treatment Average Fruit Weight · Marketable Yield per (oz) Acre(lbs)
9 inch In-Row Spacing 6.92 66,066
18 inch In-Row Spacina .. 7.39 63,539 lsd (0.05)= ns ns
80 f
Foliar Boron Application to Field Grown Tomatoes
By Henry G. Taber\ Michael Bartolo\ and Vince Lawson1
1Department of Horticulture, Iowa State University 2Department of Horticulture, Colorado State University
In 2002, a collaborative research project was conducted between Iowa State University and Colorado State University. The goal was to investigate the relationship between soil K and B levels and tomato plant absorption of B. This field study, therefore, was initiated to examine K soil rates coupled with foliar B application at two locations: low residual K (Muscatine, lA) and high residual K (Rocky Ford, CO). For the purpose of this paper, only the Rocky Ford results are reported. ,
General Methods: Tomato transplants, cv. Mt. Spring, were set May 15, 2002, with black plastic mulch and
a single line source trickle irrigation system. Row width was 5 feet and in-row plant spacing was 15 inches with 18 plants per treatment plot.
The center 10 plants were used for harvest while the 3 plants on the outside were used for leaf and flower analysis. The plants were pruned to the first flower cluster and staked according to the Florida stake and weave training system. Normal weed control and pest management practices of the area were followed.
The experimental design was a split plot, factorial, randomized complete block with 4 replications. The main factor was pre-plant K rates (0, 200, and 400 lbs K20/acre). The sub plot was B foliar application: none, 0.25 B lbs/acre at initial flowering , and a second quarter-pound application approximately 4 weeks later.
Soil, flower, and leaf samples were taken throughout the growing season for elemental analysis. Ripe fruit was harvested beginning August 7 and harvested once per week for 7 weeks. After the last harvest, all green fruit were harvested to indicate total fruit set among the treatments. Fruit were sorted into marketable and unmarketable (or cull), and number and weight determined in each category. Cull fruit were those too small, defects greater than 5%, and rots.
The soil type at Rocky Ford consisted of alluvial Rocky Ford silty clay loam (fine-silty, mixed, calcareous, mesic Ustic Torriorthents). Rocky Ford soil levels ofK and B were very high. The soil extraction procedure used was Mehlich No. 3 and a B level of,; 0.5 ppm indicates a probable response to B application. Soil samples taken after final harvest (late October) reflected spring pre-plant application of potash (Table 1A).
Water used for irrigation was analyzed for mineral content throughout the growing season. The Rocky Ford site water was from the Arkansas River until August when extremely dry conditions resulted in switching to a well that was oflesser quality. Mineral content is presented in Table 2. Considerable quantities ofCa, Mg, and S were deposited in the active rootzone by the irrigation water
Results: There was a significant interaction ofK rate B application (P=.06) for total yield {Table
3). The reduction in yield by foliar B application occurred only at the no K rate (from 1729 to 1400 cwt/acre ). Further, adding K to these high K residual soils reduced total fruit produced, but only at the no foliar B application. These same effects were also evident with marketable yield. There was no treatment effect on culls, which represented 6.4% of the total yield. Clearly, the
81
yield data indicates that application of either K or B reduced total and marketable yield compared with no treatment. There were no significant treatment effects at any harvest date.
Marketable fruit size significantly changed with harvest date, from a low of 5.2 oz. (first harvest of Aug 7) to a high of 7.4 oz. in mid-August. Average fruit size was 6.3 oz. for the 7 week harvest Nfiod and was not affected by treatment.
On the high residual soils of the Arkansas River Valley, the soil K treatment had no effect on leaf petiole K concentration. Further, leafK concentration did not decline during the growing season. Correlation of petiole sap K concentration to leaf K concentration was poor at both locations when measured on an individual plot basis, i.e. r = .21 to .49. However, when average values were used the correlation was very high, r = .91 to .99.
The Rocky Ford site maintained a uniform leafK% without K rate influencing either leaf K or Mg concentration . The plant analysis research data indicates that when first flower cluster is at anthesis, and 2nd flower cluster is developing, the most recently mature leaf K%, dry wt. basis, should be ;, 4.5% and petiole sap K level ;, 6000 ppm (Calif. Data).
The foliar B application in June did not elevate leafB concentration, as measured by the July sample date (Table 5). However, after two 0.25 lbs B/acre applications the leafB was significantly elevated ( 9% at the August sample date). The leafB concentration almost doubled by the harvest period and the flower B concn was 2X that of leaf. Boron is considered to be immobile in tomato plant, but perhaps with levels in excess of vegetative demand considerable B can be shunted to reproductive tissue. .
The relationship of leaf and flower elemental concentration for other nutrients is presented in Table 6. Trends that occurred were that flowers had significantly less Ca and Mn, but more P and Zn, compared to leaf. At the high K residual Rocky Ford site, flower K concentration was significantly greater than leaf. All other leaf elements measured: P, Ca, Mg, Mn, Mo, Cu, and Zn were in the sufficiency range, or above.
Conclusions The Mehlich No.3 soil test forK is a good predictor of the need for additional K. At the very high residual K site (Rocky Ford, CO), no additional K was needed and K application significantly reduced yield. Leaf petiole K sap can be a useful tool to evaluate the need for K sidedressing.
The June foliar B application of0.25 lbs B/acre was not detected in the July leaf or flower sample. However, a second application in July elevated August leafB concn by 9%. At the Rocky Ford site, leafB levels were high, approaching the toxicity level of 100 ppm.
Boron is known to play a major function in flowering, and flower analysis may be a better predictor of plant B need than leaf analysis. However, we were not able to create differential leaf/flower B levels to fully test this idea. Interestingly, with ample plant B the tomato will accumulate Bin flower much like P.
Future Work
• Verify the occurrence of the high flower B concentration. • Evaluate Mehlich No. 3 soil B level as a predictor of tomato response to added soil
and/or foliar B.
82
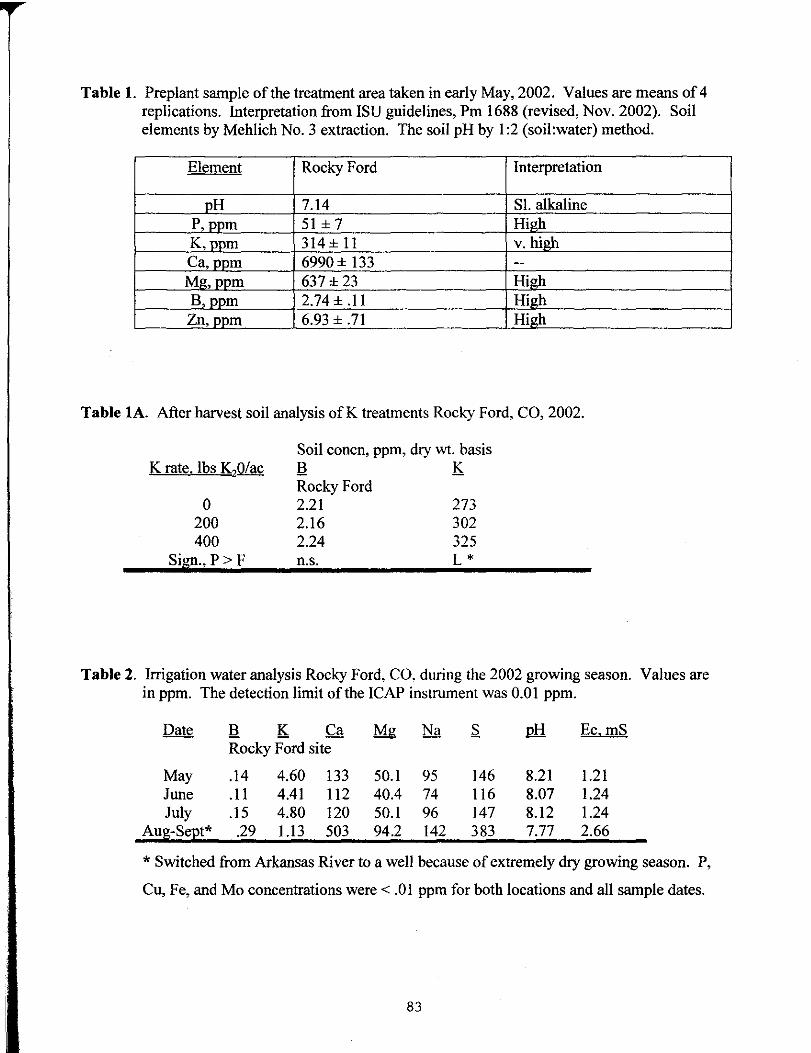
Table 1. Preplant sample of the treatment area taken in early May, 2002. Values are means of 4 replications. Interpretation from ISU guidelines, Pm 1688 (revised, Nov. 2002). Soil elements by Mehlich No.3 extraction. The soil pH by 1:2 (soil:water) method.
Element Rocky Ford Interpretation
pH 7.14 Sl. alkaline P, ppm 51± 7 High K,ppm 314±11 V. high Ca, ppm 6990± 133 --Mg, ppm 637±23 High B,ppm 2.74± .II High
Zn, ppm 6.93 ± .71 High
Table lA. After harvest soil analysis of K treatments Rocky Ford, CO, 2002.
K rate, lbs K20/ac
0 200 400
Sige., P > F
Soil concn, ppm, dry wt. basis ~ K Rocky Ford 2.21 2.16 2.24 n.s.
273 302 325 L*
Table 2. Irrigation water analysis Rocky Ford, CO. during the 2002 growing season. Values are in ppm. The detection limit of the ICAP instrument was 0.01 ppm.
Date B K Ca Mg Na s. cli Ec.mS Rocky Ford site
May .14 4.60 133 50.1 95 146 8.21 1.21 June .11 4.41 112 40.4 74 116 8.07 1.24 July .15 4.80 120 50.1 96 147 8.12 1.24
Au~-Se_et* .29 1.13 503 94.2 142 383 7.77 2.66
* Switched from Arkansas River to a well because of extremely dry growing season. P,
Cu, Fe, and Mo concentrations were< .01 ppm for both locations and all sample dates.
83
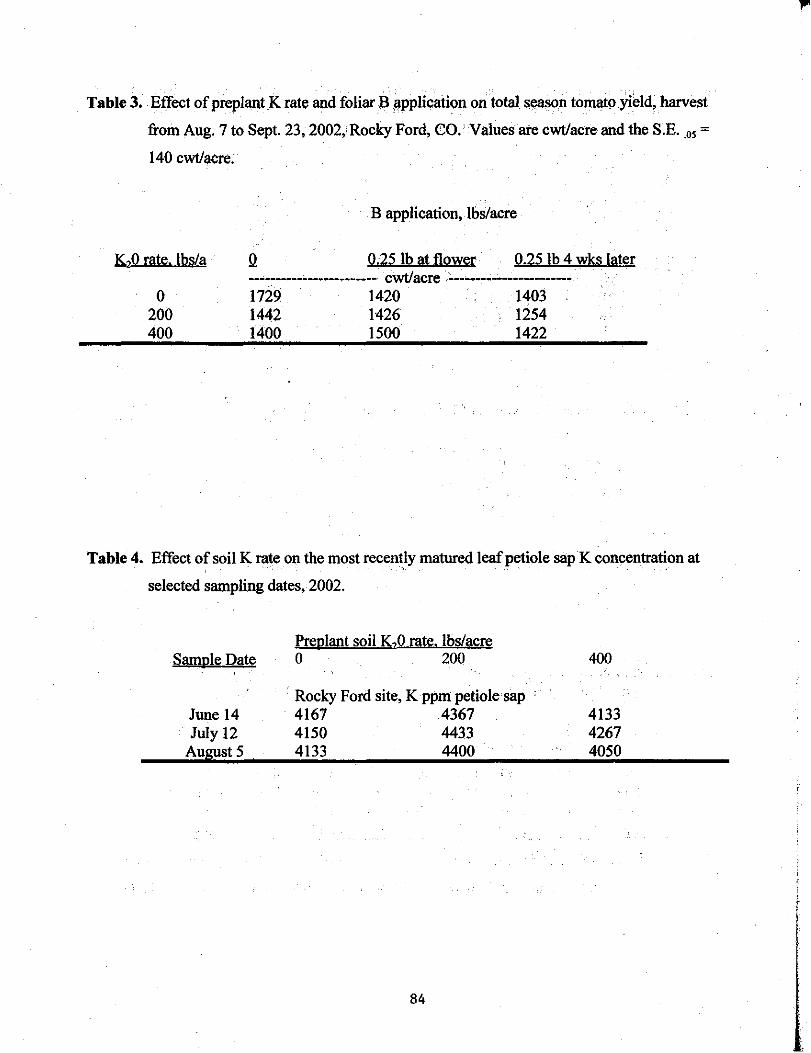
Table 3. Effect of preplant K rate and foliar B application on total SllliWn tomato yield, harvest
from Aug. 7 to Sept. 23, 2002, Rocky Ford, CO.· Values ate cwt/acre and the S.E . . os =
140 cwtlacre.
KaO rate. lbs/a ·
0 200 400
B application, lbs/acre
Q 0.25 lb at flower 0.25 lb 4 wks later ---·~------------------- cwt/acre --------·"------------1729 1420 1403 1442 1426 1254 1400 1500 1422
Table 4. Effect of soil K rate on the most recently matured leaf petiole sap K concentration at
selected sampling dates, 2002.
Sample Date
June 14 July 12
AugustS
Preplapt soil !(.,0 rate. lbs/acre 0 200
· Rocky Ford site, K ppm petiole sap · 4167 4367 4150 4433 4133 4400
84
400
4133 4267 4050
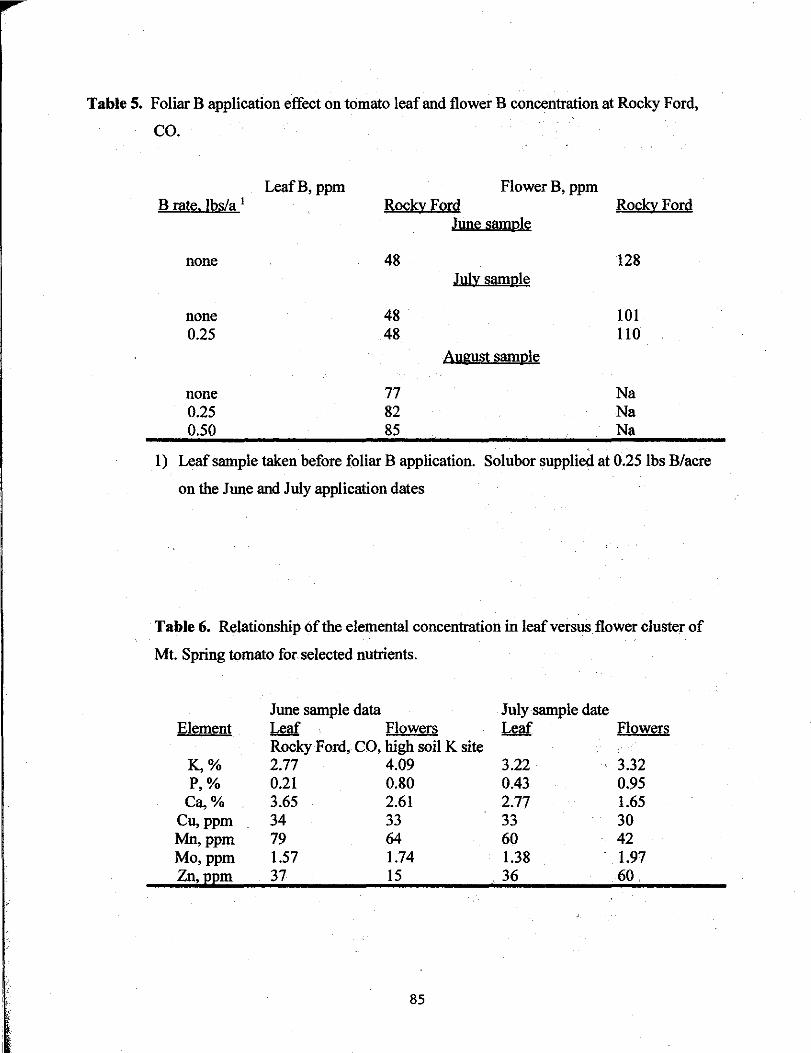
I, ,,
Table 5. Foliar B application effect on tomato leaf and flower B concentration at Rocky Ford,
co.
B rate. lbs/a 1
none
none 0.25
none 0.25 0.50
LeafB, ppm Flower B, ppm RockvFord
48
48 48
77 82 85
June sample
July sample
August sample
RockvFord
128
101 110
Na Na Na
1) Leaf sample taken before foliar B application. Solubor supplied at 0.25 lbs B/acre
on the June and July application dates
Table 6. Relationship of the elemental concentration in leaf versus flower cluster of
Mt. Spring tomato for selected nutrients.
Element
K,% P,%
Ca,% Cu,ppm Mn,ppm Mo,ppm Zn,ppm
June sample data Leaf Flowers Rocky Ford, CO, high soil K site 2.77 4.09 0.21 0.80 3.65 2.61 34 33 79 64 1.57 1.74 37 15
85
July sample date Leaf Flowers
3.22 0.43 2.77 33 60 1.38
. 36
3.32 0.95 1.65 30 42 1.97 60
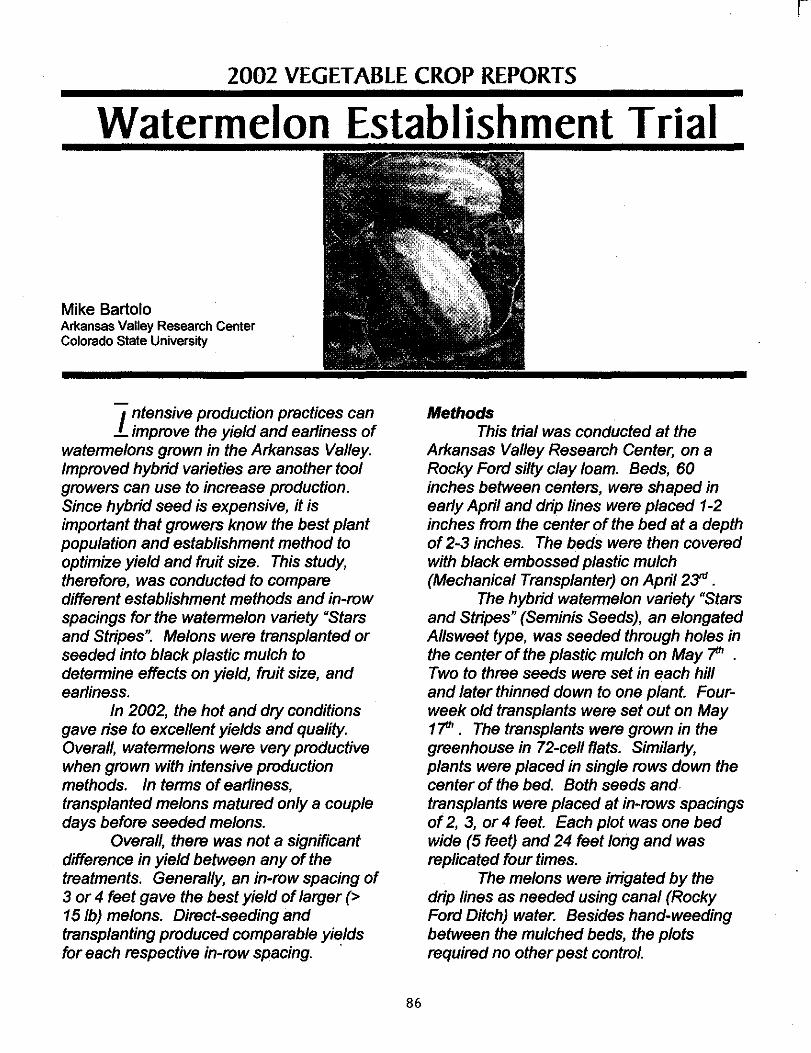
2002 VEGETABLE CROP REPORTS
Mike Bartolo Arkansas Valley Research Center Colorado State University
I ntensive production practices can _improve the yield and earliness of
watermelons grown in the Arkansas Valley. Improved hybrid varieties are another tool growers can use to increase production. Since hybrid seed is expensive, it is important that growers know the best plant population and establishment method to optimize yield and fruit size. This study, therefore, was conducted to compare different establishment methods and in-row spacings for the watermelon variety "Stars and Stripes". Melons were transplanted or seeded into black plastic mulch to determine effects on yield, fruit size, and earliness.
In 2002, the hot and dry conditions gave rise to excellent yields and quality. Overall, watermelons were very productive when grown with intensive production methods. In terms of earliness, transplanted melons matured only a couple days before seeded melons.
Overall, there was not a significant difference in yield between any of the treatments. Generally, an in-row spacing of 3 or 4 feet gave the best yield of larger (> 151b) melons. Direct-seeding and transplanting produced comparable yields for each respective in-row spacing. ·
86
Methods This trial was conducted at the
Arkansas Valley Research Center, on a Rocky Ford silty clay loam. Beds, 60 inches between centers, were shaped in early April and drip lines were placed 1-2 inches from the center of the bed at a depth of 2-3 inches. The beds were then covered with black embossed plastic mulch (Mechanical Transplanter) on April 2Jfd .
The hybrid watermelon variety "Stars and Stripes" (Seminis Seeds), an elongated Allsweet type, was seeded through holes in the center of the plastic mulch on May 1h . Two to three seeds were set in each hill and later thinned down to one plant. Fourweek old transplants were set out on May 11h . The transplants were grown in the greenhouse in 72-cell flats. Similarly, plants were placed in single rows down the center of the bed. Both seeds and transplants were placed at in-rows spacings of 2, 3, or 4 feet. Each plot was one bed wide (5 feet) and 24 feet long and was replicated four times.
The melons were irrigated by the drip lines as needed using canal (Rocky Ford Ditch) water. Besides hand-weeding between the mulched beds, the plots required no other pest control.
r

r Each plot was harvested over a 5-7 day period. The maturity date represents the mid-point of the harvest period. Only fully ripe melons were selected. Each marketable melon was individually weighed.
Watermelons were considered marketable if they weighed over 8 lbs and were free of any physical defects
Yield, average fruit weight, and earliness of seeded and transplanted hybrid watermelon ("Stars and Stripes"- Seminis Seeds) grown using black plastic mlh dd" · · f uc an np tmga ton.
Total Average Market Average Method In-Row Maturity Weight- Total Weight- Market
Spacing melons Weight melons Weight Date >Bibs > 151bs
(ft) lbs lbs lbslacre lbslacre
Transplant 2 7-30 85,105 16.92 60,911 20.04
3 7-30 96,694 17.42 72,418 19.75
4 7-31 81,366 18.71 68,715 20.46
Direct-Seed 2 8-1 80,586 15.65 54,087 18.21
3 8-3 . 106,649 16.05 70,621 19.27
4 8-1 88,971 16.36 62,245 18.82
LSD(O.OSI = ns ns ns ns
87
2002 VEGETABLE CROP REPORTS
Seedless Watermelon Trial
Mike Bartolo Arkansas Valley Research Center Colorado State University
S eedless watermelons are _increasingly in demand by
consumers throughout the country and represent a valuable new crop for Colorado growers. Like seeded melons, seedless watermelon grow exceptionally well in the Arkansas Valley. Unlike seeded watermelons, however, seedless watermelons require special production practices to optimize yield and quality. Specifically, seedless watermelons are best grown with plastic mulch and drip irrigation. With the use of expensive production practices, variety selection becomes critical.
This study was conducted to evaluate the horticultural characteristics of 22 seedless watermelon varieties. All varieties were grown with plastic mulch and drip irrigation.
Methods This trial was conducted at the
Arkansas Valley Research Center, on a Rocky Ford silty clay loam. Beds, 60 inches between centers, were shaped in early April and drip lines were placed 1-2 inches from the center of the bed at a depth of 2-3 inches. The beds were then covered with black embossed plastic mulch
(Mechanical Transplanter) on April 23. The watermelon varieties were sown
in the greenhouse in 72-ce/1 flats on Apri/9. At the 2-3 true leaf stage, the melons were transplanted in the field on May 17. Plants were placed in single rows down the center of the bed at an in-row spacings of 3 feet. Each plot was one bed wide (5 feet) and 24 feet lqng and was replicated three times.
"Stars and Stripes" (Seminis Seeds), an elongated At/sweet type, was used as the pollinator. The pollinator was randomly distributed throughout the plot area at a ratio of 1:2. 5. Every seedless watermelon plot was bordered on at least one side by a pollinator plot.
The melons were irrigated by the drip lines as needed using canal (Rocky Ford Ditch) water. Besides hand-weeding between the mulched beds, the plots required no other pest control.
Each plot was harvested over a 5-7 day period. The maturity date represents the mid-point of the harvest period. Only fully ripe melons were selected. Each marketable melon was individually weighed. Watermelons were considered marketable if they weighed over 6 lbs and were free of any physical defects
88
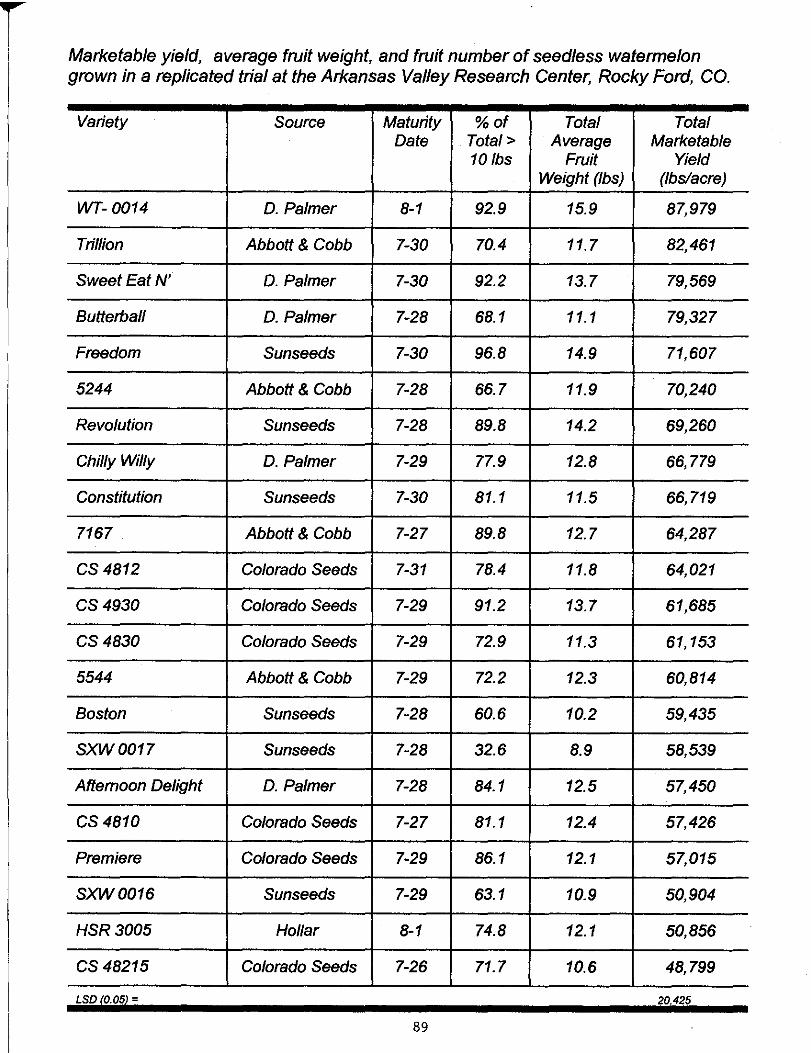
T Marketable yield, average fruit weight, and fruit number of seedless watermelon grown in a replicated trial at the Arkansas Valley Research Center, Rocky Ford, CO.
Variety Source Maturity %of Total Total Date Total> Average Marketable
101bs Fruit Yield Weight (lbs) (lbslacre)
WT- 0014 D. Palmer 8-1 92.9 15.9 87,979
Trillion Abbott & Cobb 7-30 70.4 11.7 82,461
SweetEatN' D. Palmer 7-30 92.2 13.7 79,569
Butterball D. Palmer 7-28 68.1 11.1 79,327
Freedom Sunseeds 7-30 96.8 14.9 71,607
5244 Abbott & Cobb 7-28 66.7 11.9 70,240
Revolution Sunseeds 7-28 89.8 14.2 69,260
Chilly Willy D. Palmer 7-29 77.9 12.8 66,779
Constitution Sun seeds 7-30 81.1 11.5 66,719
7167 Abbott & Cobb 7-27 89.8 12.7 64,287
cs 4812 Colorado Seeds 7-31 78.4 11.8 64,021
CS4930 Colorado Seeds 7-29 91.2 13.7 61,685
CS4830 Colorado Seeds 7-29 72.9 11.3 61,153
5544 Abbott & Cobb 7-29 72.2 12.3 60,814
Boston Sun seeds 7-28 60.6 10.2 59,435
SXW0017 Sunseeds 7-28 32.6 8.9 58,539
Afternoon Delight D. Palmer 7-28 84.1 12.5 57,450
cs 4810 Colorado Seeds 7-27 81.1 12.4 57,426
Premiere Colorado Seeds 7-29 86.1 12.1 57,015
SXW0016 Sunseeds 7-29 63.1 10.9 50,904
HSR3005 Hollar 8-1 74.8 12.1 50,856
cs 48215 Colorado Seeds 7-26 71.7 10.6 48,799
LSD 0.05 = 20425
89
2002 VEGETABLE CROP REPORTS
Zinnia Stand Loss Trial
Mike Bartolo Arkansas Valley Research Center Colorado State University
S tand loss in crops can occur due _ to a variety of environmental
stresses. In terms of yield, different plants have different capacities to compensate for reduced populations. This study was conducted to determine the yield response of zinnia (Zinnia elegans Jacq.), grown for seed, to stand Joss incurred at different stages of plant development. The effect of removing 25%, 50%, and 75% of the zinnia stand at the pre-bloom, early, mid, and latebloom stages was examined.
In 2002, the growing season was extremely hot and dry. A shortage of irrigation water in August was stressful to all zinnia treatments. Despite these dry environmental conditions, zinnia yields were good and there were significant differences between treatments. In general, yield losses increased as the amount of stand Joss increased.
This project was generously supported by the National Crop Insurance Services.
Introduction The plains of eastern Colorado are
often exposed to extreme environmental conditions including low and high
· temperatures and severe storms that contain hail (Doesken, 1994). Zinnias grown for flower seed production in the Arkansas Valley of Colorado are subjected to a variety of weather-related stresses. To date, there have been no studies describing how zinnias respond to stand losses.
90
Our objective was to determine how different levels of stand reduction during zinnia development affect seed yield. This information is needed to document the effects of stand Joss on zinnia and gain insights into possible production options after stand has occurred.
Materials and Methods This study was conducted in field
trials at the Arkansas Valley Research Center, Rocky Ford, Colorado, on a Rocky Ford silty clay loam [Ustic Torriorthents, fine silty, mixed, (calcareous, mesic)]. Seeds of Will Rogers" red-flowered zinnia (Burrell Seed Co.) were sown on 24 May 2002. Plots, 15 ft long X 4 rows (1 0 ft) wide, were used. The plot area was over-seeded and thinned to a uniform stand (6 inch in-row spacing) in all plots soon after emergence. There were approximately 120 plants per plot.
Weeds were controlled by cultivation and hand weeding. No other pest controls
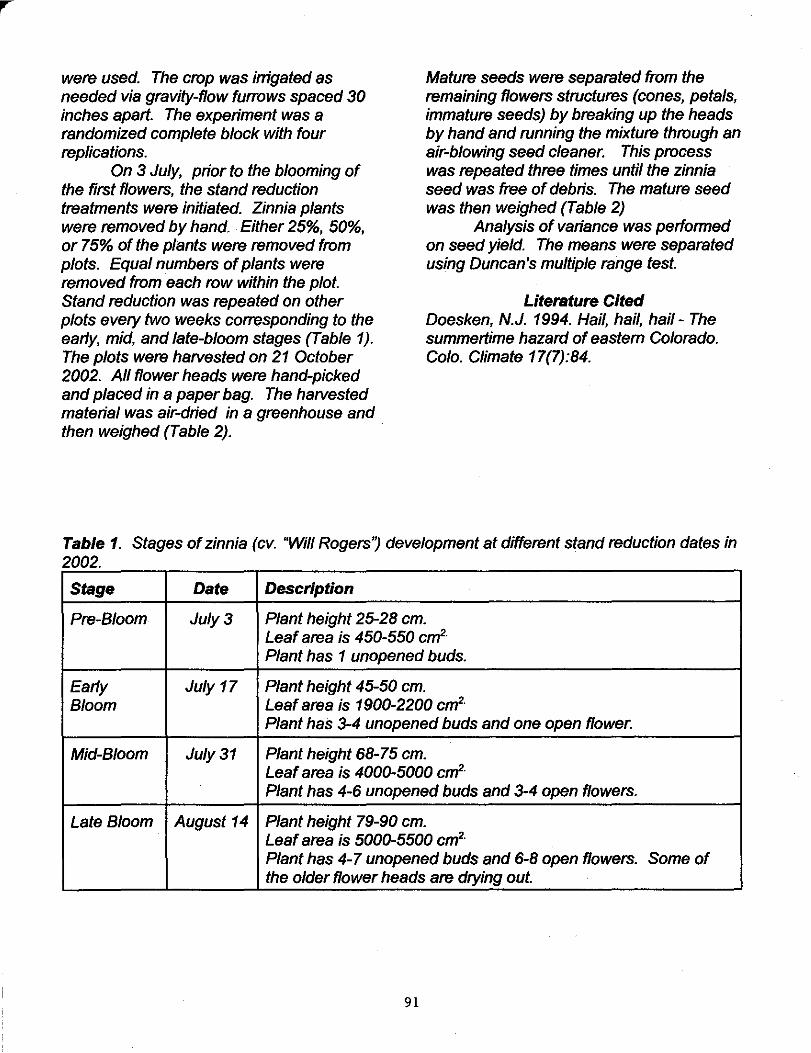
were used. The crop was irrigated as needed via gravity-flow furrows spaced 30 inches apart. The experiment was a randomized complete block with four replications.
On 3 July, prior to the blooming of the first flowers, the stand reduction treatments were initiated. Zinnia plants were removed by hand. Either 25%, 50%, or 75% of the plants were removed from plots. Equal numbers of plants were removed from each row within the plot. Stand reduction was repeated on other plots evel}' two weeks corresponding to the early, mid, and late-bloom stages (Table 1). The plots were harvested on 21 October 2002. All flower heads were hand-picked and placed in a paper bag. The harvested material was air-dried in a greenhouse and then weighed (Table 2). ·
Mature seeds were separated from the remaining flowers structures (cones, petals, immature seeds) by breaking up the heads by hand and running the mixture through an air-blowing seed cleaner. This process was repeated three times until the zinnia seed was free of debris. The mature seed was then weighed (Table 2)
Analysis of variance was performed on seed yield. The means were separated using Duncan's multiple range test.
Literature Cited Doesken, N.J. 1994. Hail, hail, hail- The summertime hazard of eastern Colorado. Colo. Climate 17(7):84.
Table 1. Stages of zinnia (cv. "Will Rogers') development at different stand reduction dates in 2002
Stage Date Description
Pre-Bloom July3 Plant height 25-28 em. Leaf area is 450-550 crrf· Plant has 1 unopened buds.
Early July 17 Plant height 45-50 em. Bloom Leaf area is 1900-2200 crrt·
Plant has 3-4 unopened buds and one open flower.
Mid-Bloom July31 Plant height 68-75 em. Leaf area is 4000-5000 crrt· Plant has 4-6 unopened buds and 3-4 open flowers.
Late Bloom August 14 Plant height 79-90 em. Leaf area is 5000-5500 crrt· Plant has 4-7 unopened buds and 6-8 open flowers. Some of the older flower heads are dl}'ing out.
91
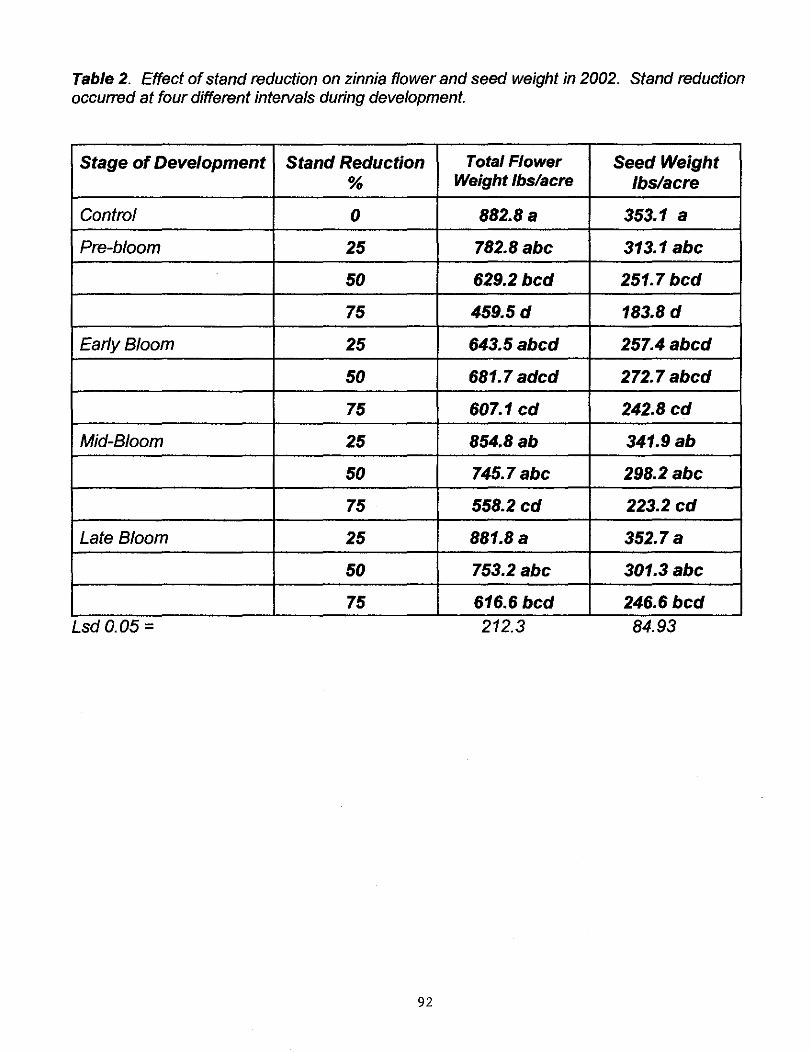
Table 2. Effect of stand reduction on zinnia flower and seed weight in 2002. Stand reduction occurred at four different intervals during development.
Stage of Development Stand Reduction Total Flower Seed Weight % Weight lbslacre lbslacre
Control 0 882.8a 353.1 a
Pre-bloom 25 782.8 abc 313.1 abc
50 629.2 bed 251.7 bed
75 459.5 d 183.8 d
Early Bloom 25 643.5abcd 257.4abcd
50 681.7 adcd 272.7 abed
75 607.1 cd 242.8 cd
Mid-Bloom 25 854.8 ab 341.9 ab
50 745.7 abc 298.2abc
75 558.2 cd 223.2 cd
Late Bloom 25 881.8 a 352.7 a
50 753.2 abc 301.3 abc
75 616.6 bed 246.6 bed
Lsd 0.05 = 212.3 84.93
92

Field Crops
2.003 k;seaz'cb :Plots ' Arkansas Va22ey Research Center
Co2orado State university Rocky Ford, Co2orado
:\
.. i ALFALFA - 24.5 acre.s .. , , ' .
Variety Trials ~24 entrle$, nf?w tz:~al
3r~, year;, 32 'entries, planted -
;:·_ :~ 0.';'~ - -Alfalfa Weevil - Variet;a.l . .RECs~stance Fertility - Potassium ·~ 4 treatments
-: iient'ries - 7t• year
BEANS (Pinto) Variety Trial - 18 entries
CORN- 23.3 acres variety Trial - 36 grain entries, 14 forage efitries SW Corn Borer Pheromone Traps - Arkansas Vallel ~· 5
·.1ni:R'l'ILITY - N fertilitY Response - Long Term 6 'rates,' 2 types
SMALL GRAINS Winter. Wheat varietY Trial
Harvest 30 entries·
SORGHUM- 4.8 acres . , Variety Trial - 14 forage ,eptries .
SOY.BEANS- 11.1 acres variety Trial - 6 entries
ALT.ERNA'l'IVE CROPS Birdsfoot Trefoil - 2 varieties
93
Plant 30 entries
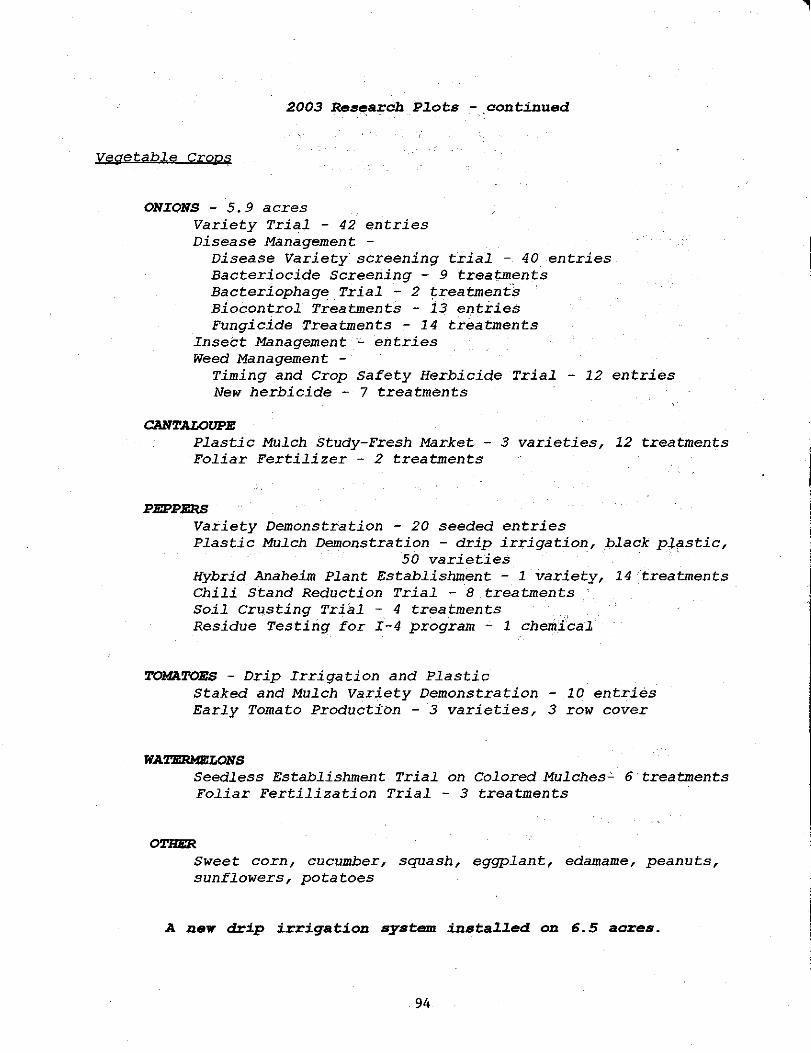
2003 Research P~ots -_continued
Veaetab.le Crops
ONIONS - 5.9 acres Variety Tria.l - 42 entries Disease Management -
Disease Variety screening tria.l - 40 entries Bacteriocide Screening - 9 treatments Bacteriophage Tria.l - 2 treatment$ Biocontro.l Treatments - l3 e~tries Fungicide Treatments - 14 treatments
Insect Management ·~ entries Weed Management -
Timing and Crop Safety Herbicide Tria.l - 12 entries New herbicide - 7 treatments
CANTALOUPE P.lastic Mu.lch Study-Fresh Market - 3 varieties, 12 treatments Fo.liar Ferti.lizer - 2 treatments
PlllPPlllRS Variety Demonstration - 20 seeded entries P.lastic Mu.lch Demonstration - drip ir;rigation, b.lack p.lf!stic,
50 varieties · Hybrid Anaheim P.lant Estab.lishment - 1 variety, 14 treatments Chi.li Stand Reduction Tria.l - 8 treatments Soi.l crusting Triii.l - 4 treatments . , Residue Testing for I-4 program - 1 chemical.
TOMATOES - Drip Irrigation and P.lastic Staked and Mu.lch Variety Demonstration - 10 entries Ear.ly Tomato Production - 3 varieties, 3 row cover
WATlllRMI!lLONS Seed.less Estab.lishment Tria.l on Co.lored Mu.lches~ 6 treatments Fo.liar Ferti.lization Tria.l - 3 treatments
OTHER sweet corn, cucumber, squash, eggp.lant, edamame, peanuts, sunf.lowers, potatoes
A new drip irrigation system insta~~ed on 6.5 acres.
94