technical report 380 - dtic.mildtic.mil/dtic/tr/fulltext/u2/618503.pdf · 8g massachusetts...
TRANSCRIPT

a,
vO UJ 1 -1 1 cc *—1 1
B tLi I
*—• 1 B CO UJ tu
ESD-TDR-65-53
%J*i\i P RECORD COPY RETURN TO
INfCRMATION DIVISION! 211
ETSTI PROCESSED
D DDC TAB □ PROJ OFFICER
C ACCESSION MASTER FILE
□ DATS.
EST£ CO
CY NR
Nr?_ AL 46693
:v»
Technical Report 380
AC Breakdown in Gases
C. E. Muehe

The work reported in this document was performed at Lincoln Laboratory, a center for research operated by Massachusetts Institute of Technology, with the support of the U.S. Air Force under Contract AF 19(628)-500.
Non-Lincoln Recipients
PLEASE DO NOT RETURN
Permission is given to destroy this document when it is no longer needed.

8G
MASSACHUSETTS INSTITUTE OF TECHNOLOGY
LINCOLN LABORATORY
AC BREAKDOWN IN GASES
C. E. MUEHE
Group 46
TECHNICAL REPORT 380
26 FEBRUARY 1965
LEXINGTON MASSACHUSETTS


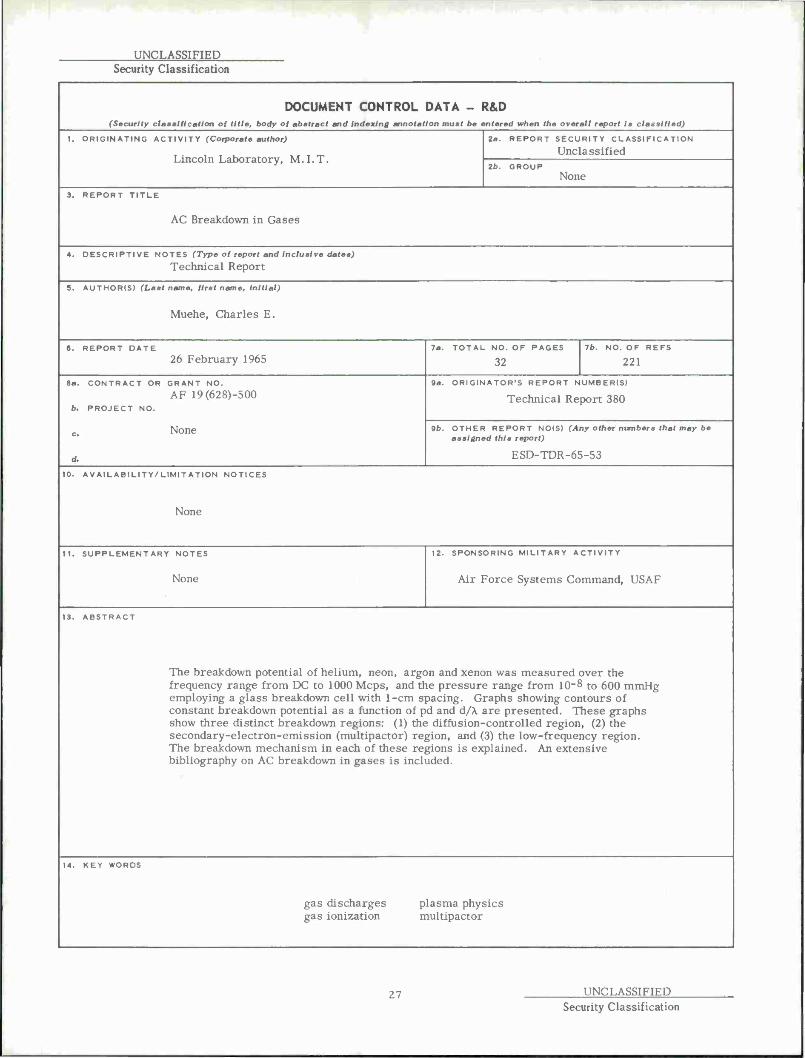
ABSTRACT
The breakdown potential of helium, neon, argon and xenon was measured
over the frequency range from DC to 1000 Mcps, and the pressure range -8
from 10 to 600 mmHg employing a glass breakdown cell with 1-cm
spacing. Graphs showing contours of constant breakdown potential as a
function of pd and d/X are presented. These graphs show three distinct
breakdown regions: (1) the diffusion-controlled region, (2) the secondary-
electron-emission (multipactor) region, and (3) the low-frequency region.
The breakdown mechanism in each of these regions is explained. An ex-
tensive bibliography on AC breakdown in gases is included.
Accepted for the Air Force Stanley J. Wisniewski Lt Colonel, USAF Chief, Lincoln Laboratory Office
iii

TABLE OF CONTENTS
Abstract iii
I. Introduction 1
II. Three breakdown Regions 1
A. Diffusion-Controlled Region 7
B. Low-Frequency Region 8
C. Secondary-Electron-Emission Region 11
III. Experimental Procedure 11
IV. Conclusion 15
Bibliography on AC Breakdown in Gases 19

AC BREAKDOWN IN GASES
I. INTRODUCTION
The breakdown potential of a gas, when subject to an AC electric field, has been the topic of a very large number of experimental and theoretical investigations as evidenced by the exten-
sive bibliography included in this report. Unfortunately, each of these investigations covers only a small range of experimental variables so that it is difficult to get an over-all picture of
1 2 AC breakdown. This was clarified somewhat by Brown ' who recognized that the experimental
data for a given gas and geometry could all be displayed on one graph if a set of proper variables were used. This is the approach followed in the present investigation.
We will consider breakdown in a uniform field between two parallel plates. If we assume
that the plate diameter is large compared to the spacing and that edge effects are somehow
avoided, then the only experimentally adjustable parameters are the spacing between the plates
d, the pressure p, the wavelength \, the nature of the plate material, and the gas used. Fig-
ure 1, the breakdown of hydrogen between brass or copper plates, results from plotting the 3-7 data of several experimenters using proper variables that are well established and are in
g conformity with the usual similarity laws for gas discharges. We used a slightly different set of proper variables from those used by Brown for the simple reasons that the resulting graph
displays more vertical and horizontal lines in the contours of constant breakdown voltage, and the graph is more compact (extends over fewer orders of magnitude of the proper variables)
than Brown's. A horizontal or vertical line in one of the contours indicates that the breakdown voltage is independent of one of the parameters in a certain region. Thus the horizontal lines
to the left of Fig. 1 indicate that the breakdown voltage is independent of pressure as one ap-
proaches a vacuum. We normalized all other variables to the spacing d. This particular nor-
malization is also useful from an experimental point of view, since the distance d usually is
fixed in a given experiment while the pressure and wavelength are allowed to vary.
We measured the high-frequency breakdown potential in helium, neon, argon and xenon
using experimental methods described below (Figs. 2 through 5*). Before discussing the ex-
periments, we will briefly review the various types of AC breakdown. This discussion will center on Fig. 1, although from the similarity in the shapes of the curves it could equally apply to Figs. 2 through 5.
II. THREE BREAKDOWN REGIONS
Figure 1 can be broken into three regions. The upper and lower halves of the figure are
divided by the oscillation amplitude limit, which starts at the left of Fig. 1 in a horizontal line
* Enlarged copies of these figures may be obtained from the author.

Pd
Fig. 1. Contours of constant breakdown voltage for hydrogen.

pd (mmHg-cm)
Fig. 2. Experimental AC breakdown of xenon.

pd (mmHg-em)
Fig. 3. Experimental AC breakdown of argon.

|5-4<-H50|
V ■ 500 voll»
,0«
*•"
iöe
BREAKDOWN MEASURED ON PYREX PILLBOX WITH SILVERED ENDS
I VOLTAGE BETWEEN PLATES AT BREAKDOWN
d PLATE SPACING (cm)
X WAVELENGTH (cm)
p PRESSURE (mmHg) AT 25*C
ELECTRODES ARE PYREX GLASS (CORNING 7740)
Fig. 4. Experimental AC breakdown of neon.

E
O c
! "0 o Q)
-Q
U <
I

at a d/\ value of 0.0027 and extends into the dashed line marked "oscillation amplitude limit."
The upper half of the figure is further subdivided into two parts by the "mean-free-path limit."
The three different regions into which the breakdown diagram is divided are characterized by
various electron production and loss mechanisms. If a very slowly increasing AC field is ap-
plied to the region between the plates, any electrons present will either multiply or be lost.
When the rate of gain exceeds the rate of loss, breakdown occurs.
A. Diffusion-Controlled Region
When the experimental parameters are adjusted to be in the upper-right-hand corner of
Fig. 1, the breakdown is said to be "diffusion controlled." In this region electrons are produced
by ionizing collisions between electrons and gas molecules, and are lost by diffusion to the walls.
Where the equipotential lines in this region are straight and vertical, the breakdown potential is
independent of frequency. Moving vertically upward (increases the frequency, decreases the
wavelength) along one of these lines, one notices that they bend to the left because the efficiency
of energy transfer from the electric field falls off with increasing frequency. An effective field 2 I 2 2
is often defined as E = Ev I \v + co (where v is the collision frequency for momentum e m' *v m m J
transfer), which would transfer the same energy to the electrons as a DC field of the same value.
Examining the above expression we see that when v - w the effective field equals E/'^2. With
this in mind we can determine the curve of v - oo in Fig. 1 by projecting the vertical straight-
line portions of the curves to a point where the voltage is N/Y times the value for each equipoten-
tial curve. The above procedure is valid since we have not varied p or d in the projection so
that the loss of electrons by diffusion is still the same, and we must merely have a higher elec-
tric field in order to heat the electrons enough to produce the needed ionization.
If we examine what happens in the diffusion-controlled region when the pressure is varied
while holding the spacing d and the wavelength \ constant (movement along a horizontal line),
we observe that the minimum potential occurs to the left of the v - w line at high values of
d/x as one might expect if the above-mentioned effect alone were acting. But, at low values of
d/\, the minimum occurs to the right of the v - u line. This can be explained by the fact that
the same effect which causes the minimum in the DC Paschen curve, as explained under low-
frequency breakdown, is also active.
Actual breakdown voltages in the diffusion-controlled region have been calculated theoreti-
cally for helium (Ref. 9), neon (Ref. 10), hydrogen (Ref. 11), and in a helium-mercury mixture
(Ref. 12). These theoretical investigations utilized Boltzmann's equation and experimentally
measured elastic and inelastic collision cross sections. Good agreement exists between theory
and experiment.
By use of measured uniform-field breakdown data, diffusion-controlled breakdown fields
have been predicted correctly for several nonuniform-field situations: coaxial geometry, spher-
ical geometry, around a small hemispherical boss, and for cavities with d/\ > 0.1 (Ref. 16).
In electron-attaching gases such as air, electrons are lost by attachment as well as diffu-
sion. Attachment predominates at high pressures where diffusion losses are small; then the
breakdown becomes a volume process occurring when a certain value of E/p is exceeded.
Also, in the diffusion-controlled region when the pressure is high enough and the fre-
quency low enough, the breakdown field is altered because the electron energy is modulated.
At each collision with a gas molecule, an electron loses some small fraction g of its energy.
If the collision is elastic, g is about 2m/M (where m is the electron mass and M is the molec-
ular mass). If the collision is inelastic, a larger portion will be lost. A simple analysis shows
that if v /co is much less than 2/g, the electron energy will remain practically constant through-
out the AC cycle. If v /u is much greater than 2/g, then the electron energy will closely follow
the electric field. The transition v /w = 2/g is approximately a 45° line running upward to the
right, marked "energy modulation transition" in Fig. 1. We have taken g = 0.01 for hydrogen*
Figure 1 shows no change in breakdown voltage in crossing this transition for two reasons. First, 17
the expected change in voltage is probably quite small for hydrogen. Gould and Roberts cal-
culated that the breakdown field for air increased by 20 percent when this transition is crossed
vertically by going from longer to shorter wavelength. The change depends to a large extent on
the slope of the ionization-vs-field curve which is steeper for air than hydrogen. Second, Fig. 1
was drawn using the data from five experimenters. There was about 10-percent scatter between
the various sets of data, and no single experimenter gave enough data to detect the change in
voltage in crossing this transition. It would be interesting to take several vertical experimental
runs in this region for some polyatomic gas to find the exact effect of the energy modulation. If
plotted, we would find this energy modulation transition off to the right of our graphs (Figs. 2
through 5) everywhere above the oscillation amplitude limit. Below this limit the energy mod-
ulation transition is not important because the electrons themselves are swept out of the break-
down region during each half cycle, as explained in Sec. B below.
B. Low-Frequency Region
The dividing line between the diffusion-controlled and low-frequency breakdown regions is
the "oscillation amplitude limit," so called because at voltages corresponding to the diffusion-
controlled breakdown voltage along this line, the amplitude of oscillation of the electron motion
equals half the plate separation d. Thus during one cycle all the electrons will hit the walls of
the container. Below this line the breakdown takes place much like a DC breakdown with each
electrode acting as cathode during half the cycle. At high pd the oscillation amplitude limit
approaches a horizontal straight line for attaching gases, but continues to slope gently down-
ward with increasing pd for nonattaching gases.
In the low-frequency breakdown region, because the electrons are rapidly swept to the anode,
a secondary (y or ß) process such as electron emission due to bombardment of the cathode by
positive ions or photons is required for breakdown. At low and medium pressures, breakdown
occurs when the equation y(ea — 1) = 1 is satisfied. Here a is the number of electron-ion ex d
pairs produced by one electron as it drifts 1 cm in the applied field. The quantity (e — 1) is
the number of ions formed by one electron in crossing the gap d. The quantity y. is defined as
the probability that one ion so formed will produce one new electron at the cathode, and y is
the probability that the photons formed in one ionizing collision will produce one new electron at
the cathode. At high pressures, the ß process seems to be important wherein the photons pro-
duce ionization in the gas. At very low frequencies, breakdown occurs at the peak of each cycle
and the peak AC voltage for breakdown equals the DC breakdown voltage. For this reason the
curves of Fig. 1 become vertical straight lines at the bottom of the graph with pd values corre-
sponding to the normal Paschen curve for DC breakdown.
*LB. Loeb, Basic Processes of Gaseous Electronics (University of California Press, Berkeley, California, 1955), p. 325.

The Paschen curve of DC breakdown voltage vs pd is concave upward with a single minimum.
Breakdown voltage rises with increasing pressure at higher pressures because of the increasing
collision frequency. The electrons lose energy more rapidly due to collisions so they require
a higher electric field to raise their average energy sufficiently to ionize the gas. At low pres-
sures the breakdown voltage rises with decreasing pressure because the collision frequency is
so low that ionizations are rare before the electrons are lost from the discharge. Thus their average energy must be raised higher so that an electron has a better chance of ionizing before
being lost.
As the frequency is raised (movement along a vertical line in Fig. 1) from DC, the time it 18 19 takes to initiate the discharge becomes important. ' ' If the breakdown time is more than a
small fraction of a cycle, the voltage will not remain near its peak value long enough for break-
down to take place. Then, during the next quarter cycle, the charged particles will be swept out
of the gap. Thus when the breakdown time is long, usually at low pressures, the peak voltage
must be raised with increasing frequency to cause breakdown. (See the low-pressure curves in Fig. 6.)
If the frequency is increased still further, a point will be reached at which some ions gen- erated at the positive peak of the RF cycle will remain in the gap at the next peak. If the ions can just cross the gap in £ of the RF cycle, many ions generated near the anode at the positive peak
will traverse the gap twice before the negative peak and bombard the cathode at just the right time
to produce new electrons. Thus simultaneous multiple avalanches will take place at the negative
peak. A reduction in breakdown voltage can then be expected much as if the cathode were bom-
barded by intense ultraviolet. At low pressures, where the y. process is important, the breakdown voltage will first rise
with increasing frequency because there is insufficient time at the peak of the cycle for the ions
to reach the cathode and then fall when the gap transit time is £ cycle. This course of events is
seen to exist for argon at low pressure in Fig. 6, where the ~ cycle transit time points are marked. At higher pressure, where the y process dominates, no transition is apparent. This effect is very marked in xenon. A dashed line in Fig. 2 shows where the transit time is £ cycle. Similar
A Q
results were observed by Fuchs in hydrogen. The distance ions travel in \ cycle is (JL.N/2E/CJ,
where \i. is the ion mobility. If the frequency is increased above the point where the ion transit time is \ cycle (d =
2N/2^.E/W), ions can accumulate in the gap from one cycle to the next. In this case breakdown
will take place if the number of ions produced exceeds the number lost by diffusion per cycle.
Breakdown of air at atmospheric pressure with increasing frequency usually between various-
sized spheres has been the subject of a number of investigations. A downward departure from
the 60-cps breakdown value is observed when the transit time is £ to \ cycle (see especially
Lassen ). It is not clear which of the above mechanisms is causing this departure. Because of
the very short breakdown times with small overvoltages at high pressure, associated with the fact that breakdown takes place in a single avalanche, it is hard to explain breakdown as being
due to the accumulation of ions after many cycles. We prefer the explanation involving the
production of simultaneous multiple avalanches by the ions bombarding the cathode at the peak
of the pulse when the ion transit time is greater than \ cycle.
* T. F. Godlove, "Nanosecond Triggering of Air Gaps with Intense Ultraviolet Light," J. Appl. Phys. 32, 1589 (1961).

- |j-«6-«l5Z|
r Pd 0.25v
-
32\ 10.7^
---^- ^ (^9—
- l.0v <y^
^\_
r
-
-
1 1 1 1
® 1/4 CYCLE ION TRANSIT TIME
1 1 1 1 1 1 1 1 1 1 1 1 1 1 1 I 1 1 1 1 1 1 1 1 1 1 1 1 1 1 1 1 1 1 1 1 1 1 1 1 1 1 1 I | 1 1 1 1 1 1 1 I l I I i I 10- .0-« ID'7 to'6 ID"5 to"4 ,0"3 lo-'
d/X
Fig. 6. Low-frequency breakdown in argon.

C. Secondary-Electron-Emission Region
The "secondary-electron-emission" and "diffusion-controlled" breakdown regions (Fig. 1)
are separated by the "mean-free-path limit." Left of this limit, breakdown becomes independent of the nature of the gas or the gas pressure so that the constant breakdown voltage lines become
horizontal, and ionization in the gas is no longer important. Instead, new electrons are produced
by secondary-electron emission at the walls of the container. The theory of secondary-electron- 2 22 emission (multipactor) breakdown is well understood. ' ' For breakdown to occur, the walls
must have a secondary-emission ratio greater than one in the energy range of the incident elec-
trons, and the transit time must be an odd number of half periods of the applied RF. A fairly
well-defined sheet of electrons travels back and forth between the electrodes, reconstituting
itself through secondary emission as it strikes each wall. The density of the electron sheet
grows with each wall encounter and is finally limited principally by space-charge repulsion
forces. For values of d/\ less than 0.0027, no voltage exists for which the secondary emission is greater than one and the transit time is one-half period, even if all starting phases are ex- amined. Below this value of d/\, the amplitude of oscillation of electrons in a field sufficiently
large to give a secondary-emission ratio greater than one is much larger than the plate spacing
so that no breakdown will occur. Thus the line d/\ = 0.0027 is a natural extension of the oscilla-
tion amplitude limit of higher pressures. Several geometries, other than the parallel-plate geometry described above, can lead to
multipactor breakdown. A magnetic field, an applied DC field, or an electrostatic field can
be used to return the electron to the secondary emitting surface. Multipactor discharges can
also take place between irregular-shaped electrodes. '
m. EXPERIMENTAL PROCEDURE
The tube used for breakdown measurements was in the form of a Pyrex pillbox (see Fig. 2). Electrodes were external and were applied to the flat ends of the tubes. Internal spacing between
the flat ends was 1 cm. Voltage given on the figures is the internal, rms voltage. The tube di-
ameter was chosen so that it would not change the diffusion length by more than 8 percent from a tube with infinite radius.
The pillbox was placed at the high-voltage point of various cavities tuned to the frequency of
operation in order to increase the applied voltage and filter out any harmonics from the oscilla-
tor output. The cavity most often used was a piece of 3| -inch coaxial line with the tube mounted
between the end of the center conductor and an end plate. The other end of the cavity had an
adjustable shorting plate and a small adjustable loop for coupling in power. Voltage was meas-
ured using a power meter and a carefully calibrated directional coupler mounted on the cavity wall.
At lower frequencies, the tube still in the 3|-inch coax mount was incorporated into a lumped- element tuned circuit coupled to the oscillator through a short piece of coaxial line and a swing-
ing loop coupling. Voltage was measured using a vacuum-tube voltmeter. At still lower fre- quencies, audio amplifiers supplied the signal and an oscilloscope was used to assure proper
wave shape.
A square, flat cavity whose height was just that of the tube spacing was built for the highest
frequency (1000 Mcps) because the R/Q could be calculated quite accurately. The input coupling
matched a 50-ohm coaxial line, and the output coupling was much smaller. Thus with the meas- ured Q and insertion loss, the relation between output power and tube voltage could be calculated.
1 1

The gas-handling system was made completely of metal and glass following the design used
for ultrahigh-vacuum systems. Bakeable metal valves were used for connections to the oil
diffusion pump and the bottle of spectroscopically pure gas. Gases used were Airco Reagent
grade; some were Airco Assayed Reagent grade. All pressures were measured at room tem-
perature and no corrections were made. Three different pressure gauges were used depending
on the pressure range. From about 1 mmHg upward, a metal diaphragm gauge incorporated into
a capacitance bridge was used. The metal diaphragm separated the clean gas system from an
auxiliary system which included a conventional mercury U-tube manometer and a McCleod gauge.
The capacitance bridge was balanced with both gas systems evacuated, then balanced again with
gas in both systems. The pressure in the clean system was then the same as that read in the
auxiliary system.
In the pressure range from about 3 microns to about 20 mmHg, a Pirani (hot-wire) gauge
was employed as one arm of a DC bridge circuit which was always kept in balance by adjusting the
voltage supplied to the bridge. The Pirani gauge was surrounded by an aluminum block which
was kept within 0.1 °C at 40°C by means of a heating element and a mercury contact thermometer,
both embedded in the block. Special low-temperature coefficient resistors were used in the
other arms of the bridge and a precision (|-percent) meter was used to read the bridge voltage.
The hot wire was maintained at a constant 140°C. In separate calibration tests using a CYC-
type, GM-100, triple-scale McCleod gauge and a conventional mercury manometer, the follow-
ing equation for the calibration curve was found to hold within the experimental accuracy over
the whole range of pressures for which the Pirani gauge is useful:
P = P. V2 - v/
where p is the pressure corresponding to any voltage V. Of the three parameters in the above equation, two (p and V?) vary with the nature of the gas. V. is the voltage necessary to bal-
ance the bridge in a good vacuum; V^ is the bridge voltage at pressures high enough so that the heat conductivity of the gas is constant, independent of pressure; and p is the pressure where
the bridge voltage has fallen off to V7 /sTz. A transparent overlay of a log-log graph of 2 2 2 2 V — V. vs p of the above equation was made letting p = 1, and V2 - V. = 1. Then calibra-
tion points in the high-pressure range (>1 mmHg) were obtained using the diaphragm pressure 2 2
gauge. A log-log plot of V — V. vs p for the experimental points was overlaid with the previ-
ously prepared transparency. The best fit was obtained and the (1,1) point of the transparency 2 2 covered the (V2 — V. , p ) point on the experimental plot. This had to be done for each gas and
each Pirani gauge used. It was found that the gauge could be relied on to hold its calibration as
long as the voltage V., necessary to balance the bridge in a vacuum, stayed the same. A change in V. indicates a surface change in the tungsten wire of the gauge, usually the formation or re- duction of oxides.
At pressures below 10" mmHg, an M. I. T. -modified Bayard-Alpert gauge was employed, calibrated* for each of the gases used with the aid of the CVC McCleod gauge. The ionization
gauge calibration is probably not very accurate (~ 20 percent) but the breakdown voltage turns
* W. B. Nottingham and F. L. Torney, Jr., "A Detailed Examination of the Principles of Ion Gauge Calibration/' Seventh Notional Symposium on Vacuum Technology Transactions (Pergamon Press, New York, 1960).
12

out to be quite independent of pressure in its range anyway (see Figs. 2 through 5). Using the
three pressure gauges described above, we were able to measure the pressure from 10 to
several hundred mmHg without introducing condensible vapors of any description into the system
under test.
The experimental procedure was to outgas the whole system using a torch until a pressure _Q
in the 10 -mmHg range was achieved. The ion gauge was outgassed and a multipactor discharge
was run in the experimental tube for several hours. At this point the valve to the diffusion pump
could be closed off and the pressure would not exceed 10" after about six hours even without
ion-gauge pumping. With ion-gauge pumping, the pressure would remain much lower. Gas was
then admitted and a pressure measurement made. RF voltage was brought up very slowly, and
the voltage at which breakdown occurred was noted. The darkened tube was viewed with a 1P21
photomultiplier tube to detect breakdown. Under some experimental conditions, breakdown pro-
duced no change in the electrical circuits and could only be detected by eye in a darkened room.
The photomultiplier was perfectly reliable in detecting breakdown. After an initial determination
of the breakdown voltage, the RF power was lowered and raised even more slowly through the
suspected breakdown voltage. After several such trials the scale reading for breakdown was
determined with great precision. A pressure run was made across the limits shown in Figs. 2
through 5 at each frequency; the frequencies were varied in steps of 1.5 to 1. At several low
pressures, where the lines are nearly horizontal, the pressure was fixed and the frequency was
varied so as to progress along a vertical line in the graphs. Oscillators delivered at least 50
watts at all frequencies from 300 cps to 1000 Mcps. At least 1000 volts could be produced across
the experimental breakdown tube. Frequencies were measured using a Beckman counter.
Xenon: — Our xenon breakdown measurements agree very well with those reported by
Bradford, et al. (d/\ - 0.0297) for pressures up to 10 mmHg. Above this pressure our break-
down fields are lower than theirs, lying between their "pure" and "impure" xenon curves. The
discrepancy probably comes from their use of a Pirani gauge to measure pressures. Above
10 mmHg for xenon, the Pirani gauge used in a bridge circuit is very inaccurate. When cali-
brating this gauge any impurities in the gas, particularly condensibles, would lead to a higher
voltage reading than for pure xenon. This effect, coupled with the flat voltage-pressure cali-
bration curve, would introduce large, systematic errors in reading the pressures above 10 mmHg.
The large scatter in their experimental points seems to confirm this suspicion.
28 Argon:— Our argon breakdown measurements agree well with those of Krasik, et al.
(d/x = 0.0555), MacDonald and Matthews 9 (d/x = 0.0442), and Vlaardingerbroek ° (0.00034 <
d/x< 0.00101) except for the low-pressure end of the latters curves, where our breakdown po-
tentials are generally lower. This can easily be explained by the fact that Vlaardingerbroek used
nickel electrodes and his curves approached the oscillation amplitude limit at their low-pressure
ends. Since our electrodes were glass with a much higher secondary-emission ratio than nickel,
their electron contribution due to secondary emission would be much larger, resulting in a lower
breakdown voltage. This difference should not appear at higher pressures where the experimental
agreement is quite satisfactory.
Neon:- Our results for neon are not in agreement with other workers (Fig. 7 illustrates the
discrepancies). We have plotted various reported results for diffusion-controlled breakdown;
all results should fall on the same curve. The most logical explanation of these discrepancies
13

MocDONALD AND BETTS10
FREEMAN (l-usec pulse)35
MacDONALD AND MATTHEWS29
PATEIUK34
PROWSE AND CL
HARRIES AND von ENGELJ
J L J I I MINI I05
pdfmmHg x cm)
Fig. 7. Diffusion-controlled breakdown in neon. Results of "Several experimenters.
is that neon can form a Penning mixture with most likely impurities. An argon impurity content of only one part in 10 can cause a large reduction in the breakdown potential. ' Most other
impurities would also form Penning mixtures with neon, whereas xenon and argon will not form
Penning mixtures with most impurities. Prowse and Clark recognized this fact when they com-
pared their neon results with those from known argon-neon Penning mixtures. On the other hand, Harries and von Engel invented a new mechanism involving light quanta to explain their extremely
low breakdown potentials. Their measurements in the low-frequency region are much lower than
ours, and they find a transition to higher breakdown values as d/x is reduced below 2X10
If the Penning effect explains their low breakdown voltages in the diffusion-controlled region,
then this transition near d/x = 2 x 10~ might be explained in terms of a change in impurity con-
tent or some other interesting mechanism involving the Penning effect. Until experiments are
made with known, well-controlled mixtures over the whole wavelength range, any discussion
would be mere speculation. 29 / Our low results, compared with those of MacDonald and Matthews (d/X = 0.0442), are
probably due to a small impurity in our gas. One batch of neon showed much lower breakdown
potentials so the results were discarded. Aside from the efforts already described to ensure a
clean gas-handling system, we made no other attempt to purify the gas. There was more scat- ter in the experimental points for neon than for any other gas we used. It would be interesting to
use getters and cataphoresis tubes to remove impurities. MacDonald and Betts*10 results for two different spacings (d/x = 0.0297 and 0.595) do not
29 agree with themselves or with the results reported later. We cannot explain this discrepancy.
Pateiuk's low results (d/x = 0.00263, 0.00525) are probably due to impurities. Freeman's
rather high results (d/x = 0.095) are probably due to the short pulse (1 u.sec) used in her break-
down studies because the experimental apparatus used almost surely had a high impurity content.
14

Q Helium:— Parallel-plate breakdown data for pure helium are reported by Reder and Brown.
The same data are reported in Brown's book (Ref. 2, pp. 144 and 150). Our electric fields lie
consistently a factor of 1.4 lower than these. There may be some confusion between peak and
rms values since the argon breakdown fields plotted on p. 150 of Brown's book and taken from 28 Krasik, et al., are definitely peak fields, but the graph is merely labeled E . We are led, in
other parts of the book (p. 142), to believe that E represents an rms value. All we can say is
that our values are all rms values.
Our breakdown voltages for helium are a factor of about two higher than those reported by o
Francis. Again, as in our discussion of the neon results, the difference may be attributed to
impurities in the gas since helium also forms Penning mixtures with various impurity gases.
Our disagreement with Reder and Brown may also be due to impurities in our gas.
IV. CONCLUSION
We have measured the breakdown potential in four inert gases over an extremely wide range
of the experimental parameters. Three breakdown regions are easily discernible on each graph: (a) the diffusion-controlled region, (b) the low-frequency region, and (c) the secondary-electron-
emission (multipactor) region. The dividing lines between these regions are easily discernible on all the graphs. The constant breakdown potential lines flow smoothly from one region to the next. Agreement with previous theory and experiment is good for all gases except neon where
large discrepancies, probably due to impurities, appear among all investigators. An interesting effect was observed in the low-frequency region for low pressures in argon
and xenon. When the transit time of the positive ions is approximately \ cycle, the breakdown 19 voltage is reduced. The effect is similar to that observed by Fuchs, et al., in hydrogen. An
extensive bibliography for AC breakdown in gases follows.
ACKNOWLEDGMENTS
The author wishes to acknowledge the excellent work by T. E. Maggiacomo,
who built the equipment and gathered and compiled all the experimental
data reported here. The help of C. B. Nelson (presently with U. S. Health,
Education and Welfare Department, Northeastern Radiological Health Lab-
oratory, Winchester, Mass.), who designed some of the experimental ap-
paratus, is also acknowledged.
15

REFERENCES
1. S. C. Brown, "Breakdown in Gases: Alternating and High Frequency Fields/' Handbuch der Physik, Vol. 22 (Springer, Berlin, 1956), pp.531-575.
2. , Basic Data of Plasma Physics (Wiley, New York, 1959).
3. H. Gutton, "Recherches sur les proprietes dielectriques des gaz ionises et la decharge en haute frequence," Ann. Physik 13, 62 (1930).
4. J. Thomson, "Sparking Potentials at Ultra-High Frequency," Phil. Mag. 23, 1 (1937).
5. S. Githens, "The Influence of Discharge Chamber Structure Upon the Initiating Mechanism of the High-Frequency Discharge," Phys. Rev. 57, 822 (1940).
6. A.D. MacDonald and S. C. Brown, "High Frequency Gas Discharge Breakdown in Hydrogen," Phys. Rev. 76, 1634(1949).
7. A. J. Hatch and H.B. Williams, "The Secondary Electron Resonance Mechanism of Low- Pressure High-Frequency Gas Breakdown," J. Appl. Phys. 25, 417 (1954).
8. G. Francis, lonization Phenomena in Gases (Academic Press, New York, 1960).
9. F. H. Reder and S. C. Brown, "Energy Distribution Function of Electrons in Pure Helium," Phys. Rev. 95, 885(1954).
10. A. D. MacDonald and D. D. Betts, "High Frequency Gas Discharge Breakdown in Neon," Can. J. Phys. 30, 565(1952).
11. W. P. AM is and S. C. Brown, "High Frequency Electrical Breakdown in Gases," Phys. Rev. 87, 419(1952).
12. A.D. MacDonald and S. C. Brown, "High Frequency Gas Discharge Breakdown in Helium," Phys. Rev. 75, 411 (1949).
13. M.A. Herlin and S. C. Brown, "Electrical Breakdown of a Gas Between Coaxial Cylinders at Microwave Frequencies," Phys. Rev. 74, 910 (1948).
14. A. D. MacDonald and S. C. Brown, "Electron Diffusion in a Spherical Cavity," Can. J. Phys. 28, 168(1950).
15. P.M. Platzman and E. H. Solt, "Microwave Breakdown of Air in Nonuniform Electric Fields," Phys. Rev. 1J9, 1143(1960).
16. S. B. Self and H.A. Boot, "The Effect of Field Configuration on Gas Discharge Breakdown in Microwave Cavities at Low Pressure," J. Electron. Control 6, 527 (1959).
17. L. Gould and L.W. Roberts, "Breakdown of Air at Microwave Frequencies," J. Appl. Phys. 27, 1162(1956).
18. W. Fuchs, "Zündung bei Wechselspannung. Zündung bei pulsierender Bestrahlung," Z. Physik 103, 709(1936).
19. , et ql., "Zündung der elektrischen Gasentladung im homogenen Wechselfeld," Z. Physik ]45, 1 (1956).
20. H. Luft, "Uberschlagspannung bei Hochfrequenz mittlerer Wellenlänge an einfachen Anordnungen,"Arch. Elektrotech. 31, 93(1937).
21. H. Lassen, "Frequenzabhängigkeit der Funkenspannung in Luft," Arch. Elektrotech. 25, 322 (1931).
22. G. Francis, "The Growth of Electrodeless Discharges in Hydrogen," Proc. Phys. Soc. (London) B68, 137(1955).
23. E. F. Vance, "One-Sided Multipactor Discharge Modes," J. Appl. Phys. 34, 3237 (1963).
24. D. H. Preist, "Multipactor Effects and Their Prevention in High-Power Microwave Tubes," Microwave J. 6, 55 (October 1963).
lb

25. J. R. M. Vaughan, "Some High-Power Window Failures/' Trans. IRE, PGED ED-8, 302 (1961).
26. D. K. Aitken, "Long-Transit Time Multipactoring at Ultra-High Frequencies and the Effect of Surface Emitting Layers/' Proc. lnst. Elec. Engrs. (London) B105, Supp. 12, 824 (1958).
27. H.M. Bradford, et a]., "Electrical Breakdown in Xenon and Krypton at Ultra-High Frequencies/' Can. J. Phys. 37, 1166(1959).
28. S. Krasik, D. Alpert and A. O. McCoubrey, "Breakdown and Maintenance of Microwave Discharges in Argon," Phys. Rev. 76, 722 (1949).
29. A. D. MacDonald and J. H. Matthews, "High Frequency lonization Coefficients in Neon-Argon Mixtures," Phys. Rev. 98, 1070(1955).
30. M. T. Vlaardingerbroek, "Gas Discharge Breakdown as a Function of Frequency," Appl. Sei. Res. (Hague) B5, 139 (1955).
31. H. J. Oskam, "High Frequency Gas Discharge Breakdown in Neon-Argon Mixtures," J. Appl. Phys. 27, 848(1956).
32. W. A. Prowse and J. L. Clark, "Ultra-High Frequency Gas Breakdown Between Rogowski Electrodes," Proc. Phys. Soc. (London) 72, 625 (1958).
33. W. L. Harries and A. von Engel, "The Role of Light Quanta in the Electric Breakdown of Gases," Proc. Roy. Soc. (London) A222, 490 (1954).
34. G. M. Pateiuk, "An Investigation of High-Frequency Discharge," Soviet Phys.-JETP 3, 14(1956).
35. J. M. Freeman, "Investigation of Electrical Breakdown of Gases at Low Pressures in the Microwave Region," C. S. I. R. Australia RPR 50 (November 1946).
17


BIBLIOGRAPHY ON AC BREAKDOWN IN GASES
1890 - 1899
N. Tesla, Elec. Engr. 7, 549 (1891).
J. J. Thomson, Phil. Mag. 32, 321, 445 (1891).
E. Wiedemann and H. Ebert, Wied. Ann. i, 549 (1893).
1900 - 1929
B. Davis, "The Theory of the Electrodeless Discharge," Phys. Rev. 17, 501 (1903).
"Theory of the Electrodeless Ring Discharge," Phys. Rev. 20, 129 (1905).
J. Algermissen, "Verhältnis von Schlagweite und Spannung bei schnellen Schwingungen," Ann. Physik 19, 1007 (1906).
Alexanderson, "Sphere Gap Discharge Voltages at High Frequencies," Gen- eral Electric Review, 427 (1914).
J. C. Clark and H. J. Ryan, "Sphere Gap Discharge Voltages at High Fre- quency," Proc. AIEE 33, 2, 937 and 1014 (1914).
F. W. Peek, Jr., "The Sphere Gap as a Measuring High Voltage," Proc. AIEE 33, 889 (1914).
J. B. Whitehead and W. S. Gorton, "The Electric Strength of Air. Section V, The Influence of Frequency," Proc. AIEE 33, 915 (1914)'.
J.C. Clark and H. J. Ryan, Elektrotech. Z. 36, 484 (1915).
F. Kirchner, Ann. Physik 77, 287 (1915).
F.W. Peek, Proc. AIEE 36, 1695 (1915).
Elektrotech. Z. 37, 11, 246 (1916).
E.O. Hulbert, "Phenomena in Gases Excited by Radio Frequency Currents," Phys. Rev. 20, 127 (1922).
A. Leontiewa, "Über die Entladungspotentiale fur schnelle elektrische Schwingungen," Physik Z. 23, 33 (1922).
C. Gutton, "Sur la decharge a haute frequence dans les gaz rarefies," Jour. Phys. 4, 420 (1923).
, S.K. Mitra and V. Ylostalo, "Sur la decharge a haute frequence dans les gaz rarefies," C. R. Acad. Sei. Paris 1_76, 1871 (1923).
P.O. Pedersen, Ann. Physik 71, 317 (1923).
W. O. Schumann, Elektrische Durchbruchfeldstärke von Gasen (Springer, Berlin, 1923).
E. Goebeler, "Über die dielektrische Eigenschaft der Luft und einiger fester Isoliermaterialien bei hochgespannter Hochfrequenz," Arch. f. Elektro. 14, 491 (1924).
C. Gutton, "Sur la decharge electrique a frequence tr6s elev6e," C.R Acad. Sei. Paris 1_78, 467 (1924).
A. Palm, Z. techn. Phys. 4. 233, 258 (1924).
F. Kirchner, "Über die Glimmentladung bei schnell wechselnden Feld," Ann. Phys. 77, 287 (1925).
E. Manz and R. Seeliger, "Über die dynamische Zündspannung der Glimmentladung," Z. Physik 25, 13 (1925).
A. Palm, "Elektrostatische Voltmeter und Glimmröhren zur Spannungsmessung mit Hochfrequenz," Z. Hochfrequenz 26, 13 (1925).
19

E. W. B. Gill and R. H. Donaldson, "A New Method of Obtaining a Luminous Dis- charge in Gases at Very Low Pressures," Phil. Mag. 2_, 129 (1926).
W. Rogowski, "Townsend's Theorie und der Durchschlag der Luft bei Stosspannung," Arch. Elektrotech. 16, 496 (1926).
J.J. Thomson, "The Electrodeless Discharge Through Gases," Phil. Mag. 4, 1128 (1927).
L.E. Reukema, "Abridgement of: The Relation Between Frequency and Spark-over Voltage in a Sphere-gap Voltmeter," J. AIEE 46, 1314 (1927).
R. W. Wood and A. L. Loomis, "Spectra of High-Frequency Discharges in Super-Vacuum Tubes," Nature 120, 510 (1927).
C. Gutton and H. Gutton, "Sur la d^charge electrique en haute frequence," C. R. Acad. Sei. Paris 186, 303 (1928).
E. Hiedemann, "Über die Hochfrequenz-Glimmentladung in Wasserstoff," Ann. Physik 85, 649 (1928).
Inge and Walther, "Durchschlag von festen Isolatoren bei hochfrequenz," Arch. Elektrotech. 21, 209 (1928).
L. E. Reukema, "The Relation Between Frequency and Spark Over Voltage for a Sphere Gap Voltmeter," Trans. AIEE 47, 38 (1928).
W. Rogowski, "Stosspannung und Durchschlag bei Gasen," Arch. Elektrotech. 20, 99 (1928).
J. S. Townsend and R. H. Donaldson, "Electrodeless Discharges," Phil. Mag. 5, 178 (1928).
R. L. Hayman, "High Frequency Discharges in Helium and Neon," Phil. Mag. 7, 586 (1929).
1930 - 1939
J. Kampschulte, "Luftdurchschlag und Überschlag mit Wechselspannung von 50 und 100,000 Hertz," Arch. Elektrotech. 24, 525 (1930).
H. Lassen, "Frequenzabhängigkeit der Funkenspannung in Luft," Z. Physik 31, 868 (1930).
W.O. Schumann, "Über Gasdurchschlag und Raumladung," Z. techn. Phys. 11, 131 (1930).
J. Thomson, "On the Mechanism of the Electrodeless Discharge," Phil. Mag. 10, 280 (1930).
R. W. Wood, "Plasmoidal High-Frequency Oscillatory Discharges in Non- conducting Vacua," Phys. Rev. 35, 673 (1930).
E. W. B. Gill and R. H. Donaldson, "The Sparking Potential of Air for High- Frequency Discharges," Phil. Mag. 12, 719 (1931).
F. Misere, "Luftdurchschlag bei Niederfrequenz und Hochfrequenz an verschiedenen Elektroden," Arch. Elektrotech. 26, 123 (1932).
L. Rohde, "Gasentlandungen bei sehr hohen Frequenzen," Ann. Physik \2, 569 (1932).
P. L. Bellaschi, "The Measurement of High Surge Voltages," Trans. AIEE 52, 544, 553 (1933).
K.K. Darrow, "High Frequency Phenomena in Gases, Second Part," Bell System Tech. J. 12, 91 (1933).
P. L. Bellaschi and P. H. McAuley, "Impulse Calibration of Sphere Gaps," Elec. J. 31, 228 (1934).
P.T. Farnsworth, "Television by Electron Image Scanning," J. Franklin Inst. 218, 411 (1934).
W. Förster, "Die Kugelfunkenstrecke bei sehr geringer Stossdauer," Elektrotech. Z. 55, 689 (1934).
20

F. Misere, "Gasentladung bei Niederund Hochfrequenz (KoronaanfangsSpannung und Koronaverluste)," Arch. Elektrotech. 28, 411 (1934).
F. Muller, "Der elektrische Durchschlag von Luft bei sehr hohen Fre- quenzen," Arch. Elektrotech. 28, 341 (1934).
J. Thomson, "The High Frequency Glow Discharge," Phil. Mag. 18, 696 (1934).
P. L. Bellaschi and W. L. Teague, "Sphere Gap Characteristics on Very Short Impulses," Elec. J. 32, 120 (1935).
W. Henneburg, R. Orthuber and E. Stendel, "Zur Wirkungsweise des Elektronenvervielfachers I," Z. tech. Physik 17, 115 (1936).
A. Köher, "Die Stossdurchschlagspannung und der Stossdurchschlag im homogenen Feld bei niederen Drucken (100 bis 760 Torr)," Arch. Elektrotech. 30, 528 (1936).
H. Bocker, "Die Durchschlagsenkung bei hochfrequenz," Arch. Elektrotech. 31, 166 (1937).
J. Townsend and E. W. B. Gill, "Generalization of the Theory of Electrical Discharges," Phil. Mag. 26, 290 (1938).
W. Baer, "Spitzentladungen in Luft bei Drucken von 1 bis 30 at," Arch. Elektrotech. 32, 684 (1939). P. Jacottet, "Zur Frage der Messung von Hochfrequenz Spannungen und Stosspannungen kürzester Dauer mit der Kugelfunkenstrecke," Elektrotech. Z. 60, 92 (1939).
L. M. Myers, Electron Optics (Chapman and Hall, Ltd., New York, 1939), pp.309-325.
E. W. Seward, "The Electric Strength of Air at High Frequencies," J. Inst. Elec. Engrs. (London) 84, 288 (1939).
1940 - 1949
A.E. Brown, "The Effect of a Magnetic Force on High Frequency Discharges in Pure Gases," Phil. Mag. 29, 302 (1940). P.A. Ekstrand, "Radio Frequency Spark-Over in Air," Proc. IRE 28, 262 (1940).
L. Rohde and G. Wedemeyer, "Die Messung von Verlusten bei Hochspannung hoher Frequenz," Elektrotech. Z. 61, 577 (1940).
, "Verlust und Durchschlag bei Hochspannung hoher Frequenz," Elektrotech. Z. 61, 1161 (1940).
R. Zouckerman, "Decharge en Haute Frequence avec Electrodes," Ann. Phys. Paris 13, 78 (1940).
B. Ganger, "Der Hochfrequenzdurchschlag verdichteter Gase," Arch. Elektrotech. 37, 267 (1943). H. Alfen and H. J. Cohn-Peters, "Eine neue Art von Hochfrequenz-Engladung un Vakuum und deren Verwendung als Ionenquelle," Arkiv for Matematic Astr. Fysik 31A, No. 18, 1 (1944). T. Holstein, "Initiation of High Frequency Gas Discharges," Phys. Rev. 69, 50 (1946). , "Energy Distribution of Electrons in High Frequency Gas Discharges," Phys. Rev. 70, 367 (1946).
H. Margenau, "Conduction and Dispersion of Ionized Gases at High Frequencies," Phys. Rev. 69, 508 (1946). C. R. Nieserwanger and J. R. Holmes, "Electrodeless Discharges at High Frequencies and Low Pressures," J. Opt. Soc. Am. 36, 581 (1946).
D.Q. Posin, "Lowering of Electrical Breakdown Field Strength at Micro- wave Frequencies Due to Externally Applied Magnetic Field," Phys. Rev. 69, 541 (1946).
21

R. Cooper, "Experiments on the Electric Strength of Air at Centimetre Wavelengths," J. Inst. Elec. Engrs. (London) 94, Part III, No. 31, 315 (1947).
E. W. B. Gill and A. von Engel, "Low Pressure Electrical Discharges," Nature 159, 404 (1947).
F. Kirschner, "The Effect of a Direct Current Potential on the Initiation of a Radio Frequency Discharge," Phys. Rev. 72, 348 (1947).
N. R. Labrum, "Investigation of the Breakdown of Gases by Pulsed Radio- Frequency Electric Fields," C.S. I. R. Australia RPR 85 (December 1947).
A.A. Varela, "Effect of Direct Current Potential on Initiation of Radio Frequency Discharge," Phys. Rev. 71, 124 (1947).
M. Chenot, "Recherches experimentales sur la decharge en haute frequence," Ann. Phys. Paris 3, 277 (1948).
R. Cooper and W. A. Prowse, "High Frequency Electrical Breakdown in Gases," J. Inst. Elec. Engrs. (London) 95, Part III, 342 (1948).
E. W. B. Gill and A. von Engel, "Starting Potentials of High Frequency Gas Discharge at Low Pressure," Proc. Roy. Soc. (London) A192, 446 (1948).
D. H. Hale, "The Breakdown of Gases in High Frequency Electrical Fields," Phys. Rev. 73, 1046 (1948).
L. M. Hartman, "Theory of High Frequency Gas Discharges. III. High Frequency Breakdown," Phys. Rev. 73, 316 (1948).
M. A. Herlin and S. C. Brown, "Breakdown of a Gas at Microwave Frequencies," Phys. Rev. 74, 291 (1948). , "Microwave Breakdown of a Gas in a Cylindrical Cavity of Arbitrary Length," Phys. Rev. 74, 1650 (1948).
H. Margenau, "Theory of High Frequency Gas Discharges. I. Methods for Calculating Electron Distribution Functions," Phys. Rev. 73, 297 (1948).
and L. M. Hartman, "Theory of High Frequency Gas Discharges. II. Harmonic Components of the Distribution Function," Phys. Rev. 73, 309 (1948).
_, "Theory of High Frequency Gas Discharges. IV. Note on the Similarity Principle," Phys. Rev. 73, 326 (1948).
_, "Erratum: Theory of High Frequency Discharges. IV," Phys. Rev. 74, 706 (1948).
J. A.Pirn, "Electrical Breakdown Strength of Air at Ultra-High Frequencies," Nature 161, 683 (1948).
D.Q. Posin, "The Microwave Spark," Phys. Rev. 73, 496 (1948).
W.A. Prowse and R. Cooper, "Gas Discharge at Centimetre Wavelengths," Nature 161, 310 (1948).
G. L. Ragan, Microwave Transmission Circuits (McGraw-Hill, New York, 1948), pp.227-242.
S. C. Brown and A. D. MacDonald, "Limits for the Diffusion Theory of High- Frequency Gas Discharge Breakdown," Phys. Rev. 76, 1629 (1949).
E. W. B. Gill and A. von Engel, "Starting Potentials of Electrodeless Discharges," Proc. Roy. Soc. (London) 197A, 107 (1949). M.H. Greenblatt, Rev. Sei. Instr. 20, 646 (1949).
A.D. MacDonald and S. C. Brown, "Microwave Gas Discharge Breakdown in Helium," Phys. Rev. 75, 13 24 (1949). J. A. Pirn, "The Electrical Breakdown Strength of Air at Ultra-High Frequencies," J. Inst. Elec. Engrs. (London) 96, Part III, 117 (1949).
W.A. Prowse and W. Jasinski, "Oscillographic Observations on Ultra-High Frequency Sparks," Nature 163, 103 (1949).
2.Z

1950 - 1959
A.W. Bright, "High Frequency Discharges in Gases/1 Nature 165, 811 (1950).
G. Francis and A. von Engel, "Development of the Low Pressure Electrodeless Discharge in a High-Frequency Electric Field," Proc. Phys. Soc. (London) B63 823 (1950).
K. Krebs, "Über die Pendalvervielfachung von Sekunderelektronen in hochfrequenten Feldern," Z. angew. Phys. 2, 400 (1950).
B. Lax, P. Allis and S. C. Brown, "The Effect of Magnetic Field on the Breakdown of Gases at Microwave Frequencies," J. Appl. Phys. 21, 1297 (1950).
W. A. Prowse, "The Initiation of Breakdown in Gases Subject to High Frequency Electric Fields," J. Brit. IRE 10, 333 (1950).
"A Note on Ultra-High Frequency Gas Breakdown," Proc. IEE 97, Part III, No. 48, 253 (1950).
L. J. Varnerin and S. C. Brown, "Microwave Determination of Average Electron Energies and the First Townsend Coefficient in Hydrogen," Phys. Rev. 79, 946 (1950).
S.C. Brown, "High-Frequency Gas-Discharge Breakdown," Proc. IRE 39, 1493 (1951).
R. Fatehchand, "Positive Ion Formation in Air Prior to High-Frequency Break- down," Nature 167, 566 (1951).
W. L. Harries and A. von Engel, "The Mechanism of the Low-Frequency Electrodeless Discharge in Chlorine and the Influence of'Irradiation," Proc. Phys. Soc. (London) B64, 915 (1951). F. L. Jones and G.D. Morgan, "High Frequency Discharges: I Breakdown Mechanism and Similarity Relationship. II Similarity Relationship for Minimum Maintenance Potentials," Proc. Phys. Soc. (London) 64B, 560 (1951). W. A. Prowse and W. Jasinski, "Observations on the Electrical Breakdown of Gases at 2800 Mcps," Proc. IEE 98, Part IV, No. 1, 101 (1951).
S. Whitehead, Dielectric Breakdown of Solids (Clarendon Press, Oxford, 1951).
H.M. Barlow, "The Relative Power-Carrying Capacity of High Frequency Waveguides," Proc. Instn. Elec. Engrs. 99, Part III, 21 (1952).
D. Dettinger, "A Standard Waveguide Spark Gap," Proc. IRE 40, 1604 (1952).
T. Kihara, "The Mathematical Theory of Electrical Discharges in Gases," Rev. Mod. Phys. 24, 45 (1952).
A.D. MacDonald, "High Frequency Breakdown in Neon," Phys. Rev. 88, 420 (1952).
W.A. Prowse and W. Jasinski, "Observations on the Electrical Breakdown of Gases at 2800 Mcps. Part II— Relative Breakdown Stresses, Statistical Lags and Formative Lags," Proc. Instn. Elec. Engrs. 99, Part IV, 194 (1952).
D. Dettinger and R. D. Wengenroth, "A Standard Waveguide Spark Gap," Trans. IRE, PGMTT MTT-1, 39(1953).
G. Francis and A. von Engel, "The Growth of High Frequency Electrodeless Discharges," Trans. Roy. Soc. (London) 246A, 143 (1953).
J. W. Gibson and CG. Miller, "The Electric Strength of Sulfurhexafluoride at Radio Frequencies," J. Electrochem. Soc. ^00, 265 (1953).
W. L. Harries, "The Electrical Breakdown of Air Between Insulators," Proc. Instn. Elec. Engrs. 100, Part Ha, 132 (1953).
and A. von Engel, "A New Electron Multiplication Process," Nature (London) 171, 517 (1953).
A. J. Hatch and H. B. Williams, "On the Theory of the High Frequency Secondary Electron Resonance Discharge Mechanism," Phys. Rev. 89, 339 (1953).
23

F. Llewellyn-Jones and G. C. Williams, "Collisional Processes and Similarity in High-Frequency Discharges in Helium," Proc. Phys. Soc. (London) 66B, 17 (1953).
G. D. Morgan, "High Frequency Discharges in Gases," Sei, Progress 41, 22 (1953).
W. A. Prowse and P. E. Lane, "Breakdown of a Gas Subject to Crossed Electric Fields," Nature (London) 172, 116 (1953).
K. Bol, "The Multipactor Effect in Klystrons," IRE Natl. Conv. Record 2, Part 3, 151 (1954).
A. W. Bright and H.C. Huang, "Formative Time-Lag Studies with High- Frequency Discharges," Proc. Instn. Elec. Engrs. 100, Part III, 407 (1954).
F. Kossel and K. Krebs, "Der Einfluss von Sekundärelektronen Auf die Zündung von Hochfrequenzentladungen," Z. Physik 139, 189 (1954).
A. W. Bright and H. C. Huang, "Formative Time-Lag Studies with High- Frequency Discharges," Proc. Instn. Elec. Engrs. 102(C), 42 (1955).
S.C. Brown, "Microwave Gas Discharge Breakdown," Appl. Sei. Research 5B, 97 (1955).
W. Fuchs, "Dependence of Breakdown on Dark Current and Frequency," Appl. Sei. Res. (Hague) B5, 109 (1955).
G. K. Hart and M.S. Tanenbaum, "High Power Breakdown of Microwave Compo- nents," IRE Natl. Conv. Record, Vol.3, Part 8, 62 (1955). A. J. Hatch and H. B. Williams, "Pressure Limits of the High-Frequency Secondary Electron Resonance Breakdown Mechanism," Phys. Rev. 100, 1228 (1955).
C. W. Hoover and R.K. Smither, "Secondary Electron Resonance Discharge Mechanism," Phys. Rev. 98, 1149 (1955).
K. Krebs and H. Meerbach, "Die Pendelvervielfachung von Sekundärelektronen," Ann. Physik 15, 189 (1955).
W.A. Prowse, "Ultrahigh Frequency Breakdown in Irradiated Parallel Plate Gaps," International Symposium on Electron Discrimination in Gases, Delft, Netherlands, 1955, pp. 127-130. and P.E. Lane, "Ultra-high Frequency Breakdown in Irradiated Parallel Plate Gaps," Appl. Sei. Research 5B, 127 (1955).
J.E. Salmon, "Theorie de la decharge haute frequence dans les gaz aux basses pressions calcul de la fonction de distribution des electrons," J. Phys. Radium 16, 210, 384 (errata) (1955).
G.K. Hart, F. R. Stevenson and M.S. Tanenbaum, "High Power Breakdown of Microwave Structures," IRE Convention Record, Part 5, 199 (1956). K. Krebs and H. Meerbach, "Die Elektronendichte und Geshwindigkeitsverteilung bei der Pendelvervielfachung von Sekundärelektronen," Ann. Physik 18, 146 (1956).
W.A. Prowse and P.E. Lane, "The Breakdown of Gases Subject to Crossed Electric Fields," Proc. Phys. Soc. (London) B69, 33 (1956).
R. R.T. Fatechand, "The Electrical Breakdown of Gaseous Dielectrics at High Frequencies," Proc. IEE 100-11, 585 (1957).
W. Fuchs, "High Pressure Breakdown with Small PD Values, AC Breakdown," Proceedings of Third International Conference on Ionization Phenomena in Gases (Societä Italiana di Fisica, Venice, 1957), pp. 353-358.
V. E. Golant, "The Origin of a Pulse Discharge in Neon at UHF," Zhur. Tekh. Fiz. 27, 1482, Soviet Phys.-Tech. Phys. 2, 1370(1957).
, "Formation of a Pulsed Discharge in Argon at UHF, I. Electron Velocity Distribution Function," Zhur. Tekh. Fiz. 2_7, 756, Soviet Phys.-Tech. Phys. 2, 684 (1957).
24

V. E. Golant, "Production of a Pulsed Discharge in Argon at UHF, II. Production of a Discharge by Rectangular Power Pulses," Zhur. Tekh. Fiz. 27, 771, Soviet Phys.-Tech. Phys. 2, 699 (1957). , "Initiation of Pulsed Discharge in Argon at UHF, HI. Initiation of the Discharge Under the Action of an Exponentially Increasing High Frequency Power," Zhur. Tekh. Fiz. 27, 2071, Soviet Phys.-Tech. Phys. 2, 1919 (1957).
F. Llewellyn-Jones, Ionization and Breakdown in Gases (Methuen, London; Wiley, New York, 1957). D. J. Rose and S. C. Brown, "Microwave Gas Discharge Breakdown in Air, Nitrogen and Oxygen," J. Appl. Phys. 28, 561 (1957).
J.E. Salmon,^ "Theorie de la decharge haute frequence dans les gaz aud faibles pressions. Etude experimentale des sources dions du type haute frequence," Ann. Phys. Paris 2, 827 (1957).
H. Tamagawa, "A Theory of High Frequency Discharge in High Vacuum," Electrotechnical Journal of Japan 3, 93 (1957).
"On the Mechanism of the High Frequency Vacuum Discharge," Electrotechnical Journal of Japan 3, 42 (1957).
T. S. Abramova and V. E. Golant, "Effect of Diffusion on the Formation of a Pulsed Ultra-High Frequency Discharge in Argon," Zhur. Tekh. Fiz. 28, 1096, Soviet Phys.-Tech. Phys. 3, 1022 (1958).
P. S. Bulkin and M. Z. Khokhlov, "The Statistical Delay in the Initiation of a Microwave Pulse Discharge," Radiotekhnika i Elektronika 3, No. 6, 806 (1958).
V. E. Golant, Usp. Fiz. Nauk. 65, 39 (1958).
A. J. Hatch and H. B. Williams, "Multipacting Modes of High Frequency Gaseous Breakdown," Phys. Rev. 112, 681 (1958).
M.Z. Khokhlov, et al., "Influence of Radioactive Irradiation on the Initiation of Super-High Frequency Pulse Discharge," Radiotekhnika i Elektronika 3, 704 (1958).
V. E. Mitsuk, et al., "Electrical Discharge in Air at 3.2 cm Wavelength," Radiotekhnika i Elektronika 3, 152 (1958).
G. S. Solutsev and G. N. Zastenker, "The Influence of Humidity on the Initiation of Microwave Pulse Discharges," Radiotekhnika i Elektronika 3, No. 6, 811 (1958).
W.G. Townsend and G.C. Williams, "The Electrical Breakdown of Gases in Uniform High Frequency Fields at Low Pressure," Proc. Phys. Soc. (London) 72, 823 (1958).
F. Arama, "SFfc Waveguide Dielectric Breakdown Curves," Space/Aeronautics (May 1959), p. 138. J.B. Chown, et al., "Voltage Breakdown Characteristics of Microwave Antennas," Proc. IRE 47, 1331 (1959).
Kh. A. Dzherpetov, "The Effect of the Temperature of an Auxiliary Electrode on the Ignition of a High-Frequency Discharge in Helium," Izv. Akad. Nauk. S. S. S. R., Ser. Fiz. 23, No. 8, 1036 (1959).
V. E. Golant, "Initiation of Super-High Frequency Pulse Discharges in Inert Gases," Izv. Akad. Nauk. S.S.S.R., Ser. Fiz. 23, No. 8, 942 (1959).
"Correlation Between the Characteristics of Super-High Frequency and Direct Currents in Gases," Izv. Akad. Nauk. S.S.S.R., Ser. Fiz. 23, 956 (1959). K. Krebs, "FrequenzVervielfachung im Zentimeterwellengebiet durch Sekundärelektronen, Z. Physik 154, 19 (1959).
.and H. V. Villiez, "Die Anregung von Hohlraumresonatoren dureh Pendelvervielfachung von Sekundärelektronen," Z. Physik 154, 27 (1959).
A. D. MacDonald, "High Frequency Breakdown in Air at High Altitudes," Proc. IRE 47, 436 (1959).
W. J. Sutherland, "Electrical Breakdown in Waveguides at 3000 Mcps," Electron. Eng. (London) 26, 538 (1959).
25

S. J. Tetenbaum and R.M. Hill, "High Power, Magnetic Field Controlled Microwave Gas Discharge Switches," Trans. IRE, PGMTT MTT-7, 73 (1959).
I960 - 1963
W. E. Scharfman, "Voltage Breakdown of Antennas at High Altitudes," Proc. IRE 48, 1881 (1960).
R. Akerib, "Microwave Breakdown of the Atmosphere," Fifth International Conference on Ionization Phenomena in Gases, Munich (North Holland Publishing Co., Amsterdam, 1961), pp. 986-991.
S. B. Cohn, "Rounded Corners in Microwave High-Power Filters and Other Components," Trans. IRE, PGMTT MTT-9, 389 (1961). A. J. Hatch, "Electron Bunching in the Multipacting Mechanism of High- Frequency Discharge," J. Appl. Phys. 32, 1086 (1961).
D. H. Preist and R. C. Talcott, "On the Heating of Output Windows of Micro- wave Tubes by Electron Bombardment," Trans. IRE, PGED ED-8, No. 4, 243 (1961).
M. P. Forrer and C. Milazzo, "Duplexing and Switching with Multipactor Discharges," Proc. IRE 50, 442 (1962).
R. C. Talcott, "The Effects of Titanium Films on Secondary Electron Emission Phenomena in Resonant Cavities and at Dielectric Surfaces," Trans. IRE, PGED ED-9, No. 5, 405 (1962).
A. D. MacDonald, D. U. Gaskell and H. N. Gitterman, "Microwave Breakdown in Air, Oxygen and Nitrogen," Phys. Rev. 130, 1841 (1963).
A. Miller, H. B. Williams and O. Theimer, "Secondary-Electron-Emission Phase-Angle Distribution in High-Frequency Multipacting Discharges," J. Appl. Phys. 34, 1673 (1963).
26
UNCLASSIFIED Security Classification
DOCUMENT CONTROL DATA - R&D (Security classification of title, body of abstract and indexing annotation must be entered when the overall report is classified)
I. ORIGINATING ACTIVITY (Corporate author)
Lincoln Laboratory, M.I.T.
2a. REPORT SECURITY CLASSIFICATION
Unclassified 2b. GROUP
None
3. REPORT TITLE
AC Breakdown in Gases
4. DESCRIPTIVE NOTES (Type of report and inclusive dates)
Technical Report
5. AUTHOR(S) (Last name, first name, initial)
Muehe, Charles E.
6. REPORT DATE 26 February 1965
7«. TOTAL NO. OF PAGES
32 7b. NO. OF REFS
221
8a. CONTRACT OR GRANT NO.
AF 19(628)-500 b. PROJECT NO.
None
9«. ORIGINATOR'S REPORT NUMBER(S)
Technical Report 380
9b. OTHER REPORT NO(S) (Any other numbers that may be assigned this report)
ESD-TDR-65-53
10. AVAILABILITY/LIMITATION NOTICES
None
II. SUPPLEMENTARY NOTES
None
12. SPONSORING MILITARY ACTIVITY
Air Force Systems Command, USAF
13. ABSTRACT
The breakdown potential of helium, neon, argon and xenon was measured over the frequency range from DC to 1000 Mcps, and the pressure range from 10_8 to 600 mmHg employing a glass breakdown cell with 1-cm spacing. Graphs showing contours of constant breakdown potential as a function of pd and d/X are presented. These graphs show three distinct breakdown regions: (1) the diffusion-controlled region, (2) the secondary-electron-emission (multipactor) region, and (3) the low-frequency region. The breakdown mechanism in each of these regions is explained. An extensive bibliography on AC breakdown in gases is included.
14. KEY WORDS
gas discharges plasma physics gas ionization multipactor
27 UNCLASSIFIED Security Classification


Printed by United States Air Force L. G. Hanscom Field Bedford, Massachusetts