unclassified ad number - dtic.mildtic.mil/dtic/tr/fulltext/u2/061817.pdf · and of the resonance...
TRANSCRIPT
UNCLASSIFIED
AD NUMBER
AD061817
NEW LIMITATION CHANGE
TOApproved for public release, distributionunlimited
FROMDistribution authorized to U.S. Gov't.agencies and their contractors;Administrative/Operational Use; NOV 1954.Other requests shall be referred to US AirForce Wright Air Development Center, Attn:Aero Medical Laboratory, Wright-PattersonAFB, OH 45433.
AUTHORITY
AFAL ltr 17 Aug 1979
THIS PAGE IS UNCLASSIFIED
DO ',T DES}RGY
WADC TECHNICAL REPORT 54-24 TiTh ;,
JAC) FILE COPY
THE RESPONSE OF THE HUMAN SKULL TOMECHANICAL VIBRATIONS
ERNST K. FRANKE
AERO MEDICAL LABORATORY
NOVEMBER 1954
statement AApproved for Public Release
QtOSO7/13 /1%~WRIGHT AIR DEVELOPMENT CENTER
NOTICE
When Government drawings, specifications, or other data areusedfor any purpose other than in connection with a definitely related Govern-ment procurement operation, the United States Government thereby in-curs no responsibility nor any obligation whatsoever; and the fact thatthe Government may have formulated, furnished, or in any way suppliedthe said drawings, specifications, or other data, is not to be regardedby implication or otherwise as in any manner licensing the holder orany other person or corporation, or conveying any rights or permissionto manufacture, use, or sell anypatented invention that may in any waybe related thereto.
-, - - -- --------.. ...

WADC TECHNICAL REPORT 54-24
THE RESPONSE OF THE HUMAN SKULL TO
MECHANICAL VIBRATIONS
ERNST K. FRANKE
AERO MEDICAL LABORATORY
NOVEMBER 1954
PROJECT No. 7210
TASK No. 71704
WRIGHT AIR DEVELOPMENT CENTER
AIR RESEARCH AND DEVELOPMENT COMMAND
UNITED STATES AIR FORCE
WRIGHT-PATTERSON AIR FORCE BASE, OHIO
Carpenter Litho & Prtg. Co., Springfield, 0.200 - 15 March 1955

FOREWORD
This research was conducted by the Bio-Acoustics Section of theAero Medical Laboratory, Directorate of Research, Wright Air Develop-ment Center, under the authority of Project No. 7Zl0, Human Response toVibratory Energy, Task No. 71704, The Response of the Human Body to ExternalMechanical Vibrations. Dr. Ernst K. Franke served as the project scientist.
Part of the work described in Section III of this report was carried out atthe Department of Anatomy, College of Medicine, Ohio State University, withthe kind permission of Dean R. C. Baker. The help of Prof. Ralph Stacy andDr. Alfred Fasola is gratefully acknowledged.
WADC TR 54-24

ABSTRACT
This report describes measurements of the mechanical impedanceand of the resonance frequencies of the human skull. The measurementswere made in the frequency range from 200 to 1.600 cps, the skull beingexcited to vibration by means of an electrodynamically driven piston witha small contact area. Data were obtained from living subjects, a dryskull preparation and a human cadaver. The modulus of elasticity of skullbone, calculated from the resonance frequency of the skull, is consistentwith the value obtained by static measuring methods. The propagationvelocity of bending waves in the skull bones, also calculated from theresonance frequency, agrees satisfactorily with the experimentally deter-mined propagation velocity. It is shown, finally, that a vibrating sphericalshell is a suitable model for the skull and describes its vibrationpatterns with good approximation.
PUBLICATION REVIEW
This report has been reviewed and is approved.FOR THE COMMANDER:
ACK BOLLERUDColonel, USAF (MC)Chief, Aero Medical LaboratoryDirectorate of Research
WADC TR 54-24 iii

TABLE OF CONTENTS
Page
I Introduction ................ .................... 1
U Impedance Measurements on a Dry Human Skull Preparation. . . . 1
HI Impedance Measurements on Human Subjects. . ........ 4
IV The Measurement of Nodal Lines of Vibration on the Heads ofHuman Subjects ............ .................. . 5
V The Velocity of Propagation of Skull Vibration . . . . . . . . 8
VI Comparison of the Vibrating Skull with a Vibrating ClosedSpherical Shell . . . . . . . . . . . . . . .*. . . 11
APPENDIX
I The Viscosity of Brain Tissue . . . .. . . . . 14
HI The Elasticity of the Skull Bones. .......... ... . . 15
Bibliography ...... ........... . 16
WADC TR 54-24 IV

LIST OF ILLUSTRATIONS
Figure Page
1. The mechanical impedance locus of a dry skull preparation. . . . 3
2. The mechanical impedance locus of a gelatin filled dry skullpreparation . .. .. . . . . . . . . . . . . ........ 3
3. The mechanical resistance and reactance measured on the fore-head of a living human subject .. ................ 4
4. The mechanical resistance and reactance measured on the fore-head of a human cadaver after removal of skin .*. . . . . . . . 5
5. The mechanical impedance locus of the forehead of a humancadaver after removal of skin . ... .... .......... 5
6. Phase of vibration on the circumference of the head at 300 and400 cps. . . ........................ 7
7. Phase of vibration on the circumference of the head at 600 and750 cps. . . ... . . . . ........... . .o . . 7
8. Phase of vibration on the circumference of the head at 900 and1200 cps. . . . ....................... 7
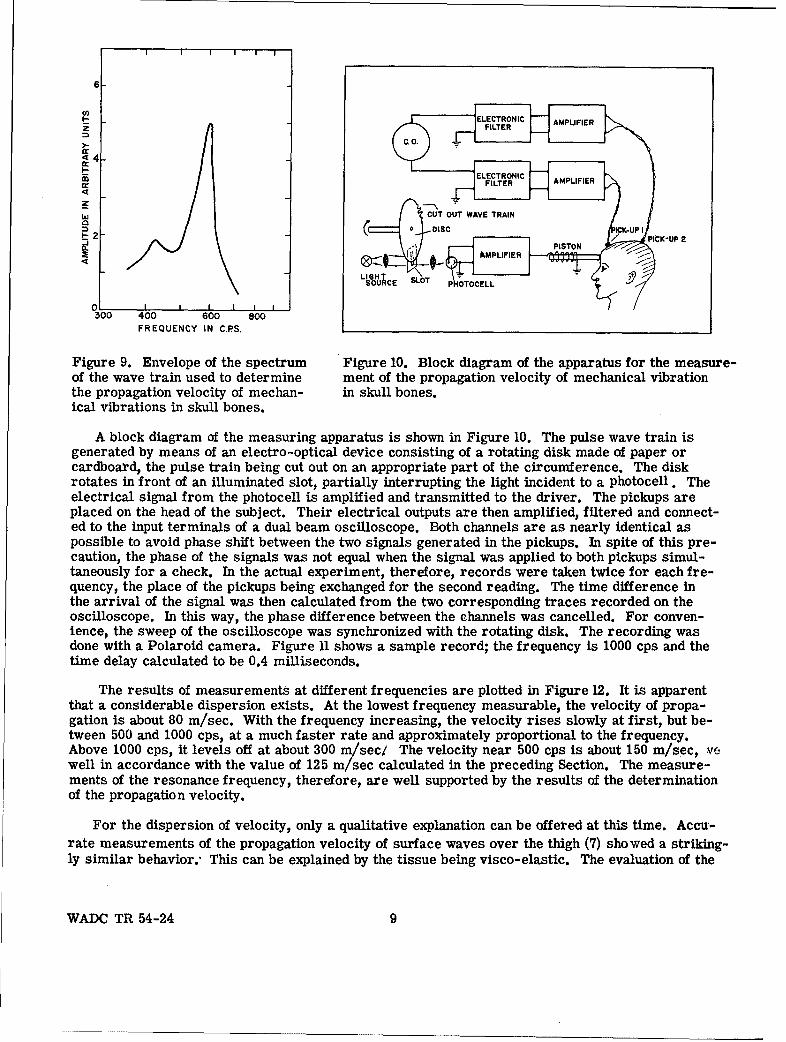
9. Envelope of the spectrum of the wave train used to determinethe propagation velocity of mechanical vibrations in skull bones . 9
10. Block diagram of the apparatus for the measurement of thepropagation velocity of mechanical vibration in skull bones. .. 9
11. Sample record of wave train. ... ... ............... o . 10
12. Propagation velocity of vibrations in skull bones as a functionof frequency . . .................... . . 10
13. Phase of vibration on the circumference of a closed sphericalshell ........................ . . . 13
WADC TR 54-24 v


SECTION IINTRODUCTION
The human skull, when exposed to mechanical vibration either by contact with vibratingstructures or by action of a sound field, will respond by vibrating in certain modes with an intensitydepending on its own structural peculiarities and the parameters of the external stimulus. Inves-tigation and explanation of its response are problems in their own right, the solution of which willcontribute to the general understanding of body mechanics. Beyond this basic interest, the know-ledge of the various aspects of skull vibration will further the development of the theories of hear-ing by bone conduction and of side tone propagation. It may also bear upon the response of the headto impulsive forces which produce skull fracture or brain concussion. In spite of its importance,knowledge of the mechanical properties of the human skull is still limited. Moreover, there arecontradictions between the results of different experimenters. For this reason it appeared worthwhile to work on problems of skull vibration.
Attempts to obtain experimental data for the skull have, thus far, met certain difficulties whichare commonly found in experiments with human subjects. For instance, measurements of the humanmastoid (1), which were made previously in this laboratory to obtain design data for an artificialmastoid, did not show any appreciable influence on skull vibration. Instead, the experiment revealedthat the mechanical properties of the surface of the head are controlled exclusively by the soft layerof skin overlying the skull bones. This difficulty was avoided by using a dry skull preparation in atentative experiment that was performed with the intent to determine the fundamental resonancefrequency of the skull. In such a preparation, a strong coupling between the measurement deviceand the skull is easily obtained. The measurement revealed that the skull has a resonance at about800 cps; in living subjects, its frequency may well be expected to be considerably lower because ofthe strong damping effect of the attached tissues. This value of resonance frequency, however, isat variance with data for living subjects previously published in the literature. G. von Bekesy (2)for instance, has suggested 1600 cps; in a later review of this subject (3) however, he has statedwithout further explanation, that the skull resonance for living subjects is about 800 cps. This isstill higher than our own preliminary experiments would indicate. Barany (4), in his extensivetreatise on hearing by bone conduction, unfortunately used a frequency range too limited to have anybearing on the problem of skull resonance and skull vibration in general. For all these reasons itwas decided to re-investigate the mechanical response of the skull to vibration and to establish asufficiently simple mechanical model which describes the essential features of the experiment.The results of these investigations are presented and discussed in the following Sections.
SECTION II
IMPEDANCE MEASUREMENTS ON A DRY HUMAN SKULL PREPARATION
Two main reasons make the measurements on the living skull particularly difficult. First, thehuman skull is filled with brain, a highly viscous fluid* strongly damping the vibrations on the head.
* In a mechanical sense, the brain tissue may be considered as a viscous fluid in the frequencyrange of the wave motion considered in this report.
WADC TR 54-24 1

Secondly, the skull is lined on its outer side with rather pliable tissue which prevents sufficientlystrong coupling between mechanical measuring devices and the bone. Both obstacles can be removedby using a dry human skull preparation. In this case, however, it must be determined whether theresonance frequencies of respective modes of vibration are at least approximately the same as thosein living subjects. To obtain an estimate, one must first find out how much the elastic modulus ofthe bone is changed by the drying process. According to F. Gaynor Evans and M. Lebow (5), theelastic modulus of a dry bone is, on the average, about 20% higher than that of a wet bone. Sincethe resonance frequency of any geometric configuration depends upon the square root of E, the dif-ference between the living skull and this dry preparation will be in the order of 10%. This meansthat the inaccuracy of resonance determination will, very likely, be greater than the inaccuracy dueto drying.
The second objection to the use of a dry preparation is the possible effect of tissue viscosity onthe resonance. It may be expected that the damping is very high in a living subject, even so highthat the displacement is not appreciably enhanced at resonance. It is for this reason that previousattempts to measure the resonance frequency by recording the displacement amplitude of a livingskull as a function of frequency may have been unsuccessful. Therefore, one has good reason tob elieve that the damping will be almost aperiodic. The coefficient of damping would then be approx-imately 0.5. If this assumption -- which is probably an overestimate-- were correct, the funda-mental natural frequency of a dry skull preparation would be about 25% greater than that of a
Jiving subject. This figure means that the measurement of the resonance frequency of a dry skullpreparation will give information at least comparable as to the order of magnitude with that ofliving subjects.
The following measurement method was used: The occipital side of the human skull preparationwas put on a small, rigid support and its frontal side brought in contact with a vibrator. The tip ofthe vibrator contained a pressure sensitive element which recorded the amplitude and phase of thevibratory force exerted by the driver on the skull. In addition, the amplitude and phase of the vel-ocity of the piston of the vibrator was measured. The impedance of the skull was then calculatedand the natural frequencies obtained from the locus of impedance in the complex plane. Fordetails of the method of measurement and its theory, the reader is referred to the work of Franke
-6). Two improvements on the method described in this reference have since been made and may beworth mentioning. One of them is the use of a drive magnet which is less bulky and easier to man-ipulate. The other is the change from the measurement of the displacement of the piston to themeasurement of its acceleration. The motion of the piston must be measured in an inertial system.This condition is difficult to fulfill by measuring displacement. However, by recording the acceler-ation of the piston, it is accomplished automatically.
At first, the skull preparation was used without any attempt to simulate the damping effect ofthe brain fluid. The impedance locus thus obtained is shown in Figure 1. On the abscissa is plot-ted the resistance and on the ordinate, the reactance. The frequency is shown as a parameter.The natural frequency of the system can be read at the point where X=O and R = R max. In thiscase it is approximately 820 cps. The general shape of the locus curve shows that the equivalentelectrical network is a parallel resonant circuit with the resonance impedance
I =as= 830 x 104 dynes/CM/secr
where m is the mass of an equivalent system of one degree of freedom (considered to be concen-trated to a point-mass), s its stiffness and r its resistance. It is not possible to separate theequivalent circuit elements with the the aid of the information obtained so far. The mechanicalproperties of the living skull may be assumed to be strongly influenced by the properties of theSattached tissues. Two phenomena may be expected; one is the decrease in resonance amplitude,the other, the reduction of resonance frequency. Therefore, an experiment was conducted with theskull filled with gelatin to obtain at least, an approximation of the actual viscosity of the humanbrain (Appendix I). The results of the measurements are shown in Figure 2. In this diagram, the
WADC TR 54-242

the impedance locus has the same shape, cor-I , I responding to a vibrator of one degree of free-
dom. Its details, however, are different from4FAMETER: FREQENCY IN CAS. those obtained with an air-filled skull. The
resonance impedance has decreased to
Soo Oslo Ines= 300 x 10 4 dyne/CM/sec.2 790
9 •,oThe resonance frequency is reduced to approx-7r70 imately 500 cps. This is in accordance with
So°the theoretical considerations in the first para-S-0 graphs of this Section. In Section IV, the theo-
zIO8 01020 retical part of this report, the mode of vibration0 g2I which corresponds to this resonance frequency3-2- 019oo will be discussed.
0~0
• 830
4- 850
I I I I
2 4 6 8 10RESISTANCE IN ICF DYNE/CM/SEC
Figure 1. The mechanical impedance locus of adry skull preparation.
I i I
PARAMETER; FREQUENCY IN C.RS.
Figure 2. The mechanical impedance locus of a U 61
gelatin filled dry skull preparation.WJ 440z 0-2 432
0
4 6234
W Sooo
I 2 3RESISTANCE IN I0G DYNE/CM/SEC
WADC Th 54-24 3

SECTION mIIMPEDANCE MEASUREMENTS ON HUMAN SUBIECTS
Using the same method as described in Section II, the impedance of the heads of living humansubjects and in one instance, of a cadaver, were measured. Figure 3 shows a typical sample of theresults of measurement of the forehead impedance of a human subject. The curves are almostidentical with those found over the mastoid. (1). During the experiment the subject sat upright on achair. The occiput was loosely supported and the vibrations were applied to the forehead by ahorizontally vibrating piston. The support of the occiput had no influence on the results of themeasurements in the frequency range under investigation. As previously stated (1), no indicationof skull resonance or bone vibration could be found. The reactance measured is virtually that ofa soft spring with a resonance that is almost constant. Tierefore, one may conclude that it is thereactance of the layer of tissues overlying the hard skull. The coupling between the driving pistonand the skull is so loose that no measurable reactions of the vibrations of the skull to the pistonare detectable.
CA W2
WU )z
4
h-
I
LUJZV
0
UZ -4-
4
cc -6-
0 500 1000 1500 2000
FREQUENCY IN C.P.S.
Figure 3. Mechanical resistance and reactance measured on theforehead of a living human subject.
To obtain better coupling between the piston and the skull, it was decided to measure the impe-dance of the head of a human cadaver after removal of the skin and periostium. Figure 4 shows thereactance and the resistance measured after removal of the skin; the periostium is still in place.The general shape of the curve is the same as that in Figure 3, that is, the piston of the measuringdevice is still acting against a predominantly elastic reactance.
But there are also significant differences. The absolute value of elastic resistance is manytimes higher than that measured with the skin still in place. There is also a slight trace of resonanceof the whole skull structure. By carefully looking at Figure 4, one can observe a deviation from the14/4 frequency response at approximately 600 to 1000 cps; this fact indicates a small deviation from
WADC TR 54-24 4

W 2-
U
.J2
UJ
z
4
- U
IS
20 L I L0 500 o000 1500 200o
FREQUENCY IN C.P.S.
Figure 4. Mechanical resistance and reactance measured on theforehead of a human cadaver after removal of the skin.
the predominantly elastic character of the reactance. At the same frequencies, the resistance alsodeviates from the regular behavior. The change will stand out more clearly when the curves ofFigure 4 are combined into one graph of the impedance locus (Figure 5) with the frequency as aparameter. There is evidence of an extremely damped resonance at 600 cps, and another slightly
less damped -resonance at approximately 900 cps. The accuracy of0_ the measurement is rather small because of the high stiffness and
PARAMETER, comparably small resistance (6). The same results are obtainedFREQUENCY IN CRS. after removal of the periostium. In the following Section it will be
seen that these frequencies are very close to the resonance fre-,Too quency that is observed on the living skull by means of other
-40 ISM methods. Quantitative evaluation of the curves of Figures 4 and 5-4o • similar to the manner used for Figures 1 and 2 is not possible be-3113001200 cause of the inherently low accuracy of measurement.
o100W1 750 10
N 900
o- SECTION IV"- -80
THE MEASUREMENT OF NODAL LINES OF VIBRATION ON THE
2 ,:.o 600 HEADS OF HUMAN SUBJECTSz
,., The modes of skull vibration may be determined by measuringz 400 the relative phase of motion at different points of the head of a sub-Sject although, as shown in Section III, the resonance amplitude isW, too faint to give any useful clue. This method was first employedc by von Bekesy (2). He obtained, fo r the lowest excitable mode, a
frequency of 1600 cps. This result is considerably at variance with-160 the data in Section II of this report which show that the frequency ofI b3°°l
0 2 4 6 the modes, even of a dry preparation, are well below 1000 cps. InRESISTANCE IN 104DYNE/CM/SEC a more recent publication (3) von Bekesy mentions 800 cps as the
resonance frequency of the head without giving experimental details.Since the knowledge of the resonance frequency of the head is of
Figure 5. The mechanical theoretical as well as practical interest, for instance in bonelocus of the forehead of a conduction hearing, the measurements of von Bekesy were repeatedhuman cadaver after re- in a somewhat modified fo rm.moval of the skin.
WADC TR 54-24 5

The following method was used; The head was excited to vibrations by means of an electro-dynamically actuated piston. The design of the piston which was pressed against the middle of theforehead was similar to that used for the impedance measurements of Sections H and HI. Thereference voltage for the determination of the phase was obtained by pressing a bone conduction
transducer (used as a pickup) against the middle of the occiput. The surface of the head was thenprobed with another pickup; (for the necessary conditions which a pickup should fulfill to be anaccurate measuring instrument, see von Bekesy (2)). The phase difference of the two pickups wasread on a commercial audio-frequency phase meter and plotted as shown in Figures 6 to 8.
In passing, it may be mentioned that the driving voltage of the piston cannot be used as a phasereference since changes in attachment pressure which are difficult to avoid in experiments invol-ving living subjects,will change the relative phase between piston and head. In fact, the phase fluc-tuations were so great that measuring was virtually impossible. A reference pickup placed near thepiston also was tried but could not be used because, in this case, the vibrations recorded werecaused by two different mechanisms. One is the vibration of the underlying bone, the vibration tobe measured; the other is a strongly damped shear wave propagated along the tissues covering thebone. The latter also depends so much on attachment pressure that stable recording is impossible.With the reference pickup at, the occiput, however, very satisfactory reading nf the phase wasfinally obtained since the relative phase between the two pickups now depends only on the vibrationof the underlying bone. Any phase change due to fluctuations of the attachment pressure is trans-mitted equally to both transducers and cancels out in their relative phase.
Curve A of Figure 6 shows the phase at various points on the circumference of the head at aSfrequency of 300 cps. The phase reverses approximately in the middle transverse line of the head.
It will be explained in Section VI that this is the characteristic of the first mode of vibration of aspherical shell. This mode, in the present case, is essentially a displacement of the skull as awhole, parallel to itself. In Curve b of Figure 6 at 400 cps, another line of phase reversal hasappeared near the point of excitation at the forehead. On the other hand, the node line correspond=ing to the first node has moved a little toward the occiput. This behavior is well in accordance with
,the theoretical properties of a closed spherical shell (see Section VI) where the node lines change 2their position as a function of frequency during transition from one mode to the next higher one.In Figure 7 at 600 and 750 cps, a second node line is already well established near the foreheadand the first has moved still farther backward. Figures 6 and 7 demonstrate that the resonancefrequency of the second mode of the skull - which is, incidentally, the lowest bending mode thatcan be excited here as well as in the experimental arrangements of Sections II and III - falls in therange between 400 and 600 cps. This frequency is in the order of magnitude of the correspondingfrequency of the gelatin filled preparation (580 cps) and very likely somewhat lower. This result isnot surprising because of the fact that the damping of the head of a living subject is much greaterthan that of the preparation.
At 900 cps (Curve a of Figure 8) the second mode still prevails and is about symmetricallydeveloped. Curve b of Figure 8 shows the situation at 1200 cps. Here the third node line hasappeared while the-other node lines have again moved farther to the left. The transition point fromthe second to the third mode is now somewhere between 900 and 1200 cps. The exact frequency ishard to determine because the transition is gradual in contrast to the undamped sphere where thetransition takes place in a rather short frequency interval. The theoretical frequency ratio betweenthe third and second mode is 1.5 (see Section VI). The frequencies of the second and third modeswhich are compatible with this figure as well as the results of the measurements, are 500 and 850 cps.These figures are well in agreement with the results obtained by the different methods discussed inSections II and MI, and show that the resonance frequency of the skull is considerably lower thanpreviously assumed.
WADC TR 54-24 6

S I I I I I I I I
+ q" 97, h Figure 6. Phase of vibrationon the circumference of the÷.5 \300 CR5s. head at 300 cps and 400 cps.
400 C.P.S. \
o\
0- 40 6.S 380 CI0
e d a 0 c sa d4 0 c s
0 1
DISTANCE OF PICK-UP FROM REFERENCE POINT IN INCHES
I III I II I I
Figure 7. Phase of +1 0s ..vibration on the circum-ference of the head at600 cps and 750 cps. io c.P.
1 0 750 C.R5.\
U)
0C,-.5,\/
-I - - - -
I I I I I I I I
0 2 4 6 8 10
DISTANCE OF PICK-UP FROM REFERENCE POINT IN INCHES
I I I I i I I |
Figure 8. Phase ofvibration on the circumfer-
a ence of the head at 900 cps,5 / and 1200 cps.
' 900 C.PS.
o 1200C.PS. \ /
-5 0 //
-I
I I I I I I I I
0 2 4 6 8 I0
DISTANCE OF PICK-UP FROM REFERENCE POINT IN INCHES
WADC TR 54-24 7

SECTION V
THE VELOCITY OF PROPAGATION OF SKULL VIBRATION
The velocity of propagation of the vibration of the skull may be derived from the frequency ofthe second mode. Because it can also be measured directly without theoretical assumptions, itmay be used conveniently as a means of checking the validity of the results presented in the prece-ding sections. The frequency of the second mode is approximately 500 cps, and the full wave lengthis one half the circumference of the skull. In the subject used for the determination of the modes,the circumference is about 25 cm after due allowance for skin and periostium. From these figuresa wave velocity of 125 m/sec is computed.
In contrast to this figure, von Bekesy (2) had derived a much higher velocity, i.e., 540 m/sec.from his resonance data. He also tried to verify his calculations by measuring the difference intime of arrival of a signal at the forehead and occiput. As a signal, he used clicking of the incisors.As the path length, he chose the full distance between the midpoints of forehead and occiput, wherehe had placed the pickups. Some objections may be made, however, to the choice of path. It seemsthat the time difference between the two paths, i.e., incisor-forehead and incisor-occiput, is smallerthan the time that the wave would need to travel directly from forehead to occiput. Von Bekesy (2)argued theoretically that most of the vibratory energy that eventually reaches the occiput willtravel over the forehead. But this is an assumption which would have required experimental veri-fication and is also at variance with the data obtained in experiments with "side tone" propagation.
There is also another point which is open to criticism, the choice of a click as a signal. A clickhas essentially a continuous spectrum; the spectrum of an actual signal arriving at the forehead andocciput is shaped by the mechanical properties of the skull which act as a mechanical filter. Eventhen, it covers a wide band of frequencies, and different frequencies may travel with differentvelocities. It has been found, indeed, that in the case of the propagation velocity of surface wavesover muscle tissue there is considerable dispersion of velocity (7). The dispersion (frequencydependence of velocity) is caused by the presence of viscosity in the tissues. Because of the dis-persion, the determination of the velocity is different since different frequencies arrive at differenttimes. It will be virtually impossible to determine which frequency arrives first.
For all these reasons, it appeared necessary to make a new attempt to determine the velocityof propagation, the more so because this experiment is crucial to the validity of the results present-ed in the other portions of this report. The methods and apparatus were designed to avoid thedeficiencies commented on in the foregoing paragraph.irst, the signal was not generated byclicking of the teeth but by means of an electro-magnetically driven piston similar to that used forthe impedance measurements. In this way, one is free to chose the site of excitation in the mostsatisfactory manner. The point of excitation, therefore, was put at the forehead as near as practi-cally possible, to a pickup placed on the forehead. The second pickup was placed near the occiputand connected to the first by means of adhesive tape (loosely stretched to avoid transmission ofvibrations) to keep a fixed distance of 12 or 6 cm, respectively. Because the first pickup is so nearthe piston, it is certain that there is no faster path between the forehead and the occiput.
To avoid the difficulties inherent in the broad spectrum of the click, a short wave train was usedconsisting of five full periods of sinusoidal shape with a slowly rising and falling amplitude. Theenvelope of the whole pulse train was chosen according to a cosine function. The pulse was repetitivebut the time between two consecutive pulses was long enough to allow the first pulse to die outentirely before the next arrived. The envelope of the pulse spectrum is shown in Figure 9. Itsfrequency range is sufficiently narrow to permit specifying a predominaht frequency and to avoidvirtually any appreciable dispersion of the components of the spectrum during transmission.
WADC TR 54-24 8
6- Z F IL IEIR
c<4
I- ELECTRONIC
FILTER AMPLIFIER
LJ CUT OUT WAVE TRAIN
0is IC-U I
t 2 - PIK-Ps-- . ~ ~~PISTON PIKU2
aJ AMPLIFIER _"''.
L<H~ SLO \-- 0' 0- - ;>SOUI E PHOTOCELL
300 400 600 800FREQUENCY IN C.PS.
Figure 9. Envelope of the spectrum Figure 10. Block diagram of the apparatus for the measure-of the wave train used to determine ment of the propagation velocity of mechanical vibrationthe propagation velocity of mechan- in skull bones.ical vibrations in skull bones.
A block diagram of the measuring apparatus is shown in Figure 10. The pulse wave train isgenerated by means of an electro-optical device consisting of a rotating disk made of paper orcardboard, the pulse train being cut out on an appropriate part of the circumference. The diskrotates in front of an illuminated slot, partially interrupting the light incident to a photocell. Theelectrical signal from the photocell is amplified and transmitted to the driver. The pickups areplaced on the head of the subject. Their electrical outputs are then amplified, filtered and connect-ed to the input terminals of a dual beam oscilloscope. Both channels are as nearly identical aspossible to avoid phase shift between the two signals generated in the pickups. In spite of this pre-caution, the phase of the signals was not equal when the signal was applied to both pickups simul-taneously for a check. In the actual experiment, therefore, records were taken twice for each fre-quency, the place of the pickups being exchanged for the second reading. The time difference inthe arrival of the signal was then calculated from the two corresponding traces recorded on theoscilloscope. In this way, the phase difference between the channels was cancelled. For conven-ience, the sweep of the oscilloscope was synchronized with the rotating disk. The recording wasdone with a Polaroid camera. Figure 11 shows a sample record; the frequency is 1000 cps and thetime delay calculated to be 0.4 milliseconds.
The results of measurements at different frequencies are plotted in Figure 12. It is apparentthat a considerable dispersion exists. At the lowest frequency measurable, the velocity of propa-gation is about 80 m/sec. With the frequency increasing, the velocity rises slowly at first, but be-tween 500 and 1000 cps, at a much faster rate and approximately proportional to the frequency.Above 1000 cps, it levels off at about 300 m/sec/ The velocity near 500 cps is about 150 m/sec, vewell in accordance with the value of 125 m/sec calculated in the preceding Section. The measure-ments of the resonance frequency, therefore, are well supported by the results of the determinationof the propagation velocity.
For the dispersion of velocity, only a qualitative explanation can be offered at this time. Accu-rate measurements of the propagation velocity of surface waves over the thigh (7) showed a striking-ly similar behavior.- This can be explained by the tissue being visco-elastic. The evaluation of the
WADC TR 54-24 9

equation of wave motion in a semi-infinite visco-elastic medium (8) gives a velocity of propagationwhich depends on frequency in about the same manner as in the experiments on the skull. Byanalogy, therefore, it appears likely that also in the case of propagation in bony tissues, the presenceof viscosity will account for the existence of the dispersion.
Figure 11. Sample record of a wave train.
300
20
00
10 0 00
z_ 200
0
O , I I I
0 500 1000 1500 2000FREQUENCY IN C.P.S.
Figure 12. Propagation velocity of vibrations in skull bones as afunction of frequency.
WADC TR 54-24 10

SECTION VI
COMPARISON OF THE VIBRATING SKULL WITH A VIBRATING CLOSED SHPERICAL SHELL
N
To get an approximate theoretical model of the vibration patterns of the skull, an attempt willbe made to compare its vibratory properties with those of a closed, thin-walled spherical shell.This is a rather crude approximation, of course, primarily because the head is not uniform. Thefacial bone attached to the brain capsule and the cervical bones, for instance, will certainly causeconsiderable deviations from the behavior of the simplified model. On the other hand, the sphereis the only body geometrically related to the skull that has been mathematically treated. A theoryof the vibrations of the oblong rotation ellipsoid, the next better approximation, is not yet available.Any configuration giving a still better approximation will probably present insurmountable math-ematical difficulties. The vibration of a closed spherical shell has been treated by Love (9). Afurther development of his results and, at the same time, a more modern presentation, has beenworked out by lunger (10). He gives, on page 443, c.f., an equation of the mathematical impedanceof a spherical shell vibrating in vacuo
for the node 7 where W) = angular frequency4, = hall-thickness of shell" = density of shell
F -= Young' s modulusV = Poisson' s ratio.7= integer (number of mode)
i= radius of shell
Since the superposition of modes is possible, he obtains for the radial component of the dynamicdisplacement
(2)
These equations hold in case of a radially directed harmonic force c Kp (1i&J-0applied at the pole -= 0 of a sphere. ?, (cos 9) are Legendrel s polynomials. Since the trans-verse component of displacement cannot be measured with the methods described in previous partsof this paper, it will be omitted from the following considerations. For the discussion, it is advan-tageous to express in dimensionless form that part ot the equation 1 which depends on frequency(term in braces). For this purpose the angular frequency of the lowest mode id., is introducedwhich is found by putting 7-= 0 and it follows
S--r a -or '4 " - (3)
For the impedance, we get thenz,, -- j zd - "(Lr - / lz-d 7 (4)
WADC TR 54-24 11

Now a dimensionless normalized frequency, , is defined by putting WA/), =-i and hence
E I-r Z; !" -t-11
(5)
After some elementary calculation it follows;
~E,~-r (.~(#)3J (6)
It can now be seen that the dimensions are contained in the constant term .,2 k sJ. ./' whereasthe variable part, i.e., the function of a normalized frequency, w , is dimensionless. This part is,therefore, independent of thickness and radius of the skull. Equation 5 permits the calculation ofthe ratios of the frequencies of the higher modes to the frequency of the lowest mode;
= 1 as assumed
- 5=• that is, the frequency of the first mode isr6 slightly lower than that of the zero mode.
"112 = 1.87
"_7k = 2.74
"A4 =3.51
The resonance frequencies have been determined in such a way as to render the impedance zerofor A• = 0, 1, 2, 3, 4, etc. That means that one may, for every independent mode, represent thevibrating sphere by an equivalent network of an inductance and a capacitance connected in a series,with negligible damping.
Through the combined action of the modes, the sphere also has frequencies where it presentsan infinite impedance to the driving piston, as one may see from the respective numerical calcu-lation. Since these frequencies are rather close to the frequencies where the impedance is low, itwill suffice to consider only the frequencies where, = O .
The different modes will now be considered separately. In the zero mode, the radial displacementof the sphere is independent of the meridian. This is the case of the pulsating sphere. It is veryunlikely that this mode can be excited by either unsymmetrical (piston on forehead, head approx-imately free) or symmetrical force (piston on forehead, occiput supported). It may be possible how-ever, to excite this mode in a sound field. For the first mode,-= / , we have a node meridian at0 - gO. This mode can be excited by unsymmetrical forces only. Since, in experimental arrange-ment only phases are measured, this case is undistinguishable from the case of ordinary trans-lation of the sphere parallel to itself, since the latter also gives a node at 0 = 9o* for the radialcomponent.
WADC TR 54-24 12

The second mode, with a node meridian at both 0=550 andO=1250 can be excited in both
experimental arrangements. Therefore, it is most important for our case. In the preceding Section
where the details of the measurement have been discussed, it was made rather certain that it is
this mode that appears at approximately 500 or 600 cps in the measurements of impedance of the
dry skull preparation as well as in the phase measurements on the head of the subject.
The third mode,0--40*, 900, 1400, is unsymmetrical again and was found only in the phase measure-
ments. A trace of it may also be present in the impedance of the skull of a human cadaver; in this
case, it may have been superimposed on the second mode vibrations because the head is not very
rigidly supported at the occiput because of the tissues.
The fourth mode occurs at frequencies higher than those used in the experiment.
It was shown in Section IV that the node meridian moves slowly away from the point of excitat-
ion (forehead) with rising frequency. Such motion of nodes of displacement is well known on mem-
branes and it also takes place in shells. The node shift during the transition from the first to the
second mode has been calculated as a function ofkw. The results will be described at first quali-tatively; atll= 1.8, -the first mode prevails, the node meridian lies between 800 and 900 (not exactly
at 90* because there is already aslight influence of the second mode).
.1 iAt 7 = 1.96, the node has moved too n" 1.950 = 1050. From there on, it moves
-1 very rapidly, and at 1-- 1.96, the secondmode appears with a node at 0 -0,at the point of excitation. This also
+1 means that at this frequency the im-Sn -1.96 pedance is infinite. The previous
node meridian has moved to approx-
-__ imately 1100. '71 1.96 is only slight-o ,ly higher than 71. .81, which is the
frequency of the impedance minimum.o 7This is a quantitative verification of
our previous statement that the fre--1 quencies where, in the undamped case,
i;..--O and X*-- inf are rather close+1 - together. With damping, the frequency
difference may be somewhat greater.In this case, the change of position of"nodes with frequency may also be
O 30 60 90 120 50 180' slightly lower. Atv t=.9qlthere are
AZIMUTH 9 OF SPHERE IN DEGREES. EXCITATION AT e - 0. now two well established node merid-ians at 0 = 200 and 8 = 110°. At
Figure 13. Phase of vibration on the circumference of a I• =2.o the meridians have moved
closed spherical shell, further but not so rapidly as beforeand are now at 0 =40 0 and e= 120,not far from their theoretical position
for the pure second mode. From now on, with the frequency rising further, position of the nodes
remains fairly stable until the appearance of the third node. Figure 13 represents the phase of
motion with respect to the exciting force for different normalized frequencies. The similarity with
Figures 6 to 8 is at once apparent. This confirms the validity of the sphere as a model for theoret-ical studies of skull vibration patterns.
WADC TR 54-24 13

APPENDIX I
THE VISCOSITY OF BRAIN TISSUE
Oestreicher (8) has worked out the theory of a vibrating rigid sphere in a viscous elastic in-finite medium. Specifically, he has worked out the driving point impedance of the sphere as afunction of the properties of the medium. Working backward, the elasticity and viscosity constantsof the medium can be calculated by application of this theory after the mechanical impedance of thevibrating sphere has been measured. In this case, the sphere is a first order source. Applying thetheory to brain tissue, one is justified to make some simplifying assumptions. First, the attenuationof the waves is, fortunately, sufficiently high so that the condition of infinite medium is easily satis-fied. In other words, the reaction of the walls of a rigid vessel containing tissue will be negligiblysmall, even when the container is not very large. A cylindrical vessel of approximately 25 cm dia-meter and a filling height of about 15 cm was used. The frequency range extended to 500 cps only.This means that shear waves are present. Compression waves would start at frequencies wellabove the range of interest for the present report. According to reference (4), we have the resis-tance of the sphere . _ ,
where t = radius of the sphere_P= density of medium
t) = angular frequency& = coefficient of shear viscosity
With a sphere of the diameter of -4- e - .- m- the value
A . d c.g.s. units of viscosity
was found from the measured resistance and the above equation.
Methods:
The container was first filled with whole pig brains to the extent stated above. The sphere(blown glass sphere attached to a thin glass tube) was immersed in approximately the center of thematerial and attached to the same impedance measuring apparatus that was used for the rMeasure-ments described in Sections II and III. The brain was very fresh, used not later than two hoursafter slaughtering of the animals, and kept at body temperature a I1 the time. The frequencies ofmeasurement were 150, 125 and 500 cps, the upper frequency limit given by the inherent complianceof the glass rod. To obtain an estimate of the influence on the results of the fact that whole brainswere used and that, therefore, the mass was not quite homogeneous, contrary to the premises of thetheory, the brains were ground afterwards and the measurements repeated. There was no signifi-cant difference.
The value of viscosity is in the order of magnitude of that of glycerin at room temperature, andmuch smaller than the viscosity found for the other tissues.
WADC TR 54-24 14

APPENDIX II
THE ELASTICITY OF THE SKULL BONES
Equation 3 (page I1 this report) permits the computation of Young' s modulus, E, by Introdticingnumerical values for the radius of the skull and the zero mode xesonance frequency. rhe latter is notdirectly observable but can be calculated from the observable resonance frequency of the secondmode (about 800 cps for the dry preparation) and the theoretical ratiol 2/lo = 1.81. Hence theelastic modulus of the dry skull preparation is
E = 1.4 x 10¹⁰ dynes/cm2
The value available in the literature(5, 11) for the elasticity of bone is
E = 1.0 x 10¹¹ dynes/cm2
This value was measured on samples taken from different sites on the femur. In particular, thesamples were cut from the hard layers of the bone only and did not contain any spongy material.The elastic modulus determining the resonance of the skull, however, is determined by the wholebone, including the spongy part. Therefore, it seemed worthwhile to make a few static measure-ments of the elastic modulus of the whole bone of the skull used in the experiments. Test sampleswere cut from the skull preparation at three sites, frontal bone, above the temporal and parietalbone. Modulus was determined by bending the samples. The accuracy of the static tests was nottoo great, primarily because the thickness of the samples was rather irregular. Unfortunately,shaping of the samples would remove materially, the hard outer layer nly, thus significantlychanging the elasticity of the sample. The results for E were 3.5 x 10 0; 2.0 x 10¹⁰ and 0.8 x 10¹⁰dynes/cm2 , respectively. This is exactly the same order of magnitude as computed from theresonance.
WADC TR 54-24 15

BIBLIOGRAPHY
1. Franke, E. K., "Impedance of the Human Mastoid". 3. Acous. Soc. Am., 24;410,1952.
2. von Bekesy. G., "Vibration of the Head in a Sound Field and Its Role in Hearing by BoneConduction". I Acous. Soc. Am., 20; 749, 1948.
3. von Bekesy, G., "Handbook of Experimental Psychology" (The Mechanical Properties of theEar). Ed. S. S. Stevens, John Wiley and Sons, New York, New York, 1951.
4. Barany, E., "A Contribution to the Physiology of Bone Conduction" . Acta Otolaryngolocia,Supplement XXVI, Stockholm, 1938.
5. Evans, F. G., and Lebow, M., "Regional Differences in Some of the Physical Properties ofthe Human Femur". 1. Appl. Physiol. 3; 563, 1951.
6. Franke, E. K., "Mechanical Impedance Measurements of the Human Body Surface". USAFTechnical Report 6469, April 1951, Wright-Patterson Air Force Base, Ohio.
7. von Gierke, H. E., Franke, E. K., and Oestreicher, H. L., "The Propagation Velocity ofSurface Waves Over the Human Body". Presented to the Acoustical Society of America,June 1954.
8. Oestreicher, H. L., "Field and Impedance of an Oscillating Sphere in a Viscous-ElasticMedium with an Application to Biophysics". J. Acous. Soc. Am., 23; 707, 1951.
9. Love, A. E. H., "A Treatise on the Mathematical Theory of Elasticity". Dover Publications,New York, New York, 1944.
10. Junger, M., "Vibration of Elastic Shells in a Fluid Mediuln and the Associated Radiation ofSound". J. Appl. Mech., 19; 439, 1952.
U1. Seidl, F., "Sound Transmission Through the Human Bone". Acoustica, 3; 224, 1953 (German)
WADC TR 54-24 16