technical note -- d-2276 c-. i - nasa · nasa technical note -- nasa tn d-2276 ... because it is a...
TRANSCRIPT

- --111.111..1.11..11 11.111111 1 1 1 1 1 1 1 1.- 111 111111 1111 I I 1 - 1 I IL1111 11111 1 1 1 1 111111111111111111111111111
N A S A TECHNICAL NOTE N A S A TN D-2276 - - c-. I
EXPERIMENTAL DETERMINATION OF SODIUM VAPOR EXPANSION CHARACTERISTICS WITH INERT-GAS-INJECTION PRESSURE-MEASURING TECHNIQUE
by Lundon R. Nichols, Stunley M . Nosek, Churles H. Winzig, und Louis J. Goldmun
Lewis Reseurch Center CZeveZund, Ohio
i" NATIONAL AERONAUTICS AND SPACE A D M I N I S T R A T I O N WASHINGTON, D. C. APRIL 1964
https://ntrs.nasa.gov/search.jsp?R=19640009047 2018-07-08T06:26:19+00:00Z
TECH LIBRARY KAFB. NM
~ ~ _ _ .... 0354973
EXPERIMENTAL DETERMINATION OF SODIUM VAPOR EXPANSION
CHARACTERISTICS WITH INERT-GAS-INJECTION
PRESSURE -MEASURING TECHNIQUE
By Landon R. Nichols, Stanley M. Nosek, Charles H . Winzig, and Louis J . Goldman
Lewis Research Center Cleveland, Ohio
NATIONAL AERONAUTICS AND SPACE ADMINISTRATION
For sale by the Office of Technical Services, Department of Commerce, Washington, D. C. 20230 -- Price $1.00

EXPERIMENTAL DETERMINATION OF SODIUM VAPOR EXPANSION
CHARACTERISTICS WITH INERT-GAS-INJECTION
PRESSURE-MEASURING TECHNIQUE
by Landon R. Nichols, Stanley M. Nosek, Charles H. Winzig, and Louis J. Goldman
Lewis Research Center
SUMMARY
An inert-gas-injection technique was successfully used to measure accu- rately the static pressures of vaporous sodium expanding through an axisymmetri- cal convergent-divergent nozzle. Wall-pressure and axial-pressure profiles through the nozzle were determined. A search probe was actuated axially through the nozzle with a bellows seal to separate the sodium fromthe atmosphere.
The research nozzle was 3.75 inches long with an inlet diameter of 3 inches and an outlet diameter of 0.845 inch. The throat of the nozzle had a diameter of 0.677 inch and was located 2.52 inches from the nozzle inlet. The nozzle inlet pressure was varied from approximately 6 to 29 inches of mercury absolute; the inlet temperature ranged from 13800 to 16500 F, and vapors with indicated superheat up to 60° F were studied. essentially complete expansion through the supersonic nozzle.
The receiving pressure was varied to allow
Comparison of the experimentally determined expansion characteristics of the metallic vapors with a theoretical one-dfmensional isentropic expansion of a gas indicated that an expansion index n pvn = c, where p is absolute pressure, v is specific volume, and c is a constant) best represented the experimental data over the range of nozzle inlet conditions in- vestigated.
of 1.3 (from the law
Further study at higher levels of superheat are recommended to substantiate results.
The application of alkali metals as working fluids for space power Rankine systems has emphasized the need for accurate and more extensive knowledge of their physical and thermodynamic properties. This knowledge is essential to

evaluate properly the processes, such as vaporization, expansion, and condensa- t ion , t h a t occur i n this cycle. The vapor phase i s of pa r t i cu la r concern be- cause i t s propert ies a re complicated by molecular weight changes due t o poly- merization react ion and also, because it i s a condensible, by changes i n phase. The proper design of turbines is, therefore, of pa r t i cu la r concern because under t h e rap id ly expanding flow conditions i n a turbine these changes are d i f f i c u l t t o predict .
Currently, there are two choices usually considered f o r the process on which t o base the design of a turbine. One is the equilibrium expansion proc- ess, i n which the expansion i s assumed t o occur with equilibrium both between physical phases of vapor and l i q u i d and between chemical reac t ion species of monatomic and diatomic molecules- The second choice is a supersaturated expan- s ion process, which i n references 1 and 2 i s indicated as perhaps more plau- s ib l e , a t l e a s t f o r sodium vapor. I n this process, it is assumed that conden- sa t ion is delayed so t h a t the f l u i d remains vaporous throughout the expansion. X t i s a l s o assumed t h a t the expansion proceeds too rapidly t o allow any change i n the chemical equilibrium from the i n i t i a l s t a t e point. t o behave as an i d e a l gas, and the r a t i o of the spec i f ic heat a t constant pres- sure t o the spec i f ic heat a t constant volume i s taken as the index n i n the l a w pvn = c f o r the expansion process. (Symbols a re defined i n appendix A . ) The theore t ica l ly calculated performance between the two processes is s i g n i f i - cant ly d i f f e ren t i consequently, a more accurate iden t i f i ca t ion of the expansion process is required. Thermodyndc-property data may be taken from references such as reference 3, a comprehensive compilation f o r most a l k a l i metals, or reference 4, which i s spec i f i ca l ly f o r sodium.
The vapor i s presumed
The purpose of the invest igat ion reported herein was t o determine the ex- pansion process index f o r sa tura ted and superheated sodium vapor. d i s t r ibu t ion of t he sodium vapor expanding through a convergent-divergent nozzle was t o be measured, and the r e s u l t s were then t o be compared with the pressure d i s t r ibu t ion theo re t i ca l ly calculated f o r a gas expanding isentropical ly . The accurate pressure measurements necessary f o r this purpose were t o be attempted by the use of an iner t -gas- inject ion technique. process pressure i s n u l l balanced with an i n e r t gas barrier s o t h a t readings could be taken with a mercury manometer.
The pressure
By this method, the sodium
The nozzle i n l e t pressure was varied from approximately 6 t o 29 inches of mercury absolute, and the receiving or condenser pressure w a s varied from 1 t o 7 inches of mercury absolute t o provide supersonic flow through the nozzle. H e a t was added t o the vapors leaving the liquid-vapor separator i n an attempt t o evaporate any entrained.droplets and thus obtain dry vapors i n t o the nozzle. Vapors, with up t o 60° F indicated superheat, were used.
I n addition t o pressure measurements along the w a l l of the nozzle, the s t a t i c pressure along the axis of the nozzle w a s also measured with a bellows- sealed t ravers ing probe. The probe was a l so used t o detect signs of condensa- t i o n by providing measurements over s m a l l increments of t r ave l .
2

9
J i
EQUIPMFNT
Vapor-Generation System
The investigation covered by this report was conducted in a sodium flash- vaporization facility. A detailed discussion of the facility and the generation of sodium vapor is given in reference 2. To carry out the research reported herein, the facility was modified by replacement of the simple convergent noz- zle and the environmental chamber with a convergent-divergent nozzle research assembly. Heaters were added to the 3-inch vapor line for superheating the va- por from the separator to the nozzle. A brief discussion of the process scheme of the facility w i l l be given here with reference to figure 1, which indicates the major components and peak design parameters.
Nozzle research assembly
_ _ _ _
CD-7742
Figure 1. - Schematic drawing of sodium flash-vaporization facility.
Saturated liquid at temperatures as high as 1620° F and at flow rates up to 50 gallons per mFnute (19,000 lb/hr) is circulated by an electromagnetic pump from a liquid-vapor separator to the main heater. heated to 1700' F in the electrical-resistance heater. liquid due to flow through an orifice located at the outlet of the heater allows fractional vaporization. The two-phase mixture is separated in a centrifugal separator. The liquid portion passes out of the bottom and returns to the pump. In parallel with the pump is an oxide control and indicating system to maintain and monitor the purity of the molten sodium.
The compressed liquid is Decompression of the
Vapor at rates up to 300 pounds per hour passes from the separator, through the superheater, the convergent-divergent nozzle, and then to an air-cooled condenser. The saturated condensate enters an accumulator fram which it flows through the secondary pump and flowmeter before combining with the primary
3
l i qu id flow from the separator.
Nozzle Research Assembly
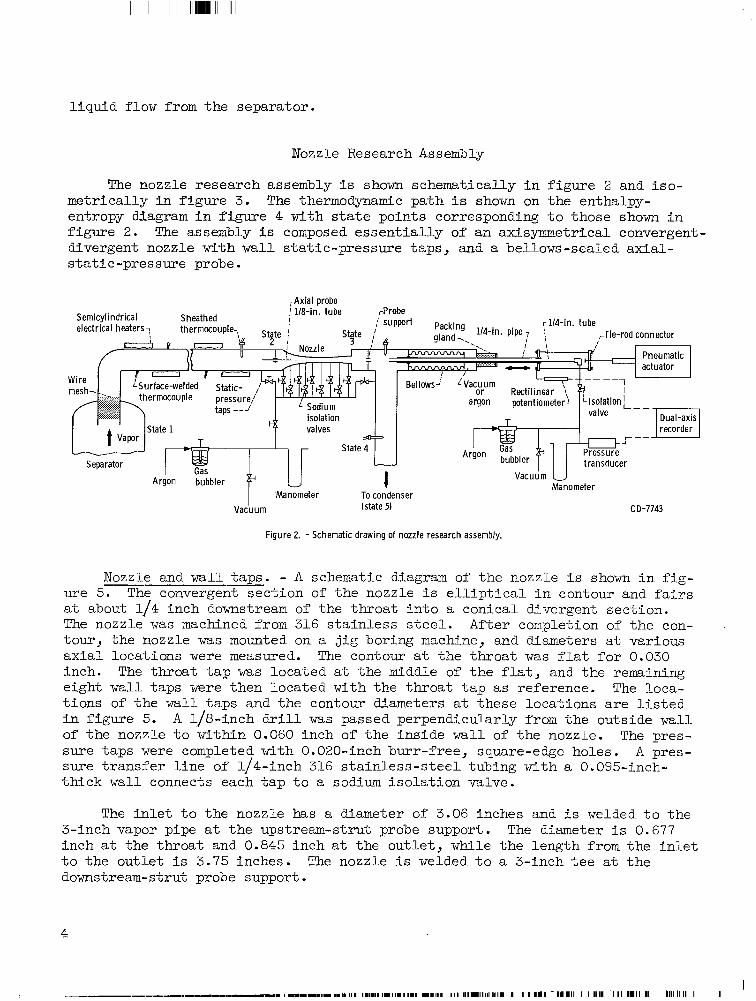
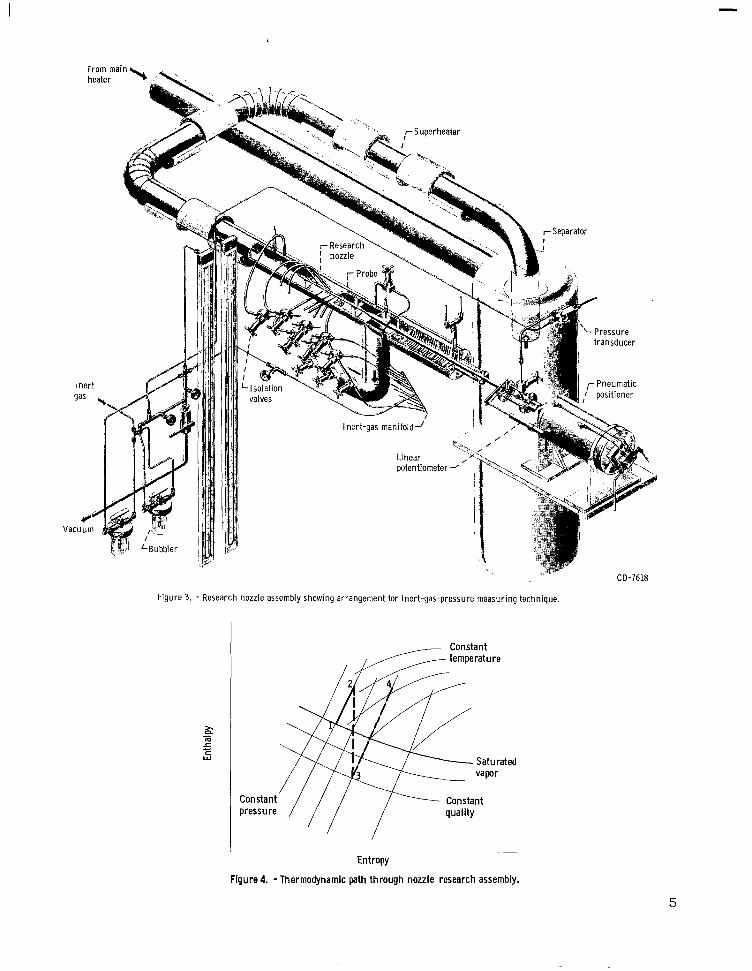
The nozzle research assembly is shown schematically i n f igure 2 and i so- metr ical ly i n f igure 3. entropy diagram i n f igure 4 with s t a t e points corresponding t o those shown i n f igure 2. The assembly i s composed e s sen t i a l ly of an axisymmetrical convergent- divergent nozzle with w a l l s ta t ic-pressure taps, and a bellows-sealed axial- s ta t ic-pressure probe.
The thermodynamic path is shown on the enthalpy-
,Axial probe
I Vacuum (state 5) CD-7743
Figure 2. - Schematic drawing of nozzle research assembly.
Nozzle and wall taps . - A schematic diagram of the nozzle i s shown i n f i g - ure 5. The convergent sec t ion of the nozzle i s e l l i p t i c a l i n contour and fairs a t about 1/4 inch downstream of the throa t i n t o a conical divergent sect ion. The nozzle w a s machined from 316 s t a in l e s s s t e e l . A f t e r completion of the con- tour, the nozzle was mounted on a j i g boring machine, and diameters a t various a x i a l locations were measured. The contour a t the throa t w a s f l a t f o r 0.030 inch. The throat t a p was located a t the middle of t he f la t , and the remaining eight wall taps Were then located with the throa t t a p as reference. The loca- t i ons of t he wall t aps and the contour diameters a t these locations a re l i s t e d i n f igure 5. A 1/8-inch d r i l l was passed perpendicularly from the outside wall of the nozzle t o within 0.060 inch of t he ins ide wall of the nozzle. The pres- sure taps were completed with 0.020-inch burr-free, square-edge holes. A pres- sure t ransfer l l n e of 1/4-inch 316 s t a in l e s s - s t ee l tubing with a 0.095-inch- th ick w a l l connects each t a p t o a sodium i so la t ion valve.
The i n l e t t o the nozzle has a diameter of 3.06 inches and i s welded t o the 3-inch vapor pipe a t the upstream-strut probe support. The diameter i s 0.677 inch a t the throa t and 0.845 inch a t the out le t , while t he length from the i n l e t t o the out le t i s 3.75 inches. The nozzle i s welded t o a 3-inch t e e a t t h e downstream-strut probe support.
4
I --.----.---..,--.I. I111.11111.111.11 111 11111111II.IIIIII.I 1111111111 111 111.111111111. I I I1111 - 1111111 I I 11111 I II 111111 II 1111 1 1 1 1 I I
CD-7618
Figure 3. - Research nozzle assembly showing arrangement for inert-gas-pressure measuring technique.
~
Entropy
Flgure 4. - Thermodynamic path through nozzle research assembly.
5

I I I I I Il11111lIIlIIl11l11111l I II IIIIIIIIII
Distance from inlet,
in.
0.52 1.02 1.52 2.02 2.27 2.52 2.77 3.02 3.52
I
Nozzle diameter,
in.
1.584 1.129 .866 .721 . a 9 .677 .691 .725 .803
Upstream probe support-,
L Down strea m Pressuretap 1 2 3 4 5 6 7 8 9 probe support
Nozzle diame Pressure
ta P
1 2 3 4 5 6 (throat 7 8 9
CD-7744
Figure 5. - Diagrammatic sketch and dimensions of nozzle.
A nozzle i n l e t pressure t a p i s located 4 inches upstream of the upstream probe support. A receiving or condenser pressure t a p i s located i n the t e e down- stream of the nozzle.
Axial-pressure probe. - Draw- ings of t h e axial-pressure probe and bellows s e a l a r e included i n f igures 2 and 3. The probe i s 1/8-inch tubing that is 42 inches long and has a w a l l thickness of 0.018 inch.
S t ru t s a t e i the r end of the nozzle a s shown i n f igures 2, 3, and 5 support and guide the probe along the ax is of the nozzle. S t e l l i t e i n s e r t s a re used a s bear- ings t o prevent self-welding t o the probe, and a s l id ing clearance of 0.003 inch is provided.
The upstream end of the probe is closed off with a tapered plug. The portion passing through the t e e and bellows assembly i s en-
closed i n a 28-inch length of l/d-inch tubing. The annulus at the ends of the two tubes i s welded shut, and the end i s connected t o a 1/4-inch bexlows-sealed sodium i so la t ion valve. Four 0.020-inch s t a t i c pressure sensing holes, spaced 90° apart rad ia l ly , a r e located i n the probe 6.685 inches from the l e f t end of the 1/4-inch tube. as a s top and posi t ion reference, the sensing holes a re a t the i n l e t of the nozzle. f i g . 5); therefore, as the 1/4-inch tube t raveled away from the s t r u t , the t rav- e l and exact locat ion of the probe r e l a t i v e t o the nozzle could be readi ly de- termined.
With the 1/4-inch tube against the downstream probe support
The distance from the s t r u t t o the throa t wall *ap was measured (see
The probe together with the 1/4-inch tube are driven by the bellows-sealed 1/4-inch pipe through which they pass. The r igh t end of t h i s pipe terminates at the t ie - rod connector and is closed around t h e 1/4-inch t d e . The l e f t end terminates i n the 3-inch tee , which serves t o connect the nozzle, the bellows assembly, and the condenser-
The composite bellows was fabr ica ted from four single-ply 0.005-inch 31 32 s t a in l e s s - s t ee l bellows with an outside diameter of 3-inches and an inside
diameter of 3 inches. Each of the bellows sect ions has nine corrugations. The sect ions were joined with connector r ings by furnace brazing i n a reducing at- mosphere. s t e e l disk, which w a f i welded t o the 1/4-inch pipe-
The r igh t end of the composite bellows was brazed t o a stainless- The left end of the bellows
6

was brazed t o a ring, which was welded t o a support disk. i s welded t o the same disk, and the disk is , in turn, welded t o the tee . A hole through the center of the disk provides passage and support f o r the 1/4-inch pipe containing the probe. f r e e drainage of sodium f romthe bellows chamber i n t o the tee .
The bellows housing
A hole a t the bottom of the disk allows
The bellows housing i s an 11-inch length of 4-inch pipe with the inside surface smoothly finished. The r igh t end of the housing contains a conventional packing gland t o support the 1/4-inch pipe and t o s e a l the housing. The packing was made with asbestos string, lubricated with molybdenum disu l f ide . The bel- lows housing was equipped with vacuum and argon services t o control the pressure d i f f e r e n t i a l across the bellows. d i f f e r e n t i a l was maintained a t a m i n i m u m t o prolong the l i f e of the bellows. When the probe was i n operation, the d i f f e r e n t i a l was increased su f f i c i en t ly t o allow the probe t o move i n (upstream). l i z e d t o control the motion and the posit ion. stream) en t i r e ly by the pneumatic drive with no assis tance from pressure d i f f e r - e n t i a l across the bellows.
When the probe was not being operated, this
The pneumatic drive mechanism was u t i - The probe was moved out (down-
Pressure-measuring techniques. - The 11 wall pressure taps , t h a t i s , the nozzle i n l e t pressure tap, the nozzle pressure taps, and the receiving pressure tap, were joined t o a common manifold ( f i g . 2 ) . Line heaters were used t o sus ta in the pressure t r ans fe r l i n e s (connecting the w a l l t aps t o the respective i so l a t ion valves) and the i so l a t ion valves a t 250' t o 400° F when pressure measurements were being taken. With the desired nozzle i n l e t conditions and the desired receiving pressure s e t , the manifold and the U-tube mercury-filled manometer a re pressurized with argon t o a few inches of mercury greater than the nozzle i n l e t pressure as determined by the vapor pressure i n the separator. The argon i s introduced through a visual glass-bowl bubbler pa r t ly f i l l e d with mineral o i l .
The w a l l pressures were generally taken i n sequence beginning with the f a r thes t upstream or nozzle i n l e t pressure tap. The appropriate sodium iso la- t i o n valve i s opened t o permit the flow of argon i n t o the nozzle. The ine r t - gas pressure n u l l balances the pressure of the sodium vapor as indicated by no fur ther change i n the mercury column. Pressure measurements taken both with gas flow, as indicated by the visual bubbler, and without gas flow showed no difference i n the measured pressure i f the gas flow did not exceed about 8 cubic centimeters per minute a t t h e pressure ex is t ing i n the manifold system. Fre- quent random checks showed no differences in the measured pressure- Sequential measurements a r e desirable t o reduce the amount of i n e r t gas in jec ted i n t o the process system. A manifold inert-gas pressure, a few inches of mercury greater than the predicted system pressure, i s needed i n i t i a l l y t o force any condensed sodium between the i so l a t ion valve and the 0-020-inch wall t a p i n t o the flowing sodium vapor stream.
Axial-pressure-probe measurements were a l so made wlth the inert-gas nul l - balance technique. The probe was a l so equipped with a sodium i so la t ion valve. The a x i a l probe and the pressure t r ans fe r l i n e up t o and including the valve were heated with e lec t r ica l - res i s tance heaters and heating lamps when pressure measurements were being taken. Pressure prof i les were taken with the probe

moving out (from high t o low pressure) and with t h e probe moving i n ( f r o m low t o high pressure).
With the probe posit ioned t o the extreme upstream posi t ion ( the 1/4-in. tube pressed against t he downstream face of t h e downstream probe support) the inert-gas s ide of the i so l a t ion valve w a s pressurized 2 or 3 inches of mercury above the predicted nozzle i n l e t pressure.
The i so l a t ion valve was opened, and the argon w a s in jec ted i n t o the probe and, consequently, t he process system. After t he null-pressure condition was reached, the probe drive mechanism was started and the probe was moved slowly outward. No addi t ional argon was passed through the bubbler i n t o t h e system; rather , as the probe moved out (from highest t o lowest pressure), t he argon i n the pressure-probe assembly flowed out i n to the sodium stream. Here too, t e s t s showed tha t continuous in jec t ion of not more than 8 cubic centimeters per min- ute of argon through the minera l -o i l - f i l l ed bubbler i n t o the system had no ef- f e c t on the pressure measurements.
When the probe was moved inward (from low t o high pressure), it w a s neces- sary t o s top the probe, open the i so l a t ion valve, and permit the i n e r t gas t o depressurize by flowing i n t o the sodium system. w a s reached and the pressure measurement noted, t he i so l a t ion valve was closed, and the argon l i n e s up t o the valve were repressurized i n preparation f o r anoth- e r axial pressure measurement.
When the null-balance point
General instrumentation and equipment. - As shown i n f igures 2 and 3 the U - s h a w c h pipe, connecting the separator and the nozzle, i s equipped with e l e c t r i c a l heaters. Semicylindrical heaters placed on the s t r a igh t sections of t he pipe and tubular heaters located a t the bends served as superheaters f o r the. sodium vapor flowing f romthe separator. Power t o these heaters was regulated manually with autotransformers.
Chromel-Alumel thermocouples were attached t o the surface of the vapor l i n e t o f a c i l i t a t e control of t h e superheaters. Sheathed thermocouples were placed d i r ec t ly I n t h e vapor stream upstream and downstream of the nozzle. Each i s o - l a t i on valve body was equipped with a thermocouple t o ensure tha t the valve temperature was above the freezing temperature of sodium.
The w a l l s t a t i c pressures were read on a mercury manometer. The acquisi- t i o n of these data was e n t i r e l y manual.
The axial-s ta t ic-pressure probe was attached through the t ie - rod connector t o a pneumatic actuator ( f ig s . 2 and 3). actuator by a motorized pressure regulator. a t raverse with the ;?robe. t o r was used t o determine the posi t ion of t he probe. The distance f romthe bellows housing to the t i e - rod connector was determined frequently with a micrometer t o check the potentiometer cal ibrat ion. potentiometer was recorded on the Y-axis of a dual-axis recorder.
Instrument a i r was introduced t o the F i f teen minutes were required f o r
A r ec t i l i nea r potentiometer attached t o t he connec-
The mi l l i vo l t output of the
The axial pressure was read from a manometer; it was a l s o sensed by an
8

unbonded strain-gage pressure transducer. The mi l l i vo l t output of t he t rans- ducer was recorded on the X - a x i s of the dual-axis recorder.
PROCEDURE
Operating Conditions
The nozzle research assembly was pretested with a i r a t ambient temperature p r io r t o i n s t a l l a t i o n i n the sodium f a c i l i t y . The moisture content of t h e a i r was 1.5 grains per pound of a i r j t h i s l o w moisture content precluded any s igni f - i can t e f f ec t on the expansion process due t o condensation. The nozzle i n l e t pressure w a s varied from 10.45 t o 29.67 inches of mercury absolute.
I n the sodium f a c i l i t y , the nozzle i n l e t pressure was varied from 5.85 t o 28.90 inches mercury absolute, while the receiving pressure was var ied from 1.04 t o 6.89 inches of mercury absolute. The vapors were heated t o a t t a i n dry conditions before expansion. Up t o 60' F superheat, as indicated by a r i s e In temperature between the separator and nozzle i n l e t locat ions 1 and 2 ( f i g . Z ) , w a s used.
Recording of Data
The wal l -s ta t ic-pressure data f o r both a i r and sodium flow were v isua l ly The manometer readings were corrected t o 32' F noted and manually recorded.
and recorded as inches of mercury absolute with a mercury column located on s i t e t o determine atmospheric pressure.
The wall-static-pressure data f o r a i r a re tabulated i n t ab le I. Three d i f fe ren t runs are tabulated a t nozzle i n l e t pressures of 29.67, 20.10, and 10.45 inches of mercury absolute. Runs 1, 2, and 3 were made with low receiving pressures, which resu l ted i n e s sen t i a l ly no recompression. Only one s e t of ob- servations i s recorded i n t ab le I f o r each rUQj however, duplicate readings showed no deviations from the i n i t i a l observations.
The wall-static-pressure data f o r sodium vapor a r e tabulated i n t ab le 11. Runs 1 t o 4 were made with the a x i a l probe inser ted, and runs 5 t o 8 were made with the probe removed. After the process had operated a t steady-state condi- t i ons f o r a t l e a s t 1 hour as indicated by temperature a t s t a t e points 1, 2, 4, and 5 ( f i g . 2) , the i n i t i a l s e t of wall-pressure readings was taken and re - corded; the i n i t i a l readings a r e designated as A. A s e t of repeated readings were taken immediately the rea f t e r and designated as AA. I n runs 1 t o 5, a f t e r 1 t o 6 hours of fu r the r operation a t e s sen t i a l ly the same process conditions, a second s e t of observations was made and pa r t ly o r completely repeated. Table 11 shows the pressure readings corrected t o a temperature of 32' F and the corresponding pressure r a t i o s p d p z . Where avai lable , the measured value of the nozzle i n l e t pressure p2 w a s used as the common denominator. I n several instances, t he inlet pressure t a p w a s plugged, and the value of the i n l e t pres- sure was approximted by an extrapolation of the avai lable pressure data t o the nozzle i n l e t . These estimated values a re designated i n t ab le T I by foot-
9

note. they were e s sen t i a l ly the same as the pressure a t wall-pressure t a p 1. estimated values a re considered t o be as correct as the reproducibi l i ty between repeated readings. Also l i s t e d a re the temperature data taken during each s e t of pressure readings. t h i r d colqnn of t h e temperature data.
It may be noted t h a t where values of nozzle i n l e t pressure were measured, These
Various degrees of superheat were used as shown i n the
I
The axial-probe s ta t ic-pressure readings for a i r a re not tabulated. Ex- ce l len t reproducibi l i ty between the continuous pressure-length t races w a s ob- ta ined on the dual recorder with the probe t rave l ing i n e i the r direction. An actuator drive speed t o cover the nominal 3.8 inches of t r a v e l in 15 minutes was determined t o be the f a s t e s t allowable speed. A t f a s t e r probe speeds, the transmitted pressure t o t h e transducer (and manometer) lagged behind the ac tua l nozzle pressure. I n order t o determine t h i s , t he probe was stopped periodi- cally, and the change of the pressure-recording pen on the dual-axis recorder and the corresponding change on the manometer were noted. f o r a i r i n f igures 6 and 7 a r e presented graphically only and a re reproductions of the or ig ina l t races .
The ax ia l pressures
0 . 2 . 4 . 6 .8 1.0 1.2 1.4
-U- j -*-
I - -U- I
\ %
I I A
I I I I
I ii"i 1.6 1.8 2.0 2.2 2.4 2.6 2
Distance from nozzle inlet, in.
Run
Wall measurements
Axial measurements Theoretical one-dimensional -
\
mpansion (y = 1.4)
:
i. 2
Figure 6. - Pressure distribution of air through nozzle. Inlet temperature, 55' F.
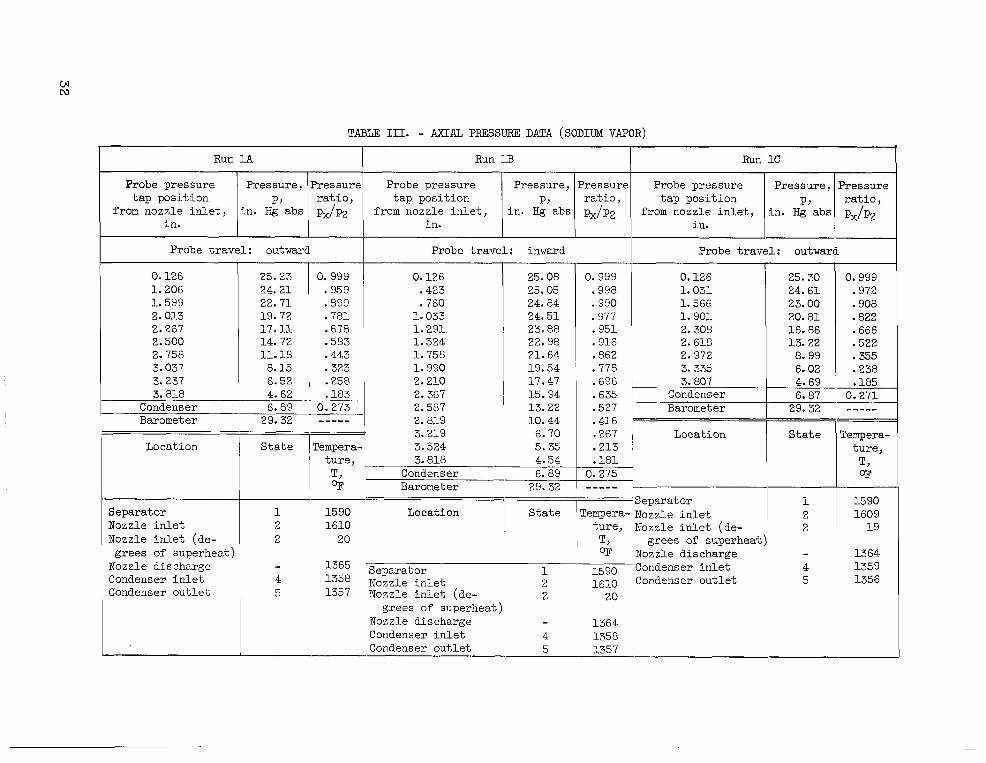
The axial-s ta t ic-pressure data f o r sodium a r e tabulated i n t ab le 111. An er ror as high as 0.3 inch of mercury between the pressure t r ace and the ac tua l nozzle pressure a t a par t icu lar location i n t h e nozzle was noticed when the
10

1.0
.9
.a
N - 7 n
.6 0-
2 . 5 E : . 4 E
. 3
. 2
.1
- x
.- I
VI
0
Figure 1.
1 . I I 1 2 Distance from nozzl
, , , I , a I I , I T T
Theoretical one-dimensional
2.4 2.6 2.8 3.0 3.2 3.4 3.6 3.8 4.0 et, in.
Variation of static- to inlet-pressure ratio along nozzle wall and axis (air). Inlet temperature, 55' F.
probe was i n motion. This value was determined by stopping the probe a t various locations i n the nozzle. A t the i n l e t and the out le t of the nozzle, l i t t l e e r ro r was noticed3 however, as the pressure gradient increased, t he e r ro r i n transmitted reading increased up t o about 0.3 inch of mercury. transmitted pressure was due t o a larger volumetric t r ans fe r system than t h a t used with the air-evaluating f a c i l i t y . Therefore, t he probe was stopped a t in- te rva ls , and the pressure output as measured by a manometer was recorded a s shown i n t ab le 133.
The lag i n
Table I11 contains data from four primary runs. These runs, designated 1 t o 4, correspond t o wall s t a t i c data numbered similarly. Each run of axia l - pressure data consists of two o r more repeated t e s t s t h a t a r e l e t t e r e d chron- ologically. The process temperature data a re l i s t e d f o r each s e t of data and indicate s tab le operation throughout each primary run. The value of t he nozzle i n l e t pressure p2 extrapolation t o the nozzle i n l e t . This extrapolated value did not d i f f e r s ig- n i f i can t ly f r o m the f a r thes t upstream posi t ion of the probe pressure tap, which was about 118 inch downstream of the nozzle in l e t .
was determined by a plot of the axial-pressure data and an
Analysis of D 3 t a
The experimental data have been compared with the theo re t i ca l isentropic expansion of a gas as expressed by t h e following equation, where one-dimensfonal flow i s assumed:
11

A derivation of this equation is presented in appendix B as applicable to any substance undergoing a reversible process according to the relation pvn = e. Since the equation also holds for a perfect gas, the substitution of y for n allowed the use of the values tabulated in reference 5. In order to find the expansion process index, the sum of the squares of the differences between the observed values of px/p2 values of n (or y) were graphically minimized. T h i s procedure is outlined in appendix C.
and the theoretical pressure ratios for various
D I S C U S S O N OF RESULTS
Flow Characteristics of Air Through Experimental Nozzle
The pressure profiles for air flowing through the convergent-divergent nozzle are shown in figures 6 and 7. Figure 6 shows the variation of pressure through the nozzle for three different inlet pressures. Slight recompression at the outlet of the nozzle is noted for run 3 , The theoretical isentropic expansion curve for air (y = 1.4) is shown as a dotted line for run 1 for gen- eral comparison with experimental data. Up to 2.2 inches from the nozzle inlet, the w a l l - and axial-pressure measurements show excellent agreement and deviate only slightly from the theoretical curve. From 2-2 inches to the outlet of the nozzle, substantial difference between the w a l l and the axial measurements was observed. This is a departure from uniformity of flow as assumed in the one-dimensional analysis.
The w a l l measurements are lower than the axial pressures because of the curvature of the streamlines around the curved surface at the throat of the nozzle. Due to the resulting centrifugal forces, the pressure increases from the wall to the axis. The flow in this transonic region is supersonic near the wall at the geoxetric throat and is subsonic at the axis. reached at the centerline downstream of the geometric throat of the nozzle. This nonuniformity persists to the nozzle outlet.
Sonic speed is
At about 2.2 inches from the nozzle inlet, the axial measurements show a decrease in the pressure gradient up to the throat where the gradient increases to a point 2-6 inches fromthe nozzle inlet. Beyond this point, the axial meas- urements again exhibit excellent conformity to the theoretical one-dimensional expansion. This temporary departure of the axfa1 pressure from the theoretical in the transonic region may be due to a compression shock of unknown origin in- teracting with the boundary layer to exert pronounced changes in the flow
12

I
28
26
24
22
20
2 18- m
pa t t e rn ( r e f . 6 ) .
~
- Lh
The a i r data a r e shown i n f igure 7 as the var ia t ion of pressure r a t i o through the nozzle. i n run 3) and indicate the p l a u s i b i l i t y of the one-dimensional analysis. w a l l measurements a l s o show good agreement and, as i n f igure 6, show departures from the axial data.
The a x i a l data coincide (up t o the point of recompression The
-
-
Flow Character is t ics of Sodium Vapor Through Nozzle
1.0
Wall-pressure data. - The var ia t ion of pressure through the nozzle as meas- ured by w a l l taps i s shown i n f igure 8 f o r the eight runs made with nozzle i n l e t pressures ranging from 5.85 inches of mercury (run 6) t o 28.90 inches of mercury (run 4) . Some recompression i s noted a t the nozzle ou t l e t for runs 1, 4, and 8. Theoretical expansion curves for various isentr.opic indexes a re shown as dotted l i nes . Near the i n l e t of t he nozzle, experimental data indicated generally a process index of 1 . 2 o r l e s s . Where the pressure gradient becomes f a i r l y large a t about 2.2 inches from the nozzle i n l e t , t h e data indicate (with the exception of run 4A) a process index of about 1.3. and shows the anomaly of temporarily reduced pressure gradient i n the transonic regime as noted previously with the axial-pressure data with a i r flow. A
R u n 4.A w a s made with 33' F superheat
- 2 I_
1.4 1
lAA, ZAA, 3AA ratio, 16.28.36
lBB,ZBB,3BB Wall measurements Th eoretica I one-
3.2 3.4 3.6 3.8 4.0 Distance from nozzle inlet, in.
(a) Runs 1 to 3.
Figure 8. - Variation of wall pressure measurements through nozzle (sodium vapor).
13
Distance from nozzle inlet, in.
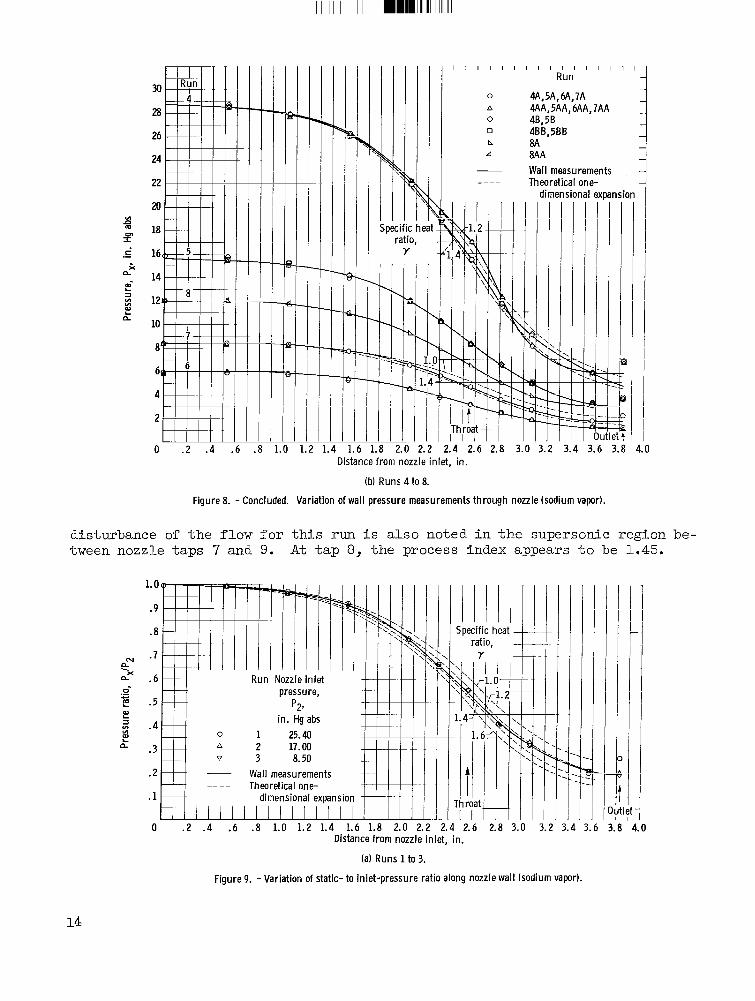
(b) Runs 4 to 8.
Figure 8. - Concluded. Variation of wall pressure measurements th rough nozzle (sodium vapor).
disturbance of the flow for this rurt is also noted in the supersonic region be- tween nozzle taps 7 and 9. At tap 8, the process index appears to be 1.45.
I I I 1 I l l 1
I l l
3.8 4.0 Distance from nozzle inlet, in.
(a) Runs 1 to 3.
Figure 9. - Variation of static-to inlet-pressure ratio along nozzle wall (sodium vapr ) .
14

The data are shown as t h e var ia t ion of pressure r a t i o px/p2 through the nozzle i n f igure 9. expansion index of about 1.3- dex as low as 1.05 a t the throa t . Run 4B shows an expansion index of 1.35 t o 1.4. R u n s 5 t o 8 ( f i g . 9 (c ) ) exhibi t expansion indexes between 1.3 and 1.4 when neglecting the s l i g h t recompression a t the nozzle out le t .
By inspection runs 1, 2, and 3 ( f i g . 9 ( a ) ) show an I n f igure 9(b) , run 4 A indicates an expansion in-
1. c
.9
.a
hl . 6
ax .4-
?! .5-
e 0- - W
I n . In W L a
L a
2~
1
-
- -
3-
N
x CL
a - 0-
e .- c W L =I In In W L
n
1.0
.9
.8
.l
. 6
.5
. 4
.3
. 2
.1
0 .2
m ...
Run Nozzle in let pressure,
in. Hg abs p21
0 2 } 28.15 A
- Wall measurements Theoretical one- _ _ _
dimensional expansion '
I I I . / I I 1 I 1 1 1 1 i 1 1 I . 4 . 6 - 8 1.0 1.2 1.4 1.6 1.8
I I I I I -Specific heat - ratio, - Y
Throat I I
2.4 2.6 2 Distance from nozzle inlet, in.
(b) Run 4.
pressure,
in. Hg abs PPI
0 5 15.60 A 6 6.00 V 7 8.40 0 a 12.00 - Wall measurements _ - _ _ Theoretical one- l , , , i i di,rne[s[n,al i q j a n r i o r 1
.4 . 6 .8 1.0 1.2 1.4 1.6 1.8 I.. J
- Specific heat - ratio,
Throat
1 2 . 6 2.8 I
3 3.8 4.0
II 3.6
Distance from nozzle inlet, in.
(c) Runs 5 to 8.
Figure 9. - Concluded. Variation of static- to inlet-pressure rat io along nozzle wall bod ium vapor).
% 4.0
The wall-pressure data f o r each run were t r e a t e d as discussed i n appendix C t o determine the bes t approximation of t he expansion process index f o r (1) the convergent section, ( 2 ) t he divergent section, and (3) the overa l l expansion
15

process, t o the nozzle i n l e t pressure by means of equation (B10) of appendix B. These r e s u l t s together with the con- d i t ions at the nozzle i n l e t a r e summarized for each run i n the following table1
A l s o the r a t i o of the pressure as measured a t the throa t of the nozzle pt/p2 was used t o calculate t he process index
- RUn
- 1
2
3
4A
4B
SA
5B
r. 3
7
3 ~
Pressure, P,
in. Hg ab;
25.40
17.01
8.58
“28.70
“28.83
“15.42
“15.74
5.90
8.41
12.08
Nozzle i n l e t
Temperature T, OF
1613
1526
1443
1647
1624
1504
1565
1383
1423
148 2
?Extrapolated values.
The only s igni f icant
Superheat
20
10
35
33
9
0
62
35
23
23
difference culated by the method of appendix C,
A t th roa t ,
nt
1.26
1.35
1,25
1.06
1.34
1.33
1.40
1.30
I. 28
1.33
Expansion process index, n
Convergen s e e t ion,
nC
1.26
1.35
1.29
1.16
1.38
1.29
1.42
1.27
1.27
1.33
Diverge nl section,
nd
1.26
1.28
1.23
1.24
1.29
1.27
1.32
1.27
1.23
1.27
Overall. no
1.26
1.29
1.25
1.24
1.32
1.27
1.33
1.32
1.22
1.30
between these expansion indexes, a s cal- i s for the convergent sect ion of t he nozzle
for runs &I and 5B. expansion index n, of 1.16. R u n 5B with 62’ F superheat shows a value of 1.42 f o r the index. Comparison of runs 1, 7, and 8, with runs 3, 4A, and 6, which were made with e s sen t i a l ly the same superheat, indicate no e f f ec t of noz- z le i n l e t pressure ( o r temperature) on the index. value of the index i s noted with varied leve ls of superheat notwithstanding the differences i n the index between runs 4A and 5B. It i s noted t h a t the expan- sion process index % th roa t of the nozzle, with the exception of rm 411, i s not s ign i f icant ly d i f - fe ren t from the other indexes determined by use of a l l the avai lable data. R u n s 5 t o 8, which were made with the a x i a l probe removed, a r e not s ign i f icant ly different from runs 1 t o 4, which were made with the probe inserted.
R u n 4A was made with 33’ F superheat and shows a convergent
Similarly, no e f f ec t on the
as determined by the s t a t i c pressure measured a t the
Since no s igni f icant trends i n the process index a re apparent, a l l the data a r e consolidated t o determine values of the convergent, the divergent, and the overal l expansion indexes (nc, nd, and no), as out l ined i n appendix C.
16
I

A l s o an average value of t h r o a t expansion index value of pt/p2 f o r t he runs was determined. These values a r e given i n the following t ab le :
% obtained from the average
Expansion process ind-ex, n
Nwneri c a l value
At t h roa t , nt 1 1.29
Divergent sect ion, nd
Overall, q,
I
1.27
1.28
1.32 nc I Convergent section,
I
Axial-pressure data. - The pressure d is t r ibu t ions through the nozzle as determined by the a x i a l probe a r e shown i n f igure 10. The four runs were made with e s sen t i a l ly t h e same operating conditions as those f o r the corresponding wall-pressure readings, with the exception of run 4A, which was made with 3 3 O F superheat when the w a l l data were being recorded and 100 F superheat when t h e search probe data ms being obtained. This i s noted by a comparison of t ab le s I1 and III i n which the wall-tap data and the axial-pressure data, respectively,
. I
1.6 3.4 3.6 3.8 4.0 Distance from nozzle inlet, in.
Figure 10. -Variation of axial pressure measurements through nozzle (sodium vapor).
17
I

a re given. Generally, a f t e r t he desired process conditions were established, a set of wall-tap pressure measurements were taken, followed by the axial meas- urements; a second set of wall-tap measurements were taken before t h e process conditions were changed. For each run i n t ab le s 11 and III the process condi- t ions a r e Ustea f o r reference.
The axial search tube was used primarily t o attempt t o locate the zone of condensation of t h e vaporous sodium as w e l l as t o obtain general pressure pro- f i l e s through the nozzle. indicat ive of condensation were noted.
No changes i n the pressure gradient t h a t would be
Figure 10 shows an expansion index of about 1.3 when the recompression a t the ou t l e t of t he nozzle i s neglected. A s l i g h t indicat ion of t he temporary decrease i n the pressure gradient just ahead of t h e throa t of t he nozzle i s noted as a l so observed with the a i r data.
All the axial-pressure data a re p lo t ted i n f igure 11 as the var ia t ion of pressure r a t i o through the nozzle. No e f f ec t of pressure l eve l or superheat i s indicated. The curve drawn through the data neglects t he anomalous points just upstream of the throa t and those indicat ing s l i g h t recompression a t the nozzle out le t .
0 .2
i t
1.0
1
.. 2
2
4 I ii I
Thrl I
I I I I I I I I I Run Nozzle in1
pressure,
in. Hgab! P2,
V A
0 0
L.4 1.6 1.8 2.0 2.2 2.4 2.6 2.8 3.0 Distance from nozzle inlet, in.
I
1 2 3 4
j
1 I 3.4 3
Figure 11. - Variation of static- to inlet-pressure rat io along nozzle axis (sodium vapor).
All the data f o r the flow of sodium vapor through the nozzle a re summarized i n f igure 12. shown as a so l id curve i n f igure 1 2 . A t each w a l l tap, the average pressure r a t i o f o r a l l runs i s shown together with the high and low values of t he pres- sure r a t i o . Theoretical-expansion curves for various isentropic indexes a re shown as dotted l ines. With the exception of t h e wall-tap readings a t taps 8 and 9, which r e f l e c t some recompression, t h e axial-pressure curve passes through the mean value of each wall-tap measurement. Inspection of f igure 1 2 reveals t h a t t he expansion process index indicated by both w a l l - and axial-pressure
The curve drawn through the axial-pressure data ( f ig . 11) is
18

1.0
.9
.8
cu .7 E ax .6 0-
e . 5 - E 2 . 4 - E
.3-
.2-
.1
.- c
111
Q
T -
-
-
/all measurements (maximum, average, and min imum values are shown)
- Axial measurements ..__ Theoretical one-dimensional
expansion
. 2 .4 .6 .8 1.0 1.2 1.4 1.6 1.8 ,. '.2 3 3.6 3.8 4 0 Distance from nozzle inlet, in.
Figure 12. - Variation of static- to inlet-pressure rat io along nozzle wall and axis.
data i s about 1.3.
The condition of the vapors entering t h e nozzle w a s defined en t i r e ly on the basis of pressure and temperature measurements. Without an addi t ional means of ascertaining the qua l i ty of the vapor, the poss ib i l i t y ex i s t s t h a t t rue superheat may not have been attained; t h a t is, l i qu id droplets could have been dispersed i n the superheated vapor. The presefice of droplets could have af- fected the expansion process. and the resu l t ing index. Consequently, fur ther study a t higher leve ls of superheat together with accurate measurements of flow are needed. The expansion index, as determined herein, a l so includes the e f f ec t of f r i c t i o n i n the nozzle; f o r example, i f the nozzle eff ic iency were 95 per- cent, the isentropic index would be about 1.33. More accurate determination of the isentropic index would, therefore, require knowledge of the ac tua l e f f i - ciency of the nozzle.
Thermal growth corrections. - The accuracy of t he posi t ion a t which the probe%atic pressures were measured depended on the thermal growth of t he pressure t a p from the downstream s t r u t , which served a s a reference stop. For thermal growth corrections, it w a s assumed t h a t the en t i r e probe w a s a t t he receiving temperature ( s t a t e 4). nozzle i n l e t ( s t a t e 2 ) and the receiving zone ( s t a t e 4) w a s not grea te r than 300' F. If the e n t i r e probe were a t the i n l e t temperature, t h e m a x i " e r r o r i n the approximate 4 inches of t r a v e l would be 0.15 inch and would occur when the probe t a p w a s located a t the nozzle in l e t . would be essent ia l ly no error . Over the complete traverse, therefore, t he e r - ro r s involved i n assuming the e n t i r e probe t o be a t the receiving temperature a re considered t o be ins igni f icant or well within the accuracy of p lo t t i ng the data as seen by inspection of f igures 11 and 12. I n the region of t he t ie - rod connector, t o which t h e r e c t i l i n e a r potentiometer was connected, t h e temperature w a s about 300' F and w a s maintained by e l e c t r i c a l heaters. Consequently, it w a s a l so assumed t h a t no s igni f icant e r rors i n posi t ion were introduced from
The s t 3 t i c temperature difference between the
A t the nozzle out le t , there
19

111111 1.1. ..I 1,111 I, I, ,,,... ,,.-.-,-. . ...,..--
this source.
The temperatures used for the thermal growth of the nozzle were measured by a surface-welded thermocoqle located at the middle of the 4-inch-long noz- zle. The error involved in the corrected position of a wall tap is not greater than k0.005 inch.
Vapor-pressure check. - As a check on the pressure-m$asuring technique, the nozzle inlet and the receiving pressures were compared with a vapor-pressure curve recommended in reference 4. The result is shown in figure 13.
E00 It
/ d
/
] Measured Receiving
1 I
I
/
Calculated with equations from ref. 4: - log p = 6.05389 -9448.4 where T T - 14.7 -
ranges from 720’ to 1710° R 8718 3 log p = 5.83981 - - where T -
T - 83.2 ranges from 1710’ to 2700° R
1700 1800 1900 2OOO 2100 Temperature, OR
Figure 13. - Comparison of measured pressures with pressures cal- culated with equations from reference 4.
The pressure measured at the nozzle inlet (state 2) should (with line losses neglected) be the same as the saturation pres- sure in the separator. Likewise, the measured pressures at the tee downstream of the nozzle should correspond with the sat- uration pressure in the condenser (state 5). pressure measured at the nozzle inlet is plotted against the tem- perature measured in the sepsra- tor. The measured pressures range from 5.97 to 28.58 inches of mercury and show excellent agreement with the vapor-pressure curve.
In figure 13, the
The measured receiving pres- sures, also indicated in fig- ure 13, fall above the recommend- ed vapor-pressure curve. These measured pressures are plotted against the temperature of the saturated condensate measured in the bottom header of the free- draining condenser (state 5). If it is assumed that the recom- mended vapor-pressure curve is accurate in the low pressure area, the partial pressure of the inert gas, injected for pres- sure measurement, in the area of the condenser and the pressure
losses from the tee to the bottom of the condenser probably account for the discrepancies.
20
I

SUMMARY OF RESULTS
An inert-gas-injection technique has been successfully used to measure accurately the pressure of vaporous sodium flowing under steady-state conditions through an axisymmetrical convergent-divergent nozzle. Nozzle inlet conditions were varied; pressures ranged from approximately 6 to 29 inches of mercury ab- solute, while inlet temperatures ranged from 1380' to 1650' F with indicated superheat up to 60' F above saturated temperature. through the nozzle were determined with wall taps and an axial-pressure probe and were compared with the pressure distributions theoretically calculated for a gas expanding isentropically. The following results were found:
Pressure distributions
1. The accuracy of pressure measurements of one- or two-phase flow obtain- able by the inert-gas-injection technique depends upon the sensitivity of the read-out instrument. This technique is recommended for use in high-temperature liquid-phase and vapor-phase liquid-metal systems, where proper analysis of re- search data requires the measurement of process pressures to an accuracy of a few inches of water.
2. The axial pressure distribution along the nozzle axis did not differ significantly from the distribution determined by the w a l l pressure taps. No changes in the pressure gradient that would be indicative of condensation were noted. Also, no significant difference in the expansion path as a function of superheat for indicated superheats up to 60' F was noted.
3. A value of 1.3 for the expansion index relating the pressure and volume during expansion according to test conditions investigated,. Further study at higher levels of superheat to- gether with accurate measurements of flow are needed to substantiate the re- sults. True superheat may not have been attained; that is, liquid droplets could have been dispersed in the superheated vapor.
pvn = c best represented the nozzle and the
Lewis Research Center National Aeronautics and Space Administration
Cleveland, Ohio, January 22, 1964
21
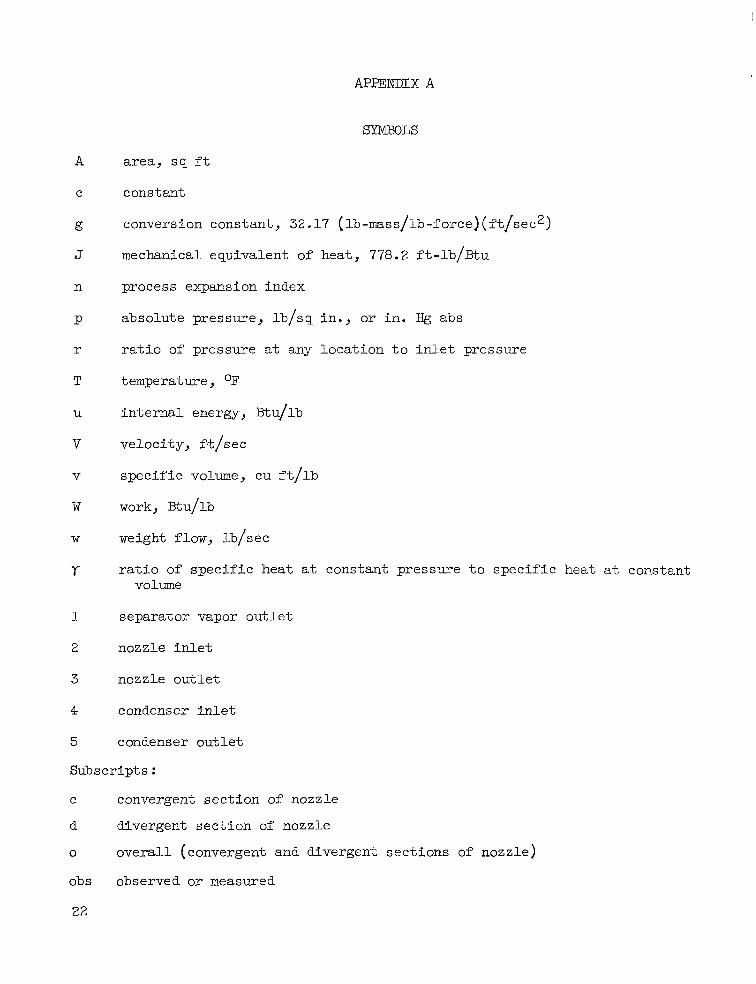
APPENDIX A
SYMBOLS
A
C
g
J
n
P
r
T
U
V
v
W
W
Y
1
2
3
4
5
area, s q f t
constant
conversion constant , 32.17 (lb-mass/lb-force) ( ft /sec2)
mechanical equivalent of heat, 778.2 ft- lb/Btu
process expansion index
absolute pressure, lb/sq in . , or i n . Hg abs
r a t i o of pressure a t any locat ion t o i n l e t pressure
temperature , OF i n t e rna l energy , Btu/lb
velocity, f.t/sec
spec i f ic volume, cu f t / l b
work, Btu/lb
weight flow, Ib/sec
r a t i o of spec i f i c heat a t constant pressure t o spec i f i c heat a t constant volume
separator vapor ou t l e t
nozzle i n l e t
nozzle ou t l e t
condenser i n l e t
condenser ou t l e t
Subscripts :
C convergent sec t ion of nozzle
d divergent sect ion of nozzle
0
obs observed o r measured
22
overa l l (convergent and divergent sect ions of nozzle)
t throat of nozzle
x variable s t a t e point
r theore t ica l
23
I

DERIVATCON OF EQUATION R E L A a N G PRESSURES AND ABFA JIN
ONE-DIMEZVSIONAL ISE2lTROEIC ROZZLE l3XRUVSION
I n one-dimensional analysis of steady-state flow, it is assumed t h a t the radius of curvature of t he ducting i s much l a rge r than the width of the ducting and t h a t the propert ies of t he flowing f l u i d change only i n the axial direct ion. This implies t h a t any properties required t o define t h e flowing f l u i d a re con- s t an t a t any plane normal t o the stream and t h a t transverse flow does not ex i s t . T h i s is , of course, not t rue. By working with average transverse values of the defining properties, however, t h i s one-dimensional analysis gives a good indica- t i o n of t he average change i n properties along the longi tudinal coordinate.
I n many cases, flow through a short well-contoured nozzle i s essent ia l ly f r i c t ion le s s , and the expansion process can be considered reversible . 9 m a l l de- viat ions from a f r i c t i o n l e s s expansion can bes t be expressed by a nozzle e f f i - ciency fac tor or a veloci ty coeff ic ient . The expansion process through a short nozzle is e s sen t i a l ly adiabat ic because of the s m a l l heat- t ransfer area ava i l - able and the short residence time of the flowing f l u i d i n the nozzle. This revers ible adiabat ic (o r isentropic) expansion i s a valuable guide f o r comparing actual expansion processes.
The following derivation r e l a t e s the area a t any locat ion i n a convergent- divergent nozzle t o the pressure a t the same location, the i n l e t pressure, and the area of the throa t of the nozzle f o r c r i t i c a l flow. One-dimensional isen- t rop ic flow i s assumed i n the derivation.
The general energy equation f o r isentropic flow i n the nozzle from the in- l e t t o any s t a t ion within the nozzle can be wri t ten as
The change i n in t e rna l energy i s independent of t h e process occurring be- tween s t a t e points whether t h a t process i s flow o r nonflow. Therefore, the simple energy equation f o r an isentropic nonflow process can be u t i l i z e d t o show t h a t
From equations (B1) and (BZ),
24
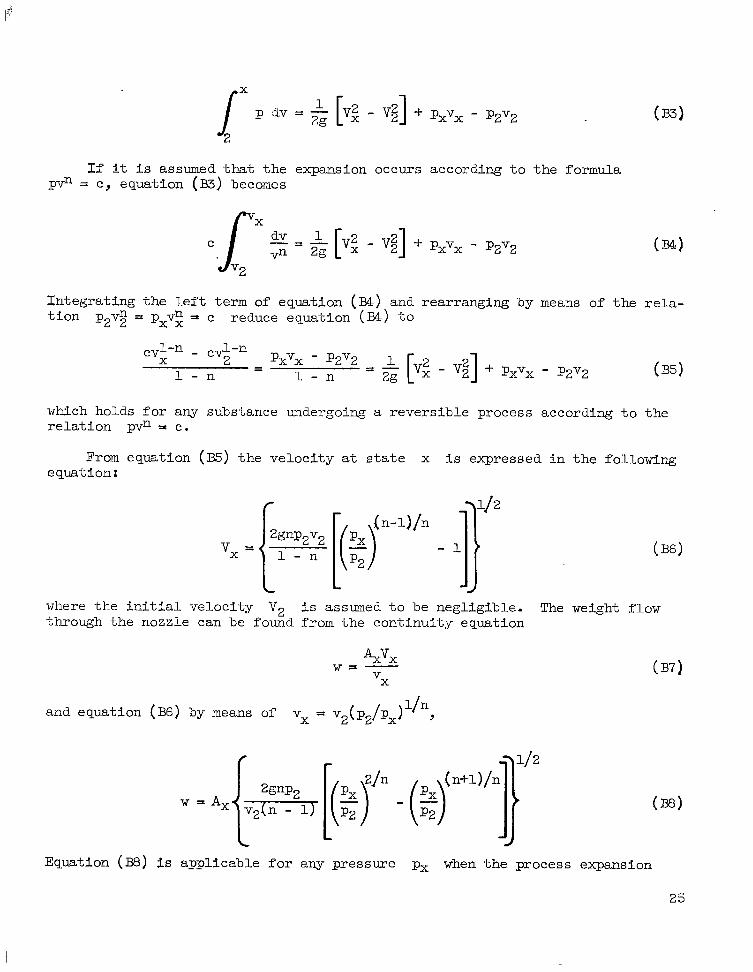
If it is assumed that the expansion occurs pvn = c, equation (B3) becomes
pxvx - p2v2
according t o the formula
In tegra t ing the l e f t term of equation (a) and rearranging by means of the rela- t i o n p2v5 = pxvg = c reduce equation (E41 t o
which holds f o r any substance undergoing a reversible process according t o the r e l a t i o n pvn = c.
From equation (E) t he veloci ty a t s t a t e x i s expressed i n t h e following equation!
where the i n i t i a l veloci ty V2 i s assumed t o be negligible. The weight flow through the nozzle can be found from the continuity equation
AXVX v=- v X
and equation (B6) by means of vx = v2(p2/Px) l /n
Equation (E3) L
applicable for any pressure px when the process expansion
25

index n i s known. For a per fec t gas, the process index i s y, the r-atio of the specific heat a t constant pressure t o the spec i f ic heat a t constant volume cP/cY, where pvy = c describes the expansion process. Writing equation (BB) f o r the th roa t of t he nozzle and dividing this e x p l i c i t form of the weight-flow equation by equation ( ~ 8 ) as stown previously give
r
L The pressure r a t i o pJp2 follows f
f o r c r i t i c a l flow is r e l a t ed t o the process index as
Subst i tut ion of this equation i n t o equation (B9) r e s u l t s i n
AX A t p
L J
This expression r e l a t e s the r a t i o of the area a t any loca t ion t o the throa t area, and the r a t i o of the pressure a t s t a t i o n reversible expansion.
x t o the i n l e t pressure f o r a
26
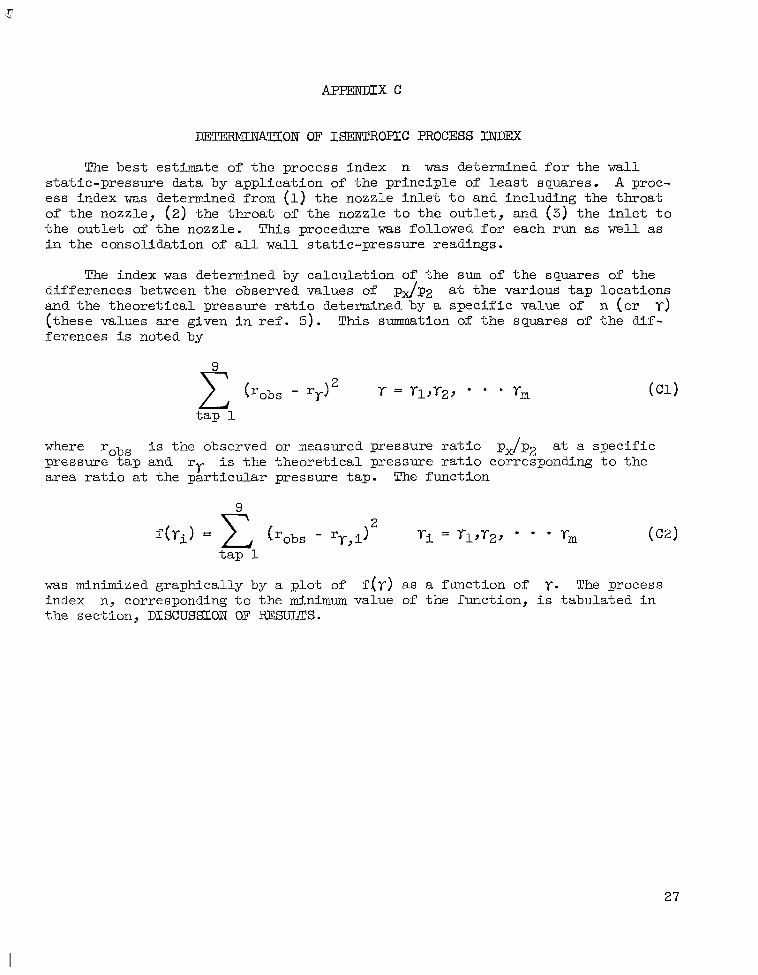
DETERMINATION OF I m R O € ' I C PROCESS u\TDEx
The best e s t h a t e of t he process index n was determined f o r the wall stat ic-pressure data by appl icat ion of the pr inciple of l e a s t squares. A proc- ess index was determined from (1) the nozzle i n l e t t o and including the throat of the nozzle, (2) the throa t of the nozzle t o the out le t , and (3) the i n l e t t o the out le t of t he nozzle. This procedure was followed f o r each run as well as i n the consolidation of a l l w a l l s ta t ic-pressure readings.
The index w a s determined by calculat ion of the sum of the squares of t he differences between the observed values of and the theore t ica l pressure r a t i o determined by a spec i f ic value of (these values a re given i n r e f . 5). ferences i s noted by
pJp2 a t the various t a p locations r) n (or
T h i s summation of t he squares of the dif-
t a p 1
where robs i s the observed o r measured pressure r a t i o px/p2 a t a spec i f ic pressure t a p and rr area r a t i o a t the par t icu lar pressure tap.
i s the theo re t i ca l pressure r a t i o corresponding t o the The function
was minimized graphically by a p lo t of f l y ) as a function of Y. The process index n, corresponding t o the minimum value of the function, i s tabulated i n the section, DI~CUSSION OF RESULTS.
27

I 11111111l Ill I I Ill Ill1 II
1. Coultas, T. A . ; Thermodynamic Aspects of the Flow of Sodium Vapor Through a Supersonic Nozzle. Research Rept. 61-32, Rocketdyne Div., North American Aviation, lnc., Nov. 1961.
2. Nichols, Landon R., Winzig, Charles H., Nosek, Stanley M., and Goldman, Louis J.1 Flash-Vaporization Facility. NABA TN D-1661, 1963.
Design and Operational Performance of a 150-Kilowatt Sodium
3. Weatherford, W. D., Jr., eler, John C., and Ku, P. M.r Properties of Inor- ganic Energy-Conversion and Heat-Transfer Fluids for Space Applications. WADD TR 61-96, NOV. 1961-
4. Thomson, George W., Garelis, Edward: Physical and Thermodynamic Properties of Sodium. Second ed., Ethyl Corp., Nov. 29, 1955.
5. Keenan, Joseph H., Kaye, Joseph1 Gas Tables. John Wiley & Sons, Inc., 1948. Tables 30-34.
6. Shapiro, Ascher H.: The Dynamics and Thermodynamics of Compressible Fluid Flow. Vol. 2, Ronald Press, 1954.
28

Wall tap
Loca- tion
Inlet 1 2 3 4 5 6 7 8 9
3eceiv ing
Barom- eter
TABIX I. - N0ZZI;E WALL 'STATIC-PRESSUIIE DATA (AIR)
[Nozzle inlet temperature, 55O F. 1
Pressure, PJ
n. Hg abs
29.67 29.48 28-79 26.83 22-25 18- 87 14.64 10.75 8-55 4-67 5.82
29-64
1
Pressure ratio, P X h
1- 000 .993 .970 . 904 -750 . 636 .493 -362 288 157 .196
-----
Run
2
Pressure, P,
in, Hg abs
20.10 19-94 19.50
15.07 12-80 10,oo 7-38 5.83 3.25 4.38
29.49
~
18.17
1.000 t 992 e 970 . 904 I 750 .637 498 367 .290 162
t 218
-----
Pres sure, P,
.ne Hg abs
10-45 10.39 10-15 9.48 7.83 6-68 5.33 3- 93 3.09 3.17 3.51
29-49
3
Pressure ratio, p&2
1,000 -994 . 971 907 .749 . 639 .I 510 - 376 296 303 - 336
-----
29

TABLE 11. - NOZZLE WALL STATIC-PRESSURE DATA (SODIUM VAPOR)
( a ) Axial DrObe i n s e r t e d
Run Condenser Barometer Separa tor Nozzle Degrees Nozzle Condenser Condenser
( s t a t e 2) super- charge ( s t a t e 4) ( s t a t e 5 ) of dis- i n l e t o u t l e t
Nozzle Nozzle w a l l p r e s s u r e t a p
( s t a t e 2) 1 2 3 4 5 6 7 8 9 4 and 5) i n l e t - ( s t a t e s ( s t a t e 1) i n l e t
h e a t ( s t a t e 2)
Pressure , p, i n . Hg ab8
1 6 1 1 1611 1609 1608
Temperature, T, OF
21 21 19 18
1 A
1B 1BB
Pressure , p. i n . Hg ab8
25.49 25.38 24.84 23.49 19.77 16.97 14.09 10.39 8-10 5.12 6.89 29.33 1590
25.45 25.40 24.87 23.50 19.67 16.97 14.04 10.54 8.37 5.28 6.87 23.28 _ _ _ _ _ -_--- 14.02 _ _ _ _ _ _ _ _ _ 5.26 6.57
25.39 _ _ _ _ _ _ - _ _ _ 25-38 19.66 r_ -__ _ _ _ _ _ --___ _ _ _ _ _ _ _ _ _ _ _ _ 25.28 _ _ _ _ _ _ _ _ _ _
1373 1366 1365 1360
1358 1357 1358 1355 1360 1355 ~
1356 1357
Pressure , p, i n . Hg abs
1 B 1BB
1522 9 1522 9 1523 : 10 1523 10
0.996 0.975 0.922 0.776 0.666 0.553 0.408 0.318 0.201 0.270 _ _ _ _ _ ----- .g21 -774 ----- _ _ _ _ _ ----- ----- ----- _ _ _ _ _ .998 ,977 .923 .773 .667 .552 .414 .329 .208 ,270
.208 .260 _ _ _ _ _ _ _ _ _ _ .g21 ----_ ----- ,555 _ _ _ _ _ ---__
2A
2B 2AA
2BB
4
a17.05 16.90 16.40 15.55 13.05 11.14 9.07 6.94 5.37 3.57 3.44 29.29 1513 12.97 ----- g .07 _ _ _ _ _ _ _ _ 3.59 3.46
a16.97 16.78 16.40 15.46 13.17 11.15 9.16 6.89 5.97 3.77 3.49 3.69 ----
------ 16.93 -_-__ _ _ _ _ _ ------ 16.90 ----- _ _ _ _ _ 13.02 ----- 9.16 _ _ _ _ _ _ _ _
1270 1 1260 1256 1270 1259 1257 1270 1259 1256 1271 1260 1256
2B 2BB
0.991 0.962 0.912 0.765 0.653 0.532 0.407 0.315 0.209 0.202 .211 .203 ,993 ----- ---_-
.989 ,966 .911 .776 .657 ,540 .406 .352 .222 .206 .217 -----
-532 -____ ----- .761 ----- -767 --___ -540 _ _ _ _ _ _ _ _ _ _ -996 _ _ _ _ _ _ _ _ _ _
3A 3AA 3B 3 m
4A “28.78 28.59 27.87 26.23 22.26 19.56 17.00 12.21 8.08 5.86 29.22 1610 1639 29 1365 1357 1356 4AA a28.61 28.39 27.62 26.17 22.17 19.48 17.00 12.28 8.17 5.88 1611 1648 37 1380 1358 1356
4B 4BB I a28.90 a28.76 1 28.68 28.54 127.89 27.85 126.04 26.04 121.89 21.92 (18.79 18.64 115.52 15.52 111.74 11.43 1 9 . 1 4 8 .96 15.88 5.83 I iiii I I 9 9 1368 1365 1357 1.1Sfi 1355 1355 1612 1612 1621 1621
‘8.52 8.49 8.30 7.86 6.69 5.76 4.80 3.64 2.81 1.85 1 .66 29.19 1405 1437 32 1198 1164 1158 1404 1439 35 1198 1165 1158 1405 1442 37 1196 1164 1161 1405 1441 36 1190 1168 1161
a8.61 8.54 8.28 7.71 6.55 5.68 4.68 3.55 2.80 1.78 1.65 a8.60 8-40 8.31 7.91 6.56 5.61 4.80 3.63 2.84 1.81 1.63
7-90 _ _ _ _ 5.63 _ _ _ _ _ _ _ _ _-__ _ _ _ _ _ _ _ _ 8.54 ---- _ _ _ _ _
Pressure r a t i o , px/p2
0.997 0.974 .992 .962 .977 .966
3BB
0,923 0.785 0.676 0.563 0.427 0.330 0.217 0.195 .896 .761 .660 .544 .410 .325 .207 .192 .920 .763 .652 .558 .422 .330 .211 .190 .919 ----- -655 _ _ _ _ _ _ _ _ _ _ ---__ _ _ _ _ _ _ _ _ _ _
2 A 4BB
0.993 0.968 0.911 0.774 0.680 0.591 0.424 0.281 0.204 0.236 392 .965 .915 .775 .681 .594 .429 .286 -206 .230
.992 .965 .901 .757 .650 .537 .406 -317 .204 .236
.992 .968 .904 .762 .648 .540 .397 .312 -203 .236 ‘iw 1

R u n
Pressure r a t i o , pJp9
Nozzle Nozzle wal l p re s su re t a p Condenser Barometer Separator Nozzle Degrees Nozzle Condenser Condenser i n l e t ( s t a t e s ( s t a t e 1) i n l e t of d i s - i n l e t o u t l e t
( s t a t e 2) 1 2 3 4 5 6 7 8 9 4 and 5 ) ( s t a t e 2) super- charge ( s t a t e 4) ( s t a t e 5) heat
( s t a t e 2)
Pressure, D. in . HE abs
5A 5AA 5B 5BB
‘15.42 15.44 15.07 14.01 11.96 10.19 8.38 6.57 4.96 3.31 3.83 29.38 1500 1500 0 1270 1261 1258 1501 1501 0 1267 1259 1257 1500 1562 62 1263 1254 1251 I 1500 1561 61 1277 1253 1254
a15.42 15.35 15.02 14.08 11.99 10.12 8.31 6.41 4.98 3.31 3.75 15.84 15.68 15.15 14.18 11.97 10.32 8.38 6.40 5.02 3.05 3.50
‘15.64 15.57 15.23 14.12 11.94 10.15 8.22 6.40 4.99 3.09 3.56
6A 6AA
‘Extrapolated data .
5.96 5.89 5.74 5.32 4.56 3.81 3.21 2.51 1 .91 1.29 1.27 29.14 1344 1379 35 1117 1106 1098 5.85 6.02 5.93 5.46 4.57 3.89 3.23 2.51 1.92 1:26 1.04 29.14 1346 1381 35 1121 1113 1105
1422 22 1208 1201 1200 1418 23 1207 I 1200 I 1198
6A 6AA
1479 23 1479 ~ 22
1.00 0.988 0.963 0.893 0.765 0.639 0.539 0.421 0.321 0.216 0.213 29.14 1-00 1.029 1.014 .933 .78 .665 .552 .429 -328 .215 .178 29.14
Pressure, p, i n . Hg abs
7A 8.42 8.45 8.31 7.76 6.56 5.59 4.63 3.61 2.77 1.80 2.24 29.14 29.14 7AA 8-40 8.36 8-14 _ _ _ _ _ _ _ _ _ _ _ _ _ _ _ _ _ _ - _ _ _ _ _ _ _ _ _ _ _ _ _ 1400
1395
I Probe t r a v e l : outward
Run 1 B
0.126 1.206 1.599 2.013 2.267 2.500 2.758 3.037 3.237 3.818
Condenser Barometer
Run 1C
I Location
Probe pressure
from nozzle i n l e t , in.
t a p pos i t ion
Separator Nozzle i n l e t Nozzle i n l e t (de-
Nozzle discharge Condenser i n l e t Condenser o u t l e t
g rees of superheat)
Pressure, P,
i n . Hg abs
25.23 24.21 22.71 19.72 17.11 14.72 11.18 8.15 6.52
Pressure, PJ
in. Hg abs
0.999 .959 .899 .781 .67% .593 .443 .323 -258
Pressure r a t i o , px/pz
4. 62 .183 6.89 0.273 29.32 -----
S t a t e Tempera- t u re ,
T, OF
TABLE 111. - AXIAL PRESSURE DATA (SODIUM VAPOR)
S t a t e Tempera- 3.524
Probe t r ave l : inward
1 1590 Location 2 1610
0.126 .423 .760 1.033 1.291 1.524 1.758 1.990 2.210 2.367 2.587 2.819
S t a t e
~
25.08 25.05 24.84 24.51 23.88 22.98 21.64 19.54 17.47 15.94 13.22 10.44 6.70 5.35
Probe pressure r a t i o , t a p pos i t i on
from nozzle i n l e t , in.
0.999 .998 .990 .977 .951 .916 .862 .778 .696 .635 .527 .416
I Probe t r ave l : outward
0.126 1.031 1.566 1.901 2.308 2.618 2.972 3.335 3.807
Condenser Barometer
.267 ~ Location
.213 ~
.181 0.275
Separator
tUre, Nozzle i n l e t (de- reupera- Nozzle i n l e t
25.30 0.999 24.61 23.00 20.81 16.86 13.22 8.99 .355 6.02 4.69 .185
T, grees of superheat) OF Nozzle discharge - 1364
r 1590 Condenser i n l e t 4 1359 1365 Separator 1
5 1357 Nozzle in le t (de- 2 20 4 1358 Nozzle i n l e t 2 1610 Condenser o u t l e t 5 1356
grees of superheat) - Nozzle discharge 1364
Condenser i n l e t 4 1358 Condenser o u t l e t 5 1357 j

17.00 0.994 16.75 .980 16.40 .959
Probe pressure Pressure, t ap posit ion p,
from nozzle in le t , in . Hg abs in.
Pressure Probe pressure Pressure, Pressure Probe pressure Pressure, Pressure Probe pressure Pressure, Pressure p, ra t io , r a t i o , t ap posit ion P, r a t i o , t ap posit ion p, ra t io , t a p posit ion
px/p2 from nozzle i n l e t , i n . Hg abs px/p2 from nozzle i n l e t , in . Hg abs px/p2 from nozzle in le t , in. Hg ab8 p d p 2 in. in. i n .
1.588 15.03 .879 2.031 12.89 .754 2.361 10.74 .628
7.84 .458 2.704
Sta te Tempera- 2.942 6.01 .358 3.797 3.00 .176 4.31 .256 Condenser 3.49 0.205
T, 3.542 3.67 .218 Eai-omet e r 29.20 ----- Location
ture, 3.265
OF 3.797 2.90 ,173 Condenser 3.46 0.206 Location 1 Sta te Tempera- Separator
1 2 Nozzle i n l e t 2 1522 - T, Nozzle i n l e t (de- 2 Nozzle i n l e t (de- 2 11 Location S ta te Tempera- OF grees of superheat)
Nozzle discharge 1268 T, Separator 1 1515 Condenser i n l e t 4 4 2 5
1511 Barometer 29.23 ----- ture , Nozzle i n l e t Separator
grees of superheat) ture, Nozzle discharge
1258 OF Nozzle i n l e t 1523 Condenser o u t l e t 1255 Separator
Condenser i n l e t Condenser ou t le t 5 1
2 1514 Nozzle i n l e t (de- 2 8
grees of superheat) Nozzle discharge , 2 1271 Condenser i n l e t 4 1261
1270 Condenser ou t le t 5 1256
Nozzle i n l e t Nozzle in le t (de-
Nozzle discharge grees of superheat)
Condenser in le t 4 1261 Condenser ou t le t 5 125d
4.62 .270
Condenser 3.69 , 0.216 Barometer 29.15 1 -----
3.195 3.791 2.99 . .175 -
ture , T, OF
1515 1523
8
1270 1260 1256
- Location S ta te Tempera-

w rb
Run 3A
Probe pressure Pressure, Pressure tap position P, ratio,
from nozzle inlet, in. Hg abs px/p2 in.
Run 3B Run 4A Run 4B
Probe pressure Pressure, Pressure Probe pressure Pressure, Pressure Probe pressure Pressure, Pressure tap position p, ratio,
from nozzle inlet, in. Hg abs px/p2 from nozzle inlet, in. Hg ab8 px/p2 from nozzle inlet, in. Hg abs px/p2 tap position P, ratio, tap position p, ratio,
in. in. i n .
~ ~
1404 Separator 1 1611 Separator 1 1611 Nozzle inlet 2 1624 Nozzle inlet 2 1621
l4;$ Nozzle inlet (de- 2 13 Nozzle inlet (de- 2 10 2 2
Separator 1 - Nozzle inlet
39 Nozzle inlet (de-
Separator 1 Nozzle inlet Nozzle inlet (de- l ;
5
Nozzle discharge Condenser inlet 4 Condenser outlet , 1159 'Ondenser Outlet
grees of superheat) grees of superheat) Nozzle discharge 1365 Nozzle discharge 1365
4 i:i: Condenser Inlet 1357 Condenser inlet 4 1357
grees of superheat) grees of superheat: Nozzle discharge Condenser inlet
5 1355 Condenser outlet 5 1355

"The National Aeronautics and Space Administration . . . shall . . . provide for the widest practical appropriate dissemination of information concerning its activities and the results thereof . . . objectives being the expansion of human knowledge of phenomena in the atmosphere and space."
- -NAT~ONAL AERONAUTICS AND SPACE ACT 01 1958
NASA SCIENTIFIC AND TECHNICAL PUBLICATIONS
TECHNICAL REPORTS: important, complete, and a lasting contribution to existing knowledge.
TECHNICAL NOTES: of importance as a convibution to existing knowledge.
TECHNICAL MEMORANDUMS: Information receiving limited distri- bution because of preliminary data, security dassification, or other reasons.
CONTRACTOR REPORTS: Technical information generated in con- nection with a NASA contract or grant and released under NASA auspices.
TECHNICAL TRANSLATIONS: Information published in a foreign language considered to merit NASA distribution in English.
TECHNICAL REPRINTS: Information derived from NASA activities and initially published in the form of journal articles or meeting papers.
SPECIAL PUBLICATIONS: Information derived from or of value to NASA activities but not necessarily reporting the results of individual NASA-programmed scientific efforts. Publications include conference proceedings, monographs, data compilations, handbooks, sourcebooks, and special bibliographies.
Scientific and technical information considered
Information less broad in scope but nevertheless
Details on the availabil i ty of these publications m a y be obtained from:
SCIENTIFIC AND TECHNICAL INFORMATION DIVISION
NATIONAL AERONAUTICS AND SPACE ADMINISTRATION
Washington, D.C. 20546
~ - - -- . . , , I .I ......,.. .~