technical journal - sae a - 2014 meea technic… · aerodynamics of australian coal trains ... and...
TRANSCRIPT

TECHNICAL JOURNAL

2014 Excellence Awards, Technical Papers 1
Contents About & Award Categories........................................................................................................................... 2
The Mobility Engineering Excellence Awards ........................................................................................... 2
Professional Category Awards ................................................................................................................ 2
Academia Category Awards .................................................................................................................... 2
Key Dates for 2015 MEEA ........................................................................................................................... 2
Apply for the 2015 Excellence Awards ......................................................................................................... 3
SAE-A National Office Contact Details ......................................................................................................... 3
2014 MEEA Award Winners......................................................................................................................... 4
Sponsors of the 2014 MEEA ........................................................................................................................ 5
The SAE-A .................................................................................................................................................. 6
Being a member ..................................................................................................................................... 6
2014 Judging Panel ..................................................................................................................................... 7
Platinum Award & Gold Award for Automotive Robert Bosch Australia,
Automatic Emergency Braking Rear (AEB-Rear) .......................................................................................... 9
Gold Award for Heavy Commercial Vehicle AutoTest Products Pty Ltd,
AutoMonitor: Complete Vehicle Condition Monitoring ................................................................................. 14
Gold Award for Manufacturing AutoCRC Ltd, Victorian Partnership for Advanced Computing, Malaysia
Automotive Institute, vMould – Rapid Plastic Injection Mould Design Optimisation ...................................... 23
Student Gold Award Tyler Plowright, University of Newcastle,
Aerodynamics of Australian Coal Trains ..................................................................................................... 31
Student Highly Commended Award Marc Russouw, Monash University,
Development of a Vehicle and Tyre Model for Formula SAE-A .................................................................... 32

2014 Excellence Awards, Technical Papers 2
About & Award Categories
The Mobility Engineering Excellence Awards The SAE-A Mobility Engineering Excellence Awards (MEEA) is the industry’s premiere event recognising
outstanding contributions to advancing technologies in the transport mobility field. The MEEA carries great
prestige within the engineering mobility profession. Award submission offers significant recognition, with all
submissions being reviewed by technical experts within the industry, and promoted through the Society’s
publications and media releases.
Each year nominations are sought from across the mobility engineering industry, with awards in the following
sectors:
Professional Category Awards: The Platinum Award - for the overall winner
Gold Award for Automotive
Gold Award for Caravans & Campers
Gold Award for Rail
Gold Award for Aerospace
Gold Award for Heavy Commercial Vehicles
Gold Award for Off-Road Vehicles
Gold Award for Manufacturing
Gold Award for Aftermarket
Gold Award for Young Engineer
Student Category Awards:
Gold Award for Student – Post Graduate
Gold Award for Student – Under Graduate
Highly Commended Award for Student
Key Dates for 2015 MEEA Nominations and Submissions Nominations for the 2015 MEEA officially open 26 May, 2015.
Professional and Young Engineer submissions close 12 October, 2015.
Post and under Graduate submissions close 26 October 2015.
Awards Ceremony The Awards ceremony and dinner will be held on 19 November 2015 at Fenix; 680 Victoria Street, Richmond, Victoria.
Dinner RSVP closes 12 November 2015.

2014 Excellence Awards, Technical Papers 3
Apply for the 2015 Excellence Awards The SAE-A’s Mobility Engineering Excellence Awards recognises excellence in engineering across a product,
process or service.
Register your interest now to [email protected], or (03) 9676 9568.
The SAE-A awards “Outstanding Contributions to Advancing Technology”, as well as recognising key persons in
the Young Engineer, Post Graduate and Undergraduate categories, for their key contributions to the engineering
mobility industry.
The SAE-A can help facilitate your nomination – contact one of the friendly staff at the National Office.
Submissions for the next MEEA close October 2015.
SAE-A National Office Contact Details Address: Unit 30 / 3 Westside Ave,
Port Melbourne Vic 3207
Phone: (03) 9676 9568
Fax: (03) 9646 7793
Email: [email protected]
Office Hours: Monday – Friday,
9:00am – 5:00pm
www.saea.com.au
2014 Excellence Awards, Technical Papers 4
2014 MEEA Award Winners
Platinum Award
& Gold Award for Automotive:
Robert Bosch Australia - Automatic Emergency Braking Rear The most prestigious award of the evening; the overall winner of the professional awards category, was
presented to Robert Bosch Australia for their highly innovative Automatic Emergency Braking Rear (AEB-Rear)
product. The AEB-Rear has significant export opportunities for many global platforms. AEB-Rear uses
ultrasonic and radar sensing technologies combined with automatic braking to reduce pedestrian injuries and
fatalities as well as unintended collisions caused when a vehicle is reversing.
Gold Award for Heavy Commercial Vehicle:
AutoTest Products Pty Ltd - AutoMonitor: Complete Vehicle
Condition Monitoring AutoTest Products Pty Ltd was awarded Gold in the Heavy Commercial Vehicle category for their AutoMonitor
product; a Complete Vehicle Condition and Roll-Over Monitor for heavy vehicles. A product of interest to safety
authorities and of value to fleet operators.
Gold Award for Manufacturing:
AutoCRC Ltd, Victorian Partnership for Advanced Computing,
Malaysia Automotive Institute – vMould: Rapid Plastic Injection
Mould Design Optimisation vMould, an easy to access web application and software package from Victorian Partnership for Advanced
Computing (VPAC), in collaboration with AutoCRC Ltd and Malaysia Automotive Institute, received a Gold
award for the Manufacturing category, for its ability to automate plastic injection mould design and production
process, reducing manufacturing time and costs.
Gold Award for Student:
Tyler Plowright, Monash University - Aerodynamics of Australian
Coal Trains In the Student category, Tyler Plowright of the University of Newcastle was awarded Gold for his work in
Aerodynamics of Australian Coal Trains; a research project to help improve the energy efficiency and therefore
reduce fuel consumption in these trains.
Highly Commended Award for Student:
Marc Russouw, Monash University - Development of a Vehicle and
Tyre Model for Formula SAE-A Marc Russouw of Monash University was Highly Commended for his project on the Development of a Vehicle
and Tyre Model for Formula SAE, a model used by the Monash Formula team in the development of their
overall vehicle model.

2014 Excellence Awards, Technical Papers 5
Sponsors of the 2014 MEEA
The State Government of Victoria The State Government of Victoria sponsored the Platinum Award.
Mr. Chris Wong, Manager Automotive Victorian Government was
proud to present the highest award of the night, the Platinum Award
for engineering Excellence.
The RACV The RACV sponsored the Professional Awards: Automotive, Heavy
Commercial Vehicle and Manufacturing.
Nicholas Platt, RACV’s Acting Manager of Vehicle Engineering
presented these three awards to the winning companies.
GM Holden GM Holden sponsored the Student Awards category, including both
Gold and Highly commended awards.
Brett Vivian, Executive Director of Engineering at GM Holden
presented the awards to the student winners.
The Suncorp Group Suncorp was a proud supporter of the 2014 MEEA
2014 Excellence Awards, Technical Papers 6
The SAE-A The SAE-A is a non-profit organisation that works to serve the needs of its members and to promote the
relevance of mobility related technologies to governments, industry and the community in general.
SAE-A is the world’s third oldest mobility society and was founded in Melbourne in 1927 to address the need
for further education for all facets surrounding Mobility Engineering and now encompasses all mobility
engineering industries in the Asia Pacific region.
The vision of the SAE-A is to advance the mobility engineering professions in Australasia through promoting
the transfer of technical knowledge and skills, encouraging research and development in the private, education
and government sectors and involving our members in the development and maintenance of Australasian and
global technical standards.
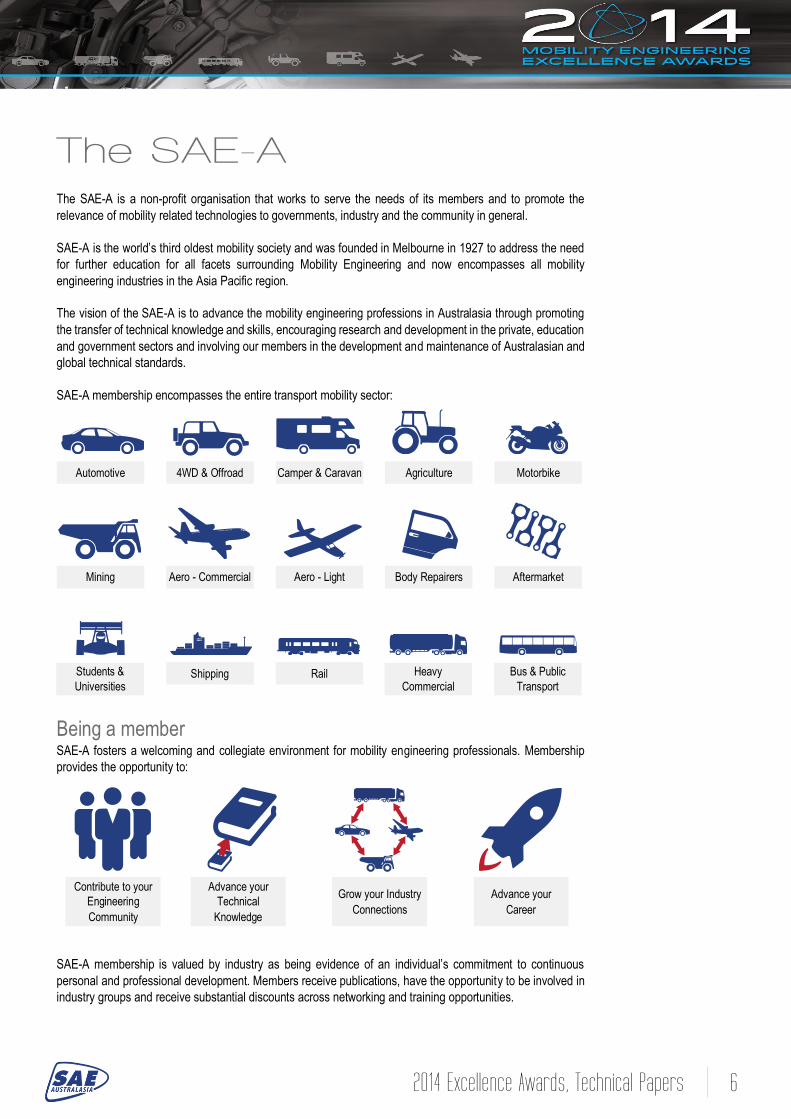
SAE-A membership encompasses the entire transport mobility sector:
Being a member SAE-A fosters a welcoming and collegiate environment for mobility engineering professionals. Membership
provides the opportunity to:
SAE-A membership is valued by industry as being evidence of an individual’s commitment to continuous
personal and professional development. Members receive publications, have the opportunity to be involved in
industry groups and receive substantial discounts across networking and training opportunities.
Contribute to your
Engineering
Community
Advance your
Technical
Knowledge
Grow your Industry
Connections
Advance your
Career
Automotive 4WD & Offroad Camper & Caravan Agriculture Motorbike
Mining Aero - Commercial Aero - Light Body Repairers Aftermarket
Students &
Universities Shipping Rail Heavy
Commercial
Bus & Public
Transport

2014 Excellence Awards, Technical Papers 7
2014 Judging Panel
Chair, SAE-A Excellence Awards - Shane Richardson Dr Shane Richardson is Principal Forensic Engineer and Managing Director of Delta-V Experts. Shane leads
a team of Engineers focused on evaluating, understanding and describing forensic engineering issues. Shane
investigates the dynamic exchange of energy between objects be it a pedestrian, cyclist, car or truck,
maintenance evaluations, mechanical failure analysis or workplace incident investigations. Shane also
conducts dynamic vehicle handing tests and develops engineering solutions to unique problems such as Roll
Over Protective Structures, Road Roughness Monitoring systems and instrumentation for sporting equipment.
Carl Liersch General Manager, Bosch Chassis Systems Control Engineering in Australia. Carl has worked in the automotive
supplier industry for 27 years, with the last 24 of those years with Bosch. During that time Carl has worked
primarily with vehicle safety systems. He was involved with the introduction of ABS and Airbag technology to
Australia in the early 1990s via the Australian OEMs. Since 2000, has worked on Electronic Stability Control.
Carl has tuned ABS and ESC systems for each of the vehicle manufacturers in Australia, for Jaguar and Ford
in Europe and the USA, and for Toyota in Japan. He leads the Chassis Engineering division in Australia with a
team of 50 engineers supporting safety system projects in Europe, Japan, India, Malaysia, the USA, and
Australia.
William Malkoutzis Proprietor, Talk Torque Automotive. Bill has been working for 33 years in the automotive industry, 13 years of
that career with Ford Australia, holding positions in both light and heavy vehicle design, test and development
in Australia and USA. He contributed to the development of the F series trucks and the design and introduction
of the Ford Capri in Australia and USA. A further 13 years with PBR Australia designing and developing braking
systems for customers in Australia, America, Asia and Europe. Bill has operated his own automotive
consultancy with various ongoing commercial clients for 8 years. He is a VASS authorised signatory for
modified light vehicles as regulated by VicRoads. He is the Immediate Past President of the SAE-A, serving
for over five years and has served as SAE-A Excellence Awards Chairmen for three years.
Clint Steele Senior Lecturer, Swinburne University of Technology. Clint Steele worked as a design or development engineer
in the automotive, mining equipment, water products and product design/development industries before
entering academia. He has also worked in Australia and China as a design engineer and the influence of
background (economic, cultural and environmental) upon engineering design practice is a research focus. An
additional interest is the attributes of expert engineering designers and how these can be developed in all
engineers. In his academic role Clint is also the academic advisor to the F-SAE team (Team Swinburne) and
a member of the electric vehicle research group (focusing on industry engagement). He is also on the board of
directors of the Alternative Technologies Association and SolarX.

2014 Excellence Awards, Technical Papers 8
Simon Watkins Professor Automotive Engineering, RMIT. He worked for British Aerospace at the Harrier Jump Jet plant in the
UK and studied the aerodynamics of advanced ground transport vehicles at City University, London. In 1983
he moved to Australia and has since researched and taught at RMIT. He has experience in Micro plane, car,
truck and train aerodynamics and heads a research group in vehicle aerodynamics and acoustics, consisting
of several graduate students and associated staff. He also is past chair of the SAE (International) Road Vehicle
Aerodynamics Forum based in Detroit and the Aero-acoustic subcommittee. He was the Chair and Conference
Convenor of the 2015 Asia Pacific Automotive Conference (APAC), held in Melbourne in March, preceding the
2015 Australian Grand Prix.
David Ford A University of Melbourne Honours graduate in Mechanical Engineering, David is a Fellow of the Institute of
Engineers Australia, SAE-International and SAE-Australasia. He is a former Senior Vice President and
Treasurer of SAE-Australasia. He was a Product Planning Manager and Chief Engineer at Ford Motor
Company in Australia, moving to the Ford Motor Company USA in 1990 to take up Director/Executive positions
in Product Development. He retired 1998 to return to Australia, where he has maintained international and local
industry and academic contacts and local business interests. He has also served on advisory committees for
the Engineering Schools of Melbourne, RMIT and Swinburne Universities and was Deputy President of the
Committee of Convocation of the University of Melbourne.
Andrea Winkelmann With more than 25 years in the automotive light, heavy and fuels industries, Andrea began her career in
Germany and completed her engineering degree in the UK. Immigrating to Australia in 2005 to take the role of
Senior Quality Engineer responsible for domestic vehicle warranty issues at Ford reporting to the executive,
and subsequently working at GM-Holden from 2007 were she hold the position as the Verification and
Validation Program Lead for the Global Zeta Platform, responsible for the project management of
vehicle/engine testing and system verification.
Andrea has recently taken up a position with ABMARC as Director of Engineering. In her new role she is
responsible for Emissions Testing for On & Off-road Engines and Vehicles using the AVL PEM System (the
only system of its type and capability in Australia), Dynamic Vehicle Testing and VASS Certification. Andrea
was awarded the ISSI – Eddy Dunn Endowment International Fellowship in 2014 to research the Impact of
International Heavy Duty Vehicle OBD Regulation Amendments (2013 onwards) on the Service and Repair
Industry in Australia.

2014 Excellence Awards, Technical Papers 9
Platinum Award & Gold Award for Automotive
Robert Bosch Australia,
Automatic Emergency Braking Rear (AEB-Rear)
Overview The Bosch Australia Chassis Systems Control team is the centre of global Bosch competency in Automatic
Emergency Braking technology.
The team has integrated a number of existing, new and emerging technologies to create a fully automated,
potentially life-saving feature that will be appearing in future model vehicles across the globe. Its development
required the clever combination of both ultrasonic and radar sensing technologies, along with an automatic
braking system, to create a solution to the reversing visibility problem, that has been causing ever increasing
numbers of pedestrian injuries and fatalities as well as unintended collisions the world over.
The system is tuned to be sensitive and discerning of pedestrians and obstructions at speeds up to 15 km/h,
to within 10 metres of the rear of the vehicle dependent on the path taken. It uses the sensing data and
associated algorithms to apply a calculated level of braking force if an obstruction or pedestrian is sensed to
be within and surrounding the vehicles path. Without the need of driver input, AEB-Rear will stop the vehicle
and prevent collisions and injuries, while ensuring that false interventions are kept to a minimum.
Judges’ Comments The standout feature of this submission is the manner in which Bosch simply and efficiently brings together
currently available technologies in a practical way to address a current need; reducing the potential of
pedestrian, particular children, injuries and fatalities. The potential of this product to save lives, combined with
major global export opportunities of an Australian developed product, has deemed Bosch the Overall Winner
of the 2014 MEEA.

2014 Excellence Awards, Technical Papers 10
Robert Bosch (Australia) Automatic Emergency Braking Rear (AEB Rear) Function for Avoiding Back Over
Accidents
Mark Anderson Robert Bosch Australia
ABSTRACT
Automatic Emergency Braking (low speed) Rear (AEB-L Rear) is a function developed at Bosch Australia with support from Automotive New Markets Program (ANMP) that utilises vehicle sensors in combination with the Electronic Stability Control Program (ESP) to prevent a reversing accident. It brakes the vehicle when it is reversing towards a person or object that the driver would normally want to avoid. The detection utilises standard surround sensors such as Ultrasonic parking sensors and a pair of rear radars.
INTRODUCTION
Tragically, on average, seven children are killed each year and 60 are seriously injured after being hit or run over by a motor vehicle at home [1].
This statistic is mirrored around the world with over 60 child backover fatalities occurring in the U.S.A. in 2013 and over 1,180 since 1990 [2]. What makes this data even more shocking is that most of these accidents take place in home driveways and thus it is the children’s’ parents or family members who are most likely behind the wheel.
There are many awareness factors that contribute to backover deaths; such as lack of driver visibility for small children (many of whom are not tall enough to be seen in the rear window or rear-view mirror), a lack of road/vehicle safety knowledge in small children, and unpredictable juvenile behaviour. And, while many accidents can be avoided or minimised by reversing sensors or cameras, to date there does not exist any full-proof automobile technology that can eliminate human error and mitigate unexpected and sudden risks while reversing a vehicle.
Automatic Emergency Braking Rear (AEB Rear) is a function developed at Bosch Australia with support from Automotive New Markets Program (ANMP) aimed at reducing this unnecessary carnage.
Figure 1 – 3 Year Old Child standing behind a Ford Territory
SENSORS
The implementation of the AEB Rear utilises two different sensing technologies. The different types of sensors have been chosen to complement each other in terms of Field Of View (FOV) to optimise the combined FOV and minimise risks associated with individual sensor types.
Radar
The Bosch Mid-Range Radar Rear (MRR Rear) is the chosen technology for this implementation. These radars are a 77 GHz dual mode antenna radar utilising SiGe MMIC technology. The radar antenna has a range of approximately 100 meters with an opening angle of 150 degrees. The sensors are installed in pairs facing approximately 45 degrees off the centreline of the vehicle at the rear corner of the vehicle.

2014 Excellence Awards, Technical Papers 11
Figure 2. Image of a single MRR Rear radar FOV with an example of Blind Spot Detection illustrated.
The radars are conventionally installed for Cross Traffic Alert (CTA) and Blind Spot Detection (BSD). The AEB Rear function was designed to function when the radars are installed in their conventional locations.
The primary area of interest for AEB Rear has been determined to be within ten meters of the rear of the vehicle. This is based on limiting the speed at which the function operates to fifteen kilometres per hour. This speed was chosen based on a subjective evaluation of reversing speeds in a normal environment.
The distance was estimated by a build-up of the detection time, monitoring time, and stopping distance.
The limiting of the distance reduces some of the complexity in terms of vehicle corridor estimation, which when driving in reverse, can change quickly with relatively little steering input.
Tracking
It was found that in the near range for slow moving objects with lower radar cross sectional area that the tracking algorithms that have been implemented for other use cases needed to be modified. This tailoring enabled better tracking of children within the radar FOV.
The tracking algorithm was further developed to maintain a memory of objects that enter the blind spot of the radar immediately behind the vehicle. For pictorial representation of the Blind spot, refer to figure 3.
Figure 3 – FOV (2 Dimensional) of different sensing technologies.
Filtering
The second component of the radar development is to implement appropriate filtering techniques to identify relevant objects and to exclude non-relevant objects. An important part of this exercise was in the initial requirements development and elicitation phase of the project. With the appropriate requirements development, a technique was developed that enabled the filtering of relevant target objects from non-relevant objects. The technique used is currently being investigated for a patent application and is therefore protected internal IP until it is deemed appropriate for it to be released.
Ultrasonic Sensors
The ultrasonic sensors that have been used for the implementation are standard Bosch UltraSonic Sensors (USS).
A limitation of relying on current USS technology solely, is angular resolution and their overall measurement distance. They also inherently have distances at which they are more sensitive to false detections. This is largely determined by mounting configurations.
Given these limitations, in arbitration it is important to minimise the reliance on USS particularly at higher speeds where a false detection could occur in a region already swept by the radar.
ARBITRATION
In order that the information from the different sensors are utilised in the most opportunistic fashion, sensor data arbitration was implemented. This arbitrates between the information from the Radar including the Radar target tracking algorithm and the ultrasonics to generate the best possible understanding of where objects of interest are behind the vehicle and to inform the actuation algorithms to react accordingly.
By utilising radar technology to observe with better angular resolution, better tracking and better filtering

2014 Excellence Awards, Technical Papers 12
capabilities, it is important to limit the reliability on the USS where possible.
This limitation filter can be seen in figure 4.
Figure 4 - USS intervention limitation curve
ACTIVE BRAKING
Within the Bosch ESP there is an existing Automatic Emergency Braking (AEB) function in the forward facing direction. This function has been then tailored for the rear case. The application of the measured stopping distance for the development vehicle enabled the braking of the vehicle to be optimised. This stopping distance curve was calculated based on experimentation utilising a pressure build from the ESP in a “nominal condition” (dry, flat, bitumen, vehicle loaded with driver plus measurement equipment). This is confirmed with a MATLAB simulation based on the vehicle parameters. Refer to figure 5 for the reverse stopping distance curve. The stopping distance curve will need to be tailored to each vehicle application due to dependencies not only on the vehicle setup but also the brake characteristics, in particular the rear brakes.
Figure 5 - Stopping Distance curve for demonstration vehicle
SYSTEM INTEGRATION
The prototype vehicle has integrated the function through utilising the existing USS with the CAN signals shared through a gateway on the high speed CAN. The MRR CAN signals are shared through a separate gateway also on the high speed CAN. The Arbitration and active braking is implemented on the ESP unit.
SUMMARY / CONCLUSIONS
The testing that has been completed to this point in the project show promising results in the effective reduction of reversing accidents. A major consideration is ensuring the implementation does not result in an excessive number of unwanted interventions that would result in a negative perception of the support function. Through the final stages of development, with the team focussing on the requirements, the implementation of the function looks promising for contributing to the reduction of reversing accidents.
REFERENCES
1. Department of Infrastructure and Transport. (2012, August). http://www.bitre.gov.au/publications/2012/files/is_043a.pdf.
2. Kids and Cars. (2014). Statistics. Retrieved from http://www.kidsandcars.org/statistics.html
ACKNOWLEDGMENTS
I would like to acknowledge financial support of ANMP and Robert Bosch (Australia) Pty Ltd to make this program happen. I would like to acknowledge the support of the project sponsors, Mark Jackman, Carl Liersch and John Nicolopoulos in believing in the project from the start, promoting and supporting it at every opportunity. I would also like to acknowledge the contribution of Andrew Greenbury and Joseph Cavallaro who first demonstrated the concept as part of the new products development group and last but not least the team who have worked tirelessly over the past 18 months implementing, testing, learning and then doing it all again to get the function to where it is today.
2014 Excellence Awards, Technical Papers 13
CONTACT
Mark Anderson Robert Bosch Australia Email: [email protected]
DEFINITIONS / ABBREVIATIONS
AEB Rear: Automatic Emergency Braking Rear
SiGe MMIC: Silicon-Germanium microwave monolithic integrated circuit
FOV: Field Of View - 3 dimensional space in which a sensor or group/s of sensors can identify objects.
MRR Rear: Bosch Mid Range Rear radar
CTA: Cross Traffic Alert. Function for detecting traffic driving across the vehicle path
BSD: Blind Spot Detection. Function for detecting traffic sitting or passing through in the blind spot of the vehicle from the driver’s perspective
USS: Ultra Sonic Sensors
ESP: Electronic Stability Program
AEB: Automated Emergency Braking

2014 Excellence Awards, Technical Papers 14
Gold Award for Heavy Commercial Vehicle
AutoTest Products Pty Ltd,
AutoMonitor: Complete Vehicle Condition Monitoring
Overview While a number of heavy vehicle/driver monitoring devices are available locally and internationally
(Tachographs; GPS tracking systems; vehicle monitoring systems), the AutoMonitor integrates these functions
into a compact digital system. The AutoMonitor also includes a Rollover Prediction system, increasing the
operator safety in addition to the other monitoring and recording functions. AutoMonitor is predictive, with the
ability to determine the mass and Centre of Gravity of the vehicle, and can thereby warn drivers to slow as they
approach the rollover point. The system is likely to be of interest to safety authorities and be of value to fleet
operators, in local and international markets. Judges Synopsis Gold was awarded to AutoTest in the Heavy Commercial Vehicle Category for AutoMonitor, a locally developed
and manufactured product that helps address a safety need in the trucking industry, as well as providing
operational information in one complete package.
2014 Excellence Awards, Technical Papers 15
Rollover Prediction In Dynamic Environment
Muhammad Alamgir AutoTest Products Pty Ltd
ABSTRACT
Given the rising statistics of fatalities and injuries
caused by vehicle rollover accidents, an effective
solution to predict and prevent an impending rollover
is imperative. An accurate rollover prediction method
using multi-dimensional sensor inputs is proposed. A
rollover prediction scale or rollover index function
taking multiple inputs is presented. Several field tests
are carried out to validate the proposed rollover
prediction approach. The findings indicate that the
proposed method is not just effective but also very
practical.
INTRODUCTION
Rollover of automotive vehicles is a growing problem
as the number of vehicles running on roads is
increasing. Whenever a fatal accident occurs, there is
a one in four chance that the vehicle rolled over [1].
In the Northern Territory, one of the states of
Australia, the rollover rate is found to be as high as
over 70% [1]. The rollover rate of heavy vehicles in
Tasmania is found to be 16.3% of all truck crashes
[2]. According to a report from AARB, using the data
from Victorian Crash Database and National
Transport Insurance (NTI) over years 2003–2007,
10% of all truck crashes in Victoria were involved in
rollover [3][4]. While trucks are more likely to roll over
because of their higher centre-of-gravity, studies
have shown a significant number light vehicles have
also been involved in rollover incidents [5] [6]. In fact,
vehicle rollover accounts for 35% of all fatalities in a
single vehicle transport injury event [7]. The rollover
instability is the most significant issue causing
crashes resulting in severe injuries and fatalities [8].
Besides the fatalities and injuries caused by vehicle
rollover, the rollover of vehicles also results in large
repair costs, which according to a report is estimated
to be an average of $33,000 per incident on top of an
average four weeks down time [9]. Many vehicles
these days are equipped with safety related
technologies such as ABS, ESP, and air bags, which
are intended to add stability to the vehicle handling in
order to reduce the number of accidents or injuries.
However, a vast majority of vehicles are lacking
rollover prevention related technologies suggesting a
strong demand for a vehicle rollover prediction based
system that can save both lives and cost.
There are many factors that affect the stability of a
vehicle and ultimately cause it to roll over. Under
typical driving conditions, factors such as over-
speeding around corners, manoeuvres caused during
obstacle avoidance and severe lane changing can
induce lateral acceleration which if it exceeds the
stability threshold value of a vehicle can cause it to
rollover [8]. Over-speeding has been the main cause
of accidents in the majority of rollover cases.
According to an accident investigation report, 59.6%
of speed related truck crashes resulted in rollover
[10]. Similar findings were obtained for the truck
crashes in Tasmania, where 50% of rolled-over trucks
were found to be over-speeding [2]. When a vehicle
is driven around a bend, the lateral acceleration (ay)
exerted on the vehicle is a function of the current
speed of the vehicle v and its turn radius R:
𝑎𝑦 =𝑣2
𝑅 (1)
According to equation (1), the lateral acceleration
increases by the square of the speed. If the speed of
a vehicle is reduced from 60 km/h to 50 km/h, when it
travels around a bend with radius 500m, the lateral
acceleration will be reduced by 30%. Thus, if speeds
are lowered around bends, rollover likelihood is
lowered. Another factor that affects the lateral
acceleration is the yaw rate of the vehicle. The lateral
acceleration can also be described in terms of yaw
rate ψ ̇and the speed of the vehicle (v) as:
𝑎𝑦 = 𝑣�̇� (2)
Once the factors contributing to rollover of a vehicle
are understood, a rollover prediction system could be
designed using the knowledge of the current dynamic
state of the vehicle, the rate at which dynamics are
varying, and the future state when rollover will occur.
A considerable amount of research work has been
undertaken in this field. The traditional techniques
measure the lateral acceleration exerted on the
vehicle and compare it against the rollover stability
factor known as Static Rollover Threshold (SRT) or
Static Stability Factor (SSF) of the vehicle [11]. Since
the lateral acceleration is the only input used to
determine vehicle rollover and the rolling dynamics of

2014 Excellence Awards, Technical Papers 16
the vehicle are not considered, such techniques
suffer from early trigger and late trigger problems.
Other improved techniques consider rolling dynamics
and predict rollover occurrence using additional input
parameters such as roll rate and roll angle [12][13].
Further improved methods use more input
parameters such as yaw rate, yaw angle or steering
angle and vehicle speed to predict rollover with
greater confidence [14][15]. However, many of these
techniques are based on simulation results and not
practical observational findings.
To determine the current rollover state of a vehicle, a
scale known as Rollover Index (RI) is used [16].
Rollover Index indicates the propensity of a vehicle to
become unstable and rollover. There are different
variants of the Rollover Index function, however, the
objective of a rollover index function remains the
same [17][18]. Often Load Transfer Ratio (LTR) is
used as an indicator to determine the stability of the
vehicle rollover system [19][20][21].
The rollover prediction technique described in this
paper is based on a novel approach that observes the
dynamics of vehicle rolling effects using multiple
sensors and predicts impending rollover based on a
real-time rollover index indicator. This paper first
presents a rollover analysis in dynamic situation.
Once the factors involved in the vehicle rollover are
highlighted, a rollover indicator function is described.
The performance of the algorithm is later verified with
field test results.
ROLLOVER ANALYSIS
Rollover dynamics incorporate lateral force exerted
by an external system, the rotational forces due to the
rolling moment of the sprung mass, the road bank
angle, and the damping forces of the suspension
system and tires. Figure 6 illustrates a generic
rollover model. When the vehicle rollover system is at
equilibrium, the tire forces F1 and F2 are equal.
To describe the model in figure 6 in a dynamic rollover
situation, we need to consider the moment forces
acting on the system at the time of cornering
manoeuvre [16].
(𝐼𝑥𝑥 + 𝑚ℎ𝑟2)�̈� = ∑ 𝑀𝑥 (3)
(𝐼𝑥𝑥 + 𝑚ℎ𝑟2)�̈� = 𝐹𝑦ℎ𝑟 cos 𝜙 + 𝑚𝑔ℎ𝑟 sin 𝜙
+𝑇𝑠
2(𝐹𝑠1 − 𝐹𝑠2) (4)
Figure 2. Rollover moment forces.
The term (𝐹𝑠1 − 𝐹𝑠2) can be expressed in terms of the
forces acting in the suspension system:
𝐹𝑠1 − 𝐹𝑠2 = −𝑘𝑠𝑇𝑠 sin 𝜙 − 𝑏𝑠�̇� cos 𝜙 (5)
By substituting (5) into (4), the moment equation can
be described as:
(𝐼𝑥𝑥 + 𝑚ℎ𝑟2)�̈� = 𝐹𝑦ℎ𝑟 cos 𝜙 + 𝑚𝑔ℎ𝑟 sin 𝜙
−𝑇𝑠
2𝑘𝑠 sin 𝜙
2−
𝑇𝑠2𝑏𝑠�̇� cos 𝜙
2 (6)
(𝐼𝑥𝑥 + 𝑚ℎ𝑟2)�̈� = 𝑚𝑎𝑦ℎ𝑟 cos 𝜙 + 𝑚𝑔ℎ𝑟 sin 𝜙
−𝑇𝑠
2
2(𝑘𝑠 sin 𝜙 + 𝑏𝑠�̇� cos 𝜙) (7)
When considering the effects of road bank angle, the observed lateral force exerted on the vehicle is given as [22]:
𝐹𝑙𝑎𝑡 = 𝑚(�̈� + 𝑣𝑥�̇� − 𝑔 sin 𝜃𝑟) (8)
Where, �̈� is the lateral acceleration, vx is the speed of
the vehicle, ψ ̇
angle. If the rollover effects are observed using an
accelerometer mounted on the chassis, the observed
lateral acceleration in terms of the road angle is
described as:
𝑎𝑚𝑒𝑎𝑠 = �̈� + 𝑣𝑥�̇� − 𝑔 sin 𝜃𝑟 (9)
If equation (9) is substituted in (7), the moment equation will then be formed in terms of road angle as:
(𝐼𝑥𝑥 + 𝑚ℎ𝑟2)�̈� = 𝑚𝑎𝑚𝑒𝑎𝑠ℎ𝑟 cos 𝜙
+ 𝑚𝑔ℎ𝑟 sin(𝜙 − 𝜃𝑟)
−𝑇𝑠
2
2(𝑘𝑠 sin 𝜙 + 𝑏𝑠�̇� cos 𝜙) (10)
hcg
T
H
hbase
Fy
W
Fnet
F2 F1
hr
r
c.r.
c.g.

2014 Excellence Awards, Technical Papers 17
Equation (10) can be used to directly determine the stability of a vehicle’s rollover dynamics. Using a tri-axial accelerometer and a tri-axial gyroscope, many of the parameters of the rollover moment equation can be obtained. However, the absolute values of an accelerometer cannot be used due to the tilting of the vehicle and the road bank angle. The absolute acceleration vector will have to be projected onto the linear plane of earth’s gravity, which requires the information of current tilt angles of the vehicle. First of all, the tilt or rotation angles need to be calculated by integrating the instantaneous readings of the gyroscope.
𝜃 = ∫ �̇� 𝑑𝑡 (11)
𝜙 = ∫ �̇� 𝑑𝑡 (12)
It is challenging to estimate the rotational angles by integrating the measurements of the gyroscope because of the drift error associated in gyroscope sensor readings when integrating over long periods. A hybrid technique is used in which readings from the accelerometer are used as feedback to determine rotational angles with a sufficient degree of accuracy. Once the orientation angles of the vehicle are estimated, the net acceleration vector relative to the earth’s gravity plane can be calculated using the Euler’s angle method [23]:
𝑎𝑥 = 𝐴𝑥 cos(𝜃) − 𝐴𝑧 sin(𝜃) (13)
𝑎𝑦 = 𝐴𝑦 sin(𝜃)sin(𝜙) + 𝐴𝑦 cos(𝜙) + 𝐴𝑧 cos(𝜃) sin (𝜙)
(14)
𝑎𝑧 = 𝐴𝑥 sin(𝜃) cos (𝜙) − 𝐴𝑦 sin(𝜙) + 𝐴𝑧 cos(𝜃)cos (𝜙)
(15)
Where, Ax, Ay, and Az are absolute acceleration
readings from an accelerometer, and are pitch and roll angles, respectively.
ROLLOVER INDICATOR
The rollover stability of a vehicle can be indicated by rollover index scale. The rollover index scale is usually described as the lateral load transfer ratio (LTR), which is expressed as:
𝑅𝐼 = 𝐿𝑇𝑅 =𝐹2−𝐹1
𝐹2+𝐹1 (16)
When the tire forces F2 and F1 are equal, the overall load transfer ratio becomes zero and the rollover system is considered stable. But when the LTR approaches 1 or -1, the vehicle rollover state becomes unstable and ultimately one of the side tires
is lifted up, which causes the vehicle to rollover on the opposite site.
The load-transfer ratio (LTR) cannot be computed in real-time because the tire forces F1 and F2 are not easily measured externally. However, the LTR can be estimated using the following equation [22]:
𝐿𝑇𝑅 =𝐹2−𝐹1
𝐹2+𝐹1=
𝑘𝑠𝑇𝑠 sin 𝜙+𝑏𝑠𝑇𝑠�̇� cos 𝜙
𝑚𝑔 (17)
The above LTR expression requires the information of the vehicle’s suspension system. However, the suspension system related coefficients can be eliminated by rearranging (10) and then substituting it into (17) [24].
𝑘𝑠𝑇𝑠 sin 𝜙 + 𝑏𝑠𝑇𝑠�̇� cos 𝜙 =2𝑚ℎ𝑟
𝑇𝑠[𝑎𝑚𝑒𝑎𝑠 cos 𝜙 +
𝑔 sin(𝜙 − 𝜃𝑟)] (18)
The rollover index can now be expressed in terms of vehicle dimensions, lateral acceleration and orientation angles, as:
𝑅𝐼 = 𝐿𝑇𝑅 =2ℎ𝑟𝑎𝑚𝑒𝑎𝑠 cos 𝜙+2𝑔ℎ𝑟 sin(𝜙−𝜃𝑟)
𝑇𝑠𝑔 (19)
=2ℎ𝑟
𝑇𝑠𝑔(𝑎𝑚𝑒𝑎𝑠 cos 𝜙 + 𝑔 sin(𝜙 − 𝜃𝑟)) (20)
The road bank angle can be estimated in a steady state condition using equation (9):
sin 𝜃𝑟 =𝑣𝑥�̇�−𝑎𝑚𝑒𝑎𝑠
𝑔 (21)
The road bank angle r is thus estimated from the speed of the vehicle, its yaw rate and the measured lateral acceleration:
𝜃𝑟 = sin−1 (𝑣𝑥�̇�−𝑎𝑚𝑒𝑎𝑠
𝑔) (22)
A general expression of the rollover index function in terms of multiple inputs can be given as:
𝑅𝐼 = 𝑓(𝑎𝑦 , 𝜙, 𝜃𝑟 , ℎ𝑟 , 𝑇𝑠) (23)
=2ℎ𝑟
𝑇𝑠𝑔(𝑎𝑦 cos 𝜙 + 𝑔 sin(𝜙 − 𝜃𝑟)) (24)
ROLLOVER PREDICTION SCHEME
The rollover prediction scheme determines the rollover index value (RI) at the instant when a vehicle becomes unstable and rollover is imminent. When the rollover system becomes unstable, one of the wheels

2014 Excellence Awards, Technical Papers 18
of the vehicle is lifted up in the air. At the instant of wheel lift-off, the load transfer ratio is either above +1 or below -1. Hence, the rollover index, when vehicle becomes unstable, can be described as:
2ℎ𝑟
𝑇𝑠𝑔(𝑎 𝑚𝑒𝑎𝑠 cos 𝜙 + 𝑔 sin(𝜙 − 𝜃𝑟)) ≥ 1 − 𝜇 (25)
Where, µ is a safety margin used to account for unconsidered material properties of tires and chassis system. After rearranging (25), the maximum lateral acceleration sustainable by the vehicle could be expressed as:
𝑎𝑦,𝑚𝑎𝑥 ≥ (1 − 𝜇)𝑇𝑠𝑔
2ℎ𝑟 cos 𝜙−
𝑔 sin(𝜙−𝜃𝑟)
cos 𝜙 (26)
If the dynamic effects of vehicle rollover are not considered, the rollover, the maximum lateral acceleration sustainable by the vehicle can be simply given as [16][24]:
𝑆𝑅𝑇 =𝑎𝑦,𝑚𝑎𝑥
𝑔=
𝑇
2ℎ𝑐𝑔− 𝜑 (27)
Where, SRT is the Static Rollover Threshold (SRT) or Static Stability Factor (SSF) of the vehicle, and 𝜑 is the collection of other factors affecting rollover stability of a vehicle such as suspension system, tires, and chassis properties. According to the National Heavy Vehicle Regulator (NHVR), the minimum Static Rollover Threshold (SRT) limit of a vehicle holding dangerous goods is 0.40 g, while any other vehicle has this minimum limit set to 0.35 g [8], thus the maximum lateral acceleration has to be greater than the SRT limit
𝑎𝑦,𝑚𝑎𝑥 ≥𝑆𝑅𝑇𝑙𝑖𝑚𝑖𝑡
𝑔≥ (1 − 𝜇)
𝑇𝑠𝑔
2ℎ𝑟 cos 𝜙−
𝑔 sin(𝜙−𝜃𝑟)
cos 𝜙 (28)
To make the rollover prediction system more redundant, other input parameters such as vehicle speed and yaw rate could also be used to predict an impending rollover, since the lateral acceleration could also be described these parameters as:
𝑎𝑦 = 𝑣𝑥�̇� − 𝑔 sin 𝜃𝑟 (29)
Thus, the maximum vehicle speed and the maximum yaw rate can be described as:
𝑣𝑥�̇�𝑚𝑎𝑥 ≥ 𝑎𝑦,𝑚𝑎𝑥 + 𝑔 sin 𝜃𝑟 (30)
An early rollover warning system can have multiple warning levels, where different RI threshold levels can be defined for each type of alert.
Table 1 - Rollover alert threshold levels
Time-to-Rollover (TTR) technique has been used in the past [25][26], which determines the likelihood of rollover by predicting the time remaining in rollover based on the present trend of the
vehicle motion. In order to predict an impending rollover, the current rate of change of rollover index is averaged over the past one second. The average rate of change of the rollover index is
used to extrapolate rollover index data and predict the future
rollover index at time t+ .
𝑅𝐼𝑡+𝜏 = 𝑅𝐼𝑡 + Δ𝑅𝐼𝑎𝑣𝑔 × 𝜏 (31)
The rollover index (RI) can be predicted at 0.5 second
ahead of time by substituting =0.5 into (32).
𝑅𝐼𝑡+0.5𝑠 = 𝑅𝐼𝑡 + Δ𝑅𝐼𝑎𝑣𝑔 × 0.5𝑠 (32)
The time to rollover (roll) can thus be determined by rearranging equation (31):
𝑇𝑇𝑅 = 𝜏𝑟𝑜𝑙𝑙 =𝑅𝐼𝑚𝑎𝑥−𝑅𝐼𝑡
Δ𝑅𝐼𝑎𝑣𝑔 (33)
Where, RImax is the rollover index when vehicle becomes unstable, RIt is the current rollover index, and Δ𝑅𝐼𝑎𝑣𝑔 is the average rate of change of rollover
index over the past one second.
PREDICTION SYSTEM VERIFICATION
In order to verify the accuracy of the rollover prediction system, several test drives were performed at different driving manoeuvres. A rollover sensor module was constructed and mounted on a car. The sensor module consisted of a tri-axial accelerometer and a tri-axial gyroscope. The speed of the vehicle was taken from a vehicle module. Additionally, a GPS device was also mounted on the vehicle to obtain track log of the vehicle’s movement.
The first test was carried out at a freeway entrance, which had the shape of a long U (Figure 3). The vehicle was travelling fast at about 40 km/h when it entered the long U-turn. The rollover system detected an impending rollover event and it raised a warning alert. The speed was then gradually slowed down to keep the vehicle stable and in control.
Alarm type Typical threshold level
Warning Alert RIwarn = RImax * 0.40
Critical Alert RIcrit = RImax * 0.60

2014 Excellence Awards, Technical Papers 19
Figure 3. Test 1 – vehicle drive path.
Figure 4. Test 1 - vehicle speed and lateral acceleration.
Figure 5. Test 1 - results showing vehicle's roll angle and roll rate.
Figure 6. Test 1 - rollover index and predicted dynamic state.
A second test was done at a round-about, making a 270-degree turn. The approaching speed of the vehicle was quite high at 35 km/h. The vehicle had to be slowed down to keep it under control.
Figure 7. Test 2 - vehicle speed and lateral acceleration.
Figure 8. Test 2 - roll angle and roll rate.
0 1 2 3 4 5 6 725
30
35
40
45Vehicle Speed (Vx)
Speed (
kph)
0 1 2 3 4 5 6 7-0.2
0
0.2
0.4
0.6Lateral Acceleration (ay)
Accele
ration (
g)
time (s)
0 1 2 3 4 5 6 7-2
0
2
4
6Roll angle
Angle
(deg)
0 1 2 3 4 5 6 7-100
-50
0
50Rotation rate
Rota
tion r
ate
(d/s
)
time (s)
roll rate yaw rate
0 1 2 3 4 5 6 7-0.1
0
0.1
0.2
0.3
0.4
0.5
0.6
0.7
0.8
0.9
Rollo
ver
Index
time (s)
Rollover Index (RI)
critical
actual
predicted
alert
0 2 4 6 8 10 12 1420
25
30
35Vehicle Speed (Vx)
Speed (
kph)
0 2 4 6 8 10 12 14-0.5
0
0.5
1Lateral Acceleration (ay)
Accele
ration (
g)
time (s)
0 2 4 6 8 10 12 14-2
0
2
4
6Roll angle
Angle
(deg)
0 2 4 6 8 10 12 14-100
-50
0
50Rotation rate
Rota
tion r
ate
(d/s
)
time (s)
roll rate
yaw rate

2014 Excellence Awards, Technical Papers 20
Figure 9. Test 2 - rollover index and predicted dynamic state.
CONCLUSION
The rollover prediction techniques described here considered multiple parameters, which relate to the dynamics of the vehicle, to accurately predict an impending rollover situation. Once an impending rollover event is accurately predicted, the rollover occurrence can potentially be prevented by means of alerting the driver of the rollover risk as indicated in this paper; or by activating a control prevention system, which includes active braking [27][28] for controlling vehicle speed, active steering for controlling yaw rate [29], anti-roll bar [30], and active suspension system [31][32]. The results from the field test conform the validity of the proposed prediction system, where the predicted rollover index at 0.5 second ahead of time was close to the actual rollover index. The techniques described here have already been implemented in the AutoMonitor product manufactured by AutoTest Products Pty Ltd.
REFERENCES
1. Grzebieta et al., “Rollover crashworthiness : The final frontier for vehicle passive safety,” Proc. Australasian Road Safety Research Policing and Education Conference, 2007.
2. John de Pont, “An Assessment of Heavy Truck Safety in Tasmania,” TERNZ, 2005.
3. K. Imberger, T. Styles, and K. Walsh, “Victorian Truck Rollover Crashes (2003-2007),” 2009 Australasian Road Safety Research, ARRB Group, Sydney - NSW: 706–713, 2009.
4. Rechnitzer, G., Monash University., Accident Research Centre., Victoria Police., “Police vehicles : rollover stability analysis (phase 1 project),” Monash University Accident Research
Centre, Victoria (Australia), ISBN 073261483X 9780732614836, 2002.
5. S. A. Richardson, G. Rechnitzer, and R. H. Grzebieta, “A methodology for estimating vehicle rollover propensity that combines stability factor and handling metrics,” Monash Univ. Accid. Res. Cent.
6. Keall, M.D., Newstead, Stuart, “Are SUVs dangerous vehicles?,” Accid. Anal. Prev. Accid. Anal. Prev. 40(3):954–963, 2008.
7. Frechede B, M.A., Grzebieta R, Bambach MR, “Characteristics of single vehicle rollover fatalities in three Australian states (2000-2007).,” Accid. Anal. Prev. 43(3):804–12, 2011.
8. PBS Scheme - The Standards and Vehicle Assessment Rules, 2008.
9. Tipper trucks and trailers, WorkCover ACT Government, 2007.
10. Driscoll, O., “2013 Major Accident Investigation Report,” National Transport Insurance.
11. Rothhamel, M., Ijkema, J., Drugge, L., “Influencing driver chosen cornering speed by means of modified steering feel,” Veh. Syst. Dyn. 52(4):522–538, 2014.
12. Dahmani, H., Chadli, M., Rabhi, A., El Hajjaji, A., “Vehicle dynamic estimation with road bank angle consideration for rollover detection: theoretical and experimental studies,” Veh. Syst. Dyn. Veh. Syst. Dyn. 51(12):1853–1871, 2013.
13. Dahmani, H., Chadli, M., Rabhi, A., and El-Hajjaji, A., “Fuzzy observer for detection of impending vehicle rollover with road bank angle considerations,” Control & Automation (MED), 2010 18th Mediterranean Conference on, 1497–1502, 2010, doi:10.1109/MED.2010.5547838.
14. Yoon, J., Kim, Dongshin, Yi, Kyongsu, “Design of a rollover index-based vehicle stability control scheme,” Veh. Syst. Dyn. 45(5):459–475, 2007.
15. Trent, V., Greene, M., “A Genetic Algorithm Predictor for Vehicular Rollover,” IECON -Proc.- 3:1752–1756, 2002.
16. Winkler, C.B., “Rollover of heavy commercial vehicles,” Society of Automotive Engineers, Warrendale, Pa., ISBN 0768006260 9780768006261, 2000.
0 2 4 6 8 10 12 14-0.2
0
0.2
0.4
0.6
0.8
1
1.2
Rollo
ver
Index
time (s)
Rollover Index (RI)
critical
actual
predicted
alert

2014 Excellence Awards, Technical Papers 21
17. A., Brown, T., Martens, J., Hac, “2004-01-1757 Detection of Vehicle Rollover,” SAE SP (1869):153–161, 2004.
18. Chou, T., Chu, Tzyy-Wen, “An improvement in rollover detection of articulated vehicles using the grey system theory,” Veh. Syst. Dyn. 52(5):679–703, 2014.
19. Larish C., P.D., Tsourapas V., Rajamani R., “A new predictive lateral load transfer ratio for rollover prevention systems,” IEEE Trans Veh Technol IEEE Trans. Veh. Technol. 62(7):2928–2936, 2013.
20. Zhu Tianjun and Zong Changfu, “Research on Rollover Early Warning Algorithm for Heavy Tractor- Semitrailer Based on PTR Metric,” Intelligent Systems and Applications, 2009. ISA 2009. International Workshop on, 1–4, 2009, doi:10.1109/IWISA.2009.5073081.
21. Imine, H., Benallegue, A., Madani, T., and Srairi, S., “Rollover risk prediction of an instrumented heavy vehicle using high order sliding mode observer,” Robotics and Automation, 2009. ICRA ’09. IEEE International Conference on, ISBN 1050-4729: 64–69, 2009, doi:10.1109/ROBOT.2009.5152185.
22. Rajesh Rajamani, “Vehicle Dynamics and Control,” Springer-Verlag New York Inc., New York, NY, 2012.
23. E. J. Wallner and J. K. Schiffmann, “Automotive Rollover Sensing,” Advanced microsystems for automotive applications 2000, Springer, Berlin; New York, ISBN 3540670874 9783540670872: 205–217, 2000.
24. Rajamani, R., “Roll Dynamics and Rollover Prevention,” Vehicle dynamics and control, 427–456, 2012.
25. Yu, H., Guvenc, L., Ozguner, U., “Heavy duty vehicle rollover detection and active roll control,” Veh. Syst. Dyn. 46(6):451–470, 2008.
26. Wang Jian, Yu Guizhen, Li Zhenhua, Zhang Wei, and Ding Nenggen, “Real-time roll state estimation and rollover prediction for light SUVs,” Mechatronics and Automation, 2009. ICMA 2009. International Conference on, 4387–4392, 2009, doi:10.1109/ICMA.2009.5246635.
27. Bo-Chiuan Chen and Huei Peng, “Differential-Braking-Based Rollover Prevention for Sport Utility Vehicles with Human-in-the-loop Evaluations,” Veh. Syst. Dyn. 36:359–389, 2001.
28. Gaspar, P., Szabo, Z., and Bokor, J., “Prediction Based Combined Control to Prevent the Rollover of Heavy Vehicles,” Intelligent Control, 2005. Proceedings of the 2005 IEEE International Symposium on, Mediterrean Conference on Control and Automation, ISBN 2158-9860: 575–580, 2005, doi:10.1109/.2005.1467078.
29. Mammar, S. and Koenig, D., “Vehicle Handling Improvement by Active Steering,” Veh. Syst. Dyn. 38(3):211–242, 2002, doi:10.1076/vesd.38.3.211.8288.
30. Cronje, P.H., Els, P.S., “Improving off-road vehicle handling using an active anti-roll bar,” J. Terramechanics 47(3):179–189, 2010.
31. Shim, T., Velusamy, Pradheep C., “Improvement of vehicle roll stability by varying suspension properties,” Veh. Syst. Dyn. 49(1-2):129–152, 2011.
32. Westhuizen, S.F., Els, Pieter S., van der, “Slow active suspension control for rollover prevention,” TER J. Terramechanics 50(1):29–36, 2013.
CONTACT
Muhammad Alamgir AutoTest Products Pty Ltd Phone: +61 3 9647 9797 Email: [email protected]
DEFINITIONS
: pitch angle
: roll angle
r: road bank angle
roll: time left in rollover
ameas: measured lateral acceleration
ay: lateral acceleration
c.g.: centre of gravity
c.r.: centre of roll
Fnet: net force
Fy: externally exerted lateral force
H: maximum height of the vehicle
hbase: load base height
hcg: current centre of gravity height
hr: roll height (hcg – hbase)
m: vehicle mass

2014 Excellence Awards, Technical Papers 22
Mx: external rolling moments
R: turn radius
T: track width
Ts: suspension track width
TTR: time-to-rollover
v, vx: longitudinal vehicle speed
W: gravitational weight force

2014 Excellence Awards, Technical Papers 23
Gold Award for Manufacturing
AutoCRC Ltd, Victorian Partnership for Advanced Computing, Malaysia Automotive Institute,
vMould – Rapid Plastic Injection Mould Design Optimisation
Overview Mass reduction is directly linked to vehicle efficiency and performance improvement. Injection-moulded plastic
parts represent a significant proportion of the mass and cost of a modern vehicle. Manufacturers are looking
to automation to reduce costs, and whilst the majority of associated processes have been automated, an
exception is the challenging area of mould design and production. The Victorian Partnership for Advanced
Computing, in collaboration with the AutoCRC, the Malaysian Automotive Institute, Sipro Plastics and Dolphin
Products have developed a user-friendly software package, vMould, to automate the mould design and
production process. The collaboration resulted in the vMould Package which has global application in improving
component quality and reducing cycle times, thus reducing the mass and costs of plastic components.
Judges Synopsis vMould software received the Gold award in the Manufacturing Category for the innovative use of knowledge
from specialist tool makers, the application of flow analysis and the focus to reduce manufacturing time and
cost, to create a useful and accessible tool for industry.

2014 Excellence Awards, Technical Papers 24
vMould – Rapid Plastic Injection Mould Design Optimisation
Jarrod Sinclair VPAC Innovations
ABSTRACT
vMould is a new software approach to plastic injection mould design optimisation that directly supports the engineer with critical design directions pertinent to the best practices and workflows already used in industry. It includes six main features that cover CAD quality assessment, draw direction identification, the ideal location for a single gate, locations for air vents to ensure quality filling, the shape of the cavity required to compensate for warpage and shrinkage, and finally identification of hot spots required for cooling design. The software is delivered using the cloud as a web-based application that abstracts away the complexities of numerical computations used by each optimisation feature. This approach lowers the total cost of operation by industry, including associated software, hardware and staff training.
A multidisciplinary team of computational analysis engineers and software developers conducted almost two years of research and development to produce vMould. This included close collaboration with industry leading plastic injection mould manufacturers. The collaboration was critical in identifying actual business and engineering processes used to form the optimal mould required for start of production. vMould was designed to directly support these industry processes without dictating yet another software workflow.
As a result, vMould has proved to be quick to adopt, easy to operate, and effective in improving the quality and lowering the time to market of plastic injection moulds. The software delivers productivity gains by automating the baseline business processes of mould design, and frees up time for the engineer to focus on driving innovation in the organisation.
INTRODUCTION
The manufacture of plastic injection moulded parts is
a key process in vehicle production. Some plastic
parts include door panels and handles, interior
components, instrument panels, bull bars,
powertrain components and many more. Plastic is
chosen for these parts as it is relatively inexpensive,
provides structural efficiency, and can take almost
any shape defined by the vehicle styling and
functional design requirements.
The plastic injection mould manufacturing process
involves a significant amount of expertise to ensure
consistently high quality parts are produced at cost
competitive rates. The ideal mould and machine
setup is a large investment in both time and cost.
Typically, prior experience of the manufacturer and
toolmaker drives the efficiency of this setup stage.
To gain greater competitiveness, additional
technologies are required to assist the engineers
throughout the design and production process.
Software known as Computer Aided Engineering
(CAE) can be used, however the impact on the
overall business efficiency needs to be studied in
order for improvements to be made.
This work focuses on the use of CAE in the design
of plastic injection moulds, particularly for the key
decision making steps early in the engineer’s
workflow. A new software suite known as vMould is
presented, that provides a novel approach to direct
optimisation of the key design steps. The software is
developed as a web application that can be easily
deployed and exploited for efficiency gains in the
plastic injection mould design process.
Objectives and Outline
This work was split into three main stages:
1. Research best practices for mould design at
Australian and Malaysian plastics manufacturers
and toolmakers, focusing on the daily use of CAE
tools to improve business efficiency.
2. Develop new CAE methods to address gaps in
current workflows in industry.
3. Implement, deploy and test the CAE methods to
industry partners.
This paper will present the main highlights and
developments of these three stages, providing
industry examples where appropriate.

2014 Excellence Awards, Technical Papers 25
RESEARCH FINDINGS
Consultation and collaboration with industry partners
has elucidated that there are approximately twelve
key decision points in the design of a plastic injection
mould suitable for mass production. These are
typically conducted sequentially, and include:
1. Determination of the best draw direction and
therefore the part orientation in the mould
(sometimes mistakenly viewed as locked in by
the product designer, and not the mould
designer).
2. Identification of manufacturing enablers such as
slides required to ensure the part can be
produced using a two-piece core and cavity
setup.
3. Incorporation of robust draft angles to prevent
material failure during part ejection.
4. Determination of the injection point for the plastic
melt to flow through a gate into the mould volume.
5. Determination of air vent locations to ensure melt
flow without air pockets and other quality
degradations.
6. Identification of hot spots in the tool and design of
liquid cooling channels to reduce the hot regions.
7. Allowance for shrinkage and warpage of the
plastic part during the cooling phase, using
standard shrinkage rates and trial-and-error with
physical tests.
8. Build complete tool structure and mechanisms in
CAD.
9. Select best tool material based on production
volumes and loads (such as injection pressures
and clamp forces).
10. Fabricate the mould using CNC or other
processes, apply material treatments (such as
heat treatment) and assemble for testing.
11. Commence physical testing (known as mould
trials), adjusting process parameters and
modifying the mould design were available.
12. Conduct detailed 3-dimensional CAE analysis to
help fix any issues that are not easily understood
with the physical testing. Fixes at this stage
require re-fabrication of the mould once
improvements have been made.
It can be seen from the sequence of decision points
above that industry does not generally employ CAE
throughout the design process. Rather, detailed CAE
analysis is initiated once a mould has been fabricated
and there is need to fix issues and improve the
design. Furthermore, it is common practice in industry
to use a “guess and iterate” method when deciding on
the design direction throughout the twelve steps,
sometimes employing detailed CAE either in-house
or with third-parties if it is suspected that issues may
arise. This adoption model of CAE by industry is
costly and inefficient.
We conclude that newer CAE methods are required
to directly assist the engineer in making informed
decisions during the twelve steps, in order to reduce
issues with the mould design that are experienced
downstream in the process. Less rework of the
mould, and ultimately no re-fabrication before the
start of production, will lead to greater productivity
and efficiencies of the entire business. Therefore,
CAE needs to closely match the best-practices used
by industry and not formulate a new workflow.
The goal for vMould is to provide a rapid and easy to
use series of software tools that can propose ideal
solutions for each step, so that the design engineer
can integrate the solutions along with their expertise
to develop the optimal mould faster than if they used
only their expertise. In this way vMould can be used
as either a confirmation step or an idea generator
depending on the degree of mastery of the toolmaker
KEY FEATURES
Six main features were developed to address the
shortcomings of current CAE tools used by industry
for plastic injection mould design optimisation. The
rationale, algorithm and user experience for each
feature is described below.
Part and Mould Geometry
CAD is the central software tool for all aspects of
engineering design of plastic injection moulds and
parts. Specifically it includes:
The plastic part is defined in CAD by the client
wanting the plastic parts, or in-house in
consultation with the automotive company.

2014 Excellence Awards, Technical Papers 26
The shape of the mould is created in CAD from
the geometry of the plastic part and other
engineering inputs, such as draw direction.
The tool design and mechanisms are designed
and mocked up in CAD, and generally CNC
machined during fabrication.
Figure 14: CAD Quality assessment feature
However there are many CAD applications and file
formats. Therefore, vMould uses the neutral STL
format as it is highly portable and compatible with all
CAD software. STL is a surface triangulation of the
CAD geometry, rather than a mathematical function
such as NURBS. Files need to be refined in areas of
high curvature in order to discretise the shape whilst
still capturing the surface smoothness. vMould
includes quality checks to ensure that the STL file is
appropriate for use during the optimisation steps.
Figure 14 shows the web interface for the CAD
Quality assessment tool using a representative
plastic part from industry. The checks include
identifying error regions for:
1. Water-tightness (free edges).
2. Degenerate surfaces (t-junctions).
3. Self-intersections (generally formed from
insufficient refinement in areas of high curvature).
Identification of STL errors is typically symptomatic of
fundamental CAD issues, and serves as a good guide
for general CAD quality. Issues that are identified by
vMould can be corrected in CAD and re-analysed to
ensure correctness. Once the part contains no STL
errors, the optimisation processes below can
commence.
Draw Direction Optimisation
The first decision point in mould design at industry is
determining the orientation of the part within the
mould. This may seem like an obvious process,
however it is a critical decision that could lead to
significant rework and additional costs if a non-
optimal orientation is chosen. Furthermore, designers
of plastic automotive parts may specify their chosen
orientation, but this critical business decision should
be not be outsourced, and must be completely
controlled by the plastic injection mould
manufacturer.
Figure 15: Draw Direction algorithm
Draw direction provides the split plane of both sides
of the two-piece mould, and the extraction vector
when the part is ejected after filling, cooling and
packing. The optimal draw direction is given by the
orientation that reduces the amount of manufacturing
enablers such as slides and other actuators, and
preserves the surface finish quality requirement.
Typically, experience with similar parts guides the
decision in industry, however this becomes difficult for
unique and complex plastic parts. vMould provides a
more quantitative method to arrive at the most optimal
draw direction that takes into account the 3D part
geometry and key features such as ribs, walls and
holes.
A bi-directional shadow analysis was developed
using computational visualization techniques

2014 Excellence Awards, Technical Papers 27
including ray casting and occlusion detection, as
shown in Figure 15. The main process includes:
1. Select a part orientation vector.
2. Compute the lit portions of the surfaces in the
draw direction using ray casting.
3. Compute the lit portions of the surfaces in the
opposite draw direction.
4. Boolean the two fields in order to classify the
base, draw and slide portions of the surface.
5. Compute the surface area of each classified
portions.
6. Iterate for all orientation vectors in order to find
the minimal slide surface area.
Figure 16: Draw Direction feature
The algorithm implemented into vMould is shown in
Figure 16 for an automotive door handle part. It can
be seen that the user simply uploads the part
geometry (as an STL file) and runs the draw direction
optimisation using the default settings in this case.
The computations are run in the background on cloud
servers, and the user can monitor the progress via the
web interface. Once the optimal solution has been
found, the results are presented to the user visually,
and the relevant CAD files can be downloaded and
used in any CAD tool for further processing.
Numerical optimisations were developed in the draw
direction tool to intelligently reduce the amount of
orientations processed using a multilevel grid
refinement algorithm, leading to a total run time of a
few minutes.
Gate Locator
In mass production of plastic parts, it is desirable to
inject the plastic melt into the mould cavity and fill the
volume completely in the shortest period of time
whilst ensuring a quality resulting plastic part. A naïve
solution would suggest that numerous injection
locations would be beneficial to achieve the best
outcome, however seam lines and other quality
defects are introduced when more than one location
is used in production environments. Therefore,
industry typically limits the number of locations to only
one gate, and its placement is critical to achieve
desired production rates.
For vMould, an idealized gate locator was developed
to assist the design engineer in this vital decision. The
method was based on a recursive graph
decomposition. The process included:
1. Discretize the volume of the mould cavity into
voxels at a given resolution
2. Arrange the voxels based on their network
connectivity
3. Split into two equally weighted groups, determine
centroid location
4. Repeat with successively refined voxels until
convergence in centroid location value
Figure 17: Gate Locator feature
The resulting implementation is shown in Figure 17.
Whilst there is no graphical representation of the gate
location within the web interface, the user can easily
import the resulting coordinate into CAD in order to
continue mocking up the overall tool design.
Air Vents Locator

2014 Excellence Awards, Technical Papers 28
Before the plastic melt is injected into the cavity of the
mould, the pieces of the tool are clamped together to
form a watertight seal. This is done with enough force
to resist injection pressures that can prematurely
open the mould during filling. To ensure conservation
of mass during this filling stage, venting locations are
required for air to gather and escape. In the right
positions, the air vents ensure the plastic is filled with
high quality due to minimal trapped air pockets and
other fouling sites.
An experienced plastic injection engineer will have a
good understanding of the main locations for air vents
given the cavity geometry and injection gate location.
However, for complex and non-standard plastic parts,
or to gain further production efficiency from increased
injection speeds, it can be difficult to predict all of the
ideal air vent locations based purely on prior
experience. This is because the flow of melt during
filling is highly non-linear, transient and three-
dimensional in space.
A rapid air vent locations advisor was developed for
vMould that takes into account the non-linear fluid
dynamics process of melt filling and indicates the
ideal locations for vents on the surface of the mould
geometry. The process involves:
1. Discretise the cavity volume into a three-
dimensional mesh suitable for CFD.
2. Define the gate location on the surface of the
mould geometry (can be specified from the Gate
Locator tool discussed previously).
3. Implement a pseudo-outlet boundary condition at
all wall boundaries of the cavity domain
(excluding the inlet gate).
4. Compute the advancing front of the melt filling
process with a multiphase finite volume model.
5. Rank the localized outflow rates and isolate key
air vent locations.
Figure 18: Air Vents Locator feature
Figure 19: Suggested locations for air vents on an automotive door handle
Figure 18 shows the implemented air vents locator
feature, and Figure 19 shows the locations of air vents
on a 3D part. It be seen that the tool predicts air vent
locations as required at the end of enclosed volumes,
which allow air to flow out of the cavity in order for
plastic melt to properly fill the domain.
Cavity Shape Optimisation
One of the most challenging mould design steps is
compensating for the correct amount of shrinkage
that occurs when the plastic melt solidifies during and
after injection to form the final plastic part. Typically,
uniform volume percentage shrinkage rates are used
from best practices of the material and the part type.
However, these spatially uniform values are not
appropriate for increasingly more three-dimensional
and unique plastic automotive parts.

2014 Excellence Awards, Technical Papers 29
Figure 20: Cavity Shape algorithm
Figure 21: Warpage of the converged cavity shape compared to the desired part geometry
An iterative solution method was developed for
vMould that helps predict the ideal cavity shape
accounting for non-uniform thermal warpage during
the solidification process. A three-dimensional
thermal/structural model was created of the original
mould cavity shape, and subjected to the thermal
loads imposed due to polymer phase change. Given
the deflection response of the material, a second
candidate cavity shape was created to compensate
for this deflection in order for the final warpage to
more closely align with the desired part geometry.
The process is continued until the final post-deflection
shape closely matches the desired part. This is
shown in Figure 20 for the automotive door handle,
where the colours represent various iteration steps in
the optimisation process. Figure 21 shows the
deformation of the final cavity shape in red, and that
it closely matches the required part geometry in white.
Cooling Design
Hot spots exist at various locations throughout the
material of the tool due to the high temperature of the
plastic melt required for flow in the filling stage. During
and after this stage, heat is transferred via conduction
to the mould itself and needs to be dissipated in order
to promote proper solidification of the plastic part.
Typically, cooling channels of flowing water are used
to transport this heat energy out of the system.
However, it is a design challenge to determine the
best location and flow rates to apply the cooling
strategy. Again, best practices and prior experience
guides the selection of this. This is difficult to optimize
for complex plastic parts that involve many conjugate
regions for thermal diffusion.
To provide a more quantitative solution, a thermal
model of the conjugate heat transfer was developed
in vMould. For this, a combined pseudo-fluid/solid
model of the solidifying plastic melt and the metal
material tool was developed in three-dimensions.
This involves the following process:
1. Discretise the cavity into a inner fluid domain of
volumetric mesh elements, and a surrounding
solid domain.
2. Incorporate the thermal characteristics from the
filling simulation conducted in the air vent locator
tool.
3. Allow for conjugate heat transfer into the solid
domain.
4. Track local maxima of temperature, and
determine the rate of energy extraction required
for the ideal cooling design.
SOFTWARE DEPLOYMENT
To ensure the mould design optimisation features
presented above are delivered to the engineer in the
simplest form possible, a new cloud based software
design was implemented into vMould. This provides
the lowest total cost of operation to the end-user, as
only a web browser is required without needing
expensive software, hardware or networking onsite.
Further, the nature of web-based software is for
simplified user interfaces that do not require training
or significant expertise to operate. The quintessential
example of this approach is the Google search
interface that anyone can use without knowledge of
the complex algorithms or substantial computations
conducted behind the scenes.

2014 Excellence Awards, Technical Papers 30
Figure 22: CAD Quality assessment feature
Web-services were used to wrap each optimisation
feature discussed above, producing self-sufficient
components defined by an input and output interface
known as an Application Programming Interface
(API). This is shown for the entire infrastructure in
Figure 22. Web services were chosen as they are
simple to define using the REST specification that is
compatible with most internet ready connections. The
JSON language was used to communicate the
specifics of the input and output data fields, as it is
easy to parse and is commonly used for modern web-
service APIs.
The front-end website of vMould, that is the main
interface that the user interacts with, was defined as
a separate server programmed in HTML, CSS,
JavaScript and higher level libraries jQuery and
AngularJS. This ensured portability and easier
maintainability with advancements of the web
platform. The front-end website communicates with
the back-end computational servers as the user
requests to start and monitor the optimisation
features. The design and orchestration of the vMould
web servers allows for flexible scalability based on
the number of concurrent users requesting
optimisation tasks. This exploits the benefits of
modern cloud architecture, that is inexpensive to
operate at scale and transparent to the end-user.
SUMMARY/CONCLUSIONS
This paper summarized the research, development
and technical details of a new software tool “vMould”,
developed exclusively for the plastic injection
moulding industry. Firstly, the best-practices of
industry partners were evaluated and opportunities
for productivity gains using software automation were
identified. Next six independent features were
developed to aid in the decision making process of
mould design engineers, utilising numerical
computation and optimisation. Algorithms were
developed using visualization methods,
computational geometry, fluid dynamics, structural
mechanics and thermal flows. Finally, these were
implemented into a software suite using web-services
to provide scalability. The final software is delivered
to the end-user via a web browser, and does not
require significant training or any onsite infrastructure
costs. As a result, vMould provides a unique
productivity gain to the plastic injection mould
manufacturing industry. Tests with industry partners
has shown substantial efficiency gains, and added
confidence in the decisions required to start
production of plastic parts.
Future improvements to vMould will focus on deeper
integration with CAD software via plugins in order to
reduce the dependence on STL file uploading to run
the tools. Also, vMould will connect to manufacturing
machines to further automate the optimisation of
process parameters throughout production.
ACKNOWLEDGEMENTS
We would like to thank the AutoCRC and the Malaysia
Automotive Institute (MAI) for providing the
collaborative framework, financial support and
industry vision to conduct this work. Also, thanks to
our industry partners Sipro Plastic Industries Sdn Bhd
and Dolphin Products Pty Ltd for providing invaluable
industry knowledge and an environment to trial ideas.
CONTACT
Jarrod Sinclair VPAC Innovations
Email: [email protected]

2014 Excellence Awards, Technical Papers 31
Student Gold Award
Tyler Plowright, University of Newcastle,
Aerodynamics of Australian Coal Trains
Overview Tyler Plowright from the University of Newcastle and Pacific National carried out investigation into the
aerodynamics of Australian coal trains and wagons. The aim of the research was to look into potential
aerodynamic drag reduction designs for both locomotive and coal wagons that would help to improve the
energy efficiency of the train and wagon and therefore reduce fuel consumption. The research also looked into
the different aerodynamic flow that are present around and inside the coal wagon.
The study assessed a variety of current and future technologies that improve aerodynamic drag, and the pro
and cons of these designs. Four of these designs were modelled and analysed using Computational Fluid
Dynamics to calculate the drag reduction and determine the fuel saving.
CFD simulation has shown that by reducing the aerodynamic drag in the inter-wagon gap has the best results
for drag reduction and fuel consumption. The calculated fuel savings can be 4.5% for vortex generators or
13.5% for inter-wagon shrouds for an unloaded train.
This study will allow for better informed decisions on the potential benefits and costs associated with adopting
drag reducing devices.
Judges Synopsis Tyler’s study of the Aerodynamics of Australian Coal Trains received Gold in the Student Category for his
application of aerodynamics and CFD to help improve efficiencies in Australian Coal Train operations,
highlighting the potential for improvement and savings in this industry. Tyler carried out both computer
simulations and actual testing to demonstrate to validity of the data he has presented.

2014 Excellence Awards, Technical Papers 32
Student Highly Commended Award
Marc Russouw, Monash University,
Development of a Vehicle and Tyre Model for Formula SAE-A
Overview The interactions of surfaces have puzzled engineers and scientists for decades, and tyres have remained one
of the most complex elements of car design. Marc Russouw has taken on this challenging problem by using a
combination of established testing methods and engineering analysis tools to produce an efficient method to
capture tyre performance data and incorporate this into vehicle models for improved vehicle modelling.
Judges Synopsis The breadth of work undertaken by Marc Russouw was well defined and is a fine example of how engineers
can use scientific knowledge for substantial and practical benefit.

2014 Excellence Awards, Technical Papers 33
Development of a Vehicle and Tyre Model for Formula SAE-A
Marc Russouw Monash University
ABSTRACT
A broad spectrum of modelling techniques exists for
predicting tyre performance and force characteristics
under various operating conditions. These range from
purely theoretical models to semi-empirical fits of data
collected from constrained or on-vehicle testing. This
paper puts forward a combination of existing
techniques for modelling the performance of a racing
slick tyre using data obtained from constrained tyre
testing with the aim of reducing computational
expense and capturing salient differences in tyre
behaviour under changes in inclination angle,
pressure and normal load.
The force vs. slip data is non-dimensionalised and
compressed such that a single characteristic curve
taking into account the above parameters can be
fitted and then expanded. Response surface
modelling of the characteristic curve coefficients is
also used to interpolate tyre performance between
the test data points. These non-dimensional fits are
then expanded for any combination of the input
parameters that are fed into the model.
This information is subsequently used to create
simple steady-state vehicle models based on both
constant radius and constant velocity constraints to
investigate vehicle turn-in and limit performance.
Additionally, this paper presents steady-state testing
of a Formula SAE-A vehicle which attempts to
validate model behaviour and reconcile differences
between the data obtained from constrained testing
and that obtained from the vehicle.
INTRODUCTION
Maximising the overall dynamic performance of a
Formula SAE-A car requires an understanding of how
the tyres and vehicle as a whole behave under the
various conditions encountered and manoeuvres
performed on a track. Milliken and Milliken [4]
developed the Milliken Moment Method in order to
simulate the performance of a vehicle under constant
corner radii and velocities in terms of yaw and lateral
motion. To be able to construct a steady-state model
it is however first necessary to model the tyre force
outputs for given pressures, inclination angles and
vertical loads. Tyre data was obtained from
constrained testing done by the Tire Testing
Consortium at Calspan [3] using the setup shown in
figure 23 below:
Figure 23. Constrained tyre testing rig at Calspan TIRF, pictured with 13" Formula SAE tyre mounted [3].
The coordinate system used in this paper for force
and slip quantities is the same as that defined for
tyres by the SAE [9] as seen in figure 24.
Figure 24. SAE Tyre coordinate system.
The technique of non-dimensionalising tyre data was
first developed by Radt [3] and is one of the simplest
manners in which to obtain fits to force vs. slip data
obtained empirically. The transformations applied to

2014 Excellence Awards, Technical Papers 34
the data using this technique yield a dimensionless
tyre lateral force F ̅ and also slip angle �̅�. These are:
�̅� =𝐹𝑦
𝜇𝑦𝐹𝑧 (1)
�̅� =𝐶𝑠𝑙𝑖𝑝 tan 𝛼
𝜇𝑦𝐹𝑧 (2)
𝐶𝑠𝑙𝑖𝑝 = 𝜕𝐹𝑦
𝜕𝛼|
𝛼=0 (3)
Where 𝐹𝑦 is the lateral force in N, 𝐹𝑧 is the normal
force in N, 𝜇𝑦 is the maximum lateral force coefficient,
𝛼 is the slip angle in radians and 𝐶𝑠𝑙𝑖𝑝 is the cornering
stiffness in N/rad. For the extensions of these
quantities to modelling longitudinal force and
moments, see [4].
Due to asymmetries in the construction of the tyre as
well as inclination angle effects, two additional
dimensionless parameters are used to shift the
compressed curve (see figure 25 below) to the origin
of the non-dimensional force vs. slip graph [5].
𝑉𝑦 = 𝐹𝑦
𝐹𝑧|
max(𝐶𝑠𝑙𝑖𝑝) (4)
𝐻𝑦 = �̅�|max(𝐶𝑠𝑙𝑖𝑝) (5)
Where 𝑉𝑦 and 𝐻𝑦 are the dimensionless vertical and
horizontal shifts. The effects of cornering stiffness are
unable to be taken directly from the raw data, as the
hysteresis during the tyre slip angle sweeps creates
two different curves passing the zero force point on
the force vs. slip curve. To overcome this, the two
positive slip sweeps were averaged and this was then
averaged with the negative slip sweep (see figure 26)
such that the bias from the two positive sweeps would
be removed. A third order polynomial was fitted to this
data between -2.5 and 2.5 degrees slip angle and
shifts obtained from the intercepts along with the
gradient (cornering stiffness) at the ‘shifted’ origin
(see figure 26). This allowed the parameters required
to non-dimensionalise the data prior to fitting the
‘Magic Formula’ in (6) and (7) to be determined.
Figure 25. Force vs. time plot showing 2 positive (1 partial) and 1 negative force sweep.
Figure 26. Polynomial fit to positive and negative sweeps.
The curve to fit takes the following form:
�̅� = 𝐷 sin (𝐶 𝑎𝑡𝑎𝑛 (𝐵 {(1 − 𝐸)�̅� +𝐸
𝐵𝑎𝑡𝑎𝑛(𝐵�̅�)})) (6)
However, this can be further simplified as shown in
[5] to the following relation:
�̅� = sin (1
𝐵𝑎𝑡𝑎𝑛 (𝐵 {(1 − 𝐸)�̅� +
𝐸
𝐵𝑎𝑡𝑎𝑛(𝐵�̅�)})) (7)
Applying transforms and shifts 1-7 to the raw data
then enables all of the curves to be compressed into
a single characteristic line as shown on the right in
figure 27.
Figure 27. Raw Data (Left) vs. Non-Dimensional Transform (Right)
INPUT PARAMETER EXTENSION
Both Kasprzak and Patton [2,5] extend the number of
operating parameters to be input into the model by

2014 Excellence Awards, Technical Papers 35
fitting response surfaces for each of the six model
parameters required for the Magic Formula in (7).
Instead of fitting one line to the compressed data,
multiple lines are fitted and the B and E coefficients
obtained for equation (7) using a non-linear least-
squares fit. This data can then be represented as 2nd
order surface fits to enable continuous estimation of
the parameters given inputs within the tested range.
Dimensionless cornering stiffness, for example, is
represented as:
𝐶𝑠𝑙𝑖𝑝̅̅ ̅̅ ̅̅ = 𝑓(𝐹𝑧 , 𝛾) (8)
Figure 28. Response Surface fit for dimensionless cornering stiffness (see Appendix for the other parameter fits)
Given that there is only information for 3 inflation
pressures available (10, 12, 14 psi), adding a
pressure parameter into the model is achieved via
additional surfaces. This is shown for maximum force
coefficient in figure 29 below:
Figure 29. Surface fitting for maximum lateral force coefficient for 3 discrete pressures.
Once all of these surfaces have been collected and
stored as coefficients to the quadratic surface fit given
by (9), the model can be expanded for any
combination of inclination angle, slip angle, normal
load and discrete inflation pressure points that fall
within the tested range. Figure 30 is an example of
model expansion across the tested normal loads and
this shows good agreement with the constrained
testing data.
𝐶𝑠𝑙𝑖𝑝̅̅ ̅̅ ̅̅ = 𝐶0 + 𝐶1𝐹𝑧 + 𝐶2𝛾 + 𝐶3𝐹𝑧
2 + 𝐶4𝛾2 + 𝐶5𝐹𝑧𝛾 (9)
Figure 30. Non-dimensional Model fit (black line) vs. raw data.
Furthermore, the model’s response to varying
inclination angles and pressures is illustrated by
figures 31-32.
Figure 31. Model response to variation in pressure.
Figure 32. Model Response to variation in inclination angle.
The method described above can also be extended
to fitting pure longitudinal slip data. All that is required
is to replace the lateral force and slip quantities with
their longitudinal analogues. However, instead of
equation (2), from [5] the normalized slip quantity
becomes:
�̅� =𝐶𝑥𝜅
𝜇𝑥𝐹𝑧 (10)
𝜅 =𝑁𝑅0−𝑉 cos 𝛼
𝑉 cos 𝛼 (11)
𝐶𝑥 = 𝜕𝐹𝑥
𝜕𝜅|
𝜅=0 (12)
Where 𝜅 is the slip ratio, V is axle speed in m/s (or
belt speed in the case of the constrained test), 𝑅0 is

2014 Excellence Awards, Technical Papers 36
the rolling radius in m for the tyre at a slip angle of 0
and 𝐶𝑥 is the longitudinal slip stiffness of the tyre in N.
BICYCLE MODEL
Once the tyre model is established, a simple 3 DOF
‘bicycle model’ can be created (see figure 33). The
coordinate system used is the same as that of [9].
Figure 33. Bicycle model setup [7]
To analyse the vehicle’s steady-state behaviour the
Moment Method as described in chapter 8 of [4] is
employed. There are two types of moment method
diagrams (MMD), the 𝐶𝑁 − 𝐴𝑦 diagram which
corresponds to constant velocity manoeuvres around
different path radii and assumes that all of the lateral
force produced by the vehicle must maintain the
vehicle in the trim condition (equal the centrifugal
force) [6].
𝐶𝑁 =𝑁
𝑚𝑔𝑙 (13)
𝐴𝑦 =𝐹𝑦
𝑚𝑔 (14)
𝑟 =𝐴𝑦
𝑉 (15)
This type of diagram is most useful for simulating
vehicle behaviour under a variety of operating
conditions and can be incorporated into a lap
simulation algorithm.
The second type of representation is the 𝐶𝑁 − 𝐶𝑦
diagram where path radius is constant through for
each steered angle/CG slip angle grid point and
velocity varies. The previous constraint where the
lateral force generated by the vehicle balances the
acceleration of the vehicle mass no longer needs to
be met and can be used to resist aerodynamic side
forces or any other lateral force disturbances the
vehicle encounters (see [5]). This is the more
generalized of the two forms and is more useful for
tuning setup for a particular corner radius (a situation
encountered in the Skid Pad event for a Formula SAE
car).
The 𝐶𝑁 − 𝐶𝑦 diagram is used for the bicycle model
and has the following input parameters:
Table 2. Input Parameters for Bicycle Model CN-CY diagram
The two dependent parameters, front steered angle
𝛿𝐹 and CG slip angle 𝛽𝐶𝐺 (both in degrees) are used
to construct a grid of combinations with each
parameter varied from -10° to 10° in 0.5° increments
.The algorithm requires both a starting velocity and
acceleration for each point and the convergence
process is described by the flowchart in figure 34.
Figure 34. Flow chart for bicycle model C_N-C_Y diagram.
Weight transfer is neglected for the model and thus,
for the tyre normal loads, equations (16) and (17) are
used.
Wheelbase 1.55 m
Mass 280 kg
Weight Distribution 50:50 Front:Rear
Radius 15 m
Camber Angle 0° Front & Rear
Toe Angle 0° Front & Rear
For 𝑅 = 15 𝑚 point
𝛿𝐹 = 1° and 𝛽𝐶𝐺 = 0°
Calculate tyre slip
angles and 𝐹𝑧
Guess 𝐴𝑦, 𝑉
Calculate tyre lateral force
given by tyre model.
Calculate 𝑉𝑛𝑒𝑤 and
𝐴𝑦 𝑛𝑒𝑤
Is 𝐴𝑦 𝑛𝑒𝑤 − 𝐴𝑦 𝑜𝑙𝑑 < 𝜖 ?
No
Is 𝑉𝑛𝑒𝑤 − 𝑉𝑜𝑙𝑑 < 𝜖 ?
𝐴𝑦 𝑛𝑒𝑤 = 𝐴𝑦 𝑜𝑙𝑑 + 0.1
𝑉𝑛𝑒𝑤 = 𝑉 𝑜𝑙𝑑 + 0.1
No
Yes
Yes
Grid point converged,
move to next 𝛿𝐹 and 𝛽𝐶𝐺
point

2014 Excellence Awards, Technical Papers 37
𝐹𝑧 𝑓𝑟𝑜𝑛𝑡 = 𝑚𝑔𝑎
𝑎+𝑏 (16)
𝐹𝑧 𝑟𝑒𝑎𝑟 = 𝑚𝑔𝑏
𝑎+𝑏 (17)
Where m is the vehicle mass in kg, g is the
gravitational constant 9.81 𝑚/𝑠2, a is the distance
from the CG to the front axle in meters and b is the
distance from the CG to the rear axle in meters. Once
the tyre loads are evaluated using the tyre model, the
following equations are used to evaluate the new
lateral acceleration and velocity values.
𝐴𝑦 𝑛𝑒𝑤 =∑ 𝐹𝑦,𝑖
2𝑖=1
𝑚 (18)
𝑉𝑛𝑒𝑤 = √𝐴𝑦𝑅 (19)
If the difference between the old and new values for
each of these quantities is less than a user specified
value, 𝜖, the solution has converged for that specific
point on the steer and CG slip angle grid.
Figure 35. Converged CN-CY diagram for Bicycle Model
Figure 35 shows the result, which as expected for the
model, is symmetric about both axes. To visualise
what happens along a line of constant steer, front and
rear lateral forces are plotted against CG slip angle in
figure 36:
Figure 36. Front and rear end lateral force contributions with steer angle held constant.
Figure 36 shows an offset in the 𝛽𝐶𝐺 direction such
that at 0 degrees chassis slip angle, the front end of
the vehicle is producing a net lateral force in the
positive direction. The magnitude of this force
corresponds to the same as that at the rear when the
CG slip is at 4 degrees. This lateral shift in the force
curves thus agrees with expectations.
Figure 37. Yaw Moment and Lateral Acceleration for constant
steer, varying CG slip angle.
Figure 37 confirms that the CG slip angles at which
the signs of the tyre slip angles and hence forces in
figure 36 are opposite produce the largest yawing
moments (between -6 and 0 degrees). Lateral
Acceleration increases as the combined magnitudes
of both the front and rear tyre forces increase as well,
which also agree with expectations.
The Bicycle Model’s predictions in terms of vehicle
behaviour as steered angle and CG slip angle are
varied with respect to one another provides a
qualitative and initial understanding of vehicle yaw
dynamics. Incorporating vehicle weight transfer and
extending the model to 4 wheels is the next step.
FOUR WHEEL MODEL
Extending the Bicycle Model to four wheels requires
only a few additional steps and parameters to be
added to the existing algorithm. The input parameters
for the four wheel model are:
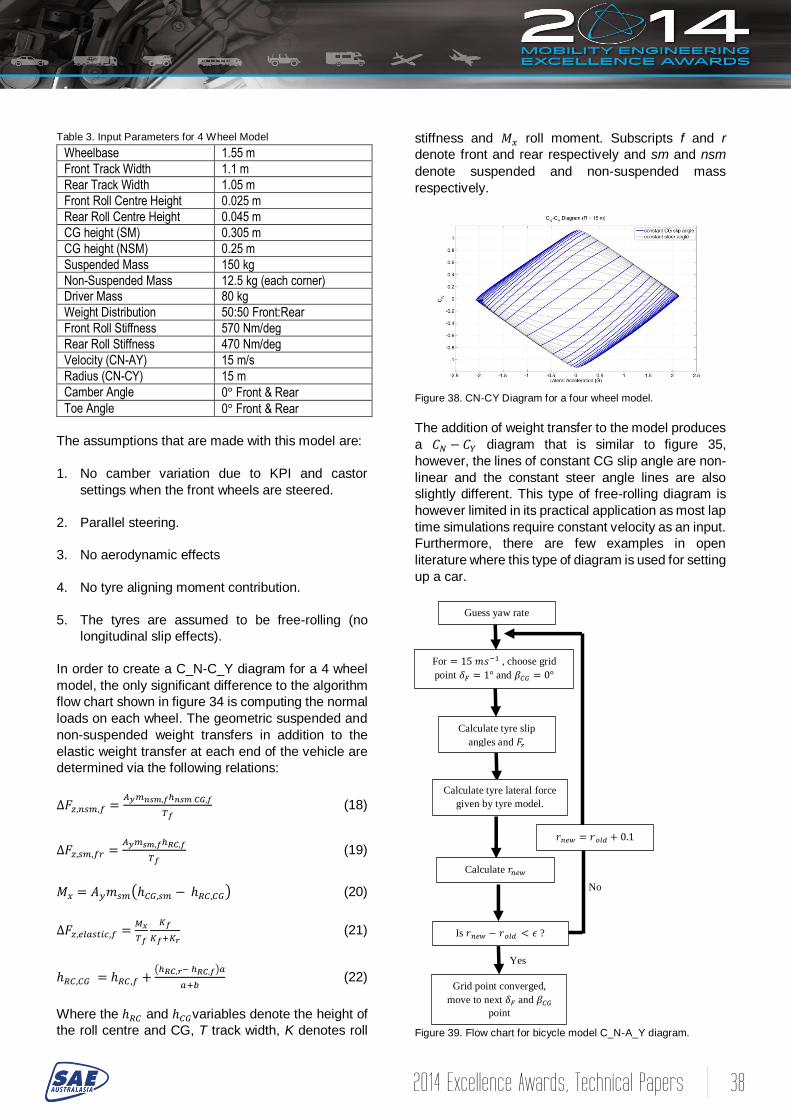
2014 Excellence Awards, Technical Papers 38
Table 3. Input Parameters for 4 Wheel Model
The assumptions that are made with this model are:
1. No camber variation due to KPI and castor
settings when the front wheels are steered.
2. Parallel steering.
3. No aerodynamic effects
4. No tyre aligning moment contribution.
5. The tyres are assumed to be free-rolling (no
longitudinal slip effects).
In order to create a C_N-C_Y diagram for a 4 wheel
model, the only significant difference to the algorithm
flow chart shown in figure 34 is computing the normal
loads on each wheel. The geometric suspended and
non-suspended weight transfers in addition to the
elastic weight transfer at each end of the vehicle are
determined via the following relations:
∆𝐹𝑧,𝑛𝑠𝑚,𝑓 =𝐴𝑦𝑚𝑛𝑠𝑚,𝑓ℎ𝑛𝑠𝑚 𝐶𝐺,𝑓
𝑇𝑓 (18)
∆𝐹𝑧,𝑠𝑚,𝑓𝑟 =𝐴𝑦𝑚𝑠𝑚,𝑓ℎ𝑅𝐶,𝑓
𝑇𝑓 (19)
𝑀𝑥 = 𝐴𝑦𝑚𝑠𝑚(ℎ𝐶𝐺,𝑠𝑚 − ℎ𝑅𝐶,𝐶𝐺) (20)
∆𝐹𝑧,𝑒𝑙𝑎𝑠𝑡𝑖𝑐,𝑓 =𝑀𝑥
𝑇𝑓
𝐾𝑓
𝐾𝑓+𝐾𝑟 (21)
ℎ𝑅𝐶,𝐶𝐺 = ℎ𝑅𝐶,𝑓 +(ℎ𝑅𝐶,𝑟− ℎ𝑅𝐶,𝑓)𝑎
𝑎+𝑏 (22)
Where the ℎ𝑅𝐶 and ℎ𝐶𝐺variables denote the height of
the roll centre and CG, T track width, K denotes roll
stiffness and 𝑀𝑥 roll moment. Subscripts f and r
denote front and rear respectively and sm and nsm
denote suspended and non-suspended mass
respectively.
Figure 38. CN-CY Diagram for a four wheel model.
The addition of weight transfer to the model produces
a 𝐶𝑁 − 𝐶𝑌 diagram that is similar to figure 35,
however, the lines of constant CG slip angle are non-
linear and the constant steer angle lines are also
slightly different. This type of free-rolling diagram is
however limited in its practical application as most lap
time simulations require constant velocity as an input.
Furthermore, there are few examples in open
literature where this type of diagram is used for setting
up a car.
Figure 39. Flow chart for bicycle model C_N-A_Y diagram.
Wheelbase 1.55 m
Front Track Width 1.1 m
Rear Track Width 1.05 m
Front Roll Centre Height 0.025 m
Rear Roll Centre Height 0.045 m
CG height (SM) 0.305 m
CG height (NSM) 0.25 m
Suspended Mass 150 kg
Non-Suspended Mass 12.5 kg (each corner) Driver Mass 80 kg
Weight Distribution 50:50 Front:Rear
Front Roll Stiffness 570 Nm/deg
Rear Roll Stiffness 470 Nm/deg
Velocity (CN-AY) 15 m/s
Radius (CN-CY) 15 m
Camber Angle 0° Front & Rear
Toe Angle 0° Front & Rear
For = 15 𝑚𝑠−1 , choose grid
point 𝛿𝐹 = 1° and 𝛽𝐶𝐺 = 0°
Calculate tyre slip
angles and 𝐹𝑧
Guess yaw rate
Calculate tyre lateral force
given by tyre model.
Calculate 𝑟𝑛𝑒𝑤
Is 𝑟 𝑛𝑒𝑤 − 𝑟 𝑜𝑙𝑑 < 𝜖 ?
No
𝑟 𝑛𝑒𝑤 = 𝑟 𝑜𝑙𝑑 + 0.1
Yes
Grid point converged,
move to next 𝛿𝐹 and 𝛽𝐶𝐺
point

2014 Excellence Awards, Technical Papers 39
Developing a 𝐶𝑁 − 𝐴𝑌 diagram requires a modified
algorithm flowchart to that of figure 34.
Due to the fact that the yaw rate is changing for every
loop, this requires the wheel slip angles in addition to
the normal loads to be updated on every iteration.
𝛽𝐹𝐿 = arctan (𝑉 sin 𝛽𝐶𝐺+𝑟𝑋𝐹𝐿
𝑉 cos 𝛽𝐶𝐺+𝑟𝑌𝐹𝐿) (23)
𝛽𝐹𝑅 = arctan (𝑉 sin 𝛽𝐶𝐺+𝑟𝑋𝐹𝑅
𝑉 cos 𝛽𝐶𝐺−𝑟𝑌𝐹𝑅) (24)
𝛽𝑅𝐿 = arctan (𝑉 sin 𝛽𝐶𝐺−𝑟𝑋𝑅𝐿
𝑉 cos 𝛽𝐶𝐺+𝑟𝑌𝑅𝐿) (25)
𝛽𝑅𝑅 = arctan (𝑉 sin 𝛽𝐶𝐺−𝑟𝑋𝑅𝑅
𝑉 cos 𝛽𝐶𝐺−𝑟𝑌𝑅𝑅) (26)
Where r is yaw rate in radians per second, V is
velocity in m/s, X denotes CG-to-axle distance in
meters and Y is the half track width in meters.
These then yield the final slip angles:
𝛼𝐹𝑅 = 𝛽𝐹𝑅 − 𝛿𝐹𝑅 (27)
𝛼𝐹𝐿 = 𝛽𝐹𝐿 − 𝛿𝐹𝐿 (28)
𝛼𝑅𝑅 = 𝛽𝑅𝑅 (29)
𝛼𝑅𝐿 = 𝛽𝑅𝐿 (30)
Figure 40. CN-AY Diagram at 15 m/s.
It is evident that relaxing the corner radius constraint
and imposing a velocity for each grid point across the
range of steered and CG slip angles has resulted in
different stability (gradient of constant steer angle
lines) and control (gradient of constant CG slip angle
lines) characteristics. For lap simulations this enables
the possible range of corner radii for a given setup
and speed at any instant along the vehicle’s trajectory
to be determined. Due to the steered angles on the
front wheels producing a tire ‘drag’ force component
when resolved into the body reference frame,
longitudinal acceleration also needs to be accounted
for in the model. Since this is only a ‘free-rolling’ (zero
longitudinal slip) model, all of the tyre’s grip potential
is assumed to be used to generate lateral force. This
is only true in reality during a cornering manoeuvre
when the car is at the apex (lowest radius of the
vehicle’s trajectory) or coasting during part of the
manoeuvre (no braking/throttle input applied). The
slip angle induced drag however, becomes significant
at high steered and CG slip angles as seen in figure
41.
Figure 41. CN-AY diagram showing longitudinal effects on free-rolling solution.
This demonstrates the importance of including
longitudinal dynamics in the model to obtain the
particular solution or limit envelope for a given
longitudinal acceleration constraint.
CONSTRAINED TESTING
Though the tyre model may respond well to the limited
number of inputs, there are many more parameters
that are able to influence tyre behaviour. Tyre surface
temperature is closely linked with load sensitivity [10]
and the effect it has on maximum lateral grip
coefficient is also significant. This is evident when
looking at the magnitude of the lateral grip coefficient
plotted against surface temperature during a
constrained test run in figure 42.
Figure 42. Lateral grip coefficient as a function of tyre surface

2014 Excellence Awards, Technical Papers 40
temperature. Polynomial and normal distribution function fits included.
𝜇(𝑇) = 𝐶0 + 𝐶1𝑇 + 𝐶2𝑇2 + 𝐶3𝑇3 (31)
𝜇(𝑇) =1
𝐶1√2𝜋𝑒
−(𝑇−𝐶2)2
2𝐶22
(32)
Figure 42 shows that it is possible to obtain
reasonable fits using either (31) or (32), however
tread temperature itself is a function of many
parameters such as road surface, wear, ambient
conditions, tyre compound etc. Temperature effects
can therefore be included in a lap simulation if a
temperature profile gathered from test data is used
(however this information will yield qualitative results
at best as vehicle parameter sweeps will change the
actual temperature profile in reality).
From figure 23, the setup of the test road surface
contributes to the unrealistically high grip coefficients
measured. The belt surface does not have asperities
that are representative of those found on typical
tracks and the nature of the setup means that rubber
is continuously deposited on the tyre path. Whilst this
creates greater adhesion between the tyre and the
belt surface, this condition is not encountered on long
asphalt tracks where dirt deposits and variation in
surface asperities can decrease the grip coefficient
predicted from constrained testing by up to 50%. [10]
The test machine also shows difficulty in maintaining
the required normal load during a sweep due to the
deflection of the tyre at the contact patch increasing
with slip angle. This can also affect the accuracy of
the tyre model generated from this data. Figure 43
illustrates this phenomenon, which is more severe for
higher loads and also softer compounds (see figure
44).
Figure 43. Variation in measured lateral load with normal load.
Figure 44. Variation in measured lateral load with normal load for a
softer compound.
Another discrepancy between constrained testing
data and on-track data is the transient behaviour of
the tyre on-track. The slip rate during constrained
testing is fixed at +/- 5 degrees per second during the
sweeps, however this can be much higher on a
Formula SAE-A car (up to 80 degrees/second). It is
known that rubber modulus (and in the context of a
Formula SAE-A car, properties of the rubber in the
contact patch) will change due to strain hardening
and crystallisation at higher rates of strain (slip) [10].
This in turn will affect how temperature builds up in
the tyre on-track, and is something that is not
accurately modelled in the constrained test.
Though the constrained testing does not accurately
capture the transient behaviour of the tyre, it still
provides excellent qualitative information on the
steady state performance of a tyre. Additionally, it
provides a good basis from which the relative
performance of a tyre under various conditions can
be modelled and quantified.
MODEL VALIDATION
In order to confirm whether the trends predicted by
the steady state simulation are correct as it develops,
a series of manoeuvres were tested using the
Monash Motorsport 2012 Formula SAE-A car as a
testbed. The car was instrumented with a non-contact
optical Correvit LFII sensor to measure CG slip angle
and also to determine the individual wheel slip angles.

2014 Excellence Awards, Technical Papers 41
Figure 45. Sensor setup on M12 during a shakedown.
Constant radius circles of radii 5,7.88,8, 12 and 20
meters were driven as shown in figures 46-48:
Figure 46: CG Slip Angle vs. Inverse Corner Radius for constant radius manoeuvres.
Figure 47: CG Slip Angle vs. Yaw Rate
Figure 48: CG Slip Angle vs. Lateral Acceleration
Though the manoeuvres take place under constant
lateral acceleration, as shown at the tips of the 𝐶𝑁 −
𝐴𝑌 diagram in figure 19, including longitudinal
dynamics will enable direct comparison between the
model and the collected data. From the figures above
it can be seen how the vehicle balance (shifting CG
slip angle) close to the limit of the 𝐶𝑁 − 𝐴𝑌 diagram
on-track is influenced by lateral acceleration, corner
radius and yaw rate and hence justifies the approach
of extending the vehicle model to include yaw
dynamics.
FUTURE WORK
At this stage, the model agrees with expectations,
however, in order to progress it to the stage where
parameter studies can be done in order to refine car
setup, a combined longitudinal and lateral tyre needs
to be developed.
Furthermore, the tyre data fitting procedure can be
applied to data measured on-track through strain
gauging the wishbones on one or more corners of the
vehicle. Since there are some compounds that have
not yet been tested by the TTC, in addition to
validating tyre constructions that have already been
tested, new tyre data can be obtained.
There is also scope to extend the work presented to
form the basis of a Lap simulation which accounts for
yaw dynamics which cannot be investigated in
simpler particle model based simulations.
CONCLUSION
The development and validation of a tyre and vehicle
simulation for Formula SAE-A was described. Using
data provided by constrained testing, a tyre model
was created using Non-dimensional Tyre Theory and
this was shown for a pure lateral force model to be in
good agreement with the data obtained from
constrained testing. The tyre model was then

2014 Excellence Awards, Technical Papers 42
extended systematically to a two wheeled vehicle
model and finally a four wheeled model to create a
vehicle performance envelope accounting for yaw
dynamics in addition to longitudinal and lateral
acceleration. Finally, data from constant radius
manoeuvres collected using the Monash 2012
Formula SAE-A car was processed and will serve as
a baseline against which the model will be checked
as it develops.
ACKNOWLEDGEMENTS
The author would like to thank:
Dr. Scott Wordley, for his support and guidance
throughout the project.
Martin Bett, Luke Pherrson, Damien McArthur,
Andrew Salvo, Alex Biviano, Tom Knast, Ashan
Perera,Yuval Shavit, Daniel Teo, Katherine
Venables, Terence Avadiar, Peter Roufaeil, Areeb
Hassan and Ryan Paine for their support and
guidance during testing and the tireless commitment
of the students involved in the Monash Motorsport
Formula SAE-A Team.
Calspan TIRF and TTC, as without their volunteers
running the constrained testing, there would be little
or no tyre data available in Formula SAE and hence
writing this paper.
Joe Cavallaro, Peter Herath and Robert Bosch
Australia for their support of the team with testing at
their facilities and use of their measurement systems.
REFERENCES
1. Calspan Corporation. Capabilities Report.
Technical, Buffalo, NY: Calspan Corporation,
2012.
2. Kasprzak, Edward. Inflation Pressure Effects in
the Nondimensional Tyre Model. Technical
Paper, Warrendal,PA: Society of Automotive
Engineers, 2006.
3. Kasprzak, Edward M. “Test photos from
Calspan.” Calspan, 2014.
4. Milliken, W.F., and D.L. Milliken. Race Car
Vehicle Dynamics. Warrendale: Society of
Automotive Engineers, 1995.
5. Patton, Chris. Development of Vehicle Dynamics
Tools for Motorsports. Corvalis: Oregon State
University, 2013.
6. Ringwood, Pete. Determining a Tire's Influence
on Vehicle Handling and Limit Performance.
Sydney: University of Technology Sydney, 2012.
7. Ryu, Jihan. Vehicle State Estimation with GPS. -
December 2004.
ddl.stanford.edu/GPSestimation (accessed
February 17, 2014).
8. SAE International. “SAE Collegiate Design
Series.” Society of Automotive Engineers. 2013.
students.sae.org/cds/formulaseries/rules/2014_f
sae_rules.pdf (accessed 2 24, 2014).
9. Society of Automotive Engineers. Vehicle
Dynamics Terminology - SAE standard J670e.
Warrendal,PA: Society of Automotive Engineers,
1976.
10. Trevorrow, Nick. A Theoretical Model and
Experimental Investigation of Racing Slick Tyre
Performance and Behaviour. Melbourne: Monash
University, 2006.
CONTACT
Marc Russouw Monash University
Phone: +61 0425 719 680
Email: [email protected]

2014 Excellence Awards, Technical Papers 43