technical advisory committee meeting agenda scta
TRANSCRIPT

411 King Street, Santa Rosa, CA | 707.565.5373 | scta.ca.gov | rcpa.ca.gov
Technical Advisory Committee
MEETING AGENDA SCTA Headquarters Office
September 26, 2019 – 1:30 p.m. Sonoma County Transportation Authority
Large Conference Room 411 King Street, Second Floor Santa Rosa, California 95404
ITEM
1. Introductions
2. Public Comment
3. Approval of Minutes, August 22, 2019* DISCUSSION/ACTION
4. Sonoma County Travel Model – 2015 Validation Report DISCUSSION
5. Long Range Planning DISCUSSION
5.1 Comprehensive Transportation Plan - Update
6. Measure M DISCUSSION
6.1 Measure M Reporting Letter Status*
6.2 Measure M Invoicing/Obligation Status*
6.3 Measure M Reauthorization Ad Hoc Update
7. Regional Information Update DISCUSSION
7.1 Inactive Federal Obligation Status**: project sponsors should be prepared to address status of inactive obligations at the meeting: https://dot.ca.gov/programs/local-assistance/projects/inactive-projects
Currently Inactive: Petaluma, Sebastopol, and Sonoma County
7.2 Programming and Delivery Working Group Agenda items of note:
• FINAL FFY19/20 Annual Obligation Plan* • HPB Seismic Retrofit Program Status* • PMP Certification and PTAP-21* • SPOC Certification and Training Announcement: November 4 at Caltrans District 4 Auditorium* • Regional Pavement Condition Summary* • Plan Bay Area 2050 Needs Assessment*
8. SCTA/RCPA DRAFT Board Agenda, October 14, 2019**
9. Other Business / Comments / Announcements DISCUSSION
10. Adjourn ACTION *Materials attached. **Materials distributed separately
1

The next S C T A meeting will be held October 14th, 2019 The next TAC meeting will be held on October 24th 2019
Copies of the full Agenda Packet are available at www.scta.ca.gov
DISABLED ACCOMMODATION: If you have a disability that requires the agenda materials to be in an alternate format, or that requires an interpreter or other person to assist you while attending this meeting, please contact SCTA at least 72 hours prior to the meeting to ensure arrangements for accommodation.
SB 343 DOCUMENTS RELATED TO OPEN SESSION AGENDAS: Materials related to an item on this agenda submitted to the Technical Advisory Committee after distribution of the agenda packet are available for public inspection in the Sonoma County Transportation Authority office at 411 King St, Santa Rosa, during normal business hours.
TAC Voting member attendance – (6 Month rolling 2019) Jurisdiction March April May June August September
Cloverdale Public Works
Cotati Public Works
County of Sonoma DHS*
County of Sonoma PRMD*
County of Sonoma Regional Parks*
County of Sonoma TPW* (by phone) (by phone)
Healdsburg Public Works
Petaluma Public Works & Transit
Rohnert Park Public Works (by phone)
Santa Rosa Public Works**
Santa Rosa Transit**
Sebastopol Public Works
SMART
Sonoma County Transit*
Sonoma Public Works (by phone)
Windsor Public Works
*One Vote between all **One Vote between all NB: No meeting held in July 2019
2

TECHNICAL ADVISORY COMMITTEE MEETING NOTES
Meeting Notes of August 22, 2019
ITEM
1. Introductions
Meeting called to order at 1:30 p.m. by Chair Katherine Wall.
Committee Members: Katherine Wall, Chair, City of Sonoma; Nancy Adams, Vice Chair, City of Santa Rosa; Clay Thistle, City of Healdsburg; Henry Mikus, City of Sebastopol; Mario Traverso, City of Petaluma; Alejandro Perez, Town of Windsor; Craig Scott, City of Cotati; Eydie Tacata, City of Rohnert Park; Elizabeth Tyree, Sonoma County Regional Parks; Brittany Lobo, Sonoma County Department of Health Services; Joanne Parker, SMART; Steve Urbanek, via Phone, Sonoma County Transportation and Public Works; Gary Alfred, Permit Sonoma.
Guest: Ada Chan, MTC/ABAG.
Staff: Seana Gause; James Cameron; Janet Spilman; Chris Barney; Dana Turrey; Tanya Narath.
2. Public Comment
N/A
3. Approval of Minutes, June 27, 2019 – ACTION
Approved as submitted.
4. TFCA/TDA3 Quarterly Report
This is a quarterly report for TFCA and TDA3 projects. Projects noted in the red color have upcoming expiration dates.
5. SB 743 – DISCUSSION/ACTION
5.1. SB743 Implementation Fact Sheet and Checklist
Chris Barney referenced the checklist included in the agenda packet. This provides the types and ideas that should be thought about.
Mr. Barney further outlined the levels of support SCTA could provide to the jurisdictions.
5.2. Draft VMT Summaries
Chris Barney provided an update to SB 743 implementation and the related calculation method. The VMT calculation is currently calculated as: VMT = Link Volume x Distance or vehicle trips x trip length.
There are two common methods in calculating VMT: Boundary- and Origin-Destination Method. Mr. Barney described the two methods and the guidance set by OPR.
Next steps include detailed VMT summaries/maps, the 2015 Model validation, SB743 implementation White Paper, the Travel Behavior Study, model enhancements, and working on a VMT calculator for the MTC region.
Draft estimates for Sonoma County were provided to the committee noting each jurisdiction’s total VMT from the Travel Behavior Study (2017), MTC’s Travel Model One (2015), and SCTA Travel Model (2010).
6. Travel Behavior Study Update
Chris Barney further updated the committee on the Travel Behavior Study. Fehr & Peers have collected the data for this project and now are processing/summarizing the data.
3

A brief background on this project was described for those who are not familiar with this project.
The final report will have weekend and supplemental data (i.e. seasonal and post-fire data).
Mr. Barney described the key findings of trips within, though, and out of Sonoma County.
The final report is expected this October and will be brought to the committee.
7. Long Range Planning – Discussion/Action
7.1. Comprehensive Transportation Plan/Measure M Reauthorization Applications due September 4, 2019
Janet Spilman spoke on the CTP/Measure M Reauthorization Call for Projects. The application is due on September 4th information is available on the SCTA website.
Each jurisdiction has up to ten projects to submit and projects for Measure M must be included in the CTP. There is an additional five projects available for transit related projects.
Ms. Spilman encouraged the committee to review the existing the list of projects submitted prior to submitting this application.
8. Measure M – DISCUSSION/ACTION
8.1. Measure M Reminder Letter
This is a reminder that the Measure M Annual Reporting letters are due to Seana Gause by the close of business September 16, 2019.
8.2. Measure M Invoicing/Obligation Status*
Ms. Gause recalled this monthly item provided to the committee regarding invoicing and the request for extensions if need be.
There are currently no projects that are approaching invoicing or projects that have not been appropriated for FY 19/20 given the new fiscal year.
8.3. Measure M Reauthorization Ad Hoc Update
The Ad Hoc committee has selected a consultant to conduct polling and strategic community strategies. The Ad Hoc will meet in early September with the consultant to develop the poll.
The poll will be conducted in September. Analysis and preliminary results will be presented to the Board of Directors in October.
9. Regional Information Update – Discussion
9.1. Inactive Federal Obligation Status*
This is a standard item on the agenda.
Seana Gause requested an update from the jurisdictions.
9.2. Program and Delivery Working Group Agenda items of note
Seana Gause highlighted the Seismic Retrofit Program, stating that the delivery plan and list of goals must be updated prior to the deadline.
In regards to the Annual Obligation Plan, the federal obligation plan draft was provided and Ms. Gause requested the committee to review and determine if projects are not deliverable in the upcoming federal fiscal year, to contact SCTA and MTC to have the projects removed from the plan to avoid a “failure to deliver.”
Ms. Gause further spoke on the CTC Allocation Plan, noting that SCTA has requested to deprogram Sonoma County’s LPP-F project and will reprogram in the next cycle.
Lastly, Ms. Gause reported on the proposed changes to MTC Resolution 3606. The proposed
4

revisions are shown in the staff report by MTC that was included in the agenda packet.
10. SB-1 Local Partnership Formulaic Program Call for Projects
Seana Gause noted the guidelines for the competitive program are being developed. They were expected to be released by the CTC in August, however that did not happen.
Ms. Gause noted the changes made to the schedule for SCTA’s Call for Projects for the Competitive Program to align better when these guidelines are distributed.
Ms. Gause noted at least two projects SCTA will have under consideration: Hearn Avenue Interchange and Highway 116/121 intersection improvements.
11. Santa Rosa Grant Support
Seana Gause spoke on the request from the City of Santa Rosa for an amendment to the Measure M Expenditure Plan. The request did not meet the policy requirement.
Ms. Gause recalled the work already completed for this project and noted that construction funding is absent. The City of Santa Rosa has positioned themselves for BUILD and matching grants.
SCTA staff is recommending support to the City in the BUILD and LPP(c) grant applications and recommending to the Board of Directors to support providing this funding should the City be successful in these grant applications.
If the City is successful, SCTA staff will develop a proposed amendment to the expenditure plan for action by the SCTA Board of Directors.
12. SCTA/RCPA DRAFT Board agenda, June 10, 2019
Included in the agenda packet for the committee’s interest.
13. Other Business / Comments / Announcements – Discussion
Kat Wall announced that Larry Zimmer will be chairing the TAC starting in September.
Seana Gause expressed thanks for Ms. Wall chairing the TAC over the past year.
Brittany Lobo spoke on Vision Zero planning efforts that will be beginning soon.
14. Adjourn Action
The committee adjourned at 2:35 p.m.
5

490 Mendocino Ave. #206, Santa Rosa, CA| 707.565.5373 | scta.ca.gov | rcpa.ca.gov
Staff Report To: Sonoma County Transportation Authority Technical and Citizens Advisory Committees
From: Seana L. S. Gause, Senior – Programming and Projects
Item: Status of Measure M annual reporting letters
Date: September 26 & September 30, 2019
Issue:
What is the status of the annual reporting for expenditures of Measure M funds for FY18/19?
Background:
The Traffic Relief Act of Sonoma County requires that agencies receiving Measure M funds report on how those funds were spent in a given fiscal year. Reporting letters are due on September 15 of each year, reporting on the previous fiscal year. The 2019 Strategic Plan outlines this requirement in Policy 4.12. The policy states reporting letters are required for the following programs:
• Transit/Rail (LBT/Rail) • Local Streets Rehabilitation (LSR) • Local Streets Projects (LSP) • Bicycle/Pedestrian Projects (Bike/Ped)
If an agency fails to submit Measure M reporting letters by the deadline, the Strategic Plan states that the next fiscal year’s allocation or reimbursements for expenditures (in the case of Local Streets or Bike/Ped Projects) may be withheld until the reporting letter is received. Upon the suggestion of the auditor, governing bodies of any Measure M recipients delinquent in submitting annual reporting letters may be notified in writing.
The LSR program allows cities to carry over funds for up to three years in order to amass funds for larger projects. The program also requires that if an agency has chosen to carry over funds from previous fiscal year’s allocation, interest on the sum must be reported. Banked funds must be spent in the third year, or SCTA reserves the right to withhold the next year’s allocation until the jurisdiction’s balance is drawn down, as is outlined in the Strategic Plan, Policy 4.1. Several jurisdictions show a partial expenditure of funds, but are banking some portion of the balance for future expenditures.
All of the LSR reporting letters were received by the 9/16/18 deadline (9/15/18 fell on a Sunday, thus the deadline was extended to the following Monday). As of the writing of this staff report.
LBT program funds are distributed on a quarterly basis. All transit agencies receiving Measure M funding are required to submit an annual audit to accompany their reporting. Because the annual audits usually take some months to produce after the close of the fiscal year, they are not always complete by the reporting deadline of September 15, thus transit agencies are given until December 31 to submit the required audit. Reporting letters remain due on September 15. All transit agencies submitted their annual reporting letters.
6

All reporting letters for the LSP, Bike/Ped and Rail programs were submitted on time. Staff will also provide this summary to the SCTA Board of Directors.
Policy Impacts:
None, these procedures are consistent with the policy established in the Traffic Relief Act of Sonoma County, and the 2019 Strategic Plan.
Fiscal Impacts:
None
Staff Recommendation:
None, this is an information item only.
7

Sonoma County Transportation AuthorityMeasure M Appropriation/Invoice Status Report
FY 19/20
Project Sponsor Project NameMeasure M Program
Prior Apprp Balance
19/20 Programmed
19/20 Amount Apprp
Appropriation Date
Last Invoice Date
Balance Remaining Notes
Santa Rosa Hearn Avenue (Phase 3) LSP $611,075 $0 $0 7/10/17 6/7/19 $611,075 R/W Santa Rosa Hearn Avenue (Phase 3) LSP $945,512 $0 $0 7/10/17 6/7/19 $945,512 PSE Santa Rosa Fulton Road Impvrovements LSP $399,322 $0 $0 9/11/17 6/7/19 $399,322 PSE Santa Rosa Fulton Road Impvrovements LSP $29,705 $0 $0 9/11/17 6/7/19 $29,705 R/W SUP Sonoma County Airport Blvd Landscaping LSP $20,499 $0 $0 3/27/17 7/11/19 $20,499 CON SUPSonoma County Airport Blvd Landscaping LSP $333,583 $0 $0 3/27/17 7/11/19 $333,583 CON CAPSanta Rosa Santa Rosa Creek Trail Bike/Ped $45,615 $110,000 $0 6/11/18 6/7/19 $45,615 Not prog'd, bal not approp'd in 18/19Rohnert Park Access Across 101 Bike/Ped $247,011 $0 $0 6/11/2018 6/14/2019 $247,011Sonoma Co Reg Parks Central Sonoma Valley Trail Bike/Ped $20,000 $0 $0 7/9/2018 $20,000 Ext granted 5/20/19Sonoma Co Reg Parks Bodega Bay Trail Bike/Ped $0 $350,000 $0 Not prog'd, not approp'd in 18/19; push100 prog'd to 20/21Sonoma Co Reg Parks Sonoma Schellville Trail Bike/Ped $0 $200,000 $0 $100 prog'd, $100 not approp'd in 18/19Sonoma County TPW Arnold Drive Bike Lanes Bike/Ped $0 $250,000 $0Healdsburg Foss Creek Trail Bike/Ped $0 $1,840,000 $0 $1,062 not prog'd, not appop'd in 18/19SCBC BTW (SCBC) Bike/Ped $0 $13,000 $0 $0SMART NWPRR Bike/Ped $414,896 $0 $0 7/10/19 $140,868 PSE
$2,763,000 $0 $2,793,191 total remaining
projects that are approaching or past 6 months for invoicing or appropriation $453,494 Bike Ped Remaining
OR projects that are programmed for 19/20 that have not been
appropriated after 6 mos. $2,339,696 LSP Remaining
8

Inactive ObligationsLocal, State Administered/Locally Funded and Rail Projects
Updated on 09/17/2019
Project Number
Status Agency Action Required District County Agency Project Description Latest Date Earliest Authorization Date Latest Payment Date
Last Action Date
Program Codes
Total Cost Amount Obligations Amount Expenditure Amount
Unexpended Balance
5920147 Inactive Carry over project. Invoice under review by Caltrans. Monitor for progress.
4 SON Sonoma County SONOMA CO.(SONOMA MARIN AREA TRAIL TRANSIT AIRPORT STATION.), DEVELOP A NEW STATION AREA PLAN AND UPDATE OF 1984
06/22/2018 02/17/2015 06/22/2018 06/22/2018 M23E $395,347.00 $350,000.00 $145,584.17 $204,415.83
5920148 Inactive Carry over project. Invoice under review by Caltrans. Monitor for progress.
4 SON Sonoma County SPRINGS AREA PLAN IN SONOMA COUNTY., PDA PLANNING - SPRINGS AREA PLAN
06/22/2018 02/17/2015 06/22/2018 06/22/2018 M23E $508,303.00 $450,000.00 $245,732.19 $204,267.81
5022054 Inactive Carry over project. Invoice returned to agency. Contact DLAE.
4 SON Petaluma LAKEVILLE HWY(SR116) / PINE VIEW WAY SAFETY IMPROVEMENT
04/25/2018 11/27/2013 04/25/2018 04/25/2018 ZS30,MS30 $302,677.00 $272,400.00 $84,600.00 $187,800.00
5123015 Inactive Carry over project. Zero dollar invoice under review by Caltrans. Monitor for progress.
4 SON Sebastopol KEATING AVENUE FROM NORTH MAIN STREET TO PITT AVENUE, REHABILITATE ROADWAY (TC)
09/13/2016 03/26/2015 09/13/2016 09/13/2016 M23E $249,392.00 $249,392.00 $166,262.07 $83,129.93
1of19

DRAFT FFY2019-20 Annual Obligation Plan LSRPDWG Item 4E
Draft MTC FFY 2019-20 Annual Obligation PlanProject List Remaining Total
Balance ProgrammedCounty Local Agency TIP ID FMS ID Unique ID Program Fund Source FPN Phase Project Title Latest Action Latest Action Planned Planned Oblig/Alloc 100% 100%
Status Date Award Oblig Deadline $295,164,569 $295,164,569County Sponsor TIP ID FMS ID Unique ID Program Fund Source FPN Phase Project Title Latest Action Action Date Planned Award Planned Oblig Deadline Balance Total
September 10, 2019 Obligation
Santa Clara Santa Clara Co SCL170019 6749 STP-T5-OBAG2-CO-FAS OBAG2 STP -5937() CON Uvas Road Pavement Rehabilitation 30-Apr-2020 31-Jan-2020 $1,561,000 $1,561,000Santa Clara Santa Clara Co SCL170032 6747 STP-T5-OBAG2-CO OBAG2 STP -5937() CON McKean Rd Pavement Rehabilitation 31-Dec-2019 31-Jan-2020 $1,056,446 $1,056,446Santa Clara Saratoga SCL130026 6627 CMAQ-T5-OBAG2-CO OBAG2 CMAQ -5332() CON Prospect Rd Complete Streets 31-Jan-2020 $1,075,000 $1,075,000Santa Clara Sunnyvale SCL170059 6829 ATP-ST-T5-3-FED ATP-ST ATP-FED ATPL-5213() ENV Sunnyvale Safe Routes to School Imps CTC Allocated 31-Jan-2019 30-Jun-2020 $56,000 $56,000Santa Clara Sunnyvale SCL170059 6829 ATP-ST-T5-3-FED ATP-ST ATP-FED ATPL-5213() PSE Sunnyvale Safe Routes to School Imps CTC Ext Approved 15-May-2019 30-Jun-2020 $318,000 $318,000Santa Clara Sunnyvale SCL170059 6829 ATP-ST-T5-3-FED ATP-ST ATP-FED ATPL-5213() CON Sunnyvale Safe Routes to School Imps CTC Allocated 16-May-2019 31-Jan-2019 $6,000 $6,000Santa Clara Sunnyvale SCL170059 6829 ATP-ST-T5-3-FED ATP-ST ATP-FED ATPL-5213() CON Sunnyvale Safe Routes to School Imps 30-Jun-2020 $1,509,000 $1,509,000Santa Clara Sunnyvale SCL170017 6555 ATP-ST-T5-3-FED ATP-ST ATP-FED ATPL-5213(068) CON-CE Sunnyvale SNAIL Neighborhood Improvements 31-Jan-2020 $13,000 $13,000Santa Clara Sunnyvale SCL170017 6555 ATP-ST-T5-3-FED ATP-ST ATP-FED ATPL-5213(068) PSE Sunnyvale SNAIL Neighborhood Improvements 31-Jan-2020 $780,000 $780,000Santa Clara Sunnyvale SCL170022 6566 CMAQ-T5-OBAG2-CO OBAG2 CMAQ -5213() CON Java Dr Road Diet and Bike Lanes 31-Jan-2020 $286,000 $286,000Santa Clara VTA SCL090030 4197 RIP-T5-18-ST-SCL RTIP RTIP-FED -6264() ROW US 101 Express Lanes - Phase 4 - Civil 31-Jan-2019 $600,000 $600,000Santa Clara VTA SCL110002 4198 RIP-T5-18-ST-SCL RTIP RTIP-FED -6264() PSE US 101 Express Lanes - Phase 5 - Civil (APDE) 31-Jan-2019 $10,589,000 $10,589,000Santa Clara VTA SCL150001 6045 0521C RTIP RTIP-FED RPSTPL-6264() PSE I-680 Soundwalls - Capitol Expwy to Mueller Ave CTC Ext Approved 28-Jun-2018 31-Jan-2018 $731,000 $731,000Solano Fairfield SOL170006 6536 ATP-ST-T5-3-FED ATP-ST ATP-FED ATPL-5132() PSE East Tabor Tolenas SR2S Sidewalk Closure Gap 31-Jan-2020 $122,000 $122,000Solano Fairfield SOL170006 6536 ATP-ST-T5-3-FED ATP-ST ATP-FED ATPL-5132() ROW East Tabor Tolenas SR2S Sidewalk Closure Gap 31-Jan-2020 $138,000 $138,000Solano Fairfield SOL170006 6536 ATP-ST-T5-3-FED ATP-ST ATP-FED ATPL-5132() CON East Tabor Tolenas SR2S Sidewalk Closure Gap 31-Jan-2020 $1,440,000 $1,440,000Solano Rio Vista VAR170002 7008 HSIP9-04-026 HSIP 9 HSIP HSIPL-5099(015) PE Rio Vista: H9-04-026 Pedestrian Crossings RFA at CT-HQ 29-Aug-2019 30-Sep-2019 $44,500 $44,500Solano Solano County SOL090015 4582 CMAQ-T4-2-OBAG OBAG 1 CMAQ HPLUL-5923(122) PE Redwood-Fairgrounds Dr Interchange Imps 31-Jan-2019 $94,000 $94,000Solano Solano County SOL170016 6706 STP-T5-OBAG2-REG-PCA OBAG 2 STP -5923() PE Solano County Farm to Market Phase 3 31-Jan-2019 $132,000 $132,000Solano Solano County SOL170015 6719 STP-T5-OBAG2-CO-FAS OBAG2 STP -5923() CON Solano County Roadway Preservation 31-Jan-2020 $506,000 $506,000Solano Solano County VAR170002 6497 HSIP-T5-8 HSIP8 HSIP HSIPL-5923(118) CON Guardrail Repair and Installation HSIP8-04-028 AC Authorized 26-Aug-2019 31-Dec-2019 $435,900 $435,900Solano STA SOL110019 4992 CMAQ+T5-OBAG2-CO-SRTS OBAG2 CMAQ -6249() CON Solano Safe Routes to School Program 31-Jan-2020 $1,209,000 $1,209,000Solano Suisun City SOL170014 6807 STP-T5-OBAG2-CO OBAG2 STP -5032() CON New Railroad Avenue Pavement Rehabilitation 31-Jan-2020 $491,000 $491,000Solano Vacaville SOL170012 6684 STP-T5-OBAG2-CO OBAG 2 STP STPL-5094(068) CON Vacaville Pavement Preservation AC Authorized 3-May-2019 31-Jan-2019 $1,193,000 $1,193,000Solano Vallejo VAR170012 6398 23C0152 HBP-Seismic Bridge STPLZ-5030(056) CON Sacramento Street over US Navy RR PAST DUE PAST DUE 31-Oct-2018 $5,994,366 $5,994,366Solano Vallejo SOL190004 6916 STP-T5-OBAG2-CO OBAG2 STP -5030() CON Vallejo - Sacramento St Streetscape 31-Jan-2020 $681,000 $681,000Sonoma Rohnert Park SON170016 6610 STP-T5-OBAG2-CO OBAG2 STP -5379() CON Rohnert Park Various Streets Rehabilitation 31-Jan-2020 $1,035,000 $1,035,000Sonoma Sonoma County SON170010 6625 STP-T5-OBAG2-CA-FAS OBAG2 STP -5920(167) PE Sonoma County - River Road Pavement Rehab 31-Jan-2020 $100,000 $100,000Sonoma Sonoma County SON170013 6621 STP-T5-OBAG2-CO OBAG2 STP STPL-5920(164) PE Rehabilitation of Various Roads in Sonoma County 31-Jan-2020 $260,000 $260,000Sonoma Sonoma County SON170014 6624 CMAQ-T5-OBAG2-CO OBAG2 CMAQ -5920() PE Crocker Bridge Bike and Pedestrain Passage 31-Jan-2020 $664,000 $664,000Sonoma Sonoma County VAR170012 5253 20C0262 HBP-Seismic Bridge STPLZ-5920(059) CON Boyes Blvd over Sonoma Creek AC at CT-HQ 16-Apr-2019 1-Nov-2018 $4,488,471 $4,488,471Sonoma Sonoma County VAR170012 5242 20C0155 HBP-Seismic Bridge STPLZ-5920(137) CON Big Wohler Road over Russian River 1-Nov-2019 $3,718,260 $3,718,260Sonoma Windsor SON170001 6313 STP-T5-OBAG2-CO OBAG2 STP -5472() CON Windsor River Road/Windsor Road Intersection Imps Moved to FY20/21 3-Sep-2019 31-Jan-2020 $3,000,000 $3,000,000
$295,164,569 $295,164,569
10

HBP Local Bridge Seismic Retrofit Program LSRPDWG Item 03H.iv
MTC FY 2018-19 HBP Local Seismic Retrofit Delivery StatusProject List Remaining Obligation Programming Remaining
Balance HBP HBP BalanceCounty Local Agency TIP ID FMS ID Unique ID Program Fund Source FPN Phase Project Title Latest Action Latest Action Construction Oblig/Alloc 87% 100% 100% 87%
Status Date Begin Deadline $83,090,123 $12,265,258 $95,355,381 $83,090,123County Sponsor TIP ID FMS ID Unique ID Program Fund Source FPN Phase Project Title Latest Action Action Date Planned Con Deadline Balance Seismic Seismic Balance
Alameda Oakland VAR170012 5221 33C0215 HBP-Seismic Bridge STPLZ-5012(124) ROW Leimert Blvd over Sausal Creek Oblig due in FY 19 30-Jun-2021 1-Sep-2019 $250,000 $250,000 $250,000Alameda Oakland VAR170012 5221 33C0215 HBP-Seismic Bridge STPLZ-5012(124) CON Leimert Blvd over Sausal Creek Oblig due in FY 21 30-Jun-2021 1-Dec-2020 $7,500,000 $7,500,000 $7,500,000Contra Costa Contra Costa County VAR170012 -None- 28C0442 HBP-Seismic Bridge BRLS-5928(128) ROW Marsh Drive over Walnut Creek Channel Oblig due in FY 20 31-Aug-2021 1-Feb-2020 $212,472 $212,472 $212,472Contra Costa Contra Costa County VAR170012 -None- 28C0442 HBP-Seismic Bridge BRLS-5928(128) CON Marsh Drive over Walnut Creek Channel Oblig due in FY 21 31-Aug-2021 1-Feb-2021 $5,850,062 $5,850,062 $5,850,062Contra Costa Orinda VAR170012 5336 28C0331 HBP-Seismic Bridge STPLZ-5444(007) ROW Bear Creek Road over San Pablo Creek Oblig due in FY 20 31-Jan-2021 1-Mar-2020 $132,795 $132,795 $132,795Contra Costa Orinda VAR170012 5336 28C0331 HBP-Seismic Bridge STPLZ-5444(007) CON Bear Creek Road over San Pablo Creek Oblig due in FY 20 31-Jan-2021 1-Aug-2020 $132,795 $132,795 $132,795Contra Costa Orinda VAR170012 5335 28C0330 HBP-Seismic Bridge STPLZ-5444(010) ROW Miner Road over San Pablo Creek Oblig due in FY 20 30-Jun-2021 1-Apr-2020 $1,046,074 $1,046,074 $1,046,074Contra Costa Orinda VAR170012 5335 28C0330 HBP-Seismic Bridge STPLZ-5444(010) CON Miner Road over San Pablo Creek Oblig due in FY 21 30-Jun-2021 1-Jan-2021 $1,046,074 $1,046,074 $1,046,074San Francisco SFCTA SF-070027 3741 Multiple HBP-Seismic Bridge STPLZ-6272(046) PE PE for SFOBB Ramp Structures Obligated 29-Nov-2018 31-Mar-2020 30-Nov-2018 $0 $7,088,597 $7,088,597 $0San Francisco SFCTA SF-070027 3741 01CA0006 HBP-Seismic Bridge STPLZ-6272(029) CON Hillcrest Road West of Yerba Buena Island PAST DUE PAST DUE 1-Jan-2018 30-Jun-2017 $2,042,843 $2,042,843 $2,042,843San Francisco SFCTA SF-070027 3741 01CA0002 HBP-Seismic Bridge STPLZ-6272(026) ROW WB I-80 on ramp West of Yerba Buena Island Oblig due in FY 19 Past Due 31-Mar-2020 31-Mar-2019 $550,000 $550,000 $550,000San Francisco SFCTA SF-070027 3741 01CA0002 HBP-Seismic Bridge STPLZ-6272(026) CON WB I-80 on ramp West of Yerba Buena Island Oblig due in FY 20 31-Mar-2020 1-Oct-2019 $19,077,011 $19,077,011 $19,077,011San Francisco SFCTA SF-070027 3741 01CA0003 HBP-Seismic Bridge STPLZ-6272(027) ROW EB I-80 off ramp to TI Road (2 Bridges) Oblig due in FY 19 Past Due 31-Mar-2020 31-Mar-2019 $300,000 $300,000 $300,000San Francisco SFCTA SF-070027 3741 01CA0003 HBP-Seismic Bridge STPLZ-6272(027) CON EB I-80 off ramp to TI Road (2 Bridges) Oblig due in FY 20 31-Mar-2020 1-Oct-2019 $8,460,249 $8,460,249 $8,460,249San Francisco SFCTA SF-070027 3741 01CA0004 HBP-Seismic Bridge STPLZ-6272(028) CON Treasure Island Road West of SFOBB Oblig due in FY 20 31-Mar-2020 1-Oct-2019 $1,724,961 $1,724,961 $1,724,961San Francisco SFCTA SF-070027 3741 01CA0008 HBP-Seismic Bridge STPLZ-6272(032) CON Treasure Island road West of SFOBB Oblig due in FY 20 31-Mar-2020 1-Oct-2019 $505,169 $505,169 $505,169San Francisco SFCTA SF-070027 3741 01CA007A HBP-Seismic Bridge STPLZ-6272(030) CON Treasure Island Road West of SFOBB Oblig due in FY 20 31-Mar-2020 1-Oct-2019 $271,062 $271,062 $271,062San Francisco SFCTA SF-070027 3741 01CA007B HBP-Seismic Bridge STPLZ-6272(031) CON Treasure Isand Road west of SFOBB Oblig due in FY 20 31-Mar-2020 1-Oct-2019 $357,315 $357,315 $357,315San Francisco SFCTA SF-070027 3741 01CA0001 HBP-Seismic Bridge STPLZ-6272(024) CON WB SFOBB on ramp West of YBI Oblig due in FY 20 31-Mar-2020 1-Oct-2019 $369,634 $369,634 $369,634Solano Vallejo VAR170012 6398 23C0152 HBP-Seismic Bridge STPLZ-5030(056) ROW Sacramento Street over US Navy RR Obligated 3-Apr-2019 1-May-2019 1-May-2018 $0 $154,927 $154,927 $0Solano Vallejo VAR170012 6398 23C0152 HBP-Seismic Bridge STPLZ-5030(056) CON Sacramento Street over US Navy RR Oblig due in FY 19 Past Due 1-May-2019 31-Oct-2018 $5,994,366 $5,994,366 $5,994,366Sonoma Sonoma County VAR170012 5253 20C0262 HBP-Seismic Bridge STPLZ-5920(059) CON Boyes Blvd over Sonoma Creek AC Authorized 19-Apr-2019 30-Apr-2019 1-Nov-2018 $0 $5,021,734 $5,021,734 $0Sonoma Sonoma County VAR170012 -None- 20C0017 HBP-Seismic Bridge STPLZ-5920(092) ROW Watmaugh Road over Sonoma Creek Oblig due in FY 21 30-Sep-2021 1-Aug-2019 $4,559,295 $4,559,295 $4,559,295Sonoma Sonoma County VAR170012 -None- 20C0017 HBP-Seismic Bridge STPLZ-5920(092) CON Watmaugh Road over Sonoma Creek Oblig due in FY 21 30-Sep-2021 1-Apr-2021 $4,559,295 $4,559,295 $4,559,295Sonoma Sonoma County VAR170012 5251 20C0018 HBP-Seismic Bridge STPLZ-5920(135) ROW Monte Rio - Bohemian Hwy over Russian Oblig due in FY 22 31-May-2024 1-Jul-2022 $265,590 $265,590 $265,590Sonoma Sonoma County VAR170012 5251 20C0018 HBP-Seismic Bridge STPLZ-5920(135) CON Monte Rio - Bohemian Hwy over Russian Oblig due in FY 24 31-May-2024 1-Dec-2023 $14,164,800 $14,164,800 $14,164,800Sonoma Sonoma County VAR170012 5242 20C0155 HBP-Seismic Bridge STPLZ-5920(137) CON Big Wohler Road over Russian River Oblig due in FY 20 30-Apr-2020 1-Nov-2019 $3,718,260 $3,718,260 $3,718,260
$83,090,123 $12,265,258 $95,355,381 $83,090,123
September 5, 2019
11

03B_PMP_Certification_Status_Listing.xlsx LSRPDWG Item 3B
Page 3 of 3
PMP Certification ExpiredSeptember 5, 2019 Expiring within 60 days
Certified
County JurisdictionLast Major Inspectionᵜ Certified
P-TAPCycle
Certification Expiration Date
ᵜ "Last Major Inspection" is the basis for certification and is indicative of the date the field inspection was completed.
Santa Clara Mountain View* 8/5/2018 Yes 19 9/1/2020Santa Clara Palo Alto 12/31/2017 Yes 15 1/1/2020Santa Clara San Jose 11/30/2017 Yes 20 12/1/2019Santa Clara Santa Clara 9/8/2017 Yes 18 10/1/2019Santa Clara Santa Clara County 2/28/2018 Yes 20 3/1/2020Santa Clara Saratoga 9/30/2016 Pending 20 4/30/2020Santa Clara Sunnyvale* 1/31/2017 Yes 17 2/1/2020
Solano Benicia 8/31/2014 Yes 18 10/31/2019Solano Dixon 12/30/2017 Yes 18 1/1/2020Solano Fairfield 9/30/2018 Yes 19 10/1/2020Solano Rio Vista 10/31/2017 Yes 18 11/1/2019Solano Solano County 3/30/2019 No 19 4/1/2021Solano Suisun City 6/30/2018 Yes 19 7/1/2020Solano Vacaville 12/20/2018 Yes 19 1/1/2021Solano Vallejo 11/19/2018 Yes 19 12/1/2020
Sonoma Cloverdale 7/12/2018 Yes 19 8/1/2020Sonoma Cotati 8/31/2017 Pending 20 4/30/2020Sonoma Healdsburg 11/5/2018 Yes 19 12/1/2020Sonoma Petaluma 11/30/2017 Yes 20 12/1/2019Sonoma Rohnert Park 10/31/2017 Yes 20 11/1/2019Sonoma Santa Rosa 4/30/2018 Yes 16 5/1/2020Sonoma Sebastopol 7/20/2018 Yes 19 8/1/2020Sonoma Sonoma 10/30/2017 Yes 20 11/1/2019Sonoma Sonoma County 11/30/2017 Yes 18 12/1/2019Sonoma Windsor 9/30/2017 Pending 20 4/30/2020
Note: Updated report is posted monthly to:http://mtc.ca.gov/sites/default/files/PMP_Certification_Status_Listing.xlsx
(*) Indicates One-Year Extension. Note: PTAP awardees are ineligible for a one-year extension during the cycle awarded.
(^) Indicates previous P-TAP awardee, but hasn't fulfilled requirement; must submit certification prior to updating to current P-TAP award status.
PTAP-21 will be released October 10, 2019. Application due date is approximately 1 month later. PTAP requires a 20% local match.
12

_SPOC Certification Status Listing.xlsx LSRPDWG Item 3C
Page 3 of 3
SPOC Certification Not CertifiedSeptember 5, 2019 No Federal FHWA funds
Certified
County Jurisdiction Effective Certified SPOC First SPOC Last SPOC EmailSanta Clara San Jose 3/14/2019 Yes Adam Paranial [email protected] Clara Santa Clara 8/14/2019 Carol Shariat [email protected] Clara Santa Clara County 10/4/2017 Yes Ellen Talbo [email protected]
Santa ClaraSanta Clara County Roads &
Airports 3/9/2018 Yes Ellen Talbo [email protected] Clara Santa Clara VTA 9/27/2018 Yes Amin Surani [email protected] Clara Saratoga 9/20/2017 Yes Macedonio Nunez [email protected] Clara Sunnyvale 6/25/2019 Yes Nasser Fakih [email protected]
Solano Benicia 9/21/2017 Yes Nouae Vue [email protected] Dixon 7/19/2018 Yes Joe Leach [email protected] Fairfield 9/25/2017 Yes Diane Feinstein [email protected] Rio Vista 4/10/2019 Yes Robin Borre [email protected] Solano County 5/29/2018 Yes Matthew Tuggle [email protected] STA 9/20/2017 Yes Anthony Adams [email protected] Suisun City 2/22/2018 Yes Nick Lozano [email protected] Vacaville 9/21/2017 Yes Tracy Rideout [email protected] Vallejo 3/27/2018 Yes Carmen Cole [email protected]
Sonoma Cloverdale 9/21/2017 Yes Eric Janzen [email protected] Cotati 10/5/2017 Yes Craig Scott [email protected] Healdsburg 6/3/2018 Yes Clay Thistle [email protected] Petaluma 2/5/2018 Yes Jeff Stutsman [email protected] Rohnert Park 9/29/2017 Yes Eydie Tacata [email protected] Santa Rosa 9/26/2017 Yes Nancy Adams [email protected] Santa Rosa City Bus 6/4/2019 Yes Rachel Ede [email protected] SCTA 7/13/2017 Yes Seana Gause [email protected] Sebastopol 7/11/2017 Yes Henry Mikus [email protected] Sonoma 9/29/2017 Yes Katherine Wall [email protected] Sonoma County 4/13/2018 Yes Janice Thompson [email protected] Windsor 9/28/2017 Yes Alejandro Perez [email protected]
J:\COMMITTE\Partnership\Partnership PDWG\Federal Efficiencies Subcommittee\FES\SPOC\_SPOC Certification Status Listing.xlsx
Note: Updated report is posted monthly to:https://mtc.ca.gov/our-work/fund-invest/federal-funding/project-delivery
(*) Indicates a change
Mandatory SPOC Training at Caltrans District 04 Auditorium November 4, 2019 4 hours (with lunch break).Discussion will include: Caltrans roles and responsibilitiesSPOC roles and responsibilitiesReviewing SB-1 ProgramsOverview of Project Delivery and Best Practices by Phase Attendance is mandatory for each jurisdiction, but flexibility will be provided for those SPOCs unable to attend to send a proxy.
13

LSRPDWG Item 4B
TO: Local Streets & Roads Working Group DATE: September 12, 2019
FR: Sui Tan
RE: 2018 Regional Pavement Condition Summary Report – Final
MTC’s Regional Streets & Roads Program staff has completed the 2018 regional pavement condition summary report. The PCI numbers presented in the 2018 regional pavement condition summary report reflect the information contained in each jurisdiction’s StreetSaver® database. The 2018 PCI scores are weighted by pavement section area. Please be aware that the PCI scores are based on pavement conditions as of 12/31/2018. Reports generated for a different date may vary from what is shown in this report. 2018 Regional Pavement Condition Summary In 2018, there were 43,492 lane-miles of local streets and roads reported in the San Francisco Bay Area, an overall network increase of 118 lane-miles as compared to 2017. This increase was driven primarily by new sections being added to the StreetSaver® databases. The Bay Area’s average network pavement condition index (PCI) in 2018 was 68, out of a maximum possible of 100, while the three-year moving average PCI has maintained at 67. As shown in the following chart, Bay Area roads in “Excellent or Very Good” category is stable at 37 percent for 2017 and 2018. Notably, since 2006, the share of roads in the “Poor or Failed” and “At Risk” categories have decreased from 35 percent to 31 percent. This indicates that major efforts are being made around the Bay Area to preserve and improve roadways using best pavement management practices. This report does reflect some of the Senate Bill 1 funding which was approved in April 2017, however, the full impact was not measured as most road maintenance work was still ongoing during the reporting period. MTC’s goal is to provide information that accurately reflects current pavement conditions in the region. Any condition assessments or road repairs completed after 12/31/2018 are not included in this report and will be included in the 2019 Regional Pavement Condition Summary due next year. You will also find more information in the attachments related to the break-down of the Bay Area roadways by condition category, functional class, year-over-year comparison of pavement conditions, countywide comparison, and the jurisdiction ranking summary.
14

Metropolitan Transportation Commission September 12, 2019 Page 2
Regional Weighted Network PCI (Year over Year) Year 2010 2011 2012 2013 2014 2015 2016 2017 2018
Weighted PCI 66 66 66 66 66 67 67 67 68
34%
35%
33%
32%
31%
31%
32%
31%
34%
34%
37%
37%
31%
32%
34%
34%
35%
35%
34%
35%
34%
34%
32%
32%
10%
10%
11%
11%
11%
11%
10%
10%
10%
10%
9%
9%
25%
22%
21%
23%
23%
23%
23%
23%
22%
23%
22%
22%
0% 10% 20% 30% 40% 50% 60% 70% 80% 90% 100%
2006
2007
2008/09
2010
2011
2012
2013
2014
2015
2016
2017
2018
Pavement Conditions for Local Roadways, 2006-2018 (Lane Miles)
Excellent or Very Good Good or Fair At Risk Poor or Failed No Data
15

Metropolitan Transportation Commission September 12, 2019 Page 3 For more information, please contact Sui Tan at [email protected] , 415-778-5844. Attachment 1: 2018 Jurisdiction Ranking Summary
Lists jurisdictions with PCI scores in the Top and Bottom 10, Greatest Increase/Decrease, and Three-year moving averages.
Attachment 2: Bay Area 2018 PCI Scores Provides detailed information on individual jurisdiction PCI scores.
Attachment 3: Bay Area Countywide 2018 PCI Scores Provides regional and county by county comparison
16

Attachment 1 - FINAL
2018 Jurisdiction Ranking Summary
Year-over-Year RankingBest 2018 Worst 2018
Cupertino 85 Petaluma 44
Dublin 85 Pacifica 45
Palo Alto 85 Napa County 47
Woodside 83 Sebastopol 50
Clayton 82 Sonoma County 50
Daly City 82 Larkspur 52
El Cerrito 82 Vallejo 52
Brentwood 81 Benicia 53
Foster City 81 Millbrae 53
Solano County 81 Albany 54
Greatest Increase 2018 Greatest Decrease 2018
Mill Valley 13 Mountain View -9
Calistoga 10 East Palo Alto -8
Larkspur 8 Pacifica -6
Menlo Park 8 Pinole -4
Orinda 8 Sebastopol -4
Burlingame 7 Albany -3
Woodside 7 Belmont -3
Campbell 6 Half Moon Bay -3
Moraga 5 Martinez -3
Vacaville 5 Richmond -3
Rio Vista -3
Rohnert Park -3
San Leandro -3
3-Year Moving Average RankingBest 2018 Worst 2018
Dublin 86 Petaluma 45
Palo Alto 84 Larkspur 46
Clayton 84 Napa County 50
El Cerrito 83 Pacifica 50
Daly City 83 Sonoma County 50
Brentwood 82 Vallejo 52
Cupertino 81 Millbrae 53
Foster City 81 Benicia 54
Solano County 81 Sebastopol 54
Colma 80 Oakland 54
Union City 80 Cotati 54
Updated 2019-08-07
LSRPDWG Item 4b - Attachment 1
17

Attachment 2 - Bay Area Countywide 2018 PCI Scores - FINALCurrent Level of Service by County and Jurisdiction
2018 Annual PCI Score 3 YR Moving Average
Total Lane
Miles
Total
Centerline
Miles
% Poor or
Failed
%
Excellent
or Very
Good
Arterial Collector Residential Network
2017
Network
PCI
Change,
2017 to
2018
2016 2017 2018
Change
Los Gatos 230.0 108.7 21% 34% 70 70 68 69 66 3 67 66 67
Milpitas 298.8 128.6 11% 52% 74 74 75 75 77 -2 73 74 74
Monte Sereno 26.8 13.3 21% 21% 68 56 65 65 61 4 62 62 63
Morgan Hill 286.6 131.5 15% 37% 77 66 69 71 70 1 69 69 71
Mountain View 332.3 140.1 22% 18% 60 61 67 64 73 -9 71 72 71
Palo Alto 414.3 198.3 6% 76% 81 83 86 85 85 0 81 83 84
San Jose 4,317.3 1,957.9 23% 33% 77 73 61 66 67 -1 62 64 65
Santa Clara 606.1 249.4 4% 38% 77 71 75 75 76 -1 73 74 75
Santa Clara County 1,425.9 619.3 12% 16% 69 66 64 67 66 1 69 67 67
Saratoga 283.4 141.8 20% 42% 78 66 66 68 69 -1 68 69 70
Sunnyvale 638.1 260.9 2% 42% 78 72 75 76 76 0 76 76 76
Solano 3,599 1,670 22% 43% 72 69 66 68 67 1 66 67 67
Benicia 198.0 95.2 49% 22% 63 69 45 53 54 -1 56 55 54
Dixon 138.9 64.8 24% 30% 69 64 64 65 65 0 69 67 66
Fairfield 767.9 356.0 12% 42% 73 69 72 72 71 1 72 71 71
Rio Vista 45.6 23.0 34% 49% 73 69 56 62 65 -3 56 60 61
Solano County 925.6 460.1 3% 64% 80 82 80 81 81 0 80 81 81
Suisun City 153.5 76.7 29% 22% 66 62 55 60 62 -2 58 60 62
Vacaville 658.2 305.5 21% 28% 72 67 73 71 66 5 69 68 68
Vallejo 710.9 318.4 48% 25% 66 57 45 52 51 1 51 53 52
Sonoma 4,911 2,368 46% 25% 72 64 46 54 53 1 55 55 54
Cloverdale 64.7 32.0 38% 39% 57 57 60 59 57 2 61 59 58
Cotati 47.9 23.1 39% 26% 69 52 52 56 55 1 52 53 54
Healdsburg 94.1 45.3 27% 22% 57 66 63 62 60 2 61 62 61
Petaluma 395.8 177.5 55% 27% 58 37 40 44 46 -2 46 46 45
Rohnert Park 210.6 92.1 23% 41% 82 71 57 66 69 -3 71 71 69
Santa Rosa 1,125.9 508.6 32% 24% 66 63 59 61 59 2 60 60 60
Sebastopol 47.5 23.8 47% 17% 25 55 51 50 54 -4 58 56 54
Sonoma 68.2 33.8 12% 37% 74 76 69 72 74 -2 73 74 73
Page 4 of 5 18

Attachment 2 - Bay Area Countywide 2018 PCI Scores - FINALCurrent Level of Service by County and Jurisdiction
2018 Annual PCI Score 3 YR Moving Average
Total Lane
Miles
Total
Centerline
Miles
% Poor or
Failed
%
Excellent
or Very
Good
Arterial Collector Residential Network
2017
Network
PCI
Change,
2017 to
2018
2016 2017 2018
Change
Sonoma County 2,685.4 1,346.6 58% 21% 77 67 36 50 48 2 49 49 50
Windsor 170.7 85.2 5% 51% 71 71 79 76 78 -2 75 78 77
Bay Area 43,493 20,178 22% 37% 74 69 64 68 67 1 67 67 67
Updated 2019-08-07
Page 5 of 5 19

Attachment 3 - Bay Area Countywide 2018 PCI Scores - FINALCurrent Level of Service by County and Jurisdiction
2018 Annual PCI Score Change 3YR Moving Average
Total Lane
Miles
Total
Centerline
Miles
% Poor or
Failed
%
Excellent
or Very
Good
Arterial Collector Residential Network
2017
Network
PCI
Change,
2017 to
2018
2016 2017 2018
Alameda 8,191 3,645 23% 39% 75 67 64 68 67 1 68 68 68
Contra Costa 7,161 3,425 15% 39% 74 70 68 70 71 -1 70 70 70
Marin 2,054 1,035 25% 34% 70 65 65 66 66 0 65 66 66
Napa 1,515 744 45% 26% 71 59 52 56 58 -2 59 59 58
San Francisco 2,143 944 11% 52% 72 71 75 74 74 0 68 70 72
San Mateo 3,912 1,866 15% 42% 74 73 70 72 72 0 71 72 72
Santa Clara 10,007 4,481 16% 35% 75 71 67 70 70 0 68 68 69
Solano 3,599 1,670 22% 43% 72 69 66 68 67 1 66 67 67
Sonoma 4,911 2,368 46% 25% 72 64 46 54 53 1 55 55 54
Bay Area 43,493 20,178 22% 37% 74 69 64 68 67 1 66 67 67
Updated 2019-08-07
LSRPDWG Item 4b - Attachment 3
20

LSRPDWG Item 4C
TO: Joint Partnership Working Group DATE: September 12, 2019
FR: Theresa Romell
RE: Plan Bay Area 2050 Draft LSR Needs Assessment
The upcoming Sustainable Communities Strategy / Regional Transportation Plan (SCS/RTP), Plan Bay Area 2050 (PBA2050), will span 30 years from fiscal years 2021 through 2050. A required element of the SCS/RTP is the estimation of costs and available revenues for the preservation of the existing transportation system.
The information presented below is a preliminary draft estimate of the region’s local street and road pavement and non-pavement capital maintenance needs, and state and local revenues available to meet those needs. Operational (routine maintenance, cleaning, overhead, etc.) or expansion costs and the corresponding revenues needed to satisfy them are not included in the estimate of capital maintenance needs and revenues.
This information is being provided for your technical review in advance of being presented to the Commission (expected in November) The system preservation needs were calculated for two different “condition level” scenarios:
1.) Maintain Existing PCI – Local jurisdictions maintain the existing pavement condition index (PCI) and deferred maintenance costs continue to grow.
2.) State of Good Repair (SGR) – Pavement conditions reach a “best management practices” level within the first ten years of the analysis period, and then maintain that level for the duration of the Plan period. A best management practices condition level equates roughly to a low-to-mid 80s pavement condition index (PCI). Deferred maintenance is eliminated.
This memo outlines the draft results of the LS&R system preservation (pavement and non-pavement) needs scenario projections and the methods used in their calculation. A summary of the region’s system preservation needs, by county, is shown in Table 1. below.
21
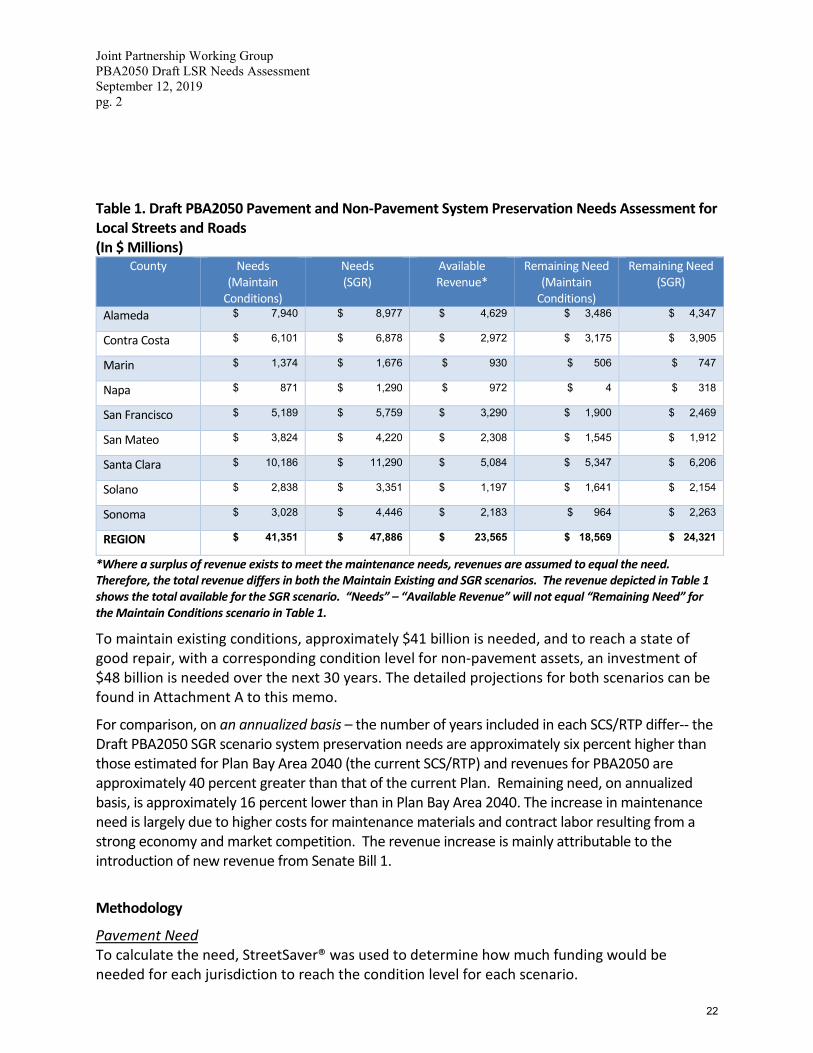
Joint Partnership Working Group PBA2050 Draft LSR Needs Assessment September 12, 2019 pg. 2
Table 1. Draft PBA2050 Pavement and Non-Pavement System Preservation Needs Assessment for Local Streets and Roads (In $ Millions)
County Needs (Maintain
Conditions)
Needs (SGR)
Available Revenue*
Remaining Need (Maintain
Conditions)
Remaining Need (SGR)
Alameda $ 7,940 $ 8,977 $ 4,629 $ 3,486 $ 4,347
Contra Costa $ 6,101 $ 6,878 $ 2,972 $ 3,175 $ 3,905
Marin $ 1,374 $ 1,676 $ 930 $ 506 $ 747
Napa $ 871 $ 1,290 $ 972 $ 4 $ 318
San Francisco $ 5,189 $ 5,759 $ 3,290 $ 1,900 $ 2,469
San Mateo $ 3,824 $ 4,220 $ 2,308 $ 1,545 $ 1,912
Santa Clara $ 10,186 $ 11,290 $ 5,084 $ 5,347 $ 6,206
Solano $ 2,838 $ 3,351 $ 1,197 $ 1,641 $ 2,154
Sonoma $ 3,028 $ 4,446 $ 2,183 $ 964 $ 2,263
REGION $ 41,351 $ 47,886 $ 23,565 $ 18,569 $ 24,321
*Where a surplus of revenue exists to meet the maintenance needs, revenues are assumed to equal the need. Therefore, the total revenue differs in both the Maintain Existing and SGR scenarios. The revenue depicted in Table 1 shows the total available for the SGR scenario. “Needs” – “Available Revenue” will not equal “Remaining Need” for the Maintain Conditions scenario in Table 1.
To maintain existing conditions, approximately $41 billion is needed, and to reach a state of good repair, with a corresponding condition level for non-pavement assets, an investment of $48 billion is needed over the next 30 years. The detailed projections for both scenarios can be found in Attachment A to this memo.
For comparison, on an annualized basis – the number of years included in each SCS/RTP differ-- the Draft PBA2050 SGR scenario system preservation needs are approximately six percent higher than those estimated for Plan Bay Area 2040 (the current SCS/RTP) and revenues for PBA2050 are approximately 40 percent greater than that of the current Plan. Remaining need, on annualized basis, is approximately 16 percent lower than in Plan Bay Area 2040. The increase in maintenance need is largely due to higher costs for maintenance materials and contract labor resulting from a strong economy and market competition. The revenue increase is mainly attributable to the introduction of new revenue from Senate Bill 1.
Methodology
Pavement Need To calculate the need, StreetSaver® was used to determine how much funding would be needed for each jurisdiction to reach the condition level for each scenario.
22

Joint Partnership Working Group PBA2050 Draft LSR Needs Assessment September 12, 2019 pg. 3 Average maintenance costs, a key input into the StreetSaver® model, were estimated by county, using information submitted by local jurisdictions to the 2018 California Local Street and Road Needs Assessment survey. Non-Pavement Need Non–Pavement needs include the capital maintenance of assets that are required for a functioning LS&R system. Primary examples of these assets include storm drains, sidewalks, curb & gutter, street lights, signs, and signals. To estimate the Non-Pavement needs on the LS&R system, MTC used a prediction model developed by Nichols Consulting Engineers (NCE) that uses information provided by local jurisdictions on non-pavement asset inventory and useful life to estimate long term costs to maintain non-pavement assets. NCE determined that replacement costs can be predicted by the inventory of two non-pavement assets - curb and gutter and streetlights. The total regional non-pavement asset replacement cost is then divided by the average useful life for each of the major non-pavement asset groups to estimate an annual preservation cost. The regional totals are then divided into city non-pavement need and county non-pavement need. The city need is distributed across all jurisdictions based on relative population share and the county need is distributed across the unincorporated jurisdictions based on total lane mileage. San Francisco was considered as a city only. The prediction model was updated with asset inventory and replacement cost information provided by local jurisdictions in responses to the 2018 California Local Street and Road Needs Assessment survey. Revenues
Information derived from the 2018 California Local Street and Roads Needs Assessment survey was used to determine revenues for Bay Area LS&R maintenance derived from local and county sources, as well as to determine the categorical split between capital maintenance and operations and new construction, by which jurisdictions expend revenues available for LS&R.
For the local and county generated revenue sources, an annual average was determined based on past, current and forecasted revenue data for each jurisdiction. The annual average was then grown over the 30-year period. The growth rate used for locally generated revenue was 2.2%. For agencies that submitted incomplete data, an average, countywide, per-mile revenue amount was calculated and applied to that jurisdiction’s total centerline mileage Based on a region-wide analysis of the average split between expenditures categories, it was assumed that for cities, 30% of revenues available for LS&R was used for operational expenses and five percent was used for expansion or “other” expenditures. This assumption was applied across all cities, except for San Francisco, for which it was assumed that 50% of revenue for LS&R would be used for operational expenses. For counties, it was determined that on average, 45% of revenues were used for operational expenses and five percent for expansion or “other” expenditures. This assumption was applied to all counties. The remainder of the funds, after deducting for operational
23

Joint Partnership Working Group PBA2050 Draft LSR Needs Assessment September 12, 2019 pg. 4 and expansion or “other” expenses was assumed to be available for capital maintenance. Due to the variability in the quality of the revenue data submitted, staff was unable to rely on a by-jurisdiction break-down of expenditure categories. While jurisdictions may spend more or less of their total LS&R available revenue on operational expenses, this split is largely a function of budgeting and can be adjusted year to year based on local priorities. It was further assumed that capital maintenance revenues applied to pavement and non-pavement needs are proportional to the capital maintenance needs in those categories for each jurisdiction. Projections of state gas tax subvention revenue were prepared by MTC staff. If you have questions or would like to provide feedback on this analysis, please feel free to contact me at (415) 778-6772 or [email protected] J:\COMMITTE\Partnership\Partnership Joint LSRPDWG\2019 Joint LSRPDWG\2019_Memos\04_Sep 12 2019 Packet\04c_PBA2050 Needs Assessment Memo.docx
24
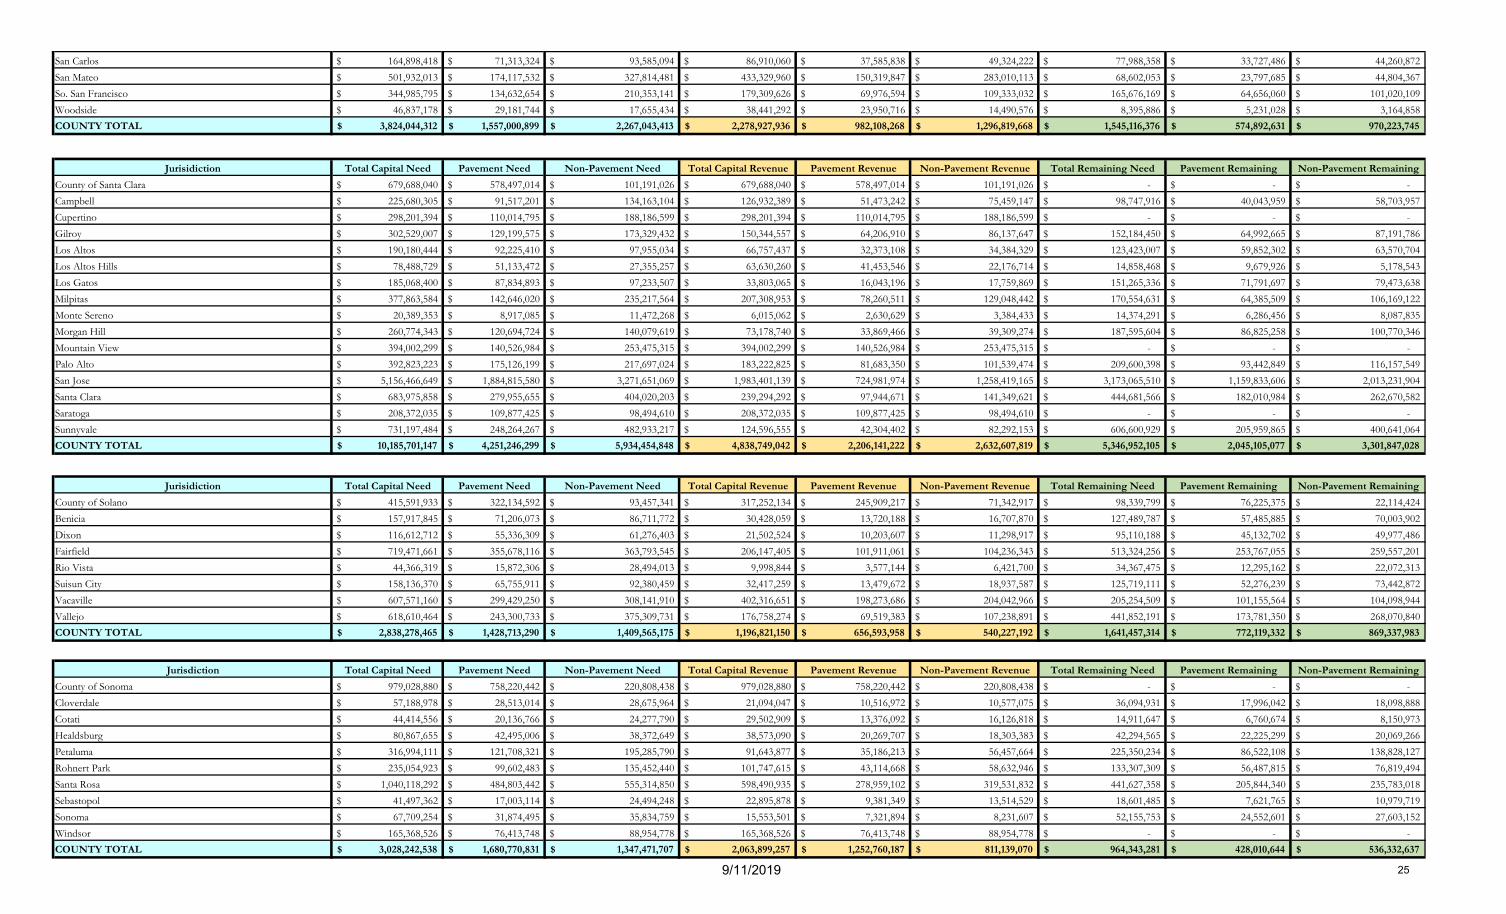
San Carlos 164,898,418$ 71,313,324$ 93,585,094$ 86,910,060$ 37,585,838$ 49,324,222$ 77,988,358$ 33,727,486$ 44,260,872$ San Mateo 501,932,013$ 174,117,532$ 327,814,481$ 433,329,960$ 150,319,847$ 283,010,113$ 68,602,053$ 23,797,685$ 44,804,367$ So. San Francisco 344,985,795$ 134,632,654$ 210,353,141$ 179,309,626$ 69,976,594$ 109,333,032$ 165,676,169$ 64,656,060$ 101,020,109$ Woodside 46,837,178$ 29,181,744$ 17,655,434$ 38,441,292$ 23,950,716$ 14,490,576$ 8,395,886$ 5,231,028$ 3,164,858$ COUNTY TOTAL 3,824,044,312$ 1,557,000,899$ 2,267,043,413$ 2,278,927,936$ 982,108,268$ 1,296,819,668$ 1,545,116,376$ 574,892,631$ 970,223,745$
Jurisidiction Total Capital Need Pavement Need Non-Pavement Need Total Capital Revenue Pavement Revenue Non-Pavement Revenue Total Remaining Need Pavement Remaining Non-Pavement RemainingCounty of Santa Clara 679,688,040$ 578,497,014$ 101,191,026$ 679,688,040$ 578,497,014$ 101,191,026$ -$ -$ -$ Campbell 225,680,305$ 91,517,201$ 134,163,104$ 126,932,389$ 51,473,242$ 75,459,147$ 98,747,916$ 40,043,959$ 58,703,957$ Cupertino 298,201,394$ 110,014,795$ 188,186,599$ 298,201,394$ 110,014,795$ 188,186,599$ -$ -$ -$ Gilroy 302,529,007$ 129,199,575$ 173,329,432$ 150,344,557$ 64,206,910$ 86,137,647$ 152,184,450$ 64,992,665$ 87,191,786$ Los Altos 190,180,444$ 92,225,410$ 97,955,034$ 66,757,437$ 32,373,108$ 34,384,329$ 123,423,007$ 59,852,302$ 63,570,704$ Los Altos Hills 78,488,729$ 51,133,472$ 27,355,257$ 63,630,260$ 41,453,546$ 22,176,714$ 14,858,468$ 9,679,926$ 5,178,543$ Los Gatos 185,068,400$ 87,834,893$ 97,233,507$ 33,803,065$ 16,043,196$ 17,759,869$ 151,265,336$ 71,791,697$ 79,473,638$ Milpitas 377,863,584$ 142,646,020$ 235,217,564$ 207,308,953$ 78,260,511$ 129,048,442$ 170,554,631$ 64,385,509$ 106,169,122$ Monte Sereno 20,389,353$ 8,917,085$ 11,472,268$ 6,015,062$ 2,630,629$ 3,384,433$ 14,374,291$ 6,286,456$ 8,087,835$ Morgan Hill 260,774,343$ 120,694,724$ 140,079,619$ 73,178,740$ 33,869,466$ 39,309,274$ 187,595,604$ 86,825,258$ 100,770,346$ Mountain View 394,002,299$ 140,526,984$ 253,475,315$ 394,002,299$ 140,526,984$ 253,475,315$ -$ -$ -$ Palo Alto 392,823,223$ 175,126,199$ 217,697,024$ 183,222,825$ 81,683,350$ 101,539,474$ 209,600,398$ 93,442,849$ 116,157,549$ San Jose 5,156,466,649$ 1,884,815,580$ 3,271,651,069$ 1,983,401,139$ 724,981,974$ 1,258,419,165$ 3,173,065,510$ 1,159,833,606$ 2,013,231,904$ Santa Clara 683,975,858$ 279,955,655$ 404,020,203$ 239,294,292$ 97,944,671$ 141,349,621$ 444,681,566$ 182,010,984$ 262,670,582$ Saratoga 208,372,035$ 109,877,425$ 98,494,610$ 208,372,035$ 109,877,425$ 98,494,610$ -$ -$ -$ Sunnyvale 731,197,484$ 248,264,267$ 482,933,217$ 124,596,555$ 42,304,402$ 82,292,153$ 606,600,929$ 205,959,865$ 400,641,064$ COUNTY TOTAL 10,185,701,147$ 4,251,246,299$ 5,934,454,848$ 4,838,749,042$ 2,206,141,222$ 2,632,607,819$ 5,346,952,105$ 2,045,105,077$ 3,301,847,028$
Jurisidiction Total Capital Need Pavement Need Non-Pavement Need Total Capital Revenue Pavement Revenue Non-Pavement Revenue Total Remaining Need Pavement Remaining Non-Pavement RemainingCounty of Solano 415,591,933$ 322,134,592$ 93,457,341$ 317,252,134$ 245,909,217$ 71,342,917$ 98,339,799$ 76,225,375$ 22,114,424$ Benicia 157,917,845$ 71,206,073$ 86,711,772$ 30,428,059$ 13,720,188$ 16,707,870$ 127,489,787$ 57,485,885$ 70,003,902$ Dixon 116,612,712$ 55,336,309$ 61,276,403$ 21,502,524$ 10,203,607$ 11,298,917$ 95,110,188$ 45,132,702$ 49,977,486$ Fairfield 719,471,661$ 355,678,116$ 363,793,545$ 206,147,405$ 101,911,061$ 104,236,343$ 513,324,256$ 253,767,055$ 259,557,201$ Rio Vista 44,366,319$ 15,872,306$ 28,494,013$ 9,998,844$ 3,577,144$ 6,421,700$ 34,367,475$ 12,295,162$ 22,072,313$ Suisun City 158,136,370$ 65,755,911$ 92,380,459$ 32,417,259$ 13,479,672$ 18,937,587$ 125,719,111$ 52,276,239$ 73,442,872$ Vacaville 607,571,160$ 299,429,250$ 308,141,910$ 402,316,651$ 198,273,686$ 204,042,966$ 205,254,509$ 101,155,564$ 104,098,944$ Vallejo 618,610,464$ 243,300,733$ 375,309,731$ 176,758,274$ 69,519,383$ 107,238,891$ 441,852,191$ 173,781,350$ 268,070,840$ COUNTY TOTAL 2,838,278,465$ 1,428,713,290$ 1,409,565,175$ 1,196,821,150$ 656,593,958$ 540,227,192$ 1,641,457,314$ 772,119,332$ 869,337,983$
Jurisdiction Total Capital Need Pavement Need Non-Pavement Need Total Capital Revenue Pavement Revenue Non-Pavement Revenue Total Remaining Need Pavement Remaining Non-Pavement RemainingCounty of Sonoma 979,028,880$ 758,220,442$ 220,808,438$ 979,028,880$ 758,220,442$ 220,808,438$ -$ -$ -$ Cloverdale 57,188,978$ 28,513,014$ 28,675,964$ 21,094,047$ 10,516,972$ 10,577,075$ 36,094,931$ 17,996,042$ 18,098,888$ Cotati 44,414,556$ 20,136,766$ 24,277,790$ 29,502,909$ 13,376,092$ 16,126,818$ 14,911,647$ 6,760,674$ 8,150,973$ Healdsburg 80,867,655$ 42,495,006$ 38,372,649$ 38,573,090$ 20,269,707$ 18,303,383$ 42,294,565$ 22,225,299$ 20,069,266$ Petaluma 316,994,111$ 121,708,321$ 195,285,790$ 91,643,877$ 35,186,213$ 56,457,664$ 225,350,234$ 86,522,108$ 138,828,127$ Rohnert Park 235,054,923$ 99,602,483$ 135,452,440$ 101,747,615$ 43,114,668$ 58,632,946$ 133,307,309$ 56,487,815$ 76,819,494$ Santa Rosa 1,040,118,292$ 484,803,442$ 555,314,850$ 598,490,935$ 278,959,102$ 319,531,832$ 441,627,358$ 205,844,340$ 235,783,018$ Sebastopol 41,497,362$ 17,003,114$ 24,494,248$ 22,895,878$ 9,381,349$ 13,514,529$ 18,601,485$ 7,621,765$ 10,979,719$ Sonoma 67,709,254$ 31,874,495$ 35,834,759$ 15,553,501$ 7,321,894$ 8,231,607$ 52,155,753$ 24,552,601$ 27,603,152$ Windsor 165,368,526$ 76,413,748$ 88,954,778$ 165,368,526$ 76,413,748$ 88,954,778$ -$ -$ -$ COUNTY TOTAL 3,028,242,538$ 1,680,770,831$ 1,347,471,707$ 2,063,899,257$ 1,252,760,187$ 811,139,070$ 964,343,281$ 428,010,644$ 536,332,637$
9/11/2019 25

Region Total Capital Need Pavement Need Non-Pavement Need Total Capital Revenue Pavement Revenue Non-Pavement Revenue Total Capital Shortfall Pavement Shortfall Non-Pavement ShortfallAlameda 7,939,550,698$ 3,134,846,621$ 4,804,704,077$ 4,453,410,529$ 1,779,600,381$ 2,673,810,148$ 3,486,140,169$ 1,355,246,240$ 2,130,893,929$ Contra Costa 6,100,738,727$ 2,935,430,690$ 3,165,308,037$ 2,925,260,511$ 1,552,647,154$ 1,372,613,357$ 3,175,478,217$ 1,382,783,536$ 1,792,694,680$ Marin 1,373,868,445$ 699,671,495$ 674,196,950$ 868,026,070$ 492,827,377$ 375,198,693$ 505,842,375$ 206,844,118$ 298,998,256$ Napa 871,222,966$ 440,514,684$ 430,708,282$ 867,379,971$ 439,144,077$ 428,235,894$ 3,842,995$ 1,370,607$ 2,472,388$ San Francisco 5,189,336,275$ 2,425,639,700$ 2,763,696,575$ 3,289,715,517$ 1,537,704,272$ 1,752,011,245$ 1,899,620,759$ 887,935,428$ 1,011,685,331$ San Mateo 3,824,044,312$ 1,557,000,899$ 2,267,043,413$ 2,278,927,936$ 982,108,268$ 1,296,819,668$ 1,545,116,376$ 574,892,631$ 970,223,745$ Santa Clara 10,185,701,147$ 4,251,246,299$ 5,934,454,848$ 4,838,749,042$ 2,206,141,222$ 2,632,607,819$ 5,346,952,105$ 2,045,105,077$ 3,301,847,028$ Solano 2,838,278,465$ 1,428,713,290$ 1,409,565,175$ 1,196,821,150$ 656,593,958$ 540,227,192$ 1,641,457,314$ 772,119,332$ 869,337,983$ Sonoma 3,028,242,538$ 1,680,770,831$ 1,347,471,707$ 2,063,899,257$ 1,252,760,187$ 811,139,070$ 964,343,281$ 428,010,644$ 536,332,637$ Total 41,350,983,572$ 18,553,834,509$ 22,797,149,063$ 22,782,189,983$ 10,899,526,896$ 11,882,663,086$ 18,568,793,590$ 7,654,307,613$ 10,914,485,977$
9/11/2019 26

Jurisidiction Total Capital Need Pavement Need Non-Pavement Need Total Capital Revenue Pavement Revenue Non-Pavement Revenue Total Remaining Need Pavement Remaining Non-Pavement RemainingCounty of Santa Clara 817,183,413$ 715,992,387$ 101,191,026$ 817,183,413$ 715,992,387$ 101,191,026$ -$ -$ -$ Campbell 245,032,168$ 110,869,064$ 134,163,104$ 126,932,389$ 57,432,766$ 69,499,623$ 118,099,779$ 53,436,298$ 64,663,481$ Cupertino 299,848,796$ 111,662,197$ 188,186,599$ 299,848,796$ 111,662,197$ 188,186,599$ -$ -$ -$ Gilroy 348,389,177$ 175,059,745$ 173,329,432$ 150,344,557$ 75,545,630$ 74,798,927$ 198,044,620$ 99,514,115$ 98,530,505$ Los Altos 204,333,542$ 106,378,508$ 97,955,034$ 66,757,437$ 34,754,728$ 32,002,710$ 137,576,105$ 71,623,780$ 65,952,324$ Los Altos Hills 66,281,685$ 38,926,428$ 27,355,257$ 63,630,260$ 37,369,279$ 26,260,982$ 2,651,424$ 1,557,149$ 1,094,275$ Los Gatos 217,424,633$ 120,191,126$ 97,233,507$ 33,803,065$ 18,686,146$ 15,116,919$ 183,621,569$ 101,504,980$ 82,116,588$ Milpitas 407,171,260$ 171,953,696$ 235,217,564$ 207,308,953$ 87,549,255$ 119,759,697$ 199,862,307$ 84,404,441$ 115,457,866$ Monte Sereno 23,188,766$ 11,716,498$ 11,472,268$ 6,015,062$ 3,039,207$ 2,975,855$ 17,173,704$ 8,677,291$ 8,496,413$ Morgan Hill 303,646,159$ 163,566,540$ 140,079,619$ 73,178,740$ 39,419,544$ 33,759,195$ 230,467,420$ 124,146,996$ 106,320,424$ Mountain View 453,638,355$ 200,163,040$ 253,475,315$ 453,638,355$ 200,163,040$ 253,475,315$ -$ -$ -$ Palo Alto 400,728,071$ 183,031,047$ 217,697,024$ 183,222,825$ 83,686,340$ 99,536,485$ 217,505,246$ 99,344,707$ 118,160,539$ San Jose 5,747,583,858$ 2,475,932,789$ 3,271,651,069$ 1,983,401,139$ 854,405,614$ 1,128,995,525$ 3,764,182,719$ 1,621,527,175$ 2,142,655,544$ Santa Clara 731,412,044$ 327,391,841$ 404,020,203$ 239,294,292$ 107,111,989$ 132,182,303$ 492,117,752$ 220,279,852$ 271,837,900$ Saratoga 254,802,572$ 156,307,962$ 98,494,610$ 254,802,572$ 156,307,962$ 98,494,610$ -$ -$ -$ Sunnyvale 769,454,997$ 286,521,780$ 482,933,217$ 124,596,555$ 46,395,991$ 78,200,565$ 644,858,442$ 240,125,789$ 404,732,652$ COUNTY TOTAL 11,290,119,496$ 5,355,664,648$ 5,934,454,848$ 5,083,958,410$ 2,629,522,074$ 2,454,436,336$ 6,206,161,086$ 2,726,142,574$ 3,480,018,512$
Jurisidiction Total Capital Need Pavement Need Non-Pavement Need Total Capital Revenue Pavement Revenue Non-Pavement Revenue Total Remaining Need Pavement Remaining Non-Pavement RemainingCounty of Solano 364,013,001$ 270,555,660$ 93,457,341$ 317,252,134$ 235,800,261$ 81,451,874$ 46,760,867$ 34,755,399$ 12,005,468$ Benicia 222,691,972$ 135,980,200$ 86,711,772$ 30,428,059$ 18,579,985$ 11,848,074$ 192,263,914$ 117,400,215$ 74,863,699$ Dixon 136,736,884$ 75,460,481$ 61,276,403$ 21,502,524$ 11,866,519$ 9,636,005$ 115,234,360$ 63,593,962$ 51,640,397$ Fairfield 812,601,265$ 448,807,720$ 363,793,545$ 206,147,405$ 113,857,252$ 92,290,153$ 606,453,860$ 334,950,468$ 271,503,392$ Rio Vista 53,976,913$ 25,482,900$ 28,494,013$ 9,998,844$ 4,720,528$ 5,278,316$ 43,978,069$ 20,762,372$ 23,215,698$ Suisun City 195,045,506$ 102,665,047$ 92,380,459$ 32,417,259$ 17,063,297$ 15,353,962$ 162,628,247$ 85,601,750$ 77,026,497$ Vacaville 687,182,050$ 379,040,140$ 308,141,910$ 402,316,651$ 221,912,315$ 180,404,336$ 284,865,399$ 157,127,825$ 127,737,574$ Vallejo 878,691,412$ 503,381,681$ 375,309,731$ 176,758,274$ 101,260,665$ 75,497,608$ 701,933,139$ 402,121,016$ 299,812,123$ COUNTY TOTAL 3,350,939,004$ 1,941,373,829$ 1,409,565,175$ 1,196,821,150$ 725,060,822$ 471,760,328$ 2,154,117,853$ 1,216,313,007$ 937,804,847$
Jurisdiction Total Capital Need Pavement Need Non-Pavement Need Total Capital Revenue Pavement Revenue Non-Pavement Revenue Total Remaining Need Pavement Remaining Non-Pavement RemainingCounty of Sonoma 1,821,979,357$ 1,601,170,919$ 220,808,438$ 1,096,291,598$ 963,430,358$ 132,861,239$ 725,687,759$ 637,740,561$ 87,947,199$ Cloverdale 78,065,471$ 49,389,507$ 28,675,964$ 21,094,047$ 13,345,524$ 7,748,523$ 56,971,424$ 36,043,983$ 20,927,440$ Cotati 58,611,554$ 34,333,764$ 24,277,790$ 29,502,909$ 17,282,359$ 12,220,550$ 29,108,645$ 17,051,405$ 12,057,240$ Healdsburg 99,716,384$ 61,343,735$ 38,372,649$ 38,573,090$ 23,729,475$ 14,843,615$ 61,143,294$ 37,614,260$ 23,529,034$ Petaluma 530,451,523$ 335,165,733$ 195,285,790$ 91,643,877$ 57,905,173$ 33,738,704$ 438,807,646$ 277,260,560$ 161,547,086$ Rohnert Park 276,949,502$ 141,497,062$ 135,452,440$ 101,747,615$ 51,984,165$ 49,763,450$ 175,201,888$ 89,512,897$ 85,688,990$ Santa Rosa 1,279,276,175$ 723,961,325$ 555,314,850$ 598,490,935$ 338,694,880$ 259,796,055$ 680,785,241$ 385,266,445$ 295,518,795$ Sebastopol 61,236,621$ 36,742,373$ 24,494,248$ 22,895,878$ 13,737,676$ 9,158,201$ 38,340,744$ 23,004,697$ 15,336,047$ Sonoma 72,563,553$ 36,728,794$ 35,834,759$ 15,553,501$ 7,872,566$ 7,680,935$ 57,010,052$ 28,856,228$ 28,153,824$ Windsor 167,216,779$ 78,262,001$ 88,954,778$ 167,216,779$ 78,262,001$ 88,954,778$ -$ -$ -$ COUNTY TOTAL 4,446,066,920$ 3,098,595,213$ 1,347,471,707$ 2,183,010,228$ 1,566,244,176$ 616,766,052$ 2,263,056,692$ 1,532,351,037$ 730,705,655$
9/11/2019 27

Region Total Capital Need Pavement Need Non-Pavement Need Total Capital Revenue Pavement Revenue Non-Pavement Revenue Total Remaining Need Pavement Remaining Non-Pavement RemainingAlameda 8,976,548,723$ 4,171,844,646$ 4,804,704,077$ 4,629,182,461$ 2,240,929,262$ 2,388,253,199$ 4,347,366,262$ 1,930,915,384$ 2,416,450,878$ Contra Costa 6,877,848,509$ 3,712,540,472$ 3,165,308,037$ 2,972,354,776$ 1,729,071,259$ 1,243,283,517$ 3,905,493,734$ 1,983,469,213$ 1,922,024,521$ Marin 1,676,354,684$ 1,002,157,734$ 674,196,950$ 929,668,841$ 603,028,204$ 326,640,637$ 746,685,843$ 399,129,530$ 347,556,313$ Napa 1,289,560,026$ 858,851,744$ 430,708,282$ 972,019,854$ 590,322,212$ 381,697,642$ 317,540,172$ 268,529,532$ 49,010,640$ San Francisco 5,758,877,536$ 2,995,180,961$ 2,763,696,575$ 3,289,715,517$ 1,710,974,616$ 1,578,740,900$ 2,469,162,020$ 1,284,206,345$ 1,184,955,675$ San Mateo 4,219,731,972$ 1,952,688,559$ 2,267,043,413$ 2,308,198,176$ 1,092,192,346$ 1,216,005,830$ 1,911,533,796$ 860,496,213$ 1,051,037,583$ Santa Clara 11,290,119,496$ 5,355,664,648$ 5,934,454,848$ 5,083,958,410$ 2,629,522,074$ 2,454,436,336$ 6,206,161,086$ 2,726,142,574$ 3,480,018,512$ Solano 3,350,939,004$ 1,941,373,829$ 1,409,565,175$ 1,196,821,150$ 725,060,822$ 471,760,328$ 2,154,117,853$ 1,216,313,007$ 937,804,847$ Sonoma 4,446,066,920$ 3,098,595,213$ 1,347,471,707$ 2,183,010,228$ 1,566,244,176$ 616,766,052$ 2,263,056,692$ 1,532,351,037$ 730,705,655$ Total 47,886,046,869$ 25,088,897,806$ 22,797,149,063$ 23,564,929,412$ 12,887,344,971$ 10,677,584,441$ 24,321,117,457$ 12,201,552,835$ 12,119,564,623$
9/11/2019 28