teaching)modelling)) and systemic)change
TRANSCRIPT

Teaching Modelling and
Systemic Change
Hugh Burkhardt Malcolm Swan
Shell Centre Centre for Research in Mathematics Education
University of Nottingham
ICTMA 2015

The Shell Centre ‘Brief’
Agreed with the University in 1976:
To work to improve the teaching and learning of mathematics
regionally, nationally and internationally
Impact remains a key focus of Shell Centre projects within a broad range of CRME research
2

Aiming to transform practice through design research:
• Analysing existing situations • Designing new processes, products and experiences for
teachers and learners • Articulating values and principles that underpin these
“designs” • Analysing “designs in action” • Revising and refining theories and designs in the light of these
experiences
• “Scaling up” designs for use by others.

Projects that have involved Modelling1981 The Real World and Mathematics
1981 -‐ 1986 Testing Strategic Skills Task exemplars, Boxes, WYTIWYG, Alignment, Gradual change
1987 -‐ 1989
Numeracy through Problem Solving Modelling in maths, materials-‐directed project work, group investigations, exams on projects, controlled transfer distance
1985 -‐ 1988 Extended tasks for GCSE Maths Materials supporting ‘coursework’/portfolios
1999 -‐ 2005 World Class Arena Test of PS across STEM, Expert tasks ~ high strategic/low technical demand, computer-‐based tasks, microworlds
2007 -‐ 2014 Bowland Maths Investigative video/software driven microworlds, PD package
2011 -‐ 2013 Promoting Inquiry in Mathematics and Science Professional Development for Inquiry-‐based Learning
2009 -‐ 2014 Mathematics Assessment Project Supporting formative assessment through materials
2014 -‐ 2015 Lessons for Mathematical Problem Solving (LeMaPS) Using Lesson Study for Professional Development in Modelling


Where to find the research products
http://map.mathshell.org http://mathshell.org

Our Current Team

Overview
• Modelling – what does it look like (11-‐16)? • A 1-‐lesson modelling task • A 4-‐lesson modelling task • A 3-‐week modelling project • Modelling subskills
• Supporting Modelling • Professional Development and Pedagogy • Assessment
• Why doesn’t Modelling happen in our classrooms? • Strategies for System Change

Modelling: what does it look like In secondary classrooms?

Problem in context
Mathematical problem
Mathematical results
Results in context
Formulate
Employ
Interpret
Evaluate
“The modelling cycle is a central aspect of the PISA conception of students as active problem solvers”
Mathematical literacy (PISA, 2015)

Formulating situations mathematically
• Identify accessible questions that may be tackled • Make suitable assumptions to simplify a situation • Represent a situation mathematically • Identify significant variables • Generate relationships between variables • Making connections with known problems or mathematical
concepts, facts, or procedures
Problem in context
Mathematical problemFormulate

Employing concepts, facts, procedures and reasoning
• Select appropriate mathematical concepts and procedures
• Plan an approach • Carry out the plan, monitoring progress and changing direction where necessary.
Mathematical problem
Mathematical results
Employ

Interpreting and evaluating
• interpreting results in the real world context; • evaluating the reasonableness of a
mathematical solution in the context; • explaining why a result or conclusion does,
or does not, make sense in the context; • identifying and critiquing the limits of the
model.
Problem in context
Mathematical results
Results in context
Interpret
Evaluate

A single lesson modelling task
from Bowland Maths
Quantity
http://www.bowlandmaths.org.uk

There are about 60 million people in the UK.
About how many school teachers do we need?
How many teachers?


What were the students doing?
Identifying significant variables and making assumptions:Size of population 60,000,000 p How long do you go to school 12 years t Average lifespan 80 years n Size of class 25 c Deriving relationships and facts: Fraction of population at school 1/8 t ÷ n School population 7,500,000 p (t ÷ n) Number of teachers 300,000 p (t ÷ n) ÷ c
In spite of errors, formulating processes are evident.

A 4-‐lesson modelling task
from Bowland Maths
Data Handling
http://www.bowlandmaths.org.uk

http://www.bbc.co.uk/news/uk-‐15975720
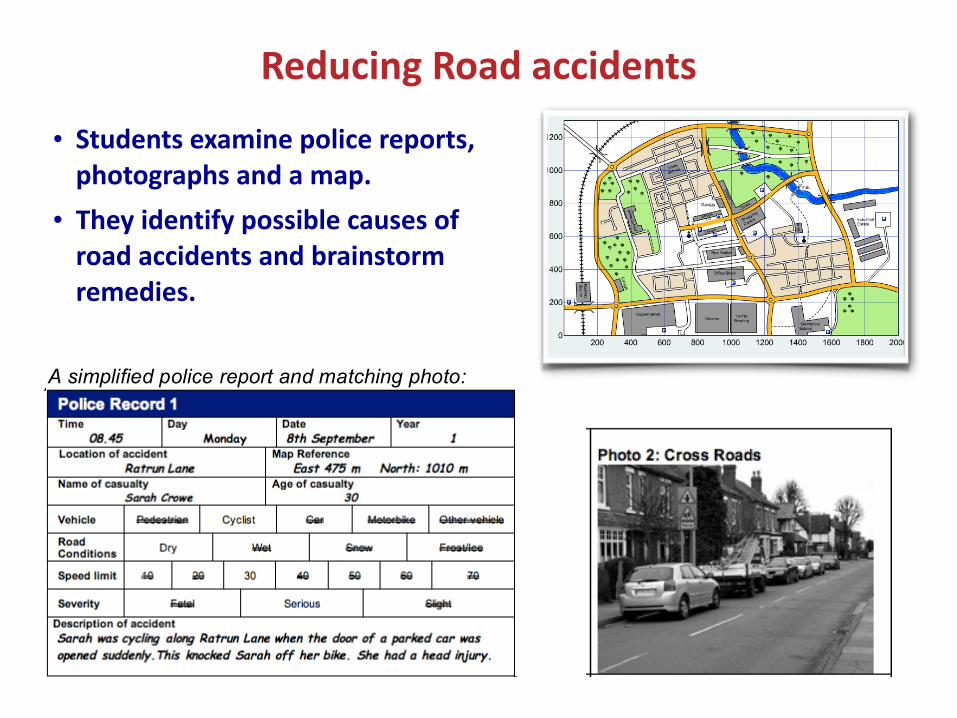
A simplified police report and matching photo:
Reducing Road accidents
• Students examine police reports, photographs and a map.
• They identify possible causes of road accidents and brainstorm remedies.

Employing statistical representations
• Students are given a computer database of casualty reports.
• Students explore the data and try to find patterns in it:
• in accident locations, times, weather conditions, vehicle usage and so on.


Preparing a caseEach group of students is allocated a budget of £100,000 to spend on road improvements.


Sample student report
The problems we have found are that outside the school there are a number of accidents to cyclist leaving school. To sort out this problem we are going to put in 500 metres of cycle lanes and tracks costing £30,000 out of our £100,000. We could also add 8 road humps costing £8,000 To help the road humps we would need 2 traffic island and pedestrians refuge costing £6,000. We should get 2 sets of pelican crossing costing £36,000 coming to a total cost of £80,000 this should reduce the accident rate by half. Hopefully helping save pupils lives on bikes every year.
(Student work)

Modelling with Data
Formulating • Identify specific questions: “What is relationship between number of accidents
and ...?” • Make suitable assumptions: “Let’s assume that the accidents are due to ….” • Represent mathematically: “Which representation best shows … ?” • Identify significant variables: “Number of fatal accidents, time of day, age, weather..” • Generate relationships: “Older people seem to have fewer accidents.”
Employing • Select and use appropriate mathematics:
“How long is this road? What will a cycle lane cost” • Make and carry out a plan, monitor progress
“Let’s find three big causes and tackle them.” Interpreting and Evaluating
• Interpreting results: “About how many lives will this plan save?” • Evaluating the solution: “Is John’s plan convincing?”
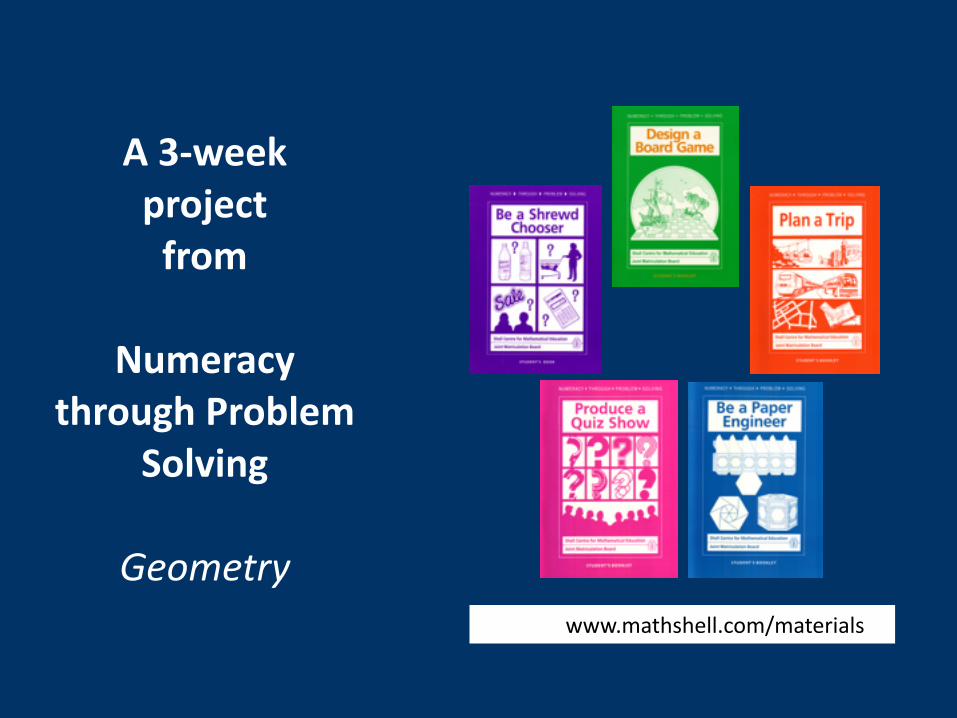
A 3-‐week project from
Numeracy through Problem
Solving
Geometryhttp://www.mathshell.com/materials

Numeracy through problem solving (1987-‐9)
• Rationale: • The teaching, learning and
assessment of numeracy through solving real problems
• Students as designers, planners, decision-‐makers.
• Students put their designs and plans into action.
• Teaching time: • Each module:
10-‐20 hours over 3-‐6 weeks. • Certification at 3 levels:
• Basic; Standard; Extension • Teacher assessed
+ written exam papers at higher levels.

• Design a Board Game • Geometry, probability
• Plan a Trip • Money, time, distance
• Be a Shrewd Chooser • Money, data handling,
• Be a Paper Engineer • 3D geometry, algebra
• Produce a Quiz Show • Scheduling, fairness
Numeracy through problem solving (1987-‐9)

Numeracy through Problem Solving
Number Algebra Shape and Space Handling data
Design a Board Game *** *
Be a Paper Engineer * ***Plan a Trip *** * *
Produce a Quiz show *** * *
Be a Shrewd Chooser * * ***

Mathematics through Problem Solving
Number Algebra Shape and Space Handling data
Design a Board Game *** *
Be a Paper Engineer * ***Plan a Trip *** * *
Produce a Quiz show *** * *
Be a Shrewd Chooser * * ***
Patterns and Numbers * ***
Functions and Graphs ***

Each module has 4 stages• Stage 1: Looking at existing examples
• Students analyse existing products or processes and critique them
• Students identify criteria/ structures for successful products
• Stage 2: Planning an approach • Students brainstorm ideas, select one to work on, study
the techniques they need and plan their work. • Stage 3: Carrying out the approach
• Students carry out their plan, make a prototype. • Stage 4: Presenting and evaluating the outcomes
• Students make/enact the product/process. • Students test and evaluate each others’ work.

Stage 1: Looking at examples• Students, share the work of making 30 boxes, envelopes,
pop-‐up cards. • They classify them according to their structure. • They bring in outside examples from home as well.

Stage 2: Exploring techniques• Students select a type of box or card they are interested in and explore the
mathematical principles involved in more depth. • They tackle a series of investigations and challenges and write up their
findings.

Stage 2: Exploring techniques
Which of these cards will work properly? How can you tell?

a+b+c=d+e
b=d
b<a
c+d<e
Stage 2: Exploring techniques
Which of these cards will work properly? How can you tell?

Stage 2: Exploring techniques
• If this card is to work properly, what can you say about:
• the directions of the fold lines; • the angles between the fold
lines?

Stage 2: Exploring techniques

Stage 3: Making your own original• Students brainstorm ideas for their own product. • They then each make a rough version, followed by a final version

Stage 4: Going into production• Students devise step-‐by-‐step instructions for making their product. • Students produce and test their instructions, by asking someone else to
follow them.

Modelling with GeometryFormulating
• Identify specific questions: “How can I make a card that does this..?” • Make simplified drawings: “Let’s study its structure…” • Represent mathematically: “How can we draw this 3D shape in 2D … ?” • Identify significant variables: “Which lengths / angles are important here? ..” • Generate relationships: “How does this length depend on this one?”
Employing
• Make & carry out a plan “Can we draw before making cuts?” • Select appropriate maths: “Can we use the principles we discovered?
Interpreting and Evaluating
• Interpreting results: “Can you interpret John’s instructions for making it?” • Evaluating the solution: “How can you improve John’s design?”

Issues that led to lack of use
• Teacher expectations • Teachers found that it took them outside what they understood to be
Mathematics. • Demand on teachers
• 5 x 10-‐20 hours was too much for many teachers. • Pedagogy was so different to what they had been used to.
• Teachers tended to use it mainly with ‘low attainers’ • The roots of the scheme in ‘numeracy’, together with its emphasis on
practical activity made some teachers reluctant to use it with more able students.
• Teachers used it for cross curricular work


New role for the teacher
Transmission • Maths:
body of knowledge to cover • Learning:
individual listening and imitating • Teaching:
linear explaining
Discovery • Maths:
students create maths • Learning:
individual exploration and reflection • Teaching:
provide stimulating environment to explore, sequences activities and facilitates.
Collaborative • Maths:
teacher and students co-‐create maths • Learning:
collaborative learning through discussion • Teaching:
challenges, non-‐linear dialogue exploring meanings and connections.

Mathematics Assessment Project
100 sample lessons + PD Support Grades 6, 7, 8 and High School

Formative assessment = Adaptive teaching
Students and teachers Using evidence of learning To adapt teaching and learning To meet immediate needs Minute-‐to-‐minute and day-‐by-‐day
(Thompson and Wiliam, 2007)

Establishing the purpose of the lesson
Modelling processesConcept development
Mathematical topic
Illustrative Applications
Choose appropriate mathematical tools
Practical situation

Cats and Kittens
Is this figure of 2000 realistic ? Length of
pregnancy
About 2 months
Age at which a
female cat gets
pregnant
About 4 months.
Number of kittens in a
litter
Usually 4 to 6
Age at which a
female cat no longer
has kittens
About 10 years
Average number of
litters a female cat can have in
one year
3

Before the lesson…
• Problem presented to students • Students tackle the problem unaided • Teacher assesses student work and prepares qualitative feedback

Sample student work

Issue Suggested questions and prompts
Has difficulty starting • Can you describe what happens during first five months?
Does not develop suitable representation
• Can you make a diagram or table to show what is happening?
Work is unsystematic • Could you start by just looking at the litters from the first cat? What would you do after that?
Develops a partial model • Do you think the first litter of kittens will have time to grow and have litters of their own? What about their kittens?
Does not make clear or reasonable assumptions
• What assumptions have you made? Are all your kittens are born at the beginning of the year?
Makes a successful attempt • How could you check this using a different method?

Typical Lesson Structure
1. Introduction • Teacher re-‐introduces the main task for the lesson. Students respond to
the prepared questions. 2. Group work: Comparing strategic approaches
• Students discuss the work of each individual, then produce a poster showing a joint solution. This promotes peer assessment.
3. Inter-‐group discussion • Groups compare approaches and justify their own.


Students may not choose powerful approaches.
But:
• If we tell them to try a particular approach, opportunities for decision-‐making are taken away from the student. The problem solving lesson becomes an exercise in imitating a method.
• So how can we introduce more powerful approaches, without also removing student decision-‐making?

Typical Lesson Structure
1. Introduction • Teacher re-‐introduces the main task for the lesson. Students respond to
the prepared questions. 2. Group work: Comparing strategic approaches
• Students discuss the work of each individual, then produce a poster showing a joint solution. This promotes peer assessment.
3. Inter-‐group discussion • Groups compare approaches and justify their own.
4. Group work: Critiquing pre-‐prepared sample student work • Students discuss approaches they may not have considered

Sample student work: Alice
• What assumptions has Alice made? • What has Alice forgotten?

Sample student work: Wayne
• What assumptions has Wayne made?
• What has Wayne forgotten?

Possible uses of “sample student work”
• To encourage a student that is stuck in one line of thinking to consider others
• To enable students to make connections • To compare alternative representations • To compare hidden assumptions and their effect • To encourage metacognitive behavior • To draw attention to common errors • To encourage criticality without fear of criticism • To become more aware of valued criteria for
assessment

Typical Lesson Structure
1. Introduction • Teacher re-‐introduces the main task for the lesson. Students respond to the
prepared questions. 2. Group work: Comparing strategic approaches
• Students discuss the work of each individual, then produce a poster showing a joint solution. This promotes peer assessment.
3. Inter-‐group discussion • Groups compare approaches and justify their own.
4. Group work: Critiquing pre-‐prepared sample student work • Students discuss approaches they may not have considered
5. Group work: Refining solutions • Students improve their solutions to the problem
6. Whole class discussion: a review of learning • Discussion of processes; implications of assumptions, alternative representations

Alternative forms of PD
• “Training” models • Transmission of information by an ‘expert’. • Useful mainly for raising awareness of an initiative, but may feel alien
to teachers. • “Experiential course” models
• Courses mediated by a provider, that offer teachers opportunities to explore ideas in their own classrooms and report back. May be accredited.
• “Embedded” professional learning communities • Teachers take over responsibility for setting their own research goals
and collaboratively and systematically study them in their own classrooms. This may be informed by outside support from materials and/or invited ‘experts’.

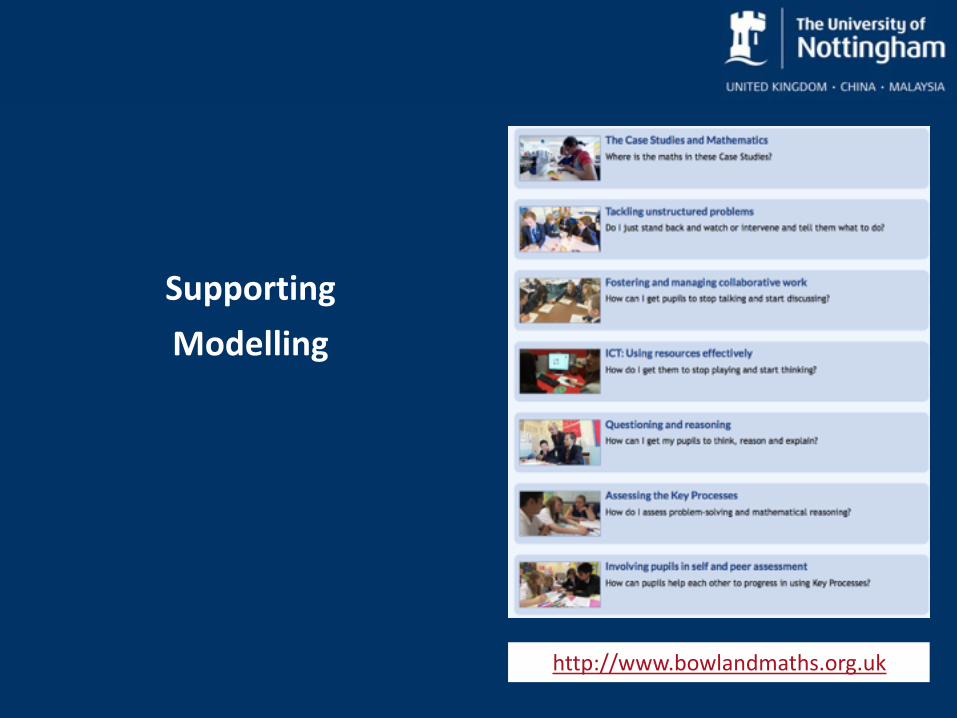
Bowland Professional Development Modules
The projects and Mathematics • Where is the maths?
Tackling unstructured problems • Do I stand back or intervene and tell them what to do?
Fostering and managing collaborative work • How can I get them to stop talking and start discussing?
ICT: Using resources effectively • How can I get them to stop playing and start thinking?
Questioning and reasoning • How can we ask questions that improve thinking and reasoning?
Assessing modelling processes • How do I assess progress?
Involving students in self and peer assessment • How can students help each other to progress?

Professional Development Modules
Introductory session: • Teachers work on problems, discuss pedagogical challenges they present, watch video of other teachers using these problems and plan lessons.
Into the classroom: • Teacher all teach the planned lessons.
Follow-‐up session: • Teachers describe and reflect on what happened, discuss video extracts, and plan strategies for future lessons.

The circles show old trees
The triangles show young trees
Think of a method you could use to estimate the number of trees of each type. Explain the method fully Use your method to estimate the number of old trees and young trees
Summative Assessment tasks: Counting Trees

Formulate Employ Interpret and evaluate
Incorrect assumptions. Assumes equal numbers of old/young trees.
Uses inappropriate method. Attempts to count all trees.
Multiplies trees in one row by trees in one column.
Ignores gaps / entire rows.
Does not consider reasonableness or check answer.
Assumes different numbers of old/young trees.
Uses sampling, but sample is unrepresentative or too small.
Attempts to count trees systematically.
E.g. Multiplies trees in one row by number of rows.
Makes an estimate.
Answer is unreasonable due to method.
Checks answer by repeating method.
Chooses appropriate sampling method.
Follows chosen method mostly accurately.
Uses proportion to obtain an estimate.
Checks answer using a different sample.
Considers whether different answers vary within an acceptable degree of accuracy.
Progression
Progression Grids

Examples of Task Types
Plan and organise • Find optimum solution subject to constraints.
Design and make • Design an artefact or procedure and test it
Model and explain • Invent, interpret, explain models.
Explore and discover • Find relationships, make predictions
Interpret and translate • Deduce information, move between representations of data
Evaluate and improve • Review and improve an argument, a plan, an artefact

Plan and Organize
Airplane turn-‐round How quickly could they do it?

Design and Make a Party Invitation
Show where you would put the cut and fold lines to make the pop-up card shown here.

Model and explain
• Babies must never be left in locked cars on hot days. They quickly dehydrate.
• Can you explain why toddlers dehydrate more rapidly than adults?

Model and Explain
12 miles traffic jam on a two-‐lane freeway • How many cars?
2-‐second reaction time • How long to clear?

Explore and discover
How does the strength of a plank bridge depend on its dimensions?

Explore and discover
Students control variables…

Evaluate and Improve
Here is a plan for a cycling trip to Chatsworth.
Identify the mistakes in the plan and correct them.
Meet at Loughborough station at 7.23 am. Buy tickets and then catch the train to Derby. This arrives at 7.51 am.
At Derby, catch the 8.20 am train to Cromford. This arrives at 8.41 am.
Here are the instructions for getting to the Cycle Hire centre:
“Turn left as you come out of Cromford station, walk along by the river and down Mill road. Cross over the A6. Walk up Cromford hill for about 1/2 mile and you will see..

Evaluate and Improve
Snakes and Ladders Game: Toss a coin • Heads: move 2 spaces • Tails: move 1 space
1. Find and describe design faults
2. Now design a better version

Problem Solving Examination Schemes (1987-‐95)
JMB Numeracy Certificate • Coursework • Basic • Standard and Extension level certificates
NEA Syll. D Limited Grade Numeracy GCSE • Grades E, F, G available only. • 50% coursework • 25% module exams spread over two years • 25% end of course exam.
NEAB Syll. C Full Grade Mathematics GCSE • Grades A-‐G available
Three tiers of demand (P, Q, R) • 20% coursework • 30% module exams spread over two years • 50% end of course exam.
Then… Government decided that every awarding body could only offer two GCSE syllabuses … so it all disappeared!
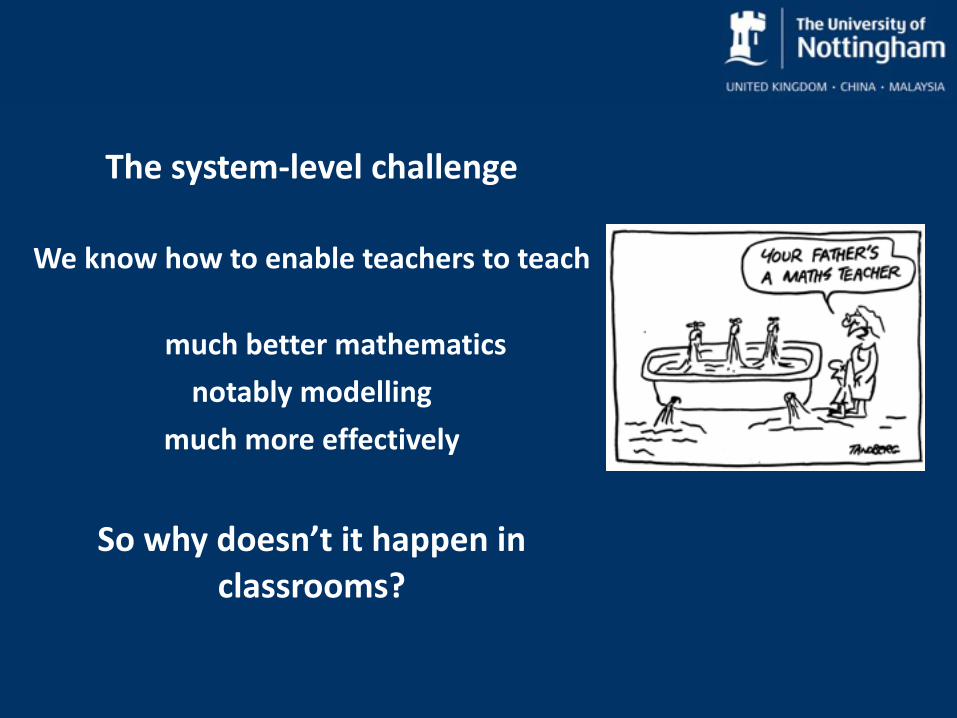
The system-‐level challenge
We know how to enable teachers to teach
much better mathematics notably modelling
much more effectively
So why doesn’t it happen in classrooms?

The Systemic Problem
Policy initiatives are: • often misguided • usually badly designed • outcomes far from the policy intentions
Mistakes in design lead to unintended consequences that are: • not only predictable • often predicted • usually avoidable

The Big Picture
In maths, modelling is seen as important but: • Education systems – are complex • Different levels have different pressures/priorities:
• Politicians – stay in power, avoid negatives • Superintendents, Principals – management urgencies • Teachers – many pressures and needs, poor support • Parents …..
• Making a change positive for all is a challenge • Politicians’ world – and world view dominate Improvement challenges are underestimated Potential contribution of good “engineering” ignored
Models of Change: very brief!
• No established model, but we know a lot about it • Difficult, all key constituencies have to move • Needs incentives + pressure + support • Alignment is vital • Issues:
• Big bang v gradual • Ambition v robustness • Arranging piloting • Engines for improvement
• Strategic design is vital

This model of change was both successful and popular with all involved. Key features: • Gradual change
• one seriously new task-‐type a year in 16+ exam ~ 5% of 2-‐year syllabus ~ 3 weeks teaching
• Box of support containing: • 5 exemplar exam tasks, illustrating variety to be expected • well-‐engineered supportive teaching materials • DIY PD kit for use by teachers
• Outcomes: • Kids learned, and enjoyed the new stuff – teachers too*
* The model died, incidentally, through a re-‐organisation
Box Model for Change

Strategic design
“Those aspects of design that relate to the interaction of the product with the system it aims to serve” www.educationaldesigner.org issue 3
• Poor strategic design is the main source of: • low impact • unintended consequences
• Does this test assess the intended curriculum in a balance way? • Does it encourage good teaching?” • If not, point it out – and push for better tests

Strategic design: testing disasters
1. The “tests are just measurement” fallacy • In fact they dominate teaching and learning
2. Accepting cheap limited “proxy tests”: • Multiple choice, computer adaptive hold standards down
3. Criterion-‐based testing drive down standards • They force you to test the bits separately

Good engineering methodology
• Standard engineering: research > design > development > robust product
• Design principles for these purposes • Create designs, from research insights & prior designs • Draft designs for comment • Draft version for trialing (~ piloting, field testing) • Rich and detailed feedback from observers • Revision based on evidence • Iterate until outcomes match goals
• Release to the field, monitor feedback

Changing policy making
• Not easy -‐ work with policy makers • Treat policy initiatives as serious design and engineering problems: • Models of change • Strategic design • Good detailed design and engineering
• Hasten slowly – but with short-‐term rewards • Use design expertise • Reshape the research enterprise

Research Strategy: a design challenge for the community
How well do we, the research community, serve: • Ourselves? • The education system as a whole?
• Students? • Teachers? • Support? • Policy makers?
How could we do (much) better?

To be a research-‐based field of practice:
What is needed? How do we score? Key elements:
• A body of generally accepted knowledge • A system for turning research insights into
effective tools and processes, with rich evaluative formative feedback
Why is education not like this?

Research in Education
Three research traditions: • Humanities
• Critical analysis > Plausible insights • No empirical testing, so can cover a lot of ground
Treated as opinion, and politicians have opinions too. Still, alas, has most influence on policy – but not a lot.
• Science • Empirical testing of hypotheses > Insights • Mostly very small scale > limited evidence
• Engineering • Impact focus > Research + Design + Development
> Improved tools, processes • Specific reproducible (= researchable) tools and
treatments

3-‐D model of research studies
Alan Schoenfeld looked at it this way

Academic value system
Priorities for helping practice are the reverse
new ideas over reliable researchnew results over replication and extensiontrustworthiness over generalizabilitysmall studies over major programspersonal research over team researchfirst author over team memberdisputation over consensus buildingpapers over Tools and processes
Favours

How might we serve students better?
Levels of R&D:
The scale of R&D needed gets bigger. What do we need to handle it?
Study focus Variables Minimum scale
Learning Student, task … 3 students (Piaget)
Teaching … + instruction 1 classroom
Representative teachers …+ teacher 5 classrooms
System change …+ school, system 1 school system

Research-‐based practice & policy
Medicine and such fields have key elements • body of reliable research • exemplars of tools and processes • funded development programs • stable design teams • systematic iterative development • clear circumstances of use • comparative evaluation-‐in-‐depth
funded by clients who understand the process

Replication: exploring the boundaries
Testing models over the range of variables:
This is one result among many similar on diagnostic teaching v direct instruction Only common patterns lead to design principles, so we need big programs

System Change R&D
This recognises that we face Big Problems They need big coherent research efforts
Big collaborative R&D programs to yield Robust solutions
Compare other fields – they are organised: • LHC, Human Genome, ….. “Big Education” can learn from “Big Science”

A practice-‐focused research enterprise
We should work to:
• Build collaborations for tackling big issues • Focus on specific well-‐engineered exemplars • Focus evaluation-‐in-‐depth on what happens as well as student outcomes
• Together, build bodies of reliable results with evidence of their range of validity
• Identify and publicise successes
That is “Big Education”
Math Assessment Project – a US case study
• Strategic design by Gates Foundation + Shell Centre • “Common Core Standards” are challenging • Support must be: scalable, and core of implementation • Formative assessment, if good, is powerful for learning
it helps teachers and students shift roles diagnose strengths and weaknesses, move reasoning forward
• Try supplementary classroom materials (10-‐15% of time) • Who can do it, and how? Shell Centre’s 30 year record • New methodology: US trials, structured observation • Outcome: 5 million lesson downloads , evaluations +vex

MathNIC a new exploratory project
Goal • to work with 10 districts/system “partners” to design and develop ways of reconciling different level-‐priorities in tackling some core problems
Effective professional development • needs to be ongoing • adaptive expertise is challenging and takes time to build • finding time is a challenge for the system – within the job,
or outside it? • effective support – needs R&D too
We’ll see how it works!

MathNIC: how will it work?
Design is optimising within constraints • Key challenges will be identified, then selected • Design ideas will come from partners’ experience, and the project team
• We will provide engineering: detailed design >> improvement through trialing and revision
We’ll see how it works!

We have things to build on
On the MAP website you will also find, and try? • Professional development modules
• activity-‐based • design principle: plan, try, reflect together
• TRU Math: “ Teaching for Robust Understanding” • Framework for thinking about teaching: mathematics, cognitive load, access, ownership, feedback
• Tools for looking at classrooms

Thank You!