teaching mathematics iii: research -...
TRANSCRIPT


TEACHING MATHEMATICS III:
INNOVATION, NEW TRENDS,
RESEARCH

The publication was published with the support ofthe Catholic University in Ruzomberok
Faculty of Education, Department of Mathematics
This volume is published thanks to the support of the grantKEGA 001UJS-4/2011

Scientific Issues
Catholic University in Ruzomberok
TEACHING MATHEMATICS III:
INNOVATION, NEW TRENDS,
RESEARCH
Martin Billich
Ruzomberok 2012

Teaching Mathematics III, Scientific Issues
Editor
Martin BILLICH
Editorial Board
Marian TRENKLER, Roman FRICJan OHRISKA, Jan GUNCAGA
Stefan TKACIK, Nadezda STOLLAROVAEduard BUBLINEC, Juraj SLABEYCIUSDanica MELICHERCIKOVA, Pavel BELLABranislav NIZNANSKY, Peter TOMCIKPeter KUBATKA, Milan LEHOTSKYIgor CERNAK, Pavol CICMANEC
Reviewers
Jan GUNCAGA, Marian TRENKLER
Typesetting by LATEX
Martin BILLICH
Graphical Project of a Cover
Martin PAPCO
c© VERBUM - Catholic University in Ruzomberok Press, 2012Place Andrej Hlinka 60, 034 01 Ruzomberok
http://ku.sk, [email protected], Phone: +421 44 4304693
ISBN 978-80-8084-955-9
CONTENTS
Andras Szilard. Basic trigonometric formulas in an inquiring approach . . . . . 5
Bednarıkova Anna, Palasthy Hedviga. Programs for creating electronicstudy materials . . . . . . . . . . . . . . . . . . . . . . . . . . . . . . . . . . . . . . . . . . . . . . . . . . . 15
Boda Judit. Applications of informatics in teaching algebra . . . . . . . . . . . . . . . . 23
Budai Laszlo. The development of disadvantaged pupils with GeoGebra . . . . 31
Csakany Aniko. Report on Mathematics “Test Zero” at Budapest Universityof Technology and Economics in 2011 . . . . . . . . . . . . . . . . . . . . . . . . . . . . . . 45
Debrenti Edith. How we teach Mathematics? . . . . . . . . . . . . . . . . . . . . . . . . . . . . . 53
Dillingerova Monika. Commensalism between board games and teachingmaths . . . . . . . . . . . . . . . . . . . . . . . . . . . . . . . . . . . . . . . . . . . . . . . . . . . . . . . . . . . . 61
Fejes-Toth Peter. Measuring the efficiency of e-learning programs. . . . . . . . . . 67
Javorsky Stanislav. Digital competence and its impact on student perfor-mance results analytical comparison of digital competence withinSlovak, Czech and English mathematics . . . . . . . . . . . . . . . . . . . . . . . . . . . . 73
Kollar Judit. The role of knowledge acquired in secondary school in highereducation . . . . . . . . . . . . . . . . . . . . . . . . . . . . . . . . . . . . . . . . . . . . . . . . . . . . . . . . 79
Lazar Edit. Kvizy . . . . . . . . . . . . . . . . . . . . . . . . . . . . . . . . . . . . . . . . . . . . . . . . . . . . . . . 89
Nagy-Kondor Rita. Restriction on construction tools used . . . . . . . . . . . . . . . . 97
Perge Erika. Using educational multimedia-based software in teaching colortheory to students of civil engineering . . . . . . . . . . . . . . . . . . . . . . . . . . . . . . 103
Pobocıkova Ivana, Sedliackova Zuzana. Teaching of Binomial ConfidenceIntervals . . . . . . . . . . . . . . . . . . . . . . . . . . . . . . . . . . . . . . . . . . . . . . . . . . . . . . . . . 111
Stando Jacek, Szumigaj Konrad. The use of multimedia in the context ofe-exams . . . . . . . . . . . . . . . . . . . . . . . . . . . . . . . . . . . . . . . . . . . . . . . . . . . . . . . . . . 117
Vankus Peter, Kubicova Emılia. Attitudes of pupils and teachers asimportant factor for mathematics education . . . . . . . . . . . . . . . . . . . . . . . . 125

PREFACE
This volume of 16 texts presents the authors, who took part in the Mathematicsand Informatics Didactics Conference, which was held at the Juraj Pales Instituteof the Faculty of Education of the Catholic University in Ruzomberok, Levoca, Ja-nuary 20 – 22, 2012. The main goal of the conference was international exchangebetween researchers in mathematics and informatics education. The big supportfor the conference was the participation of the PhD students from the PhD Schoolin mathematics and informatics education of the University of Debrecen, Hungary,Faculty of Informatics of the University of Debrecen, Academic Commission of theHungarian Academy of Science in Debrecen, Kolcsey Ferenc Reformed Teachers’ Col-lege and other researchers and teachers from universities in Visegrad countries. Theparticipants presented their research results, and possibilities of future cooperativeresearch.
The primary objective of Teaching Mathematics III: Innovation, New Trends,Research is to present results from some of these PhD students and other experiencedresearchers and teachers. It is nowadays important exchange information betweenthese groups of researchers, because PhD students bring new methods (for examplein ICT aided education) and experienced researchers bring experience and goodpractices for the teaching. We hope that potential readers (teachers and researchersin mathematics and informatics education) of this publication can find inspirationsfor their educational and research work.
Martin Billich

Scientific Issues, Teaching Mathematics III: Innovation, New Trends, Research. Ruzomberok 2012
Basic trigonometric formulas in an inquiring
approach
Szilard Andras
Babes-Bolyai University, Faculty of Mathematics and Computer Science
RO-400084, Cluj-Napoca, Mihail Kogalniceanu street, No. 1
Abstract. The main aim of this paper is to present an inquiry based professionaldevelopment activity about the teaching of basic trigonometric relations andsome conclusions about possible implementations in the framework of regularschool lessons. The activity itself was designed to understand basic facts aboutthe structure and the construction of standard curricula parts and in the sametime to achieve a higher consciousness level in choosing teaching attitudes.
Keywords: basic trigonometric formulas, inquiry based learning.
Classification: G60; D50.
1 Introduction
In the recent educational trend the introduction of inquiry based learning into dayto day teaching practice has become an important goal ([5], [3]). However the realworld approach based on modelling and inquiry steps was traditionally an organicpart of mathematics teaching (not as a pedagogical method, but as a strategy forunderstanding [2]) the politicians and decision-making system needs new proofs forthe efficiency and reliability of this approach ([6]). But to obtain demonstrativearguments a more organic structure is needed in the construction of curricula. Thisstructure has to deal not only with pieces of content as independent entities but ithas to deal with the teaching method itself, the activities students have to performin order to achieve a deep understanding of mathematics as a science, as a humanactivity, as a useful viewpoint in handling various situations, a viewpoint that ulti-mately models human behavior. On the other hand teachers needs new materialsfor the implementation of IBL and moreover they need transformative training inorder to get confidence in using IBL.
As a part of the FP7 project PRIMAS1 the Babes-Bolyai University organizedseveral training courses on the practical aspects of inquiry based teaching of mathe-matics. This paper is a report of one session which was focused on the teachingof trigonometric formulas. The main aim of this session was double: to get a deepinsight into classroom processes, learning difficulties, teacher attitudes, student re-actions which can appear during the teaching of trigonometric formulas and on theother hand to develop an organic structure, suitable for IBL activities at classroomand at professional development level. According to these targets the session wasdivided into two major parts. In the first step of part I. (about 1,5 working hours)the participating teachers worked in small groups and each small group had to con-struct a detailed teaching approach with problems and proofs. To avoid similar oridentical approaches at the beginning there was a brief brainstorming to emphasizeall possible ideas and then each group had to work on a specific idea he has chosen.As a second step (about 1,5 hours) there was a debate on the constructed proofs, onthe different approaches from the point of view of teaching practice. In the second
1Promoting Inquiry in Mathematics and Science Across Europe, http://www.primas-project.eu

6 Szilard Andras
part the teachers had to construct a new curriculum structure for this content unitbased on IBL activities and real world application. For this part a consultation withseveral professionals (topographer, astronomer, web designer, architect) was usedand after these consultations the teachers had to prepare a common structure. Thisreport is focused on the first part, where teachers had to develop and to reflect onpossible proving strategies for the basic formulas.
2 Proofs and strategies
Problem 1 Construct a strategy to calculate sin(x+ y), cos(x+ y) and tg(x+ y) ifyou know sin(x), cos(x), tg(x) and sin(y), cos(y), tg(y).
The participants agreed after several comments that only geometric proofs willbe considered because only this can guarantee a strong connection to students’ for-mer knowledge (in Romania trigonometry is taught in the 9th grade, for 15 yearsold students). Some other approaches can be found in [10], these can be used toconnect trigonometry and vector geometry, or complex numbers, but first the basicformulas need to be derived by elementary arguments. This shows that for a suc-cesfull calculation (or proof) we need to construct a figure where we have the anglesx, y and x+y embedded into right angled triangles. After a short brainstorming theconfigurations from Figure 1 were found.
x
y
x
y
xy
A B
C
D
A
A
B
CC
DD
Ba) b) c)
yx
A
B C
x y+
d)
Figure 1: Possibilities to illustrate x, y and x+ y, where x, y are in right angledtriangles
Each group had to choose a configuration, to construct a proof and to analyzepossible other proofs based on the chosen configuration.
Configuration a) We need to embed the angle x+y into a right angled triangle.For this we have several possibilities (in fact there are infinitely many, but only a feware connected to the already constructed configuration). Hence we have to deal withthe possibilities illustrated on Figure 2 (we omitted the case when a perpendicularto AD is drawn through C).

Trigonometric formulas and IBL 7
x
yAB
C
D
E
x
yAB
C
D
E
x
yAB
C
D
E
Figure 2: Possibilities to embed x+ y into a right angled triangle
Case 1. We use the first configuration in Figure 2. In order to be able tocalculate the lengths of segments in the figure we need a reference length, whichcan be any one of the existing segments. For the simplicity we choose AD = 1. Thestrategy for calculation is very simple. We calculate the length of each segment usingx, y and AD. We can fix AD = 1. Hence DC = sinx, AC = cosx,BC = cosx sin yand AB = cosx cos y. To calculate DE we construct the orthogonal projection of C
to DE. With this construction we have m(CDF ) = y, so DF = sinx cos y. On theother hand
sin(x+ y) =DE
1= DE = DF + FE = DF +BC = sinx cos y + cosx sin y.
Using a similar argument we obtain
cos(x+ y) =AE
1= AE = AB −BE = AB − FC = cosx cos y − sinx sin y
and
tg(x+ y) =DE
AE=
DF + FE
AB − FC=
sinx cos y + cosx sin y
cosx cos y − sinx sin y=
tgx+ tgy
1− tgxtgy.
Figure 3 illustrates the necessary constructions for the second and the thirdconfiguration in Figure 2. For completeness we reproduce the proofs for these figurestoo.
Remark 1 This proof can be found in many textbooks and online resources. See forexample [2], [10].
Case 2. On the second configuration in Figure 3 we fix AD = 1 and we have
FC = sinx cos y, DF = sinx sin y, DE =sinx sin y
cos(x+ y)and EF = sinx sin y tg(x+ y).
Hence
sin(x + y) =BE
AE=
cosx sin y + sinx cos y + sinx sin ytg(x+ y)
1 + sin x sin y
cos(x+y)
.

8 Szilard Andras
From this equality we obtain (after rearrangement)
sin(x+ y) = sinx cos y + sin y cosx. (1)
The formulas for cos(x+ y) and tg(x+ y) can be obtained in a similar manner.
x
yAB
C
D
E
x
yAB
C
D
E
x
yAB
C
D
EF
FF
G
Figure 3: Auxiliary lines and calculation strategies I.
Case 3. We use the third configuration in Figure 3 and we consider as in the
previous cases AD = 1. In this construction we have m(FCD) = x and m(GBC) =x+ y, thus
sin(x+ y) =GC
BC=
EF
BC=
AD − AE − FD
BC.
On the other hand AE = AB cos(x + y) = cosx cos y cos(x + y), FD = DC sinx =sin2 x and BC = cosx sin y, so we obtain
sin(x+ y) sin y + cos(x+ y) cos y = cosx (2)
In order to obtain another relation between sin(x + y) and cos(x + y) we writeEB = AB sin(x+ y) = EG+GB = FC +BC cos(x+ y) so
sin(x+ y) cos y − sin y cos(x+ y) = sinx. (3)
Multiplying both sides of (2) with sin y, both sides of (3) with cos y and addingthe obtained relations we deduce 1 and from this we can obtain the correspondingformula for cosine and tangent.
Configuration b) Using configuration b) for the embedding of the angle x+ yinto a right angled triangle we have the possibilities illustrated in Figure 4 (for eachcase we illustrated the auxiliary construction too).
According to these constructions we have to analyze the following three cases.Case 1. We use the first construction on Figure 4 and we consider AC = 1.
m(FDC) = x+ y, so FD = DC cos(x+ y) = sinx cos(x+ y), FE = BC = sin y andhence
sin(x+ y) =DE
AD=
sinx cos(x+ y) + sin y
cosx.
From this relation we obtain
sin(x + y) cosx− cos(x + y) sinx = sin y (4)

Trigonometric formulas and IBL 9
x
yA
D
C
BE
F
x
yA
D
C
B
E
F
x
yA
D
C
B
E
x y+
x y+
Figure 4: Auxiliary lines and calculation strategies II.
On the other hand AB = AE + EB = AE + FC, hence
sin(x + y) sinx+ cos(x+ y) cosx = cos y (5)
From relation (4) and (5) we obtain the well known formulas for sin(x+y), cos(x+y).
Remark 2 It is possible to use a slightly different argument in this case. In the
triangle ADE we have sin(x + y) =DE
AD=
BC +DF
AD=
sinx cos(x+ y) + sin y
cosx.
From this relation we have
cos2(x+y) = 1−sin2(x+y) = 1− sin2 x cos2(x + y) + sin2 y + 2 sinx sin y cos(x+ y)
cos2 x,
hence we obtain a quadratic equation for cos(x+ y) :
cos2(x+ y) + 2 sinx sin y cos(x + y) + sin2 y − cos2 x = 0.
The discriminant of this equation is
∆ = 4 sin2 x sin2 y − 4 sin2 x+ 4 cos2 y = 4 cos2 x cos2 y,
thuscos(x+ y) = − sinx sin y ± cosx cos y.
In the last relation the last term could not have negative sign because cos(x+y) mustbe positive, hence we obtain the formula for cos(x+ y) and from this we can obtainthe formula for sin(x+ y) and tg(x+ y).
Case 2. Suppose AC = 1. BC = sin y and EB = cos ytg(x + y) and from thetriangle DEC we have EC = sinx 1
cos(x+y) . From these relations we have
sin y = BC = EB − EC = tg(x+ y) cos y − sinx1
cos(x + y),
orsinx+ cos(x + y) sin y = cos y sin(x+ y).

10 Szilard Andras
Squaring both sides and using sin2(x + y) + cos2(x + y) = 1 we obtain the samequadratic equations for cos(x + y) as in the previous remark, hence the rest of theproof is the same.
Case 3. As in the previous cases we suppose AC = 1. From AD = AE +ED =AE + CF and DC = EF = EB − FB we obtain the relations (2) and (3), hencethe rest of the proof is similar to the third case of configuration a).
Configuration c) Working with this configuration allows to use different tools.If we calculate the area of the triangle ABD in two different ways, we obtain aformula for sin(x + y). Suppose AC = 1. On one hand we have
σ[ABD] =AC · CD
2+
AC ·BC
2=
tgx+ tgy
2.
On the other hand
σ[ABD] =AD ·AB · sin(x+ y)
2.
From these relations we obtain
sin(x+ y) =DC +BC
AB · AD = cosx cos y(tgx+ tgy) = cos y sinx+ cosx sin y.
Remark 3 The use of the are can be avoided if we construct the perpendicular BEfrom B to AD. In this case BF = tgy cosx and EF = sinx, where F is the projectionof C to EB.
Configuration d) For the last configuration we can use several auxiliary con-structions (if we want to embed the angle x + y into a right angled triangle) or wecan use an argument based on the area of the triangle (for this last argument seealso [8]). We analyze two auxiliary constructions. These are illustrated in Figure 5.
y yx x
A A
B BC CD
E
D
E
Figure 5: Auxiliary lines and calculation strategies III.
Case 1. Suppose AD = 1.With this assumption we haveBD =1
tgx, DC =
1
tgy,
AC =1
sin yand EC =
(
1
tgx+
1
tgy
)
sinx. From the triangle EAC we obtain
sin(x+ y) =EC
AC= sinx sin y
(
1
tgx+
1
tgy
)
= sinx cos y + sin y cosx.
In a similar way we can deduce the formulas for tg(x + y), cos(x+ y).
Remark 4 This proof appears in [13] and [14].

Trigonometric formulas and IBL 11
Case 2. In this case we denote by a and b the length of CE respectively AE.From the area of triangle BCE we obtain
a1
sin y+
1
tgx+
1
tgy=
(
1
tgx+
1
tgy
)(
1
sinx+ b
)
sinx,
soa
b= sinx sin y
(
1
tgx+
1
tgy
)
.
On the other hand from the triangle ACE we have sin(x+ y) = ab, hence we obtain
the desired relation.
Remark 5 Using more auxiliary constructions and other arguments we can obtainalso some other proofs. As an example we sketch a proof based on Ptolemy’s firsttheorem (for more delightful trigonometric ideas see [9]). In the configuration c)the quadrilateral ABCD is inscribed in the circle with diameter AC, hence due toPtolemy’s first relation we have
AC · BD = AD · BC +AB · CD.
If we suppose AC = 1 and we use the relations from case 1/a) we obtain
BD = sinx cos y + sin y cosx.
On the other hand BD = sin(x + y) (due to the sine law or using an auxiliaryconstruction), hence we obtain the required relation.
x
yA
B
C
D
Figure 6: Auxiliary lines and calculation strategies IV.
Remark 6 The formulas for sin(x − y), cos(x − y), tg(x − y) can be proved usingsimilar arguments and figures. We propose to the reader as an exercise to analyzethese geometrical proofs.
Remark 7 The main idea of the previous proofs, without a detailed analysis of thepossible proving strategies, also appears in [4].

12 Szilard Andras
3 Conclusions
1. Almost all solutions appeared at the training session (produced by the groupsin the initial step, or at the presentation of the possible solutions), the authorof this paper only unified and structured them. The participants were highlysurprised about the diversity of possible approaches in contrast to the usualtreatment of the problem in textbooks and classrooms.
2. The participants realized that basically all possible ideas were good and allideas led to a correct solution (with more or less effort). By analyzing theseproofs they realized that in many textbooks the presented solution is the short-est or the simplest as reasoning. This aspect is very important and shows thatusually without analyzing other possible approaches, proofs, the main proper-ties of a proof remain hidden. In most cases teachers present a possible proof,but they don’t know that this proof is the optimal from some points of view.For this reason very often they can not answer the simplest question posed bystudents: “Why do we learn this proof?”
3. The diversity of proofs shows that if the necessity of these formulas appearsas a problem in contextual problem situations, students have real chance toconstruct a geometric proof which is strictly based on their previous knowledge.Moreover by giving them the chance to construct such a proof and analyzesome alternative approaches they can realize how mathematics works, howmathematicians work. They can understand that some tools can be moreeffective than others in constructing a proof and doing mathematics meansthat we seek for an optimal solution/proof (which is usually not unique becausedepends on the criteria we use).
4. Most of the proofs have one or two fundamental idea in the background, therest are only technical details. The real understanding of mathematics startswith the understanding of these background ideas and the capability of makingthe connections between the simple and clear background ideas and formalism.All these proofs and ideas are useless in the existing Romanian curricula wherefirst the trigonometric functions are introduced and the proofs are fitted to thisapproach (while this functional viewpoint is strange for most of the students).This shows that if we want to use IBL methods and activities, we need tocompletely rethink the structure of the content and in most cases we have tostart with the problems (applications) that are at the end of the chapter inthe present structure. The trigonometry represents an illustrative example inthis sense. The geometrical applications are usually at the end of the chapterwhile fundamentally they motivate the existence of the whole chapter and theyconnect this chapter to the students’ former knowledge.
5. The proofs presented here shows how inquiry based learning is working inan abstract framework and how simple ideas (the necessity of constructing theright angled triangles) combined with basic choices (the choice of configuration)lead to a correct proof. From this point of view the content itself in thisactivity is not as important as the processes the students/teachers are goingthrough. This shift (from focusing on content to focusing on processes) isproper to inquiry based teaching however the importance of the content mustbe emphasized (by using an adequate context to introduce the problem andby giving other applications too).

Trigonometric formulas and IBL 13
4 Acknowledgements
This paper is based on the work within the project Primas. Coordination: Univer-sity of Education, Freiburg. Partners: University of Geneve, Freudenthal Institute,University of Nottingham, University of Jaen, Konstantin the Philosopher Univer-sity in Nitra, University of Szeged, Cyprus University of Technology, Universityof Malta, Roskilde University, University of Manchester, Babes-Bolyai University,Sør-Trøndelag University College. The author wishes to thank his students and col-leagues attending the training course organized by the Babes-Bolyai University inthe framework of the FP7 project PRIMAS2. The author was partially supportedalso by the SimpleX Association from Miercurea Ciuc.
References
[1] Andras, Sz.; Csapo, H.; Szilagyi, J.: Tankonyv a IX. osztaly szamara,Status kiado, Csıkszereda, 2002, online adress: http://simplexportal.ro/tan-anyagok/kozepiskola konyvek/TANK9/t8.pdf
[2] Arnold, V. I.: On teaching mathematics, text of the address at the discussionon teaching of mathematics in Palais de Decouverte in Paris on 7 March 1997,http://pauli.uni-muenster.de/∼munsteg/arnold.html
[3] Csıkos Cs.: Problemaalapu tanulas es matematikai neveles, Iskolakultura,2010/12
[4] Gelfand, I. M.; Saul, M.: Trigonometry, Birkhauser, 2001[5] Harriet Wallberg-Henriksson, Valerie Hemmo, Peter Csermely, Michel Ro-
card, Doris Jorde and Dieter Lenzen: Science education now: a re-newed pedagogy for the future of Europe, http://ec.europa.eu/research/science-society/document library/pdf 06/report-rocard-on-science-education en.pdf
[6] Laursen S., Hassi M M.-L., Kogan M., Hunter A.-B., Weston T.: Evaluationof the IBL Mathematics Project: Student and Instructor Outcomes of Inquiry-Based Learning in College Mathematics, Colorado University, 2011, april
[7] Nelsen, R. B.: Proofs Without Words, MAA, 1993[8] Nelsen, R. B.: Proofs Without Words II, MAA, 2000[9] Maor, E.: Trigonometric Delights, Princeton University Press, 1998[10] Olteanu, E.: An original method of proving the formula of a trigonometric func-
tion of a sum of angles, Proceedings of the International Conference on Theoryand Applications of Mathematics and Informatics - ICTAMI 2004, Thessaloniki,Greece
[11] Ren, G.: Proof without Words: tan(α− β), College Math. J. 30, 212, 1999.[12] Smiley, L. M.: Proof without Words: Geometry of Subtraction Formulas, Math.
Mag. 72, 366, 1999.[13] Smiley, L. and Smiley, D.: Geometry of Addition and Subtraction Formulas,
http://math.uaa.alaska.edu/ smiley/trigproofs.html.[14] Weisstein, Eric W.: Trigonometric Addition Formulas, From MathWorld–
A Wolfram Web Resource. http://mathworld.wolfram.com/Trigonometric-AdditionFormulas.html
2Promoting inquiry in Mathematics and science education across Europe, Grant Agreement No.244380


Scientific Issues, Teaching Mathematics III: Innovation, New Trends, Research. Ruzomberok 2012
Programs for creating electronic study materials
Anna Bednarıkova, Hedviga Palasthy
Catholic University in Ruzomberok, Faculty of Education
Hrabovska cesta 1, 034 01 Ruzomberok
Abstract. The development of ICT brings new products constantly in technicaland programs. Modern society is based primarily on the ability to obtainnecessary information. An important task is now becoming an appropriateselection and processing of information, together with the manner of their use.Applications and procedures offering the creation of electronic materials largequantities on the market, however, not all are attractive and popular for users.Authors will be dealt with by several programs suitable for the production ofelectronic materials, and describe in more detail content management systemWordPress in the contribution. Authors give a preview of the creation of anelectronic material for computer networks at the and of the article.
Keywords: Electronic materials, software, chapter, WordPress.
Classification: R10, R70.
1 Introduction
A development in information and communication technologies is so rapid that it isway behind schedule seen in its entirety. With the development of new informationand communication technology is the creation of study materials in electronic form.
The electronic materials created by different programs, must be processed toenable the student to understand maximum of the theme even without direct contactwith the teacher. These materials require transparency, orientation and access toinformation.
There are study materials of different qualities, whose practical use can be dis-puted. It should be always good to consider the objectives in the creation of studymaterials, which we want to, achieve and create an appropriate study material, ac-cording to the instruction for the target group of users and the form of teaching.The creation of properly processed electronic study materials is not simple, and itis also time and financially consuming. Their creation is not only a technical issue,but also social. If we take the text originally in printed form, only in electronic formwithout other effects, it is such a little interesting and illustrative study material forthe student. It must be just as substantially higher than in the printed textbooksin the electronic materials.
The use of multimedia electronic textbook presents a functional link of the textand the multimedia for the achievement of the effective promotion of the study. Itis getting not only the content page of electronic materials in the foreground, butalso their formal processing. There is currently available a lot of software resourcesfor the creation of multimedia educational material. Creation at the high-qualityproducts requires knowledge of the relevant software technologies.
2 Selected programmers for the creation of electronic materials
We will define some software products assigned for the preparation and productionof interactive multimedia materials.

16 Anna Bednarıkova, Hedviga Palasthy
CamStudio is a free program, and the environment of the program is very simple.It consists of three separate, but functionally related programs. It’s an applicationfor recording video, which contains the necessary settings. Another component isSWF Producer. This is a program that converts video format AVI to SWF. Thethird part is the player AVI files. Its main task is to take action on entire the screenof the computer, or take action only of a part of the screen, that we showing a certainactivity. CamStudio is a simple tool for creating multimedia materials, but is quiteeffective and fulfils the purpose.
Wink is freely available software for creating multimedia materials for e-learning.This application is available not only for the operating system Windows, but alsofor the operating system Linux. Unlike Camstudio, it is not necessary to exam-ine through a number of text menu for each operation, but the icons of availablefunctions are always located directly on the desktop program. Wink is most oftenused to create the animated tutorials, adding for example graphics, or spoken word,interactive elements (buttons for moving to a specific location in a presentation, orWeb page). A standard output format of software Wink is an interactive Flash pre-sentation. The software Wink provides the tools for the most demanding creatorsat a high level and the possibility to check the results of its work. The program alsosupports a file to export as PDF, HTML and PostScript.
Camtasia Studio resources include between commercial software. It is the com-plete solution for recording, editing and sharing videos in Web pages, CD-ROM andmp3. This software is available only for operating system Windows. In the process-ing of the video recording in Camtasia Studio editor, we can use special tags whichmay serve as identifiers for the time during the course or under them; we can divideor combine the whole video. The timeline contains a few feet, which are used forworking with video and audio commentary, as well as for various special effects. Themain advantage of this program is easy and intuitive environment for video editing,and exports the resulting presentations to create by the lot of supported formats.Camtasia Studio has the ability to shrink a record is from a larger resolution (e.g.,1024 x 768) screen to smaller (800 x 600), while maintaining readability and qualityof output.
Another commercial product is the Zoner Callisto. Zoner Callisto offers toolsfor processing vector graphics. This program is among the appropriate instrumentsfor home work with vector graphics and its creation.
Macromedia Authorware 7 is one of the most complex author systems for thedevelopment of interactive multimedia programs. It belongs to a group of paidproducts. It is the ideal tool for creating e-learning applications, interactive catalogsand publications, interactive training courses or all sorts of simulators. The scenarioapplication creates on the timeline, where the icons are placed of the individualactions. Several icons represent the basic program structure, with the help of whichit is possible to build very large applications. Macromedia Authorware 7 makes iteasy the integrated full-text search, to work with data on the Internet, the evaluationof responses, and the full support of e-learning standards AICC and SCORM.
ToolBook II Instructor belongs to the tools for creating high-quality multimediamaterials. This is a tool that deals with the creation of electronic presentations andcourses. The program provides courses in the form of presentation, in which it ispossible to use an integrated scripting language. ToolBook Instructor has incorpo-

Programs for creating electronic study materials 17
rated the link with the management system of Tutor2000, which is the product offirm Kontis Prague.
Commercial software Macromedia Flash is designed for creating interactive Webapplications. Thanks to the use of vector graphics is the size of the resulting filenot large. Bitmap graphics indicates for each pixel his position and color, and viceversa the vector graphics is registered as the mathematical equation. The use ofsound in MP3 format and an Internet scripting language allows creating interactivemultimedia presentations that are executable on all of the most popular browsersand operating systems. Flash animation may work with extern information stored,for example, in the classic text file, XML or PHP. Flash is mainly used for creatingbuildups and multimedia. Services of Google or YouTube make up data warehousesfor video sequences, used consist of video players created in Macromedia Flash.
Pinnacle Studio is software with nonlinear content from firm Pinnacle Systems,which is a part of Avid Technology. It allows users to create DVD with menu andburn their video content, without the need for further additional software.
For example, ProShow Gold, Adobe Photoshop, CorelDRAW, Captivate, AllCapture etc. belong to other commercial products intended for the production andpreparation of multimedia of electronic educational materials.
3 The creation of an electronic textbook on subject computer
networks with the use the WordPress
In the creation of electronic textbooks Selected chapters on the subject of the com-puter networks we used WordPress system, which allows, among other functions, tocompile a simple and efficient electronic educational material directly in the Webbrowser interface. Electronic material is seen as a set of semantic-proper classifica-tion of chapters and subchapters.
WordPress is one of the most widely used content management systems for thecreation of blogs, and small to medium-sized Web pages. The term blog, we under-stand the Web site, with frequent updates to the content. Its main advantages areeasy to install, the transparency of the code, it is fast and free. Another advantageis the wide and active community of users, with resulting benefits, such as a largenumber of free templates and a comprehensive range of plug-ins available that ex-tend the functionality of the platform. The basic package contains functions thatensure the immediate function of the system. On the Internet is a large number ofplug-ins, which are usually available free of charge to WordPress. Easier plug-ins tojust add some functionality, and more complex plug-ins added control panel. Know-ledge of programming is not needed. In our work we used for WordPress system thefollowing plug-ins:
• Easy Tube – makes it easy to add videos from YouTube,
• Tiny Style 0.0.1 – allows to edit the articles, parties, chapters using the built-inWYSIWYG editor TinyMCE Rich Visual Editor
• Tiny Table 0.0.2 – implements controls for the management of the tables inthe text WYSIWYG editor TinyMCE Rich Visual Editor,
• wbQuiz 0.1.0 – used to this extension can be create simple tests,
• wp-table 1.52 – allows an extensive report tables

18 Anna Bednarıkova, Hedviga Palasthy
• WP Super Edit 1.1.2 – extends implemented WYSIWYG editor for many ofthe advanced text formatting features.
3.1 Add a new chapter
After opening Write it display empty form that contains a Write Post and WritePage. Write Post serves to add a new chapter, Write Page for the addition of anew test. If we want to add a new chapter in electronic materials, we write headingto form the element Title, such as “LAN Topology”. To form element Post weadd the text of the chapter, we can add videos, images and format text using aWYSIWYG editor. For the selection of the category to which the chapter belongs,we choose menu in the right hand menu called Categories. Specifically for thechapter “Topology LAN” we have selected a category of “Topology LAN”. If wewant to insert the video into the text of chapter from YouTube.com, just insert theaddress of the video. In an electronic textbook we used video Network topology bus(http://youtube.com/watch?v=sIkCwoEJyCE).
When we want to insert images to the text of chapter, we will use this formnamed Upload. We can load new image to that chapter, which currently fulfill.
Figure 1: Upload new picture
It is possible select previously recorded images. Just choose the option Browse Allin the form for the pictures and choose from them. The selection of the possibilitiesof inserting the image into the chapter is:
• Thumbnail – preview of the small appears to actual image
• Full Size – displays the image in full size
• Title – displays only the title to the image
Link to the image in the chapter may to be the following:
• File – you will see the image at full size in the browser window
• Page – displays the new page of the electronic textbook
• None – the picture does not click
After confirming the command Send to editor, the image loaded at the placewhere the cursor is currently in the text of chapters.

Programs for creating electronic study materials 19
Figure 2: View an image in chapter
Chapter shall be made available to press Publish under article. The Save optionsaves and closes the chapter an editing form. Select Save and Continue Editing savesthe chapter and continues its editing in the currently open form.
It is that specifies the ID attribute in table editing, the order the creation of thechapter and included unsuccessful attempts. Attribute When shows the time label,on which the chapter is published. The attribute Title shows the name of the chapter.Attribute Categories specifies into which categories the chapter falls. AttributeComments shows the number of comments to chapter. The Author attributes showwho is the author of the chapter. It is also possible to have multiple authors withdifferent rights in the WordPress system. The last three items to View, Edit andDelete the whole record. View shows how the chapter look like in the browser, Editopens an edit window of the chapter and Delete deletes a chapter.
3.2 Creation of a new test
If we want to add at the end of chapter for students test the knowledge of howthe feedback, we must have activated the plugin in WordPress wbQuiz. If we havewritten a chapter from the LAN, we Manage the components of the Topology andyour saved items Pages. To create a new test are two options, through the windowand Create a new page link or by using the components of the Write Page, and itssubdirectories.
We write the title and the name of the TextField to a form element to the PageTitle. For clarity, it is best to choose a name that is similar to the name of thechapter to which the test belongs. The next step will be to select the menu from theright menu Page Template and then choose wbQuiz. This is a selection of templatesfor your page, to which we attach a file with the contents of the test. The nextstep is the choice of Custom Fields that we create the form Add below the contents.Individual form elements means:
• Key- question file: key that is predefined by the plug-in wbQuiz. It serves forthe party, which we create, use the plugin was able to currently.
• Value-the wp-content/plugins/wbQuiz/test topologia lan.php: marks the pathto the content of the test, which is stored in this particular case in the filetest topologia lan.php.
• Action – Update/Delete: after we enter the previous form fields Key and Valuewe can choose the option Update for changing an already existing test ormodified test and select the option Delete to delete this field.

20 Anna Bednarıkova, Hedviga Palasthy
To save the page, which will contain the test, select the option Save and Con-tinue Editing, Save or Publish. For our e-textbook we used php files with the namestest transmission media.php, test wireless networks.php, test active elements.php andtest end.php.
It is in the beginning of each chapter clearly and comprehensibly defined the ob-jective that contains the knowledge that they will be studying control after studyingthe whole chapter. It is indicated in color and located in a frame. After the goal,follow short introduction, which serves for putting up the themes of the subject.
In the introduction, it is appropriate to point out prior knowledge, which isnecessary to control, so that we can continue to study. In each chapter it should bepart of the motivation, which raises the interest in learning in students. It can bedisplayed in the form of a picture, animation, and video. We have chosen in LANTopology chapter as motivation video from YouTube.com. Then new concepts,keywords, examples are following for a better understanding of the substance. Allcontent is accompanied by images, or diagrams that students have also visuallypresented knowledge. At the end of the chapter it is a summary of the concepts tolearn.
After studying each chapter is followed by the test. Students have the optionto verify the acquired knowledge. In the tests, they used the open questions andclosed questions with a choice of one or more correct answers. Each test containsan evaluation of the test. Evaluation provides students, but also tutors feedback onthe gained knowledge. At the end of the electronic textbook is prepared a final testfor the students, which includes questions from all the chapters.
4 Conclusion
A properly designed electronic textbook should have correctly defined goal, motiva-tion, and include the requirements for previous knowledge. It is a definition of thesis,accompanied by illustrative images, diagrams, tables, which help students to betterunderstand of the presented concepts to learn. At the end of the chapter processed isknowledge test, which verifies knowledge’s from the corresponding concepts to learn,and provide students with feedback in the form results. Electronic materials have tocompensate for lectures or interpretation and their expressing style, language, butalso the graphic format must be well prepared. The form, in which it is submitted,plays an important role in teaching matters, because it replaces the missing schoolenvironment and the advantages of the presents study.
References
[1] Kucavıkova, V.: Tvorba obsahu elektronickej ucebnice, Diplomova praca, PFKU Ruzomberok, 2008, s. 73
[2] CamStudio. [online, 22.01.2011], Available at http://enscreenshots.
softonic.com/s2en/47000/47285/4_camstudio_296.jpg
[3] CamStudio prostredie. [online, 22.01.2011], Available at http://www.stahuj.centrum.cz/direct/iR/katalog/camstudio/Mo\%BEnosti.jpg
[4] Camtasia Studio. [online, 03.03.2011], Available at http://
thephotofinishes.com/images/camtSlideUI.gif
[5] Camtasia Studio 5 Single User. [online, 22.01.2011], Available athttp://www.sw.sk/vyvojove-nastroje/webdesign/ostatni-editory/
camtasia-studio-4-\\single-user/

Programs for creating electronic study materials 21
[6] Computer Networks Laboratory. [online, 17.03.2011], Available at http://
www.cnl.tuke.sk/sk/
[7] Ceska poradna pro WordPress. [online, 17.03.2010], Available at http://
podpora.dgx.cz/wordpress/
[8] Macromedia Flash. [online, 22.01.2008], Available at http://downloadsource.net/img/98ea08648e96d17665f983901e45c2ac.gif
[9] Macromedia Flash Professional. [online, 28.11.2007], Available at http://
webdevfoundations.net/flash8/fl1.gif
[10] Wikipedia. Pinnacle Studio. [online, 03.03.2009], Available at http://en.
wikipedia.org/wiki/Pinnacle_Studio[11] WordPress. [online, 17.03.2010], Available at http://wordpress.org/[12] Zoner Callisto 4. [online, 03.03.2011], Available at http://www.gjar-po.sk/
studenti/informatika/02_03/trojanovic/images/newimg/img/zonner.
jpg
[13] http://fpedas.uniza.sk/dopravaaspoje/2006/1/madlenak.pdf[14] http://www.fem.uniag.sk/Martina.Majorova/files/chlebec_majorova_
divai2007.pdf


Scientific Issues, Teaching Mathematics III: Innovation, New Trends, Research. Ruzomberok 2012
Applications of informatics in teaching algebra
Judit Boda
University of Debrecen
4032 Debrecen, Egyetem square 1.
Abstract. Since term of 2010/2011 I am a maths teacher in the Ferenc KolcseyGrammar School in Debrecen. Due to being a night school the students’ contentis mixed because for attending to this school as adults there are several reasons. Iknew the challenge of teaching there is different as in other high schools. My aimis to review my collected experience of teaching the topic ’Algebra and quadraticequation’ and those handouts and instructional aids which were devised by mefor maths lessons during the last and 2011/2012 semester. The students neededto have regular practice to acquire terms of algebra and get at good solutions ofdifferent tasks. For this reason I made two programs. Due to these programsmy work became more effective and faster. Through these I can generate utilitytasks and give them to students for homework. The hang of solution can bealso generated by these programs so the checking can be simple. Through theseexercises I can encourage my students for regular learning and practice. Myexperience shows that the students like this subject better and better and theysolve the tasks more confidently.
Keywords: teaching algebra, informatics, application, mathematics.
Classification: D30; D40.
1 Introduction
There has been in the Ferenc Kolcsey Grammar School in Debrecen a night schooleducation since 2003. The students have got lessons in two afternoons a week. At thepresent 350 students study in 10 classes. Our aim is to prepare them for successfulfinal examinations. With 15 colleagues we try to do our best.
The number of mathematics lessons is three per week in the 9th form and twoper week in the 10th form. The classes last 40 minutes. Because of this short timethe students sometimes think we are on the run with curriculum. This and otherreasons cause the so-called “small-sheet” method. In the next I detail this method.
1.1 Relation between the students and mathematics
In this grammar school the most students’ aim is obtaining a graduate certificate.Only few students are motivated by furthur study. Those, who are in the lessons,really want to learn and acquire mathematics. Several students are in the classesafter work thus they are tired even so enthusiastic. I want to maintain and supportthis inner motivation. Some students’ desperation and will for learning are hinderedby any former negative experience in maths. More students seem to be frightenedof this subject because they think it is a mysterious and too complicated subject.They think it is impossible to acquire that. In the corridor and in the break I oftenheard the next: “Anyway I wish I could have two” or “I will never understand it”.Therefore besides the acquiring of the curriculum It is very important to fight downtheir fears.
Although more students take an active part in the lessons their results are notso good as they were expected. From the tests it is clear that more students knowthe material even so they do not put up a good show. For getting good grades Itry to make the lessons more informal. For instance the mistakes of the tests are
24 Judit Boda
discussed by the writer and the teacher. Through it I managed to achieve for theend of the semester that the students think of maths as it is a bearable subject andnot so awful. Thus they do not have negative feelings because of maths lesson andthere are not fears of failures.
Although the students are enthusiastically in lessons it does not mean the increaseof knowledge or the acquirement of material but it is a very good base. For instancethere is a 9th-form-student who had a bad attitude at the beginning of the semesterand it had a big influence for his test results. However he was very active in thelessons. For the end of the semester he became one of the most interested andenthusiastic students. Now he studies in the 10th form. Before the winter break heasked if he could do more tasks from the book because he had an interest to practicemore. So the positive attitude helps the learning process.
1.2 Topics in algebra
The algebra topics in the 9th and 10th form are the most significant because thestudents are expected to acquire the most important materials. In these classes theylearn the role of letters and their formal thinking also improves. Although they haveto memorize a lot of rules/axioms and recognize them during solving the certaintasks.
Topics in the 9th form:• Using letters in mathematics
• Raising to a power
• Raising to an integral exponent
• Normal form of numbers
• Polynomes
• Nominal products
• Converting products with removing
• Converting products using nominals
• Calculations using algebraic fractions: multiplication and division
• Calculations using algebraic fractions: addition and substraction
Topics in the 10th form:• Quadratic equations
• Formula of quadratic equation
• Radical form
• Relation between roots and coefficients
• Higher-degree equations brought into quadratic form
• Quadratic functions
• Quadratic inequalitiesThe topics above have got considerable importance to solve furthur problems
and the topics of upper classes certainly rest on these materials. Learning how tosolve those exercises which connect to the topics above is inevitable and it can beimproved by practice.

Applications of informatics in teaching algebra 25
The significance of algebra was worded by Gyorgy Polya and it is the next: “Thealgebra is a language which consists of signs and not words. If we are experts on it,we can translate the certain sentences of daily life into the language of algebra”.
2 Problem posing and objectives
The students of grammar school have also got difficulties with topics above. Theyhave often complained about it like this “there is no enough time for it”, “we areon the run with topics”, “I will practise more at home if you, teacher gives moreexercises” or “In the lesson I understand how to solve it but at home I cannot doit”.
One of the explanations for fast pace is that they attended to school years agoand now they have lessons once a week. For facilitation of learning I have donea helping material which contains solved tasks of different topics in details. Thesolution is shown step by step and with different colours. Due to the feedbacksthis help seems to be very effective. In the furthur test there were some exercisesfrom that helping material. Fortunately only a few tests seemed to be solved in thesame way as it was in the helping material. Those students seemed to memorize thehandout (20 pages) like a verse. A few students thought if they learnt the helpingtasks word by word, they would know every task.
For showing the variety and opportunities of mathematics the topics of algebrawas not finished although we had to continue the curriculum.
Checking of extra homework I want to maintain and encourage the students’approach to mathematics. It means more work and it raises more questions.
To improve the students’ knowledge the lesson seems to be not enough becauseof the resons above.
Thus the next questions raise related to homework:
• For one time how many exercises must I give them for homework? I considerthat how much homework is not too much and not too little but enough forpractice; how much time the students need to solve the tasks from week toweek; how to maintain their interests.
• Do I give the same tasks for everone? Do they not copy the solutions? Do Igive different tasks for everyone? And this idea also can reflect the variety ofmathematics.
• How do I give assessments for their homework? How to consider the wrongsolutions? How to reward those who do the tasks well and who always workhard? Do I give “small five”, red point or bonus, and etc. How will theyrespond these but they are adults?
• Are there any appropriate maths compalation for them?
• How do I organize the combination in a relatively short time and assessmentof the tasks to be more effective?
Responding these questions led up to the “small-sheet” method which was namedby students. Persistent work results in success, by which the students can be moreencouraged and motivated in learning. Thus mathematics can be liked by students.Keeping in mind the main goal is to achieve a better learning process.

26 Judit Boda
Figure 1: A worksheet
3 The “small-sheet” method
The students get 20 exercises, which are different per person. Because of economyin place two ranges of exercises are in one worksheet (A/4). In Figure 1 there isshown a worksheet of the 10th form.
As an assessment the students chose and insisted on the red points. They getthese ranges of tasks every week and they have to solve them for the next lesson.If all exercises are correct they will get the red point. After getting five red pointsI give them a good mark. If there is only one mistake, they will have to do similartasks. Only twice they have opportunity to solve them. If they do not manage todo them correctly, they will not get a red point. They must try to do it correctly.Those who do not deal with the tasks get a bad mark.
I am motivated to prepare and give different exercises per person so that thestudents cannot copy from each other and they can see also the variety of mathexercises. Nevertheless there is a benefit if I have more and more exercises becauselater I will have a wide variety of worksheets, which I can use again and again.
Of course I do not forbid them to help each other or ask my help. But the maingoal is to improve their learning therefore they must know what exactly the task isand so they can solve it alone and confidently.
4 Applications
There is only one unanswered technical question: Where can I have the exercisesfrom? Those tasks which are in different maths compalations are not enough forthat huge work. Preparing different exercises per student is a long and exhaustingwork. Therefore I had to think a lot about how to solve this problem. I always tellstudents to think before they want to achieve a simple way of solution. It is knownthat “mathematicians are lazy but programmers are lazier”. Following this “theory”I was looking for an effective solving opportunity. I used my programming skills andI created an Applications which can solve the problem above. In the next I detail it.

Applications of informatics in teaching algebra 27
This Applications was created in Java with NetBeans IDE 7.0. Modelling rangesof tasks was made with Microsoft Office Word 2007. For the automation I had towrite some macro.
In the school-year 2010/2011 I used this program in tasks of 9th form and in theschool-year 2011/2012 the program was used in tasks of 10th form. I prepared thesetwo programs for own using therefore they have not got graphical surface. Thus wecan work with them from standard input.
With parameters and changing the source-code the number of wanted ranges oftasks and the number of tasks can be modulated. By these data the program makesa simple word document which is formed into the wanted shape with Word macro.
4.1 9th form
In case of 9th form topics the tasks were created formally. I did not think it was im-portant to give semantic interpretation thus the applications cannot help in checking.The number of polynomial expressions is variable.
During run the next exercises can be chosen:
• Monomial multiplied by polynomial, e.g.: −2x3y3(2x3y + 4y4 − 3xy)
• Polynominal multiplied by polynomial, e.g.:(−5x3y − 4x4y2 − 2x2y + 3xy4)(−2x3y + 3x4y3 − 2xy) =
• Removing, eg.: 20y6 − 8x4y5 + 16x2y7 − 8xy4 =
• Binominal to the power two, e.g.: (−3x2 − 2y3)2 =, and 4x8 − 12x4y2 +9y4 =
• Multiplying the sum and the difference of two terms,e.g.: (8x6y7 + x9y6)(8x6y7 − x9y6) =, and 64x16y14− 36x8y18 =
• Exponentiation and multiplication,e.g.:4x3y(−4x+ y)2 =, and 4x3y − 4x2y2 + xy3 =
• Multiplying the sum and the difference of two terms and multiplication,e.g.: 3xy2(5x4 − 4y2)(5x4 + 4y2) =, and 36x11y4 − 16x3y10 =
• Mixed type of exercises: randomly chosen 2-2 from the former examples.
• Complex exercises, e.g:3x3(4x3y4+2xy4+4y2−x4)− (4x44y2−3y3)(−3x4y4+y)+4xy(−2y3+5)2 =
4.2 10th form
In the 10th form the aim of applications was making and solving quadratic equationsand related exercises. Therefore it was indispensable to generate not only a syntacticvisualized part but a solving part also. Thus the source-code became more complexand it could use the benefits of object-orientation by Java. The options are shownin Figure 2.

28 Judit Boda
Figure 2: Quadratic Equation
By parameters it can be stated that the wanted equation is incomplete or com-plete. It can be given that the coefficient of the linear term or the rate of the constantis 0. In case of complete form the number of solutions can be also eligible. Also I paidattention to get a “nice” solution. It means that underneath the radical sign thereis always a radicant. It seemed that the problem could not be solved by randomlygenerating of the three coefficients. Actually it is not the equation but the definitionof its roots which is generated randomly. Then the roots are considered as fractionsseperating the rates of numerator and denominator into the simpliest forms. Havingthe coefficient of the roots and the quadratic term the other coefficients can be cal-culated easily with Viete-formula. And it gives an equation: ax2+ bx+ c = 0, a 6= 0,where a, b, c ∈ Z.
Of course before the students get the quadratic equations they have to be struc-tured and then we can use the formulaof solution. And again I generate an unstruc-tured version randomly with helping of two functions. Sometimes it can happenthat the students have to work with huge numbers but the solution is acceptable.
In the case of converting into products and simplification of algebra fraction itis very important that the equation must be a root. In the case of fraction we haveto consider that the two expressions must have common root.
The next expension is the case of quadratic inequalities. Here the challenge israther how to prepare the solutions.
At the present the next types of exercises can be generated:
• Incomplete quadratic equation, e.g.: x2 − 8 = 0, and x2 − 2x = 0
• Solvable equation by formula, structured form, e.g.: 10x2 − 27x+ 14 = 0
• Solvable equation by formula, instructured form,e.g.: 62x2 − 157x+ 38 = 2x2 + 5x+ 8
• Converting products, e.g.: 10x2 − 19x+ 7 =
• Simplify a fraction, e.g.:9x2 − 29x+ 6
9x2 − 4x+ 4=
• Applications of Viete-formula, e.g.: Without solving the equation answer howmany roots the next equation have got and how much the sum and product ofroots are! x2 + 4x+ 11 = 0

Applications of informatics in teaching algebra 29
Figure 3: Solution of Quadratic Equation
For faster checking and assessment the program displays the main stages of thesolving process through giving the coefficients whether the form is structured ornot. Thus we can have the partial results too. With it checking a worksheet -consists of 20 exercises - lasts for only 10 minutes.
After we start to use it we have to chose what we want to generate: eitherexample or result. The solving process of exercises lasts until the user stops it. Sothere is opportunity to use the program during checking. It is shown in Figure 3.
5 Results
Firstly I tried the “small-sheet” method named by students and the way of practiceabove int he 9th form in the school-year 2010/2011. Then I have continued to useit in this class this year.
According to my experience the students solve the tasks with pleasure and en-thusiastically. Every beginning of lessons they are excited whether they get or notred point, what the next range of tasks will be and their exercises are more difficultor their classmates’. The students chose one of the tasks which are on the table.They enjoy doing that even if their classmate is absent they chose for them too. Ithink its success is that they feel it more personal than the coursebook. They knowthose tasks are just for them. The students appreciate the work which is behindthe exercises. Their enthusiasm is shown by that there were weeks when it was notnecessary to have new range of tasks because of the material and the students weredisappointed.
Until now there has not been any problem about that they do not do their owntasks. So I have not had to take sanctions. Sometimes it happened that they had

30 Judit Boda
not brought their tasks in time but they had good reasons to explain it. But as soonas it was possible they tried to make up leeway.
My opinion is that there is worth correcting their homework because the students’attitude is becoming better and better and they think of learning maths as a possibleway and they attend to the lessons with pleasure.
Of course the learning of material is also a significant goal. We managed toachieve it. The students could solve the tasks easily and confidently for the endof the term. These results made me glad and I was expecting eagerly the nextterm (September, 2011). In that class there became more students. But the for-mer students’ results were very good and satisfying. During the review they couldremember the solutions of tasks and there were no problems with converting intoproducts. Only those who had not attended regularly for the lessons or who hadjust joined the class could have good results. After classes I tried to explain thematerial to them again and again.
I hope the same results will be solving quadratic equations and quadratic in-equalities. It would be good when they have to solve a quadratic equation in theirfurthur study and they will be able to do it easily.
6 Conclusion
According to my opinion if there are exercises which are needed to practice regu-larly, the “small-sheet” method can be a long-term successful solution. Hereby thestudents have successful experience and they recognize how to achieve good resultsif they work persistently. Due to the methods above mathematics became liked bystudents. Later we can see how long-term their effectiveness are when the studentshave to use their acquired knowledge.
Due to informatics the teachers’ huge work can be easing up. The range of taskscan be prepared and solved much more easily.

Scientific Issues, Teaching Mathematics III: Innovation, New Trends, Research. Ruzomberok 2012
The development of disadvantaged pupils with
GeoGebra
Laszlo Budai
Korosi Csoma Sandor High School
Hungary, 3170 Szecseny, Rakoczi Street 90.
Abstract. According to the tendency of the past 15 years, the number ofstudents in primary schools is decreasing nationwide. Parallel to this, the numberof disadvantaged students is increasing, exceeding one third of all students. Thisgreatly affects students’ value and behaviour brought into school. It is extremelydifficult in case of these students to find a way that would lead to the developmentof self-motivation not only in the field of Mathematics but also that of generalapproach to studying. Within this, GeoGebra as a dynamic geometric systemhas proved to be very effective when developing disadvantaged students. I wouldintroduce my observations in reflection of the past three years (2008–2011): theviewpoint for me was not only describing cognitive qualities quantitatively but Ialso emphasized the affective and psychomotoric factors.
Keywords: disadvantaged pupils, GeoGebra, spatial geometry.
Classification: G40, G80, C30, R20, U70.
1 Introduction
In the last 10-15 years, huge social changes took place in Hungary. The number ofdisadvantaged (and occasionally within this figure the number of multiple disadvan-taged) pupils increased greatly. These changes of high extent implied the necessityof altering education-control. It could be regarded as a basic task to compensate thedisadvantages originating from the social circumstances of these pupils as intenselyas it is possible and prepare them to deal with the norms, psychological attributesexpected by the society. [1] [3] The LXXIXth Law’s 121.§ from year 1993 on pub-lic education in its “Interpretative Provisions” determines disadvantaged, multipledisadvantaged status as the following:
“Disadvantaged” child, pupil: a person whose right to receive regular child pro-tection subsidy was determined by the notary, on the basis of family circumstances,social status; within this group the definition of multiple disadvantage is appliedto: the child, the pupil whose parent maintaining legal supervision – according tohis or her voluntary statement in the regulated procedure on child protection andguardianship administration – in the case of a kindergarten child, the child at theage of three, in the case of a pupil at the time of the start of compulsory educa-tion has maximally finished the eighth grade of school successfully regarding studies;multiple disadvantaged status is also valid for the child, pupil who has been takeninto durable education.
According to some opinions the concept of multiple disadvantaged status wasexpressly created by the public educational code, which would designate the causerelated to education (and only to education), which would lead to the child’s socialdependence. Namely that the parents’ low educational qualifications are the indirectcause, why the family is socially in need for support: due to their low level ofeducation there is no need to employ them on the employment market, or theirincome is so small that they reproduce unemployment through generations.

32 Laszlo Budai
Rozsa Mendi [4] during one of her research, which brought very interesting re-sults, has stated that the discrimination originating from the disadvantaged status(from society, classroom community. . . ) is a serious psychological problem, andgiven of its nature it can be taken as an acquired cultural sense of shame. The con-sequences, symptoms given from this shame and internalized oppression continuallyintensify which would lead to the present conditions and changes in progress.
The critical problem, as we can see it above, has been already mentioned – inHungary pupil numbers are decreasing but in parallel the number of disadvantagedpupils is increasing, so we can talk about proportionately significant changes (Ta-ble 1):
Primary School - statistical data
School year Total number ofpupils (persons)
Number ofdisadvantagedpupils (persons)
Number of multipledisadvantaged
pupils (within thedisadvantaged)
(persons)
2006/2007 831 262 217 328 61 4942007/2008 811 405 228 349 85 7982008/2009 790 722 241 739 100 1192009/2010 775 741 257 335 106 539
Table 1: The development of primary school pupil numbers
This tendency can be extended to a number of other countries as well. Thisheavy social legacy was left to us mostly by the last 15 years. Since this processhas already played out in some countries (for example in the US in the 70’s), asa method of idea acquiring, the measures, methods that were introduced there inorder to stop/reverse the process could offer a proper basis for us too, but otherattempts, efforts have seen the light as well.
Some of these without the attempt of a full description:
• competence based education (EU Lisbon decision, 2000) competitiveness inthe labor market
• new education methods (project, cooperative, student abstract. . . )
• differentiated occupational organizations
• Integrative Pedagogical System (IPS)
• Skill-development preparations
• Arany Janos programs
• digital education organization (education-organization supported by IKT tools,e-curriculum, the usage of teaching aids).
• . . .
The basic educational task of mathematics would be to form psychological at-tributes in the pupils that are essentially necessary to fit in the society, and to offeran applicable knowledge which is a requisite for the people nowadays, supported bythe model of lifelong learning.

The development of disadvantaged pupils with GeoGebra 33
A precondition for the above mentioned requirements is the formation of a propermotivational basis in the pupils. To create this in the case of disadvantaged pupilscould mean an even greater challenge. According to my experiences (due to so-cial/financial circumstances) the inclusion of the computer into mathematics classescreates this kind of a motivational basis among the pupils. Based on the followingpoints of view the GeoGebra, as a development tool, is perfect for achieving theobjective:
• The pupil’s point of view: easy operation, lucidity, in Hungarian language.
• The educational institution’s point of view: the software included in the teach-ing-learning process should be accessible for everybody for free if possible (inthe institution and at home as well).
• The teacher’s point of view: a simple user surface (teachability), at the mean-time utilizing as many opportunities as possible, lots of aiding materials, de-velopmentability, wide range of newer and newer possibilities.
• The educational management, mathematical-didactic and social changes of thelast 10-15 years.
The motivation does not only have to be aroused but reinforced as well withplanned, purposeful development. According to the opportunities of applying asmany tools and methods as possible → we cannot know that in the case of individualpupils by what effect does the design of individual schemes make progress. [2]
2 Results and proofs
The schedule of the research is estimated to the period between August 2008 andJune 2011 which means that the examination took 3 school years. The location was aprimary school in a village, where we had to count with on the average 80% of pupilsof Roma minority proportion yearly and with 60% of pupils with disadvantagedstatus proportion from year to year. This presupposed the Integration PedagogicalSystem’s one level higher on the part of the institution, because of which some pupilsreceived Skill-evolving development.
During the observations we must pay attention to that disadvantaged status doesnot always by all means walk in parallel with the ”less talented” marker. Amongthe disadvantaged pupils a person can emerge who shows talent in some territory,so besides the compensational development we must be attentive to offer talentmanagement fitting to his or her personality.
GeoGebra as a DGS, on the basis of my experiences that I gained in the last5 years, offers an excellent opportunity during the development work and the nur-turing of talents. The research strategy was realised in a control group experimentin which I held lectures for an experimental group using Geogebra too, (besides thetraditional tools). The control group which worked without the inclusion of com-puters and GeoGebra, was lead by a teacher-colleague. This way we excluded therisk that we would even unintentionally influence the results for the benefit of eithergroups.
The research method is cyclically operationalized which involves the observationof both the quantitative (the examination of cognitive factors) and the qualitative(affective and psychomotoric) factors. Even though the second part is not held asignificant point of view by many, I paid an emphasized attention to those factors

34 Laszlo Budai
as well because I found that especially in the case of disadvantaged children thesecould be very important factors to explore the real motives regarding mathematicsand studying in itself.
The examination model was the current 8/a and 8/b classes, approximately with20-20 pupils, where pupils in the 8/a class in the last 3 observed school years havefallen short compared to the pupils of class 8/b on the basis of input measurementswith regards to performance. Each pupil was able to use a computer – thanks to anumber of the institution’s successful tenders, two computer rooms containing 20-20computers were established.
I find it important to remark in what station do these pupils are with regards topsychological perspectives (on the basis of the division according to Piaget):
• Internalized concreteness: the child is able to imagine activities with concreteobjects, which are not in his or her environment.
• Reversibility: the child is able to reorganize objects, and to imagine a concreteoperation in a reverse direction.
• Decentralization: the child is able to focus on several aspects in the samesituation and recognize connections.
Increasing security can be regarded as a main progress step in the execution oflogical conclusions. Unfortunately my experience is that in the case of many pupils,not only does this development level delay, but it would not even take place ever. It isvery important to pay attention to this point of view during inquiries, developments.
Before we started to develop with GeoGebra there were some previous problemsthat we had needed to solve. First, there was a high-level of undevelopment regardingthe pupils’ skills related to IT tools (the lack of PCs, mobile phones at home), thisshould be compensated during lecture even outside classes in co-operation with ITteachers and colleagues.
Secondly, before the introduction of GeoGebra development, we had to modifythe schedule of development, according to a foreseeable curriculum. I did this at theexpense of theoretical lecture/lesson-sections, because I think that manual activi-ties are also very important besides virtual demonstration, since GeoGebra cannotsubstitute and never can fully replace the “take it to your hand” type learning,conceptualization. Pay attention to use GeoGebra implemented by the inventory ofpreviously applied tools.
We have mapped out three possible dimensions of the pupils’ disadvantagedstatus in the educational institution which served as the location of the researchwith the help of form-masters (Diagram 1).
70% of disadvantaged pupils live amidst difficult financial circumstances, fur-thermore it can be stated that 52% of them besides the financial circumstances isdisadvantaged both from emotional and communicational perspectives. Of coursethe pupils’ financial circumstances have a critical influence on their performances inthe educational institutions: how can one expect the preparation of the homeworkfrom for example a pupil who has no desk, pencil or in a more radical instance foodat home.
Besides cognitive measurements, I performed the examination of pupils’ affec-tive factors on the basis of a modified Claus-type questionnaire, which revealed thefollowing:
• 76% of the pupils do not like mathematics.

The development of disadvantaged pupils with GeoGebra 35
Diagram 1: The three possible dimensions of the pupils’ disadvantaged status
• Most of the pupils do not like to solve geometric exercises.
• Most of the pupils do not like to solve more difficult exercises.
• 90% of the pupils are motivated by the use of computers on mathematicsclasses.
Last but not least, we must not forget about psychomotoric factors, in connectionwith which the main tasks are the following: [3]
• The clear, bright and simple record of task solutions.
• The skillful usage of callipers, ruler and other tools.
• Freehand drawing and sketching.
• Preparing models.
• The proper operation of computers.With the traditional caliper-ruler drawings implemented with the GeoGebra, in
my opinion we can meet the above mentioned expectations. In the following sectionsI will expound the tasks supported by GeoGebra topic by topic.
2.1 Pythagorean-Theorem
The Pythagorean-Theorem is one of the most determining theorem in primary schoolmathematics-education. Later this theorem has to be applied with several taskswhich require more complex (spatial) solutions.
Two different worksheets will be demonstrated: one of them serves to confirmthe theoretical background, implying to arouse the need for a correct demonstration(Figure 1).
The other worksheet tries to offer help through an everyday example regardingthe application of the Pythagorean-Theorem (Figure 2).
By applying the dynamism and interactivity of GeoGebra, the pupils may changethe various input parameters, by this confirming connections and indicating thatmathematics is not a self-serving matter, but it surrounds us and it is present innature.
2.2 Spatial Geometry
The development of spatial approach is very important for me, since in everyday lifewe live in space as well, and in many cases this space is reflected to planes (maps,

36 Laszlo Budai
Figure 1: Implying the demonstration of Pythagorean-Theorem
Figure 2: A possible application of the Pythagorean-Theorem
photographs, instruction manuals for tools. . . ), this way it is vital that the pupilshould be familiar with processes originating from space-time connections.
Regarding this topic, the following was presented with the help of GeoGebra:• Grouping objects
• Different views of objects
• Network of objects
• Object surface, volumeA large group of GeoGebra worksheets, which serve to demonstrate different
kinds of object views, can be found on the http://dmentrard.free.fr/GEOGEBRA/Maths/accueilmath.htmwebsite. This is a fantastic collection which includes morethan 300 GeoGebra worksheets that are related to space, and its application in theclassroom proved to be very progressive (Figure 3).
It is worth to take a look at almost all of them with the pupils, they will enjoyit very much.

The development of disadvantaged pupils with GeoGebra 37
Figure 3: Displaying a sphere in GeoGebra 4.0
I have also applied self-made worksheets in this section (Figure 4).
Figure 4: Rotatable cube and other spatial formations
These worksheets proved very useful regarding the discussion of the connectionsbetween different objects and their visualization opportunities: who would think atthe sight of a square that it could even be a cube from a certain perspective.
The manual activities aided by GeoGebra proved to be more effective with re-gards to computations related to surface and volume too: more correct solutionswere evaluated in the cases of such tasks in the experimental group than in thecontrol group.
The survey closing the topic section indicated that from the perspective of thepupils’ development, in the case of the experimental group, the worksheets, used to

38 Laszlo Budai
demonstrate the network of objects, have effectively supported the models that arehandheld.
Figure 5: The case of the spider and the fly
I find it a very nice task to find the geometrical location of a point which is inmotion in some way: the fly and the spider are in two opposite points of the cube.On which path could the spider get to the fly by moving on the surface of the cube?(Figure 5)
The measurements () prove that although the pupils’ input performance fromclass 8/b fell a little short to the control group’s performance, they managed to catchup and exceed the control group’s performance related to certain spatial tasks.
2.3 Planar transformations
A number of well applicable worksheets are available for this topic on the officialwebsite of GeoGebra. I start this topic section among many others with a self-madeplayful worksheet which serves to confirm the concept of congruency.
Task: Match the formations that are congruent! Watch out, there’s an odd one,too! (Figure 6)
Figure 6: Match the formations that are congruent!

The development of disadvantaged pupils with GeoGebra 39
The self-verification can be realized with the help of a usual selection box. It isimportant to make the pupil aware of the definition of congruency that with regardsto congruency’s point of view, we don’t care about color, texture or disposition, onlyabout the form and the size.
After browsing the sheets found in GeoGebraWiki according to the topic sectioneach pupil had to prepare his or her own GeoGebra worksheet which demonstratedan optionally selected planar transformation. Some of these pupil products can beseen below (Figure 7).
Figure 7: GeoGebra worksheets prepared by pupils
The independent completion of a task in GeoGebra helped the pupil to esteemhis or her own and in the same time other pupils’ work and it could offer a foundationto meet the expectations of nowadays IT society, namely the usage of IT tools, forwhich certain parts people have to discover on their own, without external help.
2.4 Functions
I divided the function topic basically to the following categories:• The systematization of what the pupils learned about the functions’ transfor-mation
• Linear functions
• The absolute value function
• Quadratic functions
• Other functions (linear fractional functions, higher level functions, a mixtureof previously known functions. . . )
GeoGebra offered great help for the pupils since we know about ourselves thatif we work with a static figure (into a notebook or on the blackboard) then in thecase of a single function the picture of the characteristic attributes, diagrams andthe demonstration of different variable and value transformation is a quite lengthyprocess and it requires several pages of drawing.
Because of its DGS quality, within one worksheet, practically all possible dispo-sitions of a function can be covered, or even more of them also with the objective ofcomparison (Figure 8).
In this topic section I alternately used GeoGebra and the traditional callipers-ruler drawing: in GeoGebra I demonstrated the images of the function for the pupils

40 Laszlo Budai
Figure 8: The relationship of various functions’ transformed units
and in the notebook we performed several function rendition, after which we returnedto GeoGebra again applying all of its advatages.
2.5 Preliminary examinations and results gained
In all cases input and the output measurements were identically concerned: theoptimal acquisition of the curriculum defined by the skeleton curriculum was pre-supposed.
The following diagram (Diagram 2) characterizes the initial conditions, accordingto averages of input measurements, spread and relative spreads at the beginning ofschool years:
Diagram 2: Results of complex input measurements
On the basis of the diagram, we can observe that input measurement resultsshow almost identical performance/ability groups, although some differences wereseen every year: the experimental group performed less compared to the controlgroup by 3-5% each year.

The development of disadvantaged pupils with GeoGebra 41
The following 3 diagrams (Diagram 3, Diagram 4, and Diagram 5) show theresults of complex input and output measurement results broken down into schoolyears compared to each other:
Diagram 3: Comparing measurements 2008/2009
Diagram 4: Comparing measurements 2009/2010
Diagram 5: Comparing measurements 2010/2011
On the basis of the diagrams the following can be stated:• in each case the development of the GeoGebra experimental group showed afaster pace

42 Laszlo Budai
• the GeoGebra group despite starting with a few % of drawback at the startof the school year, managed to catch up (in school year 2008/2009 it evenexceeded the results of the control group as it can be seen in the school year’sfinal measurements)
• The rate of development in the case of the control group was respectively 1; 2and 2.5% compared to the conditions at the beginning of
• The rate of development in the case of the GeoGebra group was respectively4.5; 3 and 4% compared to the conditions at the beginning of the year
Besides the above mentioned quantitative natured characterization, follow-up theClaus-questionnaire indicated that the inclusion of computers motivated the pupilsin a very great proportion. According to one of the sayings of Gyorgy Polya, mathteachers have to be like good merchants: they have to persuade the customer tobuy the goods. [7] In my opinion this can be primarily achieved by influencing thepupils’ affective factors. And if we have achieved with regards to the pupils thatthere is a certain motivational base (as a consequence of the pupil’s attitude towardsmathematics) on which we can build on, then with purposeful, planned developmentwe will be able to affect the cognitive and psychomotoric factors as well.
The experimental period was characterized by a continual methodological con-trol, which besides including many others were the following:
• The continual observation of 8/a and 8/b during the last 3 school years
• Claus-type questionnaire
• A pupil satisfaction questionnaire related to the usage of computer and theinclusion of GeoGebra
• The continuous oral questioning of pupils with regards to classroom experiences
• The collection, analysis of independent products (independently prepared Geo-Gebra work sheets, documents. . . )
3 Conclusion
The demonstrable advantages of Geogebra’s usage among disadvantaged/multipledisadvantaged children were the following:
• Creating motivational base for pupils
• Helping the schemes’ individual design (assimilation, accomodation)
• Facilitating the development of cognitive abilities, thinking process (crossinginto the stage of formal operations)
• Improving affective factors (a more positive attitude towards mathematics, theusage of computers in classroom motivates pupils)
• The development of psychomotoric abilitiesDuring the observations of the 3 school years I experienced the following: among
pupils who were difficult to motivate happened that sitting in front of GeoGebra,they worked through most of the class attentively.
The most important result for me is that a pupil came to me in the break, andtold me the following about a GeoGebra class:
“Professor, when we are going to play again?”
(Roland Racz, a pupil from class 8/b)

The development of disadvantaged pupils with GeoGebra 43
Acknowledgements
The author has been supported by Miklos Hoffmann and Jan Guncaga.
References
[1] Dr. Czegledy Istvan, Dr. Orosz Gyulane, Dr. Szalontai Tibor, SzilakAladarne: Matematika tantargy-pedagogia I. (Bessenyei Gyorgy Konyvkiado,Nyıregyhaza, 2000, foiskolai jegyzet)
[2] Guncaga Jan: GeoGebra as a motivational tool for teaching according newcurriculum in Slovakia. In: GeoGebra The New Language For The Third Mil-lennnium, Zigotto – Printing & Publishing House Galati, Romani, 2011, p.278–282. ISSN 2068-3227.
[3] Dr. Ambrus Andras: Bevezetes a matematikadidaktikaba. Egyetemi jegyzet.ELTE Eotvos Kiado, 1995.
[4] Sallai Eva, Szilvasi Lena, Trencsenyi Laszlo: Modszerek a hatranyos helyzetutanulok iskolai sikeressegenek segıtesere (Educatio Tarsadalmi SzolgaltatoKozhasznu Tarsasag, 2008)
[5] http://www.geogebra.org/cms/ (Downloaded: 2010.12.16)[6] http://zeus.nyf.hu/~kovacsz/GeoGebra/kovacs_zoltan_b.pdf (Down-
loaded: 2010.12.16)[7] Polya Gyorgy: A gondolkodas iskolaja (Akkord Kiado, 2000)[8] Kamariah Abu Bakar, Ahmad Fauzi Mohd Ayub, Rohani Ahmad Tarmizi: Ex-
ploring the effectiveness of using GeoGebra an e-transformation in teaching andlearning Mathematics, Advanced Educational Technologies, 978-960-474-186-1
[9] http://www.fictupproject.eu/images/9/9a/FICTUP_Public_Case_Report_FR_EDC-GeoGebra.pdf (Downloaded: 2011-04-09)
[10] http://www.geogebra.org/en/wiki/index.php/Hungarian (Downloaded:2011-04-09)
[11] publications.uni.lu/record/4584/files/BzMU10_GeoGebraPrim.pdf(Downloaded: 2011-04-09)
[12] http://cermat.org/i2geo2010/downloads/files/I2GEO2010-Kreis.pdf(Downloaded: 2011-04-09)
[13] http://www.geogebra.org/publications/mhohen_diss.pdf (Downloaded:2011-04-09)
[14] Richard, P. R., Fortuny, J. M., Hohenwarter, M. & Gagnon, M. (2007). Geo-Gebra TUTOR: une nouvelle approche pour la recherche sur l’apprentissagecompetentiel et instrumente de la geometrie ? l’ecole secondaire. Proceedingsof the World Conference on E-Learning in Corporate, Government, Healthcare& Higher Education of the Association for the Advancement of Computing inEducation. Quebec, Canada


Scientific Issues, Teaching Mathematics III: Innovation, New Trends, Research. Ruzomberok 2012
Report on Mathematics “Test Zero” at Budapest
University of Technology and Economics in 2011
Aniko Csakany
Institute of Mathematics, Faculty of Natural Sciences
Budapest University of Technology and Economics
H-1111 Budapest, Egry J. u. 1.
Abstract. It is essential for higher education institutions to implement strategiesor steps to improve the teaching methods used in mathematics sessions, so as tosubsequently reduce the problem of non-completion. As one element of these stepsfreshmen admitted by the Budapest University of Technology and Economics(BME) are required to take a test, called “test zero” in mathematics since 2009.This paper pictures the story of mathematics “test zero”. The 2011 results of all3300 participants are presented and attention is called to typical mistakes. Someof the most important and interesting conclusions are highlighted.
Keywords: Teaching mathematics, assessment, admission system, higher educa-tion, high-school graduation.
Classification: B40; D60; D70.
1 Introduction and background
Mathematics is vital for engineers but its role is changing. In 2011 SEFI (EuropeanSociety for Engineering Education) Mathematics Working Group (MWG) producedthe first revision [1] to their own report on a mathematics curriculum for engineers[2]. In this 2011 revision report they say: “Mathematical competence is the ability torecognize, use and apply mathematical concepts in relevant contexts and situationswhich certainly is the predominant goal of the mathematical education for engineers.”
In the 2002 report “Mathematics for the European Engineer, a Curriculum forthe Twenty-first Century” [2] they noted that “in increasingly more countries, thereis concern over the deterioration in the mathematical ability of new entrants to en-gineering degree programs. However, in increasingly more countries there is concernover the deterioration in the mathematical ability of new entrants to engineering de-gree programs.”
Hungary is no exception to this experience. There are increasing concerns inHungary about the skills and competencies of students entering higher education.A nationwide survey was conducted among university students and a study aboutmathematical preparedness was published in 2009 [3]. A lack of mathematical com-petencies and abilities has been identified as a factor resulting in non-completion ofcourses in Hungarian higher education institutions.
Admission points are based only on high school achievements in the Hungarianenrolment system. Points are calculated on the results of the final exams (gradua-tion exams) in two high school subjects, one of which is typically mathematics forapplicants for engineering programs. The maximum of total admission points is 480including extra points. 400 points are based on the grades in the last two yearsof secondary school as well as/or the results of the graduation exams, while appli-cants may earn a maximum of 80 extra points for extra achievements. High school

46 Aniko Csakany
students are given options before they sign up for the exams: they may take thegraduation exams at advanced or intermediate level in each subject. The advancedlevel exam is more difficult, covers more topics and has a written and an oral part.The intermediate mathematics exam only has one written part. It is more likelythat one can earn better test scores at the intermediate level. Even though studentsare encouraged to choose advanced level exams by the possibility that they may earnan 40 extra points for each very few of them makes this choice.
Pilot programs for measuring the mathematics knowledge of freshmen when theystart their studies were introduced at different institutions of higher education inmany countries [4, 5] and also in Hungary [3, 6, 7] during the past few years. A na-tionwide assessment of freshmen was introduced in mathematics, physics and chem-istry in 2009 according to a former decision of the Panel of Rectors and Presidents ofHungarian Technical Universities and Colleges. Papers about the distressing resultswere published [8].
Budapest University of Technology and Economics (BME) with its 23 000 stu-dents is a leading institution in engineering in Hungary. Lecturers and professorsin mathematics of BME also have the impression that preparedness of freshmen isbecoming worse and worse every year. The failure rate is increasing together withthe proportion of dropouts or withdrawals. To maintain the necessary standardshas become a challenge. This has created the need to identify why so many stu-dents struggle with mathematics. The idea of adding “test zero” to items of thecourse requirements of first semester mathematics courses was motivated by the factthat students are not required to take an admission exam and the university has noother information about the knowledge and the educational background of the stu-dent than his/her total number of admission points. A report on the results of 2010test zero was formerly presented [6]. Some parts of that study are used in this paper.
2 Objectives and methods
The goals of “test zero” are• to define clearly the prerequisites of first semester mathematics,
• to enforce students to refresh their former knowledge in mathematics,
• to test certain mathematical competencies,
• to give feedback to students at the very beginning of their studies,
• to give the opportunity to students who have failed to sign up for make upcourses to improve their skills,
• to obtain data about the mathematics background of freshmen: to get informa-tion about how the total admission points and the test scores are correlated;to get information about how the level of the high school graduation exam(advanced or intermediate) in mathematics and test scores are correlated; toget a list of topics in which the students were less successful,
• to give feedback to secondary school teachers and educators.Students took the test in the second week of the fall semester on 12th September
2011 [9]. The time for the test was 50 minutes, the paper-based test included 15

Mathematics “Test Zero” at BME in 2011 47
multiple choice questions with 5 possible answers of which exactly one was correct.Students had to write the code (A, B, C, D or E) of the correct answer into theanswer box. Since the number of participants was so large, 6 different versions ofthe problem sheet were used with all similar problems.
Students were not allowed to use pocket calculators, formula books or formulasheets. One correct answer was worth 4 points, one wrong answer was worth -1 pointand the student got no score (zero point) if he/she had left the answer box blank.The maximum test score was 60, the minimum test score was -15 points. Test wassupposed to be successful if its score was above 24 points (40%).
To set up the items of the test we also studied• Hungarian high-school curricula,
• placement tests of several universities including ones in or outside Hungary,
• the PISA assessments,
• admission exams of the former Hungarian admission system,
• competency based curriculum recommended by the European Society for En-gineering Education (SEFI) Mathematics Working Group [1, 2].
Instructions and a sample test were available on the website of the Institute. A3-day make up course was offered to students during the registration week. Theparticipants were first year students of BME, among them bigger groups of studentsof the following faculties:
• Faculty of Civil Engineering (380 students)
• Faculty of Mechanical Engineering (699 students)
• Faculty of Chemical and Bioengineering (291 students)
• Faculty of Transportation Engineering and Vehicle Engineering (346 students)
• Faculty of Electrical Engineering and Informatics (938 students)
• Faculty of Economic and Social Sciences (592 students)
• Faculty of Natural Sciences (98 students)
The number of all participants in mathematics “test zero” was 3344 in September2011. The answer codes were recorded into an Excel file by student workers in onenight. The lists with the total scores of all 3344 participants were available on theinternet in less than 24 hours after the test was taken [9].
3 Results
3.1 Total admission points and test results
Figure 1 shows the distribution of test scores for all participants.In order to gain an overall view of how the admission points and test scores are
related we show Figure 2. On Figure 2 every point represents one student, identicalpoints may appear. A major part of the box is almost uniformly spread by points.Having a student with excellent admission points we can hardly suggest what we

48 Aniko Csakany
Figure 1: Distribution of test scores for all participants
Figure 2: Admission points and test scores for all participants in 2011
can expect from him/her in mathematics and knowing that the student has a badtest score we can not conclude that he/she belongs to the lower group with respectto admission points. But if the student has a good test score (above 75%) it is morelikely that he/she will have good admission points (above 400). Based on the figuresone may assume that the correlation between test results and admission points is notvery strong. Admission points give us insufficient information about the knowledgeof the student.
Even though lots of students have excellent admission points, students with non-traditional mathematics backgrounds are at a risk of struggling with problems of“test zero” and consequently with the other requirements of college-level mathemat-ics courses, due to possible gaps in their mathematical knowledge.
3.2 The level of high school graduation exam in mathematics and testresults
Knowing that high school students may make a choice on the level of their gradu-ation exam in every subject it is not surprising that very few of them choose the
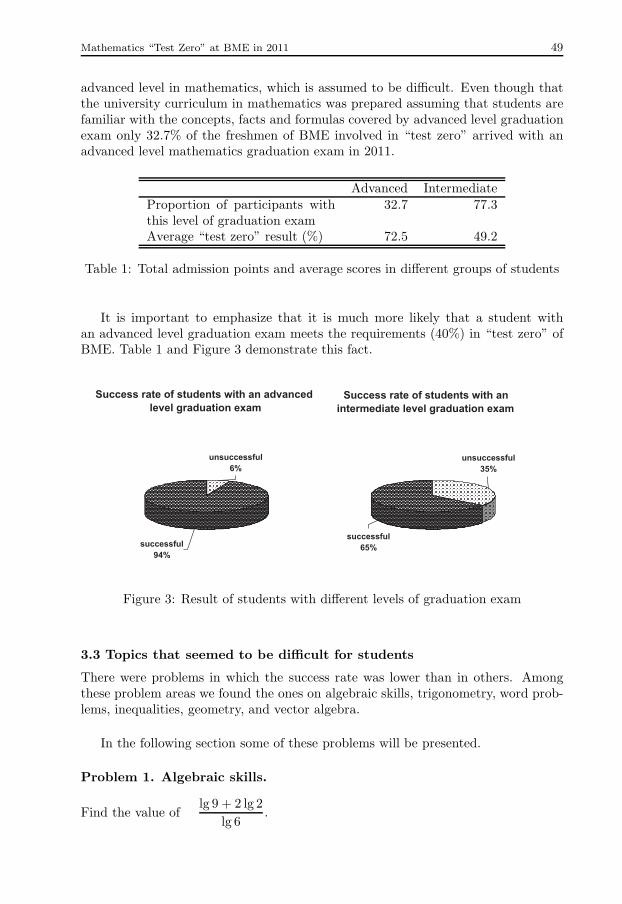
Mathematics “Test Zero” at BME in 2011 49
advanced level in mathematics, which is assumed to be difficult. Even though thatthe university curriculum in mathematics was prepared assuming that students arefamiliar with the concepts, facts and formulas covered by advanced level graduationexam only 32.7% of the freshmen of BME involved in “test zero” arrived with anadvanced level mathematics graduation exam in 2011.
Advanced IntermediateProportion of participants withthis level of graduation exam
32.7 77.3
Average “test zero” result (%) 72.5 49.2
Table 1: Total admission points and average scores in different groups of students
It is important to emphasize that it is much more likely that a student withan advanced level graduation exam meets the requirements (40%) in “test zero” ofBME. Table 1 and Figure 3 demonstrate this fact.
Figure 3: Result of students with different levels of graduation exam
3.3 Topics that seemed to be difficult for students
There were problems in which the success rate was lower than in others. Amongthese problem areas we found the ones on algebraic skills, trigonometry, word prob-lems, inequalities, geometry, and vector algebra.
In the following section some of these problems will be presented.
Problem 1. Algebraic skills.
Find the value oflg 9 + 2 lg 2
lg 6.

50 Aniko Csakany
Number of answersA 132 16%B 153 18%C 12 1%D 7 1%E 287 35%
Blank 240 29%Total 831 100%
Table 2: Distribution of answers in problem 1
(A) 6(B) lg 6(C) 1/6(D) 1(E) 2
831 students were asked to answer this question. The distribution of the answers isshown in Table 2.
The ratio of the correct answers (E) was only 35%. Though the ability to usealgebraic formulas correctly should have already been developed by the time offinishing secondary education, more than one third of the students proved to bewilling to accept false answers. One may notice that students chose the distractors(A) and (B) with an extremely high rate.
Problem 2. Vectors, scalar product.
Given the vectors a(−1; 1) and b(2; 4) find the cosine of their angle.
(A) − 1√2
(B)1√2
(C) − 1√5
(D)1√5
(E) none of these
831 students were asked to answer this question. The distribution of the answers isshown in Table 3.
The ratio of the correct answers (D) was 56%. The relatively high rate of correctanswers and the fact that only 27% of the students left the answer box blank thisyear is likely due to the fact that exactly the same problem had been asked formerlyin each and every problem sheet that were all available for students in the internet.Good news is that the rate of correct answers is increasing with time. The universitycurriculum was prepared assuming that students are familiar with the concepts andformulas of basic vector algebra like dot product of vectors. Lecturers and instruc-

Mathematics “Test Zero” at BME in 2011 51
Number of answersA 10 1%B 46 6%C 23 3%D 465 56%E 35 4%
Blank 252 30%Total 831 100%
Table 3: Distribution of answers in problem 2
tors of BME have to learn that the ability of students to identify and use formulaslike the dot product correctly is limited though it is a basic requirement in othertechnical subjects also.
4 Conclusions
The study presents informative findings and results from a recently conducted surveyof mathematics knowledge of BME students when they enter higher education.
Conclusions that were obtained from the analysis of the test results in 2011 arepretty much the same as those of 2010 [10], namely:
1. Admission points and test scores are hardly related. This means that admissionpoints can not be used to predict the performance of the student.
2. The rate of success in the test is closely related to the level of the high schoolgraduation exam in mathematics. Students who arrive with an advanced levelexam are more likely to meet the 40% result, the required standard in “testzero”.
3. Several students enter higher education in the engineering programs of BMEwith insufficient knowledge of mathematics.
4. The topics that seemed to be more difficult for students or in which the successrate is lower are identified: algebraic skills, including ability to use identitiesfor logarithms, trigonometry, geometry, word problems, inequalities, vectoralgebra.
5. Diagnostic testing (and the followup support) can help student retention andhence save time and money for both students and university.
Seeing these results, BME decided to open extra elementary bridge-gaping mathe-matics courses that offer the additional benefit of aiding the students in their tran-sition into higher education. In the fall semester of 2011 1074 students registeredfor such an extra course.
With the current eclectic mix in the background and abilities of current students,all programs in which mathematics is an obligatory subject should use this kind of

52 Aniko Csakany
diagnostic testing on entry. It is essential for higher education institutions to im-plement strategies or steps to improve the teaching methods used in mathematicssessions, so as to subsequently reduce the problem of non-completion. The provisionof mathematics support through extra elementary courses seems to work successfullyat BME.
References
[1] European Society for Engineering Education (SEFI): A Framework for Mathe-matics Curricula in Engineering Education, First Revision of Report bythe SEFI Mathematics Working Group “Mathematics for the European En-gineer: A Curriculum for the Twenty-First Century”. 2011, Accessed viahttp://sefi.htw-aalen.de/ (March 10, 2012)
[2] European Society for Engineering Education (SEFI) Mathematics WorkingGroup (MWG), Mustoe, L. and Lawson. D. (Eds): Mathematics for the Euro-pean Engineer: A Curriculum for the Twenty-First Century. 2002, Accessedvia http://sefi.htw-aalen.de/ (March 10, 2012)
[3] A. Csakany, J. Pipek: On the results of the survey on preparedness of freshmenentering higher education in engineering or natural sciences programs, Matem-atikai Lapok, Vol. 2010/1, pp. 1-15 (in Hungarian)
[4] LTSN MathsTEAM : Diagnostic Testing for Mathematics, Accessed viahttp://www.mathstore.ac.uk/mathsteam/packs/diagnostic test.pdf (March 10,2012)
[5] M. Russell: Academic Success, Failure and Withdrawal Among First Year Engi-neering Students: was poor mathematical knowledge a critical factor?, Accessedvia http://level3.dit.ie/html/issue3 list.html (March 10, 2012)
[6] A. Csakany: Results of Mathematics “test zero” at Budapest University ofTechnology and Economics in 2010, Mathematics in Arcitecture and Civil En-gineering Design and Education, 2011, ISBN 978-963-7298-44-8
[7] A. Csakany: Gap-Bridging Mathematics Courses at the Budapest Universityof Technology and Economics, Economica, 2011, vol. IV, special issue, ISSN1585-6216 (in Hungarian)
[8] K. Radnoti: Preparedness of freshmen entering higher education in Physics andChemistry, 2009. Accessed via http://members.iif.hu/rad8012/index elemei/
kriterium.htm (March 10, 2012) (in Hungarian)[9] Institute of Mathematics at Budapest Ubiversity of Technology and Eco-
nomics: Information about Mathematics “test zero”, Accessed via http://
www.ttk.bme.hu/altalanos/nyilt/NulladikZH/ (March 10, 2012) (in Hungarian)

Scientific Issues, Teaching Mathematics III: Innovation, New Trends, Research. Ruzomberok 2012
How we teach Mathematics?
Edith Debrenti
Partium Christian University Oradea, Romania, Faculty of Economic Sciences
Oradea, str. Primariei nr. 36
Abstract. The teaching of mathematics is important not only for the applicationof the acquired knowledge, but for the development of the logical and rationalway of thinking of the students of economical studies. Mathematics would be themost appropriate school subject to develop certain skills and abilities such as:associating, selecting, spotting the essence, abstract thinking, logical thinking,clearness of thinking, sense of locality, creativity, self control. Mathematicsbears a particular danger which tempts the teacher to concentrate his attentionexclusively on the cognitive aims of teaching, such as: rational argumentation,formative skills (algorithms, calculations), mathematical modelling. With thehelp of a questionnaire I made a survey in which I viewed the affective (emotive)component: the general interest, the perseverance, the attitude towards thecontent of learning material, predisposition, inclination to learning, motivation,activity, conviction. The survey was carried out among the first year students ineconomy and it views the methods they met in practice while learning.
Keywords: secondary school teaching, mathematic abilities, basic knowledge,problem solving, motivation, economic sciences.
Classification: C20; C70.
1 Introduction
The secondary school teaching plays an important role in the development of theproblem solving skills and of the knowledge needed to acquire these skills. It alsohas a great influence upon the ability of acquiring specific knowledge required in thehigh education (at the university) of subjects at the Faculty of Economics such aseconomic mathematics, economic statistics, calculation of probability, accounting,etc. One of the main features of the Romanian educational system is that studentcan study Mathematics at different levels in highschool. For example, a student inMathematics-Computer Programming Department (called Profil Real) of a NationalCollege may even take a Baccalaureate examination of high mathematical knowledgeas the programme includes: differential equations, probability theory, the basics oflinear algebra, complex numbers, etc. There are many mathematical subjects inthe curriculum of BA/BSc, MA/MSc and PhD degree programmes of faculties ofeconomics. Just like Physics, Economics needs the synchronic use of different sub-jects and domains, including all the branches of mathematics. (Kannai, Pinter,Tasnadi [2010]) In the afore mentioned work there is a short presentation of thetypes of mathematical knowledge needed in economics. The following basic subjectsin mathematics are part of the curriculum of Economics department at our univer-sity: financial mathematics, probability theory, financial statistics each throughouta semester. There is no doubt that students need a solid basic knowledge acquiredin high school in order to become a good professional or to get a PhD degree.
2 The emotional aims of teaching Mathematics
“To teach effectively, a teacher must develop a feeling for his subject; he cannot makehis students sense its vitality if he does not sense it himself. He cannot share hisenthusiasm when he has no enthusiasm to share. How he makes his point may be as

54 Edith Debrenti
important as the point he makes; he must personally feel it to be important.” GeorgePolya, Mathematical discovery (New York, 1981).
Mathematics bears a particular danger which tempts the teacher to concentratehis attention exclusively on cognitive aims of teaching, such as: rational argumen-tation, formative skills (algorithms, calculations), mathematical modelling. The useof Mathematics means creativity because all these can be easily turned into mathe-matical activities, applications and can be checked, making possible the evaluationof effectiveness of teaching.
Since the 70s there has been a growing research of the emotional side of learningand teaching, including: extended attachment to the learned contents being taught,affinity to learning, motivation, general interest, involvement, conviction. Accordingto Erich Ch. Wittmann (Ambrus [2004]), the affective aims of teaching Mathematicsare the following:
1. Developing positive attitude and interest towards Mathematics and the joystired by it
2. Individual student work done with self-confidence
3. Ability for group work done with pleasure. Giving help and learning from theothers
4. Finding intellectual inspiration and satisfaction in Mathematics
5. Determined, enthusiastic, concentrate work. Thrive for comprehension
6. Feeling of joy and pride at the end of a successful work in Mathematics
7. Recognizing the relevancy and harmony of Mathematics, understanding it
8. Appreciating the clearness of mathematical concepts and appreciating its rel-ative certainty
9. Appreciating the beauty of mathematical object, theory, consideration
2.1 Research
The research is based on 2 parts. In the first part I made a survey based on thequestionnaire of Claus (Ambrus [2004]). I enlarged it a little bit in order to analysethe affective factors: the general interest, long termed attachment, attitude towardsthe learning content, predisposition for learning, motivation, activity, conviction, aswell as the change of all these concepts in time. I was interested in their negativeand positive feelings towards Mathematics, their experiences and attitudes. I madethe research last year on 70 freshmen in economical studies at the Partium ChristianUniversity of Oradea. In the second part I made the same survey this year with somemore 90 freshmen in Economics, looking into the following questions:
• what kind of methods and instruments did they meet in high school;
• how did they learn Mathematics from the point of view formality and appli-cation;
• what did their teacher find to be most important;
• where would they place Mathematics in the list of subjects on a scale of pref-erences;
• what is their opinion about their own Mathematical abilities, skills and work.In these questionnaires they had to answer more than 120 questions. They filled inthe first questionnaire of 30 questions under my survey while they answered the restof 90 questions on the net and sent the answers to me.

How we teach Mathematics? 55
2.2 My hypotheses
1. The teaching of Mathematics is more and more informative than formative,despite the curriculum which regards the development of skills and compe-tences.
2. We, the teachers do not use a varied range of alternative methods. The tra-ditional teaching bears the emphasis on the automatic, routine applicationsrather than on understanding the concepts and on individual thinking.
3. We offer the students the solutions and we do not let them enough time todiscover and find by themselves the solutions.
4. During the maths classes the use of multimedia devices, the PC, the internetis the least present. Teachers use them very rarely.
5. The interest towards Mathematics and towards sciences in general has de-creased a lot recently.
6. From the students’ point of view, Maths classes are boring and abstract.
7. The interdisciplinary teaching is not realised.
8. In the primary and secondary school, Maths is the students‘ favourite subject,while during high school it is no longer.
2.3 The results of the survey
80% of students have graduated high school this year, while 20% graduated schoolearlier. From the point of view of gender: 54.44% of them are women and 45.55%are men. Regarding their origin, they come from six different counties and differentschools.
The first thing I discovered after doing the survey is that 62% of the studentshave graduated Human Studies at high school, where they had had just 1 or 2 mathclasses a week and only 38% of them had studied analysis. That percentage of 62 waspossible due to the fact that while there is no entrance examination (acceptance toa Faculty is 80% based on the average mark of the students’ studies throughout the4 years at high school and 20% is based on the Baccalaureate results), so the mathstest is not compulsory on the Baccalaureate examination. This year the situation isthe reversed: 63% of students have graduated Sciences and just 37% Human Studiesin high school. So there might be a great difference between the generations.
In “How to solve it - A new aspect of mathematical method”, George Polya writesabout an American survey which shows that mathematics is the least favouriteamong all school subjects. (Polya [2000]). That proves to be just partly true.Last year the answer to the question whether Maths was among their favouriteschool subjects was as it follows: 58.20% enlisted it among their favourites duringtheir study at secondary school, while just 31.34% chose Maths to be among theirfavourite subjects at high school and finally only 10.44% at university. The rest of37.31% have never liked mathematics.
This years freshmen have ranked mathematics on the second place after foreignlanguages. Natural sciences and art follow it next. Unfortunately Biology, Chemistryand Physics are the last in the line.
If they were to choose the subjects to learn, only 16.41% of them would choosemathematics, 79.10% wouldn’t while the rest of 4.47% may choose it. If they had

56 Edith Debrenti
the time 4.47% of students would take up mathematics as a hobby, while 26.86%wouldn’t and 68.65% like to solve puzzles, sudoku, etc.
The rate of students who are afraid of making a mistake and get mocked at isas it follows: 22.38% in secondary school, 26.86% in high school and 28.35% at theuniversity. The rest of 49.25% have never been afraid of that. (50.74% of studentshave always been afraid of making mistakes at calculations.)
In order to make students love mathematics the teacher plays an important partin the secondary school, according to 80.59%, in high school according to 79.10%and at university, according to 76.11% while the rest of 5.97% thinks it does notdepend on the teacher. If they were to choose their job, 25.37% would like to teachmathematics in secondary school, 5.97% would teach it in high school, 2.98% atuniversity and the rest of 70.14% wouldn’t like to be teacher.
71.64% had a lot of satisfaction and felt well at maths classes in the secondaryschool, 61.68% in high school, 29.85% at university and 10.44% said that they havenever had such a feeling, the feeling of success at maths classes. 59.70% of studentsprefer to do 5 routine exercises rather than one difficult in secondary school, 53.73%in high school and only 38.80% at university!
79.10% of students think that mathematics is different from the other subjects,while 20.89% think it is not. 22.38% of students think that mathematics is suchan abstract and difficult subject that one can barely understand it in the secondaryschool, 34.32% in high school and 73.13% at university. 16.41% of the students neverhad such problems.
They used the same solving method and practiced it throughout several exercises:almost always - state 35.70%, most of the times -39%, just on few classes 23% and2.3% say they have never done that. We learn through practice and through solvingproblems: almost all the time, think 60% of them, on most classes, think 32.22%,just on several classes, say 6.66% and 1% think they never. 52.30% say that theyhave always listened to the teacher in the classes, 42% on most occasions, 5.7% justsometimes and 1.11% never.
According to 56.66% there was never noise and disorder during the math classes,according to 33.33% there was only on several occasions, 5.55% think there was mostof the time and 4.44% say there was almost all the time.
We have solved such types of exercises that help us in our everyday life: 45.55%say they have never done that, 28.88% say they have done that during some classes,17.77% on most classes and 7.77% say they did that almost all the time.
We solved the difficult exercises gradually after having solved easier ones: 1.12%say they have never done that, 9% say they have done that on several classes, 41.57%on most classes and 48.31% say they have always done like that. We can influencethe course of the class: 12.22% think they can never, 37.77% think they can duringseveral classes, 38.88% think it is most often the case and 11.11% almost always.
We can choose the exercise, the method and we can have our own ideas: never,according to 13%, sometimes, according to 36.5%, on most occasions, is the opinionof 38.8% and 11.5% say they can always do that.
Our teacher gave us precise instructions: sometimes- according to 12.5%, on mostclasses, according to 43.82% and 43.82% say it was always the case. The teacherhelps those who need it: on some classes, according to 17%, on most classes, say30.7% and 52.3% think it happens almost always. The teacher summarized the

How we teach Mathematics? 57
details and the results: never, say 2.25%, just on several times, assert 13.5% , mostof the classes say 42.7% and 41.6% say the teacher does that almost always. Theteacher loved the subject he/she was teaching: 90.9% of the students think thattheir teachers loved mathematics.
The teacher used frontal way of teaching: never, say 3.33% , just on severaloccasions, according to 14.44%, on most classes, remember 57.77% and 24.44% saythat it happened almost all the time.
There is a talent in mathematics: is the opinion of 56.8% of students, while 43.2%think it does not exist. I often talk about the experiences and happenings of themaths classes: is never the case for 15.11% of students, it sometimes happens in thecase of 48.8% , and often for 27.9% while 8.13% say they always do that.
I look forward to the maths class: it is never true for 8.88%, it is sometimes truefor 48.88% of students and in most cases for 36.66% while 5.55% say they are alwaysexcited about the math classes. I’m happy to learn this subject: 4.44% think theopposite, 20% think it is not so good, 57.77% think it is a good thing and 17.77%say they are very happy to learn mathematics. I easily learn Mathematics: say 60%of students and 40% say they do not. I would like to have more maths classes: say5.55% of students, 17.77% would agree with that, 57.77% wouldn’t really enjoy itand 18.88% wouldn’t like it at all.
I think this subject is very useful for us: 7.86% say the opposite, 24.71% thinkit can be sometimes, 50.56% think it is in most of the cases and 16.85% think it isalmost always useful. It would be nice to use mathematics as a grownup in my job:12.22% say the opposite, 50% say they wouldn’t really like that, 31.11% say theywould like that and 6.66% say they would particularly like that.
I listen to the teacher when he explains: most of the time, say 55.05%, 38.2%say they often do, 4.5% sometimes do and 2.24% almost never do that. I ask theteacher questions: most of the time in the case of 7.9% of students, often do that29.2% of the students, 60.7% sometimes do and 2.2% never.
I copy the method from the blackboard or from the textbook: 27% of studentssay they do that most of the time, often 52.8%, sometimes do 14.6% and never5.6%. I work and think individually: most of the time 19.3%, often do that 28.4%and sometimes 45.5% while 6.8% never do. I share my thoughts and ideas with mymates and friends: in most of the cases, say 21.3% of the students, often, is theanswer of 49.5% of students and sometimes for 27% while 2.2% say they never dothat. I learn by heart the rules and features: most often, say 7.9%, 59.6% say theyoften do that and sometimes just 28% while 4.5% of them never do that.
We solve verisimilar exercises: most often, is the case of 12.65%, 54% think theyoften do that and 25.3% just sometimes while 8.05% think they never do. We analyzeand talk over our mistakes: according to 38.2% of the students that happens most ofthe times, they often do think 50.6%, sometimes do 10.1% and almost never 1.1%.
3 Conclusion
About the experiences of maths classes and about the practiced methods:
If they could decide, just 16.41% of learners would take up mathematics. Mostof them had the satisfaction and the feeling of success, though maths classes causestress when writing tests or being at the blackboard. Many of them are afraid ofmaking mistakes at the calculations (50.74%), still in most classes they analyze their

58 Edith Debrenti
mistakes in order to learn from them, according to 90%.
Teachers use in the class almost exclusively the frontal teaching: 80% of learnershave met just the frontal teaching method during the 12 years of attending school,they have not met any other methods in learning mathematics, they have not usedin class computers or internet. This fact underlines the hypothesis that duringthe maths classes the use of multimedia devices are the least often used and thecomputers, the internet are never or just very rarely used and the teachers do not usea variety of methods. The traditional teaching methods are based on the mechanicalapplications and routines rather than on individual thinking and understanding.
I copied the procedure from the board or from the student book, say 80% of learners.I learned by heart the rules and features, say 68% of them. That is the proof of myhypothesis that there is still a lot of formality in the teaching, to the detriment of thedevelopment of creative thinking and of competence. Developing knowledge basedon abilities has not come yet.
They learnt by solving problems, using the same procedure through several ex-ercises, starting with the least difficult one and continuing gradually with more andmore difficult ones. According to 75% of the learners they solved such tasks that arerelated to their everyday life (that is interesting because the textbooks contain veryfew exercises that may refer in content or in formulation to reality). Unfortunatelythey would prefer to solve usual or routine like tasks, of which they already know themathematical formula rather than another problem which needs thinking. 70% oflearners share their thoughts and ideas with their mates. Half of the learners thinkthey were able to influence the course of the math class.
Analysing the relation between the individual work, asking questions and workingin his or her own style, the strong bound among these components is revealed, provedby the result of a Chi-squared probe which is 10.638, the Yule-coefficient is Y=0.6385,which shows a quite strong relation. So, the individual work is indispensable forindividual thinking and implies it in the same time, making the learner to ask himselfsome questions and to do individual mathematical activities.
95% of learners listened to the teacher when the teacher explained the lesson.Noise and disorder are not the characteristics of the maths classes.
88% of the maths teachers are precise, according to the learners, they gave exactinstructions during the classes and they helped those who needed it, summarizedthe details and the results and 90% of the students think that their teachers likedmathematics, the subject they were teaching.
(If we use only traditional methods, the role of the teacher remains the same:he is the leader who helps directly the learner to find the solution. Quoting GeorgePolya: “It is important what the teacher says in class but it is much more importantwhat the learner thinks. The idea must arise in the head of the learner - the teachershould only be a helper...the guiding idea is that the learners should find themselvesthe solutions and discover all they can in the given situations.”)
80% of the students think that the teacher plays an important part in makingthe learners love mathematics, no matter the level, primary school or university. Itis surprising that 75% of students wouldn’t be a maths teacher.
More than half of the students have mathematical abilities or talent. 37% ofthem usually talk about maths to the people around them and 40% are lookingforward to the maths class. 15.57% use to work on mathematics in their free time.

How we teach Mathematics? 59
About the utility of mathematics in their future life as grownups,the way they willuse it: 38% would like to use it at work and 67% think that this school subject isuseful for them.
The learners should see more and more practical approach. Modelling and thepractical application of concepts are part of the curriculum but the mass of the con-tent and the time given to it do not allow learners to deeply sink into an application.
We should make our methods more varied. The aim is to use such active- in-teractive learning forms and such methods and teaching aids which would help theteacher make his classes more exciting, more interesting, guiding them towards somenew experiences by working individually as well as together. Thus the teacher canhelp them develop their problem solving ability and can pay attention to certainlearners’ individual needs making them an active part of the lesson. Experiences allover the world show that the guided discovery is practicable at all levels of teachingmathematics, in teaching the new lesson as well as in revising and solving problems.The maths teacher should revise his teaching methods in order to become a partnerin learning to his students. According to George Polya, the teacher is a businessmanwho wants to sell mathematics to young people whose interests are totally different.He should attract them in his shop with such exercises that are taken from everydaylife and which would match their interests and which finally would naturally stim-ulate them to work individually. Our question should be of the sort that it raisethe shopping interest and make them venture into an intellectual journey. The bestmotivation can be the interesting, exciting problems which are close to the studentsand which bring true joy by solving them. It is also important for the learners to askquestions and formulate problems because thus they would be more eager to thinkabout what they formulated themselves.
References
[1] A. Ambrus: Bevezetes a matematika - didaktikaba, ELTE Eotvos Kiado, Buda-pest, 2004
[2] Sz. Andras, H. Csapo, O. Nagy, K. Sipos, J. Szilagyi, and A. Soos:Kivancsisagvezerelt matematikaoktatas, Editura Status, Miercurea-Ciuc, 2010
[3] Z. Kannai, M. Pinter, and A. Tasnadi: Matematikaoktatas a bolognai tipusugazdasagi kepzesekben, Kozgazdasagi Szemle 57(3): 261-277, Budapest, 2010
[4] G. Polya: A gondolkodas iskolaja, Akkord kiado, Budapest, 2000[5] R. R. Skemp: A matematikatanulas pszichologiaja, Edge 2000 Kiado, Budapest,
2005


Scientific Issues, Teaching Mathematics III: Innovation, New Trends, Research. Ruzomberok 2012
Commensalism between board games and teaching
maths
Monika DillingerovaComenius University in Bratislava, Faculty of Mathematics, Physics and Informatics
Mlynska dolina, 842 48 Bratislava
Abstract. If you ask in Slowakia someone to name some board games, probablyyou will hear titles like “Clovece, nehnevaj sa” (Pachisi), Monopoly, “Dostihya sazky” (no english distribution or name known), Risk and a few others. Butnowadays a new form of board game named “Euro” is becoming very popular.Euro games are well suited to use in schools. They require and utilize skills, theystimulate ways of thinking and they don’t last too long. The board games bringcooperative learning, social interaction, and what never should be forgotten, funinto your lessons. In the article we show mathematic skills evolved by playinggames, we make proposals, how to use them on regular math lessons.
Keywords: Board games, mathematics, teaching maths, skills, arithmetic,algebra, geometry, strategy, tactics.
Classification: U60.
1 What are games good for?
Every year a thousand or more board games are published around the world. Theauthors (in board games business named designers) are no more nameless. A lot ofthem are living from designing games. And the games have more and more benefitsto pedagogical focuses. Sometimes the foci are hidden, sometimes they are direct.But if you search for some subject, you can really find games with mechanics, milieu,knowledge etc. in the wanted area.
In Germany in the years 2003-2004 researchers realized a project named “Spielfrdert die Schule” (Games assisting in schools). Afterwards in 2006 there was madea half year evaluation of the conclusions of this project. The evaluation confirmed 7reasons for using games in schools. Playing games develops [1]:
1. intelligence,
2. personality development,
3. social behavior,
4. motion ability,
5. power of concentration,
6. linguistic and/or language development,
7. creativity.As teachers of each subject are developing not only the knowledge, but the wholepersonality of their students and pupils, all of these conclusions are important andsnatching.
Pritchard [2] is describing similar efforts: “The most useful skills learned throughplaying games are some of the most valuable the school system can provide, namelythe interpersonal and intrapersonal skills involved with respectable and meaningfulperson-to-person interaction. The beauty of board games is that they are played bya group of people. Whether the group is all friends, all strangers, or a mix of the two,the game is the focus of their social interaction for the playing time, and in that time

62 Monika Dillingerova
individual players will sometimes benefit and sometimes disadvantage other players.All of these interactions, combined with the fact that in a game there can (usually)be only one winner, mean that players learn—or should learn—to treat each othercourteously, to behave in an honorable fashion, and to be good sportspersons. (Somegames are cooperative, with players competing against the game itself, and these areexcellent for teaching the dynamics of teamwork).”
2 Mathematics behind, in and overlapping the games
The games have their designers, which designed a good working structure. Theytry to minimize a straightforward winning strategy. The game should give morepossibilities and decisions to any player on his turn. There is much more maths thanthe player can see behind. A good example can be our interview with FriedemanFriese while playing his Factory Manger. I asked him, why are all the robots always4 Electro more expensive, but the last one is 3 Electro more expensive. He toldsomething in the further given way: I counted the efforts and the price of this tile.With a view to the time it is coming to play, there was no possibility to let theincrease in value to be constant. So I counted the value of each of the tiles over. . .That is the mathematics behind, the mathematics which should be done beforepublishing.
But there is mathematics in the game, which we do see and maths overlappingthe game which we do, but pupils do not see. Both of them give us the possibilityreach our pupils and make maths lessons more fun, more interactive, more unboundand more remarkable. We could publish some lists of games for kids of every age.In [3] you can find a list of games for first grade children. In [4] the list is spread forchildren from 10 years and in [5] we are concentrated on geometry in all her kinds.In this article let us see how much maths in the next 3 games is hidden. We didchoose different games – different in the focus of age, time, and also maths.
2.1 Picomino (Heck Meck z zizalek)
Picomino is a game for children from 8 years age. In the box of the game there are16 dominoes and 8 dice (cubes). On each dice we have numbers of dots from 1 to 5and on one side there is a little worm there. The dominoes have really two halvesas usual but with strange paintings. On the one halve we see numbers from 21 to36, only one of them on each tile. On the other halve we see from one to four littleworms. With a higher number more worms, with a lower one less worms. The clueof each player is to collect the most worms. A worm is 5 dots worth. On his turna player rolls all dice, sets all dice with one symbol aside and is allowed to roll theleft over dice. After each rolling he must set dice with a new symbol aside. If he hasafter this on the dice set aside at least one worm and a sum which is bigger or equalto the number on one of the dominoes, he can end his turn and take the domino. Ina special case the player can steal a domino from another player.
This game is good for training counting. As written in [3] “the children slowlychange from counting dot by dot to recognizing the schematic representation ofnumbers and their counting as whole.” The pupils in the second or third gradehave sometimes problems with counting without fingers. Here on the dice are dots,which the child can see and they can represent the otherwise used fingers. Countingbecomes quicker and using fingers will be lesser frequent. This is the mathematicsall can see in the game. But there is something else. From counting three fives to

Commensalism between board games and teaching maths 63
multiplication three times five is only one little mental step. That is not all. If aplayer rolls the dice, he has to choose dice with which symbol he will set aside. Is itbetter to take two dice wit 3 dots each? Or should he take one dice with 5 dots? Orbetter one dice with only 1 dot? As the player has only 8 dice, he must also countif he can make at least the lowest number on the domino. And the next step – hecan say stop, but he can roll once more. Is it safe, to roll three dice if there are only2 symbols not rolled yet? So we can find a first contact to probability.
If you use Picomino in your class, one copy is for 2 – 8 players, so 4 copiesshould be enough for the whole class. The game lasts from 5 to 15 minutes. Thisdepends on the speed of counting. But let us say: would your pupils do so muchwritten exercises in the time they do while playing the game? You can use the last10 minutes of your lesson for playing. You can also make a tournament on only onewhole lesson. All the time invested into the game comes back from the progress ofyour pupils.
2.2 Carcassonne
Let us go to children from the third (better fourth) grade. Carcassonne is nowadaysa well known game all over the world. There were millions of copies sold and thegame has a lot of expansions. So you can expect that at least one or more pupilswill know the rules. The game consists of square tiles and meeples. There are cities,roads, monasteries and meadows on the tiles. A player on his turn picks a tile andthen he must place it. He must connect the tile with one or more of his edges to theexisting land consisting by further laid tiles. Placing is only possible if all the land,city, road continues on the connected edges. Then the player may place on the tileone of his free meeples. As a last action the player scores for all closed cities, roadsor monasteries. The points belong to that player, who’s meeple stands on the closedland art and the meeple goes back to him.
After reading that rules we could only say: where is another mats than countingpoints? We will show you. There is much more maths as anybody would expect.
• Arithmetic and algebra – Is it better to set the meeple into a city try toconnect it later with another city and win the points from it (the active player+4 points, the opponent loses his points from the city)? Or should you laythe meeple to the meadows, which you do not know, how many cities will bedelivered by (unknown how much times 3 points, but the meeple is until theend of game unaviable and you score the same amount of points for the city.);
• Using algorithm – each game rule is a description of turns - an algorithm;
• Strategy – from the first turn on you can play on cities, on monasteries, ontaking over the opponents cities. . . You have a plan and this plan is nothingelse than strategy;
• Tactics – In the moment you draw a land tile, you have to decide, how youwill react to the opponents turn, what is the best choice with this tile;
• Memory – is very important in tournaments. The player knows about possibletiles, he is waiting for some special tile and he should remember how many ofthem in the game are how many were already used. . . ;
• Geometry – geometry and combinatorics are part of locality – it means deci-sions how to place a tile, how to rotate it and where to place it. Some pupilswill “see” the right place at once, others will need some time, and others

64 Monika Dillingerova
will need to try. From play to play they all will see more and more withoutmanipulation. It means their mental ability to solve such a problem increases.
The game is recommended for 2 – 5 players 8 years and older. It means you needup to 6 games in your classroom. A game can be played in 30 minutes, but you canalso use chess clocks with a preset amount of time for each player. If you want touse the game in your lessons, let at first the pupils only play and understand therules. Afterwards you can use the games to count the maximum of points from cities,roads, meadows. . . or only note the score for each player in many games and thenuse this set in statistics lessons. The game is well suited for making tournaments.If choosing this way, we recommend playing two player games, as it is usual at theWorld Championship.
2.3 The Settlers of Catan (Osadnıci z Katanu)
The Settlers of Catan is a game for children from 10 years. With 45 – 90 minutesit is the longest lasting game in this article. You cannot play it on regular lessonsand the rules are also longer. If you are going to a school trip, with games you geta lot of program and if you have many of them, each child can be satisfied. And thegood thing is, they learn something without knowing about learning.
The Settlers of Catan is a game with modular board. The modularity providefor always new feeling new appeal and high motivation to play. The player set twolittle villages and two roads each on the board. Then they collect resources to buildnew roads and villages and rebuild them to cities. A player on his turn rolls twodice and the sum of them will determine the positions giving resources and with theposition the sort is also given. The player gets victory points for each village or cityand he can get more points if buying development cards or having the longest road.All you do is paid in resources: wood, brick, wheat, sheep or ore. The player whoreached in his turn 10 victory points wins. For exact rules in English see [6].
In this game we can find the probability on dice roll result. We can also countwhat is better: a position with the numbers 5, 10, 8, or a position with numbers 6,9, 5? Where a player has better chance to get a resource: on a 9 or on a 5?
The game is full of planning (strategy) and making decisions and also trade(tactics). If you do not have a resource, you can try to trade with other players. Butwhich prize for a resource is good for both sides? What does it mean good? Willa player give me his only one brick? What should I offer him? The brick means avillage and 1 victory point for me. What is one victory point worth for him?
3 Conclusion
We tried to show how much maths is in board games. They can be used in thelessons; we only should look about some conditions like:
• educativ character
• theme
• fun factor
• how long will the rules last
• how much player we have
• how long it lasts to prepare and then store the game
• what do we expect from playing the game

Commensalism between board games and teaching maths 65
What we really should have in our schools is a game collection, which can be usedin classrooms. The collection can be divided by theme into maths games, geographygames, social games, etc. But they can also build a game library, where childrencan borrow games as books, where games can be played. We agree with Pritchard[2] that: “Games can be used in a variety of ways to teach, reinforce, and assess,not to mention (perhaps most importantly) to have fun. A part of being able touse games appropriately at school is picking games that will suit the intended use ofthe games collection. Games can, and with familiarity will, be used in classrooms tosupport or extend teaching foci, but a school-based game collection can sometimesbest support extra-curricula clubs and activities such as a school games club, boardgame nights, usable board game libraries, and the like.”
Acknowledgements
This article was supported by the MVVa SR project KEGA c. 057UK-4/2011.
References
[1] http://www.wehrfritz.de/pdf/Studie Spiel foerdert Schule.pdf, online, january2012
[2] Giles Pritchard: An Overview of Modern Games and How to Use Themin School http://www.boardgamesnews.com/index.php/boardgamesnews/C57/,online, april 2007
[3] Dillingerova Monika: Spolocenske hry v skole 7. Hry a matematika in Dobraskola. - ISSN 1338-0338. - Roc. 2, vol. 7 (2011), p. 16
[4] Dillingerova Monika: Spolocenske hry v skole 8. Este raz hry a matematika inDobra skola - ISSN 1338-0338. - Roc. 2, vol. 8 (2011), p. 20
[5] Dillingerova Monika: Spolocenske hry v skole 9. Geometria, symetria, farby,priestor... in Dobra skola - ISSN 1338-0338. - Roc. 2, vol. 9 (2011), p. 18
[6] http://mayfairgames.com/mfg-shop3/rules/MFG3061-Rules-V1 0.pdf, online,january 2012


Scientific Issues, Teaching Mathematics III: Innovation, New Trends, Research. Ruzomberok 2012
Measuring the efficiency of e-learning programs
Peter Fejes-Toth
Corvinus University of Budapest, Faculty of Horticultural Science
Department of Mathematics and Informatics
1118. Budapest, Villanyi ut 29-43.
Abstract. In October 2011 I collected data in the American International Schoolof Budapest on the “WebAssign” - the homework solver online program theyuse. I asked the students to fill out a survey about their habits, experiences andopinion about WebAssign, and had several structured interviews with teachersabout the program. In the paper I introduce the observations I made, and partof the results of the survey that I have come into so far, while also mentioningsome methodological questions to consider when measuring the efficiency of suchprograms.
Keywords: e-learning, WebAssign, efficiency of e-learning, learning managementsystems.
Classification: C70, R20, U70; D60, Q70.
1 Introduction
In the last decade, with the improvement of Information and Communication Tech-nologies and the Internet, all sorts of electronics-based supporting systems havegathered ground in education. Education supported by computers (e-learning fromnow on) was introduced by the educational institutes as an opportunity created bymodern technology to improve the quality of teaching.1 There was also an intentionto increase the efficiency of education, and to reach out to a new circle of students.The necessity of e-learning programs is no longer disputed, given the strongly in-creased number of students in higher education, which is not matched by a similarexpansion of human resources.
The question still remains though, whether these programs are capable to pro-vide the same quality in education as learning in small groups, through personalattendance. However important it would be to know the answer, today there areno systematic surveys of efficiency in Hungary, and even the occasional measuringof effectiveness is still quite rare. Reasons are many, for example the problems ofmethodology, which will be discussed later.
This is so in spite of the fact that there are numerous elaborated evaluativesystems in use around the world, and even in Hungary (see e.g. [1]). In 1998 Karpatiand colleagues made a research on electronic teaching tools used in Hungary withthe participation of teachers using these tools.
2 Measuring efficiency: aspects to consider and experiences
with WebAssign
2.1 Types of e-learning programs
Today many forms of e-learning programs or platforms are used by different educa-tional institutes, among them there are many big, complex systems, which can becustomized by inserting all kinds of modules (functions). They cannot be explicitly
1E-learning is of course present at every stage of adult education, but the issue of this article isto discuss the experiences of systems used by educational institutes.

68 Peter Fejes-Toth
differentiated, for their available functions are more or less the same. While wecannot state, that one program is only for administrative, the other is for communi-cation purpose, and others are for defined educational tasks only, it is still commonin everyday practice that one function stands out, and the others retreat to thebackground. Therefore the expansion of program functions does not lead to increas-ing simplicity; it is more common that teachers and students of an institute usesthree, four or even more programs, but only certain functions of each. Even if thisphenomenon has no direct effect on learning the curriculum, it can still influence thegeneral efficiency of education, so it is worth paying some attention to it.
There are basically two types of programs and interfaces (softwares, web pages,etc.) developed only and explicitly to teach mathematics in use, the goal of whichis to pass over, deepen, drill and verify knowledge:
1. Programs with highly interactive interface for demonstration (for example Geo-Gebra).
2. Programs for solving problems and practicing (WeBWorK, Webassign).
These programs play completely different roles, even those with the same basicfunctions. Therefore there is no point in comparing the Geogebra with the Web-Assign for instance. The Geogebra is a very useful demonstrative device of livingclasses; it helps spectacularly display certain issues or phenomena, while WebAssignis for practicing at home. These programs are usually complementers of traditionaleducation and as such are tools of a “blended learning” method. This means thatthey are not really replacements of the personal connection between teacher andstudent but of the “paper-and-pencil” practicing, or blackboard-and-chalk demon-strating, learning methods [2].
Black Board, Neptun, Moodle, Coospace, and many other complex programs,platforms, the so called Learning Management Systems were developed and (at leastin the Hungarian higher education) are mostly used to simplify the (institutional ora teacher’s) administrative tasks. One can manage results, grades and attendanceregisters with those, and they provide an opportunity of communication betweenteacher and student, directly assisting education. Materials of lectures and study-aids can be uploaded, home works can be sent in, and even tests can be filled out(for example in the Moodle) [4]. However, these programs are not made for teachingmathematics, so their efficiency in this field is way behind of those created for suchpurpose (see WeBWorK or WebAssign), though they can be (and are) further im-proved. Even the integration of aforesaid types of programs with more interactionsand practicing interface is theoretically possible into these types of systems.
2.2 Problems of measuring efficiency
When measuring the efficiency of educational programs, the first and foremost ques-tion is defining efficiency itself. What is measuring based on, what aspects do weconsider, what do we compare to? What are the expectations, who will be the users(high school or university students), what is the level of mathematics they wish tolearn?
Practical possibilities set a strict limitation to these theoretical considerations.It is obviously impossible to measure how efficiently can the same student learn andunderstand the same curriculum with different methods. Therefore the accuratemethodology of the measuring gains is of great significance. One possible method

Measuring the efficiency of e-learning programs 69
is to examine the results of students. Although one cannot measure the learningefficiency of the same student with the same curriculum but with two differentlearning methods, one can still compare the results of two groups with nearly thesame parameters, who learn the same material with different methods. One groupuses the examined program, the other does not, and at the end of the inquiry wemeasure the knowledge of the students. In this case we have to pay bigger attentionto the type of knowledge we measure; we must not let the used learning method affectour expectations (the questions we ask). If this process cannot be attained, but wehave enough elements, we can compare the results of the same students learningdifferent curriculums, based on the fact whether they have used the programs in thegiven semester or not. We can also compare the results of different student groupswith the same background and curriculum, those who used the programs and thosewho did not.
Instead of objective evaluation we can also use a subjective one; we can explorethe opinion, satisfaction and experiences of the users, either with questionnairesor through interviews or focus groups. Comparing the operation and structure ofeach program can be another useful method of study. The so-called “checklist”method mixes the latter two: this is when the evaluator has a list of features tobe evaluated in connection with the program in question. This is one of the mostpopular evaluating methods. In this case usually teachers who use the programthemselves give an evaluation about it, answering the questions of an elaborated listof possible features and attributes of the program [1].
2.3 Experiences with WebAssign
Among other inquiries of efficiency of e-learning systems (see [5]) I made a survey inthe American International School of Budapest in the fall of 2011; I wanted to findout how efficient do they find WebAssign, an online homework-making program. Inthis institute it is not the high number of students that makes the e-learning systemnecessary; they use the program out of the firm belief that this method is moresuitable for handing over the knowledge of mathematics to the students.
I charted the functions of the program as part of the survey, and I mapped theopinion of teachers and students; the former with structured interviews, and thelater with survey method.
WebAssign is a software developed for teaching mathematics; with a suitablesyntax practicing at home with computers can be much more than merely solvingtests. When solving a problem, the entered answer can be a number, and also afunction, an interval, a formula, etc. Therefore one can use the program to solvesuch algebraic conversions, equations and inequalities that can cause difficulties inhigh school education, and to drill countless types of mathematical problems. Atthe same time it is not really suitable to teach mathematical theory like proofs oftheorem, or to make geometric constructions. Problems which require creative ef-forts must stay paper-based, and their supervision must stay in the teacher’s hand.Geometric constructions on the other hand probably will soon become executableand controllable electronically, thanks to the constant developing of software. Inshort, the program has its own limitations; it can be further improved with soft-ware development, but most probably will never be suitable for teaching complexmathematical thinking. Nonetheless, it has never been its goal.
The software’s goal is to help the average student to practice certain types of

70 Peter Fejes-Toth
problems at home. This function is relatively simple, and supported by lots of usefulfeatures:
• Each problem can be solved many times, with different parameters.
• Errors are displayed immediately, so students can retry and rethink the prob-lem to find the correct answer.
• The teacher does not need to check all home works personally to see how manyattempts it took to solve a problem, and which ones were not solved, so he candecide what needs more practicing or repeating.
• Students who are clueless or doubtful about how to deal with a problem canwatch a video showing others solving the same task with different values. (Thisopportunity is unfortunately not available for all instances.)
The preliminary answers given by students to the attitude questions of the ques-tionnaire are shown in the table below (N = 89):
It can be marked out from the questionnaire that students generally like to useWebAssign. The chance of immediate viewing of results (the instant feedback) isconsidered a serious benefit.
The most frequently mentioned doubt in interviews and conversations about e-learning programs is that the knowledge gained on computing interfaces will not beusable in other environments, for instance in a traditional paper-based one. Butstudents questioned in this questionnaire did not mention to have the problem ofbeing unable to solve mathematical tasks on papers they otherwise are able to solvewith the computer. It is an important point to emphasize, because in certain casesof similar programs (the WeBWorK program for example) this problem has arisen.If the types of questions the program asks are limited, even if within a topic, it canhappen that the strangely put questions of the paper-based tests can confuse thestudents. WebAssign probably avoids this issue by having a good user interface.
The method of showing mathematical terms is also important. It is a key re-quirement of similar programs to show problems, answers and terms in a (visual)way that is commonly used in mathematics. If a student enters xˆ2 as a solution,then x2 should appear on screen, just as it would look like if written on a paper.
So one of the most important usability question (which also causes the mostproblems and tensions) is the issue of syntax or programming language; how the usercommunicates with the program, how he enters terms, mathematical signs, algebraicexpressions, intervals, etc. Programs usually have their own syntaxes which usershave to learn, because keyboards are not specialized. Half of students questionedabout WebAssign considered it a problem. This technical issue needs to be handled,because if fixed, the usability of the program would strongly improve. Even ifsomeone is familiar with the notations, it can still occur (especially in internationalschools) that a new computer’s keyboard settings can causes some difficulties.

Measuring the efficiency of e-learning programs 71
Variable yes neutral no
I am satisfied with WebAssign 63 17 20Using WA makes it easier to understand Mathematics 43 34 23By using WA I learn only to solve several types of 33 34 33problems, while the theory remains unclearUsing WA makes it harder for me to understand theory 15 25 60WA helps me more by gaining Mathematical 28 41 21knowledge than the “traditional” ways of learningWA makes Mathematics courses more enjoyable 38 29 33I often get frustrated with the syntactical 40 28 32requirements of WAThe immediate responses I get from WA help 51 39 10me learn the class materialThe immediate responses I get from WA make 63 26 11me more persistent with assignmentsI often get frustrated with the time it takes 26 23 51WA to respond to answers you submit to itHaving difficulties with solving a problem on paper 16 27 55which you practiced and could solve with WAI prefer WA over paper-and-pencil HW 49 21 30WA forces me to keep up with the class material 43 41 16WA problems are challenging 50 40 10Class lectures effectively prepare me to complete 57 29 14WA homeworksThe content of WA homeworks is consistent 64 29 7with the material taught at classesThe content of WA problems is consistent 52 37 11with the material tested on examsWA effectively prepares me for examinations 50 27 23I often get frustrated with and give up on a particular 18 30 52problem due to mathematical difficulty
It is rather a question of contents that the asked students does not feel thatWebAssign only makes them practicing problems of common types, and lacks ingiving theoretical knowledge. The key here is the intelligent usage of the programby the teachers; they must avoid reclining only upon the program, they must balanceits obligate simplicity by giving more complex, elaborated problems to solve. Theyalso have to follow an adaptive behavior during the personal meetings, the actualclasses.
I consider it important to emphasize that the students thought the homeworksuited the curriculum; it would be a mistake to think that is evident. You need theproblem libraries to be abundant, searchable and manageable, so the teacher canfind the suitable problems to be solved, and you need him to be busy in learning thedatabase management, and to create new problems when he has not found the rightone. It takes time and energy; in those institutions where e-learning systems were

72 Peter Fejes-Toth
introduced for saving resources it can be a serious disadvantage. Although theore-tically this issue only occurs at the initial interval when the problem library needsto be filled, in practice educational materials are not persistent, so the databasescontaining the tasks need continuous management.
3 Conclusion
According to these preliminary results it can be said that overall the students aresatisfied – even if not a huge majority of them – with the program, very similarly tothe opinion of students of University of Calgary towards WeBWorK [5]. However,additional analysis is needed to reveal the details of these attitudes and to find out ifthere are special groups of students who can use the programwith significantly higheror lower satisfaction/results than the others. At the same time, the application ofother evaluating methods is desirable to elaborate the results, and to reveal howvalid the results of such an opinion survey can be.
References
[1] A. Karpati: Oktatasi szoftverek ertekelese, Termeszettudomanyi Kommunikacioes UNESCO Multimediapedagogia Kozpont, Multimedia es Pedagogia onlinejegyzet 2004. http://edutech.elte.hu/multiped/szst 06/szst 06.pdf
[2] C. D. Dziuban, J. L. Hartman, and P. D. Moskal: Blended learning, EDU-CAUSE Center for Applied Research, Research Bulletin, Vol. 2004. Issue 7
[3] M. D. Guzman: The role of visualization in the teaching and learning of mathe-matical analysis, 2nd International Conference on the Teaching of Mathematics,2002, Greece
[4] B. Petho: Tavoktatasi keretrendszerek es oktato szoftverek, Termeszettudo-manyi Kommunikacio es UNESCO Multimediapedagogia Kozpont, Multimediaes Pedagogia online jegyzet, 2004. http://edutech.elte.hu/multiped/szst 11/szst11.pdf
[5] P. Fejes Toth: Using WebWork at the Department of Mathematics and Statisticsat the University of Calgary – An evaluation,Calgary 2010. Manuscript

Scientific Issues, Teaching Mathematics III: Innovation, New Trends, Research. Ruzomberok 2012
Digital competence and its impact on student
performance results analytical comparison of
digital competence within Slovak, Czech and
English mathematics
Stanislav Javorsky
University of Trnava, Faculty of Education,
Department of Mathematics and Computer Science
Priemyselna 4, 91701 Trnava
Abstract. Actual social and commercial situation comes across as recessive.One of spheres directly influencing this condition is an educational sphere andvice versa unflattering decadence manipulates the sphere of education. Importantpart is to determine such relevant limits and stimuli correctly which causequality of its system. Focus on digital competence content as one of stimuliparticipates and offers the ways for knowledge level increase and development ofstudent capabilities within specific educational disciplines (Gazdıkova, 2010). Byanalysis of explicitly-defined capabilities reflecting the focus of digital competencewithin a comparison of selected European countries; we reflect a cross-sectionalperspective on contentual disproportion of capabilities regarding to digitalcompetence. Reciprocally analysis presents relative contentual interference fromthe point of educational policies of analyzed nations.
Keywords: Average Scale Score, digital competence, Information and Commu-nication Technologies, mathematics, national curricula, standardization
Classification: R30.
1 Brief look on student performance results
Nowadays educational sphere is concerned in varied student performance measure-ment programmes at national and transnational level oriented to evaluate studentlevel of various literacies. Global comparisons intent on level of disciplinary know-ledge demonstrate great differences in student performance results and interrogateabout knowledge policy adjusting of particular nations and its functionality.
Group of specific subjects within different levels of study presents sphere of ul-timate interest due to their potential for a prospective profit-admitting. Globaldrive of constant improvement of conditions positively influencing student knowl-edge results in generation of transnational programmes measuring student perfor-mance. Programme for International Student Assessment (PISA) as a transnationalprogramme accentuates evaluation of subjects as Science, Mathematics, Problem-solving activities and Reading. Trends in International Mathematics and ScienceStudy (TIMSS) similarly to another student assessment reports at various level ofeducation exceed political and commercial intentions but academic purposes inter-nally managed by revision of statutes within national knowledge policies as well;to concretize limits and stimuli of contemporary national educational conditions.According to TIMSS comparisons realized in 2007 at 4th grade there are excessivedifferences within European countries (inter alia in examined Mathematics Content).
Average Scale Score (ASS) in Mathematics Content of England denotes 2.09 per-cent increase in compare with score of Slovak Republic and 3.61 percent increase incompare with score of Czech Republic. (Figure 1) England proves primacy not only

74 Stanislav Javorsky
Figure 1: Multiple comparisons of Average Scale Score within selected Europeancountries (Source: TIMSS 2007)
Figure 2: Percentage of Students Reaching International Benchmarks (Source:TIMSS 2007)
of the three selected countries but confirms knowledge functionality of its studentsin multiple comparisons within other European countries as well. ASS as statisticaldata cannot judge particular national educational system but may indicate progres-sive qualitative tendency of educational policies regarding to innovative approachusing trends within sphere of Information and Communication Technologies (ICT).
Figure 2 presents four groups of students reaching international benchmarks, per-centage of which differs expressly. Percentage of Students of Advanced Benchmark(AB) in Mathematics Content of England denotes 11 percent increase in comparewith score of Slovak Republic and 14 percent increase in compare with score of CzechRepublic. Percentage divergence of English, Slovak and Czech students reachingHigh Benchmark (HB) and Intermediate Benchmark (IB) is evident as well.
ASS as statistical data cannot judge particular national educational system butmay indicate progressive qualitative tendency of educational policies regarding toinnovative approach using actual operational trends. Advancement of ASS (Fig-
Figure 3: Advancement of Average Scale Score resulting in 1995, 2003 and 2007(Source: TIMSS 2007)

Digital competence and its impact on student performance results 75
ure 3) presents future tendencies where (without reference to concrete ASS results)improvement of English results is visible. Czech ASS allocates negative addiction(11 percent decreasing). Absence of Slovak students in 1995 and 2003 disables topresent future tendencies.
2 ICT and student performance
Nowadays Information and Communication Technologies (ICT) represent an irre-placeable component in all of educational spheres and grades. (Gazdıkova, 2005)As far as transnational social performance measuring programmes are concernedvolume of ICT implementation is crucial. Multiple comparisons of average stu-dent achievement within a primary school mention the fact that in specific fieldsof subject student measure of performance differentiates at any level of education.Despite of ambition to internationalize education systems of European countriesrevision of statutes inspired by Lesson-drawing, Policy emulation and other multi-national mechanisms does not involve potential of ICT sufficiently. (Virkus, 2003),(Holzinger, Knill, 2008) As far as potential of ICT as technical support for educa-tional process is mentioned, digital competence as a frame of mans capabilities hasto be introduced.
2.1 Digital competence in short
Mans competence to do something closely interrelates with academic standardiza-tions to the question of its content crossed by political and social background.(Holzinger, Knill, 2008) European social legislation defines brief explanation of dig-ital competence content which may be partially considered as academically aimedtowards functional knowledge policy within nations of European Union. (Euro-pean Council, 2006) Digital competence as one of key competences includes set ofknowledge, abilities and attitudes focused on usage of technologies of informationalsociety for working, spare time and communication as well. The aim is to developcognitive sphere by acquiring of knowledge about character, assignment and usingopportunities of ICT. Development of abilities by acquiring of digital competenceis based on cognition and usage of ICT for manipulation with information, theirediting and processing and communication, which support cooperation in cultural,social and occupational sphere as well. In compare with other studies dealing withdigital competence content is practically identical and in fact accentuates three mainfields of focusing- field of information, field of communication and field of technicalsupport. Within these fields academic purposes - ethical usage, creative potential,information processing or critical thinking are complexly developed.
3 Digital competence in sphere of mathematics within Slovak,
Czech and English educational systems
Comparative analysis concretizes digital competence content as content defined innational curricula for a field of Mathematical studies and presents relational con-tentual interference within nations analysed. To analyse quantitatively representa-tion of digital competence and to synthetize its form we incorporate a standardizedcapabilities according to International Society for Technology in Education dividedinto six spheres. They complexly develop system of knowledge and abilities of stu-dent from the sphere of ICT - data processing, construction of new informationalknowledge, communication and cooperation, critical thinking and digital citizenship.

76 Stanislav Javorsky
Figure 4: Comparison of digital competence content proportion within analysednations
(ISTE, 2007) Contentual focus of particular spheres ought to help students to developcapabilities and to construct informational literacy necessary for their occupation.Regarding ISTE standards measure of digital competence capability implementationrepresented in national education curricula of analysed nations presents notable dis-proportion of particular capabilities explicitly defined for subject of Mathematics(Figure 4).
Creativity and innovation as first sphere of digital competence is explicitly definedwithin national curricula of all analysed nations. (ISCED1, 2008), (VUP, 2007),(MSMT CR, 1995), (NCfE, 1999) Development of creative thinking and innovativeoutput production by usage of ICT within Mathematics is in case of Slovak curriculareflected in development of student capability to process data adherent to use ofcalculators. (SVP, 2009) ICT may support searching and data-processing in form offigures, charts and diagrams. In case of Czech and English national curricula, studentcapabilities explicitly defined are formed and aimed to develop data-processing andinterpretations of results using various implements (physical objects, models, visualpresentations etc.). (VUP, 2007), (MSMT CR, 1995), (NCfE, 1999)
Usage of digital media and communicational setting for communication, individ-ual learning support or support of other student learning as second sphere of digitalcompetence is for subject of Mathematics explicitly defined only in English nationalcurricula, although there is theoretical reference about its incorporation in external-ization of study programme in Czech and Slovak curricula as well. (NCfE, 1999),(VUP, 2007), (ISCED1, 2008) English curricula concretize sphere of communicationand cooperation defining a focusing on development of mutual communication- Stu-dent by usage of informal language and record (in spoken, visual or written form) andconsequently mathematical language and symbolization communicates with others.At that he uses ICT as an implement for result-linking by using symbols too (NCfE,1999).
Third sphere of digital competence is explicitly defined within national curriculaof analysed nations disproportionately. Application of digital tools for data acquire-ment, evaluation and utilization is in subject of Mathematics explicitly defined only

Digital competence and its impact on student performance results 77
in Slovak national curricula. Theoretical definition is reflected (within aim of sub-ject definition) in form of ICT usage for data-processing (SVP, 2009) without anyfractional concretization of its realization.
Critical Thinking and Digital Membership as fourth and fifth sphere of digi-tal competence are not explicitly defined within national curricula of any analysednations. (NCfE, 1999), (VUP, 2007), (ISCED1, 2008)
Technological operations and concepts as sixth sphere of digital competence isexplicitly defined within Slovak and English national curricula aimed to sphere ofMathematics. (ISCED1, 2008), (NCfE, 1999) Slovak curricula define its realizationfocusing on student selection and productive usage of ICT (software applications,etc.) applicable for solving of specific tasks and problems. ICT directly participateson student digital skill development (by usage of calculators, software applicationsetc.) through data searching and processing. (SVP, 2009) English national curriculatheoretically reflect capabilities adherent to sphere of technological operations andconcepts in productive usage of analogue or digital equipment for specific task solving(inter alia calculators for numeric task solving) as well. (NCfE, 1999) Student mayunderstand problem of angles and radius and develop his skills by usage of softwareapplicable to object design of alternative space solutions or solving of numeric tasksas well. (NCfE, 1999)
4 Conclusion
Information resources and capacity to understand and use ICT accurately impactboth qualitative and quantitative assurance of knowledge of volume-related sub-jects as Mathematics due to their wide integration opportunity. Representation ofdigital competence within national curricula is in sphere of Mathematics definedinsufficiently. Comparison presents quantitative differences of defined digital com-petence (according to spheres defined by ISTE) intensified by unequal definition ofits content. Digital competence arrangement within selected European countriesinfluences their educational systems qualitatively resulting in excessive ASS results.Transnational communication and cooperation with nations achieving high ASS re-sults supporting by analysis of practical digital competence development (based onICT implementation within specific subject) used in such educational systems maypositively influence quality-raising of national educational systems of other analysednations.
References
[1] European Council: Recommendation of the European Parliament and of theCouncil of 18 December 2006 on key competences for lifelong learning, Luxem-bourg, 2007, [online, 2011-12-09], Available at: http://eur-lex.europa.eu
[2] V. Gazdıkova: Pocıtacove zrucnosti ziakov zakladnych skol potrebne pre e-vzdelavanie, Acta Facultatis Paedagogicae Universitatis Tyrnaviensis.Trnavskauniverzita, Pedagogicka fakulta, Trnava, 2010, p.151-156, ISBN 978-80-8082-432-7
[3] V. Gazdıkova: Ziaci zakladnych a strednych skol a e-learning, Acta Facul-tatis Paedagogicae Universitatis Tyrnaviensis. Trnavska univerzita, Pedagog-icka fakulta, Trnava, 2005, p.5-9, ISBN 80-8082-048-1
[4] K. Holzinger, C. Knill: Theoretical framework: causal factors and convergenceexpectations, In T. Bieber, K. Martens: The OECD PISA Study as a Soft Power

78 Stanislav Javorsky
in Education? Lessons from Switzerland and the US. Blackwell Publishing Ltd.,Oxford, 2008, US [online, 2011-9-11], Available at: http://www.sfb597.uni-bremen.de/homepages/bieber
[5] SPU: ISCED1- Primarne vzdelavanie, Ministry of Education of Slovak Repub-lic, 1997, [online, 2011- 12-04], Available at http://www.statpedu.sk/
[6] ISTE: NETS for Students, 2007, [online, 2010- 11-30], Available at:http://www.iste.org/
[7] MSMT CR: Standard zakladnıho vzdelavanı, Ministry of Education, Youth andSports, Praha, 1995, [online, 2011- 12-04], Available at http://www.msmt.cz/
[8] The National Curriculum for England: Mathematics, Department for Edu-cation and Employment, London 1999, [online, 2011- 12-04], Available athttp://www.nc.uk.net/
[9] TIMSS 2007 International Mathematics Report: Findings from IEAs Trends inInternational Mathematics and Science Study at the Fourth and Eighth Grades,TIMSS and PIRLS International Study Center, Boston, 2008, p. 488, ISBN1-889938-48-3, [online, 2011- 12-04], Available at http://timss.bc.edu/
[10] S. Virkus: Information literacy in Europe: a literature review, In In-formation Research, 8(4), paper no. 159.[online, 2011-9-11], Available athttp://informationr.net/ir/8-4/paper159.html
[11] VUP: Ramcovy vzdelavacı program pro zakladnı vzdelavanı, Ministry of Edu-cation, Youth and Sports, Praha, 2007, p. 124, [online, 2011- 12-04], Availableat http://www.msmt.cz/

Scientific Issues, Teaching Mathematics III: Innovation, New Trends, Research. Ruzomberok 2012
The role of knowledge acquired in secondary school
in higher education
Judit Kollar
College of Finance and Accountancy, Institute of Methodology and Economics
10–12 Buzogany utca 1149, Budapest, Hungary
Abstract. We have been witnessing more and more depressing results concerningthe abilities of students joining higher education lately. Their knowledge ofmathematics is worse than it used to be, and it is not sufficient to support asuccessful professional training. The results of mathematics tests carried outamong college freshmen reflect a decisive contribution of the knowledge acquiredin secondary education to the success of students in higher education. Weconclude that the mathematical prerequisites of admittance to a college shouldbe clearly outlined, and that students who intend to join higher education shouldtake the advanced level final examination in mathematics.
Keywords: maturity, preliminary knowledge, problem exploration.
Classification: D60.
1 What led to the thought of researching this topic?
The global economic, social and technological changes directly test the adaptabilityof humans. The endeavour to meet this heightened competition and the changinglabor market needs represent a challenge for the education system. The EuropeanUnion wanted to answer this in its Lisbon decision of 2000, in which it formulated therequirement for reforming the education and training system of member countriesin a way which creates the basis for the knowledge-based society.1
The Council of Europe intends to change the education and training system sothat it focuses on competences, skills, and the ability to apply knowledge instead ofthe traditional content-centered teaching. Accordingly, new curricula, new teachingmethods were introduced, and competency-based education as a concept has becomewidely accepted. In contrast, our mathematics teaching, which has been outstandingeven by international comparison in previous decades, has declined. The knowledgeof students entering higher education, despite of their high admittance score, issignificantly lower than in the past, and they do not have the solid basis on whichthe specialized training of a higher education institution can be successfully built.
At the Budapest Business School, in order to build the foundations of specializedsubjects, the course of Economic Mathematics is indispensable. This block containsanalysis, probability theory, linear algebra, and operations research. These objectsrequire solid mathematics skills. Right from the first semester, students begin withanalysis, where they need a stable and thorough knowledge of algebra, equations,inequalities, and functions.
2 The Placement Test
Like every year, at the beginning of the current academic year students wrote aplacement test which complies with the requirements of the intermediate level highschool leaving examination, compiled along unified principles. The test was created
1The conclusions of the presidency. Lisbon European Council, March 2000, 2324., point 26.

80 Judit Kollar
to assess the knowledge level of the incoming students, and to form a targetedcatching-up strategy.
On the first seminar more than 1000 students wrote the test, of which 808 havebeen processed.2
89% of the students have an intermediate level maturity exam, and two studentsadmitted that they did not take the exam in Mathematics, that is, they did notgraduate in Mathematics. This fact reflects that Budapest Business School is notchosen by math-loving or knowing students, but the ones who want a degree inbusiness.
Distribution based on maturity exam level
Type of maturity intermediate advanced old maturity no maturityexam level level exam exam
Number of students 722 79 5 2
Table 1: The distribution of test results based on the level of high school leavingexamination results
The test focuses specifically on high school mathematics core material3, classicmathematical skills, as well as on investigating whether the knowledge required inhigher education and in order to get ahead is at the disposal of students or not.The tasks have a purely mathematical nature, and are not related to mathematicalproblems arising in life.
Raising to a higher power, operations with algebraic fractions, equations, in-equalities, defining the definition sets and value sets of functions, were all tested.There were 10 different exercise sets of the same kind, a unified key, unified scores,and 25 minutes solving time.
Placement Test 1:
Task 1. (2 points) Simplify the following fraction (a 6= 0)
(
1a
)
−
1
2 · 3√a
(3a−2)2 · a0
=
Task 2. (2 points) Carry out the operations by considering the possible values ofthe variable!
(
4b
2b+ 5− 2
)
:5
4b2 − 25=
Task 3. (2 points) Express the value of t from the formula 4k = 5t !
Task 4. (3 points) Solve the following inequality for real numbers!
lg(2x+ 10)
2< lg(x+ 1)
2The chosen pattern is not entirely representative for the students of all economic colleges.3Decree number 40/2002. (V. 24) about the detailed requirements of the maturity examination.

81
Task 5. (3 points) Enter the most extensive subset of real numbers, where a func-tion can be interpreted with the following rule:
f(x) =√2− x+
1
x2
Task 6. (4 points) Function f is given, interpreted in the set of real numbers:
f(x) = 7− |x+ 3|
a) Where does the function have a value of 6?
b) Define the value set of function f !
Figure 1: The results of individual tasks
The least likeable task was the third task since the fear from lettered expressionsappeared here. But not knowing this kind of task entails that the student will notbe able to cope with tasks and formulas of an economic nature later on. Because ofthe lack of the function table, which was used permanently in high school, they didnot have enough knowledge to solve the first two tasks. Shortcomings in functiontheory, namely defining the interpretation domain and the value set caused the poorresults in tasks 4 and 5.
General and very common mistakes:• Incorrect algebraic transformations: squaring by members, square root, comingup with the incorrect product, simplifying, for example:
2−1 = −2,(
3a−2)2
= 3a−4,
(
4b
2b+ 5− 2
)
· (2b− 5)(2b+ 5)
5= (4b−2)
2b− 5
5.
• Equations, defining the domain of inequalities, for example, in case of thesquare root equation, when inspecting the expression below the square root,they do not say anything about the sides, and do not compare the differentresults obtained with the result.
• Incorrect quadratic inequality solution: x2 > 9 ⇒ x > ±3 or x > 3.
• The role of the zero function, for example division by zero.

82 Judit Kollar
The above-mentioned problems, the frequent appearance of false analogies, in-correct solving of operations, result in incomplete knowledge and inadequate math-ematical knowledge.
Unfortunately, there was a fair number of students who committed annoyingcounting mistakes, but their thinking was correct. Sadly 15% of students achievedthe desired 50% minimum level.
Figure 2: The results of the tests
This very poor result can be explained by the prohibition of using the functiontable, and by the fact that they received fewer points in the sub-tasks than theywould have received in high school, or on the maturity examination.
If we examine students’ high school leaving examination result levels, we findthat the students who took the advanced level maturity examination performedsignificantly better than the intermediate4 level ones. These students study in highernumber of hours, and have a more demanding curriculum.
Figure 3: The results of the students with intermediate level maturity exams
4In case of the advanced level exam, the study group has a lower number of elements, so theresulting conclusions should be treated with caution.

83
Figure 4: The results of the students with advanced level maturity exams
All the Hungarian higher education institutions are experiencing the above prob-lems: similar results were obtained at BME (Budapest University of Technology andEconomics)5, where from 2006 students are been admitted have to write the place-ment test as assessment zero. Here too, only 25% of students reached the 50% level,which is the satisfactory level, and the better results were among students who tookthe advanced level maturity exams.
The placement tests of Eotvos University are more complex, time consuming,the material needed to proceed is assessed, and similar results were born.
Each survey clearly shows that the entrance exam score does not measure stu-dents’ knowledge level, which is poor; their performance is mixed, and most impor-tantly, the intermediate level maturity exam is not sufficient for further studies.
In every higher education institution the failure rate of first-year students is sohigh that it would be worth reconsidering the goals of high school mathematicseducation and those of the two-tier maturity exam system.
3 What striking changes have occurred in the current
secondary education system in recent years?
• The introduction of competency-based education and the two-tier maturityexam In Hungary competency related projects were launched in 2004, andthey were linked to the introduction of the two-tired maturity exam. TheOffice of Education determines the graduation requirements in mathematicsat two levels:
– intermediate level: it requires the mathematical knowledge of the peo-ple who are able to inquire and create in today’s society, which meansknowing and applying mathematical concepts and theorems in practicalsituations.
– the advanced level contains increased-level requirements, but the require-ments set out in the same way are achieved by more difficult tasks, whichrequire more ideas to solve. In addition, among the specific requirements
5Aniko Csakany, BME Mathematical institute, Mathematical Survey

84 Judit Kollar
of the advanced level exam are special topics, meant primarily to preparelearners in higher education.
However, as a consequence of the higher education funding system the inter-mediate-level school-leaving examination was sufficient for the entrance exam.Currently, the higher education plan contains a new maturity system, whichis being worked out by professionals but it seems that the changes will occurin the selection process and not the system requirements within the subjects6.
• Lower system requirements for students On the maturity exam a student canreceive a pass grade if:
– A minimum of 20% is achieved by him/her on the intermediate and ad-vanced level exams.
– Can adequately use the function table and the computer. This is creativeproblem solving, but we do not need this.
• Decreased time frame for teaching If we look at the time frame for teaching,it, we find that the total number of hours in all the education systems arefalling, while the volume of the syllabus increases. Balancing the amountof the material, its modern processing, and the time allowed for this seemsinsolvable.
• Changes within subjects
– New topics have been introduced, for example probability theory, mathe-matical statistics, graphs, which would not be a problem if the principlesof moderation were kept and it would not detriment mathematical oper-ations, such as algebra transformations and geometrical thinking, whichare of basic importance.
– Because of content regulation and the disproportionate distribution of thesyllabus the part of topics which is indispensable for acquiring a higher-level mathematics knowledge has been decreased. Algebra, geometry andanalysis are present at a proportion of 20-20% each.
set theory, logics, combinatorics, probability theory and statistics 40%
algebra, arithmetics, number theory 20%
functions, elements of analysis 20%
geometry, coordinate geometry, trigonometry 20%
Notice that in the description of the graduation requirements in Mathe-matics we often find the ”graphic” expression, which signals that a lot ofmathematically precise knowledge is not required, and instead the ”littlebit of everything” principle applies.
– The change in approach requires a greater emphasis on literacy (under-standing text) and language skills. 30-40% of the tasks is textual, con-nected to everyday life situations, and requires model-making tasks. Itshould also be noted that students’ native language comprehension skill isin a pathetic condition, often the children cannot arrive at mathematicalproblem solving because they do not understand the text.
6http://www.oh.gov.hu/valtozasok-felsooktatasi

85
• Some objective factors, such as mass education and classes with a large numberof people prevent the application of knowledge acquired in high school.
4 Emerging dilemmas
Statistics show that the practice-centered approach to the mathematics maturityexamination has not made things better. The average points of students decreasedcompared to results prior to 2005, and in higher education more and more depressingresults have been achieved. To begin with, you should ask the question of whetherthe competency-based mathematics tasks are sufficient enough to graduate from ahigher education institution while the students do not dispose of the scheme systemof the most significant mathematical concepts and operations.
• Will students have a more applicable knowledge by solving problems related toeconomics, IT or even everyday tasks, while they are unable to perform basicoperations?
• Will students be able to solve the mathematical problem if we consider thelack of comprehension - literacy, understanding text - skills?
E.g. elevated level maturity exam /May 2007 / Task 6:The weight of the plum seed is about 5% of the mass of the ripe plum. Whenstewing plum, during the drying technology water is subtracted from the un-seeded plum until only 5% of the remaining weight is made up of water, whatremains is the dry matter content. The resulting product is called prunes.
a) Considering the above, show that from 10 kg of picked plums 1 kg prunescan be produced!
b) Mr. Kovacs has sold half of his plum crop as raw, the other half asprunes. How many kilos of plum was his crop if the raw and dried plumsamounted to a total revenue of HUF 286000 altogether7?
• Do the new four-digit function tables help students learn the routine opera-tions?The motto of competency-based education is: knowing basic concepts, theo-rems, as well as recognizing and applying them in practical situations. Usingthe new function tables in every situation completely contradicts this theorybecause if students do not learn the theory, definitions, rules, theorems, thentheir theoretical background will not be enough for the solution patterns ofthe tasks.
• Is the content modernization equivalent with the tasks given from the newtopics in a disproportionate manner?
For example, in 2009, 42.61% of the advanced level maturity exam consistedof set theory, combinatorics, probability calculation and statistics. (tasks 2, 6,7 / c., and 9)8.
This proportion is valid for the maturity exam every year. The new topicsbeing introduced represent a high percentage of the tasks, and it seems thatknowing these precisely is not enough to graduate a college or a university.
7The whole task set and the correction and assessment notes can be found athttp://www.oh.gov.hu/letolt/okev/doc/erettsegi 2007/e mat 07maj fl.pdf
8http://www.oh.gov.hu/letolt/okev/doc/erettsegi 2009/e mat 09maj fl.pdf

86 Judit Kollar
The first obvious fact is that we should strive for a uniform distribution of diffe-rent subjects. Knowing certain bigger topics is not enough to achieve the sufficientlevel. So the content regulation has brought to the surface new problems, which aremore serious than any former ones, and I consider important that further researchis carried out in this direction.
5 Conclusion
Change does not necessarily mean improvement; introduction of new topics does notautomatically lead to better understanding.
The intermediate level examination requirements are adjusted to the general levelof education, while in order to enter the higher education system, the advanced levelmaturity examination is needed, this is confirmed by results of the placement papers,since those who learn mathematics by their choice perform much better. So highschool students preparing for mathematical studies in higher education need skillsand stable specialized knowledge to be able to solve problems within the subject, sothe effectiveness of higher education is primarily assured by requesting the advancedlevel maturity exam. The advanced level task set besides measuring certain com-petences also measures concrete material knowledge, and resembles the traditional,old maturity exam more. If the advanced level maturity exam replaced the entranceexamination, like the creators of the system thought, there would still be need forchange.
I agree with the intent to introduce more practical mathematics in order toincrease students’ interest, motivation to improve, but this should be achieved withina framework which does not reduce first-year students’ survival chances. On theone hand those areas that improve creativity, model making and thinking, shouldkeep their accentuated role, on the other hand, there is need to acquire skills inmathematical operations, equation solving, function illustrating, characterization,and skills must be acquired in plane and space geometry.
Secondary schools do not have to teach the material of higher institutions inadvance, but they need to provide a foundation which effectively supports the easieracquisition of future knowledge.
If the advanced level maturity exam is not required, for this serious problem apossible therapy would be to help students catch up with the missing knowledge.Today, most universities offer leveling courses in which basic material that is neededin college is revised. At BGF-PSZK during the first semester I held two hours weeklyin order to make up for the high school material. The need for catching up is greatfrom students’ part, and because of this many people attend these seminars. Theeffectiveness of the courses has not been inspected yet, but it is my intention tocarry out such research. Since this course takes place parallel with teaching thefirst part of Economic Mathematics, I consider important the development of acurriculum by which mathematical deficiencies can be remedied, avoiding backlogsin new material. In the coming period, within the framework of a survey I wouldlike to develop a strategy which helps the transition from one education system tothe next, for students and teachers alike.

87
References
[1] Europai Tanacs. Lisszaboni Europai Tanacs, 2000. marcius 23–24. Az elnoksegkovetkeztetesei. (European Council. Lisbon European Council 23 and 24 March2000. Presidency conclusions.)
[2] http://www.ttk.bme.hu/altalanos/nyilt/NulladikZH/[3] http://www.oh.gov.hu/korabbi-erettsegi/korabbi-erettsegi[4] http://mathdid.elte.hu/html/bscbevmat.html[5] A. Ambrus: Bevezetes a matematikadidaktikaba (Introduction to Mathematic
Didactics), ELTE Eotvos Kiado, 1995


Scientific Issues, Teaching Mathematics III: Innovation, New Trends, Research. Ruzomberok 2012
Kvizy
Edit Lazar
Department of Applied Mathematics and Probability Theory, University of Debrecen
Kassai Street 26. Debrecen 4026, Hungary
Abstract.
“Learn everything you learn for yourself... ” Petronius
In mathematics education there are a lot of important questions to response.I am searching answers for two questions: How can we make practice ourstudents? How can we control their knowledge? In an ambient where we can useIT technologies in the teaching I am looking for programs that make practicestudents and/or can control them. I am researching among free (or almost free)programs to access everybody. To understand better programs I am writinga program, too: Kvizy. In this article I introduce/compare some computersurvey programs: Kvizy, iTester, Hotpotatoes and some teaching programs:Hotpotatoes, www.maths.hu, KhanAcademy.
Keywords: Collections of computer programs, Control of knowledge, Exami-nation, Computer assisted instruction, Technological tools, Survey, Secondaryschool, University, Adult education, Higher education.
Classification: N80, D60, U50, U70; B68, B40.
1 Introduction
I am a PhD student so I am studying and teaching at the University of Debrecen atthe Department of Applied Mathematics and Probability Theory.I know the time we posse to teach students is very short and the material is gettingbigger day by day. Looking at these problems I decided to search programs oninternet (to self-study and/or to control) by two criteria:
• it can be used by students of secondary schools, universities or adults,
• it will be free or low-cost to be able to access students or everybody.
The first is because pupils more than 15 years have maturity to understand theyare studying for themselves and they can use computer without problems.
The second is because, by the experience, there are very good and wonderfulprojects and they function very well until the project has money.When the moneyruns out a lot of times the project dies.(For example at my university also was a verygood project named mobiDIAK with excellent teachers and materials but nowadaysare few people using this very useful material-system. This is very sad.)I also looked for free programs because in Hungary schools and universities are notwell-paid and I am seeing amoung our possibilities.
I will mention Mathematics Didactics (Did.) and IT (IT.) aspects, too.
2 Control and teaching
1. First I want to present some programs to control. I only see questionnary-making programs or part of them.
2. In the second part I introduce some programs/homepages that have methodsof teaching.

90 Edit Lazar
3 Control by questionnary-making programs
The control, the evaluation is almost the ’end’ of teaching. One type of control isthe test. By Binet
“This method, that measure the level of the knowledge of the student,has three advantages: - demostrates clearly the skills of every students. . . allows to measure the process of students . . . with this we can measure,evaluate pedagogic methods before to use them in the live education ”[1]
There are several types of tests but primarily I look for only the ’Single choice test’where there is a question and 2 or more answers. The responsive has to choose oneright among many bad.
(Did.) By didactics this type of test the simpliest: one ask and one good answer.It can be problem that the responsive has luck and without any knowledge canproduce a full good test. Yes, it can happen. The solution: to get more difficult testgiving closer bad answers to the good and/or extend the number of answers. In thelast case the probability to mark a good answer by chance will decrement with therising of the number of answers. It will be harder to remember to a swottinger too.
(IT.) At the background of every test there is a database to store questions, pos-sible answers and data.[2] Nowadays one of the most popular combination of surveysoftwares:(PHP + MySQL). This combination make fast and dynamic programs.
• MySQL is a database-system to store and manipulate data and[3]
• PHP is an independent programming language can make dynamic pages [4]’Single choice test’ is, by programming, the simpliest test because we do not have
to pay attention how to insert text, upper/lowercase problems also are eliminated,etc. and the main process is only compare the good answer with the given answer.
3.1 Criteria of a good questionnary-making program
(Did.) If you use a survey program as a teacher you have some main criteria:• easy to use
• easy to add new question
• you can give the number of questions
• you can give the number of answers
• after filling the form the program check it
• it shows/compares you the good answers
• it give you statistics of result
• you can choose the subject/s
3.2 Kvizy
This program is under construction. It can use on my localhost (only) but finishingI will be upload it to a shared server.How does it work?You can enter with a username and password or register.Then you can choose amongenable functions (e.g. have a list of questions, insert new subject, etc.).Next you canchoose subject and write how many questions you want (the program automaticallyshows how many asks are in the selected topic). Then the program generate a newquestionnary with random order of questions and random order of answers. At theend when you press Submit the program write your answers, good answers in red and

Programs and websites to test and practice 91
shows statistics. (Figure 1) This program serve me to understand how can prepare aprogram (IT.) and what are the didactics (Did.), technical mistakes and problems.
Figure 1: Kvizy - The result of questionnary
In the future I want to put a self-studying part adding solution method step bystep as we can see later in the subsection of www.maths.hu at page 94.
3.3 iTest
This is a complete program made by Softonic. It is made to teachers to create testsand exams.
“Create interactive exams and tests. iTest is the kind of program teacherslove and students hate: a complete tool to create exams and tests of allkinds.”[6]
How does it work?The program has two main parts: iTestServer and iTestClient.
The Server “which is the question/answer database editor and exam server” [6]. Thiscan use the teacher: you enter and give a name for your database or choose amongexisting databases.
You can insert new questions pressing the Add button.You can put a short namefor the question and write a very long question at the Question box.You can chooseamong 3 marks (Easy/Medium/Difficult) to put difficulty, too. At the bottom youcan select the type of questionnary: Single Choose/Multiple Choose and insert an-swers signing correct answer/s.
You can put similar questions with Duplicate button. At the end you have toApply and Save.So you have a database. Next step is by the Server button where can

92 Edit Lazar
make the really question-list clicking the Advanced box you can select the questions,add the Test name, Number of questions, Time for whole test or one question, etc.Pressing the Start server starts the process.
In server mode you can put the score of evaluation (percentage to pass), too.Then if you use the program in Local network clients/students can use it, if you useonly on your own PC you can press Server button and from the menu select RuniTestClient.
First you can see questions one by one in full screen mode and at the bottomon right hand you can go next / last. Clicking on left column you can select thequestion to change the answer. When you press the Finish button the program alertyou and if you finish you can see your answers and the result. You can print to filealso. Then you can make a new test or Quit.
Students’ work teacher can follow by server and have statistics, too. To finishthe test you have to choose Server button and from the menu select Stop Server.
3.4 HotPotatoes
[7] This is a website made by Half-Baked Software, the University of Victoria andCreative Technology. This is a transition between survey programs and teaching-help programs. It has parts to study. This is a Virtual Learning Environment whereyou can use various tools.
(IT.) It is made with (PHP + MySQL) and they are programming now, too.(Did.) One of the advantages of HotPotatoes: applications can use in some lan-guages, in Hungarian, too. I think this is very important for students and teacherswho do not speak in English.
“Teachers use the Hot Potatoes programs to create educational materials,especially exercises and tests. All these materials can be produced in theform of web pages, and the web pages can be uploaded to hotpotatoes.netvery simply, from within the Hot Potatoes programs.” [7]
It can use without internet seeing the result in a web-browser. I mentioned“programs” because HotPotatoes has varios parts:JClose, JMatch, JQuiz, JCross,JMix. I present JQuiz.
How does it work?
You log in (username/password). To posee a username you have to use anapplication of HotPotatoes. You can download it from the official homepagehttp://hotpot.uvic.ca/#downloads selecting the Operating System. After install ityou can use all applications. To make a test, insert queries you need JQuiz. You haveto write the title of test, choose the number of question, the question, choose whichtype of test do you want Single Choose/Multiple Choose/Mix/Short answers and theanswers, marking good answer/s. (It is possible insert more than 26 answers.) Youcan mix (randomize) the list, add picture, table in HTML form, links and text, too.Then you press F6 to export a HotPotatoes homepage. The program offer to seethe test in your web-browser or upload it to HotPotatoes.net In your browser youcan fill the test, go to the next/previev question. If you start answering it will showthe bad answer and do not allow you to change question until you solve the ask.

Programs and websites to test and practice 93
3.5 Comparison by criteria
Criteria Kvizy iTest HotPotatoes
Free X X X
Easy to use X X X
Has an own database or easy to add X X X
Number of questions X X X
Number of answers (from 2) X
Choose the topic X X X
Program checks and shows result X X X
Shows good answers X X X
Gives statistics X X X
Languages Eng/Hun Multi Multi
Internet only no no
Images X X
Single choice X X X
Multiple choice X X
To sum up this type of programs are useful not only in maths topics but othertopics too e.g. teaching languages, make IQ-tests or make lists about a given topic.
4 Teaching softwares
(Did.) [5] Teaching is a very complex process. We as teachers have good/bad habits,methods, personality, physical and psychical states/skills, have intuition, know ourstudents, etc. A simple program cannot have these aspects only can be a useful toolin the comprehension process. We have to think about how to teach and with what.These programs cannot solve teaching problems only we can look at them as usefultools.
4.1 Criteria of a good self-study or teaching softwares
(Did.) To use a teaching program you have some criteria:• easy to use,
• has clear declarations, questions, answers and descriptions,
• has subjects/topics (to group materials),
• you can follow the resolution steps easily,
• resolution steps are detailed,
• has image/s or video/s or something to help,
• can you ask, too,
• if you want to insert new material you can do it,
• interactive (if it is possible).If a program has more possibilities is better. These are only some criteria to examinea program.
(IT.) If we use a similar program for maths problems one of the most difficultproblems is how to write/insert maths formulas. Nowadays are projects to resolvethis problem and to have a common standardized solution.

94 Edit Lazar
4.2 HotPotatoes
(Did.) [7] In one of the previous sections (See . Hotpotetoes. on page 92 ) I wrotein detail about HotPotatoes. When you do test with the program it checks theanswers immediately and do not allow you to follow until you do not have (click)the right answer. So you will have the good answer at the end. Also is a good thatthe program marks next to the number of answer with a pictogram that is correct ornot and at the same time in the middle of the page at the top shows Correct or Nowith statistics. In this case the student will have the right answer but s/he will notknow the way to resolve the problem and in the future will not recognize or resolvea similar task.
4.3 www.maths.hu
[8] This is Gabor Hadnagy’s homepage (a Hungarian maths teacher). His pageis a good example “How can we use internet in maths teaching”. The site is inHungarian. The goal of the page is help students of high education with practicalexamples. The page only has the most important definitions and theorems need tosolve. Exercises are from three main topics: Analysis, Probability and OperationResearch. There are some free samples. If you want to see more you can registerand buy some credits (cc. 3 euros for 100 credits, cc. 4 credits per exercise) Withcredits you an see exercises and their keys step by step for 24 hours.I give an example here from the Operation Research topic about minimum spanningtree. In the example there are 10 steps until the solution and every step has its ownimage and explication to show the way of resolution. (Figure 2)
Figure 2: Math - Last step/solution
Recently there are 485 exercises with keys. Gabor has an online Digi board so

Programs and websites to test and practice 95
with this you can receive interactive lessons, too. The cost of use it 10 cents perminute.
4.4 KhanAcademy
[9] A page originally made to show exercises and practice a cousin but in a few timehas became a system. They have a mission so they say:
“. . . we’re on a mission to help you learn what you want, when you want,at your own pace.” [9]
They have more than 3000 videos and a mass of articles. It is in English butthere are subtitled videos and presentations. At the main page there are always newvideos and interesting conferences to see them. There are a lot of topics (not onlymaths) in three main topics (e.g. Math, Science, Humanities & Other). There arevarious levels of materials. The system uses American topics. On the videos youcan see a black-board and a pen writing with different colors during the explicationsyou can hear. The quality of script is not the best but you can follow it. You canmake tests, too but exists few tests and its level is very basic for us. If you aremaking a test on the right can see the result Check Answer or Show Solution . Witha smiley-figure they make more emphatic the result. At all page of practice the siteadvices you videos to practice the given topic. If you want to see a video you cando it only clicking on it. If you have a question or a comment you have to login andask from the authors or teachers. And they will response you. With a usernameof Google or Facebook you can login. The program make statistics and graphs, tooand you can use those. If you open the site it will collect all of your movements onpage and you can see all your operations and statistics. To help their mission youcan be a volunteer or uploader new videos.
“Students: track your video and exercise progress in your profile.Coaches: Track all of your students with the class report.”
This program is not an interactive page but almost is with a few time of waitingfor the answer.
(Did.) You can ask me about bad intention, level of the material or bad materialsto upload - this is a difficult question. It is depends on uploader’s intention.
4.5 Comparison by searched criteria
Criteria HotPotatoes www.maths.hu KhanAcademy
Free X X
Easy to use X X X
Has clear descriptions X X X
Has subjects/topics X X X
You can follow the resolution easily X X
Resolution steps are detailed X X
Choose the subject X X X
Has images/videos to help X X
Can you ask X X
Insert new material X X
Language Multi Hun Eng
Interactive if it is possible yes yes

96 Edit Lazar
5 Conclusion
Summarizing these results: these sites/programs are very useful and in case of us(Hungary) - where there is good student-resource (they are very clever in general)and not so much background resources to teach - we can and we have to useopportunities of biggest countries. Maths is not always preferred subject for studentbecause they do not understand and we do not have enough time to explain all tothem. So they will not feel the success that mean to resolve a problem independently(as mentions Gy. Polya) [5]. I hope that with practice pupils will have success andwith new technologies new appetite to get knowledge from and for their ambient. SoI am following my research with the goal: prepare a site/portal with a lot of linksof useful and free survey programs/sites and teaching programs to help our teachersand students.
My work is not finished with this comparison because there are new and newerprograms and with e-learning the process is infinite.
Acknowledgements
The author has been supported by Istvan Fazekas Dr. (Department of AppliedMaths and Probability - UD, Sandorne Kantor Dr. (Mathematics Didactics - UD,Istvan Lelkes webdesigner. And a special thanks to Gyorgy Szilagyi my husband.
References
[1] Gyorgy Horvath: Bevezetes a tesztelmeletbe Monograph Introduction to testtheory page 11. Keraban Kiado, Budapest, 1993
[2] Gabor Sagi: Webes adatbaziskezeles PHP es MySQL Book to Webprogrammingin PHP with MySQL. BBSINFO, Budapest, 2005
[3] http://php.sikerweb.hu/phptanfolyam/alapok Progamming site PHP, 2009[4] http://weblabor.hu/ Web-progamming site, various articles from2008[5] Istvan Czegledy, Dr.: Matematika tantargypedagogia I-II. Monographs in math-
ematics didactics. Calibra Kiado, Budapest, 1994[6] http://itest.en.softonic.com/ Website, USA, 2012[7] http://www.hotpotatoes.net Website, USA, 2012[8] http://www.maths.hu Website, Budapest, 2012[9] http://www.khanacademy.org Website, USA, 2012

Scientific Issues, Teaching Mathematics III: Innovation, New Trends, Research. Ruzomberok 2012
Restriction on construction tools used
Rita Nagy-Kondor
Faculty of Engineering, University of Debrecen
4028 Debrecen, Otemeto u. 2-4.
Abstract. Dynamic Geometry Systems make it possible to create a multitudeof drawings quickly, accurately and with flexibly changing the input data, andthus make the discovery of geometry an easier process. A general characteristicfeature of these systems is that they store the steps of the construction, and canalso execute those steps after a change is made to the input data. The objectiveof this paper is to demonstrate the application possibilities of Dynamic GeometrySystems in primary and secondary schools.
Keywords: teaching geometry, Dynamic Geometry Systems.
Classification: D30; U50.
1 Introduction
The emergence of computer programs in education forces people to rethink theirviews, as we have the reconsider what we regard as important. Formal knowledgeis devaluated (since the computer can perform such tasks faster and better), and ahigher value is associated with the capability for problem solving.
Computer-based drawing programs provide assistance with regard to this ob-jective, opening up new opportunities in the teaching of geometry. They makeit possible to create a multitude of drawings quickly, accurately and with flexiblychanging the input data, and thus make the discovery of geometry an easier process.Dynamic Geometry Systems (DGS) are good match to problem solution process. Asstudents draw objects and investigate relationships between objects, the represen-tation of objects impacts the nature of the relationships between objects. DGS aregood match to problem solution process.
One of approach to describe the roles of new technologies in mathematics educa-tion is to examine how they are affecting each content area. We carried out researchin computer-based teaching and learning of graph-oriented problems. The objec-tive of this paper is to demonstrate the application possibilities of DGS in teachinggeometry.
2 Application possibilities
The development of students creativity is one of the most teacher dependent areasof mathematical education. Students who can face unexpected situations and solvenew problems should be and will be in great demand. In this area, DGS may beuseful in improving students skills. The way to problem solving in geometry startswith drawings, since we need accurate drawings to arrive at the right conclusions.There are so many application possibilities of DGS in the teaching of geometry:
• Searching for sets of points (simple search for sets; the method of omittingconditions)
• Discussion, examination of limit values
• Theorem checking
• Restriction on construction tools used

98 Rita Nagy-Kondor
• Comparative geometrySome application possibilities have been illustrated by few works. [3, 4, 7, 8]The development of students creativity is one of the most teacher dependent
areas of mathematical education. In this area, DGS may be useful in improvingstudents skills. [5, 10]
3 Restriction on construction tools used
One good method of developing creativity is to approach known problems accordingto new kinds of rules. [6] A good example for this in geometry is changing the rulesof constructions, for example by putting restrictions on the construction tools thatmay be used. [1, 9, 11] Let us consider three possibilities:
• using only rulers during the construction;
• executing old, well-known constructions using only compasses (Mascheroni-construction);
• a circle and its centre are given, and only rulers may be used (Steiner-construc-tion).
Constructions to be made using only rulers are such that require points to beconnected and intersection points of lines to be located. Using the latter two methodsof constructions, all problems solvable by Euclidean construction can be solved,except, of course, that we cannot construct a line using the first method, or a circleusing the second (Mohr-Mascheroni theorem; Poncelet-Steiner theorem).
Symbolic manipulation utility programs can support rapid exploration of pat-terns in algebraic reasoning; leading to discovery of important general principles.So DGS tools facilitate exploratory learning. DGS helps students make and testconjectures about properties of basic geometric figures.
When defining interactive problems, the teacher may control what constructiontools are available in Cinderella, and thus creativity may be developed even fromas early as eighth grade. Our objective is to execute the construction using theprogram.
Example 1. The Napoleon problem: construct a square inside a circle, using onlycompasses [8] (Figure 1). Vertices of square: P, Q, R, S.
Example 2. Given AB segment with its midpoint F and with a P point outsidethe segment. Construct the parallel to the given segment through the given P point,using rulers only. [1] (Figure 2)
At the same time this picture shows how we can construct the midpoint ofsegment AB with rulers if there is given a parallel line with segment AB.
Example 3. Double the AB segment with using compasses only. (Figure 3)Example 4. Find the centre of the circle with using compasses only. (Figure 4)
4 Conclusion
DGS permitting a more effective development of experimental approach to mathe-matics, allowing for the exploration of problems and theorems is more interestingthan those usually encountered, and not strictly within the syllabus. There is notmuch point in trying to find way of satisfying old objectives by new methods; instead,education should also strive to adjust to the requirements of the quickly changingworld. The best way to decide in case of theoretical debates is an experimental

Restriction on construction tools used 99
Figure 1: The Napoleon-problem
Figure 2: Using only rulers during the construction
test. It is not only the organisation of computer-aided education, but also the pro-ducts thus created require special expertise; however, evaluation in a computer-basedlearning environment is more life-like: it is not only the extent and accuracy of stu-dents knowledge that we find out about, but also whether this knowledge will beusable.
In the computer used group it is more typical that the students helped eachother, corrected their mistakes. Experimentation was more typical for them as well,as the faulty elements could be hidden without any sign with a mouse click. Sothe computer inspired the students to stand on their own feet. Similarly to Heuglsresearches [2] we also found that the testing phase at the paper-and-pencil group isoften missing. Computers provide a more user-friendly atmosphere for teaching andthey are more suited to the needs of the individual learner.

100 Rita Nagy-Kondor
Figure 3: Double the segment AB with using compasses only
Figure 4: The centre of the circle with using compasses only
The use of computers permitting a more effective development of an experimentalapproach to mathematics, allowing for the exploration of problems is more interest-ing than those usually encountered, and not strictly within the school syllabus.
References
[1] G. Czedly A. Szendrei : Geometriai szerkeszthetoseg, Monographs in VisualCommunications. Polygon, Szeged, 1997
[2] H. Heugl: Symbolic computation systems in the classroom, The InternationalDerive Journal, 3/1, 1-10, 1996
[3] J. Hohenwarter M. Hohenwarter Z. Lavicza: Evaluating Difficulty Levels ofDynamic Geometry Software Tools to Enhance Teachers Professional Develop-

Restriction on construction tools used 101
ment, International Journal for Technology in Mathematics Education, 17/3,127-134, 2010
[4] U. H. Kortenkamp: Euklidische und Nicht-Euklidische Geometrie in Cinderella,Institut fr Theoretische Informatik Zrich, 1999
[5] U. H. Kortenkamp: Foundations of Dynamic Geometry, PhD thesis, SwissFederal Institute of Technology Zrich, 1999
[6] Z. Kovacs: Geometry constructions I (in Hungarian), University of Debrecen,2001. http://zeus.nyf.hu/ kovacsz/szerk.pdf
[7] C. Laborde: Integration of technology in the design of geometry tasks withCabri-geometry, International Journal of Computers for Mathematical Learn-ing, 6, 283-317, 2001
[8] R. Nagy-Kondor: Using dynamic geometry software at technical college, Mathe-matics and Computer Education, Fall, 249-257, 2008
[9] J. I. Perelman: Amusing geometry (in Hungarian), Muvelt Nep Konyvkiado,243-244, 1953
[10] J. Richter-Gerbert: The interactive geometry software Cinderella, Springer,1999
[11] G. Szokefalvi Nagy: A geometriai szerkesztesek elmelete, Akademiai Kiado,1968


Scientific Issues, Teaching Mathematics III: Innovation, New Trends, Research. Ruzomberok 2012
Using educational multimedia-based software in
teaching color theory to students of civil
engineering
Erika Perge
University of Debrecen
H-4028 Debrecen, Otemeto u. 2-4.
Abstract. Electronic devices and computer software have created new oppor-tunities in acquiring and imparting information. My goal is to introduce howto make use of our educational software in the process of teaching and learningcolor theory, as well as cultivating students’ skills in recognizing and discerningcolors. I offer a quick overview on how color theory is taught at different levels ofeducation, and I demonstrate the results of a survey carried out at the Universityof Debrecen aiming to assess the level of knowledge in color theory possessed bystudents starting their first year at the Faculty of Civil Engineering.
Keywords: color, color theory, educational software.
Classification: U50; P80.
1 Introduction
“Colour is life; for a world withoutcolours appears to us as dead.”
Johannes Itten
All human beings take pleasure in colors: it is nearly impossible to imagine ourlife without them. Colors surround and affect us. We can express our mood andfeelings through colors. One of the goals of education (any level) is to prepareyoung people for a world dominated by colors: colorful pictures, posters, printeddocuments, movies, video games etc. Colors affect us, and through colors, we canaffect others. In many cases, we use the effects of colors in modifying our environmentwithout being aware of said effects. However, awareness of how colors can changeour perception of space and mass is crucial to students of civil engineering, who needto be taught to apply the laws of color theory in practice. Below we demonstratethe application of an interactive software based on a modern educational approach,providing an active role to the student through various methods of learning. [1]
2 How color theory is taught in Hungary at elementary, high
school and college level
According to Hungary’s national curriculum, color theory is taught as part of thesubject “Drawing and visual culture” during the first 12 years of education.
1st to 6th year: 1,5-2 hours per week7th and 8th year: 1 hour per week9th and 10th year: 1 hour per week obligatoryDuring the 11th and 12th year, students planning to take a final exam in the
(facultative) subject can study it in 2 hours per week. Also, there is a period called“Arts”, which could include drawing, music, drama, animation or media culture,depending on the school’s decision.

104 Erika Perge
In the subject ”Drawing and visual culture”, colors are dealt with in approxi-mately 25-30 percent of the total time, which translates to 9 to 17 hours at differentgrades. The only way to pass on a satisfying level of knowledge on the field inthe short period of time provided by the national curriculum is to apply techniquesthat actively involve the student in the process of learning. While learning artsat elementary and high school, students deal with characteristics of each paint type(color, brightness, temperature, saturation), and learn the basics of subtractive colormixing. They create harmonies, disharmonies and contrast. [3]
In physics classes, students learn that the white color is characteristic for com-pound light, which contains multiple different components (each with a differentfrequency and wavelength). By guiding white light through a prism, its compo-nents, the spectral colors can be separated. The total range of spectral colors iscontinuous: it is called the spectrum. Another goal of high school physics is to teachthe laws of how light is reflected.
When learning chemistry, students observe characteristic changes of color as theresult of certain reactions (reflecting changes in the energy level of chemical bondsformed by electrons).
In biology, students are taught to distinguish between visual stimuli and visualperception: they learn the basics of the wonderful physiological coordination thatexists between our eyes and our brain.
At college level, students can deepen their knowledge on certain aspects of colortheory that are related to their chosen field. Ophthalmologists, civil engineers, tea-chers and artists all study different, specific aspects that are required for their work.
3 Basic knowledge of color theory possessed by 1st year
students of civil engineering
In September 2011, a survey was carried out at the Faculty of Civil Engineering,University of Debrecen, to assess the level of understanding of color theory possessedby students starting their studies in the 2011-12 academic year. 125 students tookpart in the survey. 52 percent were admitted from a general, 38 percent from atechnical high school. [7]
68 percent of the students only studied about colors as part of the arts subject.25 percent also encountered the topic in art history, and 1 percent in hand-drawing,history of architecture, basics of printing, technical sketching, physics, chemistry,and biology, respectively.
Only 1 percent could give a satisfying definition of the color wheel. 0.8 percentknew that it contains primary colors. 43 percent managed to correctly list theprimary, and 17 percent the secondary colors.
The complementary color for green, blue and yellow was correctly determinedby 12, 10 and 7 percent, respectively. 12 percent of the students knew that comple-mentary colors are found on opposite sides in the 6- or 12-color wheel.
Students didn’t show much experience in mixing colors, either. They seem to bemissing any kind of knowledge on the topics of light colors and visual perception inthe brain. These deficiencies need to be corrected by all means.

Using educational multimedia-based software 105
4 Improving students’ understanding of color theory
Students of civil engineering need to understand that an important part of theirfuture work (designing buildings) is to visualize the buildings using colors. Even incollege, the number of hours spent teaching color theory is limited, so it is crucialto use the time as effectively as possible. Interactive multimedia-based computerprograms are gaining ground not only in elementary and high school, but collegeand distance education as well. [2]
The software I introduce below was developed by us, and currently being used inteaching various subjects (Color dynamics, Sketching in Architecture VI., Expressiontechniques).
5 Interactive multimedia-based software to teach color theory
The educational software is useful in studying characteristic features of colors (tone,saturation, brightness), as well as summarizing experience and observing similaritiesbetween different color systems. Using the program constantly improves students’sensitivity for colors, their ability to create harmonies, their observation of howcolors manifest in the inner space and exterior of buildings. It cultivates the abilityto comprehend the role of color relations in expressing mass and space. Possessingand utilizing these skills is vital to modern architects, who are responsible for makingour environment more beautiful to look at.
5.1 The software’s development environment
To develop the program, we used the Flash ActionScript environment, which com-bines the efficiency of high level programming languages with spectacular anima-tions.[6] The developed program can perform free conversions between different colorspaces. It helps to understand the relations between light and dye colors, and allowschanging the exterior or interior colors of a building in real-time. Test questions arealso processed by a flash module, and the results are transmitted to a public serverwhere the data are stored in an SQL database.
5.2 The program’s structure
Once the program has loaded, the user can first read general information on howto use the software, hardware requirements to run the animations, and the mostimportant chapters found on the CD. [5]
Figure 1: Initial screen of the educational software

106 Erika Perge
5.3 Using interactive animations
As an example, I demonstrate a test aiming to improve the user’s ability to recog-nize and discern colors, while allowing for a deeper understanding of the acquiredknowledge through an active involvement in problem-solving.
5.3.1 Mixing colors (HSB)
Figure 2: A color mixing experiment
The computer generates a sample color on the left side of the screen. The stu-dent’s task is to match the color on the right side to the given sample, using colorstaken from the color wheel below, and adjusting saturation and brightness by thesliders. The currently black background behind the rectangles can be changed towhite, gray or colorful.
For beginners, the task is not an easy one: for the unconditioned eye, it can bevery difficult to detect slight changes in the shade of a color.
5.3.2 Mixing colors in different color systems (HSB, RGB, CMY)
Figure 3: Mixing colors in different color systems
The educational software can simulate additive and subtractive color mixing.The student can alter the “intensity” of each color on the slides, and observe theresulting colors along with their written color code. Instructors may demonstratein an interactive way how to mix certain colors by changing the parameters of tone,saturation and brightness.

Using educational multimedia-based software 107
5.3.3 Matching color stimuli
There are many possible experiments to test if the user can correctly match colorstimuli, and in each one, either the brightness or the saturation differs. The pro-gram generates samples randomly, and the difference value between the colors tobe compared is also random, but upper limits are constantly reduced to increasedifficulty.
Figure 4: An experiment to match color stimuli
5.3.4 Color harmonies
When choosing colors for anything, the most important rule to keep in mind isthat there are no bad colors, only nonmatching ones. Well-chosen colors can createharmony and express power. Creating a harmony of colors is essential in the designof documents and buildings alike. Students are expected to learn the way differentcolor harmonies (monochrome, dichrome, trichrome, tetrachrome, analogous) arecreated and applied in practice. [4]
Figure 5: Using monochrome harmony on an interior or exterior surface of a building
Using a color chosen from the color wheel, and input values (saturation, bright-ness) from the sliders, the software generates a 5-hue monochrome pattern. Colorcodes are written for each hue. The resulting pattern can be observed immediatelyon an interior or exterior surface of a building. The sample hues include a darker, abrighter, a more and a less saturated version of the chosen main color.
In the example below, the type of harmony (dichrome) and the chosen com-plementary color pair (green and red) are the same, but there is a considerabledifference in saturation values (100 percent and 26 percent). The program offersthe opportunity to perceive the different effect of applying clean, saturated colors or

108 Erika Perge
Figure 6: Using harmony on an interior or exterior surface of a building
lighter, unsaturated colors on the same external or internal surface. Students canexperiment to find the right brightness and saturation values for coloring the interioror exterior surface.
When creating a tetrachrome harmony, the user can choose from 20 different huesaltogether (5 hues for each chosen color). The software can spare one a fair amountof time, since the sketch of the building doesn’t need to be redrawn each time a newcolor pattern is applied. There are unlimited possibilities to modify coloration, andeach modification can be undone right away, so the user can test and observe manydifferent patterns in a matter of seconds.
Figure 7: Coloring building exteriors
5.4 Tests
The software provides tests allowing the instructor to monitor students’ progress, andadds the option of digital evaluation to assist the process. Using the tests is especiallyadvisable in larger student groups, where it saves time, allows for easier comparisons,a quicker recognition of problematic parts in the taught material, and makes it easierto identify students who progress slower than usual, or on the contrary, the ones whoshow talent in the field. Question types:
• Single choice and multiple choice questions: this type of test is useful in check-ing students’ knowledge on the theoretical aspects of taught material.

Using educational multimedia-based software 109
• Showing the answer (problem accompanied by an image): this kind of exami-nation is used to test the ability to recognize, define and distinguish colors.
Figure 8: Comparison by brightness and saturation, furthermore color mixing
• Determining the correct order An active type of test to measure how effectivelystudents can put samples with different brightness and saturation in the correctorder. It comes at multiple difficulty levels.
Figure 9: Rearranging color samples
Problem: Put the color samples in the correct order of tone. Start with thedarkest one, and use as few steps as possible.
Rearrange the displayed samples so that they are positioned from top to bottomon the dark-light scale, and from right to left on the saturated-unsaturated scale.Answer times for each question are monitored as well. In certain problem types, thesoftware only allows the user to progress to the next question if the correct answerhas been given, for such problems, the number of tries are monitored instead ofanswer time.
6 Practical application of the program in education
Benefits of the introduced software are listed below:• allows students to prepare for exams from the material on their own
• students can carry out basic experiments on their own, acquiring further know-ledge to the extent of their personal preference
• material is useful at various skill levels, for students of different grades
• modeling of realistic objects is possible
• contains a large variety of test problems
• useful in examination (side tests in addition to the main exam)

110 Erika Perge
• contains problems at multiple levels of difficulty
• reproduction is possible
• easy to use
• platform-free (works on almost any operation system)
• provides a sense of success to student and instructor alike
• user-friendly
7 Summary, possibilities for improvement
For a civil engineer of the future, it won’t be enough to acquire sufficient knowledgeof color theory and understanding of how color harmonies are created. It is essentialthat colleges train professionals who are able to put the studied theory into practice.
Students were looking forward to using a newly designed program to study colortheory. After being introduced to the basic structure of the software and the includedproblem types, they could vote whether they wanted to use the program in classesbeside Adobe Photoshop. All students voted on using it, the feature to instantlychange color patterns on modeled objects and the variety of options for mixing colorshad them convinced. They eagerly experiment with the program even in their freetime to practice and gain more experience. Students find the program easy to useand feature-rich.
The first phase of the design process has been completed, but testing is still inprogress. If the product turns out to be successful, we plan to implement morefeatures. The software’s structure leaves room for more chapters and improvements.We are also planning to release an English version of the educational software.
References
[1] Johannes Itten: A szınek muveszete, Corvina, Budapest, 2004.[2] Karpati Andrea: Informatikai eszkozok a vizualis nevelesben, 2006.[3] National curriculum, 2007[4] Nemcsics Antal: Szındinamika, Akademia Kiado, Budapest, 1990[5] Kiraly Sandor: Altalanos szıntan es lataselmelet, Nemzeti tankonyvkiado.
Budapest, 1994[6] Reinhardt, Robert: Flash 5 Bible, Kiskapu Kft, Budapest, 2001[7] Falus Ivan – Olle Jnos: Statisztikai modszerek pedagogusok szamara, Okker
Kiado, 2000[8] Edward Carterette – Morton Friedman: Handbook of perception, volume V.,
Seeing, Academic Press, London 1975. 3rd ed. Wiley, 2000[9] Fairchild MD: Color appearance models, Addison – Wesley, Reading1998[10] Hunt RWG: he reproduction of colour, 5th ed. Fountain Pr. 1995[11] Schanda j. ed.: Colorimetry, Using the CIE system., Wiley 2007[12] Sik Lanyi C, Lanyi Zs: Multimedia Program for Training of Vision of Children,
Journal of Information Technology Education, 2003, Volume 2, pp. 279-290[13] Lanyi C, Laky V, Tilinger A, Pataky I, Simon L, Kiss B, Simon V, Szabo J, Pall
A: Developing Multimedia Software and Virtual Reality Worlds and their Use inRehabilitation and Psychology, Transformation of Healthcare with InformationTechnologies, IOS Press, 2004, pp. 273-284

Scientific Issues, Teaching Mathematics III: Innovation, New Trends, Research. Ruzomberok 2012
Teaching of Binomial Confidence Intervals
Ivana Pobocıkova, Zuzana SedliackovaDepartment of Applied Mathematics, Faculty of Mechanical Engineering
University of Zilina, Univerzitna 1, 010 26 Zilina, Slovak republic
Abstract. In basic statistical textbooks the asymptotic Wald interval andthe exact Clopper-Pearson interval are presented for the interval estimating ofthe binomial proportion. The Wald interval performs poorly and it should notbe used. In this paper we recommend to teach the asymptotic Agresti-Coullinterval. The Agresti-Coull interval is simple to compute and understand and itsderivation is natural for students. This interval performs better compare to theWald interval. The confidence intervals are illustrated on the example.
Keywords: Binomial distribution, binomial proportion, confidence interval.
Classification: K60.
1 Introduction
The interval estimation of a binomial proportion is one of the basic problem ofstatistics. The binomial distribution is used in statistics in various application. Ingeneral, the random variableX has binomial distribution, ifX represents the numberof successes in n independent Bernoulli trials. The probability of a success is thesame for each trial and is denoted by π.
Let random variable X follows a binomial distribution with parameters n ∈ Nand π ∈ (0, 1). The probability that a random variable X is equal to the value x isgiven by
P (X = x) =
(
nx
)
πx(1 − π)n−x, x = 0, 1, ..., n. (1)
The parameter π is also called binomial proportion. In practice a value of theparameter π is usually unknown and must be estimated. The maximum likelihoodestimator for the parameter π from the sample is
p =x
n, (2)
where x is a number of successes in a random sample of size n. We are interested ininterval estimating of the parameter π.
The 100. (1 − α)% two-sided confidence interval for parameter π is intervalCI(x, n) = 〈pL, pU 〉 such as
P (pL ≤ π ≤ pU ) ≥ 1− α, (3)
where (1− α) is the desired confidence coefficient and α ∈ (0, 1).The literature contains several methods for constructing confidence intervals for
the binomial proportion. In basic statistical textbooks there are presented the Waldinterval, Laplace (1812) and the Clopper-Pearson interval, Clopper and Pearson(1934). The Clopper-Pearson interval is based on exact binomial distribution. TheWald interval is based on the standard normal approximation to the binomial dis-tribution. It is known that the Wald interval performs very poorly in term of the

112 Ivana Pobocıkova, Zuzana Sedliackova
coverage probability. According to, this interval should not be used, Newcombe(1998), Brown and etc. (2001), Pires and Amado (2008). Instead the Wald intervalwe recommend to teach the Agresti-Coull interval, Agresti and Coull (1998). Itsderivation is similar to the Wald interval. This interval performs very well and issimply to compute and to understand for students.
2 Alternatives of confidence intervals
The Clopper-Pearson interval. The Clopper-Pearson interval is based on exactbinomial distribution. This interval is often called ”exact” interval. For givenX = x,0 < x < n, lower and upper bounds of the 100. (1− α)% Clopper-Pearson intervalare
pL =x
x+ (n− x+ 1)F1−α
2(2(n− x+ 1), 2 x))
,
pU =(x+ 1)F1−α
2(2(x+ 1), 2(n− x))
n− x+ (x + 1)F1−α
2(2(x+ 1), 2(n− x))
, (4)
where Fα(r, s) is α-quantile of F -distribution F (r, s). If x = 0 then pL = 0 and
pU = 1−(α
2
)1
n
. If x = n then pU = 1 and pL =(α
2
)1
n
.
The Wald interval. The Wald interval is based on the standard normal ap-proximation to the binomial distribution. The random variable
U = (p− π)/
√
p (1− p)
n(5)
is approximately standard normally distributed. Thus for given X = x lower andupper bounds of the 100. (1− α)% Wald interval are
pL = p− k1−α
2
√
p (1− p)
n, pU = p+ k1−α
2
√
p (1− p)
n, (6)
where kα is α−quantile of a standard normal distribution N(0, 1).Why are there several methods for constructing the binomial confidence inter-
vals?To evaluate the performance of the confidence intervals these criteria: coverage
probability, conservatism and interval length are important.
The coverage probability. The coverage probability is defined for given n ∈ Nand π ∈ (0, 1) as
C(n, π) =
n∑
x=0
I(x, π)
(
nx
)
πx (1− π)n−x
, (7)
where I(x, π) =
{
1 if π ∈ CI(x, n)0 if π 6∈ CI(x, n)
is an indicator function.
If for given n ∈ N and π ∈ (0, 1) is C(n, π) ≥ 1−α, then the confidence intervalis conservative.

Teaching of Binomial Confidence Intervals 113
0 0.2 0.4 0.6 0.8 10.85
0.9
0.95
1Clopper−Pearson interval, n=30, 1−α=0.95
π
Cov
erag
e pr
obab
ility
0 0.2 0.4 0.6 0.8 10.85
0.9
0.95
1Wald interval, n=30, 1−α=0.95
π
Cov
erag
e pr
obab
ility
0 0.2 0.4 0.6 0.8 10.85
0.9
0.95
1Agresti−Coull interval, n=30, 1−α=0.95
π
Cov
erag
e pr
obab
ility
Figure 1: Coverage probability of the 95% confidence intervals for n = 30
The coverage probability is probability, that confidence interval contains theparameter π. Due to the discrete nature of the binomial distribution, the coverageprobability can not be exactly equal to the nominal level (1 − α) at all possiblevalues. We prefer confidence interval with coverage probability near to the nominallevel (1− α).
The expected length. The expected length of the confidence interval is definedas
EL(n, π) =
n∑
x=0
[pU (x, n)− pL(x, n)]
(
nx
)
πx (1− π)n−x
, (8)
where pU (x, n), pL(x, n) are bounds of particular confidence intervals.
We prefer confidence interval with shorter expected length.
The Clopper-Pearson interval is for all n ∈ N and π ∈ (0, 1) conservative intervaland too wide (Figure 1, Figure 2). Interval is good choice in the situation, whenthe coverage probability must be guaranteed to be equal to or above nominal level(1− α) and when the sample size is small.
The Wald interval is the best known and most commonly used interval. TheWald interval is simple and its derivation is natural for students. The textbooksgive ”safety” recommendation, when may be the Wald interval used, for example ifn p ≥ 5, n (1−p) ≥ 5 or n p (1−p) ≥ 5 or n is very large. The expected length of the

114 Ivana Pobocıkova, Zuzana Sedliackova
0 0.2 0.4 0.6 0.8 10
0.05
0.1
0.15
0.2
0.25
0.3
0.35
0.4Expected length of the 95% CI for n=30
Clopper−PearsonWaldAgresti−Coull
Figure 2: Expected length of the 95% confidence intervals for n = 30
Wald interval is short (Figure 2), unfortunately this simple interval suffers from alot of mistakes. The interval has problem with the zero width interval when X = 0or X = n. A lower bound of the interval can be below 0 for X close to 0 and theupper bound can be upper 1 for X close to n. It is known that the Wald intervalperforms very poorly in term of the coverage probability. The coverage probability isbelow nominal level (1−α) even for large sample sizes (Figure 1). The Wald intervaldoes not guarantee the good quality of the estimation of the binomial proportion.According to, this interval should not be used, Newcombe (1998), Brown and etc.(2001), Pires and Amado (2008).
The Agresti-Coull interval. Instead the Wald interval we recommend to teachthe Agresti-Coull interval, Agresti and Coull (1998). The Agresti-Coull interval isbased on the standard normal approximation to the binomial distribution and issimilar to the Wald interval. Agresti and Coull (1998) introduced modificationof the Wald interval by adding two successes and two failures into sample. Theestimator for the parameter π is
pw =X + 2
n+ 4. (9)
For given X = x lower and upper bounds of the 100. (1−α)% Agresti-Coull intervalare
pL = pw − k1−α
2
√
pw (1− pw)
n+ 4, pU = pw + k1−α
2
√
pw (1− pw)
n+ 4, (10)
where kα is α−quantile of a standard normal distribution N(0, 1).This interval has the disadvantage to have the lower bound pL < 0 and the upper
bound pU > 1. But never degenerate to interval with the zero width interval as theWald interval. The Agresti-Coull interval has a good coverage probability, compareto the Wald interval (Figure 1). The Agresti-Coull interval performs very well, it issimply to compute and to understand. Many autors, for instance Brown and etc.(2001), Pires, Amado (2008), recommend the Agresti-Coull interval for presentation

Teaching of Binomial Confidence Intervals 115
and teaching. Brown and etc. (2001) recommend this interval for sample sizesn ≥ 40. This interval is a good starting point to teach binomial confidence intervals.
2.1 Example
A random sample of 30 consumers taste tested a new food product. 9 consumerslike a new food product. We find the 95% confidence interval to estimate of theproportion of the consumers who like the new food product.
Solution. The point estimator of the proportion of the consumers who like a newfood product is
p =x
n=
9
30= 0, 3.
• The Clopper-Pearson interval. The lower and upper bounds of the interval are
pL =x
x+ (n− x+ 1)F1−α
2(2(n− x+ 1), 2 x))
=9
9 + 22. 2, 3673= 0, 147
pU =(x+ 1)F1−α
2(2(x+ 1), 2(n− x))
n− x+ (x+ 1)F1−α
2(2(x+ 1), 2(n− x))
=10. 2, 0499
30− 9 + 10. 2, 0499= 0, 494
The 95% Clopper-Pearson interval is 〈0, 147; 0, 494〉.• The Wald interval. The lower and upper bounds of the interval are
pL = p− k1−α
2
√
p (1− p)
n= 0, 3− 1, 96.
√
0, 3. 0, 7
30= 0, 136
pU = p+ k1−α
2
√
p (1− p)
n= 0, 3 + 1, 96.
√
0, 3. 0, 7
30= 0, 464
The 95% Wald interval is 〈0, 136; 0, 464〉.• The Agresti-Coull interval. The estimator for the parameter π is
pw =x+ 2
n+ 4=
11
34= 0, 3235.
Then the lower and upper bounds of the interval are
pL = pw − k1−α
2
√
pw (1− pw)
n+ 4= 0, 3235− 1, 96
√
0, 3235. 0, 6765
34= 0, 166
pU = pw + k1−α
2
√
pw (1 − pw)
n+ 4= 0, 3235 + 1, 96
√
0, 3235. 0, 6765
34= 0, 481
The 95% Agresti-Coull interval is 〈0, 166; 0, 481〉.From this example, the methods give different intervals. The Agresti-Coull in-
terval is the narrowest and the Clopper-Pearson interval is the widest. We prefer theAgresti-Coull interval. We have 95% confident that the proportion of the consumerswho like a new food product is in interval 〈0, 166; 0, 481〉.
3 Conclusion
The binomial distribution is encountered in various situation of everyday life. Sointerval estimation of the binomial proportion is very interesting and importantproblem. The normal approximation method serves as a simple way to introduce

116 Ivana Pobocıkova, Zuzana Sedliackova
the idea of the confidence interval. The Wald interval is easy to teach and understandfor students, it is easy to calculate by hand, but it performs poorly. We recommendto teach the Agresti-Coull interval because it has some better properties compareto the Wald interval and also it is very important to introduce new knowledge intoteaching. Then the learning is more useful and interesting for students.
Acknowledgements
The authors has been supported by grant KEGA 046U-4/2011.
References
[1] A. Agresti, D. A. Coull: Approximate is better then “exact” for interval esti-mation of binomial proportion, American Statistician 52, p. 119-126, 1998
[2] J. Borzıkova, D. Mamrilla, A. Vagaska: Matematika. Pravdepodobnost amatematicka statistika. Prednasky/Seminare, Vranov nad Toplov: Elibrol,s.r.o., ISBN 978-80-89528-16-, 2011
[3] D. L. Brown, T. T. Cai, A. DasGupta: Interval estimation for a binomialproportion, Statistical Science 16, p. 101-133, 2001
[4] C. Clopper, S. Pearson: The use of confidence or fiducial limits illustrated inthe case of the binomial, Biometrika 26, p. 404-413, 1934
[5] B. Dorciakova, I. Pobocıkova: Zbierka uloh z pravdepodobnosti a matematickejstatistiky, Zilinska univerzita, ISBN 978-80-554-0230-7, 2010
[6] P. S. Laplace: Theorie analytique des probabilities, Paris, France,Courier, 1812[7] R. G. Newcombe: Two-sided confidence intervals for the single proportion;
comparison of several methods, Statistics in Medicine 17, p. 857-872, 1998[8] M. A. Pires, C. Amado: Interval estimators for a binomial proportion: com-
parison of twenty methods, REVSTAT-Statistical Journal, Volume 6, Number2, p. 165-197, 2008
[9] I. Pobocıkova: Better confidence intervals for binomial proportion, Commu-nications: Scientific Letters of the University of Zilina Vol 17, No. 3, p. 31-37,2010

Scientific Issues, Teaching Mathematics III: Innovation, New Trends, Research. Ruzomberok 2012
The use of multimedia in the context of e-exams
Jacek Stando, Konrad SzumigajTechnical University of Lodz
11 Al. Politechniki St.
Technical University of Lodz
11 Al. Politechniki St.
Abstract. Web-based mock e-exams have been held for a few years now. Thereis a number of differences between traditional and e-exams. The possibility ofusing multimedia in e-exams is one of them. In this article we will present a fewexamples of multimedia applications used to create tasks and we will explaintheir meaning.
Keywords: e-exam, multimedia.
Classification: R20.
1 Introduction
1.1 E-matura - First steps
Web-based mock e-exams have been held for a few years now. There is a number ofdifferences between traditional and e-exams. The possibility of using multimedia ine-exams is one of them. In this article we will present a few examples of multimediaapplications used to create tasks and we will explain their meaning.
1.2 E-matura - EU project
The e-matura project is another step leading towards the development of exteriorexams and e-evaluation. There are no such extensive solutions either in Europe orin the world. By means of this project we intend to show that first attempts ofits implementation could be realised in Poland as soon as in four years’ time. Thedecision will depend on the Minister of Education. The first step to implement thee-matura is possible at the so-called extra date of matura.
The e-matura project is a modern and innovative examination system on a coun-trywide scale, which helps to solve the remaining problems that have appeared whileconducting the exams. The system allows conducting matura exams in mathemat-ics along with the computers connected to the Internet. The course of the exam issimilar to a regular matura exam in which students sit for it at a fixed time in frontof the computers and simultaneously start taking it. When the students begin theexam, they get an access to the exam questions presented with the aid of multime-dia. When a student does not understand how to do a given task, he or she canmake use of context-based information ascribed to each question.
The target users of e-matura system will be final form students who will be ableto use the materials and exams attached to the system for the students to improvetheir knowledge and prepare them better for the state exam. The system has beenprepared to help those students from distant places where access to the Internetis limited (due to frequent connection loss, low bandwidth access) - by means of a’client group’ application. Thanks to that each student on the e-matura platformhas equal chances and takes the exam on the same principles regardless of where heor she comes from to take part in the project. Moreover, the system supports thedisabled students by adjusting the user’s interface to those who are blind.

118 Jacek Stando, Konrad Szumigaj
The exam tasks can be classified as the so-called closed and open-ended. Closed-ended tasks consist of distractors (samples of wrong answers) and one or a few bestresponses (correct answers). In open-ended tasks the students independently formand write down the answers. Closed-ended tasks are convenient to use when it comesto creating an automatic evaluation system, in case of scanning exam sheets withanswers as well as the systems of online exams.
The e-matura project is being made in a versatile way to serve exams in othersubjects such as physics or geography as well. The system may also be useful forboth teachers and students to facilitate the didactic process. Since the e-maturais an IT system which thanks to advanced algorithmes of marking questions canlargely simplify and support the teacher’s work so that the students will be able tosolve more tasks individually and check their chances at the same time without thenecessity that all the exam sheets should be marked by the teacher.
The teacher has also an access to the reports made automatically in the e-maturasystem and can watch the progress made by a particular student and check wherethe student has problems and must largely improve his or her knowledge. Theapplication facilitates an extended system of reporting. The system logs not onlythe standard result but also such data as how often the student entered certainquestions or how long it took him or her to solve a given question. Thanks to suchinformation the teachers as well as the people preparing the matura exam can adjustthe questions even better to make them clear-cut for the students.
The e-matura project is an innovative approach to the idea of examining studentson a large scale using the system based on the Internet. Using the project to conductthe matura exam involves certain requirements concerning dates and hours whensuch an exam takes place. In order to standardise the rules of exam-taking for allthe participants of the project, the system must enable a large number of studentsto sit for an exam simultaneously. The system has been designed by using dispersedinfrastructure in both the data base and the application available for the students.
The data base is a key element of the project which provides an access to thesecret questions and the place where the answers given by the students are stored(till the moment that the exam commences). The data base has been created with adatabase engine of Microsoft SQL Server 2008 R2. A special cluster has been madewhich consists of two physical database servers connected by means of SAN net tothe shared matrix based on hard discs with the SAS interface. The database servershave been physically separated from the Internet and are available only by meansof the application provided by the application servers. Using the cluster technologyenables high efficiency and safety - in case of a physical failure of one of the serverstakes over its function and provides services successfully so that the final user willnot even realise that there have been any technical problems. It is necessary thatthe database engine is highly effective since all the information about the user’sactivity during the exam is stored in the data base (the answers - even if the userchanges the answer, each answer given by him or her is separately registered for thefurther analysis, the timing of giving answers, how often he or she enters a particularquestion, the information about using technical text assistance etc.)
2349 students from the schools in the province of Lodz took part in testing theproject in April, 2011. Therefore it was possible to measure how overloaded thedata base was at the level of about 10-15% of the use of the equipment which was

The use of multimedia in the context of e-exams 119
purchased for the purposes of of this project. On the basis of the synthetic testsconducted by means of the servers which carried out controlled DDOS attacks ondatabase servers of the e-matura project it is concluded that the purchased equip-ment should be sufficient for about 25000-30000 matura students (as compared tothe number of first-time matura students in the province of Lodz which amountedto 22315), simultaneous users referring to the data base by means of the e-maturaapplication. Taking into account the results of synthetic test and the constantly im-plemented optimizations in the system the equipment especially purchased for thepurposes of the project should meet the demands of conducting the matura exam forall the matura students from the province of Lodz. In order to increase the numberof students, it will be necessary to make a bigger investment in purchasing moreequipment.
The e-matura application is a user’s interface which the students use to commu-nicate with the database by downloading the questions and answering them. Theapplication has been created on the basis of a ’fat client’ model by means of 4.0.Silverlight technology. Applying this kind of model enabled making a much saferapplication as well as highly increased convenience for the students to use the appli-cation in the exam. The application is used by the WWW search engine and from auser’s perspective it operates like a website. However, it is an application modelledon a ’fat client’, which means that the whole application is downloaded to a user’s lo-cal computer and works entirely independently. The user’s interface is as responsivefor the users connected to the Internet with the bandwidth as for those who havelower connections, which would be impossible to achieve using a standard WWWwebsite as the users with a lower connection would wait much longer to browse thesites with subsequent questions. The e-matura application eliminates this problemincreasing the equality of chances among all the users taking the exam. The ap-plication downloads all the questions at the very beginning and refers to the serveronly when answering a given question. Even if the Internet connection is broken fora moment, the user’s answers are saved in the hand memory of the application andwhen the connection with the server is regained the application sends all the datain the background without an influence on the user’s work.
The physical environment which is used to serve the e-matura application hasbeen created on the basis on four servers by using the Microsoft Windows 2008R2 software. 11S in 7.5 version is a server that serves the application for the finalusers and mediates in communication between the application and the databaseserver. Furthermore, there is another server that functions as a “load balancer”which receives all the entries of the users who start the application. This serverdirects the users’ questions to the server opening the application in a way to balancethe overloading among the four servers and as a result to maximize the efficiencyof serving data. Using the dispersed infrastructure improves the safety of using theapplication by means of securing against a failure of the equipment. In case of afailure of one of the servers, the questions sent to it are redirected to the remainingservers which automatically take over its role. The e-matura project has been createdin an innovative way to meet the demands made for matura exams in mathematics.The project is being made in a way to be the most versatile and applicable aftersome alterations for other subjects as well.

120 Jacek Stando, Konrad Szumigaj
1.3 E-matura in the context of traditional matura
The system of exterior exams has been used in Poland for more than ten years.The system of exterior exams used in Poland is based on traditional written examstaken by students in paper which are then marked equally traditionally by teachersexaminers. IT technologies are not used in these processes. This situation is farfrom young people’s expectations and interests - keen on computers and the Internet.Their sensitivity, aspirations and ambitions are centered on the virtual world.
The matura exam in mathematics tests the knowledge and skills defined in thestandards of exam requirements. The tested skills include:
• using and creating information,
• using and interpreting the representation,
• mathematical models,
• using and creating strategies
• undersatnding and giving argumentsThe exam sheets are prepared by the local exam committees. The Central Exam-
ination Committee chooses one of them. The matura exam in mathematics consistsof two parts: basic and extended.
The basic part of the exam is compulsory. It lasts 170 minutes. The exam tasksinclude the requirements for the basic level. The exam sheet for the basic levelconsists of three groups of tasks:
• Group 1 - consists of 20-30 closed-ended tasks. There are four answers to eachtask and only one of them is correct. Students receive 0-1 points for each task,Figure 1.
Figure 1: Sample task for group 1, source: CEC
The student marks the answer on the answer sheet.
• Group 2 - consists of 5-10 short answer open-ended tasks scored 0-2 for eachquestion, Figure 2.
Figure 2: Sample task for group 2, source: CEC
• Group 3 - consists of 3-5 extended answer open-ended tasks scored 0-5 (de-pending on the type of the task), Figure 3.

The use of multimedia in the context of e-exams 121
Figure 3: Sample task for group 3, source: CEC
The student can score 50 points at the maximum for solving all the tasks.The extended matura exam in mathematics last 180 minutes. It consists of about
12 open-ended tasks. The tasks concern mathematical problems, Figure 4.
Figure 4: Sample task for the extended part, source: CEC
Evaluation:Open-ended tasks are marked and evaluated by the examiners are maths teachers
and those who completed courses for examiners and hold a certificate issued by theHead of the Central Examination Committee. Students mark the answers to theclosed-ended tasks on a special answer sheet. The solutions to the open-ended tasksare marked on the basis of detailed criteria of evaluation and unified throughout thecountry.
The answer sheet is detached from the the exam paper and inserted into a specialreader.
At present the most modern trend of examining is mainly to replace the paperform for an electric one. These changes pose new challenges for example the possi-bility of multimedia to create tasks. Sample tasks with the aid of multimedia willbe presented in the next chapter.
The Central Examination Committee began the realisation of the E-evaluationproject in 2007. The basic difference between traditional evaluation and e-evaluationis that the examiners do not receive the exam papers to mark in paper but in theform of a picture. The system of e-evaluationhas been introduced in many countrieslike Great Britain and the USA. The research done on e-evaluation has shown manyof its advantages. The next step to develop examining and evaluating in Poland willbecome e-exams.
2 Multimedia-based task construction
Sample tasks:Task 1. The value of the rhomboid surface:A. increasingB. decreasing

122 Jacek Stando, Konrad Szumigaj
C. constantD. undefined
The description of the animation: the rhomboid moves without changing thelengths of the parallel sides. The length of the height does not change either.
Task 31. (category 1) the surface of the rhomboid is:A. increasingB. decreasingC. constantD. undefined
Figure 5
Task 2: the angle of vertex CA. increasingB. decreasingC. constantD. undefinedThe description of the animation: point C moves around the circle, see figure 6.
Task 3. There is a triangle ABC. The surface of the trangle:A. increasingB. decreasingC. constantD. undefined
The description of the animation: point C moves along a straight line which isparallel to the line with points A and B.
Task 4. There are four subsequent figures in figure 4. Find out how new figures are

The use of multimedia in the context of e-exams 123
Figure 6
Figure 7
created and draw the tenth one. Fill in the formulas on the appropriate surfaces.Description: the student can draw segments. The systems checks the accuracy
of the drawn segments.Task 9. In the figure there are six subsequent figures. Find out how new figures arecreated and answer the questions. Pn stands for the surface area of the n-th figure(n = 1, 2, 3 . . .).Define the formula.Define the difference.Finish drawing Figure 10.
3 Conclusion
Target replacement of exams with e-exams should increase the students’ interestin education at the same time e-exams will contribute to creating an IT-orientedsociety. One may expect that students’ psychological barrier towards IT education

124 Jacek Stando, Konrad Szumigaj
Figure 8
will lessen thanks to e-exams, which should increase the number of students atTechnical Universities. The e-matura in mathematics is a pioneer project. Usingmultimedia to construct tasks creates new areas for scientific research. Multimediamay become a key element of modern exams and evaluation.
References
[1] Stando J.: First electronic examination for mathematics and sciences held inPoland - exercises and evaluation system, Proceedings, Part II. Communica-tions in Computer and Information Science 167, Springer 2011, ISBN 978-3-642-22026-5
[2] Stando J.: E-mature – report of an electronic mathematics exam, Proceedings,Part II. Communications in Computer and Information, Science Springer 2011.
[3] Stando J.: E-matura 2009 - Ocenianie zadan otwartych z matematyki, Edukacjanr 2, 2010 r.
[4] Stando J. Szumigaj K.: New possibilities in mathematics evaluation tasks inthe context of e-exams, Odborova didaktika - interdisciplinarny dialog, JanGuncaga - Branislav Niznansky, Ruzomberok 2011.

Scientific Issues, Teaching Mathematics III: Innovation, New Trends, Research. Ruzomberok 2012
Attitudes of pupils and teachers as important
factor for mathematics education
Peter Vankus, Emılia Kubicova
Faculty of Mathematics, Physics and Informatics Comenius University Bratislava
Mlynska dolina SK 842 48 Bratislava
Abstract. The paper deals with pupils’ attitudes towards mathematics, theirstructure and changes between the fifth and the ninth grade of primary school.We discuss statistically significant factors influencing the attitudes towardsmathematics and the impact on the education. Important factor is the teacherand the teaching learning styles. Therefore, in the paper we discuss also teachers’attitudes and their influence on the education.
Keywords: mathematics education, attitudes towards mathematics, emotion,beliefs.
Classification: C20; C70.
1 Introduction
The importance of the pupils’ attitudes towards mathematics is supported by theopinion, believed to be true in scientific and teacher communities which states thatpupils learn more effectively and they are more interested in the mathematics lessonand are performing better if they have positive attitudes towards mathematics (Ma& Kishor, 1997).
In this paper we deal with the result of the questionnaire survey on pupils atti-tudes towards mathematics performed in Slovakia. Used questionnaire was createdduring the study on the structure of pupils’ attitudes system (De Corte & Op’tEynde, 2002). In the later experiments the questionnaire was modified to find outthe compatibility of its use in various European states, in concrete in England, Spainand Slovakia (Andrews et all, 2007; Andrews et all, 2008). The research was donein three phases in Slovakia.
2007 76 pupils in the 5thclass (9-11 years old)and 128 pupils in the9th class (15-16)
The aim was to create version of questionnairecompatible with questionnaires in England andin Spain and to investigate development of pupils’mathematics attitudes during school education.
2008 241 pupils in the 9thclass (14-16)
The aim was to improve the questionnaire.
2009 746 pupils in the 8thclass (13-15)
The research was focused on the links betweenvarious aspects of pupils’ attitudes.
The results of researches in Slovakia were already partially published (Andrewset all, 2007, 2008; Vankus & Kubicova, 2010). In this paper we report more closelyon the part of the results from the survey carried out in 2007 on a sample of 204Slovak pupils, 76 in the 5th year (9-11 years old) and 128 pupils in the 9th year ofthe primary school (14-16 years old).

126 Peter Vankus, Emılia Kubicova
2 Questionnaire survey of pupils’ mathematics attitudes
The survey was performed at the primary school Alexandra Dubeka in Bratislava.The first page of questionnaire gave information about questionnaire and its goals.It also included items about pupils’ sex and age. The other items of questionnairewere Likert type, with six possibilities Agree Strongly (1), Agree (2), Agree Slightly(3), Disagree Slightly (4), Disagree (5), Disagree Strongly (6). Questionnaire had 60items those were created to investigate following areas:
• Positive or negative attitudes: Attitudes towards mathematics as school sub-ject and its teaching and self-evaluation of mathematics abilities.
• Passive learning or active learning: This area was studying pupils’ beliefs onthe nature of school mathematics.
• Teacher’s influences on pupils’ attitudes.
Distribution of items in the areas shows Table 1.
Table 1: Distribution of questionnaire items
Attitudes towards mathematics as school subject and its teaching and
self-evaluation of mathematics abilities
3. Everyone can learn mathematics.4. Mathematics enables us to better understand the world we live in.7. Mathematics is used all the time in people’s daily life.8. I can use what I learn in mathematics in other subjects.9. I think I will do well in mathematics this year.10. By doing the best I can in mathematics I try to show my teacherthat I’m better than other students.11. I like doing mathematics.12. I expect to do well on the mathematics tests and assessments we do.13. I try hard in mathematics to show the teacher and my fellow studentshow good I am.14. I understand everything we have done in mathematics this year.15. I think mathematics is an important subject.
Positive 17. I can understand even the most difficult topics taught me in mathe-matics.20. Im very interested in mathematics.25. I don’t have to try too hard to understand mathematics.26. I can usually do mathematics problems that take a long time tocomplete.27. I find I can do hard mathematics problems with patience.33. I study mathematics because I know how useful it is.34. Knowing mathematics will help me earn a living.35. Mathematics is a worthwhile and necessary subject.39. I think that what I am learning in this class is useful for me to know.40. I like what I am learning in this class.41. I think that what I am learning in this class is interesting.43. I am certain I can learn how to solve the most difficult mathematicsproblem.44. Compared with others in the class, I think I’m good at mathematics.

Attitudes of pupils and teachers as important factor for mathematics education 127
18. My only interest in mathematics is getting a good grade.21. If I cannot do a mathematics problem in a few minutes, I probablycannot do it at all.22. If I cannot solve a mathematics problem quickly, I quit trying.
Negative 23. Only very intelligent students can understand mathematics.24. Ordinary students cannot understand mathematics, but only mem-orise the rules they learn.36. Mathematics has no relevance to my life.37. Studying mathematics is a waste of time.
Pupils’ beliefs on the nature of school mathematics
1. Mathematics learning is mainly about having a good memory.2. It’s a waste of time when our teacher makes us think on our own.
Passive
learning
6. There is only one way to find the correct solution to a mathematicsproblem.29. Getting the right answer is more important than understanding whythe answer works.38. Only the mathematics to be tested is worth learning.
5. Everybody has to think hard to solve a mathematics problem.16. I prefer mathematics when I have to work hard to find a solution.19. If I try hard enough I understand the mathematics we are taught.
Active 28. Routine exercises are very important in the learning of mathematics.learning 30. Time used to understand why a solution works is time well spent.
31. Discussing different solutions to a mathematics problem is a goodway of learning mathematics.32. I think it is important to learn different strategies for solving thesame problem.42. I prefer class work that is challenging so I can learn new things.
Teacher’s influences on pupils’ attitudes
45. My teacher thinks mistakes are okay as long as we are learning fromthem.46. My teacher explains why mathematics is important.47. My teacher always shows us, step by step, how to solve a problem,before giving us exercises.48. My teacher really wants us to enjoy learning new things.49. My teacher understands our problems and difficulties with mathe-matics.
Positive 50. My teacher listens carefully to what we say.51. We do a lot of group work in this mathematics class.52. My teacher always gives us time to explore new problems and tryout different solution strategies.53. My teacher appreciates it when we try hard, even if our results arenot so good.54. My teacher is friendly to us.55. My teacher tries to make the mathematics lessons interesting.57. My teacher wants us to understand the content of this mathematicscourse.

128 Peter Vankus, Emılia Kubicova
56. My teacher thinks she/he knows everything best.Negative 58. My teacher wants us just to memorise the content of this mathemat-
ics course.59. My teacher does not really care how we feel in class.60. My teacher is too absorbed in mathematics to notice us.
The results of the survey (average score in the items) are shown in the followingfigures. The lower values show more strong agreement with item. In the area ofpositive or negative attitudes towards mathematics as school subject and its teachingand self-evaluation of mathematics abilities were included 24 items.
Figure 1: Positive attitudes and self-beliefs of 5th and 9th grade pupils
Items:1. Everyone can learn mathematics.
2. Mathematics enables us to better understand the world we live in.
3. Mathematics is used all the time in people’s daily life.
4. I can use what I learn in mathematics in other subjects.
5. I think I will do well in mathematics this year.
6. By doing the best I can in mathematics I try to show my teacher that I’mbetter than other students.
7. I like doing mathematics.
8. I expect to do well on the mathematics tests and assessments we do.
9. I try hard in mathematics to show the teacher and my fellow students howgood I am.
10. I understand everything we have done in mathematics this year.
11. I think mathematics is an important subject.
12. I can understand even the most difficult topics taught me in mathematics.

Attitudes of pupils and teachers as important factor for mathematics education 129
13. I’m very interested in mathematics.
14. I don’t have to try too hard to understand mathematics.
15. I can usually do mathematics problems that take a long time to complete.
16. I find I can do hard mathematics problems with patience.
17. I study mathematics because I know how useful it is.
18. Knowing mathematics will help me earn a living.
19. Mathematics is a worthwhile and necessary subject.
20. I think that what I am learning in this class is useful for me to know.
21. I like what I am learning in this class.
22. I think that what I am learning in this class is interesting.
23. I am certain I can learn how to solve the most difficult mathematics problem.
24. Compared with others in the class, I think I’m good at mathematics.
The items of this figure we can further divide to more detail specific areas. Theitems 1, 7, 13, 21 and 22 inform us about the positive attitudes of pupils towardsmathematics and the mathematics knowledge in that year of study. From the averagevalues of answers for the 9th grade we can see that they have much worse attitudestowards mathematics as the 5th grade. It could be influenced by the fact that forthe 9th grade students is mathematics usually more abstract and for some pupilstherefore less interesting. The items 2, 3, 4, 11, 17, 18, 19 and 20 are about awarenessof importance of mathematics. From the Figure 1 we can see that both the 5thgrade and the 9th grade pupils are aware about importance of mathematics. The9th grade is probably also influenced by the fact that mathematics is needed fortheir further mathematics education at the high school. The positive self-beliefsare checked by items 5, 8, 10, 12, 14, 15, 16, 23 and 24. In those the 5th gradestudents showed positive mathematics self-beliefs. Pupils of the 9th grade were totheir mathematics abilities more critical. In the items 6 and 9 we can see influence ofthe outer motivational impetus. This is more significant for the 5th grade students.This is due to the pupil’s development and its different level between the 5th gradeand the 9th grade pupils. Teacher as person that pupils want to be in favour ofthem is more important for the 5th grade as for the 9th grade pupils.
Items:
1. My only interest in mathematics is getting a good grade.
2. If I cannot do a mathematics problem in a few minutes, I probably cannot doit at all.
3. If I cannot solve a mathematics problem quickly, I quit trying.
4. Only very intelligent students can understand mathematics.
5. Ordinary students cannot understand mathematics, but only memorise therules they learn.
6. Mathematics has no relevance to my life.
7. Studying mathematics is a waste of time.

130 Peter Vankus, Emılia Kubicova
Figure 2: Negative pupils’ attitudes and self-beliefs
Negative attitudes and self-beliefs appeared more at the 9th grade students. The5th grade students have stronger link between grades and interest in mathematics.In the area passive learning we have 5 items in the questionnaire. Comparison ofthe results of the 5th grade students and the 9th grade students is in the Figure 3.
Figure 3: Passive learning of the 5th grade and 9th grade students
Items:
1. Mathematics learning is mainly about having a good memory.
2. It’s a waste of time when our teacher makes us think on our own.
3. There is only one way to find the correct solution to a mathematics problem.
4. Getting the right answer is more important than understanding why the answerworks.
5. Only the mathematics to be tested is worth learning.

Attitudes of pupils and teachers as important factor for mathematics education 131
From the figure we can see that both grades students know that mathematicsis not about passive learning of information. Also we can see that the 5th gradestudents agree more with opinion that learning mathematics is more about havinggood memory, which is connected with their cognitive development. So the 9th gradestudents have better knowing that mathematics is supposed to improve thinking andthat is important to understand the taught stuff. Opposite to passive learning is areaof active learning, comparison of the 5th grade students and the 9th grade studentsis in the Figure 4.
Figure 4: Active learning
Items:1. Everybody has to think hard to solve a mathematics problem.
2. I prefer mathematics when I have to work hard to find a solution.
3. If I try hard enough I understand the mathematics we are taught.
4. Routine exercises are very important in the learning of mathematics.
5. Time used to understand why a solution works is time well spent.
6. Discussing different solutions to a mathematics problem is a good way of learn-ing mathematics.
7. I think it is important to learn different strategies for solving the same problem.
8. I prefer class work that is challenging so I can learn new things.
The Figure 4 shows that the 5th grade students have bigger inclination towardsactive learning than the 9th grade students. The 9th grade students have less interestin solving more difficult tasks. In the next area we investigate influence of teacheron the pupils’ attitudes.
Items:1. My teacher thinks mistakes are okay as long as we are learning from them.
2. My teacher explains why mathematics is important.
3. My teacher always shows us, step by step, how to solve a problem, beforegiving us exercises.

132 Peter Vankus, Emılia Kubicova
Figure 5: Positive influence of the teacher on pupils’ attitudes
4. My teacher really wants us to enjoy learning new things.
5. My teacher understands our problems and difficulties with mathematics.
6. My teacher listens carefully to what we say.
7. We do a lot of group work in this mathematics class.
8. My teacher always gives us time to explore new problems and try out differentsolution strategies.
9. My teacher appreciates it when we try hard, even if our results are not so good.
10. My teacher is friendly to us.
11. My teacher tries to make the mathematics lessons interesting.
12. My teacher wants us to understand the content of this mathematics course.
Positive influences of the teacher are more felt by the 5th grade students. Theyhave more feeling that teacher is friendly, kind and that he/she wants to make thelessons pleasant for them. The 9th grade students have more feelings of not beingunderstood by the teacher that is connected with their psychological state in thepubescent.
Items:1. My teacher thinks she/he knows everything best.
2. My teacher wants us just to memorise the content of this mathematics course.
3. My teacher does not really care how we feel in class.
4. My teacher is too absorbed in mathematics to notice us.
From the Figure 6 we can derive that pupils do not think that teachers ignoresthem. Although, the 9th grade students have more strong feeling that teachers is notpaying attention to their feelings on the mathematics lessons. Differences betweenperception of the 5th grade and 9th grade students are probably due to the teacher’sdifferent behaviour towards the different grade students.

Attitudes of pupils and teachers as important factor for mathematics education 133
Figure 6: Negative influence of the teacher on pupils
3 Discussion
The questionnaire shows that the 5th grade students in the research sample havemore positive attitudes towards mathematics than the 9th grade students. Boththe 5th and the 9th grade students realize that mathematics is useful subject. The9th grade students are more critical towards their mathematics abilities. The 5thgrade students are more motivated for studying mathematics by the grades and theevaluation from their peers and teacher. The extrinsic motivation has less influenceon the 9th grade students. Both grade students know that mathematics is notabout passive acceptation of the knowledge. The 5th grade students show moreactivity when solving mathematical problems and they have stronger need to findmore ways of solving the problems and they take the activity in class as greaterchallenge. The 5th grade students feel the positive approach of the teacher morethan the 9th grade students that can be connected with biological and psychologicalstate of development of the 9th grade students. They are more critical towardsteacher and they have stronger feelings of misunderstanding from the teacher.
4 Conclusion
The paper is discussing comparison of the attitudes towards mathematics of the5th grade students (911 years old) and 9th grade students (1416 years old). Thequestionnaire survey was carried out in 2007 on the sample of 204 Slovak pupils, 76in the 5th grade and 128 pupils in the 9th grade. In generally we can say that thequestionnaire shows that the 5th grade students in the research sample have morepositive attitudes towards mathematics than the 9th grade students. They havemore positive self-beliefs in their mathematics knowledge and they feel more posi-tive influences from the mathematics teacher. This can be connected with differentapproach of teacher towards 9th grade students, different style of their teaching andalso with different biological and psychological state of development of the 5th gradeand 9th grade students.These results are in the coherence with previous studies of this subject those havefound that the attitudes towards mathematics are often getting worse during theschool attendance (Ma & Kishor, 1997). The inadequate difficult tasks, too fast pace

134 Peter Vankus, Emılia Kubicova
of learning and negative influences of teacher have bad impact on pupils’ mathemat-ics attitudes and their development during school attendance (Philippou a Christou,1998). Those school years are very important for the forming of the mathematicsattitudes therefore is the teachers’ responsibility to positively influence the mathe-matics attitudes of the pupils (Ma & Kishor, 1997).
References
[1] Andrews, P., Diego-Mantecon, J., Op’t Eynde, P., Sayers, J.: Evaluating thesensitivity of the refined mathematics-related beliefs questionnaire to nationality,gender and age, In:European Research in Mathematics Education: Proceedingsof the Fifth Congress of the European Society for Research in MathematicsEducation, University of Cyprus, Larnaca , s. 209-218, 2007, ISBN 978-9963-671-25-0
[2] Andrews, P., Diego-Mantecon, J., Op’t Eynde, P., Sayers, J.: A tanu-lok matematikai meggyozodeseinek ertekelese: Egy harom orszagot erintoosszahasonlıto viszgalat, (Construct consistency in the assessment of stu-dents’ mathematics-related beliefs: A three-way cross-sectional pilot comparativestudy). Iskolakultra Online, 2008(2), s. 141-159, 2008, ISSN 1789-5170
[3] Daskalogianni, K. & Simpson, A.: Towards a definition of attitude: The rela-tionship between the affective and the cognitive in pre-university students, Pro-ceedings of PME 24, vol.2, s. 217-224, Hiroshima, 2000, ISSN-0771-100X
[4] De Corte, E., & Op’t Eynde, P.: Unraveling students’ belief systems relating tomathematics learning and problem solving, In: A. Rogerson (Ed.), Proceedingsof the International Conference “The Humanistic renaissamce in mathematicseducation”, s. 96-101, Palermo, The Mathematics Education into the 21st Cen-tury Project, 2002
[5] Hannula, M. S.: Structure and dynamics of affects in mathematical thinkingand learning, CERME 7, Rzesow, 31.3.2011 online http://helsinki.academia.edu/MarkkuHannula/Talks/34636/Structure and dynamics of affect in mathematical thinking and learning
[6] Hart, L.: Describing the Affective Domain: Saying What We Mean, In: McLeod & Adams (Eds.), Affect and Mathematical Problem Solving, s. 37-45, NewYork, Springer Verlag, 1989, ISBN 978-0387-969-24-4
[7] Kadijevich, D.: Developing trustworthy TIMSS background measures: A casestudy on mathematics attitude, Teaching of Mathematics, 9 (2), s. 41-51, 2006,ISSN 1451-4966
[8] Ma X. & Kishor N.: Assessing the Relationship Between Attitude TowardMathematics and Achievement in Mathematics: A Meta-Analysis, Journal forResearch in Mathematics Education, 28 (1), 26-47, 1997, ISSN 0021-8251
[9] McLeod, D.: Research on affect in mathematics education: a reconceptualiza-tion, In: D.Grows, (Ed.), Handbook of Research on Mathematics Teaching andLearning, s. 575-596, New York, McMillan Publishing Company, 1992, ISBN0-02-922381-4
[10] Philippou, N. G. & Christou, C.: The Effects of a Preparatory Mathema-tics Program in Changing Prospective Teachers Attitudes towards Mathematics,Educational Studies in Mathematics, 35, 189-206, 1998, ISSN 0013-1954
[11] Ruffell, M., Mason, J., Allen, B.: Studying attitude to mathematics, EducationalStudies in Mathematics, 35, 1-18, 1998, ISSN 0013-1954

Attitudes of pupils and teachers as important factor for mathematics education 135
[12] Vankus, P., Kubicova, E.: Postoje ziakov 5. a 9. rocnıka ZS k matematike, In:Acta Mathematica, Vol. 13., Univerzita Konstantına Filozofa, Nitra, 277-282,2010, ISBN 978-80-8094-781-1
[13] Zan, R., Di Martino, P.: Attitude toward mathematics: Overcoming the posi-tive/negative dichotomy, The Montana Mathematics Enthusiast, Monofigure3, s. 157-168, The Montana Council of Teachers of Mathematics, 2007, ISSN1551-3440
