teaching for growth - the university of western...
TRANSCRIPT

William LoudenMary RohlSarah Hopkins
Graduate School of EducationThe University of Western Australia

William LoudenMary RohlSarah Hopkins
Teaching for Growth
E! ective teaching of literacy and numeracy
Teaching for Growth was funded by the Department of Education and Training, Western Australia.
Published by:
The Graduate School of Education
The University of Western Australia
35 Stirling Highway
WA 6009
Website: http://www.education.uwa.edu.au
© Department of Education and Training, Western Australia, 2008
Reproduction of this work in whole or part for educational purposes, within an educational institution and on condition that it is not o! ered for sale, is permitted by the Department of Education and Training, subject to the inclusion of an acknowledgment of the source.
The views expressed here are those of the authors and do not necessarily represent the views of the Department of Education and Training, Western Australia
Printed in Australia by Wren Press
Teaching for Growth: E! ective Teaching of Literacy and Numeracy
ISBN: 978-1-74052-158-1
First Published 2008
i
ContentsList of tables iii
List of fi gures iv
Acknowledgments v
Executive summary vi
1. Literacy Phase 1: assessment 2
1.1 Context 2
1.2 Aims 3
1.3 Methodology 3
1.4 Findings about student growth in literacy 5
1.5 Comparison with a national sample 12
1.6 Student literacy growth and teacher e! ectiveness 17
1.7 Summary 19
2. Literacy Phase 2: classroom observation - quantitative analysis 19
2.1 Aims 19
2.2 Methodology 19
2.3 Quantitative fi ndings from the ClOS-R observational data 23
2.4 Summary 29
3. Literacy Phase 3: classroom observation - qualitative analysis 30
3.1 Aims 30
3.2 Methodology 30
3.3 Pair-wise comparisons of literacy teaching practices 30
3.4 Pair-wise fi ndings about selected ClOS-R practices and teacher e! ectiveness 33
Oral language 33
Explanation word 38
Explanation sentence 43
Explanation text 47
Oral-written language 51
Metalanguage 55
3.5 E! ective teaching of early years literacy 60
4. Numeracy Phase 1: development of the classroom observation instrument 64
4.1 Introduction 64
4.2 Background 64
4.3 Phase 1: developing the ToMOS 66
4.4 Item selection, recording and scoring the ToMOS 70
5. Numeracy Phase 2: estimating year 8 student achievement gains 71
5.1 Methodology 71
5.2 Results 74
ii
6. Numeracy Phase 3: pilot testing the ToMOS 78
6.1 Method 78
6.2 Results 78
6.3 Discussion 84
7. Overview and Implications 86
7.1 Growth in literacy in Pre-primary and Year 1 86
Literacy teaching issues arising from the study 88
7.2 Growth in numeracy in Year 8 91
Numeracy teaching issues arising from the study 92
References 94
Appendices 98
Appendix 1 98
Appendix 2 105
Appendix 3 106
Appendix 4 114
Appendix 5 117

iii
List of tablesTable 1. General characteristics of the children who took part in the study 3
Table 2. Item descriptors and codes for Pre-primary LLANS Term 1 7
Table 3. Percentages of Pre-primary children scoring correct responses on a sample of literacy items in Term 1 8
Table 4. Percentages of Pre-primary children scoring correct responses to a sample of literacy items in Term 4 9
Table 5. Percentages of Year 1 children scoring correct responses to a sample of literacy items in Term 1 11
Table 6. Percentages of Year 1 children scoring correct responses to a sample of items in Term 4 12
Table 7. Mean ages of the children in the TFG and LLANS samples 12
Table 8. Means and standard deviations for the two samples of children 14
Table 9. Mean di! erences in performance between the TFG and LLANS 15
Table 10. Growth from Term 1 to Term 4: paired t-tests within groups 15
Table 11. Details of teachers who took part in the observation phase of the study 20
Table 12. Classroom Literacy Observation Schedule-revised (Louden & Rohl, 2008) 21
Table 13. Means and standard deviations for CLOS-R scores by teacher group 23
Table 14. Item locations and fi t statistics from the RUMM analysis of CLOS-R data 25
Table 15. Frequency for each teacher across the 10 coded episodes for the practices selected for pair-wise analysis 31
Table 16. Numbers of examples (items) and comparisons for pair-wise analysis 31
Table 17. Pair-wise data collection format 32
Table 18. Conventions used in the transcripts 33
Table 19. Participants in the ten large-scale studies 67
Table 20. Teaching actions in the ToMOS 71
Table 21. Summary of survey data for teacher participants 72
Table 22. An example of each type of question on the Year 8 numeracy assessment 73
Table 23. Numeracy achievement scores (WAMSES) 74
Table 24. Results from the two-level variance components model fi tted to explain Year 8 WAMSE numeracy scores 75
Table 25. Highly e! ective classes 76
Table 26. Less than e! ective classes 76
Table 27. Residuals for highly e! ective classes and other classes taught by the same teacher 77
Table 28. Residuals for less than e! ective classes and other classes taught by the same teacher 77
Table 29. Pilot test results 83
Table 30. Summary of pilot test results 83
iv
List of fi guresFigure 1. Pre-primary literacy item map for Term 1 6
Figure 2. Literacy scale description and achievement distributions: Pre-primary 10
Figure 3. Literacy scale description and achievement distributions: Year 1 13
Figure 4. Literacy growth of TFG and LLANS samples 14
Figure 5. Plot of Term 4 item di" culties for the TFG Pre-primary sample against the item di" culties for the LLANS sample 16
Figure 6. Ranked class-level residuals with associated 95% confi dence intervals: Pre-primary 18
Figure 7. Ranked class-level residuals with associated 95% confi dence intervals: Year 1 18
Figure 8. Working window of the artichoke input program (Fetherston, 2007) 22
Figure 9. Linear regression between CLOS-R measurements and hierarchical modelling standardised residuals 24
Figure 10. Item map showing locations of teachers and CLOS-R teaching practices 27
Figure 11. Example of probabilities of demonstrating particular practices for the individual teacher 1EF6 28
Figure 12. Layout of a working window of the artichoke pair-wise program 32
Figure 13. Oral language: item map showing locations of teachers’ examples 34
Figure 14. Explanation word: item map showing locations of teachers’ examples 39
Figure 15. Explanation sentence: item map showing locations for teachers’ examples 44
Figure 16. Explanation text: item map showing locations of teachers’ examples 48
Figure 17. Oral written language: Item map showing locations for teachers’ examples 52
Figure 18. Metalanguage: item map showing locations for teachers’ examples of 56
Figure 19. The adjusted residual calculated for each Year 8 classroom 75

v
AcknowledgmentsThe research underpinning Teaching for Growth was made possible by the generous participation of teachers, schools, children, DET colleagues and families across Western Australia. More than four thousand children in over 150 schools completed the project assessments and their teachers completed questionnaire surveys. Nineteen early years teachers and nine Year 8 mathematics teachers took the risk of welcoming the researchers and their cameras into their classrooms. We thank them for their commitment, interest and collegiality. This research project could not have been undertaken without the generous support of the Western Australian Department of Education and Training education community.
The team working on the project involved researchers from The University of Western Australia and Edith Cowan University. Mary Rohl and Pat Forster worked on the literature reviews that supported the study. Mary Rohl, Claire Brown, Libby Renton and Kellie Picker further developed the Classroom Literacy Observation Schedule (CLOS, now CLOS-R) and developed the associated manual for use in the classroom observations. Hilary Hollingsworth and Sarah Hopkins developed the Teaching of Mathematics Observation
Schedule (ToMOS). Mary Rohl, Sarah Hopkins, Hilary Hollingsworth, Kellie Picker, Libby Renton and Jessica Elderfi eld undertook classroom site visits across Western Australia. Jessica Elderfi eld also coordinated the literacy and numeracy assessment analysis. Steve Humphry and Sandy Heldsinger from the Graduate School of Education at UWA gave great support to the research team in both qualitative and quantitative analysis. Hilary Hollingsworth provided ongoing support and advice in fi nalizing the reporting of the fi ndings for the mathematics phase of the project.
Jocelyn Cook and Brian Young, Standards and Moderation at the Department of Education and Training initiated and developed the Year 8 assessment used in the study. Julia Masney orchestrated the invigilators and the schools for the mathematics assessments in 2005. ACER colleagues Siek Toon Khoo and Marion Meiers provided assessment and detailed statistical advice throughout the life of the project.
Kellie Picker and Libby Renton spent many months preparing videos and analysing the data. Their commitment, enthusiasm and constant good humour were essential ingredients to the completion of the project. Tony Fetherston from Edith Cowan University further developed his Artichoke software program to cater for the specifi c analysis needs of this project. His technical expertise, collegiality and ‘on the ground’ support was vital to the research team. Helen House managed the project, as always, with quiet e" ciency, patience and charm.
Our colleagues at Wren Design provided design, pre-press and technical expertise for the development of the report and the attached DVDs. Their dedication and focus to the development of a quality product was a welcome support in the fi nal stage of the project.
David Axworthy, Pam Moss , Gordon Murdoch, Rosemary Cahill and Majella Stevens from the Department of Education and Training provided sound advice and support during the life of the project. We thank them all for their interest, hard work and support.
Bill Louden and Mary Rohl, Project Directors, May, 2008
vi
E X E C U T I V E S U M M A R Y
Teaching for Growth explored the relationship between children’s growth in literacy and numeracy and teachers’ classroom teaching practices. It comprised two related studies: a study of teachers’ practices and children’s growth in literacy in Pre-primary and Year 1; and a study of teachers’ practices and children’s growth in numeracy in Year 8.
S T U D Y 1 : G R O W T H I N L I T E R A C Y I NP R E - P R I M A R Y A N D Y E A R 1
Analysis of the literacy assessments conducted at the beginning and end of Pre-primary and Year 1 revealed that:
• In Pre-primary, there was relatively little growth overall, particularly at the lower end of the achievement distribution, and a large amount of growth at the higher end.
• In Year 1, large amounts of growth were observed for all children, including low-performing children.
• Compared with a national sample of children in government schools assessed when they were approximately the same age with the same instrument in 1999, Western Australian children’s performance was signifi cantly lower. The gaps in performance were smaller at the end of Year 1 than they were at the beginning and end of Pre-primary and at the beginning of Year 1, but they were signifi cantly lower at each assessment point.
• Average growth in Year 1 was approximately two and a half times greater than average growth in Pre-primary for WA children; average growth in the 1999 national sample was relatively similar in the Pre-primary year and Year 1.
• Western Australian Pre-primary children found all assessment items, particularly those concerning sight words, more di" cult than children in the 1999 national Longitudinal Literacy and Numeracy Study (LLANS) sample.
Value-added estimates of growth in literacy were calculated for each of the class groups, after accounting for the impact of prior performance, disability, interruption to learning, relative attentiveness and Aboriginal or Torres Strait Islander status. On the basis of this analysis, teachers in these classes were allocated to one of three groups: teachers of classes that had achieved signifi cantly higher growth than expected (‘more e! ective’), teachers whose classes had achieved as much growth as expected (‘e! ective’), and teachers whose classes had achieved signifi cantly less growth than expected (‘less e! ective’).
Teachers from each of these groups were then observed teaching. The Classroom Literacy Observation Schedule -Revised (CLOS-R) was adapted from Louden & Rohl (2003) for this study. CLOS-R contains 27 teaching practices in 5 dimensions that previous research has related to e! ective teaching and this scale was used to analyse teachers’ practice. Analysis of the observation data revealed that:
• After taking into account prior performance and other predictors of success, teaching practices as measured by CLOS-R explained the majority of the remaining variance in student growth scores.
• There was a strong, and approximately linear, relationship between CLOS-R scores and LLANS value-added residual scores. That is, the higher the children’s growth in literacy, the more likely teachers were to have demonstrated more of the CLOS-R teaching practices more often.
Qualitative di! erences in CLOS-R scores from the ‘knowledge’ dimension were also investigated using pair-wise analysis. This involved asking experts to compare pairs of items and judge which was the better. Analysis of these data demonstrated that in the classes of more e! ective literacy teachers:
• There was a stronger focus on the development of oral language.
• There was a more systematic focus on explicit teaching of phonological awareness and phonics.
• Explanations at the syntactic (sentence) level were more frequent.
• Text-level discussions were more likely to involve higher-order thinking.
• Clear and substantive connections were more likely to be made between oral and written language.
• A wide variety of technical literacy-related vocabulary was more likely to be used.
• These teaching practices from the ‘knowledge’ dimension of CLOS-R were accompanied in the more e! ective teachers’ classrooms by high levels of teaching practices from the other four CLOS-R dimensions, of ‘respect’, ‘orchestration’, ‘support’ and ‘di! erentiation’. They were usually connected to a class theme or unit of work.
S T U D Y 2 : G R O W T H I N N U M E R A C Y I N Y E A R 8
The two year period between state-wide testing in numeracy achievement means that little can be inferred about the individual contribution a teacher makes to student learning based on di! erences in student performance over a single year. A similar statistical procedure used for estimating achievement gains in literacy (Study 1) was applied in Study 2 to estimate achievement gains in numeracy over a single year.
Numeracy achievement scores were collected for 2,864 students (132 classes) late in Year 8, using a modifi ed WALNA numeracy test, and were matched with achievement scores from the Year 7 WALNA test results. Value added statistical procedures (similar to those used in Study 1) were applied to estimate students’ achievement gains in numeracy, taking into account prior performance and student intake variables.

vii
The results of the value added analysis were used to identify levels of e! ective teaching rather than levels of e! ective teachers. The distinction is an important one given the di! erent context in Study 2, a secondary school setting. Many participating teachers were teaching more than one Year 8 maths class and the fi ndings revealed considerable variance in estimates of student achievement gains between di! erent classes of students taught by the same teacher. It was therefore more appropriate to use the term e! ective classes, or to suggest that students had benefi tted from e! ective teaching, rather than suggest classes were taught by e! ective teachers.
The fi ndings from the value added analysis showed that:
• All eleven of the highly e! ective classes were located in metropolitan schools, eight were in schools with SEI scores greater than 100, and ten classes had a Year 7 class mean above the grand mean for the study cohort.
• Three of the nine less than e! ective classes were in rural schools, only one was in a school with an SEI greater than 100 and none of the classes had a Year 7 class mean above the grand mean for the study cohort.
A subset of teachers was then approached to participate in the classroom observation phase of the study. A new instrument, the Teaching of Mathematics Observation Schedule (ToMOS) was developed for this purpose and pilot tested. The results indicated that:
• ToMOS is a reliable instrument for measuring teaching quality based on observed teaching practice, showing high levels of inter-rater reliability.
• There is a moderately strong relationship between ToMOS scores and student achievement gains.
• Further studies with a larger sample of teachers should be undertaken to confi rm this promising result.
C O N C L U S I O N S
Study 1 and Study 2 have identifi ed some important di! erences in rates of growth in literacy and numeracy. Rates of growth in literacy were slower for Western Australian Pre-primary children than for Year 1 children, but this was not the case for a national sample of children of similar age. Rates of growth were slower for lower-performing than for higher-performing students in Year 8 numeracy.
In both literacy and numeracy, it seems likely that growth for children could be improved if teachers were able to use more of the teaching practices identifi ed in the two observation schedules, CLOS-R and ToMOS. The results for literacy are particularly strong, suggesting that almost all of the unexplained variance between di! erent classes can be explained by the degree of absence or presence of the identifi ed teaching practices.
In the case of literacy, this study provides detailed qualitative examples of the ways in which these practices are incorporated into the classroom routine of more e! ective teachers. The implication for schools is that teachers need support to incorporate more of the practices identifi ed in the schedule.
In the case of numeracy, this study provides a valuable instrument for measuring teaching quality in lower secondary mathematics classrooms based on observed classroom practice, enabling future research to validate fi ndings and theories of e! ective mathematics teaching.


2
1 . L I T E R A C Y P H A S E 1 : A S S E S S M E N T
1 . 1 C O N T E X T
This research was conducted during a period of controversy and action in both literacy and early childhood education at international, national and state levels. Within literacy education there has been the ongoing ‘literacy debate’, played out in the Australian context in politics and the media, often with a focus on the place of phonics in literacy teaching (see Snyder, 2008, for a review). Within early childhood education there is international debate as to what should be the focus of early years classrooms, with a perceived tension between the explicit teaching of cognitive skills and supporting children’s social and emotional growth, particularly for children from backgrounds that are associated with low levels of school achievement (see for example, Dickinson, McCabe & Essex, 2006).
The ‘literacy debate’ has resulted in several high profi le government initiatives, beginning in the United States, where the National Reading Panel conducted an ‘evidence-based assessment of the scientifi c research literature on reading and its implications for reading instruction’. (NICHD, 2000) This type of analysis is normally used in research studies of the e" cacy of interventions in psychological and medical research for ‘fostering of robust health or psychological development and the prevention or treatment of disease’ (NICHD, 2000). The panel used a stringent set of criteria for inclusion of studies in the analyses and where possible a statistical meta-analysis1 was conducted and an e! ect size was calculated for the particular aspect of reading under investigation. The components of reading identifi ed by these methods as having signifi cant positive e! ects upon children’s reading achievement were phonemic awareness (defi ned as the ability ‘to focus on and manipulate phonemes in spoken syllables and words), phonics (a method of teaching reading that makes systematic connections between sounds and alphabet letters), fl uency (in terms of guided oral reading) and comprehension (including vocabulary knowledge). The research fi ndings of the Panel were used in the United States as the basis for government mandated educational initiatives.
Within the Australian context there has been ongoing concern by some that the fi ndings of the United States National Reading Panel did not appear to be infl uencing literacy teaching practice in Australia in that, it was claimed, a ‘whole language’ approach was being taken and that phonemic awareness and phonics were not being systematically taught.
This concern was taken up in the media and in 2004, the Australian Minister for Education, Science and Training announced a National Inquiry into the Teaching of Literacy,
in order to provide a broad, independent examination of reading research, teacher preparation and practices for the teaching of literacy, particularly reading, that resulted in the Rowe Report Teaching Reading (Rowe, 2005, )2. On the basis of observations and research reviewed for this inquiry, the report recommended that:
• Teachers be equipped with teaching strategies based on fi ndings from rigorous, evidence-based research that are shown to be e! ective in enhancing the literacy development of all children;
• Teachers provide systematic, direct and explicit phonics instruction so that children master the essential alphabetic code-breaking skills required for foundational reading profi ciency; equally, that teachers provide an integrated approach to reading that supports the development of oral language, vocabulary, grammar, reading fl uency, comprehension and the literacies of new technologies.
In 2006, following the National Inquiry into the Teaching of Literacy, the Western Australian Literacy and Numeracy Review Taskforce was set up in order ‘to improve literacy and numeracy levels of achievement of those students who are struggling, particularly those not reaching the benchmarks in years 3, 5 and 7’ 3. The Taskforce endorsed and extended the recommendations of the Rowe Report in terms of literacy in the early years of school and included in its report (DET, 2007) the recommendation that resources for teachers be developed in the areas of:
• Oral language, including awareness of sounds in words (phonological awareness), phonics and vocabulary, and strategies for teaching home languages and dialects other than Standard Australian English;
• Pre-Primary diagnostic assessment of phonological awareness and follow-up support for children who may later have di" culty in learning to read;
• Year 1 on-entry diagnostic assessment of literacy and numeracy skills.
Within the Western Australian context, over a number of years there have been some changes to the structure of the early school years that have the potential to impact upon literacy education. These include raising the school starting age by six months (for Pre-primary the minimum starting age is 4 years and 6 months on January 1) and provision for full-time Pre-primary and 4-half-day or 2-full-day sessions of Kindergarten attendance. Schooling for Kindergarten and Pre-primary children is not compulsory, but becomes compulsory in Year 1. A particular feature of Pre-primary classrooms is that traditionally many were not physically on the school site, but over time nearly all have been re-located to the school, but are often separated from the rest of the school by a fence. In some schools, often those built in recent years, the Pre-primary classrooms form part of an early years cluster that includes Kindergarten and possibly Years 1 and 2.
1 A meta-analsis is a statistical literature review. See Camilli et al (2003) for a more detailed description
2 http://www.dest.gov.au/nitl/report.htm3 http://www.literacyandnumeracyreview.det.wa.edu.au
3
There are some important di! erences between states in educational provision in the early years across Australia. The two most populous states, New South Wales and Victoria, have compulsory full-time school education for children from the age of fi ve years and the learning environments that these children enter are not particularly di! erent from those of Year 1 children. Further, there is a clear expectation that children will learn to read and write in this year of school. This is not necessarily the case in Western Australia, where the relatively recent move to full-time education and raising of the school entry age have led to a range of attitudes among teachers towards literacy teaching in the Pre-primary year.
1 . 2 A I M S
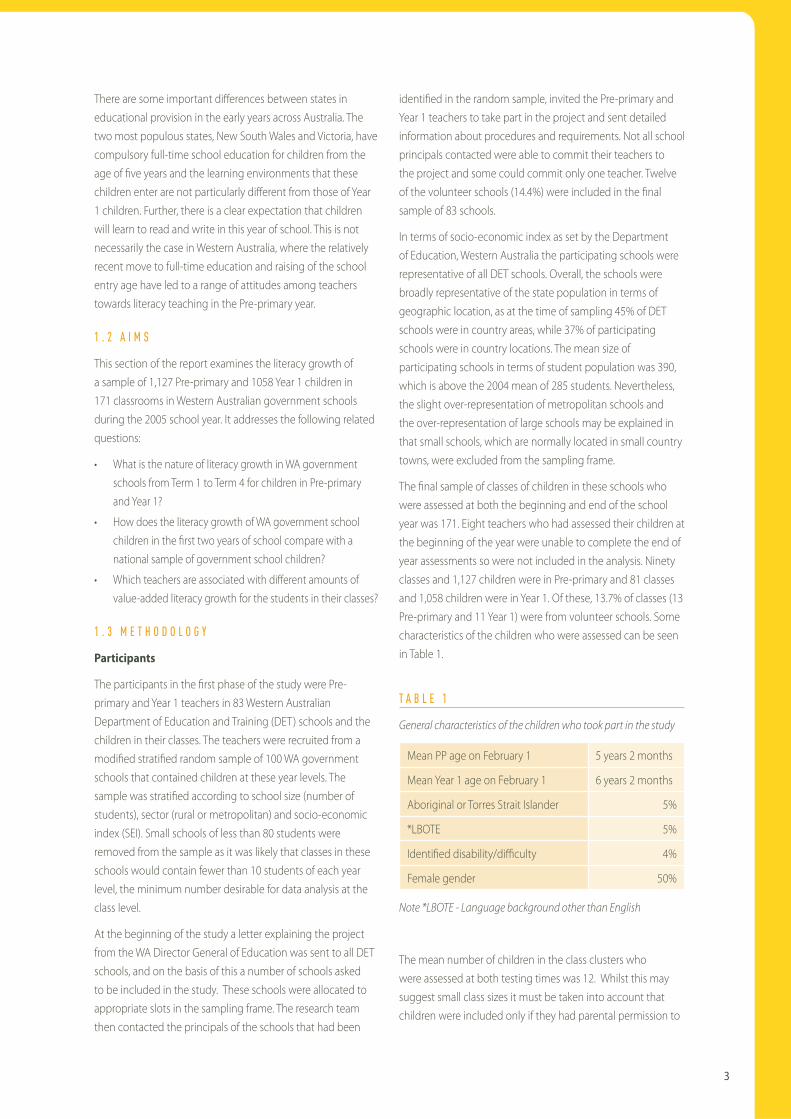
This section of the report examines the literacy growth of a sample of 1,127 Pre-primary and 1058 Year 1 children in 171 classrooms in Western Australian government schools during the 2005 school year. It addresses the following related questions:
• What is the nature of literacy growth in WA government schools from Term 1 to Term 4 for children in Pre-primary and Year 1?
• How does the literacy growth of WA government school children in the fi rst two years of school compare with a national sample of government school children?
• Which teachers are associated with di! erent amounts of value-added literacy growth for the students in their classes?
1 . 3 M E T H O D O L O G Y
Participants
The participants in the fi rst phase of the study were Pre-primary and Year 1 teachers in 83 Western Australian Department of Education and Training (DET) schools and the children in their classes. The teachers were recruited from a modifi ed stratifi ed random sample of 100 WA government schools that contained children at these year levels. The sample was stratifi ed according to school size (number of students), sector (rural or metropolitan) and socio-economic index (SEI). Small schools of less than 80 students were removed from the sample as it was likely that classes in these schools would contain fewer than 10 students of each year level, the minimum number desirable for data analysis at the class level.
At the beginning of the study a letter explaining the project from the WA Director General of Education was sent to all DET schools, and on the basis of this a number of schools asked to be included in the study. These schools were allocated to appropriate slots in the sampling frame. The research team then contacted the principals of the schools that had been
identifi ed in the random sample, invited the Pre-primary and Year 1 teachers to take part in the project and sent detailed information about procedures and requirements. Not all school principals contacted were able to commit their teachers to the project and some could commit only one teacher. Twelve of the volunteer schools (14.4%) were included in the fi nal sample of 83 schools.
In terms of socio-economic index as set by the Department of Education, Western Australia the participating schools were representative of all DET schools. Overall, the schools were broadly representative of the state population in terms of geographic location, as at the time of sampling 45% of DET schools were in country areas, while 37% of participating schools were in country locations. The mean size of participating schools in terms of student population was 390, which is above the 2004 mean of 285 students. Nevertheless, the slight over-representation of metropolitan schools and the over-representation of large schools may be explained in that small schools, which are normally located in small country towns, were excluded from the sampling frame.
The fi nal sample of classes of children in these schools who were assessed at both the beginning and end of the school year was 171. Eight teachers who had assessed their children at the beginning of the year were unable to complete the end of year assessments so were not included in the analysis. Ninety classes and 1,127 children were in Pre-primary and 81 classes and 1,058 children were in Year 1. Of these, 13.7% of classes (13 Pre-primary and 11 Year 1) were from volunteer schools. Some characteristics of the children who were assessed can be seen in Table 1.
T A B L E 1
General characteristics of the children who took part in the study
Mean PP age on February 1 5 years 2 months
Mean Year 1 age on February 1 6 years 2 months
Aboriginal or Torres Strait Islander 5%
*LBOTE 5%
Identifi ed disability/di" culty 4%
Female gender 50%
Note *LBOTE - Language background other than English
The mean number of children in the class clusters who were assessed at both testing times was 12. Whilst this may suggest small class sizes it must be taken into account that children were included only if they had parental permission to

4
participate and were assessed at both testing times. Further, in split-classes only one year level was normally assessed.
Assessment measures
The children’s literacy achievement was assessed using literacy materials from the Longitudinal Literacy and Numeracy Study (LLANS) that were devised by the Australian Council of Educational Research (Meiers, Khoo, Rowe, Stephanou, Anderson & Nolan, 2006). These materials were created in order to measure Australian student performance over time and to develop achievement scales describing growth in literacy from the beginning of school. Sets of linked assessment tasks were devised to include the expected range of children’s literacy knowledge and skills during Pre-Year 14 and Year 1. Two separate assessment instruments were designed for each school year, one to be administered at the beginning of the year; the other at the end. Sets of assessment tasks addressed the following aspects of literacy:
• Making meaning from text;
• Reading fl uency;
• Concepts about print;
• Phonemic awareness and
• Writing.
Items of varying and increasing di" culty were included in the set of activities for each assessment. Groups of items were repeated from one assessment to the next, providing links forwards and backwards between the four assessments.
The tasks were designed to be administered individually to children and involved ‘authentic texts’ some of which were high quality children’s picture books, and tasks that would be familiar to children, such as reading aloud from levelled texts, responding to a picture book read aloud by the teacher, writing based on the text read aloud and recognising letters and sounds. A detailed and precise set of instructions was provided to teachers in order to ensure standardisation of procedures, and marking guides provided clear and explicit ways of recording children’s responses.
Detailed information on the LLANS materials, construction of items and literacy achievement scales, based on the Rasch model (Adams & Khoo, 1999; Masters, 1982; Rasch, 1960), can be found in Meiers et al. (2006). Additional information on the scales can be found in Louden et al. (2005).
Assessment of children
Children were assessed by their teachers near the beginning of the school year, in March (Term 1) and again at the end of the year in November (Term 4). At both assessment times teachers were sent a package containing all materials to be used by the children in their class, detailed instructions on administration and scoring, and a brochure that contained photographs and precise explanations of each item in the package. Teachers were asked to assess all children in their classes, although those who taught split-classes containing children from more than one year level, usually Pre-primary/Year 1, were asked to assess the year level in which there were most children, as at least 10 children were required for each class. Whilst in several rural and remote schools the number of children at both year levels was fewer than 10, they were included in the study so that the sample contained a range of schools for this phase of the study. Schools were o! ered reimbursement for two days of teacher relief over the year in order to allow class teachers time to administer the assessment tasks and to complete surveys.
At the beginning of the year teachers were required to gain parent permission to assess the children in their classes. At the end of the year they were asked to complete a brief information sheet for each child who had completed both the beginning and end of year assessments, to provide information about the child’s linguistic and cultural background, any major interruption to learning or learning di" culty/disability, general literacy achievement in class and relative attention in class (using the four attentive-inattentive items from the Rowe Behavioural Rating Inventory 12-item Teacher Form, Rowe & Rowe, 1999, p. 23).
After the second round of assessments teachers were provided with detailed feedback on individual and class growth of the children they had assessed. This feedback took the form of an individual literacy progress map for each participating classroom teacher showing each child’s overall literacy growth in relation to the literacy growth of the statewide sample. In addition two diagnostic reports for school principals provided data on the participating classes for both Term 1 and Term 4 assessments in Pre-primary and Year 1.
4 When referring to school years on a national basis the term Pre-Year 1
is used to refer to the school year immediately preceding Year 1. This is
necessary as di! erent Australian states use di! erent terms for this school
year, such as Kindergarten, Prep, Reception (and Pre-primary in WA).

5
1 . 4 F I N D I N G S A B O U T S T U D E N T G R O W T H I N L I T E R A C Y
The results of the analyses of the literacy assessment data in terms of the achievement and growth of the children from Term 1 to Term 4 of the school year are now presented, beginning with an examination of what the Pre-primary and Year 1 children as whole groups were able do in Terms 1 and 4. This is followed by an analysis of their literacy growth during this time in comparison with a national sample of children of similar ages. Analyses were then made at the class level in order to identify classes in which there was more literacy growth than expected, expected literacy growth, and less than expected literacy growth. These analyses made it possible to identify individual teachers’ classrooms for the next phase of the project.
Literacy achievement and growth: Term 1 to Term 4
In order to examine the children’s literacy achievement and growth, their scored responses on the literacy assessment items were calibrated on a common logit scale5 by fi tting their response data to Rasch measurement models (see Meiers et al., 2006). An advantage of a common literacy scale upon which children’s achievements can be located, is that it can be used to compare the progress of children over time and also the relative achievement levels of di! erent student groups. Moreover, the data obtained from the scale may be modelled to identify major sources of variation and the magnitude of factors explaining that variation.
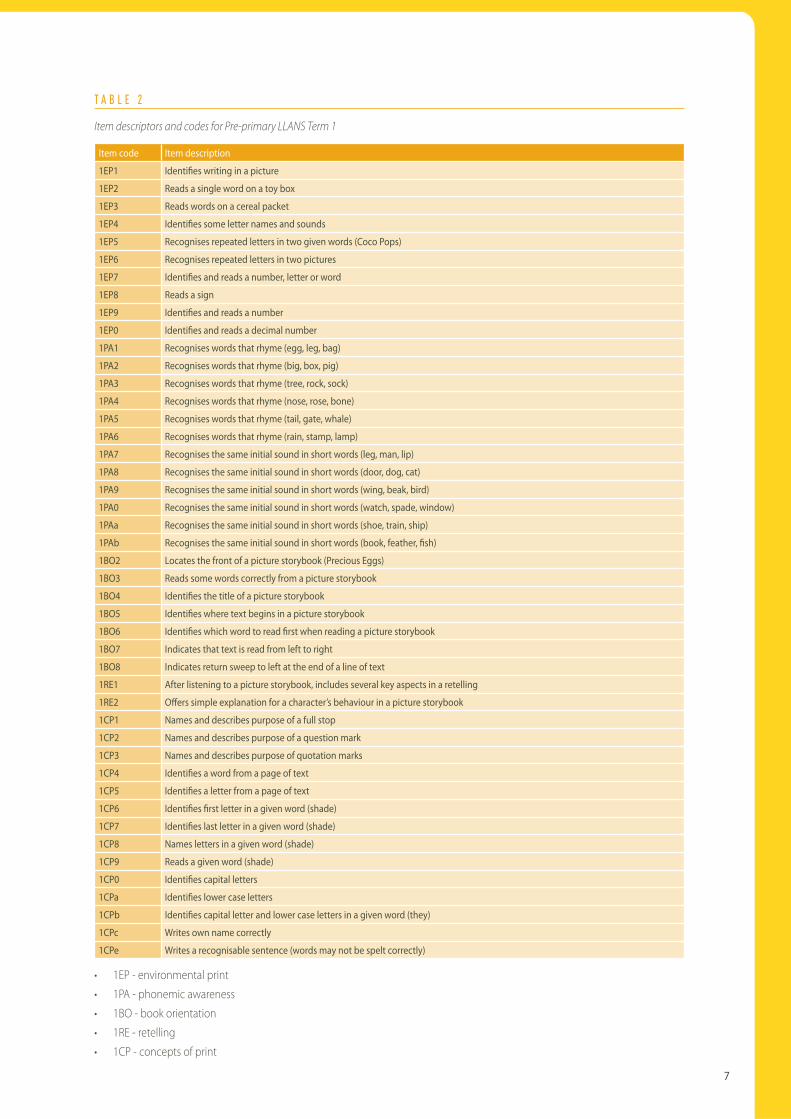
In Figure 1 the item variable map for Pre-primary Term 1 achievement can be seen. (The item maps for Pre-primary Term 4 and Year 1 Terms 1 and 4 can be found in Appendix 1). It shows the location on a logit scale of the Pre-primary Term 1 items according to di" culty (right-hand side), and the location of children according to their performances (X’s on the left-hand-side, with each X representing six children). The items that the children found easiest are located at the bottom of the map and those they found hardest at the top. In order to display each item on the map it has been given a code. A descriptor for each item code can be found in Table 2. (Code descriptors for Pre-primary Term 4 and Year 1 Terms 1 and 4 can be found in Appendix 1). All items in Figure 1 have the prefi x 1, as this survey was the fi rst in a series of literacy assessments (Meiers et al., 2006). This prefi x is followed by a code for the area of knowledge tapped by the item.
In Figure 1 the fi rst numeral following the area descriptor represents the order number of the task. Where items are marked as correct or incorrect (dichotomous) there are no further numerals. As responses to some items could be given a partial score, in some cases a numeral follows the area descriptor indicating the level reached. For example, the item 1EP5 assessed a child’s ability to match capital letters within the context of a photograph of a COCO POPS cereal packet from the question, ‘Show me any letters that are the same’. The easiest step for this item was 1EP5.1, which was located at the bottom of the item map, showing that this was the easiest item of all for the Pre-primary children in Term 1. This item step involved a child identifying one of the repeated letters in COCO POPS. The item step 1EP5.2 that was located higher on the map was more di" cult in that the child had to identify two or three of the repeated letters.
In order to give some idea of the progression of children’s literacy growth some assessment items, that show what the children could do at the beginning and end of Pre-primary and Year 1, have been selected. The selected items have been taken from word level tasks, rather than comprehension or writing tasks as these often involved partial scoring procedures that make immediate interpretation di" cult (for details of these procedures see Meiers et al., 2006).
Pre-primary
In the area of phonological awareness at the beginning of the year, nearly all the Pre-primary children demonstrated some rhyming skills, but some items proved to be more di" cult for them than others. For all items the teacher pronounced three words in a list as she pointed to a picture that represented the word. The word lists egg leg bag and nose rose bone in which the two rhyming words were pronounced fi rst were the easiest (achieved by 91% and 87% of the children respectively), whereas the list big box pig in which the rhyming words were separated by the non-rhyming word was more di" cult (achieved by 51%). A majority of the children were able to complete alliteration tasks, although there was a range of achievement (57%-76%) for di! erent items. Table 3 shows some of the skills the Pre-primary children demonstrated at the beginning of the year, approximately 6-7 weeks into Term 1.
5 To ensure that children’s item responses were calibrated on the LLANS
literacy scale, they were ‘anchored’ to the item threshold values obtained
from the fi rst four waves of data in ACER’s LLANS project (see Meiers &
Rowe, 2002; Rowe, 2002)

6
- - - - - - - - - - - - - - - - - - - - - - - - - - - - - - - - - - - - - - - - - - - - - - - - - - - - - - - - - - - - - - - - - - - - - - - - - - - - - - 3 . 0 | | | | | 1E PO. 3 | 1E P9 . 3 | 1CP3 2 . 0 | | | | | | | 1 . 0 | 1CPe . 3 | X | | 1CP9 . 2 | 1B O3 . 2 X | X | 1E P3 . 2 0 . 0 XXX | 1E P7 . 2 1 CP 9. 1 X | 1CPe . 2 XX | 1CP2 . 2 XX | 1P Ab. 3 1 BO3. 1 XXXXX | 1P A9 1 CP 8. 4 XXXXXXX | - 1 . 0 XXXXXXXX | 1E P2 1 E P 7 . 1 1R E 2 . 2 1 CP 1. 2 1CP2 . 1 1 CP a XXXXXXXXXXX | 1P Ab. 2 1 CP 8. 3 1CPO. 2 XXXXXXXXXX | 1E P3 . 1 XXXXXXXXXXXXXXXXXXXX | 1B O5 . 3 XXXXXXXXXXXXXXXXXX | 1E P4 . 2 1 RE 1 . 2 1CP8 . 2 1 CP b XXXXXXXXXXXXXXX | 1P A2 1 PA6 1P Ab. 1 1 CP 1. 1 1CPO. 1 XXXXXXXXXXXXXX | 1P A3 1 PAO 1CPe . 1 - 2 . 0 XXXXXXXXXXXXX | 1B O5 . 2 1 RE 2 . 1 XXXXXXXXXXXXXXXXXXXXX | 1P Aa XXXXXXXXXXXXX | 1E P9 . 2 1 PA5 1B O5 . 1 XXXXXXXXXXXX | 1E PO. 2 1 BO6. 2 1CP7 1 CP 8. 1 XXXXXXXXX | 1E P4 . 1 1 PA7 1P A8 XXXXXXXX | 1E P9 . 1 1 CP c . 2 XXXX | 1B O8 - 3 . 0 XXXXXXX | 1E PO. 1 1 BO6. 1 1CP4 1 CP 6 XXXX | 1E P8 1 RE 1 . 1 XX | 1B O4 . 2 1 CP c . 1 XXXX | 1E P5 . 2 X | 1E P6 1 BO2 1B O7 XX | 1E P1 1 PA4 1CP5 | - 4 . 0 X | 1P A1 1 BO4. 1 | X | | 1E P5 . 1 X | | | - 5 . 0 | - - - - - - - - - - - - - - - - - - - - - - - - - - - - - - - - - - - - - - - - - - - - - - - - - - - - - - - - - - - - - - - - - - - - - - - - - - - - - - E a c h X r epr e s e nt s 6 s t ude nt s
Figure 1. Pre-primary literacy item map for Term 1
7
T A B L E 2
Item descriptors and codes for Pre-primary LLANS Term 1
Item code Item description
1EP1 Identi! es writing in a picture
1EP2 Reads a single word on a toy box
1EP3 Reads words on a cereal packet
1EP4 Identi! es some letter names and sounds
1EP5 Recognises repeated letters in two given words (Coco Pops)
1EP6 Recognises repeated letters in two pictures
1EP7 Identi! es and reads a number, letter or word
1EP8 Reads a sign
1EP9 Identi! es and reads a number
1EP0 Identi! es and reads a decimal number
1PA1 Recognises words that rhyme (egg, leg, bag)
1PA2 Recognises words that rhyme (big, box, pig)
1PA3 Recognises words that rhyme (tree, rock, sock)
1PA4 Recognises words that rhyme (nose, rose, bone)
1PA5 Recognises words that rhyme (tail, gate, whale)
1PA6 Recognises words that rhyme (rain, stamp, lamp)
1PA7 Recognises the same initial sound in short words (leg, man, lip)
1PA8 Recognises the same initial sound in short words (door, dog, cat)
1PA9 Recognises the same initial sound in short words (wing, beak, bird)
1PA0 Recognises the same initial sound in short words (watch, spade, window)
1PAa Recognises the same initial sound in short words (shoe, train, ship)
1PAb Recognises the same initial sound in short words (book, feather, ! sh)
1BO2 Locates the front of a picture storybook (Precious Eggs)
1BO3 Reads some words correctly from a picture storybook
1BO4 Identi! es the title of a picture storybook
1BO5 Identi! es where text begins in a picture storybook
1BO6 Identi! es which word to read ! rst when reading a picture storybook
1BO7 Indicates that text is read from left to right
1BO8 Indicates return sweep to left at the end of a line of text
1RE1 After listening to a picture storybook, includes several key aspects in a retelling
1RE2 O" ers simple explanation for a character’s behaviour in a picture storybook
1CP1 Names and describes purpose of a full stop
1CP2 Names and describes purpose of a question mark
1CP3 Names and describes purpose of quotation marks
1CP4 Identi! es a word from a page of text
1CP5 Identi! es a letter from a page of text
1CP6 Identi! es ! rst letter in a given word (shade)
1CP7 Identi! es last letter in a given word (shade)
1CP8 Names letters in a given word (shade)
1CP9 Reads a given word (shade)
1CP0 Identi! es capital letters
1CPa Identi! es lower case letters
1CPb Identi! es capital letter and lower case letters in a given word (they)
1CPc Writes own name correctly
1CPe Writes a recognisable sentence (words may not be spelt correctly)
• 1EP - environmental print
• 1PA - phonemic awareness
• 1BO - book orientation
• 1RE - retelling
• 1CP - concepts of print

8
T A B L E 3
Percentages of Pre-primary children scoring correct responses on a sample of literacy items in Term 1
Item % of children
Reads the single word LEGO on a toy box 32
Reads a sign (either BP or SHELL) on a picture of a petrol station 78
Recognises words that rhyme (big, box, pig) 51
Recognises words that rhyme (tail, gate, whale) 71
Recognises words that rhyme (nose, rose, bone) 87
Recognises words that rhyme (egg, leg, bag) 91
Recognises the same initial sound in short words (watch, spade, window) 57
Recognises the same initial sound in short words (shoe, train, ship) 60
Recognises the same initial sound in short words (leg, man, lip) 70
Recognises the same initial sound in short words (door, dog, cat) 76
Identi! es lower case letters 27
Identi! es a word from a page of text 72
Identi! es a letter from a page of text 87
The Pre-primary children at this time had some concepts of words and letters: many could point to a word (72%) and a letter (87%) within a page of text and could recognise a BP or SHELL sign on a photograph of a petrol station (78%). On the other hand most did not appear to have detailed knowledge of written words or letters, with just 32% recognising the word LEGO on a photograph of a toy box, and 27% identifying a letter n as ‘little’ or lowercase.
In the Term 4 assessment the Pre-primary children were able to demonstrate a wider range of word level knowledge and skills. In addition to recognising rhyme and alliteration, albeit not always consistently, a majority were able to demonstrate identifi cation of fi nal phonemes in words (75% identifi ed /p/ at the end of pup and 64% identifi ed /t/ at the end of coat).They were also able to demonstrate some knowledge of letter names and sounds, although their knowledge in this area seemed to depend on the particular letter presented and the
font in which it was presented, for example the lower case letter l, which was sometimes confused with the numeral 1, was recognised by just about half (49%), whereas the lower case e was named by most (79%), although not as many could give its sound (59%).
Some of the Pre-primary children’s growth in word level skills over the year can be seen in Table 4 that shows a sample of what these Pre-primary children could do at the end of Term 4.
The children’s recognition of sight words out of context was beginning to develop. A majority (63%) recognised I as a word, but their knowledge of longer words was not well-developed, with few (11%) recognising the word little. The children’s skill in oral reading, assessed using the Reading Recovery Level 5 text Monkey on the Roof (Clough, 2000), was just beginning to develop. Relatively few children (19%) were able to read some or all of this simple text with accuracy.

9
T A B L E 4
Percentages of Pre-primary children scoring correct responses on a sample of literacy items in Term 4
Item % of children
Identi! es words with the same ! rst sound from a list of three (steak, tray, tree) 56
Identi! es words with the same ! rst sound from a list of three (man, mud, goat) 84
Identi! es words with that rhyme from given pairs (hand, bed; hand, sand; hand, house) 68
Identi! es words with that rhyme from given pairs (bunny, money; bunny, balloon; bunny, funny) 79
Identi! es ‘t’ sound at the end of coat 64
Identi! es ‘p’ sound at the end of pup 75
Names a letter (a) 80
Names a letter (e) 79
Names a letter (g) 55
Names a letter (l) 49
Makes a sound of a letter (a) 81
Makes a sound of a letter (e) 59
Makes a sound of a letter (g) 59
Makes a sound of a letter (l) 49
Reads ‘ and ‘ as a sight word 36
Reads ‘ I ‘ as a sight word 63
Reads ‘ Iittle ‘ as a sight word 11
Reads ‘ the ‘ as a sight word 33
Identi! es a word from a page of text 81
Identi! es a letter from a page of text 86
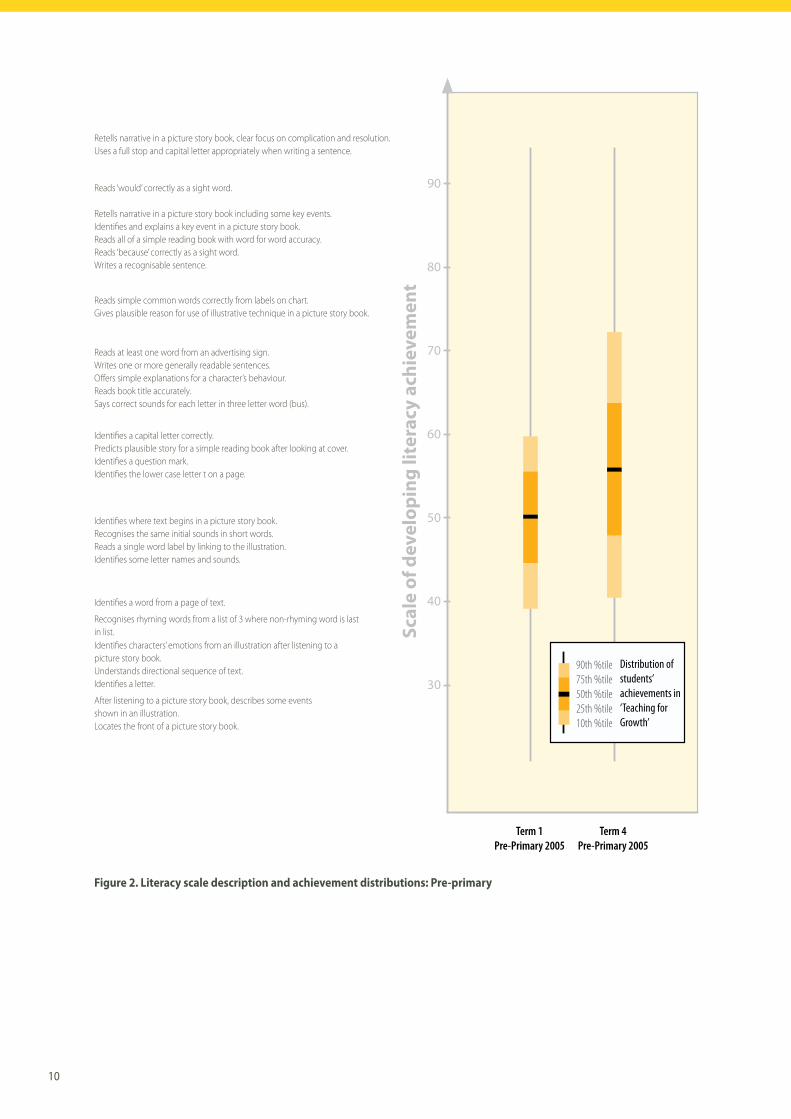
The overall literacy growth of the Pre-primary children during the school year can be seen in Figure 2. This shows, on the left, a selected sample of skill descriptions of achievement at di! erent points on the literacy scale from the easiest (at the bottom) to the hardest (at the top). The two shaded bands on the right show the distributions of achievement in the Pre-primary Term 1 and Term 4 surveys. These shaded bands represent the middle 80% of children, the darker shading
represents the middle 50% and the black line in the middle represents the median. It can be seen that whilst there was some growth in literacy at all levels, there was a range of achievement at the beginning of the Pre-primary year and that this range had become much wider by the end of the year. There was relatively little growth at the bottom of the distribution and a large amount of growth at the top.
10
Figure 2. Literacy scale description and achievement distributions: Pre-primary
Retells narrative in a picture story book, clear focus on complication and resolution.Uses a full stop and capital letter appropriately when writing a sentence.
Reads ‘would’ correctly as a sight word.
Retells narrative in a picture story book including some key events. Identifi es and explains a key event in a picture story book. Reads all of a simple reading book with word for word accuracy. Reads ‘because’ correctly as a sight word.Writes a recognisable sentence.
Reads simple common words correctly from labels on chart. Gives plausible reason for use of illustrative technique in a picture story book.
Reads at least one word from an advertising sign.Writes one or more generally readable sentences. O! ers simple explanations for a character’s behaviour. Reads book title accurately.Says correct sounds for each letter in three letter word (bus).
Identifi es a capital letter correctly.Predicts plausible story for a simple reading book after looking at cover. Identifi es a question mark. Identifi es the lower case letter t on a page.
Identifi es where text begins in a picture story book.Recognises the same initial sounds in short words.Reads a single word label by linking to the illustration. Identifi es some letter names and sounds.
Identifi es a word from a page of text.
Recognises rhyming words from a list of 3 where non-rhyming word is last in list. Identifi es characters’ emotions from an illustration after listening to a picture story book. Understands directional sequence of text.Identifi es a letter.
After listening to a picture story book, describes some events shown in an illustration. Locates the front of a picture story book.
90
70
50
30
80
60
40
90th %tile75th %tile50th %tile25th %tile10th %tile
Distribution of students’achievements in‘Teaching forGrowth’
Term 1Pre-Primary 2005
Term 4Pre-Primary 2005
Scal
e of
dev
elop
ing
liter
acy
achi
evem
ent

11
T A B L E 5
Percentages of Year 1 children scoring correct responses on a sample of literacy items in Term 4
Item % of children
Reads words with a similar structure (like/likely) 7
Reads words with a similar structure (like/likeness) 8
Reads words with a similar structure (like/strike) 11
Spells and writes a given word (liked) 11
Spells and writes a given word (bike) 13
Reads words with a similar structure (like/spike) 17
Reads words with a similar structure (like/liked) 28
Reads words with a similar structure (like/bike) 37
Reads words with a similar structure (like/likes) 42
Deletes sounds in words (black/back) 30
Deletes sounds in words (card/car) 48
Deletes sounds in words (bend/end) 52
Deletes sounds in words e.g. takes out m in meat to make eat 56
Reads words that may require segmenting of letters (sun) 63
Year 1
As for Pre-primary, the Year 1 fi rst assessment was given to the children approximately 6-7 weeks into the school year. Table 5 shows some of the word level skills demonstrated at this time.
Many of the beginning Year 1 children were able to read the simple consonant-vowel-consonant word sun (63%) and to delete the fi rst phoneme in a word (56% deleted /m/ from meat and 52% deleted /b/ from bend). Deleting a phoneme when it was part of an onset, as in deleting /l/ from black, was achieved by a smaller proportion of children (30%). Their ability to use letter patterns in reading and spelling words was developing. When given the word like some were becoming able to use the letter pattern to decode very similar words such as likes (42%) and bike (37%), although few were able to decode more complex letter patterns such as strike (11%) and likely (7%). Few were able to use the letter pattern analogy to spell bike (13%) or liked (11%) and only one third (33%) were able to read some or all of the Reading Recovery Level 8 text Kitty Cat Plays Inside (Smith, 2000) with accuracy.
In Term 4 of Year 1 many children demonstrated sophisticated phonological awareness skills in terms of manipulating phonemes in spoken words. Most were able to delete one phoneme and replace it with another at the beginning of a word (87% deleted /h/ in hat and replaced it with /m/) and the middle of a word (75% deleted /o/ in shop and replaced it with /i/).
However, manipulating part of an onset or rime was more di" cult (for example deleting /m/ from the onset of smell and replacing it with /p/ was achieved by 45% of children). Manipulating end sounds was generally more di" cult than manipulating beginning and middle sounds (only 45% were able to delete the /m/ in stem and replace it with /p/). Nearly all the children (87%) were able to read the simple consonant-vowel-consonant word ten, and many (60%) were able to read some or all of the Reading Recovery Level 15 book Meet My
Mouse (Robinson, 1993) with accuracy.
The overall literacy growth of the Year 1 children during the school year can be seen in Figure 3. This shows, on the left, a selected sample of skill descriptions of achievement at di! erent points on the literacy scale from the easiest (at the bottom) to the hardest (at the top). The two shaded bands on the right show the distributions of achievement in the Year 1 Term 1 and Term 4 surveys. These shaded bands represent the middle 80% of children, the darker shading represents the middle 50% and the black line in the middle represents the median. It can be seen that whilst there was a wide range of achievement at the beginning of Year 1 that was still apparent at the end of the year, children at all levels demonstrated large amounts of growth, including those children at the bottom of the distribution.

12
1 . 5 C O M P A R I S O N W I T H A N A T I O N A L S A M P L E
In view of the fi ndings about the literacy achievement and growth of the Pre-primary children, it appeared that there might be some di! erences between the Western Australian Teaching for Growth (TFG) sample of children and those who had taken part in the ACER Longitudinal Literacy and Numeracy
Study (LLANS) (Meiers et al., 2006). Since the children in both studies had completed the same literacy assessments at the same points in their school careers comparisons between these groups could be made. The data, therefore, were further analysed.
In both studies children in slightly modifi ed stratifi ed random samples of schools had been administered the same literacy assessments by their teachers in Pre-Year 1 (the Year prior to Year 1) and/or Year 1. In order to allow for valid comparisons, since the TFG children were all from government schools and the LLANS study also included children from non-government schools, all children who had been attending non-government schools were removed from the LLANS database. The following comparisons of literacy achievement and growth therefore are based on data collected from children in government schools only.
The assessment data in each study had been collected from children in Pre-Year 1 or Year 1 in Terms 1 and 4 of the school year. It was collected in 2005 for TFG, and was compared with data from the LLANS children who were assessed in Terms 1 and 4 of 1999 in Pre-Year 1, and in 2000 in Year 1. The Terms 1 and 4 data that had been collected for the Pre-Year 1 and Year 1 children for the TFG study were scored onto the literacy scale developed for the LLANS study. Whilst the children in both studies were in similar school years, that is Pre-Year 1 and Year 1, it was also important to ensure that the children were of similar ages. Table 7 indicates that this was the case, although
the mean age of the LLANS sample was one month higher than those of the TFG samples.
T A B L E 7
Mean ages if the children in the TFG and LLANS samples
Pre - Year 1
March November
LLANS TFG LLANS TFG
5 yrs 4 months
5 yrs 3 months
6 yrs 0 months
5 yrs 11 months
Year 1
March November
LLANS TFG LLANS TFG
6 yrs 4 months
6 yrs 3 months
7 yrs 0 months
6 yrs 11 months
Note *LLANS - Longitudinal Literacy and Numeracy Study,
TFG - Teaching for Growth
T A B L E 6Percentages of Year 1 children scoring correct responses on a sample of items in Term 4
Item % of children
Manipulates end sounds in words e.g swaps m in stem with p to make step 45
Manipulates middle sounds in word e.g swaps m in smell with p to make spell 45
Manipulates end sounds in words e.g swaps t in art with m to make arm 54
Manipulates middle sounds in word e.g swaps l in blush with r to make brush 55
Manipulates middle sounds in word e.g swaps u in cup with a to make cap 67
Manipulates end sounds in words e.g swaps n in bin with g to make big 59
Manipulates middle sounds in word e.g swaps o in shop with i to make ship 75
Manipulates beginning sounds in words e.g. swaps c in camp with l to make lamp 80
Reads words that may require segmenting of letters (ten) 87
Manipulates beginning sounds in words e.g. swaps h in hat with m to make mat 87

13
Controls a variety of simple and complex sentences in own writing. Spells 'basket' correctly.Writes a well connected piece showing recognisable structure, e.g narrative, recount.
Writes simple sentences joined with simple conjunctions eg like, but, then. Controls selected content, includes specifi c details in own writing. Writes several sentences, with consistent and accurate use of full stops and capital letters. Identifi es key events in a story after listening to a picture story book. Uses and controls a variety of common punctuation.Correctly pronounces words that require blending of at least 3 syllables. Includes one or more complex sentences in own writing. Uses context to provide meaning for unfamiliar words in informational text, e.g plentiful. Segments and blends to pronounce unfamiliar words correctly eg tactical. Reads simple reading book (repetitive structure, varied content) with word for word accuracy. Writes readable text, many words spelt correctly and errors are plausible. Identifi es main idea and provides one or more details after listening to a story. Generalises about meaning of an image in the conclusion to a picture story book.
Writes a single sentence using an initial capital letter and fi nal full stop.
Expresses more than one idea in own writing.
Writes generally readable text, spelling plausible though many errors. Identifi es words in quotation marks within a simple reading book, understands the purpose.Locates relevant information after hearing an information text read aloud.
Listens to an informational text, and identifi es specifi c information,but little detail. Manipulates sounds in words, eg takes out the b in bend – what word is left?Makes some errors in the construction of simple sentences.
Reads 2 to 3 pages of a simple reading book, limited maintenance of meaning.Identifi es main character and situation from looking at front cover of a simple reading book. Gives a literal interpretation of illustration from a picture story book.
Understands character's situation from text and pictures.
Makes a general comment about an illustration after listening to a picture story book.
Figure 3. Literacy scale description and achievement distributions: Year 1
100
80
60
40
90
70
50
90th %tile75th %tile50th %tile25th %tile10th %tile
Term 1Year 1 2005
Term 4Year 1 2005
Scal
e of
dev
elop
ing
liter
acy
achi
evem
ent
Distribution of students’achievements in‘Teaching forGrowth’

14
Figure 4 shows the distributions of children’s scores from the two studies on the common literacy scale. The maximum, the minimum, the 10th, 25th, 50th, 75th and the 90th percentile scores are marked on each column as follows:
Term 1 Term 4 Term 4Term 1
LLAN
S_’9
9
LLAN
S_’0
0
LLAN
S_’0
0
LLAN
S_’9
9
TFG
_’05
TFG
_’05
TFG
_’05
TFG
_’05
Scal
e of
dev
elop
ing
liter
acy
achi
evem
ent
Note. LLANS - Longitudinal literacy and numeracy study, TFG - Teaching for Growth
Figure 4. Literacy growth of TFG and LLANS samplesIt will be seen that there were di! erences between the samples of children in the two studies in terms of both achievement at di! erent points in time, and in patterns of growth. These di! erences were further explored. Table 8 shows the sample size, mean score and standard deviation for each sample
of children at each assessment time. It can be seen that there were distinct di! erences between the samples at all assessment points: the TFG children had lower mean scores on the literacy scale at all times.
T A B L E 8
Means and standard deviations for the two samples of children
Assessment time Sample N Mean Std dev
Pre -Year 1 Term 1LLANS 607 57.59 12.00
TFG 1127 51.42 7.85
Pre - Year 1 Term 4LLANS 562 69.21 13.18
TFG 1119 57.83 12.08
Year 1 Term 1LLANS 498 72.94 14.27
TFG 1057 64.07 10.43
Year 1 Term 4LLANS 476 83.32 11.80
TFG 1049 80.75 10.77
Note. LLANS - Longitudinal literacy and numeracy study, TFG - Teaching for Growth
15
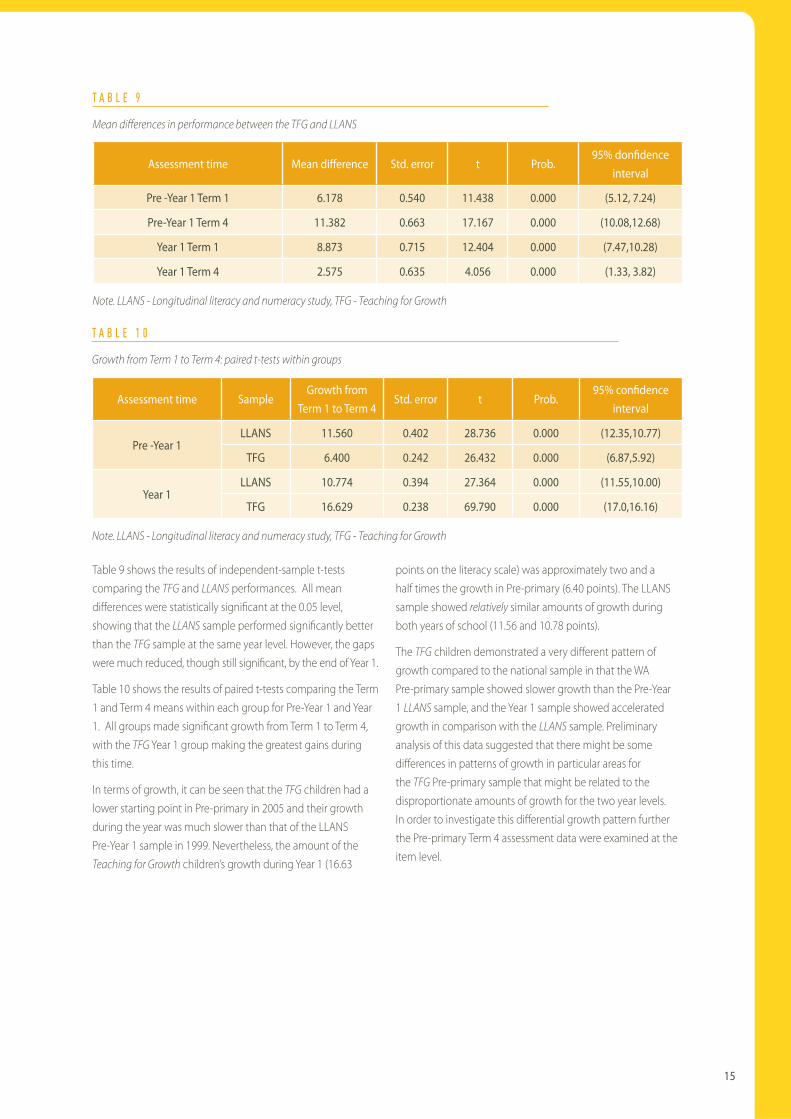
Table 9 shows the results of independent-sample t-tests comparing the TFG and LLANS performances. All mean di! erences were statistically signifi cant at the 0.05 level, showing that the LLANS sample performed signifi cantly better than the TFG sample at the same year level. However, the gaps were much reduced, though still signifi cant, by the end of Year 1.
Table 10 shows the results of paired t-tests comparing the Term 1 and Term 4 means within each group for Pre-Year 1 and Year 1. All groups made signifi cant growth from Term 1 to Term 4, with the TFG Year 1 group making the greatest gains during this time.
In terms of growth, it can be seen that the TFG children had a lower starting point in Pre-primary in 2005 and their growth during the year was much slower than that of the LLANS Pre-Year 1 sample in 1999. Nevertheless, the amount of the Teaching for Growth children’s growth during Year 1 (16.63
points on the literacy scale) was approximately two and a half times the growth in Pre-primary (6.40 points). The LLANS sample showed relatively similar amounts of growth during both years of school (11.56 and 10.78 points).
The TFG children demonstrated a very di! erent pattern of growth compared to the national sample in that the WA Pre-primary sample showed slower growth than the Pre-Year 1 LLANS sample, and the Year 1 sample showed accelerated growth in comparison with the LLANS sample. Preliminary analysis of this data suggested that there might be some di! erences in patterns of growth in particular areas for the TFG Pre-primary sample that might be related to the disproportionate amounts of growth for the two year levels. In order to investigate this di! erential growth pattern further the Pre-primary Term 4 assessment data were examined at the item level.
T A B L E 9
Mean di! erences in performance between the TFG and LLANS
Assessment time Mean di" erence Std. error t Prob.95% don! dence
interval
Pre -Year 1 Term 1 6.178 0.540 11.438 0.000 (5.12, 7.24)
Pre-Year 1 Term 4 11.382 0.663 17.167 0.000 (10.08,12.68)
Year 1 Term 1 8.873 0.715 12.404 0.000 (7.47,10.28)
Year 1 Term 4 2.575 0.635 4.056 0.000 (1.33, 3.82)
Note. LLANS - Longitudinal literacy and numeracy study, TFG - Teaching for Growth
T A B L E 1 0
Growth from Term 1 to Term 4: paired t-tests within groups
Assessment time SampleGrowth from
Term 1 to Term 4Std. error t Prob.
95% con! dence interval
Pre -Year 1LLANS 11.560 0.402 28.736 0.000 (12.35,10.77)
TFG 6.400 0.242 26.432 0.000 (6.87,5.92)
Year 1LLANS 10.774 0.394 27.364 0.000 (11.55,10.00)
TFG 16.629 0.238 69.790 0.000 (17.0,16.16)
Note. LLANS - Longitudinal literacy and numeracy study, TFG - Teaching for Growth
16
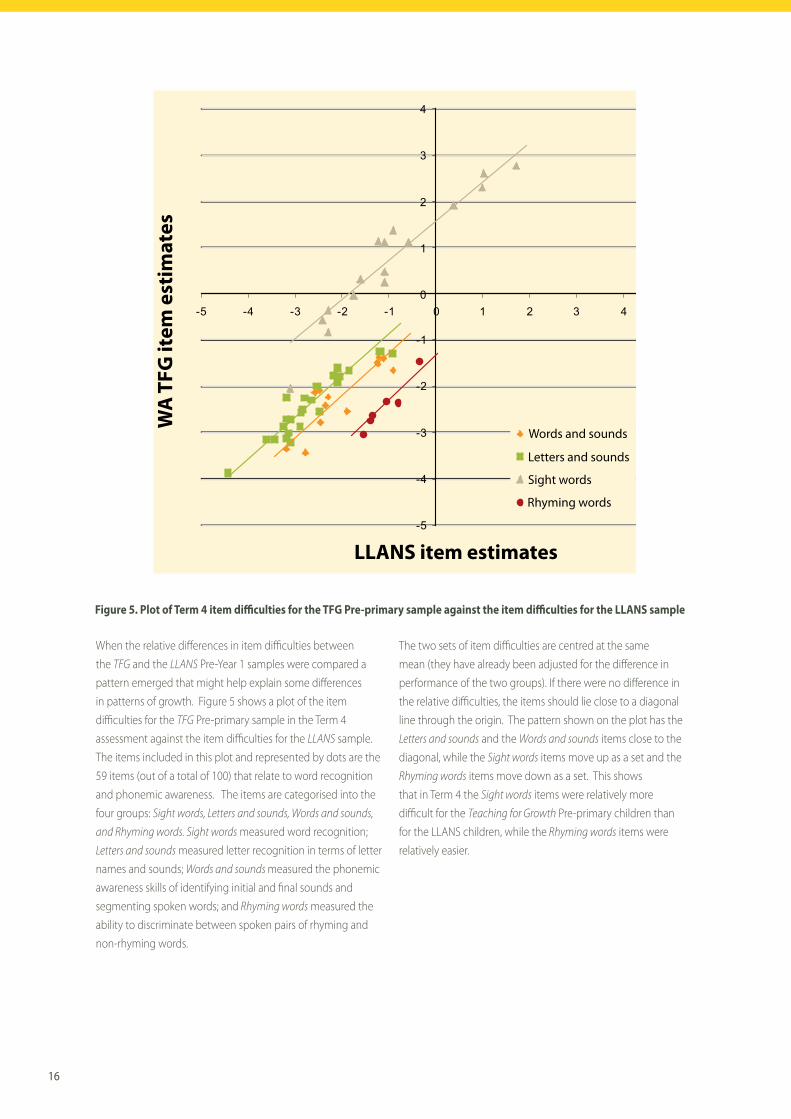
Figure 5. Plot of Term 4 item di! culties for the TFG Pre-primary sample against the item di! culties for the LLANS sample
-5
-4
-3
-2
-1
0
1
2
3
4
-5 -4 -3 -2 -1 0 1 2 3 4
Words and sounds
Letters and sounds
Sight words
Rhyming words
LLANS item estimates
WA
TFG
item
est
imat
es
When the relative di! erences in item di" culties between the TFG and the LLANS Pre-Year 1 samples were compared a pattern emerged that might help explain some di! erences in patterns of growth. Figure 5 shows a plot of the item di" culties for the TFG Pre-primary sample in the Term 4 assessment against the item di" culties for the LLANS sample. The items included in this plot and represented by dots are the 59 items (out of a total of 100) that relate to word recognition and phonemic awareness. The items are categorised into the four groups: Sight words, Letters and sounds, Words and sounds,
and Rhyming words. Sight words measured word recognition; Letters and sounds measured letter recognition in terms of letter names and sounds; Words and sounds measured the phonemic awareness skills of identifying initial and fi nal sounds and segmenting spoken words; and Rhyming words measured the ability to discriminate between spoken pairs of rhyming and non-rhyming words.
The two sets of item di" culties are centred at the same mean (they have already been adjusted for the di! erence in performance of the two groups). If there were no di! erence in the relative di" culties, the items should lie close to a diagonal line through the origin. The pattern shown on the plot has the Letters and sounds and the Words and sounds items close to the diagonal, while the Sight words items move up as a set and the Rhyming words items move down as a set. This shows that in Term 4 the Sight words items were relatively more di" cult for the Teaching for Growth Pre-primary children than for the LLANS children, while the Rhyming words items were relatively easier.
17
1 . 6 S T U D E N T L I T E R A C Y G R O W T H A N D T E A C H E R E F F E C T I V E N E S S
To estimate student learning gains for the TFG sample, after taking into account prior performance and some student-level variables, multilevel models (see Rowe, 2001) were fi tted to the literacy assessment data separately for the Western Australian Pre-primary and Year 1 samples. The analyses were based on two-level hierarchical models with students nested within classes. The aim of these analyses was to estimate the approximate e! ect of the classroom teacher on student learning after taking into account possible student-level e! ects.
Sources of variation
An unconditional model without any predictors was fi rst specifi ed and estimated with Term 4 literacy scores as the outcome variable in order to assess the proportions of variation at the student and classroom levels. This analysis was performed separately for Pre-primary and Year 1. It was found that variation between classes accounted for 24.8% of the total variance in the Pre-primary literacy scores in Term 4 (with 75.2% of the variance at the student level) and 22.9% of the total variance in the Year 1 literacy scores in Term 4 (with 77.1% of the variance at the student level).
With the addition of prior performance in Term 1 as a predictor in the student-level model, the results showed that Term 1 scores were highly signifi cant predictors for both Pre-primary and Year 1. Term 1 scores accounted for 56.1% of the total variance in the Pre-primary Term 4 scores and 55.9% of the total variance in the Year 1 Term 4 scores. Adding signifi cant student-level predictors (disability, interruption to learning and relative attentiveness) to the Pre-primary student-level model increased the proportion of total variance explained from 56.1% to 58.5%. For the Year 1 student-level model, disability, interruption to learning, relative attentiveness and Aboriginal or Torres Strait Islander status were signifi cant predictors. The addition of these four student-level variables increased the proportion of total variance explained from 55.9% to 59.5%.
Value-added measures
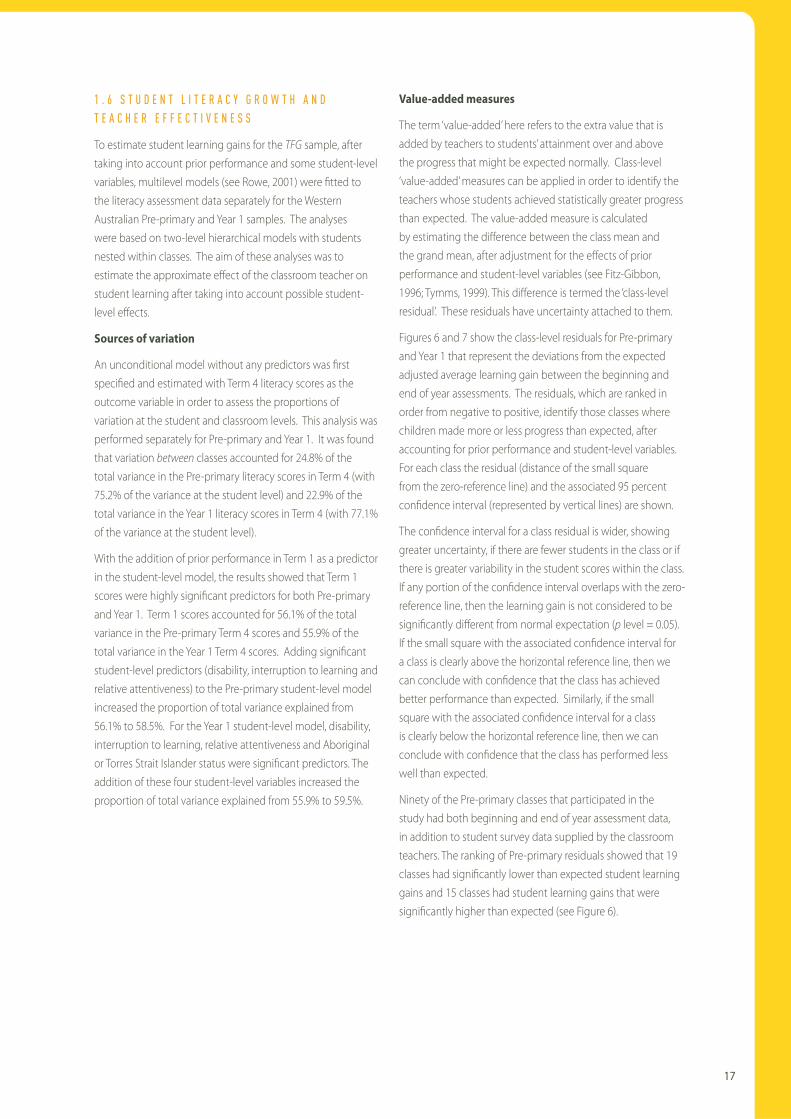
The term ‘value-added’ here refers to the extra value that is added by teachers to students’ attainment over and above the progress that might be expected normally. Class-level ‘value-added’ measures can be applied in order to identify the teachers whose students achieved statistically greater progress than expected. The value-added measure is calculated by estimating the di! erence between the class mean and the grand mean, after adjustment for the e! ects of prior performance and student-level variables (see Fitz-Gibbon, 1996; Tymms, 1999). This di! erence is termed the ‘class-level residual’. These residuals have uncertainty attached to them.
Figures 6 and 7 show the class-level residuals for Pre-primary and Year 1 that represent the deviations from the expected adjusted average learning gain between the beginning and end of year assessments. The residuals, which are ranked in order from negative to positive, identify those classes where children made more or less progress than expected, after accounting for prior performance and student-level variables. For each class the residual (distance of the small square from the zero-reference line) and the associated 95 percent confi dence interval (represented by vertical lines) are shown.
The confi dence interval for a class residual is wider, showing greater uncertainty, if there are fewer students in the class or if there is greater variability in the student scores within the class. If any portion of the confi dence interval overlaps with the zero-reference line, then the learning gain is not considered to be signifi cantly di! erent from normal expectation (p level = 0.05). If the small square with the associated confi dence interval for a class is clearly above the horizontal reference line, then we can conclude with confi dence that the class has achieved better performance than expected. Similarly, if the small square with the associated confi dence interval for a class is clearly below the horizontal reference line, then we can conclude with confi dence that the class has performed less well than expected.
Ninety of the Pre-primary classes that participated in the study had both beginning and end of year assessment data, in addition to student survey data supplied by the classroom teachers. The ranking of Pre-primary residuals showed that 19 classes had signifi cantly lower than expected student learning gains and 15 classes had student learning gains that were signifi cantly higher than expected (see Figure 6).

18
0 10 20 30 40 50 60 70 80 90 -11.6
- 5.8
0.0
5.8
11.6
17.4
Figure 6. Ranked class-level residuals with associated 95% con" dence intervals: Pre-primary
0 10 20 40 50 60 70 80 -17.4
- 8.7
0.0
8.7
30
Figure 7. Ranked class-level residuals with associated 95% con" dence intervals: Year 1
Eighty-one of the Year 1 classes that participated in the study had beginning and end of year assessment data, in addition to the student survey data. The ranking of the Year 1 residuals showed that 16 classes had signifi cantly lower than expected
student learning gains, and 16 classes had student learning gains that were signifi cantly higher than expected (see Figure 7).
19
1 . 7 S U M M A R Y
The Teaching for Growth sample of children, as a whole, demonstrated growth on the literacy scale from Term 1 to Term 4 in both Pre-primary and Year 1.
There was, however, considerable variability in achievement at the beginning of Pre-primary. This variability was greatly increased by the end of the year. The greater variation was manifested in little literacy growth at the bottom of the distribution and relatively high growth at the top. That is, children who arrived at the beginning of the Pre-primary year with limited literacy skills were likely, on average, to make little progress in literacy during their Pre-primary year. On the other hand, children who arrived with more developed literacy skills were much more likely to make substantial progress in literacy during their Pre-primary year.
In contrast, rates of growth in literacy in Year 1 were consistent at all points of the distribution. The amount of growth overall in Year 1 was approximately two and a half times that in Pre-primary and this growth was evident at all levels, including the bottom of the distribution.
These characteristics of the Western Australian children’s performance – limited growth at the bottom of the distribution in Pre-primary and substantial growth at all levels of performance in Year 1 – were not present in a national sample of children at similar ages using the same assessment instruments and procedures in 1999.
An analysis of the scores of children in government schools in the national sample showed that children in the Western Australian sample showed a lower level of achievement at the beginning of Pre-primary than the national sample, and that lower level of performance was maintained at the end of the year. In Term 1 of Year 1 the achievement gap between the national and Western Australian samples was becoming smaller. By the end of Term 4 of Year 1, the gap was noticeably smaller but the Western Australian group was still performing at a signifi cantly lower level than the national sample.
There were also di! erences in areas of achievement between the Western Australian and national samples. The Western Australian Pre-primary children found the discrimination of rhyming and non-rhyming words relatively less di" cult when compared with the national sample, and they found word recognition relatively harder.
In order to explore the impact of teachers’ literacy teaching practices on these achievement results, a value-added analysis was undertaken to identify teachers in whose classrooms there was more than expected, as expected, and less than expected literacy growth. This allowed for the linking of estimates of growth in student achievement to teachers’ pedagogical practices in the classroom observation phase of the study.
2 . L I T E R A C Y P H A S E 2 : C L A S S R O O M O B S E R V A T I O N - Q U A N T I T A T I V E A N A L Y S I S
2 . 1 A I M S
This section of the report addresses the quantitative relationship between teacher e! ectiveness and classroom practice. It describes how teachers’ residuals from the value-added analyses were used to identify groups of teachers of di! ering levels of literacy teaching e! ectiveness, how individual teachers were selected to take part in video observations and how video data were analysed in terms of the Classroom Literacy Observation Survey – Revised (CLOS-R). The following research questions are addressed:
What is the nature of the quantitative relationship between student growth and teachers’ classroom practices? Specifi cally:
• Are there any di! erences between groups of teachers, identifi ed as more e! ective, e! ective and less e! ective, in terms of the frequency of their observed CLOS-R literacy teaching practices?
• Does the CLOS-R represent a consistent and valid scale with which to observe teachers’ classroom literacy teaching practices?
2 . 2 M E T H O D O L O G Y
On the basis of their results from the value-added analysis, teachers were selected for site visit video observations. Accordingly, they were allocated to one of three groups. In classrooms where children in the previous year had achieved signifi cantly lower than expected student learning gains teachers were classifi ed as ‘less e! ective’; in classrooms where children had achieved signifi cantly higher than expected student learning gains teachers were classifi ed as ‘more e! ective’; and in classrooms where children had achieved expected learning gains teachers were classifi ed as ‘e! ective’#.
Teachers who took part in the site visit video observations met the following criteria:
• They were teaching at the same year level in the same school in 2006 as in 2005;
• They and their schools agreed to take part in this phase of the study;
• The cluster size of children assessed at both testing times the previous year was normally 10 or more, although one teacher with a cluster size of eight and one of nine were included as these two teachers were teaching in split-classes.
7 It is recognised that teachers may be e! ective in many di! erent ways. However, for the purposes of this study, teacher e! ectiveness is defi ned solely in terms of the LLANS literacy assessment residual scores of the sample of children in each teacher’s class
20
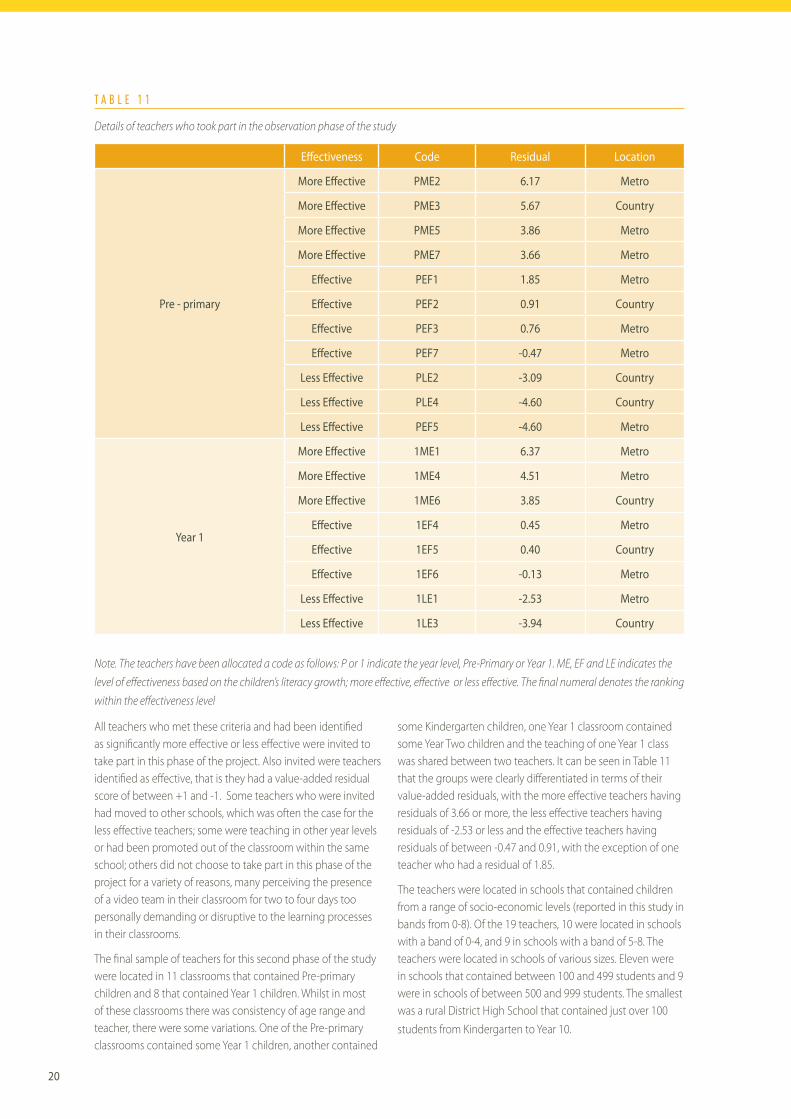
T A B L E 1 1
Details of teachers who took part in the observation phase of the study
E" ectiveness Code Residual Location
Pre - primary
More E" ective PME2 6.17 Metro
More E" ective PME3 5.67 Country
More E" ective PME5 3.86 Metro
More E" ective PME7 3.66 Metro
E" ective PEF1 1.85 Metro
E" ective PEF2 0.91 Country
E" ective PEF3 0.76 Metro
E" ective PEF7 -0.47 Metro
Less E" ective PLE2 -3.09 Country
Less E" ective PLE4 -4.60 Country
Less E" ective PEF5 -4.60 Metro
Year 1
More E" ective 1ME1 6.37 Metro
More E" ective 1ME4 4.51 Metro
More E" ective 1ME6 3.85 Country
E" ective 1EF4 0.45 Metro
E" ective 1EF5 0.40 Country
E" ective 1EF6 -0.13 Metro
Less E" ective 1LE1 -2.53 Metro
Less E" ective 1LE3 -3.94 Country
Note. The teachers have been allocated a code as follows: P or 1 indicate the year level, Pre-Primary or Year 1. ME, EF and LE indicates the
level of e! ectiveness based on the children’s literacy growth; more e! ective, e! ective or less e! ective. The fi nal numeral denotes the ranking
within the e! ectiveness level
All teachers who met these criteria and had been identifi ed as signifi cantly more e! ective or less e! ective were invited to take part in this phase of the project. Also invited were teachers identifi ed as e! ective, that is they had a value-added residual score of between +1 and -1. Some teachers who were invited had moved to other schools, which was often the case for the less e! ective teachers; some were teaching in other year levels or had been promoted out of the classroom within the same school; others did not choose to take part in this phase of the project for a variety of reasons, many perceiving the presence of a video team in their classroom for two to four days too personally demanding or disruptive to the learning processes in their classrooms.
The fi nal sample of teachers for this second phase of the study were located in 11 classrooms that contained Pre-primary children and 8 that contained Year 1 children. Whilst in most of these classrooms there was consistency of age range and teacher, there were some variations. One of the Pre-primary classrooms contained some Year 1 children, another contained
some Kindergarten children, one Year 1 classroom contained some Year Two children and the teaching of one Year 1 class was shared between two teachers. It can be seen in Table 11 that the groups were clearly di! erentiated in terms of their value-added residuals, with the more e! ective teachers having residuals of 3.66 or more, the less e! ective teachers having residuals of -2.53 or less and the e! ective teachers having residuals of between -0.47 and 0.91, with the exception of one teacher who had a residual of 1.85.
The teachers were located in schools that contained children from a range of socio-economic levels (reported in this study in bands from 0-8). Of the 19 teachers, 10 were located in schools with a band of 0-4, and 9 in schools with a band of 5-8. The teachers were located in schools of various sizes. Eleven were in schools that contained between 100 and 499 students and 9 were in schools of between 500 and 999 students. The smallest was a rural District High School that contained just over 100 students from Kindergarten to Year 10.
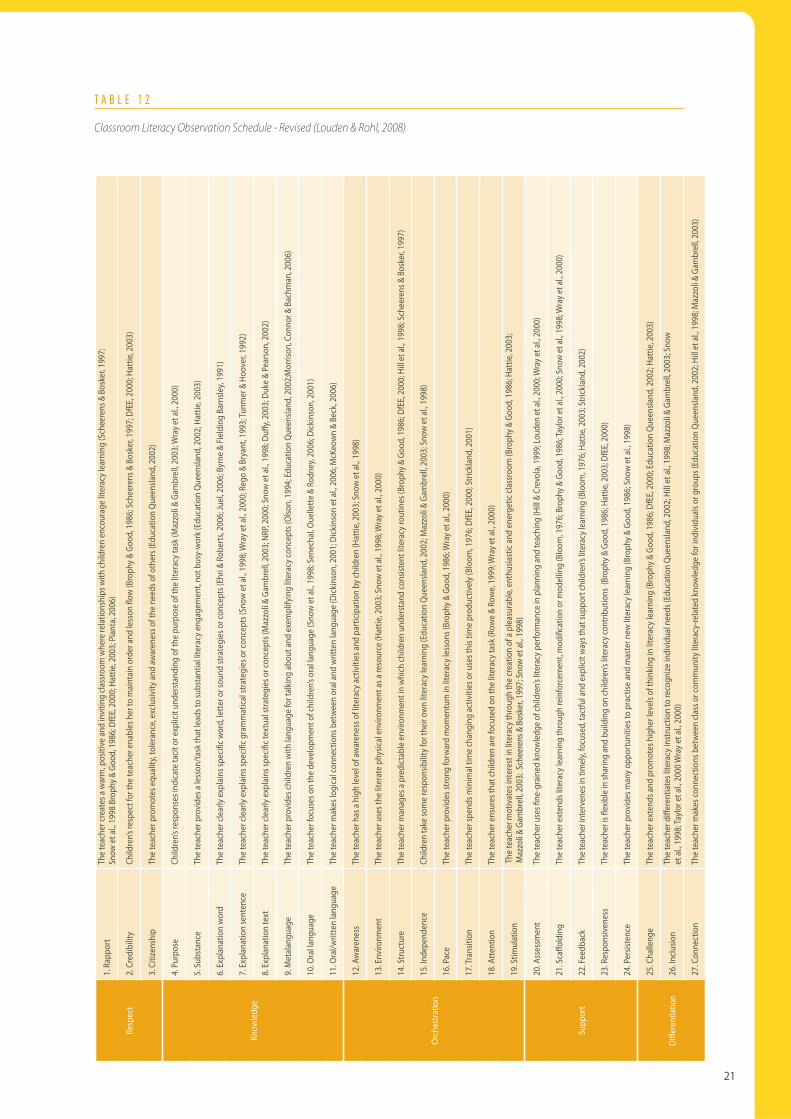
21
Resp
ect
1. R
appo
rtTh
e te
ache
r cre
ates
a w
arm
, pos
itive
and
invi
ting
class
room
whe
re re
latio
nshi
ps w
ith ch
ildre
n en
cour
age
liter
acy l
earn
ing
(Sch
eere
ns &
Bos
ker, 1
997;
Sn
ow e
t al.,
1998
Bro
phy &
Goo
d, 1
986;
DfE
E, 20
00; H
attie
, 200
3; P
iant
a, 20
06)
2. C
redi
bilit
yCh
ildre
n’s re
spec
t for
the
teac
her e
nabl
es h
er to
mai
ntai
n or
der a
nd le
sson
# ow
(Bro
phy &
Goo
d, 1
986;
Sch
eere
ns &
Bos
ker, 1
997;
DfE
E, 20
00; H
attie
, 200
3)
3. C
itize
nshi
pTh
e te
ache
r pro
mot
es e
qual
ity, t
oler
ance
, exc
lusiv
ity an
d aw
aren
ess o
f the
nee
ds o
f oth
ers (
Educ
atio
n Qu
eens
land
, 200
2)
Know
ledg
e
4. P
urpo
seCh
ildre
n’s re
spon
ses i
ndica
te ta
cit o
r exp
licit
unde
rsta
ndin
g of
the
purp
ose
of th
e lit
erac
y tas
k (M
azzo
li & G
ambr
ell, 2
003;
Wra
y et a
l., 20
00)
5. S
ubst
ance
The
teac
her p
rovi
des a
less
on/ta
sk th
at le
ads t
o su
bsta
ntia
l lite
racy
eng
agem
ent,
not b
usy-
wor
k (Ed
ucat
ion
Quee
nslan
d, 2
002;
Hat
tie, 2
003)
6. E
xpla
natio
n w
ord
The
teac
her c
lear
ly e
xpla
ins s
peci!
c w
ord,
lette
r or s
ound
stra
tegi
es o
r con
cept
s (Eh
ri &
Robe
rts, 2
006;
Juel
, 200
6; B
yrne
& Fi
eldi
ng B
arns
ley,
1991
)
7. E
xpla
natio
n se
nten
ceTh
e te
ache
r cle
arly
exp
lain
s spe
ci! c
gra
mm
atica
l stra
tegi
es o
r con
cept
s (Sn
ow e
t al.,
1998
; Wra
y et a
l., 20
00; R
ego
& Br
yant
, 199
3; Tu
nmer
& H
oove
r, 199
2)
8. E
xpla
natio
n te
xtTh
e te
ache
r cle
arly
exp
lain
s spe
ci! c
text
ual s
trate
gies
or c
once
pts (
Maz
zoli &
Gam
brel
l, 200
3; N
RP, 2
000;
Sno
w e
t al.,
1998
; Du"
y, 2
003;
Duk
e &
Pear
son,
200
2)
9. M
etal
angu
age
The
teac
her p
rovi
des c
hild
ren
with
lang
uage
for t
alki
ng ab
out a
nd e
xem
plify
ing
liter
acy c
once
pts (
Olso
n, 1
994;
Educ
atio
n Qu
eens
land
, 200
2;M
orris
on, C
onno
r & B
achm
an, 2
006)
10. O
ral la
ngua
geTh
e te
ache
r foc
uses
on
the
deve
lopm
ent o
f chi
ldre
n’s o
ral la
ngua
ge (S
now
et a
l., 19
98; S
enec
hal, O
uelle
tte &
Rod
ney,
2006
; Dick
inso
n, 2
001)
11. O
ral/w
ritte
n la
ngua
geTh
e te
ache
r mak
es lo
gica
l con
nect
ions
bet
wee
n or
al an
d w
ritte
n la
ngua
ge (D
ickin
son,
200
1; D
ickin
son
et al
., 200
6; M
cKeo
wn
& Be
ck, 2
006)
Orch
estra
tion
12. A
war
enes
sTh
e te
ache
r has
a hi
gh le
vel o
f aw
aren
ess o
f lite
racy
activ
ities
and
parti
cipat
ion
by ch
ildre
n (H
attie
, 200
3; S
now
et a
l., 19
98)
13. E
nviro
nmen
tTh
e te
ache
r use
s the
liter
ate
phys
ical e
nviro
nmen
t as a
reso
urce
(Hat
tie, 2
003;
Sno
w e
t al.,
1998
; Wra
y et a
l., 20
00)
14. S
truct
ure
The
teac
her m
anag
es a
pred
ictab
le e
nviro
nmen
t in
whi
ch ch
ildre
n un
ders
tand
cons
isten
t lite
racy
rout
ines
(Bro
phy &
Goo
d, 1
986;
DfE
E, 20
00; H
ill et
al., 1
998;
Sch
eere
ns &
Bos
ker, 1
997)
15. In
depe
nden
ceCh
ildre
n ta
ke so
me
resp
onsib
ility
for t
heir
own
liter
acy l
earn
ing
(Edu
catio
n Qu
eens
land
, 200
2; M
azzo
li & G
ambr
ell, 2
003;
Sno
w et
al., 1
998)
16. P
ace
The
teac
her p
rovi
des s
trong
forw
ard
mom
entu
m in
liter
acy l
esso
ns (B
roph
y & G
ood,
198
6; W
ray e
t al.,
2000
)
17. T
rans
ition
The
teac
her s
pend
s min
imal
tim
e ch
angi
ng ac
tiviti
es o
r use
s thi
s tim
e pr
oduc
tivel
y (Bl
oom
, 197
6; D
fEE,
2000
; Stri
ckla
nd, 2
001)
18. A
ttent
ion
The
teac
her e
nsur
es th
at ch
ildre
n ar
e fo
cuse
d on
the
liter
acy t
ask (
Row
e &
Row
e, 19
99; W
ray e
t al.,
2000
)
19. S
timul
atio
n Th
e te
ache
r mot
ivat
es in
tere
st in
liter
acy t
hrou
gh th
e cr
eatio
n of
a pl
easu
rabl
e, en
thus
iast
ic an
d en
erge
tic cl
assr
oom
(Bro
phy &
Goo
d, 1
986;
Hat
tie, 2
003;
Maz
zoli &
Gam
brel
l, 200
3; S
chee
rens
& B
oske
r, 199
7; S
now
et a
l., 19
98)
Supp
ort
20. A
sses
smen
tTh
e te
ache
r use
s ! n
e-gr
aine
d kn
owle
dge
of ch
ildre
n’s lit
erac
y per
form
ance
in p
lann
ing
and
teac
hing
(Hill
& Cr
evol
a, 19
99; L
oude
n et
al., 2
000;
Wra
y et a
l., 20
00)
21. S
ca" o
ldin
gTh
e te
ache
r ext
ends
liter
acy l
earn
ing
thro
ugh
rein
forc
emen
t, m
odi!
catio
n or
mod
ellin
g (B
loom
, 197
6; B
roph
y & G
ood,
198
6; Ta
ylor e
t al.,
2000
; Sno
w e
t al.,
1998
; Wra
y et a
l., 20
00)
22. F
eedb
ack
The
teac
her i
nter
vene
s in
timel
y, fo
cuse
d, ta
ctfu
l and
exp
licit
way
s tha
t sup
port
child
ren’s
liter
acy l
earn
ing
(Blo
om, 1
976;
Hat
tie, 2
003;
Stric
klan
d, 2
002)
23. R
espo
nsiv
enes
sTh
e te
ache
r is #
exib
le in
shar
ing
and
build
ing
on ch
ildre
n’s lit
erac
y con
tribu
tions
(Bro
phy &
Goo
d, 1
986;
Hat
tie, 2
003;
DfE
E, 20
00)
24. P
ersis
tenc
eTh
e te
ache
r pro
vide
s man
y opp
ortu
nitie
s to
prac
tise
and
mas
ter n
ew lit
erac
y lea
rnin
g (B
roph
y & G
ood,
198
6; S
now
et a
l., 19
98)
Di" e
rent
iatio
n
25. C
halle
nge
The
teac
her e
xten
ds an
d pr
omot
es h
ighe
r lev
els o
f thi
nkin
g in
liter
acy l
earn
ing
(Bro
phy &
Goo
d, 1
986;
DfE
E, 20
00; E
duca
tion
Quee
nsla
nd, 2
002;
Hat
tie, 2
003)
26. In
clusio
nTh
e te
ache
r di"
eren
tiate
s lite
racy
inst
ruct
ion
to re
cogn
ize in
divi
dual
nee
ds (E
duca
tion
Quee
nsla
nd, 2
002;
Hill
et a
l., 19
98; M
azzo
li & G
ambr
ell, 2
003;
Sno
w
et al
., 199
8; Ta
ylor
et a
l., 20
00 W
ray e
t al.,
2000
)
27. C
onne
ctio
nTh
e te
ache
r mak
es co
nnec
tions
bet
wee
n cla
ss o
r com
mun
ity lit
erac
y-re
late
d kn
owle
dge
for i
ndiv
idua
ls or
gro
ups (
Educ
atio
n Qu
eens
land
, 200
2; H
ill e
t al.,
1998
; Maz
zoli &
Gam
brel
l, 200
3)
T A B L E 1 2
Classroom Literacy Observation Schedule - Revised (Louden & Rohl, 2008)
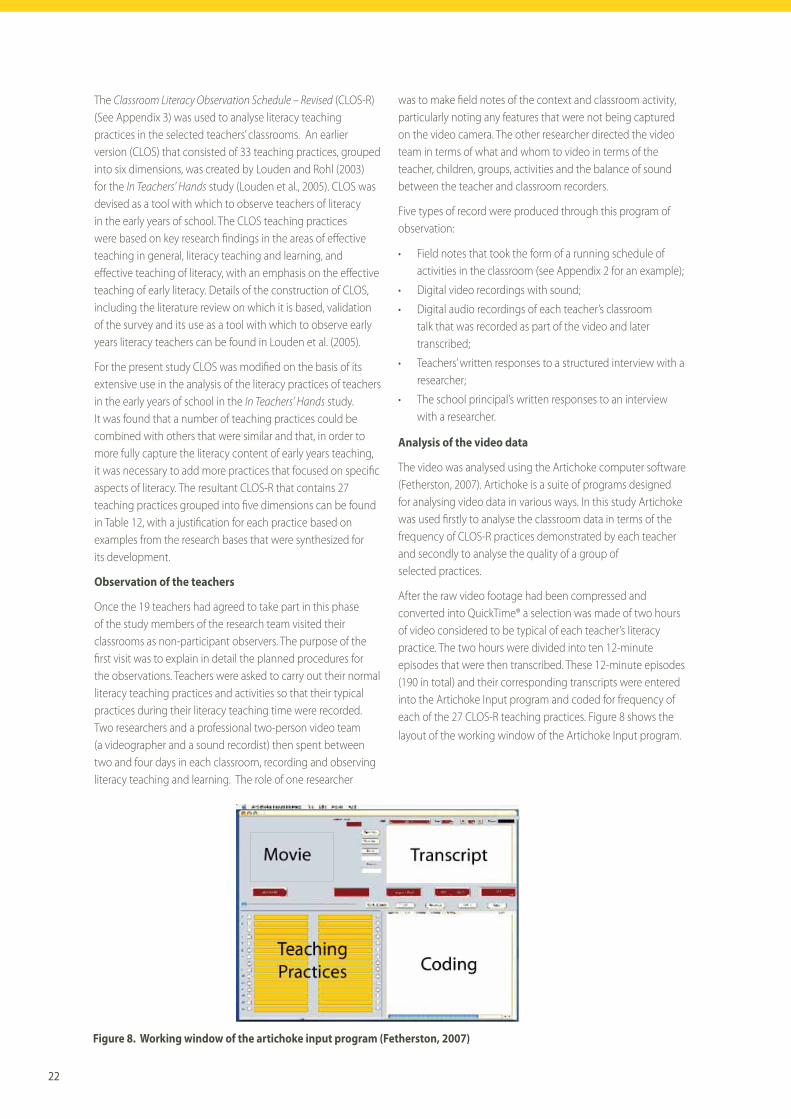
22
The Classroom Literacy Observation Schedule – Revised (CLOS-R) (See Appendix 3) was used to analyse literacy teaching practices in the selected teachers’ classrooms. An earlier version (CLOS) that consisted of 33 teaching practices, grouped into six dimensions, was created by Louden and Rohl (2003) for the In Teachers’ Hands study (Louden et al., 2005). CLOS was devised as a tool with which to observe teachers of literacy in the early years of school. The CLOS teaching practices were based on key research fi ndings in the areas of e! ective teaching in general, literacy teaching and learning, and e! ective teaching of literacy, with an emphasis on the e! ective teaching of early literacy. Details of the construction of CLOS, including the literature review on which it is based, validation of the survey and its use as a tool with which to observe early years literacy teachers can be found in Louden et al. (2005).
For the present study CLOS was modifi ed on the basis of its extensive use in the analysis of the literacy practices of teachers in the early years of school in the In Teachers’ Hands study. It was found that a number of teaching practices could be combined with others that were similar and that, in order to more fully capture the literacy content of early years teaching, it was necessary to add more practices that focused on specifi c aspects of literacy. The resultant CLOS-R that contains 27 teaching practices grouped into fi ve dimensions can be found in Table 12, with a justifi cation for each practice based on examples from the research bases that were synthesized for its development.
Observation of the teachers
Once the 19 teachers had agreed to take part in this phase of the study members of the research team visited their classrooms as non-participant observers. The purpose of the fi rst visit was to explain in detail the planned procedures for the observations. Teachers were asked to carry out their normal literacy teaching practices and activities so that their typical practices during their literacy teaching time were recorded. Two researchers and a professional two-person video team (a videographer and a sound recordist) then spent between two and four days in each classroom, recording and observing literacy teaching and learning. The role of one researcher
was to make fi eld notes of the context and classroom activity, particularly noting any features that were not being captured on the video camera. The other researcher directed the video team in terms of what and whom to video in terms of the teacher, children, groups, activities and the balance of sound between the teacher and classroom recorders.
Five types of record were produced through this program of observation:
• Field notes that took the form of a running schedule of activities in the classroom (see Appendix 2 for an example);
• Digital video recordings with sound;
• Digital audio recordings of each teacher’s classroom talk that was recorded as part of the video and later transcribed;
• Teachers’ written responses to a structured interview with a researcher;
• The school principal’s written responses to an interview with a researcher.
Analysis of the video data
The video was analysed using the Artichoke computer software (Fetherston, 2007). Artichoke is a suite of programs designed for analysing video data in various ways. In this study Artichoke was used fi rstly to analyse the classroom data in terms of the frequency of CLOS-R practices demonstrated by each teacher and secondly to analyse the quality of a group of selected practices.
After the raw video footage had been compressed and converted into QuickTime® a selection was made of two hours of video considered to be typical of each teacher’s literacy practice. The two hours were divided into ten 12-minute episodes that were then transcribed. These 12-minute episodes (190 in total) and their corresponding transcripts were entered into the Artichoke Input program and coded for frequency of each of the 27 CLOS-R teaching practices. Figure 8 shows the layout of the working window of the Artichoke Input program.
Figure 8. Working window of the artichoke input program (Fetherston, 2007)

23
Coding of the video data
Four members of the research team, who were all experienced in the teaching of literacy in the early years, were involved in coding the 190 video episodes. All four researchers coded six episodes in a pilot-coding phase that was continued until 90% inter-rater agreement was consistently reached. Each subsequent episode was coded by two of the team working together, and inter-rater reliability checks were undertaken regularly, with 28 episodes cross-coded. Overall inter-rater reliability was 94% agreement and all cross-coded episodes were discussed by the team and amendments to coding, where necessary, were made by agreement of at least three team members.
Reliability of coding was facilitated by the consistent use of a coding manual (see Appendix 3). This contained an expanded defi nition of each of the 27 practices in CLOS-R and provided key indicators for each teaching practice along with examples of what that teaching practice could look like in the classroom. These examples were based on teaching practices coded for the In Teachers’ Hands study, either from the initial data coding or from examples coded for the project website. For the Knowledge dimension practices that were added to CLOS-R, examples were taken from the pilot coding and from previous studies of literacy teaching (for example Wray et al., 2000). Most of these indicators refer to teacher behaviour, although some refer to the behaviour of the children. The manual allowed members of the research team to develop a common understanding of teaching practices in both Year 1 and Pre-primary classrooms. As three of the team members had extensive personal experience of Kindergarten and Pre-primary teaching in WA, it was possible to take account of the teaching practices of WA early years teachers and of the developmental levels of children in the Pre-primary year. The manual was constantly referred to during coding and analysis in order to maintain a clear understanding of each teaching practice that ensured consistency in coding amongst members of the research team and across teachers.
During the coding process discussions were held amongst the research team and minor changes to the manual were made in order to clarify teaching practice defi nitions. Any new examples that at least two researchers agreed should be included in the manual were discussed by the team and added when all were satisfi ed that the example fulfi lled the specifi ed criteria.
2 . 3 Q U A N T I T A T I V E F I N D I N G S F R O M T H E C L O S - R O B S E R V A T I O N A L D A T A
In order to explore the quantitative relationship between teachers’ classroom practices and the observational data from their classrooms, an examination was made of the mean CLOS-R scores for the groups of teachers classifi ed as more e! ective, e! ective and less e! ective. Table 13 shows the mean CLOS-R scores out of a total possible score of 270 for each of the three groups of teachers.
T A B L E 1 3
Means and standard deviations for CLOS-R scores by teacher group
Teacher group
Mean SD
More e" ective 233.71 9.83
E" ective 143.43 48.85
Less e" ective 77.20 28.23
A one-way ANOVA indicated a signifi cant di! erence between the means of the groups (p=0.015, df=2). The one way ANOVA post-hoc contrasts indicated signifi cant di! erences between the means of the less e! ective and e! ective teachers (p=0.043) and the e! ective and more e! ective teachers (p=0.007). Homogeneity of variance was not assumed in these post-hoc tests of signifi cance.
Teachers had been classifi ed into three groups on the basis of the literacy growth of children in their classrooms. The observations made using CLOS-R enabled measurement of the teaching practices of each teacher. The Rasch (1960) measurement model was used to establish whether interval-level measurements could be obtained from the CLOS-R data as measurements were available for two variables, that is, for student growth and teacher behaviours.
This strategy was able to ascertain whether there was a correlation between the teacher behaviours as measured using CLOS-R, and student growth as measured by LLANS assessments. This made it possible to establish whether there was a relationship between the variables based on the measurements of individual teachers and to ascertain the nature of possible relationships.
With this analysis strategy employed, the data showed a very good fi t to a simple linear regression line of best fi t. The Pearson product-moment correlation was r = 0.93. The evidence therefore indicated a strong, and approximately linear, relationship between teaching practices and student growth.
More specifi cally, the correlation was computed between teaching practices and residuals from the hierarchical modelling of student growth data. The correlation implies that variance of the measurements of teaching practices accounts for the majority of variance of the residuals from the hierarchical modelling. That is, variation in teaching practices accounts for the majority of variance in student growth that was not accounted for by other variables used in the hierarchical modelling of the growth data. Specifi cally, variation in teaching practices accounts for approximately 0.87 of the variance among these residuals.

24
Because the teachers were purposely selected into three groups, greater variance among the teachers’ e! ectiveness would be expected than if the teachers had been selected at random. Correlation is computed based on covariance and higher covariance between two variables is possible when the variance is itself higher. Therefore, a smaller correlation is likely to exist among all teachers and it is not possible to infer a correlation for the larger population of teachers from the correlation reported above.
On the other hand, however, measurement error limits the possible variance among the residuals that can be accounted for by measurements of teacher e! ectiveness based on observations of practices. This means that the actual correlation for the selected teachers is even higher than the reported correlation. Further work would be required to establish more accurately the correlation across all teachers. Clearly though, the very high observed correlation is unlikely to have been found unless there was a more general relationship.
Rasch modelling of CLOS-R observational data
The Rasch model was used to establish whether the CLOS-R data could be used to establish an interval-level measurement scale of the quality of teaching practice based on observations of the specifi c practices. The observational data fi tted the model well, indicating that it was possible to obtain such measurements.
The separation index for the Rasch modelling was 0.92. This is directly analogous to the traditional Cronbach’s alpha, and generally of very similar magnitude (Andrich, 1982). Each practice was treated in the analysis as an item. Each episode
for each teacher was treated as a case and the data was comprehensively examined to determine whether or not each practice was evident in each episode. This made it possible to construct an interval-level scale of measurements of episodes. The mean of the measurements of episodes, for a given teacher, was treated as the overall measurement of a given teacher’s practices.
An alternative and more refi ned analysis was also undertaken, in which scores were summed across episodes for each teacher. This analysis accounted for the greater dependence of data across episodes for each teacher than between teachers. The estimated scale locations for teachers from this analysis correlated almost perfectly with the mean estimates from the fi rst analysis, indicating either was appropriate for use in the research.
It will be seen in Table 14 that the tests of fi t indicated there was generally strong fi t to the Rasch model for most items. Based on the Chi-square test of fi t reported by RUMM2020, the worst fi tting item was Environment (Item 13). Independence (Item 15) and Transition (Item 17) also had somewhat poor fi t. In all three cases, the items discriminated relatively weakly, which would tend to reduce the separation somewhat. The majority of items had acceptable fi t residuals, which are log-transformed forms of the Outfi t statistic, or mean-squared standardised residual. The exceptions were generally highly discriminating items such as Substance (Item 5), Awareness (Item 12), Pace (Item 16) and Sca! olding (Item 21), all of which had fi t residuals less than -2.5. Nevertheless, the anomalies had a relatively small impact on the estimates used for the purpose of this research, and generally the fi t of data to the Rasch model was sound.
8
6
4
2
0
-2
-4
-6-3 -2 -1 0 1 2 3 4
HLM
Teac
hing
for G
row
th R
esid
ual
CLOS-R Teacher E!ectiveness
y = 1.7888x - 0.1304R" = 0.8657
Figure 9: Linear regression between ClOS-R measurements and hierarchical modelling standardised residuals
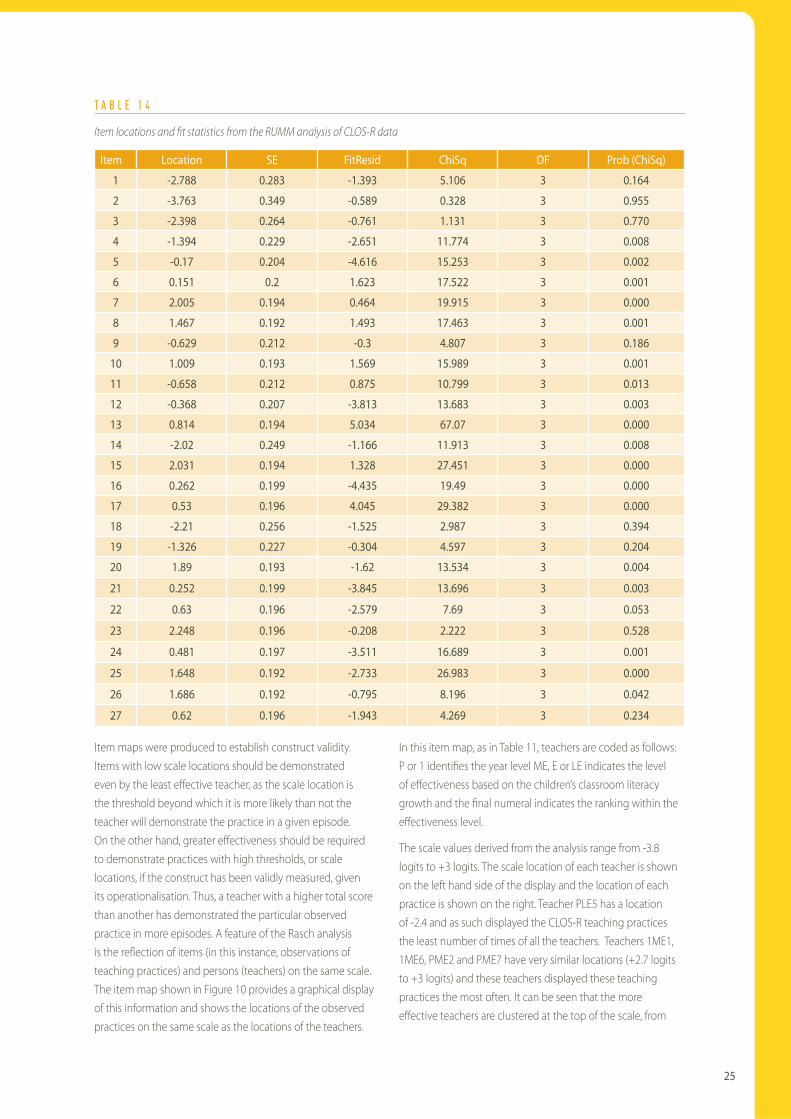
25
Item maps were produced to establish construct validity. Items with low scale locations should be demonstrated even by the least e! ective teacher, as the scale location is the threshold beyond which it is more likely than not the teacher will demonstrate the practice in a given episode. On the other hand, greater e! ectiveness should be required to demonstrate practices with high thresholds, or scale locations, if the construct has been validly measured, given its operationalisation. Thus, a teacher with a higher total score than another has demonstrated the particular observed practice in more episodes. A feature of the Rasch analysis is the refl ection of items (in this instance, observations of teaching practices) and persons (teachers) on the same scale. The item map shown in Figure 10 provides a graphical display of this information and shows the locations of the observed practices on the same scale as the locations of the teachers.
In this item map, as in Table 11, teachers are coded as follows: P or 1 identifi es the year level ME, E or LE indicates the level of e! ectiveness based on the children’s classroom literacy growth and the fi nal numeral indicates the ranking within the e! ectiveness level.
The scale values derived from the analysis range from -3.8 logits to +3 logits. The scale location of each teacher is shown on the left hand side of the display and the location of each practice is shown on the right. Teacher PLE5 has a location of -2.4 and as such displayed the CLOS-R teaching practices the least number of times of all the teachers. Teachers 1ME1, 1ME6, PME2 and PME7 have very similar locations (+2.7 logits to +3 logits) and these teachers displayed these teaching practices the most often. It can be seen that the more e! ective teachers are clustered at the top of the scale, from
T A B L E 1 4
Item locations and fi t statistics from the RUMM analysis of CLOS-R data
Item Location SE FitResid ChiSq DF Prob (ChiSq)
1 -2.788 0.283 -1.393 5.106 3 0.164
2 -3.763 0.349 -0.589 0.328 3 0.955
3 -2.398 0.264 -0.761 1.131 3 0.770
4 -1.394 0.229 -2.651 11.774 3 0.008
5 -0.17 0.204 -4.616 15.253 3 0.002
6 0.151 0.2 1.623 17.522 3 0.001
7 2.005 0.194 0.464 19.915 3 0.000
8 1.467 0.192 1.493 17.463 3 0.001
9 -0.629 0.212 -0.3 4.807 3 0.186
10 1.009 0.193 1.569 15.989 3 0.001
11 -0.658 0.212 0.875 10.799 3 0.013
12 -0.368 0.207 -3.813 13.683 3 0.003
13 0.814 0.194 5.034 67.07 3 0.000
14 -2.02 0.249 -1.166 11.913 3 0.008
15 2.031 0.194 1.328 27.451 3 0.000
16 0.262 0.199 -4.435 19.49 3 0.000
17 0.53 0.196 4.045 29.382 3 0.000
18 -2.21 0.256 -1.525 2.987 3 0.394
19 -1.326 0.227 -0.304 4.597 3 0.204
20 1.89 0.193 -1.62 13.534 3 0.004
21 0.252 0.199 -3.845 13.696 3 0.003
22 0.63 0.196 -2.579 7.69 3 0.053
23 2.248 0.196 -0.208 2.222 3 0.528
24 0.481 0.197 -3.511 16.689 3 0.001
25 1.648 0.192 -2.733 26.983 3 0.000
26 1.686 0.192 -0.795 8.196 3 0.042
27 0.62 0.196 -1.943 4.269 3 0.234
26
logit locations 2.1 to 3. Three of the less e! ective teachers are clustered at the bottom of the scale, in logit locations -2.4 to -1.8 with the other two teachers in this group at locations -1 and -0.5. The e! ective teachers have a much wider spread of locations on the scale with two of them near the more e! ective teachers at locations 1.8 and 1.9 and the rest from -0.1 to -1.2.
In terms of teaching practices, Credibility has a location of -3.8 logits and was the teaching practice most frequently observed, whereas the least observed practices of Explanation Sentence, Independence and Responsiveness have locations of +2 logits and +2.2 logits respectively.
When the scale locations of the teaching practices are considered in conjunction with the evidence of student growth, it appears that there is in e! ect a continuum of development in teaching practices. Based on the CLOS-R data, the practices of Credibility and Rapport are low-level practices (in that all teachers demonstrated them in some episodes) and the practices of Responsiveness, Explanation Sentence and Independence are high-level practices that fewer teachers incorporated into their teaching. It can seen that the teachers whose students showed the most literacy growth demonstrated all the teaching practices, including the high level practices, more often than the teachers whose students made limited growth.
Correlations between person-item residuals were inspected to further establish construct validity by
interrogating the data for evidence of multidimensionality. The analyses of person-item residuals confi rmed a somewhat greater relationship between items pertaining to the ‘Respect’ dimension.
The evidence obtained from Rasch modelling therefore indicates that in addition to internal consistency evident from the separation index, the construct was also valid. Clearly, the separation and validity established through the analyses would be expected, given the strong correlation between these measurements and the residuals from the hierarchical modelling of growth data.
In order to illustrate the information about an individual teacher that can be derived from the Rasch analysis, it is appropriate to look at what it means for teacher 1EF6 (see Figure 10). This Year 1 e! ective teacher has approximately a 50% probability of incorporating the teaching practice of Substance into her lessons, an increasingly higher probability of using the practices that have a lower scale location than her own, and a decreasingly lower probability of using the practices that have a higher location than hers. She has a somewhat lower than 50% probability of focusing explicitly on word level concepts and skills, providing sca! olding for children and adjusting the pace of her lessons. It is least probable that she will demonstrate teaching based on assessment, providing sentence-level explanations, teaching for independence in literacy learning and responding fl exibly to children’s literacy contributions.

27
Teachers Teaching practices1ME1 31ME6 2.9PME2 2.8PME7 2.7
2.6PME3 2.51ME4 2.4
2.32.2 Responsiveness
PME5 2.12 Explanation Sentence Independence
PEF1 1.9 AssessmentPEF3 1.8
1.7 Inclusion1.6 Challenge1.5 Explanation Text1.41.31.21.11 Oral language
0.90.8 Environment0.70.6 Feedback Connection0.5 Transition Persistence0.40.3 Pace Sca" olding0.2 Explanation Word0.10
1EF6 -0.1-0.2 Substance Structure
1EF5 -0.31EF4 -0.4 Awareness1LE1 -0.5PEF2 -0.6 Metalanguage
-0.7 Oral - Written Language-0.8-0.9
PLE2 -1-1.1
PEF7 -1.2-1.3 Stimulation-1.4 Purpose-1.5-1.6-1.7
PLE4 -1.8-1.9
1LE3 -2-2.1-2.2 Attention-2.3
PLE5 -2.4 Citizenship-2.5-2.6-2.7-2.8 Rapport-2.9-3
-3.1-3.2-3.3-3.4-3.5-3.6-3.7-3.8 Credibility
Key
1 = Year 1
P = Pre-primary
ME = More e" ective
EF = E" ective
LE = Less e" ective
Figure 10. Item map showing locations of teachers and CLOS-R teaching practices
Note * ME, EF and LE are derived from the students’ performance and not from this analysis
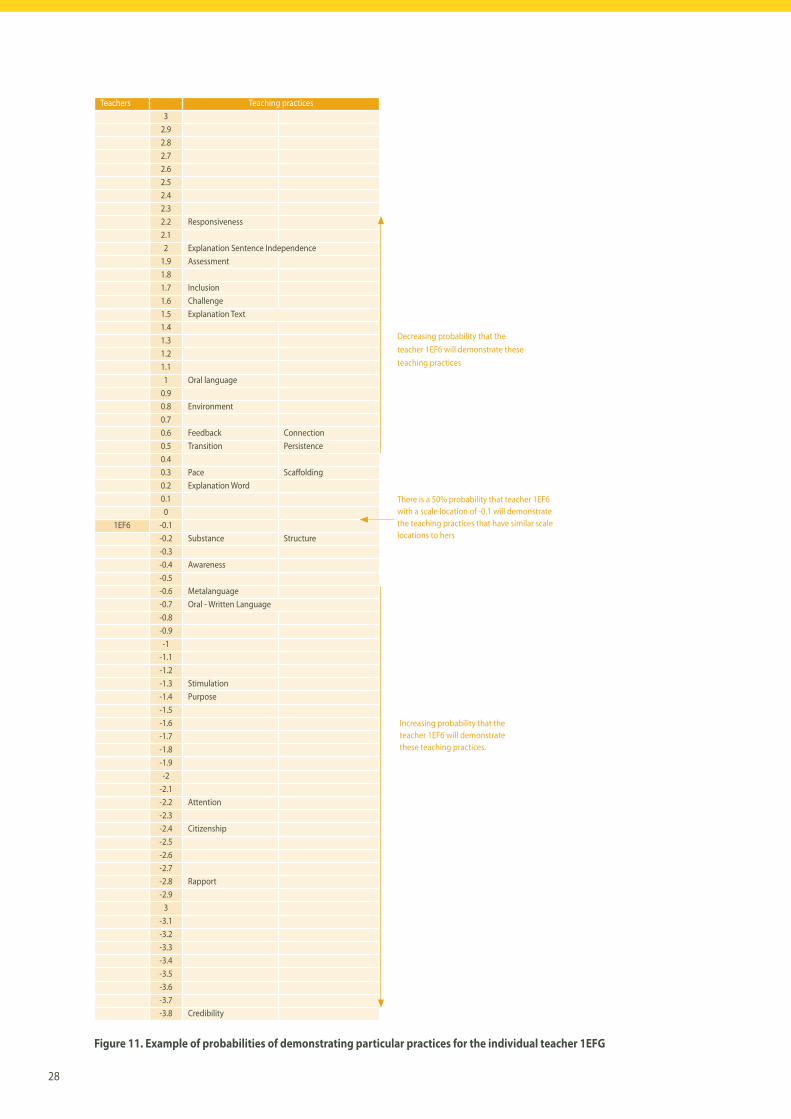
28
Teachers Teaching practices3
2.92.82.72.62.52.42.32.2 Responsiveness2.12 Explanation Sentence Independence
1.9 Assessment1.81.7 Inclusion1.6 Challenge1.5 Explanation Text1.41.31.21.11 Oral language
0.90.8 Environment0.70.6 Feedback Connection0.5 Transition Persistence0.40.3 Pace Sca" olding0.2 Explanation Word0.10
1EF6 -0.1-0.2 Substance Structure-0.3-0.4 Awareness-0.5-0.6 Metalanguage-0.7 Oral - Written Language-0.8-0.9-1
-1.1-1.2-1.3 Stimulation-1.4 Purpose-1.5-1.6-1.7-1.8-1.9-2
-2.1-2.2 Attention-2.3-2.4 Citizenship-2.5-2.6-2.7-2.8 Rapport-2.9
3-3.1-3.2-3.3-3.4-3.5-3.6-3.7-3.8 Credibility
Figure 11. Example of probabilities of demonstrating particular practices for the individual teacher 1EFG
There is a 50% probability that teacher 1EF6 with a scale location of -0.1 will demonstrate the teaching practices that have similar scale locations to hers
Decreasing probability that the teacher 1EF6 will demonstrate these teaching practices
Increasing probability that the teacher 1EF6 will demonstrate these teaching practices.
29
2 . 4 S U M M A R Y
The classroom observation phase of the study used a revised version of the classroom Literacy Observation Scale, CLOS-R, to explore the relationship between value-added estimates of student growth and teachers’ classroom literacy teaching practices. CLOS-R di! ers from CLOS (Louden & Rohl, 2003) in that it includes additional practices appropriate to the Pre-primary context (such as oral language), and the consolidation of CLOS practices that the empirical experience of In Teachers’ Hands suggested should be combined.
Rasch analysis showed the CLOS-R scale to have excellent psychometric properties in terms of its validity and reliability. A new coding manual was developed (see Appendix 3), to ensure high inter-rater reliability across coded video episodes.
A one-way ANOVA indicated statistically signifi cant di! erences between the CLOS-R scores of the more e! ective, e! ective and less e! ective groups, suggesting that teachers grouped on the basis of children’s high, average or low growth in literacy scores can be expected to demonstrate more or less of the teaching practices measured by CLOS-R .
A Rasch analysis of the correlation between the teaching behaviours measured by CLOS-R and student growth in literacy measured by LLANS literacy assessments showed a very good fi t to a simple linear regression line of best fi t (a Pearson product-moment correlation of r = 0.93). That is, the study has demonstrated a strong and approximately linear relationship between teaching practices and student growth.
Further, an analysis of the correlation between teaching practices and residuals from the hierarchical modelling of student growth data indicated that variation in teaching practices accounted for the majority of variance in student growth that was not accounted for by prior performance, disability, interruption to learning or relative attentiveness. This analysis estimated that variation in teaching practices accounts for approximately 0.87 of the variance among
these residuals. This proportion of variance may be thought an over-estimate on the grounds that teachers were selected to represent three groups rather than being randomly sampled; alternatively, the proportion of variance may be thought to be an under-estimate on the grounds that, in principle, measurement error must limit the amount of variance that can be explained by observations of practice.
Rasch modelling of the CLOS-R data confi rmed that the CLOS-R data can be used to produce an interval-level measurement scale. The separation index was 0.92, indicating that the data fi tted the model well. A more refi ned analysis of the same data, in which scores were summed across episodes for each teacher correlated almost perfectly with the former analysis, indicating that either was appropriate for use in the research. The Chi-square test of fi t reported by RUMM2020 indicated a sound level of fi t between the CLOS-R data and the Rasch model.
Substantively, analysis of the CLOS-R data in conjunction with the evidence of student growth suggests that there is a continuum of development in teaching practices. There are some low-level practices that all teachers demonstrated to some extent, some that many teachers demonstrated from time to time, and some that only teachers with the highest student growth scores demonstrated in their classrooms. Prospectively, then, if the educational goal is to improve rates for student growth in literacy, the path to improvement seems to be to increase teachers’ capacity to use the teaching practices associated with moderate-growth and high-growth literacy achievement.
A selection of these practices, and the di! erences among the ways in which teachers used them, are the subject of Phase 3 of this study.
30
3 . L I T E R A C Y P H A S E 3 : C L A S S R O O M O B S E R V A T I O N - Q U A L I T A T I V E A N A L Y S I S
3 . 1 A I M S
This section of the report addresses the qualitative relationship between teacher e! ectiveness and classroom practice. It describes the methodology of pair-wise analysis that was chosen to provide a highly innovative and structured approach to qualitative analysis, and the selection of particular CLOS-R practices that were analysed in detail. It then describes the qualitative scales that were developed for each of these selected practices, with annotated examples from teachers located at various levels on each scale. The implications of the results of these analyses are interpreted in terms of suggestions of ways in which teachers may develop and extend their classroom practice.
The following questions are addressed:
• Are there qualitative di! erences in teachers’ use of the literacy practices: Oral Language, Explanation Word, Explanation Sentence, Explanation Text, Oral/Written Language and Metalanguage?
• Can a scale for each literacy practice be developed to show the range from less e! ective implementation of the practice to highly e! ective implementation of the practice?
• What is the relationship between the quality of implementation of each practice and student growth?
• Can information such as this provide detailed understandings about what constitutes more e! ective teaching?
3 . 2 M E T H O D O L O G Y
Results of the quantitative CLOS–R analyses allowed examination of the frequency of observed literacy teaching practices used by more e! ective, e! ective and less e! ective teachers. In order to examine qualitative as well as quantitative di! erences between teachers in their implementation of particular teaching practices we undertook additional analyses. The In Teachers’ Hands report had provided some preliminary information about the overall quality of CLOS teaching practices. For this study it was decided to make more detailed qualitative analyses of practices from one dimension of CLOS-R. The chosen dimension was Knowledge, as the Knowledge practices have a specifi c focus on the content of literacy teaching and they have been expanded from the original version of CLOS that was used in the analysis of the In
Teachers’ Hands study. The practices selected for detailed qualitative analysis were Explanation Word, Explanation
Text and Metalanguage that were in the original CLOS, and Explanation Sentence, Oral Language and Oral/Written Language that are additional in CLOS-R. The methodology of pair-wise analysis was chosen in order to make a fi ne-grained analysis of these practices that allowed for exploration of the question of possible di! erences between groups of teachers identifi ed as more e! ective, e! ective and less e! ective, in terms of the quality of particular observed literacy teaching practices.
3 . 3 P A I R - W I S E C O M P A R I S O N S O F L I T E R A C Y T E A C H I N G P R A C T I C E S
The methodology of pair-wise comparisons is derived from a method originally conceived and articulated by Thurstone (1927) that has not been widely used in education, and to the researchers’ knowledge, not with video data as the stimuli. This methodology was used to develop a scale for each selected practice as it was hypothesised that if it were possible to develop such scales, it would be possible to examine qualitative di! erences between the ways in which teachers implement the literacy teaching practices. Accordingly, pair-wise data were collected from judges’ comparisons of pairs of teachers’ performances in relation to each selected teaching practice. Judges recorded the performance perceived as the ‘better’ in each pair.
All episodes that had been coded as containing the selected practices were inspected. Table 15 shows the frequency for each teacher across the 10 coded episodes for each of these practices. It will be seen that some teachers did not demonstrate some of the practices, in which case these teachers could not be included in the analysis for these particular practices.
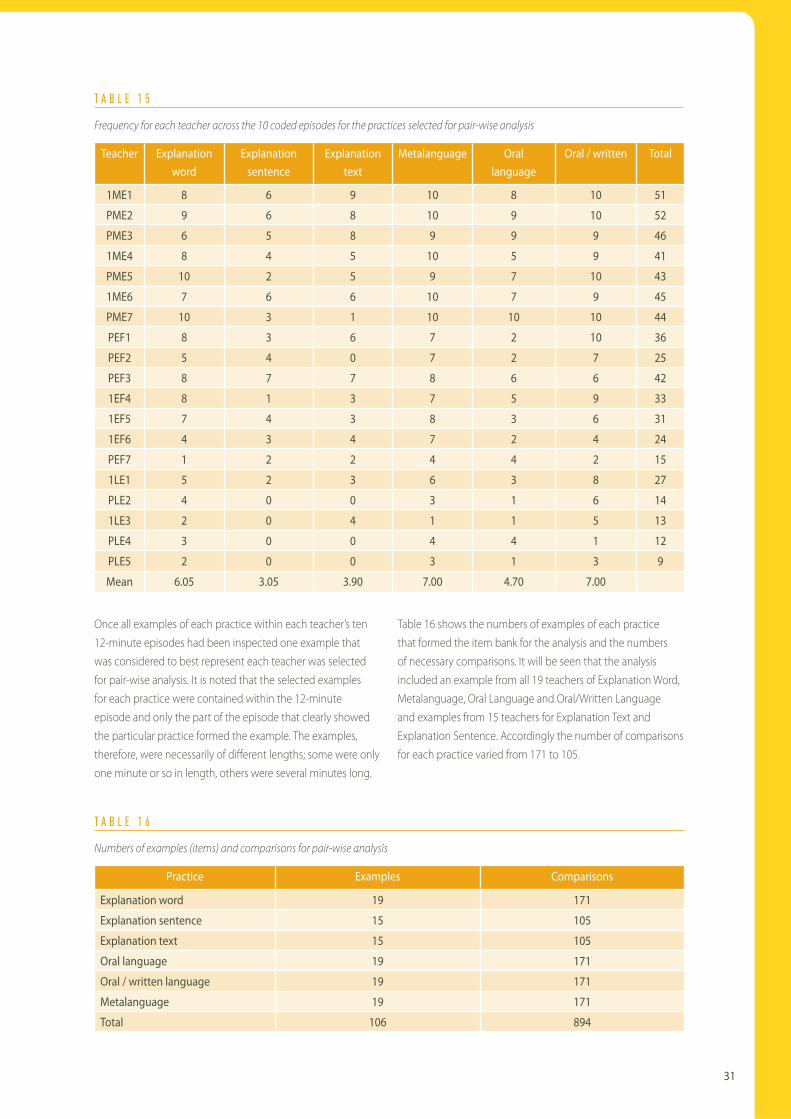
31
T A B L E 1 5
Frequency for each teacher across the 10 coded episodes for the practices selected for pair-wise analysis
Teacher Explanation word
Explanation sentence
Explanation text
Metalanguage Oral language
Oral / written Total
1ME1 8 6 9 10 8 10 51
PME2 9 6 8 10 9 10 52
PME3 6 5 8 9 9 9 46
1ME4 8 4 5 10 5 9 41
PME5 10 2 5 9 7 10 43
1ME6 7 6 6 10 7 9 45
PME7 10 3 1 10 10 10 44
PEF1 8 3 6 7 2 10 36
PEF2 5 4 0 7 2 7 25
PEF3 8 7 7 8 6 6 42
1EF4 8 1 3 7 5 9 33
1EF5 7 4 3 8 3 6 31
1EF6 4 3 4 7 2 4 24
PEF7 1 2 2 4 4 2 15
1LE1 5 2 3 6 3 8 27
PLE2 4 0 0 3 1 6 14
1LE3 2 0 4 1 1 5 13
PLE4 3 0 0 4 4 1 12
PLE5 2 0 0 3 1 3 9
Mean 6.05 3.05 3.90 7.00 4.70 7.00
Once all examples of each practice within each teacher’s ten 12-minute episodes had been inspected one example that was considered to best represent each teacher was selected for pair-wise analysis. It is noted that the selected examples for each practice were contained within the 12-minute episode and only the part of the episode that clearly showed the particular practice formed the example. The examples, therefore, were necessarily of di! erent lengths; some were only one minute or so in length, others were several minutes long.
Table 16 shows the numbers of examples of each practice that formed the item bank for the analysis and the numbers of necessary comparisons. It will be seen that the analysis included an example from all 19 teachers of Explanation Word, Metalanguage, Oral Language and Oral/Written Language and examples from 15 teachers for Explanation Text and Explanation Sentence. Accordingly the number of comparisons for each practice varied from 171 to 105.
T A B L E 1 6
Numbers of examples (items) and comparisons for pair-wise analysis
Practice Examples Comparisons
Explanation word 19 171
Explanation sentence 15 105
Explanation text 15 105
Oral language 19 171
Oral / written language 19 171
Metalanguage 19 171
Total 106 894

32
Each video example with connected transcript for each practice was entered into the Artichoke Pair-wise program (Fetherston, 2007). Figure 12 shows the layout of a working window of the program.
Figure 12. Layout of a working window of the artichoke pair-wise program
Each of the 894 pairs was assessed by a panel of fi ve or six ‘judges’, all of whom had expertise and experience in early childhood and/or primary literacy teaching. It was composed of four members of the research team, an early years teacher and an expert in pair-wise comparisons and literacy benchmarking. Judges were presented with the examples of each particular practice two at a time and asked to judge which of the two better represented the practice in terms of the defi nition and examples from the CLOS-R coding manual. For each practice every example was paired with every other example of the same practice.
Analysis of the pair-wise data
The format for pair-wise data analysis is shown in Table 17. A response x ji = 1 indicates performance j was judged a better performance compared to item i and a response x ji = 0 indicates item j was judged a weaker performance compared to item i.
Data collected in the pair-wise format were analysed using the Bradley-Terry-Luce (BTL) model (Bradley & Terry, 1952; Luce, 1959), which is usually stated in the following form:
T A B L E 1 7
Pair - wise data collection format
Judge Judge 1 Judge 2 Judge P
Performance 1, 2, 3, ... ... i ... ... l
Judge 1 1 x$$% x$&% x$' x$ (
2 x&&% x&' x& (
Judge 2 3 x''))) x' (
:
:
Judge P J ... xJI
Pr { X ji = 1} =exp ( j - j )
1 + exp ( j - j )

33
In this context, Equation (I) constitutes a statement of the probability that item j is judged more di" cult than item (i) in a pair-wise comparison between the items. Andrich (1978) showed that the person parameter is eliminated experimentally in the pair-wise design. In the context of the study, this means that the judges’ own personal disposition to the teaching practice, or their disposition to be lenient or harsh in their judgement of the teaching practice is eliminated. Instead the methodology provides information about the judgements of the relative qualitative di! erences between the teaching practices.
Analysing the data in this way provides empirical scales of each episode’s location. The episode judged to be the better over all pair-wise comparisons has the highest location. Conversely, the episode judged to be the weaker over all comparisons has the lowest location. Empirical scales are displayed graphically as item maps.
3 . 4 P A I R - W I S E F I N D I N G S A B O U T S E L E C T E D C L O S - R P R A C T I C E S A N D T E A C H E R E F F E C T I V E N E S S
Findings from the pair-wise analysis for the selected Knowledge dimension practices, that is, Oral Language, Explanation Word, Explanation Sentence, Explanation Text, Oral-Written Language, and Metalanguage are now presented. Results for each practice are introduced with a brief review of the importance of the practice to early literacy teaching in terms of established research literature and a summary of the frequency of the practice for each teacher group.
Results of the pair-wise analysis for the practice are then presented in an item map that shows the location of each teacher’s example from lowest to highest. In order to preserve confi dentiality for teachers they are identifi ed only by group, that is, more e! ective, e! ective and less e! ective. The item map is discussed in terms of observed similarities and di! erences between the implementation of the practice for teachers at di! erent locations on the item map. Transcripts of examples, or extracts from examples, of teachers at higher locations are analysed in detail. As the focus of this project is e! ective teaching, descriptions of the examples from the less e! ective teachers are usually at a fairly general level.
The conventions used in the transcripts are outlined in table 18 below.
T A B L E 1 8
Conventions used in the transcripts
S Student speak
Ss Student speak
E Teacher and most of class speak
T Teacher speak
[Stage direction] For example [inaudible] or [laughter]
[5] Indicates the length of a pause of 3 seconds or more
... Indicates a pause of less that 3 seconds
/ / Overlapping speech
/ ee / ; / ar / Phonemes that are being sounded or articulated together are italicised and enclosed within slash marks e.g. / qu / , / str /
elephant Words being focused on or studied are in italics; the words might be seen on the board or elsewhere
R ; B Letter names being discussed are in capitals
‘Once upon a time there was’ Text read aloud is italicised and enclosed in inverted commas
Oral language The teacher focuses on the development of children’s oral language
Oral Language, which did not appear in the original version of CLOS, has been added to CLOS-R to examine the speaking and listening environments of early years classrooms. In order to become print literate young children need to be able to transfer their knowledge of oral language to its written form. Comprehension of written text is highly dependent upon a reader’s oral language abilities, particularly with regard to
word meanings and the syntactic and semantic relationships between them (Snow et al., 1998). Elements of oral language that have been identifi ed as predictors of success or failure in early reading include verbal memory, particularly for sentences and stories, lexical skills, including speed of speech production and expressive and receptive vocabulary, and phonological awareness (Snow et al., 1998).
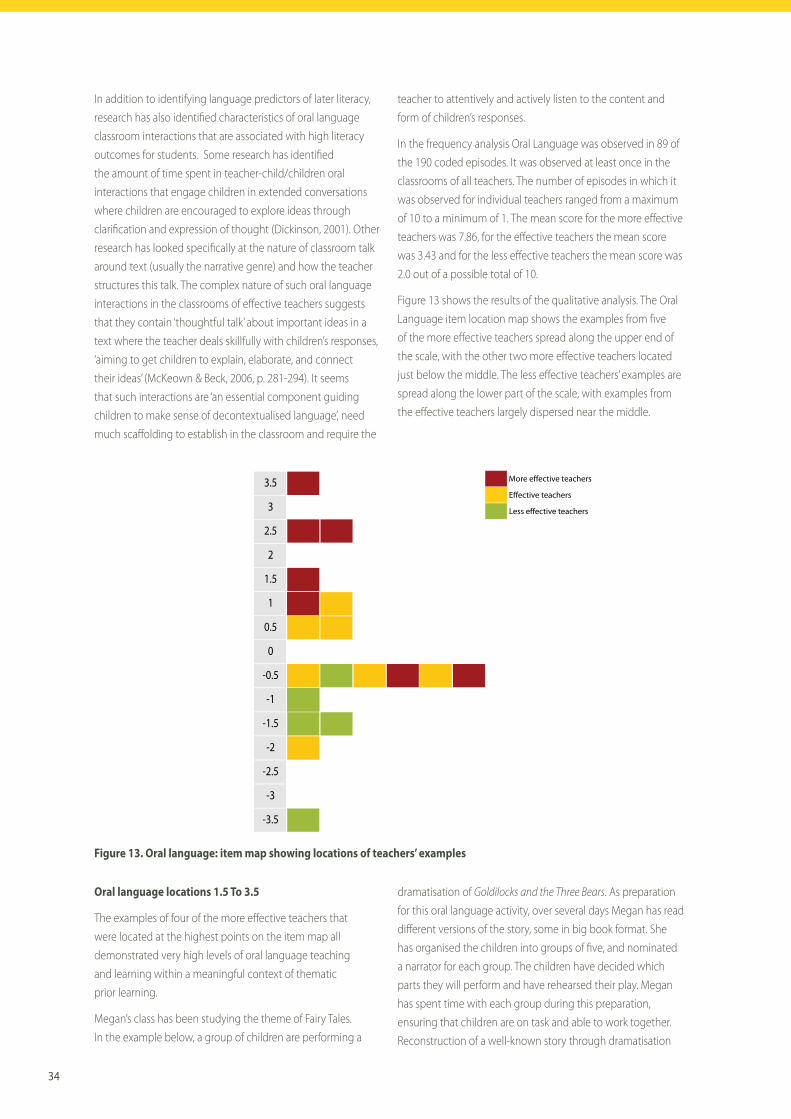
34
3.5
3
2.5
2
1.5
1
0.5
0
-0.5
-1
-1.5
-2
-2.5
-3
-3.5
More e!ective teachers
E!ective teachers
Less e!ective teachers
Figure 13. Oral language: item map showing locations of teachers’ examples
In addition to identifying language predictors of later literacy, research has also identifi ed characteristics of oral language classroom interactions that are associated with high literacy outcomes for students. Some research has identifi ed the amount of time spent in teacher-child/children oral interactions that engage children in extended conversations where children are encouraged to explore ideas through clarifi cation and expression of thought (Dickinson, 2001). Other research has looked specifi cally at the nature of classroom talk around text (usually the narrative genre) and how the teacher structures this talk. The complex nature of such oral language interactions in the classrooms of e! ective teachers suggests that they contain ‘thoughtful talk’ about important ideas in a text where the teacher deals skillfully with children’s responses, ‘aiming to get children to explain, elaborate, and connect their ideas’ (McKeown & Beck, 2006, p. 281-294). It seems that such interactions are ‘an essential component guiding children to make sense of decontextualised language’, need much sca! olding to establish in the classroom and require the
teacher to attentively and actively listen to the content and form of children’s responses.
In the frequency analysis Oral Language was observed in 89 of the 190 coded episodes. It was observed at least once in the classrooms of all teachers. The number of episodes in which it was observed for individual teachers ranged from a maximum of 10 to a minimum of 1. The mean score for the more e! ective teachers was 7.86, for the e! ective teachers the mean score was 3.43 and for the less e! ective teachers the mean score was 2.0 out of a possible total of 10.
Figure 13 shows the results of the qualitative analysis. The Oral Language item location map shows the examples from fi ve of the more e! ective teachers spread along the upper end of the scale, with the other two more e! ective teachers located just below the middle. The less e! ective teachers’ examples are spread along the lower part of the scale, with examples from the e! ective teachers largely dispersed near the middle.
Oral language locations 1.5 To 3.5
The examples of four of the more e! ective teachers that were located at the highest points on the item map all demonstrated very high levels of oral language teaching and learning within a meaningful context of thematic prior learning.
Megan’s class has been studying the theme of Fairy Tales. In the example below, a group of children are performing a
dramatisation of Goldilocks and the Three Bears. As preparation for this oral language activity, over several days Megan has read di! erent versions of the story, some in big book format. She has organised the children into groups of fi ve, and nominated a narrator for each group. The children have decided which parts they will perform and have rehearsed their play. Megan has spent time with each group during this preparation, ensuring that children are on task and able to work together. Reconstruction of a well-known story through dramatisation
35
T: You were doing a very good job when you were practising before though…
SNar: This is called Goldilocks and The Three Bears. Once upon a time there lived three bears in the woods. There was a big… the porridge was much too hot so they went for a walk in the, in the… woods.
T: Along came Goldilocks.
SNar: Along came Goldilocks and she saw a house. She wondered who it was. She wondered who it was so she went inside and she saw the porridge on the table. She tasted the big bowl but it was much too hot. Then she tasted the middle bowl but it was… much too hot too. Then she tasted the middle sized, the smaller bowl but it was just right so she ate it all. Then she went into the dining… the dining room. She sat on the big chair but it was much… it was much too hard. So she went on the middle chair but it was…but it was…
T: Too wide.
SNar: Too wide. So she went on the, on the small chair but it was just right so…
T: It broke.
SNar: But then…
T: The chair broke.
SNar: The chair broke. [twists fi ngers and moves from foot to foot]
T: Stand still please. Good girl, you’re doing a very good job.
SNar: She went in to…
T: The bedroom.
SNar: To the…
T: Bedroom.
SNar: To the bedroom and there was a big bed for Pop, Poppa Bear but it was much too big… hard. She went on to a middle sized bed but it was much too soft so she went on to a smaller bed but it was just right so before long she…she… was fast asleep.
T: Good girl
SNar: After that the bears came back.
S: Someone’s been eating my porridge.
S: Someone’s been eating my porridge.
S: Someone’s been eating my porridge and it’s all gone.
SNar: Then they went into the dining room.
S: Someone’s been sitting in my chair.
S: Someone’s been sitting in my chair.
S: Someone’s been sitting in my chair and it’s broken.
SNar: After that they went into the bedroom.
S: Someone’s been sleeping in my bed.
S: Someone’s been sleeping in my bed.
S: Someone’s been sleeping in my bed and there she is.
T: Taleah, what happened now, who woke up?
SNar: Goldilocks woke up. She saw the three bears and she ran, ran towards the… and the bears chased her into the woods.
T: I’ll save you Goldilocks. Well done. Give Taleah and all the actors a big clap. Bow to the audience Taleah, you did a very good job darling. Good girl, really good job. Last group, last group.
In this example, the narrator is a child who has little self confi dence and some language di" culties. Megan provides focussed and targeted sca! olding and feedback for her throughout the performance. Megan appears to be acutely aware of when she needs to intervene to provide support, for example by prompting the beginning of a sentence, and when it is appropriate to allow the child some time to think and to keep going at her own pace. Although this oral language task is highly challenging for this particular child, she is able to complete the narration with increasing confi dence because of the warm support from Megan. Later, at the conclusion of all performances, Megan asks the class to give each other some positive feedback, and the other children acknowledge and praise this particular child’s e! orts.
In the other examples from the more e! ective teachers at these locations on the scale there is a strong focus on understanding content, as well as on completion of tasks. The content is always substantive, for example, science-based classifi cation vocabulary, and it is based within a broader
provides the stimulation for children to transform the written text and use demanding narrative language structures in their oral language, such as ‘Along came Goldilocks’. In order to complete the task, the children need a good understanding and memory of the story, a good memory for sentences from the story, as well as some knowledge of the conventions of drama, and an ability to combine and use this knowledge.in an appropriate way. An additional component of this oral
language activity is the requirement that the children listen, whether they are in the audience, or the performance.
During the performance the teacher sits with the rest of the class and the narrator (SNar) frequently looks at her for support. The teacher’s responses are whispered as she prompts and encourages. The children who are acting the other parts enter and exit on cue.

36
theme or learning sequence, as in this extract that focuses on the attributes of insects:
T: Sometimes you can’t see the three body parts because they have the wings covering up. Matthew?
S: Camoufl age.
T: They’re very good at camoufl aging.
S: Jaws.
T: Yes they do have jaws. They have a…?
E: Proboscis.
These more e! ective teachers have a clear sense of the
purpose of oral language activities and their students
demonstrate understanding of this purpose in their responses
and in task completion. There is also an emphasis on the oral
expression of the children, on what is being expressed and also
how it is expressed.
In the extract below, the children in Elizabeth’s class are
playing a game in which they are required to provide clues so
that a selected child can guess a particular Australian animal
being described. This game is just one activity related to a
class theme about Australian animals that is strongly related
to scientifi c understandings (classifi cation and description
of animals), and requires children to analyse, synthesise and
evaluate information in order to express it in the form of a
statement. In her feedback Elizabeth accepts, models and
corrects children’s responses.
T: Can you think of a clue? Daniel?
S: It can um jump real, real high.
T: It can jump really high. Hand up. Lovely you’ve got your hand up Ryan?
S: It can croak.
T: Beautiful clues.
In another example of an oral language game, this time from
Gill’s classroom, a child is required to ask closed questions of
his peers in order to gain information that will help him identify
a target animal. The cognitive and linguistic requirements
of the task are high and include a strong auditory memory
component and using language for reasoning, in that the child
needs to remember all information given to him, make sense
of it, recognise what more information he needs in order to
identify the animal and then formulate a closed question that
can elicit this information. Gill provides sca! olding to help
the child frame his questions and reviews and synthesises
the information he has been given. In addition, she is aware
that this child has some di" culties with his hearing so she
faces him to make eye contact, and clearly articulates the
information he needs in order for him to formulate his next
question. She carefully monitors the pace of the activity,
allowing some time for thinking, but also moves the child
towards the solution.
T: All right, you’re so clever I’m going to put some animals on there you haven’t seen. Aha. Right Kieran put it on [places a headband containing a picture of a pig on the child’s head so that he can’t see it]. Right. OK Kieran. And Eva’s [got] the fi rst question. Sshh.
S: Has it four legs?
S: Yes… [hesitates]
T: Ask Hamish. Better fi nd out what size you are.
S: Is it small?
S: No.
T: Ask about your tail?
S: Does, does it have a tail?
S: Yes…um…er
T: Get some more information about your tail, long tail, short tail, what do you think it might be? [child hesitates] Youhave to ask him one or the other.
S: Travis is it a long tail?
S: No.
T: Not a long tail. Get some more information about your tail. Is it a hairy tail or a skinny tail, straight tail?
S: Is the tail skinny?
S: Yes.
T: Yes, skinny tail. Better ask her now is it straight or is it a curly tail?
S: Eva is it straight?
S: No.
T: No. It’s a skinny tail and it’s not straight and you’re big and you’ve got four legs. Do you think you know what you are yet? Where do animals live?
S: On farms.
T: They could live on a farm, they could live in the bush, better fi nd out. Better fi nd out where you live. [child hesitates] Did you hear what I said? I know you’re not hearing very well. Find out if you live on a farm or in the bush so what question are you going to ask him?
S: Angus do I live on a farm?
S: Yep.
T: Yes. Now this is the information you have, it’s big, it has four legs, it has a short thin tail and it lives on a farm.
S: It’s got a curly tail.
T: Oh now he’s giving you some information. He said he’s got a curly tail. What might it be? Curly tail, four legs, big, lives on a farm. [children call out] Don’t give him any more

37
information. What do you think it might be?
S: Dog.
T: A dog? It could be couldn’t it but it’s not. We’ll tell you what it is. That was a hard one.
In both of these examples, the teacher facilitates
communication between the children by providing tasks that
require them to speak and listen to each other. These oral
language tasks include use of a wide range of vocabulary,
specifi c sentence structures, understanding of the knowledge
necessary for the interaction, specifi cally classifi cation of
animals, and active listening.
Oral language locations 0.5 to 1.0
Some examples at these locations show teachers explaining
specifi c vocabulary to children, sometimes connected to a
theme or a sound or blend being studied. Other examples
at this location show teachers providing children with
opportunities to use and practise oral language and recently
learnt vocabulary. Often, these activities form part of the daily
routine, such as news-telling and calendar activities. These oral
activities usually require the children to speak in sentences
when asking and responding to questions.
These teachers have high expectations of the children,
and provide feedback and modelling to elicit the sentence
structure desired in the students’ responses. In these examples
children do not always have to listen to one another, as the
teacher leads the discussion and interactions occur through
the teacher rather than between children. This can be seen
in the following extract, where a more e! ective teacher and
the children are engaged in the morning routine that requires
children to identify the day, date, month and weather, and to
use statements and questions to share this information with
their peers.
T: Big sentence. [looks at child who is standing at the day chart]
S: What’s the month today? Connor?
S: Um today is August.
T: The month is August. Beautiful. I haven’t had to remind anyone to use sentences. That’s so wonderful. Okay Connor you can stay up. Now Connor you’re going to ask someone what the date is.
S: Anthony. [looks at Anthony]
T: Can you ask in a sentence?
S: What’s the date today Anthony?
T: Can you use your words to answer Anthony?
S: It’s the 30th.
The extract below takes place at the start of the day, where an
e! ective teacher asks the children to rate their day on a scale
of 1-10. In this way, she is able to determine the emotional
state of the children, some of whom are from challenging
backgrounds. The children are asked to justify their feelings
and articulate their reasoning, both of which require high
levels of thinking. This personal conversation demonstrates
high levels of respect, trust and understanding between the
teacher and children.
T: Annemarie, how’s your day?
S: Ten.
T: Ten. Why are you having a ten day today?
S: Because I was having the most happy dreams.
T: Happy dreams, oh well done. I like to have happy dreams. How about your day Brendon?
S: I’m a ten.
T: A ten, even though you’re going to daycare you’re still having a ten today? That’s good.
S: I go in the spa today.
T: Wow excellent.
Oral language lower locations
At lower locations activities tended to be isolated rather than
part of a sequence of learning, ‘We’re going to start o! the
morning with a game.’ Although the children were required to
use oral language as a part of the activity, its development was
not usually the focus. Tasks did not provide for di! erentiation
amongst children or the explicit teaching of oral language
concepts, such as vocabulary or sentence structure.
In terms of the skill of listening children usually appeared
to have the choice of engaging or opting out without a
signifi cant impact on the lesson outcome and the teachers’
responses sometimes showed a lack of careful listening
on their part. Children’s responses were usually accepted
regardless of whether they took the form of single word
utterances or simple sentences. Teachers had low expectations
of children’s performance and participation, ‘Don’t forget you
can pass,’ for both speaking and listening.
Some examples at lower locations focussed on the
development of phonological awareness, particularly
alliteration. Children were asked to articulate words beginning
with a particular letter or sound. Other examples showed
teachers modelling the use of a simple sentence, ‘This is a…’
Which children repeated or recast. Whilst these activities had
the potential to extend children’s oral language, their teachers
provided little feedback that could help extend their ideas or
further develop their oral language.
At the very lowest locations activities had no explicit outcome
so that the purpose was unclear. Whilst the opportunity to
use oral language may have been present in activities, there

38
was little attention to the development of children’s language.
Teachers appeared to have low expectations of what children
could do, all contributions were acceptable whilst errors or
misconceptions were often ignored. There was a lack of active
listening by both teachers and children, in some cases there
was little teacher participation and limited support in terms of
sca! olding or feedback.
Summary
In the frequency analysis, the teaching practice of Oral
Language, defi ned as the teacher focuses on the development
of children’s oral language, was observed in just over three-
quarters of the episodes of the more e! ective teachers, in
one third of the e! ective teachers’ episodes, and in one fi fth
of the episodes of the less e! ective teachers. It was surprising
that in early years classrooms, where children’s literacy skills
were still emerging, there were so few opportunities for the
development and extension of oral language in the classrooms
of the e! ective and less e! ective teachers. Whilst there was a
great deal of talk in these classrooms much of it did not seem
to have the potential to signifi cantly impact on children’s
language learning.
On the other hand the development of oral language was
part of an overall sequence of learning for the more e! ective
teachers. For those located at the upper end of the scale oral
language tasks were frequently integrated into a theme, with a
specifi c focus on developing related discourses that included
content-specifi c vocabulary.
These more e! ective teachers engaged children in extended
discussions where children were sca! olded in extended,
thoughtful conversations with other children as well as with
the teacher. Sometimes these conversations took the form of
a game, where children were required to provide clues, ask
questions, or make informed answers. Such tasks required the
children to use active listening skills to remember information,
analyse, synthesise and evaluate this information in order
to transform it into a di! erent linguistic form, so that verbal
memory, vocabulary, speaking and listening skills could be
extended. Children in these classrooms were encouraged to
use di! erent types of sentence structures, such as simple and
complex statements and open and closed questions.
These teachers introduced their children to a variety of
discourses and situations in which oral language performance
skills were developed and extended. Tasks included
dramatising stories, discussion around texts and high level oral
language games. It was clear that these teachers were highly
engaged in classroom oral language activities as they provided
targeted support to children, based on their sustained active
listening to the content and form of children’s responses.
Explanation word
The teacher clearly explains speci! c word, letter or sound strategies or concepts
In order to be able to read and write e! ectively, young children
need to develop the knowledge and strategies necessary to
break the code of texts (Luke & Freebody, 1999). However, the
ways in which this code breaking is taught and in particular
the explicitness with which it is taught has caused continuing
divisions in the educational arena (Chall, 1967; Snyder, 2008),
particularly for young children (Fox, 2001). Nevertheless, there
is a growing recognition within the education community that
the explicit teaching of sound-letter relationships and how to
use these in reading and writing are necessary parts of early
literacy teaching (Rowe, 2005; DETWA, 2006). Snow, Burns
and Gri" n (1998) call for a strong focus on ‘explicit instruction
and practice with sound structures that lead to phonemic
awareness…sight recognition of frequent words [and]
instruction in spelling-sound correspondences and common
spelling conventions, and their use in identifying printed words’
(p. 194).
It is important to teach young children word level foundational
knowledge in the early years of school ‘before too many
demands are placed on them by formal reading instruction’
(Ehri & Roberts, 2006, p. 127). Results of the US National
Reading Panel research (2000) showed that phonemic
awareness (awareness of the sound units of language) and
letter knowledge measured at school entry were the two
best predictors of reading success in the fi rst two years of
school and that systematic phonics instruction, in which the
acquisition of sound-letter correspondences and their use in
reading and spelling were explicitly taught, was highly e! ective
in promoting early reading. Phonics has been described as
‘an umbrella term that stands for many forms of instruction
that help children realise the alphabetic principle through
instruction that links letters and sounds’ (Juel, 2006, p. 422).
Further, the components of phonics have been defi ned as
‘teaching sound-symbol correspondences directly, having
children manipulate sounds in written words through spelling
tasks, pointing out patterns in similarly spelled words, or
anything else which helps children learn about orthographic
patterns in written language’ (Stahl, 2001, p. 335).
In the frequency analysis Explanation Word was observed in
115 of the 190 coded episodes and was observed at least once
in the classrooms of all teachers. The number of episodes in
which it was observed for individual teachers ranged from a
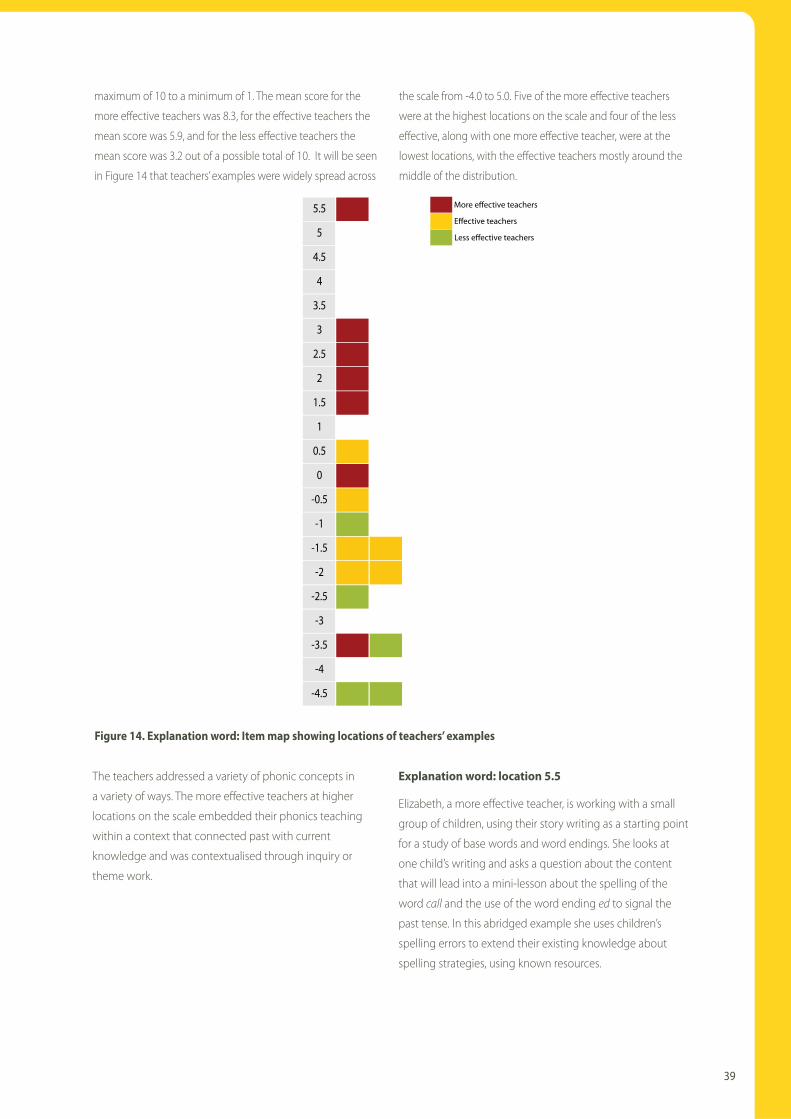
39
maximum of 10 to a minimum of 1. The mean score for the
more e! ective teachers was 8.3, for the e! ective teachers the
mean score was 5.9, and for the less e! ective teachers the
mean score was 3.2 out of a possible total of 10. It will be seen
in Figure 14 that teachers’ examples were widely spread across
the scale from -4.0 to 5.0. Five of the more e! ective teachers
were at the highest locations on the scale and four of the less
e! ective, along with one more e! ective teacher, were at the
lowest locations, with the e! ective teachers mostly around the
middle of the distribution.
3.5
4
4.5
5
5.5
3
2.5
2
1.5
1
0.5
0
-0.5
-1
-1.5
-2
-2.5
-3
-3.5
-4
-4.5
More e!ective teachers
E!ective teachers
Less e!ective teachers
Figure 14. Explanation word: Item map showing locations of teachers’ examples
The teachers addressed a variety of phonic concepts in
a variety of ways. The more e! ective teachers at higher
locations on the scale embedded their phonics teaching
within a context that connected past with current
knowledge and was contextualised through inquiry or
theme work.
Explanation word: location 5.5
Elizabeth, a more e! ective teacher, is working with a small
group of children, using their story writing as a starting point
for a study of base words and word endings. She looks at
one child’s writing and asks a question about the content
that will lead into a mini-lesson about the spelling of the
word call and the use of the word ending ed to signal the
past tense. In this abridged example she uses children’s
spelling errors to extend their existing knowledge about
spelling strategies, using known resources.
40
T: OK. Now can you think about Blakes’s story. What did the emu do, what did they do when the emu broke his leg?
S: Called the fl ying doctor.
T: Called the fl ying doctor, fantastic. Now hang on, we need to write the word, the base-word fi rst so what is the base-word?
S: Call.
T: Can you stretch it out for me?
E: /c/ /a/ /ll/. [T holds up 1 fi nger for each phoneme as they sound out the word]
T: Hang on. Take o! the word ending. What is the word ending on this word?
S: E D.
T: Take that o! , just tell me the base-word. Are you ready Jackson? Just pop the lid on Jackson because you need to listen. Ready. Listen. Call, stretch it out.
Ss: /c/ /a/ /ll/.
T: Oh how are we going to spell it? That’s quite a hard word for us to spell.
S: Does it start with K?
S: It starts with C.
T: Might…Hang on, I know a word on the THRASS chart that sounds a little bit like call, maybe we could use it.
S: Duck.
T: Duck and call, do they sound the same? I tell you what, it’s on the vowel side and it’s at the bottom and it’s in the all box.
Ss: Ball.
T: OK think about it, say the word call for me.
Ss: /c/ /a/ /ll/.
T: Hey, call, ball. Do they sound the same?
Ss: Yes.
T: Oh fantastic. Sounds like ball but it starts with /c/. OK, see if you can write it. And we’ll have to decide whether it’s a C or a K won’t we?
[break in transcript as children write the word call on small white-boards deciding on C as the fi rst letter]
T: Does it just look like ball but starts with a di! erent letter? OK, can you add the word ending now to make the word called? Can you add the word ending to make the word called? Is it E D, called? Well done. Oh fantastic. So if you were the teacher… [picks up child’s writing book and shows a page to the group] Have look, we could look at Blake’s book and he put it here. ‘He called the fl ying doctor’. So when you do your writing next would you be able to change that for me? Fantastic. OK, let’s do another one. [picks up another child’s
writing book and draws children’s attention to the picture of a sugar glider] Oh listen to this one. This story was Jackson’s and he did really well. He had a sugar glider in his story and that’s the sugar glider there. Can you see the sugar glider?
Here Elizabeth has been highly systematic in her teaching.
She has begun with a mis-spelling of the word called in
one child’s writing to create a lesson for the group on the
spelling of the base-word call and the past tense ending ed.
She encourages the children to use the spelling strategy of
stretched pronunciation in c-a-ll. She directs the children’s
attention to the THRASS chart 8 with which they are highly
familiar from daily practice with this resource, to check
the spelling of the similar sounding word ball. Once the
children have correctly spelled call Elizabeth focuses their
attention on the word ending, which they then write and
she moves on to discuss a similar error in another child’s
writing so that the children can transfer their knowledge of
the word called to spelling the word jumped.
Explanation word : location 3.5
Throughout the year Jennifer, another more e! ective
teacher, has been systematically teaching her Pre-primary
children letter and sound relationships. In the following
example she makes connections to previous learning, ‘Who
knows which song we’ve been singing for /f/? Who can
remember from kindy?’ The lesson requires her children to
sing the /f/ song, think of words that begin with a /f/ sound,
and to help sound out the words as the teacher records
them on the board. This activity provides children with
opportunities for repetition and practice. Jennifer models
segmenting of words as she writes them, a strategy that
the children can use in their own writing. She draws their
attention to word concepts, ‘February. Is that our longest
word so far or our shortest?’, and letter awareness, ‘I wonder
how many letters there are in it?’
T: Now we’ve been learning about another new letter of the alphabet this week. Who can tell me which sound? Blake?
S: /f/.
T: /f/. Who knows which song we’ve been singing for /f/? Who can remember from kindy? I’ll show you. [holds up picture of fl ies] What’s that?
Ss: Fly swatting.
T: Fly swatting. Someone’s swatting a fl y and it says ‘Flies are fl ying’ and you know how we sing that don’t you? Are we ready? One two…
8 This chart is part of the THRASS program (Davies & Ritchie, no date)
that Elizabeth has been using systematically to teach correspondences
between phonemes and graphemes
41
E: [children and teacher sing together] Flies are fl ying /f/ /f/ /f/, fl ies are fl ying /f/ /f/ /f/, fl ies are fl ying /f/ /f/ /f/, skip to my Lou my darling.
T: Beautiful. So I’ll put that up over here for today to remind us of our song and I’ve got our new chart to go on the writing centre wall. [holds up back of chart] I’m not going to turn it around yet because I want you to just think about as many /f/ words as you can that then we can write up on our chart. Oh, I wonder how many of you will come up with di! erent ones, really long words or short words. OK. Hands down for now. I’m just going to turn it around this way and I’ve got a picture on there. [turns around chart that shows upper and lower case F and a picture of a fi sh and puts it onto the easel] Mm. Let me see. George can you tell me something that starts with /f/?
S: Fish.
T: Fish. Can you help me sound out the word fi sh? So it will start with a …
S: /f/.
T: /f/.
S: We all know that it will start with /f/. [begins to write lower case F]
T: What do you hear about the /f/, /f/ /i/? [continues writing] And what’s at the end of fi sh?
S: /Sh/.
T: /Sh/. Good boy, fi sh. [writes lower case SH] So that’s a /f/ word. Well done. Joshua can you tell me another /f/ word?
S: Flower.
T: Flower. Do you think that’s a long word or a short word? Let’s sound it out. Can you help me sound it out? [begins to write] /f/, so it starts with a /f/. What do you hear after the /f/?
S: /u/.
T: Oh try again, /f/, /f/, fl -ower. [writes letters to represent each phoneme as she sounds them with the children] What do you hear after the /f/ fl -ower. Can you hear a /l/? /f/ /f/ /l/, fl and then we have the ower. What do you hear at the end, fl ow-er, fl ower. Have a look, it’s an E and a R for fl ower. Well done a /f/ word. Mikeala what’s another /f/ word?
S: February.
T: February! Now what’s special about February Mikaela. … Is it a name of something? Is it name of a…? It’s the name of a month isn’t it? And when we have the name of something what sort of letter do we use?
S: A capital.
T: A capital letter, good girl. Is this is a capital F?
Ss: Yes.
T: It is. February is a pretty tricky word. Can you all help me to sound it out?
E: [teacher scribes as the word is sounded] /f/ /e/ /b/ /r/ /u/ /a/ /r/ /y/
T: February. Is that our longest word so far or our shortest?
Ss: Longest.
T: The longest word. I wonder how many letters there are in it? Shall we count them?
E: Yes. One, two, three, four, fi ve, six, seven, eight. [teacher points to each letter as children count it]
T: Eight letters.
Elizabeth, Jennifer and the other more e! ective teachers at
high locations on the scale taught word level concepts in
highly systematic ways. They identifi ed a sequence of word
level concepts and skills and targeted their instruction to
the developmental levels of the children, demonstrating
a strong sense of purpose, that was clearly understood by
the children, as indicated by their responses and levels of
participation. Lessons were paced appropriately to allow
children time to stop, think and consolidate learning.
These teachers demonstrated correct and consistent
use of metalanguage, in particular, clearly di! erentiating
between letter names and sounds. They carefully
articulated letters, sounds and words to assist the children’s
learning. Sca! olding was used to reinforce, support and
extend learning. This was done through questioning and
modelling at both individual and group levels.
T: Is this the same sound or di! erent sound. Are you listening? Same sound or di! erent sound. Listening. I’m going to ask Jacob. Are these the same or di! erent?…..
S: Di! erent.
T: Listen I haven’t given you the sounds yet… /j/, /m/.
S: Di! erent
T: Di! erent. OK, this is out of fi ve, /p/, /l/… Same or di! erent?
S: Di! erent
T: Di! erent, well done… /m/, /m/.
S: Same.
They also provided explicit instruction, and supported
learning with rules, exceptions and defi nitions. They
frequently checked children’s understanding of word level
concepts, and reinforced specifi c literacy learning.
T: Right who thinks they know what all these words have? What’s special about these
42
words? Chiquita?
S: A Q and a U.
T: A Q and a U. Good girl. They all have the sound /qu/. Everyone say it.
E: /qu/.
T: So what two letters always have to go together when we have a /qu/, its friend that always, always, always goes with it is what? Isabelle?
S: U.
T: U. It does not go anywhere without its best friend U so they always have to go together in every word.
Within the context of a word level lesson, these more e! ective
teachers often created a conspiracy of learning. Children were
made to feel that the teacher was part of their team, and that
as a group they were working together to achieve highly
explicit phonics outcomes.
Explanation word lower locations
In examples at lower locations on the item map, word-
level activities appeared to be independent of a sequence
of literacy development, and not to fi t within a broader
context. Teachers were generally not explicit in their word
level instruction, and did not specifi cally identify the
word level concept being taught. Activities often lacked
clear purpose, particularly when task instructions were
insu" cient and lacked clarity. In one example the children
were introduced to a new activity that required them to
move a counter into a box for each phoneme in a word,
an activity that if carefully sca! olded has the potential
to facilitate phoneme awareness. However, in this less
e! ective teachers’ classroom the only instruction was, ‘So
we’re just doing sounds. This is what we’re doing, we’re just
making the sounds, OK’.
In several classrooms noise levels and general classroom
organisation interfered with lesson delivery and
task completion, particularly when precise auditory
discrimination was required. This was exacerbated
when teachers did not employ careful articulation of
the particular words or sounds being studied. Use of
metalanguage was not always consistent, particularly
when referring to letters and sounds, and was sometimes
confusing, ‘What sound, if we put A and P together what
sound does that make?’ There was a general ine" cient
use of time, for example, children waiting for a length of
time to get task direction from the teacher, or the teacher
continually repeating the same information to di! erent
individuals around the room when this could have been
used as feedback to the whole group. Also, there was
generally a low level of teacher interaction and expectation
and limited or no feedback that extended specifi c word
level understandings. Sca! olding often focussed on task
management, such as ensuring everyone had a turn, or
on task completion ‘Where did you get the A from… You
have to get your story written. Just start writing your story.
Megan I want you to fi nish your story’. Such restricted
learning provided little or no di! erentiation for children,
and limited development of word level ideas and concepts.
Summary
All teachers taught word level knowledge and skills, but
there were large di! erences in both the quantity and
quality of this teaching. In terms of quantity, word level
teaching was observed in most of the episodes of the more
e! ective teachers, just over half of the episodes of the
e! ective teachers and around one third of the less e! ective
teachers’ episodes. The large di! erences in quality could be
seen in the wide spread of example locations on the item
map, that ranged from -4.5 to 5.5 logits. These qualitative
di! erences were clearly evident in the observational
analyses of the content and delivery of word level teaching.
The more e! ective teachers, who were located at the
upper end of the scale, took a highly systematic approach
to the explicit teaching of phonological awareness
and phonics within the context of reading, writing and
spelling. The more e! ective teachers made very clear
connections between the sound structure of language
and its written form. They were very clear and precise in
their use of metalinguistic terms, particularly ‘sounds’ and
‘letters’, in their careful articulation of words and parts of
words and in their explanations of rules, exceptions and
defi nitions. When word level concepts were being taught
children were highly engaged as they actively listened
and participated in a variety of focused, motivating and
purposeful learning experiences that were often related
to other areas of the curriculum. These teachers also
provided many opportunities for practice of learnt skills,
using carefully structured sequenced programs of learning.
A particular feature of these teachers’ classrooms was that,
whilst there may have been some low background noise,
when they were making explicit the connections between
spoken and written words, children with relatively normal

43
hearing were able to hear the teacher’s exaggerated
articulation of sounds and words and also were usually able
to see the teacher’s mouth.
The teaching of phonics and phonological awareness in
the more e! ective teachers’ classrooms moved seamlessly
between explicit teaching, guided practice and transfer of
learnt knowledge, skills and concepts to new situations.
These teachers challenged the children as they made clear
their high expectations for engagement, demonstration
of knowledge and skills, and completion of tasks to a high
standard.
Explanation sentence
The teacher clearly explains speci! c grammatical strategies or concepts
Explanation sentence, which did not appear in the original
CLOS, has been included in CLOS-R in order to identify
teaching practices that address sentence level concepts
and skills. It refers to grammatical knowledge and also
related knowledge about punctuation (Wray et al., 2002).
Young children’s oral language ability that includes
syntactic knowledge and skills has been shown to be
strongly related to later reading acquisition (Snow et al.,
1998) and children’s ability to manipulate and refl ect on the
grammatical structure of language (syntactic awareness)
has been shown to be related to reading achievement
(for a review see Bowey, 1994). This relationship, however,
is not as clear as that between phonological awareness
and reading (Bowey, 2005), and there has been much less
published research in the area. It has been hypothesised
that the ability to understand and manipulate sentence
structures, when combined with phonological awareness,
helps beginning readers make more accurate predictions
about unknown words that they encounter within
a sentence context (Rego & Bryant, 1993; Tunmer &
Hoover, 1992; Cain, 2007). It has also been hypothesised
that syntactic awareness would be related to reading
comprehension, in that knowledge and use of sentence
structure would help children integrate sentence- and text-
level information (Bowey & Patel, 1988), although evidence
for this has not, as yet, been established (Bowey, 2004; Cain,
2007).
Theories of child language development are also
somewhat ambivalent on the topic of grammatical
development, as is research into the explicit teaching
of grammar. Whereas Piaget (1959) saw children as
actively constructing grammar from their experiences,
Vygotsky (1962) concluded that although very young
children learn grammar unconsciously, instruction in
grammar (and writing) helps children make a conscious
focus on language. Research over many years into the
relationship between the explicit teaching of grammar
and improvement in children’s writing has not shown a
strong relationship (Andrews et al., 2004; Snyder, 2008).
Nevertheless, as grammar is being introduced into the
national assessment system at Years 3, 5, 7 and 9 in 2008 it
seems important to examine how it is being taught in early
years classrooms.
In the frequency analysis Explanation Sentence was
observed in 58 of the 190 coded episodes. The number of
episodes in which it was observed for individual teachers
ranged from a maximum of 7 to a minimum of 0. The
mean score for the more e! ective teachers was 4.57, for
the e! ective teachers the mean score was 3.43 and for
the less e! ective teachers the mean score was 0.40 out of
a possible total of 10 episodes. As Explanation Sentence
was not observed in the coded episodes of four of the less
e! ective teachers, these teachers could not be included in
the pair-wise analysis.
It will be seen in Figure 15 that the examples from two of
the more e! ective teachers are located at the upper end of
the scale and most of the teachers, fi ve more e! ective, four
e! ective and the one less e! ective teacher are clustered
around the middle. The examples from two e! ective
teachers are located in the lowest positions.

44
Explanation sentence: location 3.5
The following example is located at 3.5, the highest position
on the item map. Lyn, a more e! ective teacher is introducing a
writing session by modelling the writing of a sentence on the
board. As she writes, she explicitly and intentionally articulates
the sentence level concepts she wishes to teach or reinforce
for the children to use in their writing. Lyn has a very clear
purpose for this lesson, with a strong focus on the sentence
as a means of expressing ‘ideas’. With the children she creates
an introductory sentence for a recount as she focuses on
both form and content. Lyn makes use of carefully sca! olded
questions to elicit information from the children as they
refresh, verify or extend their knowledge and understanding.
The children are active participants as they read, answer
questions and demonstrate their understanding of sentences.
This carefully structured sentence writing activity takes the
form of a sca! olded introduction to the children’s own writing
of a recount.
T: Let me see, when I am starting o! my ideas for writing what do I have to remember to do Alicia?
S: You have to put a capital letter.
T: I certainly do. I start all my sentences with a capital but what are the ideas that I have to remember in my fi rst sentence Olivia?
S: Who, what, where, how.
T: So we need who, what, where, how. [writes these words across top of board]
S: And why.
T: Sometimes why. There’s one that’s missing, who, what, where?
S: When.
T: When, good girl Tegan.
S: And feeling.
T: And sometimes our feelings, we can put our feeling into how and why as well. So if I start o! my beginning of my idea my sentence, what do I start with? Jessica?
S: A capital.
T: A capital letter. OK, let’s have a look at my writing today. Here’s my capital letter to start with. [starts writing on board]
Ss: ‘On Sunday’.
T: Oh well done. ‘On Sunday’… Why did I put a capital letter there. Olivia?
S: Because it’s the name of the day.
T: It’s the name of the day. ‘On Sunday’… Oh I’ve got another capital letter.
S: ‘Fred’.
T: Why did I put a capital for Fred?
S; Because it’s the name
T: Because it’s the name, exactly. ‘On Sunday Fred// and I’…
Ss: //’and I… took’.
T: ‘Took’.
Ss: ‘Honey’.
3.5
3
2.5
2
1.5
1
0.5
0
-0.5
-1
-1.5
-2
-2.5
-3
More e!ective teachers
E!ective teachers
Less e!ective teachers
Figure 15. Explanation sentence: item map showing locations for teachers’ examples

45
T: Who’s Honey? Who can remember who Honey is? Can you remember who Honey is Alicia?
S: Your dog?
T: It’s my dog. ‘On Sunday Fred and I took Honey’…
Ss: ‘For a walk to the’…
T: Oh see if you can guess this one, /b/, it’s going to start with /b/, it’s got the /ee/, listen, it’s got the /ee/ sound in it, it likes coming in the middle. What is the /ee/ sound? What is it Jason?
S: Beach.
T: We are going to have the beach. How do I spell beach with that /ee/ sound, what /ee/ sound would you choose?
S: /e/ and A.
T: Exactly, that one loves coming in the middle the most, beach. What sound comes on the end Olivia?
S: C H.
T: C H. Now that’s the end of my idea. ‘On Sunday Fred and I took Honey for a walk to the beach.’ What do I have to do at the end of my idea Annie?
S: Put a full stop.
T: Annie?
S: Put a full stop.
T: Put a full stop. OK there’s my full stop. Let me see how I’m going. Have I got who? [points to words on board]
S: Aha.
T: Who was it? Olivia?
S: Your dog.
T: It was my dog. Who else was it?
S: Fred.
T: It was Fred and who else was it?
S: You.
T: And me. What, what did we do?
S: You took Honey to the beach.
T: Right. That’s what we did. Where did we go? Jessica?
S: To the beach.
T: We went to the beach. Have I told you how?
Ss: No.
T: Do we always have to have how in our beginning sentence?
Ss: No.
T: Did I tell you why?
Ss: No.
T: Well a little bit, we went there to have a…
S: Holiday
T: No, to go for a…
Ss: Walk.
T: Walk. Exactly. Did I tell you when it was?
Ss: Yes.
S: On Sunday.
T: It was on Sunday. So I’ve got all of those things done in my beginning sentence.
This example, whilst it was part of a larger lesson on writing,
was the only instance observed in the study of a teacher
explicitly planning and delivering an activity specifi cally focused
on sentence form and content. Other teachers also taught
sentence level concepts within a larger context, but usually
with a focus on other aspects of literacy.
Explanation sentence: location 2.0
In this example of Explanation Sentence, Elizabeth, another
more e! ective teacher, has a broad focus on the characteristics
of good authors. As Elizabeth sca! olds the children’s discussion,
one child suggests that good sentence writing is one
characteristic. Elizabeth accepts the child’s contribution and
builds on it, briefl y focusing on sentence level concepts that
include punctuation, as important parts of text creation. As
she discusses these sentence concepts one child appears to
associate ‘describing words’ with the sentences of good authors,
an idea that Elizabeth acknowledges. These exchanges from her
classroom about sentences form part of a much larger guided
general discussion on the features of good writing and how
these features contribute to the construction of whole texts.
T: I’m wondering if you can remind me when good authors write what sort of things do they do, people who are really good authors, what sort of things do they do? Yes?
S: Put feeling.
T: Oh they put feelings into their writing, fantastic. Nathan?
S: They have good sentences.
T: Oh good, they have good sentences. Do they use anything special to show what a sentence is?
S: [Sound]
T: Sorry Nathan?
S: That, um…
T: How do they show a sentence? What do they use?
S: They use capitals and full stops.
46
T: Fantastic. Where would the capital go?
S: Um, at the start.
T: Right.
S: And, um, um, and after the full stop.
T: Oh yes, if you’re about to write a new sentence you’d start again with a capital letter. Good boy. Anything else that really good authors do when they write?
S: Describing words.
T: Oh yes they use lots of great describing words don’t they?
Explanation sentence: locations 1.0 to -1.0
In the examples from the more e! ective teachers at these
locations there was some teaching about a sentence as a
means of expressing information and conveying meaning.
For example as she was teaching reading strategies Megan
focussed on the idea that a sentence should make sense:
T: Read on to the full stop and then you think about what would make sense don’t you? What would make sense?
In the following example, another more e! ective teacher,
focussing on meaning, requires the children to use sentences
that include particular words encountered in their reading,
asking them to apply known features of sentence structure.
She focuses fi rst on the word ‘angry’ and then moves on to
‘saturated’ as meaning very wet, and asks the children to repeat
the word in a sentence.
S: Angry.
T: Can you tell me that in a sentence?
S: He is angry.
T: He is angry isn’t he? Oh I’m going to read and you can read back to me OK. Are we ready? ‘Mr Peacock got wet.’ Your turn.
Ss: ‘Mr Peacock got wet.’
T: ‘He got very wet.’ Your turn.
Ss: ‘He got very wet.’
T: Look how they’ve done very. It looks like it’s all wet doesn’t it? He got saturated. Can you say that?
Ss: Saturated.
T: Okay let’s say it in a sentence. ‘He got saturated.’ Your turn.
Ss: ‘He got saturated.’
In another example between these locations an e! ective
teacher, during a handwriting lesson, asked children to ‘make
a longer sentence than ‘Jelly beans jump.’ Several children
then contributed to the sentence, ‘Jack juggles jelly beans’. In
the other examples between these locations children were
encouraged to use punctuation:
T: If that’s the end of your sentence you need a full stop.
Explanation sentence: lower locations
Examples from the lowest locations showed teachers referring
very briefl y to punctuation and oral expression. Where
sentence level features in a written form were mentioned, they
were limited to identifying instances of punctuation, such as
full stop, capital letter, exclamation mark or question mark.
There was little or no elaboration as to how these could be
used to improve the children’s reading and writing:
T: These are telling us that…?
S: That someone’s talking.
T: That someone’s speaking. We’ll fi nish it tomorrow.
Oral examples required the children to express themselves in
a sentence. Although the teachers modelled the structure of
a simple sentence, for example, ‘This is a dog’, there was no
feedback on how the children could recast or expand their
sentences to make them more meaningful.
Summary
Of the six teaching practices selected for pair-wise
comparisons, Explanation Sentence was the least frequently
observed. It was observed in just under half of the episodes
in the more e! ective teachers’ classrooms, in one third of
episodes in the e! ective teachers classrooms, and was not
observed at all in the coded episodes of four of the less
e! ective teachers. The quality of sentence level teaching for
two of the more e! ective teachers was clearly di! erentiated
from the other observed episodes. There was a large cluster
of teachers in the middle of the item map that was comprised
of more e! ective teachers, e! ective teachers and one less
e! ective teacher.
The observed examples of Explanation Sentence were all
di! erent from each other. The example at the highest location
from the classroom of a more e! ective teacher showed
the teacher focussing on both the form and content of a
sentence. She explicitly taught how to structure a meaningful
sentence in terms of the information it contained as well the
punctuation and spelling required for the written form. This
teacher modelled how to create a sentence that conveyed
detailed information.
47
She kept the children actively engaged by questioning them
about various sentence aspects such as ideas, words, spelling
and punctuation. This questioning not only drew information
from the children, but also extended their knowledge and
understanding. When her sentence was complete, the teacher
then checked the children’s understanding of each element
of the sentence. This sentence then became a model for the
children’s own writing. This was the only observed example
that contained the planned explicit teaching of sentence
structure and content.
As the observations took place towards the end of the school
year, it is likely that other teachers had explicitly taught aspects
of sentence form and content. There is evidence for this
in the examples from some of the more e! ective teachers
located around the middle of the item map. Children in these
teachers’ classrooms volunteered information about the
form and content of sentences, were asked to use sentences
in oral language interactions, and were praised for using
complete sentences in speech and for demonstrating correct
punctuation in writing.
Whilst there were not many examples of the explicit teaching
of sentence structure, apart from punctuation and this was
usually limited to the placement of capital letters and full
stops, the more e! ective teachers were frequently observed
modelling the use of various sentence forms as they focussed
on other aspects of language or classroom activities and
procedures. Some of these have been coded as examples
of Oral Language. In particular, in the oral language games
that required children to use specifi c statement or question
formats, the more e! ective teachers carefully sca! olded the
children’s use of particular syntactic forms as they modelled
and directed the children’s attention to both form and content.
The results of the quantitative analysis suggest a relationship
between Explanation Sentence and teacher e! ectiveness
in that the practice was more frequently observed in the
episodes of the more e! ective teachers than in episodes of the
e! ective teachers, and was not present at all in the episodes
of the four of fi ve the less e! ective teachers. However, in
the qualitative analysis Explanation Sentence did not clearly
di! erentiate between the more e! ective teachers, e! ective
teachers and less e! ective teachers (only one less e! ective
teacher was coded as demonstrating this practice). These
inconclusive results are in accord with previous research
(see Bowey, 2004; Cain, 2007) that has failed to show a direct
relationship between the explicit teaching of grammar and
literacy learning. It may well be that the modelling and
sca! olded use with feedback of syntactic structures for other
literacy-related purposes is su" cient to develop grammatical
awareness and use at this phase of schooling.
Explanation text
The teacher clearly explains speci! c textual strategies or concepts
The National Reading Panel (2000) attributes positive
outcomes for students to methods used by teachers in which
they ‘demonstrate, explain, model and implement interaction
with students in teaching them how to comprehend a text’ (p.
4). This comprehension of text includes strategies with which
to bring background knowledge of a topic to the text being
read, to comprehend texts literally as well as inferentially, to
comprehend words and to use comprehension monitoring
and ‘fi x-up’ strategies (Snow, Burns & Gri" n, 1998). Many
methods of comprehension instruction involve careful
sca! olding of students until they have learnt a particular
strategy (for example, Du! y, 2003; Duke & Pearson (2002);
Palincsar & Brown, 1983). Making specifi c attributes of a text
explicit does not only mean formal comprehension strategy
instruction. It may mean embedding the teaching of reading
and writing into a wider context, using whole texts as the basis
for instruction (Wray et al., 2002).
Within the Australian educational context a broad view of what
is involved in learning about text is current. The ‘four resources’
model of literacy proposed by Luke and Freebody (1999) has
been widely accepted. This model involves learning about
the four resources of decoding (that has a word level focus),
participation in the meanings of text, functional use of text,
and critical analysis of text that are learnt within a cultural
context and are all seen as necessary, but not individually
su" cient, for e! ective literacy in contemporary society. Also
within the Australian educational context text is broadly
defi ned. Whilst it has been traditionally defi ned as ‘meaningful
units of written or print language’ (Lankshear, 1997, cited in
Anstey and Bull, 2006), ‘the increasing range of technological
innovation [has] produced a plethora of new forms of
text’ (Anstey & Bull, 2006, p. 100). Accordingly, included in
our defi nition of text is not only print, but also visual and
multimodal texts.
In the frequency analysis Explanation Text was observed in 74
of the 190 coded episodes. The number of episodes in which it
was observed for individual teachers varied from a maximum
of 9 to a minimum of 0. The mean score for the more e! ective
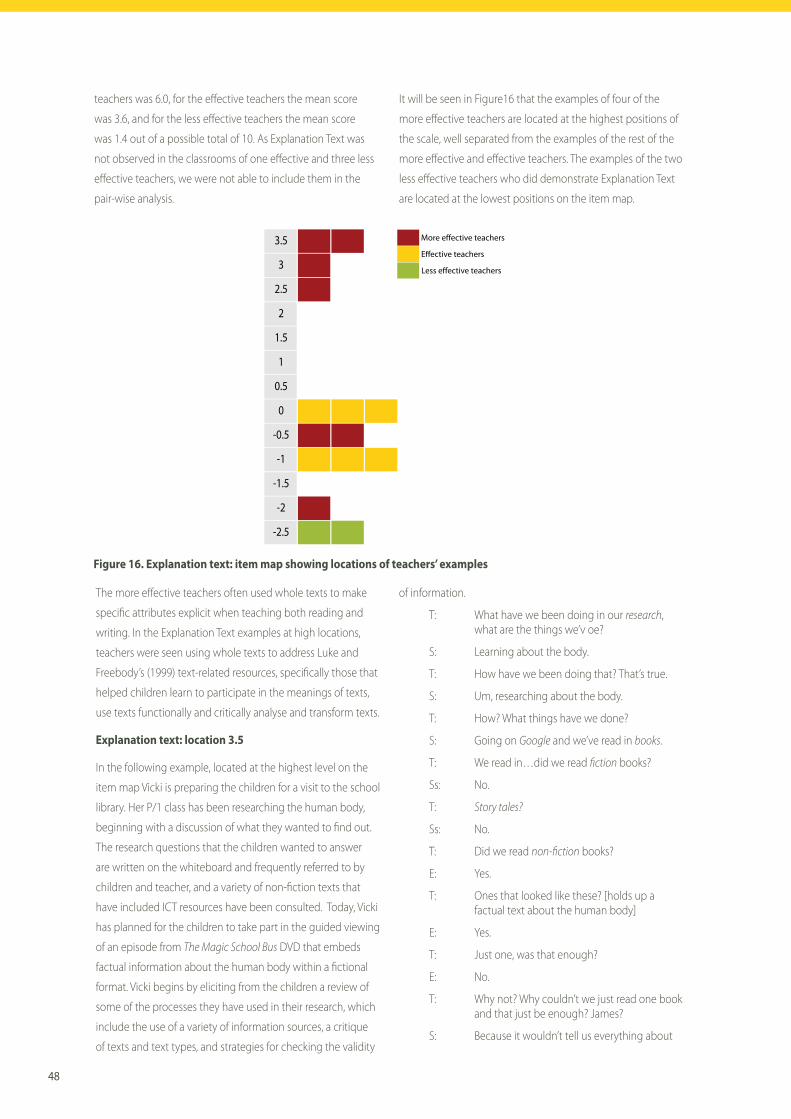
48
teachers was 6.0, for the e! ective teachers the mean score
was 3.6, and for the less e! ective teachers the mean score
was 1.4 out of a possible total of 10. As Explanation Text was
not observed in the classrooms of one e! ective and three less
e! ective teachers, we were not able to include them in the
pair-wise analysis.
It will be seen in Figure16 that the examples of four of the
more e! ective teachers are located at the highest positions of
the scale, well separated from the examples of the rest of the
more e! ective and e! ective teachers. The examples of the two
less e! ective teachers who did demonstrate Explanation Text
are located at the lowest positions on the item map.
3.5
3
2.5
2
1.5
1
0.5
0
-0.5
-1
-1.5
-2
-2.5
More e!ective teachers
E!ective teachers
Less e!ective teachers
Figure 16. Explanation text: item map showing locations of teachers’ examples
The more e! ective teachers often used whole texts to make
specifi c attributes explicit when teaching both reading and
writing. In the Explanation Text examples at high locations,
teachers were seen using whole texts to address Luke and
Freebody’s (1999) text-related resources, specifi cally those that
helped children learn to participate in the meanings of texts,
use texts functionally and critically analyse and transform texts.
Explanation text: location 3.5
In the following example, located at the highest level on the
item map Vicki is preparing the children for a visit to the school
library. Her P/1 class has been researching the human body,
beginning with a discussion of what they wanted to fi nd out.
The research questions that the children wanted to answer
are written on the whiteboard and frequently referred to by
children and teacher, and a variety of non-fi ction texts that
have included ICT resources have been consulted. Today, Vicki
has planned for the children to take part in the guided viewing
of an episode from The Magic School Bus DVD that embeds
factual information about the human body within a fi ctional
format. Vicki begins by eliciting from the children a review of
some of the processes they have used in their research, which
include the use of a variety of information sources, a critique
of texts and text types, and strategies for checking the validity
of information.
T: What have we been doing in our research, what are the things we’v oe?
S: Learning about the body.
T: How have we been doing that? That’s true.
S: Um, researching about the body.
T: How? What things have we done?
S: Going on Google and we’ve read in books.
T: We read in…did we read fi ction books?
Ss: No.
T: Story tales?
Ss: No.
T: Did we read non-fi ction books?
E: Yes.
T: Ones that looked like these? [holds up a factual text about the human body]
E: Yes.
T: Just one, was that enough?
E: No.
T: Why not? Why couldn’t we just read one book and that just be enough? James?
S: Because it wouldn’t tell us everything about
49
the body.
T: It couldn’t tell us everything could it? So, what’s another reason that we just don’t only read one book? Jack?
S: We…we… can’t read this one book.
T: You can’t read this book? Do you have friends read it with you?
S: Yes.
T: And Mum?
S: Yes.
T: And teachers? Why can’t we just read one book? It doesn’t tell us everything. Tony?
S: Um, it might not ans…answer all the questions.
T: Certainly might not answer all of our questions. Thomas?
S: And sometimes when you read a book about the human body, when…it’s…when you read a book and it tells us about a body you, like, could read another book and it might tell the same.
T: Brilliant. Because if we’re researching can we just believe one person, one book?
E: No.
T: No, we need to fi nd it in another book. [holds up another factual text about the human body] Sometimes we need to fi nd it in three books [holds up another factual text about the human body] just really to make sure that the things that they’re telling us are true. We’re checking aren’t we? You guys are beautiful researchers.
Vicki carefully guides the discussion with clear purpose and
direction, ‘What have we been doing in our research…who can
remember?’, as she develops the children’s knowledge base
through carefully sca! olded questioning, ‘Did we read fi ction
books…did we read non-fi ction books?’ She moves them
beyond factual knowledge to higher order reasoning, ‘Why
couldn’t we just read one book and that just be enough?’ In
this way she challenges and extends children’s thinking, ‘What’s
another reason that we just don’t only read one book?’ The
children are actively involved in the discussion, demonstrating
clear understanding of the purpose and their ability to respond
to the teacher’s challenge, ‘We can’t read just one book; you,
like, could read another book and it might tell the same’.
Whilst she has carefully sca! olded this discussion to elicit
much of the information from the children, Vicki draws this
part of the discussion to a close by reiterating the main point,
that it is important to consult more than one text in order to
check the authenticity of information, ‘Can we believe just
one person, just one book…we need to fi nd it in another
book….in three books…just to make sure the things they’re
telling us are true…we’re checking aren’t we’. She concludes
by explicitly praising the children for their research skills before
they continue the discussion and view the DVD in the library.
In this example it is clear that Vicki is addressing the resources
of the text and user as she questions the children about the
types of texts they have read to locate information. She has
also inducted them into the resource of critical text analyst as
she helps them refl ect on why they have used various sources
to answer their questions.
In common with other more e! ective teachers located at
high levels of the item map, Vicki has moved the children
between factual and higher levels of text knowledge. All four
more e! ective teachers at this location provided children with
a carefully sca! olded lesson about features of texts. It can
be seen in the following extracts that they taught children
important reading strategies that could be transferred to other
situations and texts. Lyn focuses on the structure of a non-
fi ction book, and how to use this structure to gain information.
T: [holding up a factual text and turning the pages] So if I looked at page twenty, there it is, it’s telling me all about beetles. There’s another page that I can look at like a contents page but it has a di! erent name, who can tell me the other one? There’s another page in my book. Go on Jennifer, you’re bursting!
S: Index.
T: Good girl, it’s the index and I was going to tell you… Where would I fi nd the index Hamish?
S: At the very back.
T: And what does the index tell us?
Elizabeth and Gill use fi ctional texts in order to focus on
particular text features. Elizabeth reviews the elements of a
narrative to sca! old the children’s own story writing.
T: Now what do stories have? When I was thinking about how I was going to write my story… What do all stories have? Have a look up here. [points to wall charts showing beginning, middle and end] Are you ready Ryan? Have a look up here? Someone with their hand up? Brittany?
S: A beginning, a middle and an end.
T: Fantastic, all stories have a good beginning, an interesting one so everyone wants to read it; they have a great middle and then an end.
In a viewing activity that follows the reading of the picture
poetry book Each Peach Pear Plum Gill compares the
connection between the illustrations and the text of two
di! erent picture books.
T: What made you look at the pictures? Why did you look at the pictures? Well we said in Handa’s Surprise the illustrator made

50
the pictures big, he made it close-up. Is this what the illustrator in this book [Each Peach Pear Plum] did or did the illustrator in this book do something di! erent?
S: Did something di! erent.
T: Well what did he do that was di! erent?
S: He made them look a bit small.
Explanation text: location 0
This Pre-primary class has been studying the topic of the planets. In this example an e! ective teacher is nearing the end of a reading of the big book Postcards from the Planets. She discusses the book with the children as preparation for writing their own postcard from a planet.
T: [reads from big book] ‘It’s strange to think we’ll be asleep for four months, Matt.’ [Points to an illustration.] Up here it’s not a postcard but there’s some writing. I wonder if you can tell how you think they’re talking to Aunty May. She says, ‘Is that you Aunty May? It’s great to hear your voice again. When I woke up we were already in earth orbit and now we can see the space-port just below us. See you at home tomorrow.’ How would she be talking to Aunty May if she’s on here [pointing to the book]? Brittany?
S: On the telephone.
T: On the telephone maybe. What else might they have? Brad?
S: A walkie talkie.
T: A walkie talkie or a radio. And here [turns the page and points to an illustration of a newspaper] is some more writing but it’s not a postcard.
S: It’s a newspaper.
T: It’s a newspaper, good girl. And the newspaper is telling everyone back on earth that the space ship has landed safely with all the people inside so that means all these people that were writing postcards are safely back to earth after their big trip.
In common with the other teachers around this location this
teacher uses questioning to check understanding of text
level concepts and provides for some extension of children’s
participation in the text, ‘How would she be talking to Aunty
May if she’s on here?’. The teacher draws attention to several
forms of text that contain ‘writing’ (speech bubble, post card
and newspaper), although there is little elaboration on other
features of these forms. Children are actively involved in the
discussion, and are responsive to the teacher’s questions.
They are able, with some support from the teacher, to
complete the associated writing task. In all episodes around
this location, teachers explained information, concepts or
text features at levels appropriate to the children’s literacy
development.
Explanation text: lower locations
In examples that were at the lower end of the item map,
teachers did not usually have a clearly articulated purpose
for the task. Discussion of text was frequently limited to
sequenced factual recall of text, where the children were
questioned about the order of events, ‘What happened fi rst in
the story?’, and they responded with one or two word answers.
Although children were usually attending to the task, there
was little opportunity for analysis and extension of text level
concepts. Task instructions were confi ned to presentation of
work, such as left to right and top to bottom direction of text.
In these examples tasks were not at an appropriate level for the
children; some were too easy, some were too di" cult. The tasks
focused mainly on procedural knowledge and, as there was
little or no sca! olding, some children did not complete them
as intended. Texts used by the teachers in these examples were
confi ned to narrative picture books.
Summary
Teaching at the text level was less frequently observed than
teaching at the word level. It was observed in over half of the
examples in the more e! ective teachers’ classrooms, in one
third of the examples in the e! ective teachers’ classrooms
and around one seventh of the examples in the less e! ective
teachers’ classrooms. It was not observed at all in three of less
e! ective and one of the e! ective teachers classrooms. In terms
of quality of text level teaching the examples of four of the
more e! ective teachers were very clearly di! erentiated from
the rest.
In the classrooms of these four more e! ective teachers there
were very high levels of discussion around text that required
high order thinking. It was clear, when the video observations
were made towards the end of the school year, that the
children were very familiar with a number of text types and
were able to transfer this knowledge to new situations and
make comparisons between di! erent texts and text types, and
to critically analyse texts. The text types chosen by teachers
included a range of fi ction and non-fi ction texts within
print, video and interactive media. When using non-fi ction
texts children were sca! olded to learn strategies for fi nding
the information they needed, to consult a number of texts,
and to question the authenticity of texts. When fi ction was
used they were required to make comparisons between the
intentions of di! erent illustrators and to focus on the elements

51
of narrative in order to guide their own story writing. Children
were challenged to make use of the resources of text user, text
participant and text analyst.
In general, the examples from the classrooms of the other
more e! ective and the more highly located e! ective teachers
still showed a strong emphasis on the structure of texts that
was often related to a writing task. Further, children were
required to refl ect on text at levels above the literal, although
there was not the high level of challenge that was observed in
the examples from the four most highly ranked more e! ective
teachers’ classrooms.
Oral-written language
The teacher makes logical connections between oral and written language
The Oral-Written Language teaching practice, that was not
included in the original version of CLOS, has been added to
CLOS-R to allow examination of the connections that teachers
make for children between oral and written language. In order
for young children to become literate they need to be able
transfer their knowledge of oral language, which they have
been learning informally and using for some years, to the
written form that becomes the most important focus of formal
teaching in the early years of school. It is important for teachers
to make connections between these modes explicit in their
literacy teaching as when literacy development is viewed
from a systems perspective oral language plays an important
part in organising cognitive and behavioural systems that
support literacy learning (Nelson, 1996). There is evidence
for the view that children learn more e" ciently when they
develop language and literacy concepts and skills together
so that ‘interconnections among systems can be fashioned
into mutually reinforcing systems’ (Dickinson, McCabe & Essex,
2006, p. 12).
In terms of the aspects of language for which connections
between oral and written forms need to be made there is
research evidence for the importance of making clear the
connections between oral and written forms for vocabulary,
syntax, discourse and phonemic awareness (Dickinson
et al., 2006).
There has been much research into the practice of reading
aloud to children (Bus, vanIJzendoorn & Pellegrini, 1995;
Scarborough & Dobrich, 1994) in which children are able to
hear written language structures and forms and view both
the text that is read and associated pictures. It is not only the
reading of the text itself that is important, but also the talk
that takes place around the text when it focuses children’s
attention on the content of the written text, engages them
in ideas and sca! olds their creation of meaning (McKeown &
Beck, 2006). Such ‘substantive conversation’, as it is described in
the Productive Pedagogies Theoretical Framework (Education
Queensland, 2002), involves ‘sustained conversational dialogue
between students, and between teacher and students to
create or negotiate understanding of subject matter’ (p. 4).
There is some evidence that this type of sustained high-level
conversation may be absent in many early years classrooms,
particularly those that contain children from lower socio-
economic backgrounds, who may also not be exposed to this
type of discourse in their out of school contexts (Teale, Paciga
& Ho! mann, 2007; Neuman, 2006).
In the frequency analysis the practice of Oral-Written Language
was observed in 134 of the 190 coded episodes and was
observed at least once in the classrooms of all teachers.
The number of episodes in which it was observed for
individual teachers ranged from a maximum of 10 to a
minimum of 1. The mean score for the more e! ective teachers
was 9.57, for the e! ective teachers the mean score was 6.29
and for the less e! ective teachers the mean score was 4.6 out
of a possible total of 10.
It can be seen in Figure 17 that the six highest locations on
the Oral-Written Language item map are occupied by more
e! ective teachers and they are widely dispersed from 1 to 5
logits. Most of the e! ective teachers are located between 1 and
-0.5 logits and three of the less e! ective teachers are located at
the bottom of the map at -3 logits. Two less e! ective teachers,
two e! ective teachers and one more e! ective teacher are
located near the bottom of the map in locations -1 to -2.5.
Oral-written language : location 5
Elizabeth, a more e! ective teacher, makes many explicit
connections between oral and written language in the
following example that is located at the highest point of the
item map. She has been working with the children on an
integrated theme around Australian animals. She has read
them stories and played games about Australian animals,
she has set up the classroom environment so that it contains
images and information to support the children’s learning
about the theme and the children have been sca! olded to use
the computer as a research tool to fi nd information. Prior to
this lesson and over several writing sessions, the children have
begun writing their own narratives about Australian animals.
As the lesson begins Elizabeth is sitting at the easel, with the

52
children gathered around her on the fl oor. She has written the
sentence ‘Good authors make great pictures in your head’, at
the top of a large sheet of paper that she places on the easel
for the children to see.
T: Can you just quickly remind me again what good authors do? Just see if you can read that in your head and we’re going to make a list underneath of what good authors do. Just read that in your head. Is there someone who could read that for us? Daniel?
S: ‘Good authors make great pictures in your head.’
T: ‘Good authors make great pictures in your head.’ When I’m reading a book, sometimes when I’m tucked up in bed at night and I’m reading a book I really love it because even though my book doesn’t have pictures in the book I have lots of//
S: //You imagine them.
T: I imagine them, you’re right and I’ve got fantastic pictures in my head.
S: It’s called your imagination.
T: It is. What did you say Brittany?
S: It’s like a movie in your head.
T: Yes, so…
S: But if it’s getting boring and then the picture’s boring in your head, but if it starts to get
exciting it makes the movie a bit more better.
T: Yes makes it more interesting, you’re right. Now can we make a list of those things that you said that good authors do? Oh, I need to use some bullets. I wonder what I should use for bullets.
S: Speech bubbles.
T: Speech bubbles for bullets? OK, because we might be saying, ‘What it is that good authors do?’ That’s a good idea. Yes?
S: Books.
T: Oh what a good idea, we could use books for bullets. OK. [draws a book] I hope that’s OK. That’s my fi rst bullet. So what do good authors do? Can you tell me again? I’ll write them down. Nathan?
S: They have good describing words.
T: Fantastic. They use really good describing words. Can you stretch out words for me while I write it?
E: /w/-/er/-/d/-/s/.
T: Did you say E-R Renee for the /er/ sound? You’re very clever because that is one way to make the /er/ sound. Good girl. Have a look in the word words; what two letters are standing together to make /er/?
S: O R.
T: O R. Is that true, can O R really make an /er/
3.5
4
4.5
5
3
2.5
2
1.5
1
0.5
0
-0.5
-1
-1.5
-2
-2.5
-3
More e!ective teachers
E!ective teachers
Less e!ective teachers
Figure 17. Oral/written language: Item map showing locations for teachers’ examples

53
sound?
S: Yes you don’t say /w/-erds you say words.
T: I think it might be the /er/ sound; stretch it out.
E: /W/-/er/-/d/-/s/.
T: Fantastic. [Points to the vowel sounds on the THRASS chart] Yes look E R can make an /er /sound but so can O R. Oh look.
S: Some people say […] it like that but they say it di! erent to get all the right letters.
T: Oh do they?
S: Yes.
T: OK. All right. Good authors use great describing words. What else do good authors do? I’ll put my next bullet. OK. I wonder if you can help us Fay. Be thinking, I might ask you next. Brittany?
S: Talking.
T: Oh yes, they get their characters to talk. You can put some talking in to your writing; that makes it very interesting. Fantastic. Another bullet. I love that idea of using books for bullets. OK.
It can be seen that Elizabeth is creating high level talk around
text as she reviews with the children the elements of a
narrative, focussing on the characteristics of good authors with
the intention of sca! olding the children’s own story writing.
She has begun by clearly outlining the task, ‘We’re going to
make a list underneath of what good authors do,’ and then
engaging the children in a guided discussion of the topic.
The opening oral discussion about what good authors do
becomes concentrated for a while on the importance of
good writing as ‘painting pictures in your head’. Elizabeth then
refocusses the children on the task of making a list, this time
in terms of the format required by the text type and the use
of bullets for signalling the items. She makes highly specifi c
connections between spoken and written text as she records
the children’s ideas on paper, beginning with the bullet
point and followed by the sentence ‘Good authors use great
describing words’. As she begins to write this sentence she asks
the children to make connections between spoken sounds and
written letters, ‘Can you stretch out the words for me while I
write it?’
This leads into a guided discussion of the relationship between
the phoneme /er/ and its graphemic representation in the
word word, ‘Did you say E R Renee for the /er/ sound? You’re
very clever because that is one way to make the /er/ sound.’
It can be seen that throughout this discussion the concepts
of phonemes (oral language) and graphemes (written
language) are clearly distinguished. The discussion is resolved
as Elizabeth demonstrates the use of a known spelling strategy
by referring the children to the THRASS chart where they can
see alternative spelling patterns for the phoneme /er/. Once
the correct spelling is established and demonstrated Elizabeth
returns the children’s attention to creating the items for her to
write on the list.
It can be seen that in this example Elizabeth has engaged the
children in making connections between oral and written
language at very high levels. These connections have included
talk around features of exemplary written narratives, in
demonstrations and/or discussions of relationships between
phonemes and graphemes and in the recasting of children’s
spoken syntactic forms into the appropriate written form for a
list, ‘Good authors….’ Throughout Elizabeth has engaged the
children through her enthusiasm that has created a conspiracy
of learning as she has prompted and questioned the children
about things she pretends to be unsure of, ‘Can you just quickly
remind me again…?’ ‘Is that true…?’ The children have actively
listened and responded as she has praised creative thought,
‘I love that idea for using books for bullets,’ ‘Fantastic. They use
really good describing words,’ thus reinforcing their high levels
of talk around text.
Oral-written language : locations 1-3.5
Like Elizabeth, the more e! ective teachers located between 1
and 3.5 logits on the item map made very clear connections
between oral and written language. In their coded examples
they addressed a number of connections between the two
forms, showing a clear purpose for their instruction that helped
to make connections logical and meaningful. The examples
from these more e! ective teachers showed oral to written
language connections that were linked to a larger unit of work,
theme or inquiry and they had high expectation of children’s
involvement in the lesson. Connections between the oral and
the written elements of the task were explicitly taught, with
appropriate sca! olding and specifi c, sometimes corrective,
feedback.
In the following extract from Vicki’s classroom, the children
are asked to relate information in the text being read aloud to
them to information gained from previously read texts. This
activity requires high levels of thinking, which the teacher
encourages through targeted questioning. As she probes
and persistently reinforces concepts and content specifi c
vocabulary previously learnt, she extends the children’s content
knowledge and through the discussion helps them relate
knowledge gained from di! erent texts.
T: [reading from text] ‘Insects feed in two ways. Some insects bite and chew their food. Ants
54
and caterpillars feed this way.’ But we know that some other insects… What do they use to eat? What’s it called Matthew?
S: The jaw.
T: Not the jaw.
S: The proboscis.
T: The proboscis, good boy Brendon. What does a proboscis look like? What’s another good name for it Courtney? It’s like a…?
S: The butterfl y’s mouth.
T: It is the butterfl y’s mouth, what it is Jessica?
S: A straw.
T: It’s like a drinking straw. So… ‘Some insects suck their food up through a hollow tube called a…’
E: ‘Proboscis’.
T: That’s right. And butterfl ies, mosquitoes and fl ies feed in this way.
The following extract shows Gill working with children to
transpose knowledge from the oral to written form. She had
initially intended to write a sentence about healthy food, but
when a Pre-primary child volunteers to do this she sca! olds his
e! orts. T: /h/-/e/-/l/-/th/-/y/ [looks at child’s writing on the
whiteboard]. How are we going to write the /ee/ phoneme ?
S: Like that? [pointing to the letter E on the wall]
T: No. [looks around the group of children] Who have we got here today?
S: I know.
T: You know. What do you think Zac?
S: Y.
T: We do, we use a Y! Well done, we use a Y. [guides child’s hand as he writes] I’ll hold your hand because it has to come like that. So we have now written ‘healthy’.
Here the teacher very carefully segments the word into
phonemes as the child writes and, as he does so, asks another
child for the correct graphemic representation of the fi nal
phoneme /ee/. She then guides the child’s hand so that he is
supported in forming the letter and she draws the children’s
attention to the correctly written word. In this way she ensures
that the children are exposed to a correct written model. She
also ensures that appropriate metalanguage is used as she
relates letters to phonemes.
In the next extract from Vicki’s classroom the children are
participating in a daily calendar activity, where one child leads
the reading of the day chart. Participation from all children is
encouraged as the teacher ensures that they make links from
written to spoken words. This activity builds on the children’s
phonological development and their understanding of
words as single units of speech. The use of a pointer to guide
oral reading shows these Pre-primary children very clear
correspondences between written and spoken words as the
leader has fun with the teacher, having the power to make the
class read fast or slowly.
T: OK, point to each word.
E: ‘Today is Thursday’ [reading as child moves pointer along the words].
T: They’re not allowed to read without you pointing.
[child points to the word the]
E: ‘The’.
T: [aside to children] It’s fun isn’t it?
[child points to 31st]
E: ‘31st’.
T: Isn’t that fun because they can’t go on.
[child points to of August]
E: ‘Of August 2007’.
T: Shall we make them go fast now? [child moves pointer quickly along the sentence ’The weather is rainy’.]
E: ‘The weather is rainy.’
Oral-written language : lower locations
Examples located at 0.5 and lower showed lower levels of
engagement by the teacher and tasks with lower levels of
purpose and challenge. Although the children appeared to
understand the purpose of activities, the focus was usually
on task completion rather than on the explicit teaching of
the relationships between oral and written language or on
creating substantive conversation around text.
One less e! ective teacher who had read aloud a big book,
followed by a cursory discussion of it by the children, then
gave the following brief instructions for the making of a story
map: ‘Now you’re going to have to think, you have to have your
thinking caps on because you need to draw a picture of every
part of the story.’ Another read aloud the instructions for a
photocopied work sheet with no explanation of the purpose of
the task: ‘It says, trace along the dotted line then you’re going
to colour the balloon with the B inside the balloon.’
Teachers’ questions focussed on literal understanding, rather
than on extension of thought. Connection to a sequence of
learning was limited, making it di" cult for the children to
make connections with prior knowledge about relationships
between oral and written language.

55
Summary
All teachers made some connections for their children
between oral and written language. In terms of quantity, the
Oral-Written Language practice was observed in almost all
episodes of the more e! ective teachers, around two thirds
of the episodes of the e! ective teachers and almost half of
the episodes of the less e! ective teachers. There were great
di! erences in the quality of the connections made between
the language modes, with a range on the item map from -3
to 5 logits. The item map also showed very clear di! erences
between the more e! ective teachers as a group and the
other two teacher groups, in that the six highest locations
on the item map (from 1-5 logits) were occupied by more
e! ective teachers (and one e! ective teacher), most of the
other teachers were grouped below them and three of the less
e! ective teachers were clustered at the very bottom of
the map.
The highly located more e! ective teachers made very clear
and substantive connections for children between oral and
written language. These teachers read to their children from
a variety of texts and provided opportunities for extended
conversations about written text and its conventions, thereby
creating or extending interconnections between language
systems. To this end they discussed with children and clarifi ed
subject specifi c vocabulary and concepts encountered in
written text and they initiated conversations with their class
about substantive features of written text in which meaning
was negotiated as children’s contributions were accepted
and built upon. They made very clear connections between
spoken and written language in terms of grapheme-phoneme
correspondences and they modelled particular syntactic
structures in both spoken and written forms.
These frequently challenging connections between language
modes were made for children in an atmosphere of mutual
respect and pleasure in learning and as part of a larger learning
sequence or theme that allowed for connections to be
integrated into other cognitive and behavioural systems.
Metalanguage
The teacher provides children with language for talking about and exemplifying literacy concepts
The teaching and learning of literacy involves children thinking
about language in new ways. It necessitates refl ection on
the form of both spoken and written language, that is, it
makes the elements of language ‘opaque’ and brings them
into conscious awareness (Olson, 1994; Watson, 2001). Olson
(1994) has used the term ‘metalanguage’ to refer to speech or
writing that focuses on any aspect of language. Much of the
research into metalanguage in young children has concerned
the ways in which they become metalinguistically aware and
how these are related to reading acquisition (see for example,
Tunmer, Herriman & Nesdale, 1988; Bowey, 2005). The aspect of
metalinguistic awareness that has received the most attention
has been phonological awareness as it has been clearly shown
to be causally related to later reading achievement (see
Burgess, 2006, for a review). The development of awareness
of syntax, pragmatics and semantics have all received
some attention (Tunmer, Pratt & Herriman, 1984) but their
relationship to later reading and writing is less clear.
Once children begin school it is expected that there will be
explicit refl ection on the form of language, that it will become
more teacher managed and will have some explicit focus
on code breaking (Morrison, Connor & Bachman, 2006). The
Productive Pedagogies Framework (Education Queensland,
2002) identifi es metalanguage as important in e! ective
classrooms. Classrooms demonstrating high-metalanguage
instruction are defi ned as having an emphasis on discussion
about talk and written language, about how written and
spoken texts work, about specifi c technical vocabulary, and
about how sentences work. What seems to be particularly
important in the early years of school, when children are
learning important concepts about written language, is that
teachers provide children with specifi c technical linguistic
vocabulary and use this terminology consistently in discussion
about spoken and written language.
The literacy teaching practice of Metalanguage was observed
in 133 of the 190 coded episodes. It was observed at least once
in the classrooms of all teachers. The number of episodes in
which it was observed for individual teachers ranged from a
maximum of 10 to a minimum of 1. The mean score for the
more e! ective teachers was 9.71, for the e! ective teachers the
mean score was 6.86 and for the less e! ective teachers the
mean score was 3.4 out of a possible total of 10.
Figure 18 shows the majority of less e! ective teachers
clustered at the lowest end of the item map. Four of the more
e! ective teachers form a group at the highest location, well
separated from the other teachers, with another more e! ective
teacher in the next highest location. The rest of the teachers,
that is all the e! ective teachers, two of the more e! ective
teachers and two of the less e! ective teachers are located in
between, within a relatively small range.
Metalanguage: locations 1.5- 3.5
Examples from the fi ve more e! ective teachers at these
locations showed metalanguage being used to make the
purpose of lessons clear. These teachers used metalinguistic
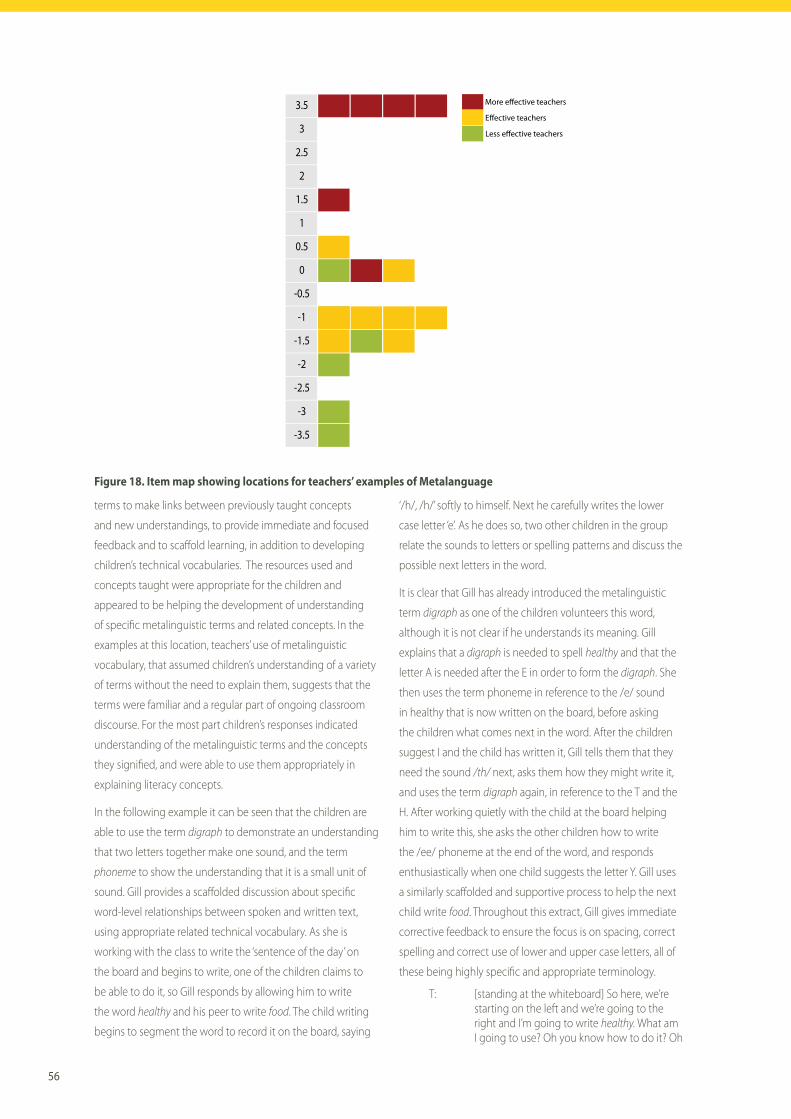
56
terms to make links between previously taught concepts
and new understandings, to provide immediate and focused
feedback and to sca! old learning, in addition to developing
children’s technical vocabularies. The resources used and
concepts taught were appropriate for the children and
appeared to be helping the development of understanding
of specifi c metalinguistic terms and related concepts. In the
examples at this location, teachers’ use of metalinguistic
vocabulary, that assumed children’s understanding of a variety
of terms without the need to explain them, suggests that the
terms were familiar and a regular part of ongoing classroom
discourse. For the most part children’s responses indicated
understanding of the metalinguistic terms and the concepts
they signifi ed, and were able to use them appropriately in
explaining literacy concepts.
In the following example it can be seen that the children are
able to use the term digraph to demonstrate an understanding
that two letters together make one sound, and the term
phoneme to show the understanding that it is a small unit of
sound. Gill provides a sca! olded discussion about specifi c
word-level relationships between spoken and written text,
using appropriate related technical vocabulary. As she is
working with the class to write the ‘sentence of the day’ on
the board and begins to write, one of the children claims to
be able to do it, so Gill responds by allowing him to write
the word healthy and his peer to write food. The child writing
begins to segment the word to record it on the board, saying
‘/h/, /h/’ softly to himself. Next he carefully writes the lower
case letter ‘e’. As he does so, two other children in the group
relate the sounds to letters or spelling patterns and discuss the
possible next letters in the word.
It is clear that Gill has already introduced the metalinguistic
term digraph as one of the children volunteers this word,
although it is not clear if he understands its meaning. Gill
explains that a digraph is needed to spell healthy and that the
letter A is needed after the E in order to form the digraph. She
then uses the term phoneme in reference to the /e/ sound
in healthy that is now written on the board, before asking
the children what comes next in the word. After the children
suggest I and the child has written it, Gill tells them that they
need the sound /th/ next, asks them how they might write it,
and uses the term digraph again, in reference to the T and the
H. After working quietly with the child at the board helping
him to write this, she asks the other children how to write
the /ee/ phoneme at the end of the word, and responds
enthusiastically when one child suggests the letter Y. Gill uses
a similarly sca! olded and supportive process to help the next
child write food. Throughout this extract, Gill gives immediate
corrective feedback to ensure the focus is on spacing, correct
spelling and correct use of lower and upper case letters, all of
these being highly specifi c and appropriate terminology.
T: [standing at the whiteboard] So here, we’re starting on the left and we’re going to the right and I’m going to write healthy. What am I going to use? Oh you know how to do it? Oh
3.5
3
2.5
2
1.5
1
0.5
0
-0.5
-1
-1.5
-2
-2.5
-3
-3.5
More e!ective teachers
E!ective teachers
Less e!ective teachers
Figure 18. Item map showing locations for teachers’ examples of Metalanguage
57
OK, you do it then.
S: /h/ /h/ [child stands at the board and writes lower-case H and E]
S: There’s a digraph.
S: And an L.
S: No, but it’s a digraph
T: An L makes a digraph does it? We do need a digraph but it’s not with an L, it’s with an A [teacher writes lower-case A next to child’s writing of he] and let’s make this a capital because it’s the beginning [teacher changes lower-case H to capital H]. Right, OK, we’ve got the /e/ phoneme, what do we need next? /h/ /e/ /l/
S: L
S: L
T: Mmm. [child writes lower case L]
T: Then we need /th/, how are we going to write /th/?
S: Oh yeah
T: It’s another digraph, it’s another digraph with a T and an H.
S: T! and H!
S: A little T? [child writing on the board]
T: [addressing child writing on the board] A little T, like this one [points to ‘t’ in another word on the board] and now a little H. Not like you did at the beginning. [child hears incorrectly and writes capital H; teacher changes it to lower-case] No, that’s a capital; let’s make that small. OK? We don’t have capital letters in the middle of words.
T: [addressing whole class] /h/ /e/ /l/ /th/ /ee/. How are we going to write the /ee/ phoneme ?
S: Like that? [pointing to E on wall behind]
T: No. Who have we got here today? [looks around group]
S: I know.
T: You know. What do you think Zac?
S: Y.
T: We do, we use a Y, well done, we use a Y. I’ll hold your hand because it has to come like that [guides child’s hand]. So we have now written ‘Healthy’. Can you write food? [asking another child] [break in transcript as teacher draws two children’s attention back to the task]
S: Yep!
T: OK have a go. Oh did you leave a space in between the two words?
S: No.
T: Oh dear and are you going to use a capital? You want a little one because it’s in the middle of a sentence. Food, how are you going to
write the /oo/ phoneme, /oo/?
S: O.
T: O, you’re right, double O in fact.
S: And that makes the /oo/ sound.
T: foo /d/.
S: /d/.
In the following extract from another example at this level Vicki
models and guides a text-level discussion on how to access
information through the use of an index page. She makes
this purpose clear and provides feedback and sca! olding that
draws attention to the similarities between the features of a
contents page, with which the children are already familiar,
and the relatively new concept of an index page. She explains
the use of the index page for locating information in a non-
fi ction text. Throughout this discussion, Vicki’s accurate use
of metalanguage provides children with language for talking
about these text features.
T: [showing the children a factual text that the class has just used to talk about the function of a contents page] There’s another page that I can look at like a contents page but it has a di! erent name. Who can tell me the other one? There’s another page in my book. Go on Courtney, you’re bursting?
S: Index.
T: Good girl, it’s the index and I was going to tell you… Where would I fi nd the index Angus?
S: At the very back.
T: At the very back. And what does the index tell us Jason?
S: What di! erence it is.
T: Sort of, you’re on the right track. Olivia what does it tell us?
S: It tells you, it tells you where the two numbers are.
T: Well it can tell you all the pages of what…? Matthew?
S: What, what they do.
T: It could tell me what they do, yes?
S: About the book.
T: Not so much about the book but about the…?
S: Bugs.
T: About the bugs. So if I wanted to look up butterfl ies when we were doing butterfl ies last week I would have looked on page six, page eight, page ten and page twenty-two.
For teachers at this level metalinguistic vocabulary was
often integrated and contextualised into the class inquiry

58
or theme. These teachers carefully questioned children to
elicit information and then used the information to extend
and challenge children’s thinking. In this way, the children’s
understanding of metalinguistic concepts and terms was
developed and extended. In the extract below, that takes place
in the library and has been preceded by a discussion of the
types of literacy resources available in a library, Vicki initiates an
extended discussion within the theme of research about the
human body that begins with a focus on the metalinguistic
terms title and spine. She challenges the children to identify
similar features on a DVD and a book cover and to analyse the
purpose of having the title on the spine (to read the title when
the book or DVD is on a library shelf ). They are able to do this
using specifi c metalinguistic vocabulary appropriately. Even
in this brief extract it can be seen that the children are familiar
with a variety of other metalinguistic terms such as book, DVD,
words, title.
T: [holding up a DVD case] So this is a DVD about…?
Ss: The body.
T: [holding up a book] And this is a book about…?
Ss: The human body.
T: They both have something that’s similar. What do they have? Kiara?
S: […].
T: They both have spines. On the spine they both have something. What do they have Isabella?
S: Words.
T: Yes they both have words on the spine. Very clever. Who can tell me what the words are? James?
S: The title.
T: The title, very clever. Why would they do that? Why would the person who published this book or made this DVD, why would they do that? Brooke?
S: It’s because if it doesn’t have the um title on the spine that means you have to pull the book out to see the title.
The active discussion continues after this extract with a focus
on the classifi cation system used in the library, the location of
resources and di! erent purposes of texts (factual to inform,
tell us real things, the truth and fi ction to entertain us) and
cartoons as forms of characters.
Teachers at this location carefully sca! olded the children
to focus them on content, form and the appropriate use
of specifi c metalinguistic terms. They provided many
opportunities to consolidate children’s understanding and use
of metalanguage as they persistently reinforced specifi c terms
as part of their literacy teaching. In the following example
Megan is sca! olding one child as he reads aloud to the
class a sentence that she has written on the easel in order to
teach the strategy of reading to the end of the sentence if an
unknown word is not readily decodable. She recasts one child’s
contribution of dot into the technical terminology of full stop
and points out that the next step in the strategy is to decide if
the sentence makes sense, a step that she repeats several times
to ensure that it is understood. Here Megan is using known
metalinguistic terms to help children consolidate a partly
learned strategy.
T: This word is too hard to sound out so what’s another thing that he could do? Taleah?
S: Go to the next word.
T: Go right to the…, not just the next word. Where do we go? Read to the where?
S: Read to the dot.
T: Read on to the full stop. Read on to the full stop and then you think about what would make sense don’t you? What would make sense. What would make sense.
These more e! ective teachers taught and used a wide
variety of technical vocabulary that addressed a wide range
of metalinguistic concepts, showing that they took a broad
approach to the content and form of literacy teaching. In
their examples the fi ve more e! ective teachers at this level
addressed a wide range of literacy concepts and provided
the children with the associated technical vocabulary with
which to discuss and process the concepts. Evidence of this
can be seen in the range of metalinguistic terms used in these
examples that included:
type of book, information book, reading, listening, contents,
content, published books, library, borrow, front cover, DVD, title,
encyclopaedia, book spine, words, spaces, left, right, write, digraph,
capital, beginning, phoneme, little ‘t’, page, pages, picture clues,
index, numbers, information, published, numbers, spine label,
fi ction, purposes, question, true, entertain, inform, characters,
cartoons, story, middle of words, words, sentence, double ‘O’,
sentences, capital, full stop, author, describing words, talking,
characters, list, bullets, book, pictures, movie, reading, imagine,
make sense, read on, sound out, read out loud.
Metalanguage: locations 0-0.5
In three of the four examples at these locations there was
an emphasis on word level concepts. Related metalinguistic

59
vocabulary was used appropriately to provide children with
practice and repetition of specifi c concepts.
T: You’re getting very good at hearing the end of words and when you’re writing you’re using the beginning sounds and you’re using the end sounds. Now I’ve also got some pictures and we’re going to listen for the end sound.
Many of these examples showed teachers using questions as
a means of focussing the children on specifi c metalinguistic
terms and their meaning. In doing so, these teachers used
precise and appropriate language.
T: It’s got a capital letter B at the beginning and it’s got a full stop at the end so do you think it might be a sentence? I think it is. If it’s got a capital letter at the beginning and a full stop at the end is it a sentence?
The teachers provided some sca! olding of the form and use of
some metalinguistic terms, or of strategies the children could
use in their reading and writing.
T: [looking at a big book with the children] Now could we have a look at this word here? ‘I can’t sleep’, can’t. Can you tell me something about that word? Carol can you remember?
S: It’s a shortened word.
T: It is a shortened word and it’s got a special name hasn’t it? Can you remember what we called shortened words Jessica?
S: It means that we’ve taken a word out of it
T: It means we’ve taken a letter out of it so if we put the letter back in what would it say? Instead of can’t it would s ay… Blake?
S: Can not.
T: I can not. Good boy. I can not sleep. And that’s got a special name. Can you remember what the special name is starting with a /c/ Mimi?
S: Contraction.
T: Good girl, contraction, we call it a contraction. Good girl.
The metalinguistic terms used by these teachers refl ected
the aspects of literacy that were taught and practised. It can
be seen in the following list that shows many of the terms
used by these teachers that there was an emphasis on word
level aspects with one teacher attending to the structure of
narrative text:
question mark, full stop, capital, sentence, lower case, beginning,
whole sentence, end, shortened word, letter, word, contraction,
starting with, end sound, end of word, hearing, writing, beginning
sounds, pictures, story, narrative structure, title, orientation,
characters, setting, beginning, ending, start, problem.
Metalanguage: lower locations
Most of the teachers at lower locations usually used
metalinguistic terms that were appropriate, but gave little
explanation of their meaning and did not build on the
children’s understanding. There was generally a focus on the
activity in which the terms were used, rather than on the terms
themselves.
T: Remember with your writing … don’t make all your letters capitals. Remember they’re lower-case.
Within these activities, some support for particular literacy
concepts using appropriate terminology was sometimes
provided to individual children, although there was little or no
extension of learning.
T: And what do you need at the end of a sentence?
S: Fullstop.
However, at the very lowest locations teachers’ use of the
terms letter and sound was sometimes confused, making it
di" cult for children in the early stages of reading and writing
to gain a stable understanding of these basic concepts that
are essential components of reading and writing. Where more
complex concepts such as question and statement were
discussed explanations were unclear or confused. Teachers’
use of metalanguage did not appear to be part of a planned
teaching sequence. Feedback provided was minimal, and
did not build on children’s knowledge and did not correct
misunderstandings.
The technical terms related to spoken or written language
that were used by the teachers in these lower locations were
for the most part amongst those commonly used by teachers
in higher locations and mostly referred to basic concepts. It
was clear from these teachers’ examples that they quite often
used non-technical terms that did not precisely describe the
concept or skill being addressed. It was also clear that when
technical terms were used they were either not explained or
inadequately explained, and it was often unclear whether the
children understood them. The concepts represented by the
following terms, and used in these teachers’ examples, were
often superfi cially addressed:
title, author, illustrator, blurb, understand, picture, number, list,
characters, newspaper, re-reading, ideas, picture, page, book,
library, means, story, front (of the book), sound, letters, capitals,
lower case, words, full stop, write, writing, written, read, sentence,
mistake, joining word, exclamation mark, sentences, dot, dash,
questions, statement, answer.
60
Summary
In the frequency analysis, the practice of Metalanguage,
in which the teacher provides children with the language
for talking about and exemplifying literacy concepts, was
observed in almost all the episodes of the more e! ective
teachers. It was observed in just over two thirds of the e! ective
teachers’ episodes, and just under two fi fths of the episodes
of the less e! ective teachers. In term of the quality of this
practice, there were clear di! erences between these groups of
teachers in that nearly all of the more e! ective teachers were
clustered at or near top of the item map and the majority of
the less e! ective teachers were clustered near the bottom.
The more e! ective teachers, who were clustered at the top
of the item map, consistently used a wide variety of technical
literacy-related vocabulary in highly appropriate ways. This
technical vocabulary represented the expertise of these
teachers in exposing the children to a broad view of literacy
that included extended and deep discussion about word
level features including phonological awareness and phonics,
sentence forms, comprehension of text, use of texts and
some critical analysis of text. Appropriate use of this technical
vocabulary enabled children to consciously refl ect on the
form of language as well as on its content and interpretation.
Further, the more e! ective teachers’ high level technical
use of metalanguage was accompanied by other high-level
classroom practices that consistently supported the children’s
learning.
3 . 5 E F F E C T I V E T E A C H I N G O F E A R L Y Y E A R S L I T E R A C Y
In view of the highly controlled methodology of pair-wise
analysis and the strong relationships shown between
teacher e! ectiveness in terms of the literacy growth of their
students, and observation of teachers’ classroom practice
in terms of the Classroom Observation Schedule – Revised
(CLOS-R), it is possible to draw some conclusions about the
teaching practices of the sample of e! ective teachers of
early years literacy.
The more e! ective teachers of Pre-primary and Year
1 children took a broad approach to the teaching of
literacy that did not rely on any one aspect. They took
a highly structured systematic approach to the explicit
teaching of word-level knowledge and skills that included
phonological awareness, phonics and spelling. These
teachers identifi ed a sequence of what needed to be
taught, taught it explicitly, persistently reinforced what
was being learnt and provided many opportunities for
guided and independent practice. They also provided the
children with the specifi c metalinguistic terminology with
which to refer to this knowledge and they ensured that
they and the children used such terminology consistently.
Their careful articulation of focus words and parts of words
helped children attend to the concepts being taught, as did
their embedding of these foci within the context of games,
quizzes and other highly motivating activities that included
songs and dances. Another feature of these teachers was
that they often embedded their teaching of word level
concepts and skills within a broad theme of work so that
children were able to see a purpose and use skills and
knowledge in meaningful ways.
Also embedded within a broader context were these
teachers’ explanations of sentence level concepts that were,
however, much less frequent than explanations of word
level concepts. Whilst the more e! ective teachers were
clearly di! erentiated from the e! ective and less e! ective
teachers in terms of frequency and quality of word level
explanations, these di! erences were less clear for sentence
level explanations. There was some talk, mostly in oral
language interactions, about using complete sentences
and punctuating them in written language but, with one
notable exception, there was little explicit talk about the
content of sentences in addition to their form. Nevertheless,
particular sentence forms clearly modelled by teachers and
the implicit requirement in particular activities to express
content within a specifi c sentence structure were features
of the more e! ective teachers’ classrooms.
The more e! ective teachers had a clear emphasis on text
features. They introduced children to a range of texts
and created high levels of thoughtful discussion around
them. By the middle of the school year when the video
observations were made it was evident that the children
in their classes were familiar with a range of text types that
included fi ction and non-fi ction within a range of print,
video and interactive media. When using non-fi ction texts
children were learning strategies for fi nding the information
they needed, to consult a number of texts, and to question
the authenticity of texts. When fi ction was used they were
required to make comparisons between the intentions
of di! erent authors and illustrators and to focus on the
elements of narrative in order to guide their own story
writing. Children were challenged to make use of the
resources of text user, text participant and text analyst.
61
The more e! ective teachers all had a good command
of spoken language and created many opportunities
for developing and extending the oral language of the
children in their classrooms. For children in Pre-primary
and Year 1 this is particularly important as instruction
and general communication rely on this medium. The
more e! ective teachers were clearly di! erentiated in both
quantitative and qualitative analyses from the e! ective
and less e! ective teachers in the ways in which they
encouraged children’s use of oral language. These teachers
introduced their children to a variety of discourses and
situations in which oral language skills were developed and
extended. Tasks included dramatising stories, thoughtful
and extended discussion around texts and high-level oral
language games. It was clear that these teachers were
highly engaged in classroom oral language activities as
they provided targeted support to children, based on their
own sustained active listening to the content and form of
children’s responses.
Not only did the more e! ective teachers have a strong
focus on oral language as a medium of instruction and
communication, they also demonstrated and encouraged
children to make the connections between oral and
written language modes. As a group they were clearly
di! erentiated from the e! ective and less e! ective teachers,
particularly with regard to the quality of the connections
made. They made clear and substantive connections for
children between oral and written language. These teachers
read to their children from a variety of texts and provided
opportunities for extended conversations about written
text and its conventions, thereby creating or extending
interconnections between language systems. To this end
they discussed and clarifi ed with children subject specifi c
vocabulary and concepts encountered in written text and
they initiated extended conversations with their class about
substantive features of written text in which meaning was
negotiated as children’s contributions were accepted and
built upon. They made very clear connections between
spoken and written language in terms of grapheme-
phoneme correspondences and they modelled particular
syntactic structures in both spoken and written forms.
In making these connections between language modes
the more e! ective teachers consistently used a wide variety
of technical literacy-related vocabulary. This technical
vocabulary represented the expertise of these teachers
in exposing the children to a broad view of literacy that
included extended and deep discussion about word level
features including phonological awareness and phonics,
sentence form, comprehension of text, use of texts and
some critical analysis of text.
This broad view of literacy was presented by the more
e! ective teachers to children in classrooms that were
characterised by consistency in the use of all CLOS-R
teaching practices. Children attended to literacy tasks and
there was mutual respect between teacher and children in
terms of rapport, credibility of the teacher and citizenship,
including equality and recognition of the needs of others,
practices that were demonstrated to some extent by all
teachers. Children were motivated to take part in literacy
tasks and there was a clear sense of their purpose, practices
demonstrated to some degree by many teachers. The more
e! ective teachers had high levels of awareness of children’s
participation and their literacy teaching was structured, it
had strong forward momentum and addressed substantial
aspects of literacy, practices demonstrated consistently by
some teachers.
The more e! ective teachers’ classrooms were also
characterised by a number of teaching practices that
few of the other teachers demonstrated with any degree
of consistency. These teachers provided high levels of
support in their literacy lessons, with many opportunities
for practice of taught concepts and skills, as they made
use of all available opportunities for literacy teaching and
practice and made clear connections between known
and new concepts and skills. They provided high quality
corrective feedback, made systematic use of the literacy
environment and challenged children to engage in high
levels of thinking. They di! erentiated literacy instruction for
individual needs, based on formal or informal assessment
of children, encouraged independent learning and were
fl exible in responding to children’s literacy contributions.
What was particularly noticeable in the observation of
the teachers’ classrooms was the dynamic and complex
mix of all the CLOS –R teaching practices. These teachers
seamlessly moved between word, sentence and text level
according to their knowledge of the children, the literacy
concepts and the skills that needed to be taught.

72

73
64
4 . N U M E R A C Y P H A S E 1 : D E V E L O P M E N T O F T H E C L A S S R O O M O B S E R V A T I O N I N S T R U M E N T
4 . 1 I N T R O D U C T I O N
The Trends in International Mathematics and Science Study
(TIMSS) data (NCES, 2003 and 1999 TIMSS Video Study
(Hiebert et al., 2003) drew attention to a need to improve the
quality of teaching in lower secondary mathematics classes
in Australia (Hollingsworth, Lokan, & McCrae, 2003) and in
other participating countries (Desimone, Smith, Baker, & Ueno,
2005; MacNab, 2000). As part of the Numeracy Research and
Development Initiative (2001-2004), the Australian Government
provided over $7 million to fund 4 National projects and
10 States and Territories projects to investigate teaching and
learning strategies associated with e! ective teaching; that is,
teaching that leads to improved numeracy outcomes for students.
To empirically substantiate improvements in teaching quality
or investigate e! ective teaching in mathematics classrooms,
robust measures of teaching quality and teaching e! ectiveness
must be available.
The rhetoric espoused in standards documents that promote
excellence in mathematics teaching often equates the idea of
teaching quality with teaching e! ectiveness and these terms
are often used interchangeably. However, by considering
each to be di! erent constructs, where teaching quality
relates to teachers’ pedagogy and teaching e! ectiveness
relates to student outcomes, the critical question requiring
empirical investigation becomes apparent: Does teaching
quality (as it is defi ned to be) lead to (predict or explain)
teaching e! ectiveness? Research to date that has examined
whether or not measures of teaching quality account for
teaching e! ectiveness in terms student achievement gains,
is very sparse (Hill, Rowan & Lowenberg Ball, 2005; Schoen,
Cebulla, Finn, & Fi, 2003). Thus, very little research is available
to empirically substantiate (or refute) fi ndings and theories
relating to e! ective teaching. A limiting factor has been a
lack of appropriate measures that represent the quality of
mathematics teachers and teaching. Traditionally in research,
the quality of mathematics teaching has been considered
in terms of easily quantifi able, proxy variables representing
teacher characteristics, such as those pertaining to qualifi cations
in mathematics and mathematics education, number of years
teaching, and verbal skills (e.g., Akiba, LeTendre, & Scribner,
2007; Wayne & Youngs, 2003). Few measures to date have been
developed to quantify characteristics of teaching actions.
The aim of this research project was to build on existing
research by developing an observation schedule that could
be used to measure teaching quality. Based on a review of
recent government reports released in Australia and the UK,
the Teaching of Mathematics Observation Schedule (ToMOS)
was developed to record the occurrence of specifi c teacher
actions relating to (a) promoting conceptual understanding
and (b) communicating expectations. To pilot test the ToMOS,
an examination of student achievement gains in Year 8
mathematics classes was undertaken. Using an equal interval
Rasch scale, mathematics achievement scores were collected
for 2,864 students (132 classes) at the end of Year 8 and
matched with achievement scores collected at the end of Year
7. Based on a value-added model, achievement gains were
estimated to represent a measure of teaching e! ectiveness.
A small subset of teachers was then observed teaching using
the ToMOS. Findings from the pilot test indicated that the
actions specifi ed on the schedule can be reliably observed and
suggest that a signifi cant, positive relationship exists between
the ToMOS measure of teaching quality and a measure of
teaching e! ectiveness (based on student achievement gains).
The ToMOS was developed in response to the need for new
instruments that measure teaching quality in lower secondary
mathematics classrooms. This instrument allows future research
to validate fi ndings and theories of e! ective mathematics
teaching, and provides a useful measure for assessing
e! orts to improve the quality of mathematics teaching. It is
anticipated the ToMOS will also become a useful refl ective
tool for mathematics teachers (both inservice and preservice
teachers) who are looking to improve their e! ectiveness. For
these reasons, details of how to code, record and score the
ToMOS are provided for teachers or researchers wanting to use
the instrument. In addition to the development of a valuable
instrument for investigating the quality of mathematics
teaching, the results revealed considerable variance in
achievement gains estimated for similar classes taught by the
same teacher. The implications for research and educational
decision making based on multilevel analyses of student
learning gains in secondary school settings are discussed in
light of these fi ndings.
4 . 2 B A C K G R O U N D
While teachers are not the only infl uence on student
achievement, they make a signifi cant contribution to it. In a
meta-analysis of over 500,000 studies that examined factors
that impact on student achievement, Hattie (1992, 2003)
estimated that teacher factors accounted for about 30% of

65
variance in student achievement. This compared with student
factors (such as prior cognitive ability and disposition to learn)
that were estimated to account for around 50% of variance,
school factors (such as class size and leadership e! ectiveness)
that accounted for about 5-10%, home factors (such as levels
of parental expectations and encouragement) that accounted
for about 5-10%, and peer factors (such as bullying and peer
tutoring) that accounted for 5-10% of variance.
Contemporary value added models, such as the Covariate
Adjustment Model (CAM) and the Annual Gains Model (AGM),
are often used to partition variance in student achievement
gains into di! erent levels (e.g., the student level, teacher or
classroom level, and the school level). Attempts to quantify
the e! ect teachers make based on the amount of variance to
be explained at the teacher or classroom level, have produced
di! erent estimates depending on the model of analysis used
(Rowan, Correnti, & Miller, 2002). Nevertheless, a substantial
proportion of variation in student achievement gains is
thought to lie within schools rather than between schools
(Konstantopoulos, 2006), and in the early years at least, teacher
e! ects appear to be larger for mathematics achievement than
reading achievement (Nye, Konstantopoulos & Hedges, 2004).
An early body of research examining teacher traits and
characteristics of teaching episodes associated with
achievement gains was reviewed by Brophy and Good (1986).
In this review, a distinction was made between presage
variables used to operationalize teacher traits, including
enthusiasm and years of experience, and process variables
used to operationalize characteristics of teaching episodes,
including time spent on whole class teaching. These variables
were among those considered most infl uential in explaining
achievement gains at this time. It could be argued that
this body of research needs updating if it is to be relevant
and inform current practice, given the shift in focus from
teacher centred learning to student centred learning, and
greater recognition of constructivist learning principles. Less
contentious is the argument that this research needs to be
substantiated and extended based on the improved statistical
models now available to estimate student achievement gains
and investigate teacher e! ects.
More recently, there has been renewed interest in the
mathematics education literature to develop improved
measures of presage and process variables in an attempt
to explain teaching e! ectiveness. For example, Hill, Rowan
and Lowenberg Ball (2005) developed a measure of teachers’
pedagogical knowledge for teaching mathematics (a presage
variable) and found it to explain a signifi cant amount of
variance in student achievement gains. A number of process
variables capturing mathematics teachers’ use of reform
teaching strategies have also been developed and found to
explain student achievement gains (Schoen, Cebulla, Finn, &
Fi, 2003; Saxe & Gearheart, 1999; McCa! rey, Hamilton, Stecher,
Klein et al., 2001). However, the number of contemporary
studies of this nature published in scholarly journals is not in
proportion to the current emphasis placed on very specifi c
criteria promoted in standards for mathematics teaching.
Furthermore, a closer look at the measures representing
instructional practices aligned with current educational
reforms reveals that they are largely based on teacher
self-reports and to a lesser extent, on expert ratings of
observed practice where the observation criteria are not
made explicit. This is worth noting for two reasons: from a
research perspective, there is often a disparity between what
mathematics teachers report they do and what they actually
do in the classroom (Mayer, 1999); from an educational
perspective, fi ndings from observations based on expert
ratings may not be easily adapted to preservice and in-service
education programs, particularly if the rating criteria are not
made transparent.
Given the current emphasis and proliferation of teaching
standards in mathematics, including Standards for Excellence
in Teaching Mathematics in Australian Schools (Australian
Association of Mathematics Teachers [AAMT], 2006), and
Principles and Standards for School Mathematics (National
Council of Teachers of Mathematics [NCTM], 2000), it is
somewhat surprising to fi nd a dearth of contemporary studies
that have substantiated the e! ectiveness of actions commonly
associated with quality teaching by showing that these actions
explain exceptional achievement gains made by students.
Such studies are critical if theories of e! ective teaching are
to be empirically substantiated. Research developments of
this nature are hindered by a lack of suitable instruments for
measuring teaching quality.
The aim of this research project was to develop an observation
schedule that could be used in situ to identify specifi c teaching
actions that are commonly associated with e! ective teaching.
The report is presented in three phases: (a) developing the
ToMOS based on a review of the literature and preliminary
testing, (b) measuring teaching e! ectiveness based on an
estimate of Year 8 student achievement gains, and (c) pilot
testing the ToMOS by examining the relationship between
teaching quality and teaching e! ectiveness.

66
4 . 3 P H A S E 1 : D E V E L O P I N G T H E T E A C H I N G O F M A T H E M A T I C S O B S E R V A T I O N S C H E D U L E
As the chosen method of data collection in this project was
observation, it was thought that public time would be the
most appropriate time in the lesson to observe teaching
actions. Public time refers to segments in a lesson when
the teacher and students are involved in public (rather than
private) interaction. Public time was defi ned to take the
following forms:
• The teacher providing an explanation, demonstration, or
instruction to the class;
• A class discussion where teacher and students
participate; or
• Students’ sharing ideas, solution methods, and processes
with the class.
Public time was operationalised as being a segment of time
lasting at least one minute long. Thus to qualify for a shift
between public and private time, the episode of time must last
for at least one minute.
The objective of Phase 1 of the research project was to
construct items for the observational schedule based on a
review of relevant literature. Findings from the review were
categorised into themes, actions associated with each theme
were identifi ed and items were written. Preliminary testing
of each item was then carried out and certain items were
eliminated or refi ned.
Reviewing the literature
The literature reviewed encompassed 10 recent large-scale,
government funded studies in mathematics education, which
are summarised in Table 19. The studies were chosen based on
the criteria that they incorporated an investigation of where
e! ective teaching was likely to be taking place (based on an
analysis of achievement gains or the extent to which learning
outcomes were enhanced) together with some examination
of teacher characteristics and/or teaching practices. Three
of the studies reviewed involved inquiry in lower secondary
mathematics classes in Australia:
• Investigation of e! ective mathematics teaching and
learning in Australian secondary schools (Ingvarson, Beavis,
Bishop, Peck, Elsworth, & Australian Council for Educational
Research, 2004);
• Middle years numeracy research Project 5-9 (Siemon,
Virgona, & Corneille, 2001); and
• School innovation: Pathway to the knowledge society
(Cuttance & Innovation and Best Practice Consortium
[IBPC], 2001).
The fourth was an international study that targeted teaching in
Year 8 classes in seven countries including Australia:
• Third international mathematics and science study (TIMSS)
1999 video study (Hiebert et al., 2003; Hollingsworth,
Lokan, & McCrae, 2003).
Four of the large-scale studies were part of the Australian
Government Numeracy Research and Development Initiative
2001-2004 and were directed at primary education (K-7):
• Building mathematical understanding in the classroom:
a constructivist teaching approach (Catholic Education
South Australia [CE SA], 2004);
• Researching numeracy teaching approaches in primary
schools (Victorian Department of Education and Training
[Victorian DET], Catholic Education Commission of Victoria,
& Association of Independent Schools of Victoria, 2004);
• Teachers enhancing numeracy (Department of Education,
Science and Training [DEST], Education Queensland [Ed
Qld], Queensland Catholic Education Commission, &
Association of Independent Schools of Queensland, 2004);
and
• What’s ‘making the di! erence’? Achieving outstanding
numeracy outcomes in New South Wales primary schools
(DEST), New South Wales Department of Education (NSW
DET), Catholic Education Commission New South Wales, &
Association of Independent Schools of New South Wales,
2004).
The other two large-scale studies focused on primary
education and were based in the UK:
• E! ective teachers of numeracy (Askew, Brown, Rhodes,
Johnson, William, 1997) and
• the Leverhulme study (Brown, 2000; Brown et al, 2003).
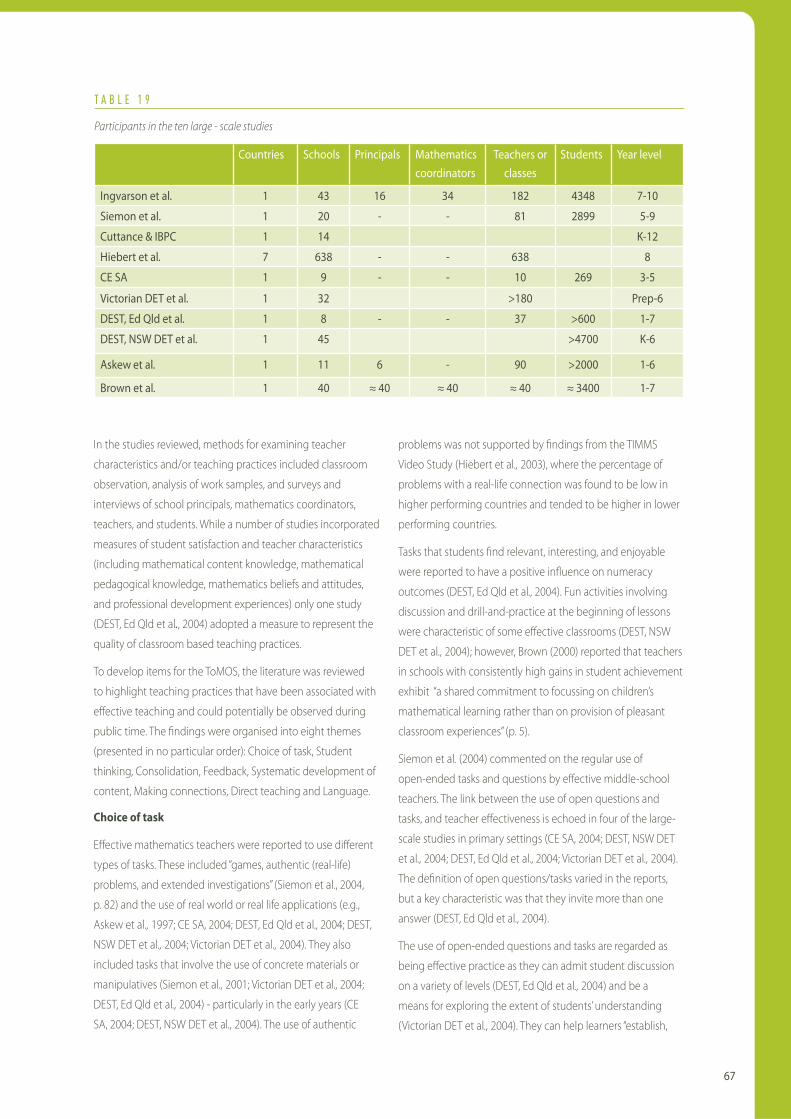
67
T A B L E 1 9
Participants in the ten large - scale studies
Countries Schools Principals Mathematics coordinators
Teachers or classes
Students Year level
Ingvarson et al. 1 43 16 34 182 4348 7-10
Siemon et al. 1 20 - - 81 2899 5-9
Cuttance & IBPC 1 14 K-12
Hiebert et al. 7 638 - - 638 8
CE SA 1 9 - - 10 269 3-5
Victorian DET et al. 1 32 >180 Prep-6
DEST, Ed Qld et al. 1 8 - - 37 >600 1-7
DEST, NSW DET et al. 1 45 >4700 K-6
Askew et al. 1 11 6 - 90 >2000 1-6
Brown et al. 1 40 * 40 * 40 * 40 * 3400 1-7
In the studies reviewed, methods for examining teacher
characteristics and/or teaching practices included classroom
observation, analysis of work samples, and surveys and
interviews of school principals, mathematics coordinators,
teachers, and students. While a number of studies incorporated
measures of student satisfaction and teacher characteristics
(including mathematical content knowledge, mathematical
pedagogical knowledge, mathematics beliefs and attitudes,
and professional development experiences) only one study
(DEST, Ed Qld et al., 2004) adopted a measure to represent the
quality of classroom based teaching practices.
To develop items for the ToMOS, the literature was reviewed
to highlight teaching practices that have been associated with
e! ective teaching and could potentially be observed during
public time. The fi ndings were organised into eight themes
(presented in no particular order): Choice of task, Student
thinking, Consolidation, Feedback, Systematic development of
content, Making connections, Direct teaching and Language.
Choice of task
E! ective mathematics teachers were reported to use di! erent
types of tasks. These included “games, authentic (real-life)
problems, and extended investigations” (Siemon et al., 2004,
p. 82) and the use of real world or real life applications (e.g.,
Askew et al., 1997; CE SA, 2004; DEST, Ed Qld et al., 2004; DEST,
NSW DET et al., 2004; Victorian DET et al., 2004). They also
included tasks that involve the use of concrete materials or
manipulatives (Siemon et al., 2001; Victorian DET et al., 2004;
DEST, Ed Qld et al., 2004) - particularly in the early years (CE
SA, 2004; DEST, NSW DET et al., 2004). The use of authentic
problems was not supported by fi ndings from the TIMMS
Video Study (Hiebert et al., 2003), where the percentage of
problems with a real-life connection was found to be low in
higher performing countries and tended to be higher in lower
performing countries.
Tasks that students fi nd relevant, interesting, and enjoyable
were reported to have a positive infl uence on numeracy
outcomes (DEST, Ed Qld et al., 2004). Fun activities involving
discussion and drill-and-practice at the beginning of lessons
were characteristic of some e! ective classrooms (DEST, NSW
DET et al., 2004); however, Brown (2000) reported that teachers
in schools with consistently high gains in student achievement
exhibit “a shared commitment to focussing on children’s
mathematical learning rather than on provision of pleasant
classroom experiences” (p. 5).
Siemon et al. (2004) commented on the regular use of
open-ended tasks and questions by e! ective middle-school
teachers. The link between the use of open questions and
tasks, and teacher e! ectiveness is echoed in four of the large-
scale studies in primary settings (CE SA, 2004; DEST, NSW DET
et al., 2004; DEST, Ed Qld et al., 2004; Victorian DET et al., 2004).
The defi nition of open questions/tasks varied in the reports,
but a key characteristic was that they invite more than one
answer (DEST, Ed Qld et al., 2004).
The use of open-ended questions and tasks are regarded as
being e! ective practice as they can admit student discussion
on a variety of levels (DEST, Ed Qld et al., 2004) and be a
means for exploring the extent of students’ understanding
(Victorian DET et al., 2004). They can help learners “establish,

68
consolidate, extend, reinforce and refl ect on concepts, skills and applications” (DEST, NSW DET et al., 2004, p. 161). Open-endedness can also be constituted through asking students to use di! erent solution strategies (DEST, Ed Qld et al., 2004). For example, The TIMSS Video Study highlighted the teaching strategy of analysing multiple student solutions to a single problem used in Japan (a higher achieving country). This approach has since attracted much international interest (Groves et al., 2004).
Based on a review of literature relating to the theme Choice of Task, a teacher action labelled Multiple Solution Strategies was included in the ToMOS.
Student thinking
Teachers who draw out and build upon student thinking were identifi ed in the literature as being e! ective. CE SA (2004) reported that learning outcomes improved when teachers (a) established students’ mathematical thinking using questioning techniques then (b) continued this interactive process to support students in building mathematical understanding. DEST, NSW DET et al. (2004) concluded that an important strategy for maintaining focus on learning was building on students’ knowledge and experiences. One of Askew et al.’s (1997) major fi ndings was that highly e! ective teachers use pupils’ methods and reasoning as starting points for engaging with numeracy concepts, establishing mental strategies for calculating, making mathematical connections, and addressing misconceptions. Siemon et al. (2004) concluded that “teaching approaches which value and build on each student’s contribution … are more likely to lead to improved numeracy outcomes” (p. 106).
Student thinking can be drawn out using purposeful discussion in whole class or small groups settings or with individual pupils (Askew et al., n.d.), or by using particular activities in small group settings that encourage the exploration of ideas (DEST, NSW DET et al., 2004). An e! ective sca! olding practice for building upon student’s understanding was identifi ed (called apprenticing), where the “teacher provides opportunities for more learned peers to operate in a student-as-teacher capacity” (Victorian DET et al., 2004, p. 3).
Based on a review of literature relating to the theme Student Thinking, a teacher action labelled Respect was included in the ToMOS. This is described as the action whereby the teacher responds to a student initiated comment or question in an elaborated way.
Consolidation
A number of reports identifi ed that e! ective teaching involved activities or actions that helped students to consolidate what they had learned. Siemon et al. (2004) observed that e! ective
middle-school teachers encouraged students to refl ect on
what they had learned using class discussions and reviews,
or by using refl ective tools such as learning journals. Victorian
DET et al. (2004) found that one of 12 sca! olding practices that
led to improved learning outcomes was where the “teacher
orchestrates a recount of what was learnt …typically … during
whole class share time at the end of a lesson” (p. 3). DEST NSW
DET et al. (2004) concluded that e! ective lessons included
“a closure that consolidated the concepts and thinking
underlying activities through questioning and discussion” (p.
57-58). The TIMMS Video Study (Hiebert et al., 2003) found that
in higher performing countries, more summary statements
were made about the lessons.
Based on a review of literature relating to Consolidation, a
teacher action labelled Summary was included in the ToMOS.
Feedback
Feedback is mentioned explicitly in 8 of the 10 large scale
studies. One of the major outcomes reported by Siemon et al.
(2001) was that numeracy outcomes improved signifi cantly
in schools when sta! made a commitment to include review
and feedback in each teaching session. In primary settings,
classroom enquiry that included feedback was thought to
enhance numeracy outcomes (DEST, Ed Qld et al., 2004) and
quality teachers were identifi ed as those who (among other
things) monitored individual student learning and provided
individualised feedback (DEST, NSW DET et al., 2004). In
addition, CE SA (2004) commented on the importance of
teachers’ feedback, including written feedback, in students’
workbooks, immediate feedback when teachers converse with
students one-to-one and in small groups, continuous feedback
provided through a range of ongoing assessment strategies,
and feedback that either a" rmed or challenged students’
thinking. On the use of feedback, Askew et al. (1997) found that
highly e! ective teachers used students’ errors as a means of
engaging with them in order to further their understanding.
Based on a review of literature relating to the theme Feedback,
a teacher action labelled Misconceptions was included in the
ToMOS.
Systematic development of content
Several studies reported the systematic use by teachers, of
curriculum documents showing growth points, achievement
indicators, syllabus outcomes, or other logical developments
of mathematics content. For example, DEST, NSW DET et
al. (2004) reported that key strategies which contributed to
outstanding numeracy outcomes were
69
Identifying specifi c outcomes as the lesson focus, linking
indicators to outcomes, structuring explicit teaching
steps to achieve outcomes within a lesson structure that
is predictable, with an introduction, activity focus and
conclusion. (p. 46)
DEST, Ed Qld et al (2004) concluded that planning by teachers
and schools was one of six elements of learning environments
that infl uenced students’ numeracy outcomes most. In
particular, teachers “ability to plan well-connected lessons
and a logical, sequential fl ow of lessons from the general
to the specifi c” (p. 57), and that such planning included
“breaking down instruction into steps that often refl ect
levels or stages of understanding” (p. 57). Another approach
to systematic development of content is reported in the
TIMMS video study (Hollingsworth et al., 2003) as it relates to
problem-solving. Teachers from higher achieving countries
tended to use mathematically related problems that “tie the
content of the lesson together” and are sequenced to “provide
good opportunities for students to construct mathematical
relationships” (p. 67).
Based on a review of literature relating to the theme
Systemmatic Development of Content, a teacher action
labelled Intentions was included in the ToMOS.
Making connections
Making connections is a theme in seven of the large scale
studies reviewed here. Askew et al. (n.d.) described how highly
e! ective teachers connect “di! erent areas of mathematics
and di! erent ideas in the same area of mathematics using a
variety of words, symbols and diagrams” (p. 2). DEST, Ed Qld et
al. (2004) referred to students’ being able to make connections
between di! erent representations of a concept, connecting
real-world enactments, concrete models, language, icons and
symbols, and unusual and prototypic examples. Teachers in
the study by CE SA (2004) were supported by a document
listing connections students might make in relation to
particular concepts. Siemon et al. (2001) noted how e! ective
teaching allows students to make “connections between prior
knowledge and new learning, ‘school mathematics’ and ‘real
world’ applications, and problem-solving strategies” (p. 82).
Siemon et al. elaborated that:
while many students will be able to learn from the
experience of doing, this depends on having access to a
network of related ideas which inform and are shaped by the
doing. Without the linking, connecting ideas and the means
to access and elaborate those ideas, the doing becomes a
boring, repetitive and unproductive exercise. (p. 55)
In the TIMMS Video Study (Hiebert et al., 2003), mathematical
processes that were used to solve problems publicly in class
were coded as either giving results, using procedures only,
stating concepts (with no discussion about mathematical
reasoning), and making connections (where explicit references
were made to mathematical relationships). The percentage of
problem solutions where connections were made
and concepts were stated were relatively high, in higher
achieving countries.
Based on a review of literature relating to the theme Making
Connections, teacher actions labelled Emphasises Meaning and
Multiple Representations were included in the ToMOS.
Direct teaching
The theme of direct teaching was distinguished in six of the
large scale studies. Siemon et al. (2001) commented that “from
the students’ point of view the most important contribution
teachers can make is to communicate mathematical ideas and
texts e! ectively to them, on a one-to-one basis where needed”
(p. 59). Cuttance and IBPC (2001) concluded that one of the
most e! ective practices in developing student capacity in
mathematics is “the use of clear explanations” (p. xvi).
In primary settings, CE SA (2004) observed that e! ective
teachers gave explicit instruction to individual students when
they were working on investigations. DEST, NSW DET et al.
(2004) concluded that that one important factor in maintaining
the focus on learning tasks was “explicit teaching of concepts”
(p. 57). Two of the 12 practices that Victorian DET et al. (2004)
linked with high gains in student achievement have elements
of direct teaching. The fi rst is orienting, where the “teacher
sets the scene, poses a problem, establishes a context, invokes
relevant prior knowledge and experience, provides a rationale”
(p. 3). The second is modelling, where the “teacher shows
students what to do and/or how to do it . . . [and] instructs,
explains, demonstrates, tells, o! ers behaviour for imitation”
(p. 3). By way of contrast to the above fi ndings, others (e.g.,
DEST, Ed Qld, 2004) point out that interactive student-centred
teaching rather than direct teaching enhances numeracy
outcomes. Siemon et al. (2001) made the point that a mixture
of teacher-directed and student-centred approaches is most
e! ective.
Based on a review of literature relating to the theme Direct
Teaching, the teacher action labelled Quality was included in

70
the ToMOS, an action whereby the teacher explicitly states
the criteria for quality work. The previously referred to action
included in the ToMOS labelled Intentions was also related
to this theme. Another action labelled Responsibility was also
included to represent the balance between teacher centred
and student centred learning. This is described as the action whereby the teacher explicitly encourages students to take responsibility for their own learning.
Language
Mathematical language is considered explicitly in six of
the large scale studies. Siemon et al. (2001) reported that
successful middle years’ numeracy schools “attend to literacy
aspects of mathematical texts and representations, for
example, the meaning of terms, written expressions, how to
read diagrams, tables, graphs, symbolic texts” (p. 82). Askew et al. (1997) identifi ed that focusing on the development
of mathematical language is one aspect of developing
students’ reasoning. Victorian DET et al. (2004) highlighted
the necessity of making language explicit. DEST, Ed Qld et
al. (2004) referred to the importance of teachers’ extending
students’ mathematics terminology, which allowed them to
discuss important mathematical ideas. They also observed
that teachers’ inconsistent use of terms caused di" culties in
communication. CE SA (2004) described the e! ective practice
of brainstorming, where the teaching purpose was that
students would link their own language with conventional
mathematical language. Word lists were created and put on
display and new words were added over time.
DEST, NSW DET et al. (2004) concluded that focusing on
language was one of three main factors that explained
improved numeracy outcomes. Strategies included organising
the classes so students could talk, having students work
on tasks in pairs or groups or with a parent or teacher,
having students explain strategies, justify conclusions, and
ask questions of each other, orally or in written language;
emphasising the role of language in mathematics learning,
and encouraging LBOTE students to discuss problems in their
home languages.
Based on a review of literature relating to the theme Language,
the teacher action labelled Mathematical Language was
included in the ToMOS.
Other
The review revealed other notable factors including that
e! ective teachers of mathematics provided a challenging
curriculum, identifi ed and accommodated di! erence including
students’ di! erent capacities and special needs, and used
a range of assessment and monitoring practices to guide
planning. Personal attributes of teachers, such as enthusiasm
for maths and infectious enjoyment for teaching, were also
linked with e! ectiveness. These factors are not detailed in this
review due the di" culty of measuring them using an in situ
observation schedule during public time.
4 . 4 I T E M S E L E C T I O N , R E C O R D I N G A N D S C O R I N G T H E T O M O S
The aim of developing an observation schedule that could be
completed in situ infl uenced the decision to restrict the ToMOS
to ten teaching actions, however initially many items were
considered. For each theme identifi ed in the review fi ndings,
di! erent items were written, describing associated teacher
actions. Care was taken to describe actions that were equally
likely to occur during a maths lesson, regardless of the content
being taught. Preliminary testing of each item was then
carried out.
Preliminary testing involved two ToMOS developers observing
four teachers teach one mathematics class each, at a school
that was equipped with an observation room attached to
a classroom. The observation room contained a one-way
viewing window and was sound proofed. This set up allowed
the developers to discuss any di! erences in the teacher actions
each identifi ed and to construct criteria for a coding manual
to minimize or resolve these di! erences, without interrupting
the class.
Certain items were eliminated because of a di" culty achieving
inter-rater agreement during preliminary testing and based
on adherence to the goal of keeping the teacher actions
objectively observable (as far as possible) without assuming
expertise on behalf of the observers. Eventually ten well
functioning items were chosen to be represented in the
ToMOS. These were categorized into two broad dimensions:
Communicates Expectations and Focuses on Conceptual
Understanding. A description of each action is presented in
Table 20. A coding manual was developed to help identify
each of the ten actions. The coding manual was further refi ned
in Phase 3 and is presented in Appendix 5.
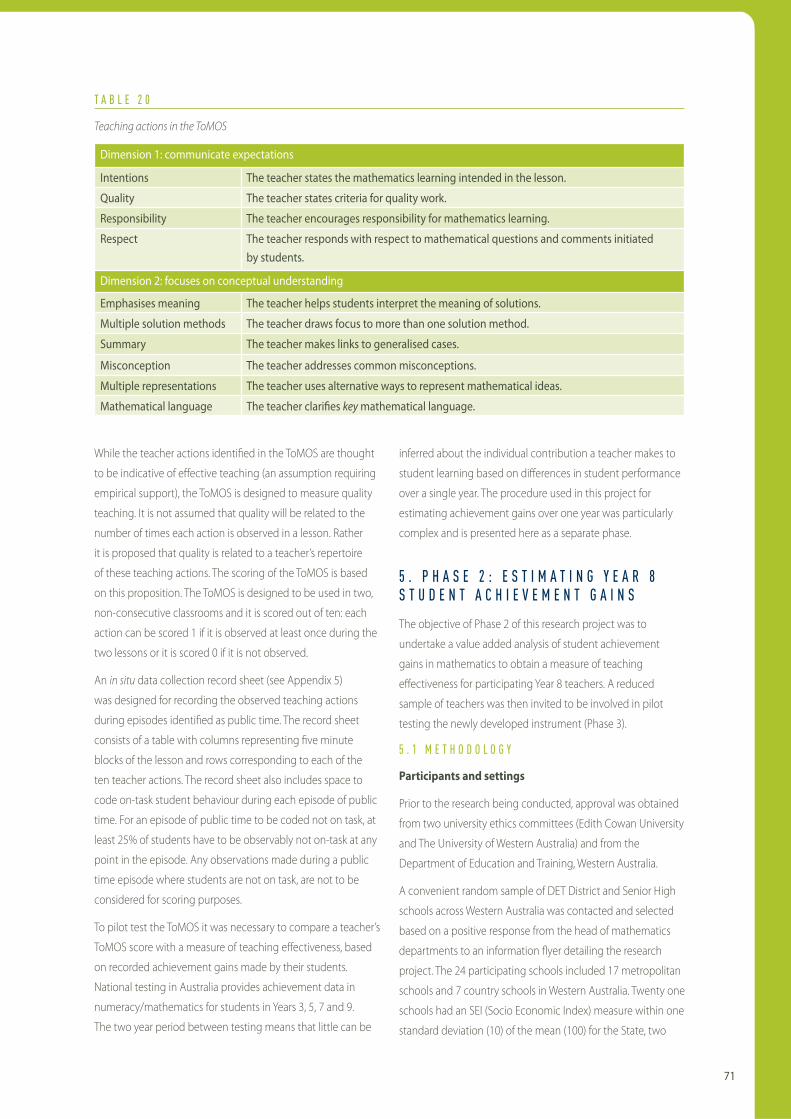
71
T A B L E 2 0
Teaching actions in the ToMOS
Dimension 1: communicate expectations
Intentions The teacher states the mathematics learning intended in the lesson.
Quality The teacher states criteria for quality work.
Responsibility The teacher encourages responsibility for mathematics learning.
Respect The teacher responds with respect to mathematical questions and comments initiated by students.
Dimension 2: focuses on conceptual understanding
Emphasises meaning The teacher helps students interpret the meaning of solutions.
Multiple solution methods The teacher draws focus to more than one solution method.
Summary The teacher makes links to generalised cases.
Misconception The teacher addresses common misconceptions.
Multiple representations The teacher uses alternative ways to represent mathematical ideas.
Mathematical language The teacher clari! es key mathematical language.
While the teacher actions identifi ed in the ToMOS are thought
to be indicative of e! ective teaching (an assumption requiring
empirical support), the ToMOS is designed to measure quality
teaching. It is not assumed that quality will be related to the
number of times each action is observed in a lesson. Rather
it is proposed that quality is related to a teacher’s repertoire
of these teaching actions. The scoring of the ToMOS is based
on this proposition. The ToMOS is designed to be used in two,
non-consecutive classrooms and it is scored out of ten: each
action can be scored 1 if it is observed at least once during the
two lessons or it is scored 0 if it is not observed.
An in situ data collection record sheet (see Appendix 5)
was designed for recording the observed teaching actions
during episodes identifi ed as public time. The record sheet
consists of a table with columns representing fi ve minute
blocks of the lesson and rows corresponding to each of the
ten teacher actions. The record sheet also includes space to
code on-task student behaviour during each episode of public
time. For an episode of public time to be coded not on task, at
least 25% of students have to be observably not on-task at any
point in the episode. Any observations made during a public
time episode where students are not on task, are not to be
considered for scoring purposes.
To pilot test the ToMOS it was necessary to compare a teacher’s
ToMOS score with a measure of teaching e! ectiveness, based
on recorded achievement gains made by their students.
National testing in Australia provides achievement data in
numeracy/mathematics for students in Years 3, 5, 7 and 9.
The two year period between testing means that little can be
inferred about the individual contribution a teacher makes to
student learning based on di! erences in student performance
over a single year. The procedure used in this project for
estimating achievement gains over one year was particularly
complex and is presented here as a separate phase.
5 . P H A S E 2 : E S T I M A T I N G Y E A R 8 S T U D E N T A C H I E V E M E N T G A I N S
The objective of Phase 2 of this research project was to
undertake a value added analysis of student achievement
gains in mathematics to obtain a measure of teaching
e! ectiveness for participating Year 8 teachers. A reduced
sample of teachers was then invited to be involved in pilot
testing the newly developed instrument (Phase 3).
5 . 1 M E T H O D O L O G Y
Participants and settings
Prior to the research being conducted, approval was obtained
from two university ethics committees (Edith Cowan University
and The University of Western Australia) and from the
Department of Education and Training, Western Australia.
A convenient random sample of DET District and Senior High
schools across Western Australia was contacted and selected
based on a positive response from the head of mathematics
departments to an information fl yer detailing the research
project. The 24 participating schools included 17 metropolitan
schools and 7 country schools in Western Australia. Twenty one
schools had an SEI (Socio Economic Index) measure within one
standard deviation (10) of the mean (100) for the State, two
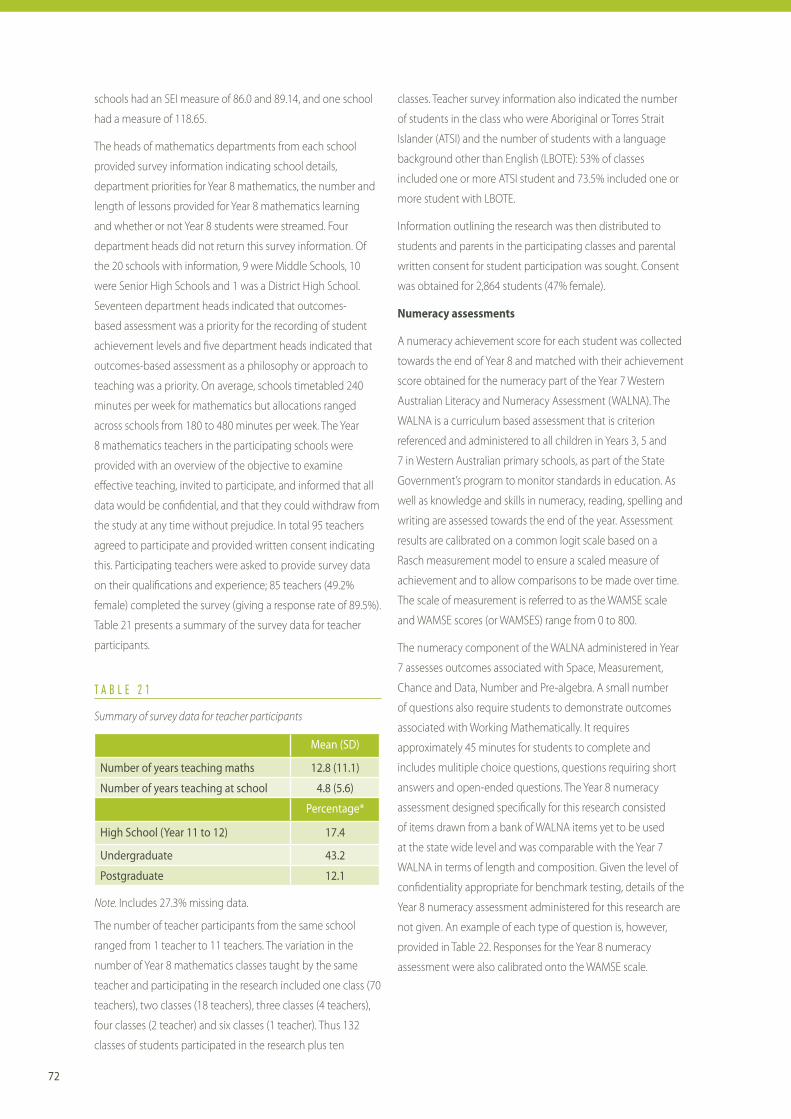
72
schools had an SEI measure of 86.0 and 89.14, and one school
had a measure of 118.65.
The heads of mathematics departments from each school
provided survey information indicating school details,
department priorities for Year 8 mathematics, the number and
length of lessons provided for Year 8 mathematics learning
and whether or not Year 8 students were streamed. Four
department heads did not return this survey information. Of
the 20 schools with information, 9 were Middle Schools, 10
were Senior High Schools and 1 was a District High School.
Seventeen department heads indicated that outcomes-
based assessment was a priority for the recording of student
achievement levels and fi ve department heads indicated that
outcomes-based assessment as a philosophy or approach to
teaching was a priority. On average, schools timetabled 240
minutes per week for mathematics but allocations ranged
across schools from 180 to 480 minutes per week. The Year
8 mathematics teachers in the participating schools were
provided with an overview of the objective to examine
e! ective teaching, invited to participate, and informed that all
data would be confi dential, and that they could withdraw from
the study at any time without prejudice. In total 95 teachers
agreed to participate and provided written consent indicating
this. Participating teachers were asked to provide survey data
on their qualifi cations and experience; 85 teachers (49.2%
female) completed the survey (giving a response rate of 89.5%).
Table 21 presents a summary of the survey data for teacher
participants.
T A B L E 2 1
Summary of survey data for teacher participants
Mean (SD)
Number of years teaching maths 12.8 (11.1)
Number of years teaching at school 4.8 (5.6)
Percentage*
High School (Year 11 to 12) 17.4
Undergraduate 43.2
Postgraduate 12.1
Note. Includes 27.3% missing data.
The number of teacher participants from the same school
ranged from 1 teacher to 11 teachers. The variation in the
number of Year 8 mathematics classes taught by the same
teacher and participating in the research included one class (70
teachers), two classes (18 teachers), three classes (4 teachers),
four classes (2 teacher) and six classes (1 teacher). Thus 132
classes of students participated in the research plus ten
classes. Teacher survey information also indicated the number
of students in the class who were Aboriginal or Torres Strait
Islander (ATSI) and the number of students with a language
background other than English (LBOTE): 53% of classes
included one or more ATSI student and 73.5% included one or
more student with LBOTE.
Information outlining the research was then distributed to
students and parents in the participating classes and parental
written consent for student participation was sought. Consent
was obtained for 2,864 students (47% female).
Numeracy assessments
A numeracy achievement score for each student was collected
towards the end of Year 8 and matched with their achievement
score obtained for the numeracy part of the Year 7 Western
Australian Literacy and Numeracy Assessment (WALNA). The
WALNA is a curriculum based assessment that is criterion
referenced and administered to all children in Years 3, 5 and
7 in Western Australian primary schools, as part of the State
Government’s program to monitor standards in education. As
well as knowledge and skills in numeracy, reading, spelling and
writing are assessed towards the end of the year. Assessment
results are calibrated on a common logit scale based on a
Rasch measurement model to ensure a scaled measure of
achievement and to allow comparisons to be made over time.
The scale of measurement is referred to as the WAMSE scale
and WAMSE scores (or WAMSES) range from 0 to 800.
The numeracy component of the WALNA administered in Year
7 assesses outcomes associated with Space, Measurement,
Chance and Data, Number and Pre-algebra. A small number
of questions also require students to demonstrate outcomes
associated with Working Mathematically. It requires
approximately 45 minutes for students to complete and
includes mulitiple choice questions, questions requiring short
answers and open-ended questions. The Year 8 numeracy
assessment designed specifi cally for this research consisted
of items drawn from a bank of WALNA items yet to be used
at the state wide level and was comparable with the Year 7
WALNA in terms of length and composition. Given the level of
confi dentiality appropriate for benchmark testing, details of the
Year 8 numeracy assessment administered for this research are
not given. An example of each type of question is, however,
provided in Table 22. Responses for the Year 8 numeracy
assessment were also calibrated onto the WAMSE scale.
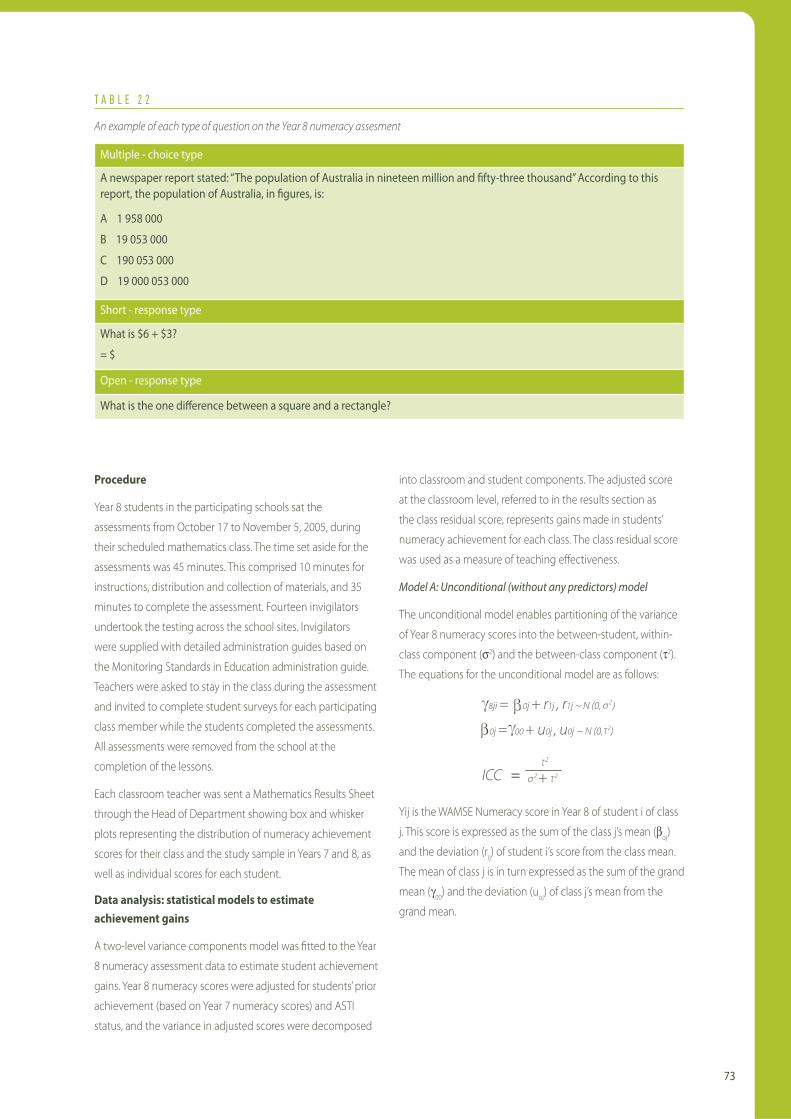
73
T A B L E 2 2
An example of each type of question on the Year 8 numeracy assesment
Multiple - choice type
A newspaper report stated: “The population of Australia in nineteen million and ! fty-three thousand” According to this report, the population of Australia, in ! gures, is:
A 1 958 000
B 19 053 000
C 190 053 000
D 19 000 053 000
Short - response type
What is $6 + $3?
= $
Open - response type
What is the one di" erence between a square and a rectangle?
Procedure
Year 8 students in the participating schools sat the
assessments from October 17 to November 5, 2005, during
their scheduled mathematics class. The time set aside for the
assessments was 45 minutes. This comprised 10 minutes for
instructions, distribution and collection of materials, and 35
minutes to complete the assessment. Fourteen invigilators
undertook the testing across the school sites. Invigilators
were supplied with detailed administration guides based on
the Monitoring Standards in Education administration guide.
Teachers were asked to stay in the class during the assessment
and invited to complete student surveys for each participating
class member while the students completed the assessments.
All assessments were removed from the school at the
completion of the lessons.
Each classroom teacher was sent a Mathematics Results Sheet
through the Head of Department showing box and whisker
plots representing the distribution of numeracy achievement
scores for their class and the study sample in Years 7 and 8, as
well as individual scores for each student.
Data analysis: statistical models to estimate achievement gains
A two-level variance components model was fi tted to the Year
8 numeracy assessment data to estimate student achievement
gains. Year 8 numeracy scores were adjusted for students’ prior
achievement (based on Year 7 numeracy scores) and ASTI
status, and the variance in adjusted scores were decomposed
into classroom and student components. The adjusted score
at the classroom level, referred to in the results section as
the class residual score, represents gains made in students’
numeracy achievement for each class. The class residual score
was used as a measure of teaching e! ectiveness.
Model A: Unconditional (without any predictors) model
The unconditional model enables partitioning of the variance
of Year 8 numeracy scores into the between-student, within-
class component (!2) and the between-class component ("2).
The equations for the unconditional model are as follows:
8ji = 0j + r1j , r1j ~ N (0, )
0j = 00 + u0j , u0j ~ N (0, )
ICC = +
2
2
2
22
Yij is the WAMSE Numeracy score in Year 8 of student i of class
j. This score is expressed as the sum of the class j’s mean (#oj)
and the deviation (rij) of student i’s score from the class mean.
The mean of class j is in turn expressed as the sum of the grand
mean ($00) and the deviation (uoj) of class j’s mean from the
grand mean.

74
Model B: Conditional on Year 7 numeracy (WAMSE) scores
Y8ij = 0j + 1j 7ij + rij , rij ~ N (0, )
0j = 00 + u0j , u0j ~ N (0, )
1j = 10
ICC adjusted for Y1 =
2
2
+2
22
As the objective of this exercise is to study ‘value-added’
residuals during the year, e! ects of student prior performance
in Year 7 and individual variables that may a! ect the
performance in Year 8 should be factored out of the residual.
Year 7 performance, however, was the main predictor of Year
8 performance. This factor would include the e! ects of many
student background variables that were not measured in
the study. In Model B, only the prior performance in Year 7 is
included as a predictor at the student-level model. With the
introduction of the Year 7 scores as a predictor, the regression
intercept #oj is the class mean after adjusting for prior
performance of the student in Year 7. The conditional ICC with
this adjustment can be calculated using the residual variance.
Model C: Conditional on Year 7 scores and other signi! cant individual variables
8ij = 0j + 1j 7ij + 2j ATSIij +rij , rij ~ N (0, )
0j = 00 + u0j , u0j ~ N (0, )
1j = 10 ; 2j = 20
2
2
ATSI status of the student was found to be a signifi cant
predictor of Year 8 performance after adjusting for Year 7 scores.
ATSI status was added as a predictor in the fi nal student-level
model. The resulting regression intercept #oj is the mean for
class j after adjusting for prior performance in Year 7 and the
ATSI status of the students. This adjusted mean can be used as a
measure of teaching e! ectiveness .
5 . 2 R E S U L T S
Numeracy achievement scores were collected for 2,864 Year 8
students, nested within 132 classrooms and 24 schools, towards
the end of the school year. These scores were then matched
with each student’s corresponding Year 7 numeracy score.
Matching scores were not available for 316 students and these
scores were coded as missing data. Based on a valid sample
size of 2,548 students, descriptive statistics for numeracy
achievement scores are given in Table 23.
T A B L E 2 3
Numeracy achievement scores (WAMSES)
Percentile
10th 25th 50th 75th 90th
Year 7 366 412 462 517 561
Year 8 385 429 491 540 598
The median score increased by around 30 WAMSES for
the study cohort; this represents a measure of expected
achievement gain (learning). Students in the 10th percentile,
however, achieved a gain of around 20 WAMSES and those
in the 90th percentile achieved a gain of 37 WAMSES; this
represents a widening of the achievement gap between low
performing and high performing students during Year 8.
A two-level variance components model was fi tted to the
Year 8 numeracy achievement scores. The unconditional
model (Model A) indicated that the proportion of variance in
numeracy achievement was partitioned into 68.1% of variance
at the student level and 31.9% at the class/teacher level. The
conditional model (Model B) incorporated Year 7 numeracy
scores as a predictor of Year 8 numeracy scores and accounted
for 57.7% of variance in numeracy scores. Model C incorporated
Year 7 numeracy scores and ATSI status as a predictor of
Year 8 numeracy scores and accounted for 58.2% of variance
attributed to possible student e! ects on achievement gain.
Model C was chosen over Model B. See Table 24 for a summary
of results.
An achievement gain ‘value-added’ analysis of residuals was then undertaken by adjusting Year 8 numeracy scores for prior achievement and ATSI status to produce adjusted mean-point estimates of residuals for each class. Residuals are displayed in
Figure 19.

75
T A B L E 2 4
Results from the two - level variance components model fi tted to explain Year 8 WAMSE numeracy scores
Model A: unconditional (without any predictors) model
Within (student level) variance 4511.02097
Between (class / teacher level) variance 2114.33414
Total variance 6625.35511
Model B: conditional on prior performance (Year 7 scores)
Within (student level) residual variance 2516.70552
Between (class / teacher level) variance 283.67424
Total unexplained variance 2800.37976
Explained variance 3824.97535
Model C: conditional on Year 7 scores and ATSI status
Within (student level) residual variance 2502.18643
Between (class / teacher level) variance 269.99167
Total unexplained variance 2772.1781
Explained variance 3853.17701
1Class Rank
7 13 19 25 31 37 43 49 55 61 67 73 79 85 91 97 103 109 115 121 127
-40.00
-20.00
0.00
20.00
40.00
60.00
Figure 19. The adjusted residual calculated for each Year 8 classroom
Each circle in Figure 19 represents the adjusted residual calculated for each Year 8 classroom. The whiskers indicate 95% confi dence intervals. The y axis represents residual scores measured in WAMSES. A residual of 0 indicates that the mean achievement gain for the class was exactly that expected based on the performance of the study sample. A residual of 30 indicates that the achievement gain was 30 WASMES about that expected and a residual of -30 indicates that the achievement gain was 30 WASMES below that expected.
Taking a conservative approach to identifying highly e! ective classes, an examination of classes where the achievement gain
adjusted residual and the lower boundary of the uncertainty interval was above that expected, eleven classrooms were highlighted as being highly e! ective. Taking a similar to approach to identify less than e! ective classrooms, an examination of classrooms where the achievement gain adjusted residual and the upper boundary of the uncertainty interval was below that expected, revealed seven classrooms were less than e! ective. This left 114 classes, which were identifi ed as being e! ective (as expected). Descriptive statistics for classrooms identifi ed as being highly e! ective and less than e! ective are presented in Tables 25 and 26.
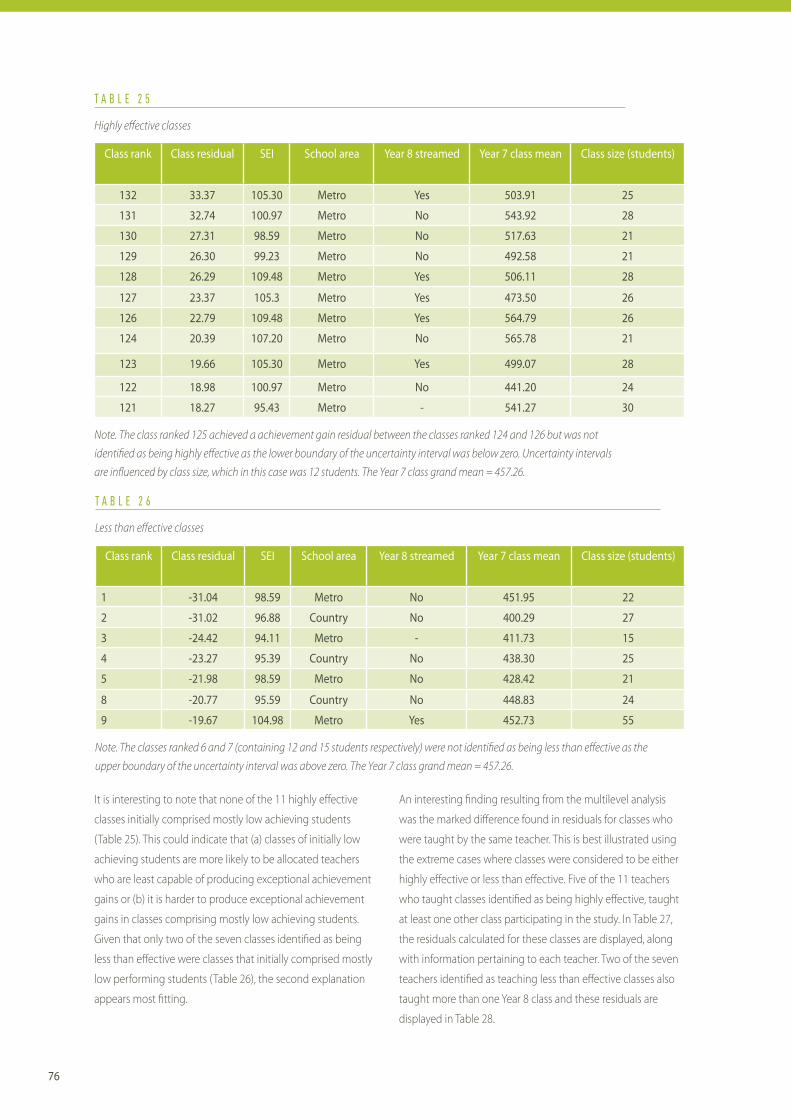
76
It is interesting to note that none of the 11 highly e! ective
classes initially comprised mostly low achieving students
(Table 25). This could indicate that (a) classes of initially low
achieving students are more likely to be allocated teachers
who are least capable of producing exceptional achievement
gains or (b) it is harder to produce exceptional achievement
gains in classes comprising mostly low achieving students.
Given that only two of the seven classes identifi ed as being
less than e! ective were classes that initially comprised mostly
low performing students (Table 26), the second explanation
appears most fi tting.
An interesting fi nding resulting from the multilevel analysis
was the marked di! erence found in residuals for classes who
were taught by the same teacher. This is best illustrated using
the extreme cases where classes were considered to be either
highly e! ective or less than e! ective. Five of the 11 teachers
who taught classes identifi ed as being highly e! ective, taught
at least one other class participating in the study. In Table 27,
the residuals calculated for these classes are displayed, along
with information pertaining to each teacher. Two of the seven
teachers identifi ed as teaching less than e! ective classes also
taught more than one Year 8 class and these residuals are
displayed in Table 28.
T A B L E 2 5
Highly e! ective classes
Class rank Class residual SEI School area Year 8 streamed Year 7 class mean Class size (students)
132 33.37 105.30 Metro Yes 503.91 25
131 32.74 100.97 Metro No 543.92 28
130 27.31 98.59 Metro No 517.63 21
129 26.30 99.23 Metro No 492.58 21
128 26.29 109.48 Metro Yes 506.11 28
127 23.37 105.3 Metro Yes 473.50 26
126 22.79 109.48 Metro Yes 564.79 26
124 20.39 107.20 Metro No 565.78 21
123 19.66 105.30 Metro Yes 499.07 28
122 18.98 100.97 Metro No 441.20 24
121 18.27 95.43 Metro - 541.27 30
Note. The class ranked 125 achieved a achievement gain residual between the classes ranked 124 and 126 but was not
identifi ed as being highly e! ective as the lower boundary of the uncertainty interval was below zero. Uncertainty intervals
are infl uenced by class size, which in this case was 12 students. The Year 7 class grand mean = 457.26.
T A B L E 2 6
Less than e! ective classes
Class rank Class residual SEI School area Year 8 streamed Year 7 class mean Class size (students)
1 -31.04 98.59 Metro No 451.95 22
2 -31.02 96.88 Country No 400.29 27
3 -24.42 94.11 Metro - 411.73 15
4 -23.27 95.39 Country No 438.30 25
5 -21.98 98.59 Metro No 428.42 21
8 -20.77 95.59 Country No 448.83 24
9 -19.67 104.98 Metro Yes 452.73 55
Note. The classes ranked 6 and 7 (containing 12 and 15 students respectively) were not identifi ed as being less than e! ective as the
upper boundary of the uncertainty interval was above zero. The Year 7 class grand mean = 457.26.
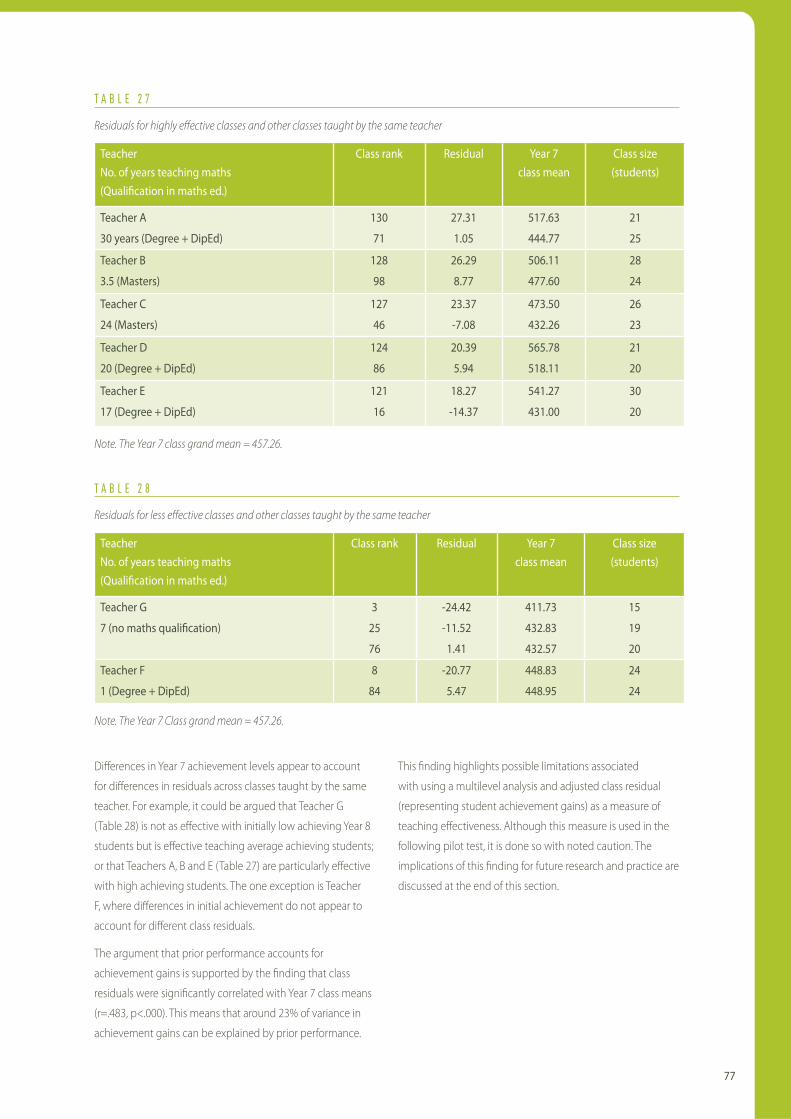
77
Di! erences in Year 7 achievement levels appear to account
for di! erences in residuals across classes taught by the same
teacher. For example, it could be argued that Teacher G
(Table 28) is not as e! ective with initially low achieving Year 8
students but is e! ective teaching average achieving students;
or that Teachers A, B and E (Table 27) are particularly e! ective
with high achieving students. The one exception is Teacher
F, where di! erences in initial achievement do not appear to
account for di! erent class residuals.
The argument that prior performance accounts for
achievement gains is supported by the fi nding that class
residuals were signifi cantly correlated with Year 7 class means
(r=.483, p<.000). This means that around 23% of variance in
achievement gains can be explained by prior performance.
This fi nding highlights possible limitations associated
with using a multilevel analysis and adjusted class residual
(representing student achievement gains) as a measure of
teaching e! ectiveness. Although this measure is used in the
following pilot test, it is done so with noted caution. The
implications of this fi nding for future research and practice are
discussed at the end of this section.
T A B L E 2 7
Residuals for highly e! ective classes and other classes taught by the same teacher
Teacher No. of years teaching maths(Quali! cation in maths ed.)
Class rank Residual Year 7 class mean
Class size (students)
Teacher A
30 years (Degree + DipEd)
130
71
27.31
1.05
517.63
444.77
21
25
Teacher B
3.5 (Masters)
128
98
26.29
8.77
506.11
477.60
28
24
Teacher C
24 (Masters)
127
46
23.37
-7.08
473.50
432.26
26
23
Teacher D
20 (Degree + DipEd)
124
86
20.39
5.94
565.78
518.11
21
20
Teacher E
17 (Degree + DipEd)
121
16
18.27
-14.37
541.27
431.00
30
20
Note. The Year 7 class grand mean = 457.26.
T A B L E 2 8
Residuals for less e! ective classes and other classes taught by the same teacher
Teacher No. of years teaching maths(Quali! cation in maths ed.)
Class rank Residual Year 7 class mean
Class size (students)
Teacher G
7 (no maths quali! cation)
3
25
76
-24.42
-11.52
1.41
411.73
432.83
432.57
15
19
20
Teacher F
1 (Degree + DipEd)
8
84
-20.77
5.47
448.83
448.95
24
24
Note. The Year 7 Class grand mean = 457.26.
78
6 . P H A S E 3 : P I L O T T E S T I N G T H E T O M O S
6 . 1 M E T H O D
Participants
Initially all 11 teachers identifi ed in Phase 2 as having taught
highly e! ective classes (or their head of department) were
contacted and a random sample of about 20 teachers
identifi ed as having taught an e! ective class were also
contacted. No teacher who had taught a class identifi ed as
being less than e! ective was invited to participate in the
pilot study.
Overall, nine teachers who participated in Phase 2 of the
study agreed to participate in pilot testing the ToMOS. Teacher
participation involved allowing the two ToMOS developers to
sit and observe them teaching two non consecutive Year 8
maths classes, and agreeing to have these classes videotaped.
The low participant rate was due in part to movement across
schools and across classes (many teachers were no longer
teaching lower secondary maths). It was also due in part to
teachers’ reluctance to having a class videotaped – highlighting
the importance of developing an observation schedule that
can be completed in situ for research purposes in a secondary
school setting. (Video was only required as the ToMOS was still
in a stage of development). Two of the nine teachers indicated
a willingness to be involved on the proviso that their class was
audiotaped only and this request was granted.
Procedure
Once teachers expressed a willingness to participate, written
consent was required from all principals, teachers, students
and parents involved. The project manager arranged with the
teacher for a research team to visit two, non-consecutive Year
8 maths classes at a time and day convenient to the teacher.
(One teacher was observed teaching Year 9 maths classes). The
instructions to the teacher were to choose two lessons that
were typical lessons. The only information provided to teachers
was that the research team was interested in observing and
recording what quality teaching looked like. The research
team included the two ToMOS developers (who coded
observations in situ) as well as a professional camera operator
(for consenting teachers).
The two coders sat together at the back or to the side of
the classroom and the camera operator found a convenient
position in the classroom to stand with a tripod. Individual
students who did not have written consent to participate
and be video taped, were seated together behind the camera
or to the side, and the camera operator was instructed to
avoid recording these students. The teacher was fi tted with a
microphone.
On the record sheet, which is sectioned into fi ve minute
segments of time (see Appendix 5), each coder used shading
to indicate public time versus public time episodes and
recorded each time a teacher action identifi ed in the ToMOS
was observed during a public time episode. Each action was
recorded only once during a fi ve minute segment of time.
If the same action continued over to the next fi ve minute
segment, it was still only recorded once. An approximate time
when the teacher action occurred was recorded and where
possible, notes relating to the teacher action were made to
help resolve potential di! erences.
During public time episodes, each coder recorded their
observations separately. During larger episodes of private
time, the two coders compared and discussed their records
and resolved any di! erences to the satisfaction of both coders,
if they were able to do so without disturbing students’ work.
Any di! erences that could not be quickly resolved were
noted. Public time segments of each lesson observed were
transcribed and resolved at a later time.
6 . 2 R E S U L T S
Eighteen maths lessons were observed: two lessons taught by
nine di! erent teachers. In total, teacher actions specifi ed on
the ToMOS were observed 95 times and inter-rater agreement
was reached during the lesson on 82 of these occasions (86%).
The 13 di! erences were later resolved easily by viewing the
video or reading the public time transcriptions and making
minor changes to the wording of the coding manual.
The extended description for each ToMOS teacher action
found in the fi nal coding manual is presented below, along
with one transcribed episode to illustrate the action in a
classroom context.
Intentions (INT)
The teacher makes verbal or written statements about the
specifi c mathematics learning intended in the lesson. The
learning intentions may relate to:
• ‘Big’ mathematics ideas (for example,
key ideas at the strand level),
• Particular mathematics concepts, or
• Tasks and assignments.
The intentions will typically be presented in the form of goal
statements prior to engaging in some mathematical work.
79
Example -
T: Okay we’re actually going to look at a particular type of equation today and the type we’re going to look at only has one pronumeral in it. [Under the heading Equations, teacher writes on the board eg. 4x – 1 = 23.] You don’t need to copy this down yet. That’s the type of equation I’m going to look at. Does anyone know why or anything interesting about that one? Anything at all you notice?
S: You could probably work it out.
T: You could probably work it out, she’s got it. What does she mean, you could probably work it out? What does work it out mean? Yes?
S: An answer.
T: Yes and what do you mean, an answer?
S: What is x.
T: What is x, thank you. That’s what you meant isn’t it? Okay do you want to know the correct term for that, working it out, fi nding an answer? Solve. So we’re going to solve equations today [teacher extends the heading on the board by writing – Solve Equations] and the only way we can solve them is if we’re only dealing with one pronumeral at a time and we can actually work it out, what is the value of x.
Quality (QUAL)
The teacher communicates in verbal or written form explicit
criteria for quality responses to tasks assigned. The teacher
may also explicitly distinguish levels of performance. Criteria
presented by the teacher may relate to:
• Mathematical accuracy,
• Mathematical ingenuity, or
• Communication/presentation of ideas.
Levels of performance might include:
• Rubric descriptions or
• Numeric/alphabetic grades
Example -
T: Now what I haven’t seen on a lot of people’s work for the perimeter of the triangle is any working out so this is what we would expect to see. C what were the measurements of your triangle? Okay so what’s this one? …
S: 28.
T: 28.
S: 20.
T: 20, and did you measure this side? Okay we’re working out the perimeter of this triangle
forgetting the rectangle around the outside. It has a face of 28, height of 28 and C mentioned from there to there and he got a distance of?
S: 34.
T: 34 okay, excellent. So how did you work out the perimeter of your triangle then C?
S: Just added them altogether.
T: Added them altogether. So this is what I would have expected to see, 28 add 20 and 34, 20 plus 20 is 40 plus 30 is 70 and we’ve got 8 and 4 so that makes 82cm.
[Teacher writes on board P = 20 + 28 + 34 = 82 cm ]
Responsibility (RESPO)
The teacher makes statements that encourage student
responsibility for learning mathematics. The kinds of student
responsibilities that teachers might encourage include:
• Asking questions to seek clarifi cation,
• Asking questions to inquire about, or suggest, new ideas
or possibilities;
• Focusing or concentrating on their mathematical work,
• Allocating appropriate time for independent studies
associated with their mathematical learning,
• Checking and justifying solutions and solution methods, or
• Self and peer assessment.
Example -
T: You should all have your survey work out in front of you which has been levelled. What I’d like you to do now is just spend one minute looking through your work, so you should have your questionnaire at the front, and then the way in which you tallied your results. Quite possibly then you have your pie graphs, bar graphs, Venn diagrams, if you just keep fl ipping through, all the di! erent strategies that you used to tally the results. Okay. What I’d like you to do is fi rst of all look through yours. Where did you do a good job? What sort of strategies, just keep it to yourself for now, what sort of strategies, what were your graphs, what did they look like? What were the features that you had to use? Have a look at the questions on your survey, what was the fi rst question, what was the second question? Why did you choose those? What sort of questions did you have, multiple choice, any written answers, tick a box? Which questions were more successful in getting the answers that you were after? Have a look at those for a moment.
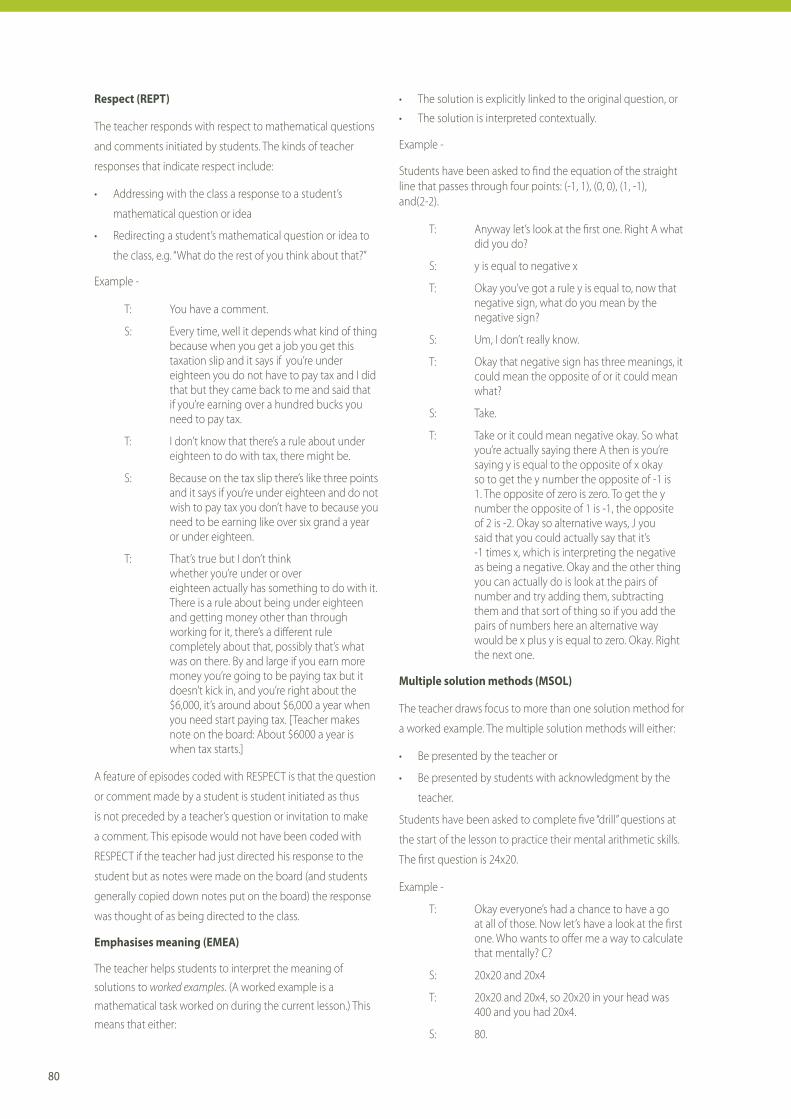
80
Respect (REPT)
The teacher responds with respect to mathematical questions
and comments initiated by students. The kinds of teacher
responses that indicate respect include:
• Addressing with the class a response to a student’s
mathematical question or idea
• Redirecting a student’s mathematical question or idea to
the class, e.g. “What do the rest of you think about that?”
Example -
T: You have a comment.
S: Every time, well it depends what kind of thing because when you get a job you get this taxation slip and it says if you’re under eighteen you do not have to pay tax and I did that but they came back to me and said that if you’re earning over a hundred bucks you need to pay tax.
T: I don’t know that there’s a rule about under eighteen to do with tax, there might be.
S: Because on the tax slip there’s like three points and it says if you’re under eighteen and do not wish to pay tax you don’t have to because you need to be earning like over six grand a year or under eighteen.
T: That’s true but I don’t think whether you’re under or over eighteen actually has something to do with it. There is a rule about being under eighteen and getting money other than through working for it, there’s a di! erent rule completely about that, possibly that’s what was on there. By and large if you earn more money you’re going to be paying tax but it doesn’t kick in, and you’re right about the $6,000, it’s around about $6,000 a year when you need start paying tax. [Teacher makes note on the board: About $6000 a year is when tax starts.]
A feature of episodes coded with RESPECT is that the question
or comment made by a student is student initiated as thus
is not preceded by a teacher’s question or invitation to make
a comment. This episode would not have been coded with
RESPECT if the teacher had just directed his response to the
student but as notes were made on the board (and students
generally copied down notes put on the board) the response
was thought of as being directed to the class.
Emphasises meaning (EMEA)
The teacher helps students to interpret the meaning of solutions to worked examples. (A worked example is a mathematical task worked on during the current lesson.) This means that either:
• The solution is explicitly linked to the original question, or
• The solution is interpreted contextually.
Example -
Students have been asked to fi nd the equation of the straightline that passes through four points: (-1, 1), (0, 0), (1, -1), and(2-2).
T: Anyway let’s look at the fi rst one. Right A what did you do?
S: y is equal to negative x
T: Okay you’ve got a rule y is equal to, now that negative sign, what do you mean by the negative sign?
S: Um, I don’t really know.
T: Okay that negative sign has three meanings, it could mean the opposite of or it could mean what?
S: Take.
T: Take or it could mean negative okay. So what you’re actually saying there A then is you’re saying y is equal to the opposite of x okay so to get the y number the opposite of -1 is 1. The opposite of zero is zero. To get the y number the opposite of 1 is -1, the opposite of 2 is -2. Okay so alternative ways, J you said that you could actually say that it’s -1 times x, which is interpreting the negative as being a negative. Okay and the other thing you can actually do is look at the pairs of number and try adding them, subtracting them and that sort of thing so if you add the pairs of numbers here an alternative way would be x plus y is equal to zero. Okay. Right the next one.
Multiple solution methods (MSOL)
The teacher draws focus to more than one solution method for
a worked example. The multiple solution methods will either:
• Be presented by the teacher or
• Be presented by students with acknowledgment by the
teacher.
Students have been asked to complete fi ve “drill” questions at
the start of the lesson to practice their mental arithmetic skills.
The fi rst question is 24x20.
Example -
T: Okay everyone’s had a chance to have a go at all of those. Now let’s have a look at the fi rst one. Who wants to o! er me a way to calculate that mentally? C?
S: 20x20 and 20x4
T: 20x20 and 20x4, so 20x20 in your head was 400 and you had 20x4.
S: 80.
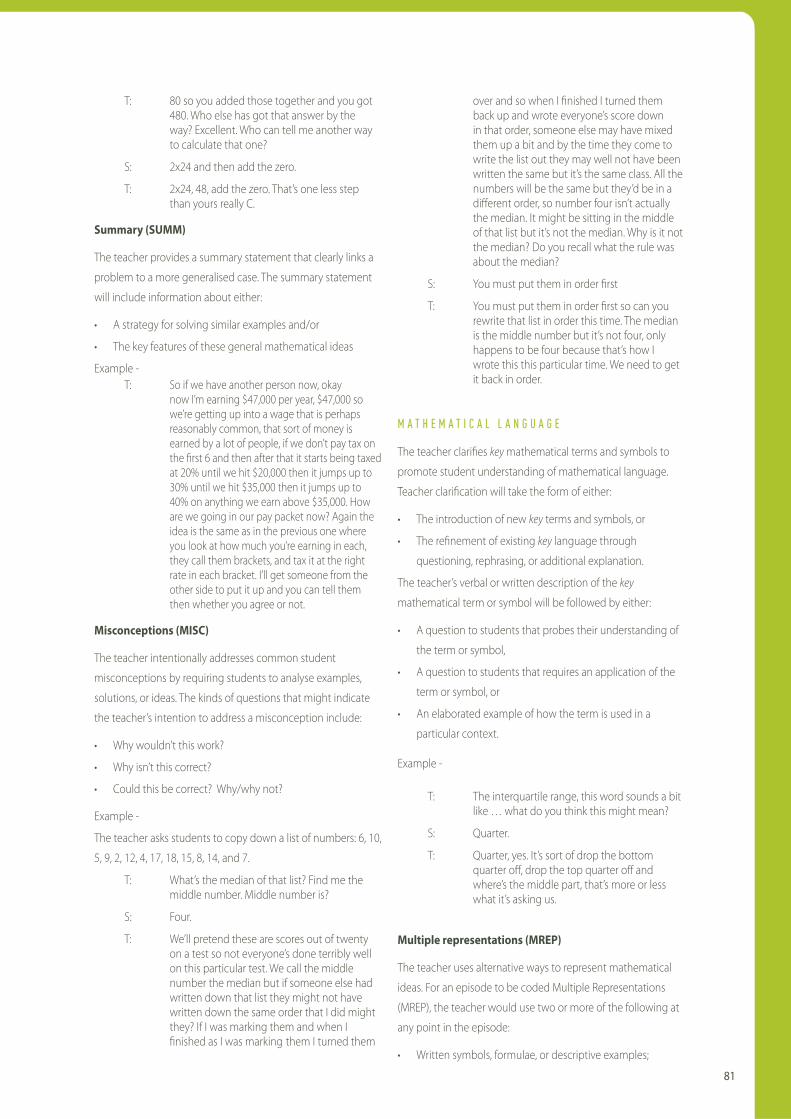
81
T: 80 so you added those together and you got 480. Who else has got that answer by the way? Excellent. Who can tell me another way to calculate that one?
S: 2x24 and then add the zero.
T: 2x24, 48, add the zero. That’s one less step than yours really C.
Summary (SUMM)
The teacher provides a summary statement that clearly links a
problem to a more generalised case. The summary statement
will include information about either:
• A strategy for solving similar examples and/or
• The key features of these general mathematical ideas
Example - T: So if we have another person now, okay
now I’m earning $47,000 per year, $47,000 so we’re getting up into a wage that is perhaps reasonably common, that sort of money is earned by a lot of people, if we don’t pay tax on the fi rst 6 and then after that it starts being taxed at 20% until we hit $20,000 then it jumps up to 30% until we hit $35,000 then it jumps up to 40% on anything we earn above $35,000. How are we going in our pay packet now? Again the idea is the same as in the previous one where you look at how much you’re earning in each, they call them brackets, and tax it at the right rate in each bracket. I’ll get someone from the other side to put it up and you can tell them then whether you agree or not.
Misconceptions (MISC)
The teacher intentionally addresses common student
misconceptions by requiring students to analyse examples,
solutions, or ideas. The kinds of questions that might indicate
the teacher’s intention to address a misconception include:
• Why wouldn’t this work?
• Why isn’t this correct?
• Could this be correct? Why/why not?
Example -
The teacher asks students to copy down a list of numbers: 6, 10,
5, 9, 2, 12, 4, 17, 18, 15, 8, 14, and 7.
T: What’s the median of that list? Find me the middle number. Middle number is?
S: Four.
T: We’ll pretend these are scores out of twenty on a test so not everyone’s done terribly well on this particular test. We call the middle number the median but if someone else had written down that list they might not have written down the same order that I did might they? If I was marking them and when I fi nished as I was marking them I turned them
over and so when I fi nished I turned them back up and wrote everyone’s score down in that order, someone else may have mixed them up a bit and by the time they come to write the list out they may well not have been written the same but it’s the same class. All the numbers will be the same but they’d be in a di! erent order, so number four isn’t actually the median. It might be sitting in the middle of that list but it’s not the median. Why is it not the median? Do you recall what the rule was about the median?
S: You must put them in order fi rst
T: You must put them in order fi rst so can you rewrite that list in order this time. The median is the middle number but it’s not four, only happens to be four because that’s how I wrote this this particular time. We need to get it back in order.
M A T H E M A T I C A L L A N G U A G E
The teacher clarifi es key mathematical terms and symbols to
promote student understanding of mathematical language.
Teacher clarifi cation will take the form of either:
• The introduction of new key terms and symbols, or
• The refi nement of existing key language through
questioning, rephrasing, or additional explanation.
The teacher’s verbal or written description of the key
mathematical term or symbol will be followed by either:
• A question to students that probes their understanding of
the term or symbol,
• A question to students that requires an application of the
term or symbol, or
• An elaborated example of how the term is used in a
particular context.
Example -
T: The interquartile range, this word sounds a bit like … what do you think this might mean?
S: Quarter.
T: Quarter, yes. It’s sort of drop the bottom quarter o! , drop the top quarter o! and where’s the middle part, that’s more or less what it’s asking us.
Multiple representations (MREP)
The teacher uses alternative ways to represent mathematical
ideas. For an episode to be coded Multiple Representations
(MREP), the teacher would use two or more of the following at
any point in the episode:
• Written symbols, formulae, or descriptive examples;
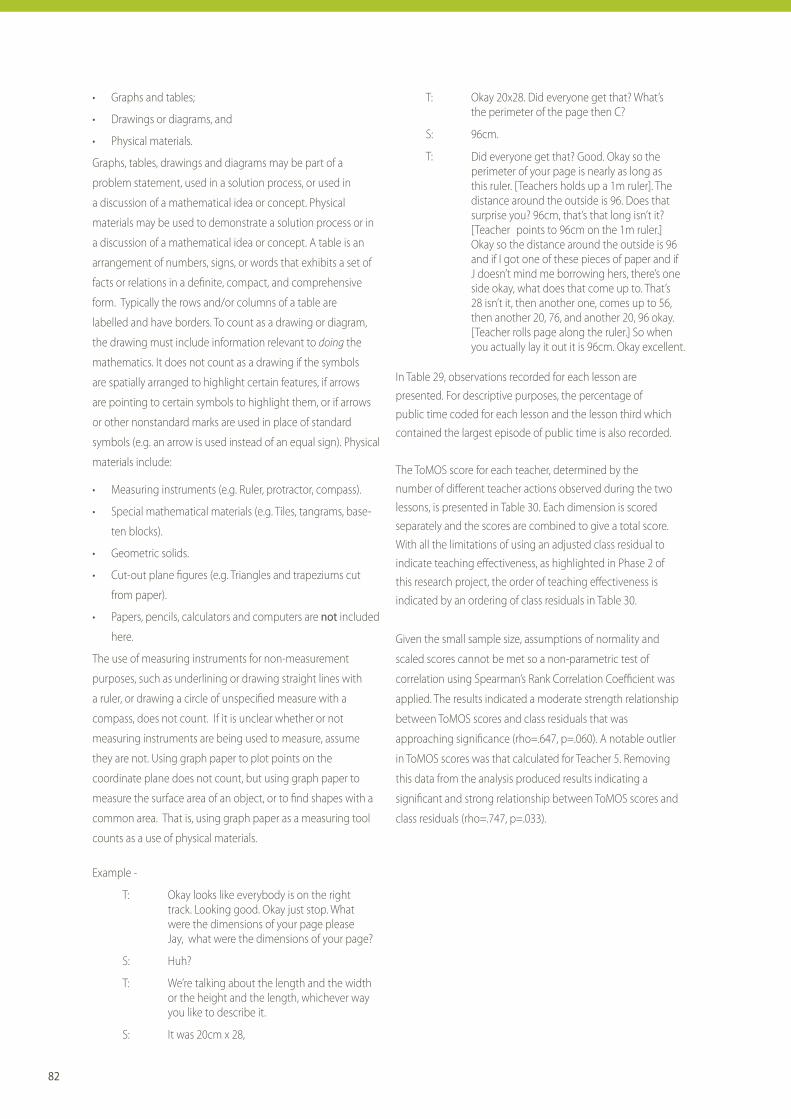
82
• Graphs and tables;
• Drawings or diagrams, and
• Physical materials.
Graphs, tables, drawings and diagrams may be part of a
problem statement, used in a solution process, or used in
a discussion of a mathematical idea or concept. Physical
materials may be used to demonstrate a solution process or in
a discussion of a mathematical idea or concept. A table is an
arrangement of numbers, signs, or words that exhibits a set of
facts or relations in a defi nite, compact, and comprehensive
form. Typically the rows and/or columns of a table are
labelled and have borders. To count as a drawing or diagram,
the drawing must include information relevant to doing the
mathematics. It does not count as a drawing if the symbols
are spatially arranged to highlight certain features, if arrows
are pointing to certain symbols to highlight them, or if arrows
or other nonstandard marks are used in place of standard
symbols (e.g. an arrow is used instead of an equal sign). Physical
materials include:
• Measuring instruments (e.g. Ruler, protractor, compass).
• Special mathematical materials (e.g. Tiles, tangrams, base-
ten blocks).
• Geometric solids.
• Cut-out plane fi gures (e.g. Triangles and trapeziums cut
from paper).
• Papers, pencils, calculators and computers are not included
here.
The use of measuring instruments for non-measurement
purposes, such as underlining or drawing straight lines with
a ruler, or drawing a circle of unspecifi ed measure with a
compass, does not count. If it is unclear whether or not
measuring instruments are being used to measure, assume
they are not. Using graph paper to plot points on the
coordinate plane does not count, but using graph paper to
measure the surface area of an object, or to fi nd shapes with a
common area. That is, using graph paper as a measuring tool
counts as a use of physical materials.
Example -
T: Okay looks like everybody is on the right track. Looking good. Okay just stop. What were the dimensions of your page please Jay, what were the dimensions of your page?
S: Huh?
T: We’re talking about the length and the width or the height and the length, whichever way you like to describe it.
S: It was 20cm x 28,
T: Okay 20x28. Did everyone get that? What’s the perimeter of the page then C?
S: 96cm.
T:
In Table 29, observations recorded for each lesson are presented. For descriptive purposes, the percentage of public time coded for each lesson and the lesson third which contained the largest episode of public time is also recorded.
The ToMOS score for each teacher, determined by the number of di! erent teacher actions observed during the two lessons, is presented in Table 30. Each dimension is scored separately and the scores are combined to give a total score. With all the limitations of using an adjusted class residual to indicate teaching e! ectiveness, as highlighted in Phase 2 of this research project, the order of teaching e! ectiveness is indicated by an ordering of class residuals in Table 30.
Given the small sample size, assumptions of normality and
scaled scores cannot be met so a non-parametric test of
correlation using Spearman’s Rank Correlation Coe" cient was
applied. The results indicated a moderate strength relationship
between ToMOS scores and class residuals that was
approaching signifi cance (rho=.647, p=.060). A notable outlier
in ToMOS scores was that calculated for Teacher 5. Removing
this data from the analysis produced results indicating a
signifi cant and strong relationship between ToMOS scores and
class residuals (rho=.747, p=.033).
Did everyone get that? Good. Okay so the perimeter of your page is nearly as long as this ruler. [Teachers holds up a 1m ruler]. The distance around the outside is 96. Does that surprise you? 96cm, that’s that long isn’t it? [Teacher points to 96cm on the 1m ruler.]Okay so the distance around the outside is 96 and if I got one of these pieces of paper and if J doesn’t mind me borrowing hers, there’s one side okay, what does that come up to. That’s 28 isn’t it, then another one, comes up to 56, then another 20, 76, and another 20, 96 okay. [Teacher rolls page along the ruler.] So when you actually lay it out it is 96cm. Okay excellent.
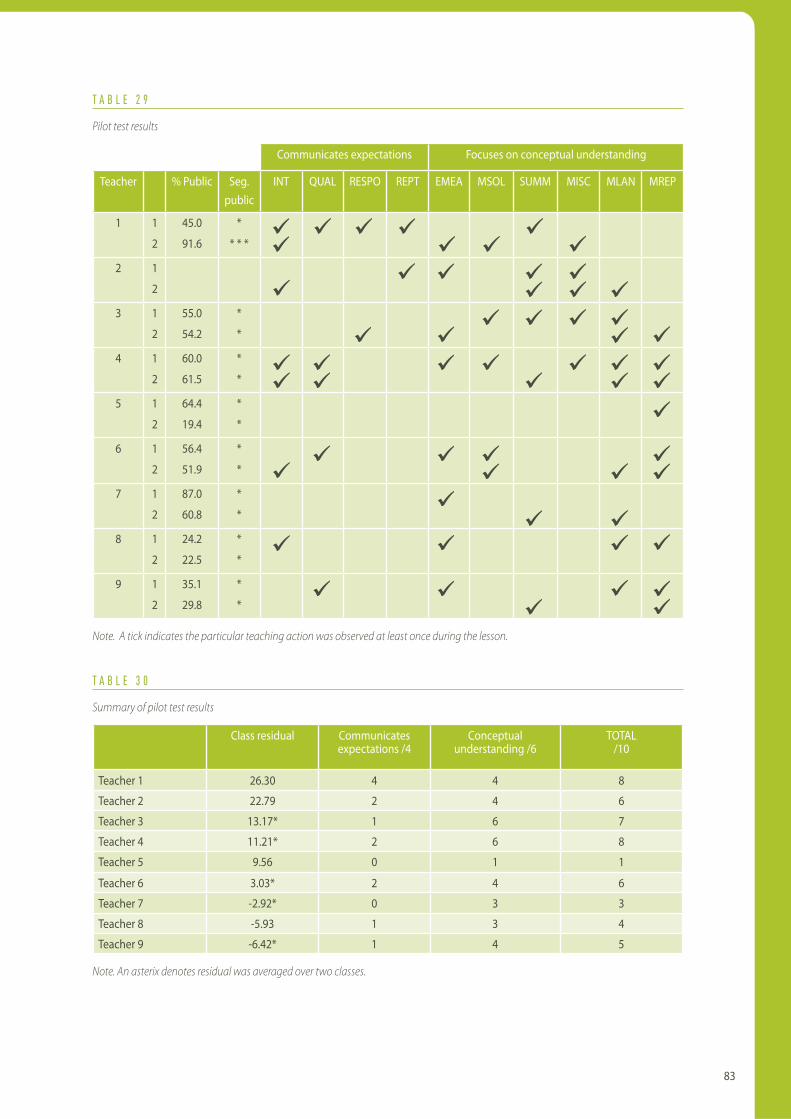
83
T A B L E 2 9
Pilot test results
Communicates expectations Focuses on conceptual understanding
Teacher % Public Seg. public
INT QUAL RESPO REPT EMEA MSOL SUMM MISC MLAN MREP
1 1
2
45.0
91.6
*
* * *
2 1
2
3 1
2
55.0
54.2
*
*
4 1
2
60.0
61.5
*
*
5 1
2
64.4
19.4
*
*
6 1
2
56.4
51.9
*
*
7 1
2
87.0
60.8
*
*
8 1
2
24.2
22.5
*
*
9 1
2
35.1
29.8
*
*
Note. A tick indicates the particular teaching action was observed at least once during the lesson.
T A B L E 3 0
Summary of pilot test results
Class residual Communicates expectations /4
Conceptual understanding /6
TOTAL/10
Teacher 1 26.30 4 4 8
Teacher 2 22.79 2 4 6
Teacher 3 13.17* 1 6 7
Teacher 4 11.21* 2 6 8
Teacher 5 9.56 0 1 1
Teacher 6 3.03* 2 4 6
Teacher 7 -2.92* 0 3 3
Teacher 8 -5.93 1 3 4
Teacher 9 -6.42* 1 4 5
Note. An asterix denotes residual was averaged over two classes.

84
6 . 3 D I S C U S S I O N
There are few instruments that have been developed to measure teaching quality based on observed classroom practice. The ToMOS was developed in response to the need to measure teaching quality in lower secondary mathematics classrooms, enabling future research to validate fi ndings and theories of e! ective mathematics teaching. While further testing of the ToMOS is required, pilot-testing of the ToMOS indicated it to be an instrument with good inter-rater reliability and a signifi cant rank correlation was found between the ToMOS score and a measure of teaching e! ectiveness (based on student achievement gains). The ToMOS is designed to also be a practical refl ective tool for mathematics in-service and preservice teachers, who can use it to critically analyse their use of public time. The ToMOS also provides a useful measure to compare programs designed to improve the quality of teaching in secondary mathematics classrooms.
To validate theories of e! ective teaching it is imperative that measures of teaching quality are found to explain variance in measures of teaching e! ectiveness. It makes good sense that measures of teaching e! ectiveness be linked in some way to student learning outcomes. While the focus of this research project was on developing a measure of teaching quality, the design of the pilot test incorporated a measure of teaching e! ectiveness that was based on student achievement gains. The secondary school setting for this research project provided an interesting scenario for a multilevel analysis of student achievement gains that is generally not present in the primary school setting; that is, teachers often teach more than one class at the same level. The fi ndings revealed considerable variance in estimates of student achievement gains between di! erent classes taught by the same teacher, that appeared to be infl uenced by the initial achievement level of the classes. This highlights the caution required when making any claim that highly e! ective classrooms (based on student achievement gains) can be used to identify highly e! ective teachers -- or the opposite claim, that ine! ective classrooms can be used to identify ine! ective teachers. The current debate on performance pay is based on this claim.
A widening of the achievement gap between initially low performing students and high performing students in mathematics was evident in the transition from primary school to the end of the fi rst year in secondary school. A signifi cant correlation between class residuals and mean Year 7 achievement scores confi rmed that this was occurring at the class level. The implications of this fi nding are outlined in the fi nal section of this report.

85

86
7 . O V E R V I E W A N D I M P L I C A T I O N S
Teaching for Growth has explored the relationship between
children’s growth in literacy and numeracy and teachers’
classroom teaching practices. It comprises two related
studies: a study of teachers’ practices and children’s growth
in literacy in Pre-primary and Year 1 and a study of teachers’
practices and children’s growth in numeracy in Year 8.
Both studies built directly on the methods, instruments and
results of a previous study, In Teachers’ Hands (Louden et al,
2005). In Teachers’ Hands established a relationship between
average growth in class groups of children’s literacy scores
and the presence of particular teaching practices in follow-
up case studies of their classroom teachers. Whereas the
earlier study was a national study of growth in literacy in
the fi rst and second years of formal schooling and drew
data from all school sectors, Teaching for Growth focuses on
growth in numeracy as well as literacy, and draws its data
from Western Australian Government schools.
7 . 1 G R O W T H I N L I T E R A C Y I N P R E - P R I M A R Y A N D Y E A R 1
Study 1, the literacy study, used the same assessment
strategy as In Teachers’ Hands, with value-added growth
scores calculated on a basis of growth between scores on
ACER’s LLANS literacy scale from March to November. Data
were collected from children in the Pre-primary year and in
Year 1. In Western Australia, Pre-primary education is full-
time but not compulsory. Attendance is, however, almost
universal. Approximately 95% of Year 1 children attend Pre-primary, typically in Pre-primary centres located on the campus of their primary schools. Year 1 is full-time and compulsory. Study 1 was completed in three broad phases: literacy assessment of children; classroom observation of teachers; and analysis of teaching practices associated with higher and lower levels of growth in literacy.
Phase 1: assessment
A representative sampling frame of 100 schools yielded
1,127 Pre-primary and 1,058 Year 1 children in 171 separate
classrooms. The average age of Pre-primary children on
February 1, 2005, just before the fi rst round of assessment,
was fi ve years and two months; the average age of year
1 children at that time was six years and two months.
Assessment of these children in March and November of
2005 revealed that:
• In Pre-primary, there was relatively little growth for low-
performing children and a large amount of growth for
high-performing children.
• In Year 1, large amounts of growth were observed for
both low-performing and high-performing children.
• Compared with a national sample of children in
government schools assessed when they were
approximately the same age with the same instrument
in 1999, Western Australian children’s performance
was signifi cantly lower. The gaps in performance were
smaller at the end of Year 1 than they were at the
beginning and end of Pre-primary and at the beginning
of Year 1, but they were signifi cantly lower at each
assessment point.
• Average growth in Year 1 was approximately two and a
half times greater than average growth in Pre-primary
for WA children; average growth in the 1999 national
sample was not signifi cantly di! erent from Pre-primary
to Year 1.
• Western Australian Pre-primary children found some
kinds of assessment items concerning sight words
more di" cult than children in the 1999 national LLANS
sample.
To estimate children’s learning gains after taking account of
predictors of children’s performance, multi-level statistical
models were fi tted to the literacy data for each of the Pre-
primary and Year 1 samples. After accounting for the impact
of prior performance, disability, interruption to learning,
relative attentiveness and Aboriginal or Torres Strait islander
status, value-added residuals were calculated for each of the
class groups. On the basis of this analysis, teachers in these
classes were allocated to one of three groups: teachers
of classes that had achieved signifi cantly higher growth
than expected (‘more e! ective’), teachers whose classes
had achieved as much growth as expected (‘e! ective’),
and teachers whose classes had achieved signifi cantly less
growth than expected (‘less e! ective’).
Phase 2: classroom observation – quantitative analysis
Teachers from the more e! ective, e! ective and less e! ective
groups were approached to participate in the classroom
observation phase of the study in 2006. Nineteen Pre-
87
primary and Year 1 teachers agreed to participate, seven
from the more e! ective groups, seven from the e! ective
groups and fi ve from the less e! ective groups. Schools
represented the range of metropolitan and country
locations and socio-economic status bands. A team
of four (two researchers, a videographer and a sound
recordist) visited each class for several days. The video and
audio records were analysed using CLOS-R, a revised and
improved version of the Classroom Literacy Observation
Schedule (Louden & Rohl, 2003). CLOS-R identifi es 27
literacy teaching practices that have been reported in
the literature as being associated with e! ective teaching.
Analysis of these data revealed that:
• CLOS-R has strong psychometric characteristics,
e! ectively measuring the presence or absence of
classroom teaching practices thought to be associated
with e! ective teaching.
• After taking into account prior performance and
other predictors of success, CLOS-R scores explain the
majority of the remaining variance in student growth
scores (r=0.87).
• There was a strong, and approximately linear,
relationship between CLOS-R scores and LLANS value-
added residual scores. (r = 0.93). That is, the higher the
children’s growth in literacy, the more likely teachers
were to have demonstrated most of the CLOS-R
teaching practices.
Substantively, analysis of the CLOS-R data in conjunction
with the evidence of student growth suggests that there
is a continuum of development in literacy teaching
practices. There are some low-level practices that all
teachers demonstrated to some extent in their teaching
practice, some that many demonstrated to some extent
and some that only a few of the teachers with the highest
student growth scores consistently demonstrated.
Prospectively, then, if the educational improvement goal
is to improve rates for student growth in literacy, the path
to improvement seems to be to increase teachers’ capacity
to use the teaching practices associated with moderate-
growth and high-growth classes, whilst maintaining or
developing consistent use of lower-level practices.
Phase 3: classroom observation – qualitative analysis
Quantitative di! erences in CLOS-R scores established in
Phase 2 were investigated in more detail in Phase 3. From
the video records of classroom teaching, 894 instances
were identifi ed for further investigation. Each of these
instances had been coded for the presence of a subset of
six teaching practices associated with literacy knowledge:
(1) explanations at the word level, (2) explanations at the
sentence level, (3) explanations at the text level, (4) support
for the development of oral language, (5) understanding
of the connections between oral and written language,
and (6) use of metalanguage to make explicit children’s
knowledge about language. For each of these teaching
practices, each instance was compared with every other
instance, with the goal of deciding which were the highest
quality and which were the lowest quality instances of
each teaching practice. Pair-wise analysis of these six sets of
instances revealed that:
• There was a stronger focus on the development of oral
language in the more e! ective teachers’ classrooms.
They were more likely to integrate their oral language
teaching into a theme and to develop context-specifi c
vocabulary; to engage children in extended and
sca! olded discussions; to provide opportunities for
children to remember information, analyse, synthesise
and evaluate information; and to provide targeted
support to individuals.
• There was a more systematic focus on the explicit
teaching of phonological awareness and phonics in the
more e! ective teachers’ classrooms. They were more
likely to be clear, precise and consistent in their use of
metalinguistic terms, particularly ‘sounds’ and ‘letters’,
and careful in their articulation of words and parts of
words and in their explanation of rules, exceptions and
defi nitions.
• Explanations at the syntactic (sentence) level were more
frequent in the classrooms of more e! ective teachers,
but the qualitative investigation of these sentence-
level explanations did not reveal uniform di! erences
between the groups of teachers.
• Text level discussions in the classrooms of the more
e! ective teachers were more likely to involve higher
order thinking. Their children were more likely to be
familiar with a wide range of text types and to make
88
comparisons between texts and to critically analyse
them. More e! ective teachers were more likely to
provide sca! olding for children seeking information
from non-fi ction texts, and to make comparisons across
texts to guide their children’ own story writing.
• The more e! ective teachers were more likely to make
clear and substantive connections for children between
oral and written language. They were more likely to
provide opportunities for extended conversations
about written text and its conventions, to clarify
subject specifi c vocabulary and concepts and to
initiate extended conversations with their class about
substantive features of written text. They were more
likely to make clear connections between spoken and
written language in terms of grapheme-phoneme
correspondences and to model particular syntactic
structures in both spoken and written forms.
• A wide variety of technical literacy-related vocabulary was more likely to be used by the more e! ective teachers as they engaged in extended and deep discussions about word level features including phonological awareness and phonics, sentence forms, comprehension of text, use of texts and critical analysis of text.
Literacy teaching issues arising from the study
A number of issues arise from the fi ndings in this study
that concern both the pattern of the Western Australian
children’s growth in literacy from the beginning of Pre-
primary to the end of Year 1 and observed characteristics of
Pre-primary and Year 1 classrooms.
During the Pre-primary year, the spread of literacy
achievement increased, indicating that whilst some
children had made substantial growth, others had
made very little growth, with slower growth particularly
noticeable at the bottom of the achievement distribution.
In contrast, during Year 1, children demonstrated
accelerated growth (approximately two and a half times
that in Pre-primary) that was evident at all levels, including
the bottom of the distribution.
Further, when compared to a previous national sample of
government school children of approximately similar ages,
who completed the same literacy assessments at the same
times of the year, the literacy achievement of the Western
Australian children was signifi cantly lower at all assessment
times, but by the end of Year 1 the gap between the groups
had become much smaller. In this national sample there
was not the large discrepancy in growth between the
Pre-primary aged group and Year 1, with relatively similar
growth during both years. Another fi nding was that the
Western Australian Pre-primary children, who, at the end
of the year scored lower as a group on all assessment
items, found the reading of LLANS sight words, an essential
literacy skill, to be particularly di" cult.
Factors related to these " ndings
It appears that a number of factors may have interacted to
produce these results about the nature of student literacy
growth in Western Australian Pre-primary and Year 1
classrooms. Some of these factors became evident during
the study as the researchers conducted interviews with the
participating teachers and their school principals and made
classroom observations.
Focus on literacy learning
In Year 1 it was clear from the observations and interviews
that literacy learning was overwhelmingly the most
important focus of the classroom. All Year 1 teachers
indicated that the main outcome for their students
during this school year was to learn to read and write.
In all observed classrooms there was a daily morning
time allocation of two or more hours for literacy in which
there was sustained attention to literacy by teachers and
children, that almost always involved direct teaching of
reading and writing, some oral discussion of literacy tasks
and some group and/or individual involvement in literacy
tasks. There were, however, distinct di! erences in the ratio
of direct teaching to individual engagement in literacy
activities between the more e! ective and the e! ective
and less e! ective teachers, with more whole group direct
instruction in the more e! ective teachers’ classes and
some very long unbroken stretches of individual seat-work
in the classrooms of e! ective and less e! ective teachers.
Nevertheless, in spite of some di! erences of program
implementation, there was a sustained drive for literacy in
all the observed Year 1 classrooms.
In the Pre-primary teachers’ classrooms, on the other hand,
the researchers noticed a range of attitudes to literacy
teaching and uncertainty by most as to what should be

89
taught and how. Some e! ective and less e! ective teachers
expressed concern that the curriculum was being ‘pushed
down’ and were apprehensive that social and emotional
growth through play situations would be neglected if there
were to be direct teaching of reading and writing in the
Pre-primary year. The more e! ective Pre-primary teachers,
on the other hand, whilst they were attentive to the
children’s social and emotional growth, saw the Pre-primary
year as having a strong foundational literacy focus that was
a very important part of an ongoing sequence of literacy
development.
Instead of the substantial allocated morning time slot for
literacy teaching that was common to Year 1 classrooms,
in many of the observed Pre-primary classrooms literacy-
related activities, both planned and unplanned, were
scattered throughout the day. These activities frequently
involved bodily movement, excitement and noise and on
many occasions were conducted by the teacher or assistant
in small groups or individually, rather than in a class
group. In addition to these features, in the more e! ective
Pre-primary teachers’ classrooms there was also a strong
emphasis on planned, direct, explicit literacy teaching and
related discussion that took place in whole class or small
groups. In these classrooms meaningful teaching time,
that was adapted to children’s developmental levels, was
maximised.
Contextual factors
The history and present structure of the Pre-primary year,
in addition to teachers’ educational philosophies, may
well have impacted on teachers’ beliefs and practices
and consequently on children’s literacy learning. The two
most populous states of Australia, New South Wales and
Victoria, have compulsory full-time school education for
children from the age of 5 years and the classrooms that
these children enter are not very di! erent from those of
Year 1 children. Further, in these states there is the clear
expectation, refl ected in curriculum documents, that
children will learn to read and write in this year of school.
On the other hand, perhaps because of its non-compulsory
nature and lack of clear direction in curriculum documents
at the time of the study, the classroom observations made
for this study showed the Western Australian Pre-primary
experience, with one exception (a composite Pre-primary/
Year 1 class), to be very di! erent from that of Year 1.
Implications for practice: equity
The two main issues that arise from these fi ndings are those
of equity and how teachers might be enabled to create
more literacy growth for all children in the early years of
school, particularly in the Pre-primary year. In terms of
equity there is much research showing that children who
begin school with low levels of literacy knowledge are ‘at
risk’ of developing literacy di" culties. There is also research
showing that these children can benefi t from targeted
intervention, but that the timing of intervention, the earlier
the better, helps determine its success (Ramey & Ramey,
2000). The fact that there appeared to be little progress at
the lowest end of the achievement distribution over the
Pre-primary year, strongly suggests that these children
were being disadvantaged in Pre-primary classrooms
that did not have a strong focus on literacy. Research
evidence suggests that such ‘at risk’ children, who are most
a! ected by the instruction of the teacher (Morrison et al.,
2006) need explicit systematic teaching in the areas of
phonological awareness and letter recognition and practice
in using these skills in reading and writing (Ehri & Roberts,
2006; Rose, 2005). In the classrooms of the more e! ective
Pre-primary teachers this explicit systematic teaching was
usually conducted through meaningful, enjoyable routines
and games that ensured active participation, showing that
the explicit teaching of literacy was highly compatible
with developmentally appropriate practice and helpful
to all children, particularly those considered to be at risk.
Further, in the classrooms of the more e! ective Pre-primary
teachers where there was a strong literacy focus, children
at all levels showed strong gains in literacy knowledge and
skills that would be the foundation for later learning.
Another issue of equity most likely related to the slower
rate of growth for Pre-primary children was the variable
amount of time in Pre-primary classrooms in which literacy
was given a specifi c focus. In some Pre-primary classrooms
the researchers spent up to four days collecting many hours
of video of teachers and children engaging in activities that
the teachers claimed to be literacy-related. However, for
the least e! ective Pre-primary teachers, it was di" cult to
fi nd a full two hours of video that addressed any aspect of
literacy, whilst the more e! ective Pre-primary teachers were
engaged in substantial literacy teaching of various kinds for
much of each day.

90
Implications for practice: creating more literacy growth for all children
The classroom observations clearly showed a very strong
relationship between children’s literacy growth and
teachers’ classroom practices. The more e! ective teachers
demonstrated more of the CLOS-R practices more often
and, for the literacy knowledge practices examined in
the pair-wise analysis, at higher levels of quality. The less
e! ective teachers demonstrated fewer of the practices less
often and, when they were demonstrated, the knowledge
practices subjected to pair-wise analysis were often of lower
quality. The results of Rasch analysis showed a continuum
of teaching practices from frequently to infrequently
observed. All classrooms visited showed relatively high
levels of the practices at the lower end of the continuum,
that is, respect in terms of rapport, teacher credibility and
citizenship, and also attention by the children, showing
that all the Pre-primary and Year 1 teachers had created
classrooms that were pleasant to be in and in which
children were focussed to a greater or lesser extent on
literacy tasks. Literacy activities in most classrooms often
began with a sense of purpose and teachers provided
some stimulation for children to participate.
The more e! ective and most of the e! ective teachers
demonstrated relatively consistent use of the mid-level
practices of making connections for children between
spoken and written language, using appropriate
metalanguage, awareness of the needs of children,
and providing substantial and structured literacy
learning experiences. The mid- to higher-level practices
demonstrated with some consistency by the more e! ective
and several of the e! ective teachers were explicitly
focussing on word-level concepts and skills, appropriate
pacing of lessons, sca! olding of children, persistently
revisiting important literacy concepts, making e! ective use
of transitions, providing timely and appropriate feedback,
making clear connections between known and unknown
concepts and skills and making productive use of the
literate environment. Only the more e! ective teachers
paid sustained attention to the highest-level practices,
that is e! ectively developing children’s oral language,
explaining text and sentence level-features, providing
challenge, inclusion of all children through di! erentiation
of instruction or resources, basing their teaching on
assessment, teaching for independence and responding
fl exibly to children’s literacy contributions.
Improving teaching
These fi nding suggest that if teachers in early years
classrooms are to create more literacy growth in the
children in their classes they need to continue to
incorporate into their teaching the practices identifi ed as
lower- and mid-level and to increase the quality of these
practices. It is also important that they begin to include
the mid-high and highest level practices. However, more
e! ective teaching as observed in the classrooms of this
study was dynamic and highly complex, in that the
teachers used many CLOS-R practices simultaneously and
seamlessly in a mix that was appropriate to the children
in their classes. It could be helpful for teachers wishing
to improve their practice to be given opportunities to
observe and make guided analyses of the practices of more
e! ective teachers and to relate this analysis to their own
classroom situations.
Systematic approaches to literacy teaching
It also seems that in order to increase growth in the Pre-
primary year for all children a more systematic approach to
literacy teaching is indicated, with more time specifi cally
allocated to focussed explicit teaching. This explicit
teaching will need to address phonological awareness,
phonics and word recognition, in addition to text and
sentence level concepts, and to have a strong focus
on extending oral language and making connections
between oral and written language. Resources for teachers
that include specifi c guidelines for literacy assessment
of children and for planning and implementing literacy
teaching, would give teachers more certainty about the
e! ective use of focussed literacy time and help schools
plan for literacy across early years classes.
Continuity of literacy experience
It would also be helpful if these resources were to include
guidelines for continuity of literacy teaching practice
between Pre-primary and Year 1 that would ensure
developmentally appropriate practice at both year levels.
The long unbroken stretches of individual seatwork with
little teacher feedback observed in some of the Year 1
classrooms were very di" cult for some children and were
in direct contrast with the vitality apparent in most of the
Pre-primary classrooms in which children regularly moved
between activities and there were many opportunities for
91
self-directed multi-sensory experiences and play.
Continuity of practice, which combined the strong literacy
focus of Year 1 with the energetic variety of Pre-primary,
was clearly shown in the classroom of the highly e! ective
teacher who taught a composite Pre-primary/Year 1 class.
In this classroom both Pre-primary and Year 1 children were
exposed to the explicit teaching of literacy appropriate to
their levels of development and were also given access to
opportunities for socio-dramatic play and other self-chosen
activities. Indeed, all the more e! ective teachers observed
in this study, whether Pre-primary or Year 1, showed
evidence of taking into account the developmental levels
of children as they broke up literacy tasks into smaller parts,
gave regular group as well as individual feedback and
used a wide variety of teaching techniques appropriate to
children’s levels of development that ensured the active
participation of all children and continued literacy growth.
7 . 2 G R O W T H I N N U M E R A C Y I N Y E A R 8
Study 2 extended the methods used in the literacy study to a new domain, Year 8 numeracy. Although the mathematics education literature contains many studies that attempt to explain teacher e! ects, such studies are largely based on teacher self reports and, to a lesser extent, on expert ratings of observed practice where the observation criteria are not made explicit. Unlike Study 1, which could begin with an established observation instrument, the fi rst phase of Study 2 was to develop an observation schedule to provide a measure of teaching quality. The second phase involved assessment of students’ growth in numeracy. The third phase involved pilot testing the observation schedule and examining the strength of the relationship between teaching quality and teaching e! ectiveness.
Phase 1: development of the classroom observation instrument
A synthesis of the literature on classroom practices identifi ed eight themes that have been linked to e! ective mathematics teaching:
• Choice of task.
• Student thinking.
• Consolidation.
• Systematic development of content.
• Making connections.
• Direct teaching.
• Language.
The Teaching of Mathematics Observation Scale was
designed to fi t some of the practical constraints that
shaped the study. Explorations with potential classroom
observation sites demonstrated that Year 8 mathematics
teachers were much more reluctant than early years
literacy teachers to participate in a study involving audio
or video recording. For this reason, the decision was made
to develop an instrument that could be scored reliably in
situ rather than relying on digital recording. For ease of in
situ scoring, it was also decided to restrict scoring to parts
of lessons when teachers and students were involved in
public (rather than private) interaction. A third constraint,
the total number of actions that an observer could be
expected to attend to during in situ observation, led to the
decision to limit coding to ten teaching practices.
Phase 2: estimating Year 8 student achievement gains
A convenient random sample of 24 schools was chosen
to represent the range of contexts in Western Australian
secondary schools. The sample included 2,864 students in
132 classes taught by a total of 95 teachers. Students were
assessed in late October/early November 2005 using secure
items from the WA Literacy and Numeracy Assessment
(WALNA) item bank. Analysis of the results of these
assessments revealed that:
• In Year 8, there was relatively more growth for high
performing students than low performing students.
Average growth on the WAMSE scale was 37 points at
the 90th percentile, 17 points at the 25th percentile and
19 points at the 10th percentile.
To estimate students’ achievement gains in mathematics
after taking account of prior performance, the same
statistical procedures were used in Study 2 as Study 1. Three
groups of classes were identifi ed: a more e! ective group, an
e! ective group and a less e! ective group. Analysis of these
results showed that:
• All eleven of the more e! ective classes were located
in metropolitan schools, eight were in schools with
SEI scores greater the 100, and ten classes had a Year 7
class mean above or well above the grand mean for the
study cohort.
• Three of the less e! ective classes were in rural schools,
only one was in a school with an SEI greater than 100,
and none of the classes had a Year 7 class mean above
the grand mean for the study cohort.
• Teachers who produced a high residual in one Year
8 class did not necessarily produce a high residual in
another Year 8 class. Teachers were generally more
e! ective with initially higher achieving classes.

92
Phase 3: pilot testing the ToMOS
Teachers of the more e! ective and e! ective classes were
approached to participate in the classroom observation
phase of the study in 2006. Nine teachers agreed to
participate. Two researchers and (where appropriate) a
videographer visited two non-consecutive lessons. The two
researchers, who had developed and tested the coding
manual for the ToMOS, scored teachers’ public time in situ
for each fi ve minute segment of each lesson. The results
indicated that:
• ToMOS is a reliable scale, showing high levels of inter-
rater reliability during pilot testing.
• There is a moderately strong relationship (rho = 0.647,
p = 0.06) between ToMOS scores and WALNA value-
added residual scores. Removal of a single outlying
score would imply a strong signifi cant relationship
between ToMOS scores and residuals (rho = 0.747, p
=0.033).
Numeracy teaching issues arising from the study
Although teachers, schools, and education departments
are more accountable for their e! ectiveness at improving
student outcomes and so are under more pressure to
improve the quality of teaching, a close examination
of research in mathematics education reveals that few
published studies have actually examined the strength of
the relationship between teacher traits or characteristics
of teaching practices commonly associated with teaching
quality or excellence, and teaching e! ectiveness. A limiting
factor has been the development of appropriate measures
of teaching quality and teaching e! ectiveness.
The ToMOS was developed in response to the need to have
a measure of teaching quality that is based on observable
practice. While further testing is required, pilot-testing of
the ToMOS indicates that mathematics teachers wanting
to improve their own e! ectiveness will do so if they
incorporate more actions identifi ed in the ToMOS into their
teaching practice.
Issues and implications
This study found a widening of the achievement gap
between classes with initially lower performing students
and classes with initially higher performing students.
Contemporary value added models, like the one used in
this study, allow researchers to partition variance in student
achievement gains into levels, including student and
class levels, and thus focus on the class level to provide a
measure of teaching e! ectiveness (referred to this analysis
as the class residual). It is not surprising that students’ initial
achievement predicts their future achievement at the
student level but it is surprising to fi nd that mean initial
achievement scores for the class were found to explain a
signifi cant amount of variance in achievement gains at the
class level.
There are many possible factors why classes with generally
lower achieving students may not be learning at the same
rate as classes of generally higher achieving students.
The secondary school setting for this research project
provided an interesting scenario for a multilevel analysis
of student achievement gains as many participating
teachers were teaching more than one Year 8 maths class;
the fi ndings revealed considerable variance in estimates
of student achievement gains between di! erent classes
of students taught by the same teacher. Although it is
beyond the scope of this report to examine in any detail
possible factors operating at the classroom level that
could explain this widening of the achievement gap, one
factor does stand out as being important to mention. As
well as substantial variation of student achievement levels
within most classes in the study (most were not streamed),
there was also striking variation in student achievement
levels between classes and schools. It should be expected
that the mathematical content and outcomes addressed
in one Year 8 class of mostly higher achieving students
would be very di! erent to the mathematical content and
outcomes addressed in another Year 8 class of mostly
lower achieving students. The instructional content must
be aimed at the appropriate level if students are to be
able to make meaningful connections between what they
know and understand, and what they are taught. While it
is reasonable to expect classes of students to learn at the
same rate, regardless of their initial achievement levels
(providing a scale measure of achievement is used), classes
will not learn at the same rate, regardless of the quality
of teaching actions, if the instructional content is not
appropriate for the student population. This is one possible
factor that could explain while classes may not be learning
at the same rate.
To validate theories of mathematics teaching in lower
secondary classrooms, it is imperative that what is
accepted and promoted as quality teaching can be
shown to account for student achievement gains. Given
93
the complexities involved in teaching lower secondary
mathematics and all that pedagogy entails, it is unlikely
that a single measure of teaching quality will account for
all variance in student achievement gains at the classroom
level. A measure of teachers’ pedagogical knowledge for
teaching mathematics (Hill, Rowan, Lowenberg Ball, 2005)
is important for measuring teaching quality. Similarly an
observational measure of teaching practice in action,
like the ToMOS, is imperative. The importance of a third
measure, one that represents the ‘distance’ between the
instructional content as it is taught and a classes’ capacity
to make meaningful connections with the content, has also
emerged. Further research is needed to examine how much
variance in student achievement gains can be explained at
the class level using these and possibly other measures, and
how much variance remains to be explained.
Practical applications
Robust instruments for examining teaching quality have
many practical applications. For example, the ToMOS can
be used as a refl ective tool for preservice mathematics
teachers, who can use it to critically analyse their use
of public time based on a videotape of themselves in
action. The consistency and type of feedback provided to
preservice teachers during practicum can vary markedly
and students’ refl ective self-reports of their practicum
experience may also vary in terms of the depth and
importance of the issues refl ected upon. The actions
identifi ed in the ToMOS will help preservice teachers
to focus, from the beginning of their development as
a teacher, on the quality of their teaching. Similarly
the ToMOS can be used as a refl ective tool for current
mathematics teachers who are looking to improve their
own e! ectiveness or as a reporting tool, as part of a
portfolio, for establishing teaching expertise.

94
R E F E R E N C E S
AAMT (2006). Standards for excellence in teaching mathematics in Australian Schools. Retrieved Jan 17, 2006, Australian Association of Mathematics Teachers:
Adams, R. J., & Khoo, S. T. (1999). ACER QUEST: The interactive test analysis system. Camberwell, VIC: The Australian Council for Educational Research.
Akiba, M., LeTendre, G. K., & Scribner, J.P. (2007). Teacher quality, opportunity gap, and national achievement in 46 countries. Educational Researcher, 36(7), 369-387.
Andrews R., Torgerson C., Beverton S., Locke T., Low G., Robinson A., Zhu D. (2004). The e! ect of grammar teaching (syntax) in English on 5 to 16 year olds’ accuracy and quality in written composition: Review summary. University of York, UK.
Andrich, D. (1982). An index of person separation in latent trait theory, the traditional KR.20 index, and the Guttman scale response pattern. Education Research and Perspectives, 9, 95-104.
Anstey, M. & Bull, J. (2006). Teaching and learning multiliteracies: Changing times changing literacies. Newark: Del: International Reading Association.
Askew, M., Brown, M., Rhodes, V., Johnson, D., & Wiliam, D. (1997). E! ective teachers of numeracy. Final report. London, UK: Kings College. Retreived Jan 10, http://www.gtce.org.uk/PolicyAndResearch/research/ROMtopics/numeracy1/study.
Askew, M., Brown, M., Rhodes, V., Johnson, D., & Wiliam, D. (n.d.). E! ective teachers of numeracy, Summary of fi ndings. London: King’s College. Retrieved Jan 11, 2006: www.tda.gov.uk
Bloom, B. S. (1976). Human characteristics and school learning. New York, NY: McGraw-Hill.
Bowey, J.A. (1994). Grammatical awareness and learning to read: A critique. In E.M.H. Assink (Ed.), Literacy acquisition and social context (pp.122-149). London: Harvester Wheatsheaf.
Bowey, J.A. (2005). Grammatical sensitivity: Its origins and potential contribution to early word reading skill. Journal of Experimental Child Psychology, 90, 318-343.
Bowey, J.A., & Patel, R.K. (1988). Metalinguistic ability and early reading achievement. Applied Psycholinguistics, 9, 367-383.
Bradley, R.A. and Terry, M.E. (1952). Rank analysis of incomplete block designs: I. The method of paired comparisons. Biometrika, 39, 324-345.
Brophy, J., & Good, T. (1986). Teacher behaviour and student achievement. In M. Wittrock (Ed.), Handbook of research on teaching (3rd ed., pp. 328-375). New York: Macmillan.
Brophy, J., & Good, T. L. (1986). Teacher behavior and student achievement. In M. C. Wittrock (Ed.), Handbook of research on teaching (3rd ed., 328-375). New York: Simon & Schuster.
Brown, M. (2000). What kinds of teaching and what other factors accelerate primary pupils’ progress in acquiring numeracy? Proceedings of Research Conference 2000, Australian Council of Educational Research (pp. 3-5). Camberwell, Victoria: Australian Council of Educational Research.
Brown, M., Askew, M., Rhodes, V., Denvir, H., Ranson, E., & Wiliam, D. (2003, April). Characterising individual and cohort progression in learning numeracy: results from the Leverhulme 5-year long longitudinal study. Paper presented at the American
Educational Research Association Conference, Chicago. Retrieved Jan 18, 2006: http://www.kcl.ac.uk/
Burgess, S.R. (2006). The development of phonological sensitivity. In D.K. Dickinson & S.B. Neuman (Eds.), Handbook of early literacy esearch (Vol. 2, pp. 90-100). New York: The Guildford Press.
Bus, A., van IJzendoorn, M., & Pellegrini, A. (1995). Joint book reading makes for success in learning to read: A meta-analysis on intergenerational transmission of literacy. Review of Educational Research, 65, 1-21.
Byrne, B., & Fielding-Barnsley, R. (1991). Evaluation of a program to teach phonological awareness to young children. Journal of Educational Psychology, 83, 451-455.
Cain, K. (2007). Syntactic awareness and reading ability: Is there any evidence for a special relationship? Applied Psycholinguistics, 28, 679-694.
Camilli, G., Vargas, S., & Yurecko, M. (2003). Teaching Children to Read: The fragile link between science and federal education policy. Education Policy Analysis Archives, 11(15). Retrieved 5 March 2008 from http://epaa.asu.edu/epaa/v11n15
Catholic Education South Australia (2004). Building mathematical understanding in the classroom: a constructivist teaching approach. Retrieved Jan 10, 2006, Australian Government Department of Education and Training Database: http://www.dest.gov.au
Chall, J. S. (1967). Learning to read: The great debate. New York: McGraw-Hill.
Clough, M. (2000). Monkey on the roof. Melbourne: Thomson Learning.
Cuttance and Innovation and Best Practice Consortium (2001). School innovation: Pathway to the knowledge society. Retrieved Jan 10, 2006, Australian Government Department of Education and Training Database: http://www.dest.gov.au
Department for Education and Employment (DfEE, 2000). A Model of Teaching E! ectiveness – a report by Hay McBer to the Department for Education and Employment. Retreived 15th Jan 2008 from http://www.teachernet.gov.uk/educationoverview/briefi ng/strategyarchive/modelofteachere! ectiveness/
Department of Education and Training in Western Australia (2006). Literacy and numeracy review: The fi nal report retreived 18th March 2008 from www.literacyandnumeracyreview.det.wa.edu.au
Department of Education, Science & Training, Education Queensland, Queensland Education Commission, & Association of Independent Schools Queensland (2004). Teachers enhancing numeracy. Retrieved Jan 17, 2006, Australian Government Department of Education and Training Database: http://www.dest.gov.au
Department of Education, Science & Training, New South Wales Department of Education and Training, Catholic Education Commission NSW, & Association of Independent Schools of New South Wales (2004). What’s ‘making the di! erence’?: Achieving outstanding numeracy outcomes in NSW primary schools. Retrieved Jan 17, 2006, Australian Government Department of Education and Training Database: http://www.dest.gov.au
Desimone, L. M., Smith, T., Baker, D., & Ueno, K. (2005). Assessing

95
barriers to the reform of U.S. mathematics instruction from an international perspective. American Educational Research Journal, 42(3), 501-535.
DEST (2005). Numeracy research and development initiative 2001-2004: An overview of the numeracy projects. Retrieved Jan 17, 2006, Australian Government Department of Education and Training Database: http://www.dest.gov.au
Dickinson, D.K. (2001). Putting the pieces together: The impact of preschool on children’s language and literacy development in kindergarten. In D.K. Dickinson & P.O. Tabors (Eds.), Beginning literacy with language: Young children learning at home andschool (pp. 257-287). Baltimore: Brookes.
Dickinson, D.K., McCabe, A., & Essex, M.J. (2006). A window of opportunity we must open to all: The case for preschool with high quality support for language and literacy. In D.K. Dickinson & S.B. Neuman (Eds.), Handbook of early literacy research (Vol. 2, pp. 11-28). New York: The Guildford Press.
Ding, C. S., & Davison, M. L. (2005). A longitudinal study of math achievement gains for initially low achieving students. Contemporary Education Psychology, 30, 81-95.
Du! y, G. G. (2003). Explaining reading: A resource for teaching concepts, skills and strategies. New York: The Guildford Press.
Duke, N. K., & Pearson, D. P. (2002). E! ective practices for developing reading comprehension. In A. E. Farstrup & S. J. Samuels (Eds.), What research has to say about reading instruction (pp. 205-242). Newark: International Reading Association.
Education Queensland. (2002). A guide to productive pedagogies: Classroom refl ection manual. Brisbane: Education Queensland / Department of Education Queensland, retrieved 12 August 2008 from http://education.qld.gov.au/public_media/reports/curriculum-framework/productive-pedagogies/html/manual/html
Ehri, L.C., & Roberts, T. (2006). The roots of learning to read and write: Acquisition of letters and phonemic awareness. In D.K. Dickinson & S.B. Neuman (Eds.), Handbook of early literacy research (Vol. 2, pp. 113-131). New York: The Guildford Press.
Fetherston, T. (2007). Artichoke computer software. Perth: Edith Cowan University.
Fitz-Gibbon, C. T. (1996). Monitoring education: Indicators, quality and e! ectiveness. London: Cassell.
Fox, M. (2001). Reading magic. Sydney: Pan MacMillan.
Groves, S., Mousley, J., & Forgasz, H. (2004). Primary numeracy: A mapping, review and analysis of Australian research in numeracy learning at the primary school level. Retrieved Jan 17, 2006, Australian Government Department of Education and Training Database: http://www.dest.gov.au
Hattie, J. (1992). Measuring the e! ects of schooling. Australian Journal of Education, 36(1), 5-13.
Hattie, J. (1999). Infl uences on student learning. Inaugural Professorial Address, University of Auckland. Retrieved Jan 10, 2006: http://scholar.google.com
Hattie, J. (2003). Teachers make a di! erence. What is the research evidence? Paper presented at the Building Teacher Quality Research Conference, Melbourne. Retrieved Jan 10, 2006: http://www.arts.auckland.ac.nz/sta! /index.cfm?P=8650
Hattie, J. A. (2003). Teachers make a di! erence: What is the research evidence? Paper presented at the Building Teacher Quality Research Conference, Melbourne. Retrieved 22 June 2004 from http://www.acer.edu.au/documents/TeachersMakeaDi! erenceHattie.doc
Hiebert, J., Gallimore, R., Garnier, H., Givvin, K. B., Hollingsworth, H., Jacobs, J., Miu-ying Chui, A., Wearne, D., Smith, M., Kersting, N., Manaster, A., Tseng, E., Etterbeek, W., Manaster, C., Gonzales, P., & Stigler, J. (2003). Teaching mathematics in seven countries: Results from the TIMSS 1999 Video Study. Washington, D.C.: National Center for Education Statistics.
Hill, H. C., Rowan, B., & Loewenberg Ball, D. (2005). E! ects of teachers’ mathematical knowledge for teaching on student achievement. American Education Research Journal, 42(2), 371-406.
Hill, P., & Crevola, C. A. (1999). Key features of a whole-school design approach to literacy teaching in schools. Australian Journal of Learning Disabilities, 4(3), 5-11.
Hill, S., Comber, B., Louden, W., Rivalland, J., & Reid, J. (1998). One hundred children go to school (Vol. 1-3). Canberra: Department of Employment, Education, Training and Youth A! airs (DEETYA).
Hollingsworth, H., Lokan, J., & McCrae, B. (2003). Teaching mathematics in Australia. Camberwell, Victoria: Australian Association of Educational Research. Retreived Jan 10, 2006, from the Australian Council of Educational Research database:http://www.acer.edu.au, http://www.aamt.edu.au, http://www.sofweb.vic.edu.au/mys/research/MYNRP/index.htm
Ingvarson, L., Beavis, A., Bishop, A., Peck, R., & Elsworth, G. (2004). Investigation of e! ective mathematics teaching and learning in Australian secondary schools. Canberra, Australian Capital Territory: Australian Government, Department of Education and Training. Retrieved Jan 18, 2006: http://www.dest.gov.au
Juel, C, (2006). The impact of early school experiences on initial reading. In D.K. Dickinson & S.B. Neuman (Eds.) Handbook of early literacy research (Vol. 2, pp. 410-426). New York: The Guildford Press.
Konstantopoulos, S. (2006) Trends of school e! ects on student achievement: Evidence from NLS:72, HSB:82, and NELS:92. Teachers College Record, 108(12), 2550-81.
Louden, W., & Rohl, M. (2003). Classroom Literacy Observation Schedule (CLOS). Perth: Edith Cowan University.
Louden, W., & Rohl, M. (2008). Classroom Literacy Observation Schedule - Revised (CLOS-R). Perth: The University of Western Australia .
Louden, W., Chan, L. K. S., Elkins, J., Greaves, D., House, H., Milton, M., Rohl, M., et al. (2000). Mapping the territory: Primary students with learning di" culties in literacy and numeracy (Vols. 1-3). Canberra: Department of Education, Training and Youth A! airs (DETYA).
Louden, W., Rohl, M., Barratt-Pugh, C., Brown, C., Cairney, C., Elderfi eld, J., et al. (2005). In teachers’ hands: E! ective teaching practices in the early years of schooling. Australian Government Department of Education Science and Training. Retrieved Jan 2006from http://www.dest.gov.au/sectors/school_education/publications_resources/profi les/in_teachers_hands.htm
Luce, R.D. (1959). Individual choice behaviours: A theoretical analysis. New York: J. Wiley.
96
Luke, A. (2003). Making literacy policy and practice with a di! erence. Australian Journal of Language and Literacy, 26 (3) 58-82.
Luke, A., & Freebody, P. (1999). A map of possible practices: Further notes on the four resources model. Practically Primary, 4(2), 5-8.
MacNab, D. (2000). Raising standards in mathematics education: values, vision, and TIMSS. Educational Studies in Mathematics, 42(1), 61-80.
Masters, G. (1982). A Rasch model for partial credit scoring. Psychometrika, 47, 149-174.
Mayer, D. P. (1999). Measuring instructional practice: Can policymakers trust survey data? Educational Evaluation and Policy Analysis, 21(1), 29-45.
Mazzoni, S. S., & Gambrell, L. B. (2003). Principles of best practice: Finding the common ground. In L. M. Morrow, L. B. Gambrell & M Pressley (Eds.), Best practices in literacy instruction (2nd Ed.). New York: The Guildford Press.
McCa! rey, D. F., Hamilton, L. S., Stecher, B. M., Klein, S. P., Bugliari, D., & Robyn, A. (2001). Interactions among instructional practices, curriculum, and student achievement: The case of standards-based high school mathematics. Journal for Research in Mathematics Education, 32(5), 493-517.
McKeown, G.R., & Beck, I.L. (2006). Encouraging young children’s interactions with stories. In D.K. Dickinson & S.B. Neuman (Eds.), Handbook of early literacy research (Vol. 2, pp. 281-294). New York: The Guildford Press.
Meiers, M., Khoo, S.T., Rowe, K., Stephanou, A., Anderson, P., & Nolan, K. (2006). Growth in literacy and numeracy in the fi rst three years of school. Camberwell, VIC: The Australian Council for Educational Research.
Morrison, F.J., Connor, C.M., & Bachman, H.J. (2006). The transition to school. In D.K. Dickinson & S.B. Neuman (Eds.), Handbook of early literacy research (Vol. 2, pp. 375-394). New York: The Guildford Press.
National Institute of Child Health and Development (2000). Report of the National Reading Pane. [Teaching children to read]An evidence-based assessment of the scientifi c research literature on reading and its implications for reading instruction. (No. 00-4769). Washington DC: Government Printing O" ce. Retrieved 4 June 2006 from http://www.nichd.nih.gov/publications/nrp/smallbook.cfm
NCTM (2000). Principles and Standards for School Mathematics. Retrieved Jan 17, 2006, National Council of Teachers of Mathematics: http://standards.nctm.org
Nelson, K. (1996). Language in cognitive development: The emergence of the mediated mind. New York: Cambridge University Press.
Nye, B., Konstantopoulos, S., & Hedges, L. V. (2004). How large are teacher e! ects? Educational Evaluation and Policy Analysis, 26(3), 237-257.
Olson, D.R. (1994). The world on paper. Cambridge: Cambridge University Press.
Palincsar, A. S., & Brown, A. L. (1984). Reciprocal teaching of comprehension-fostering and comprehension-monitoring activities. Cognition and Instruction, 1(2), 117-175.
Piaget, J. (1959). Apprentissage et connaissance. In J. Piaget (Ed.), Etudes d’epistemologie genetique. (Vol. 7, pp. 21-67). Paris: Presses Universitaries de France.
Pianta, R.C. (2006). Teacher-child relationships and early literacy. In D.K. Dickinson & S.B. Neuman (Eds.), Handbook of early literacy research (Vol. 2, pp. 149-162). New York: The Guildford Press.
Ramey, S.L., & Ramey, C.T. (2000). Early childhood experiences and developmental competence. In J. Waldfogel & S. Danziger (Eds.), Securing the future: Investing in children from birth to college (pp. 122-150). New York: Russell Sage.
Rasch, G. (1960/1980). Probabilistic models for some intelligence and attainment tests (Copenhagen, Danish Institute for Educational Research, Expanded 1980 ed.). Chicago: University of Chicago Press.
Rego, L.L.B., & Bryant, P.E. (1993). The connection between phonological, syntactic and semantic skills and children’s reading and spelling. European Journal of Psychology in Education, 13, 235-246.
Robinson, F. (1993). Meet my mouse. Glenview, Illinois: Scott, Foresman and Company.
Rose, J. (2006). Independent review of the teaching of early reading: Final report. Department for Education and Skills. Available at http://www.standards.dfes.gov.uk/phonics/report.pdf
Rowan, B., Correnti, R., Miller, R. J. (2002). What large-scale, survey research tells us about teacher e! ects on student achievement: Insights from the Prospects Study of elementary schools. Teachers College Record, 101(8), 1525-1567.
Rowe, K. J. (2001). Educational performance indicators. In M. Forster, G. Masters & K. J. Rowe (Eds.), Measuring learning outcomes: Options and challenges in evaluation and performance monitoring (Revised ed., pp. 2-20). Washington, DC: The World Bank Institute.
Rowe, K. J., & Rowe, K. S. (1999). Investigating the relationship between students’ attentive-inattentive behaviors in the classroom and their literacy progress. International Journal of Educational Research, 31(1-2), 1-38 (Whole Issue).
Rowe, K.J. (2005). Teaching reading: National inquiry into the teaching of literacy. Canberra: Australian Government Department ofEducation, Science and Training. Retrieved 12 Jan 2006 from http://www.dest.gov.au/nitl/report.htm
Saxe, B. B., Gearhart, M., & Seltzer, M. (2000). Relations between classroom practices and student learning in the domain of fractions.Cognition and Instruction, 17(1), 1-24.
Scarborough, H.S., & Dobrich, W. (1990). On the e" cacy of reading to preschoolers. Developmental Review, 14, 245-302.
Scheerens, J., & Bosker, R. J. (1997). The foundations of educational e! ectiveness. Oxford: Pergamon Press.
Schoen, H. L., Cebulla, K. J., Finn, K. F., & Fi, C. Teacher variables that relate to student achievement when using a standards-based curriculum. Journal for Research in Mathematics Education, 34 (3), 228.
Senechal, M., Ouellette, G., & Rodney, D. ( 2006). The misunderstood giant: On the predictive role of early vocabulary to future reading. In D.K. Dickinson & S.B. Neuman (Eds.), Handbook of early literacy research (Vol. 2, pp. 173-182). New York: The Guildford Press.
97
Siemon, D., Virgona, J., & Corneille, K. (2001). The middle years numeracy research project 5-9. Retrieved Jan 17, 2006 from the SOFweb database, Department of Education and Training, Victoria:
Smith, A. (2000). Kitty cat plays inside. Melbourne: Thomson Learning.
Snow, C. E., Burns, M. S., & Gri" n, P. (Eds.). (1998). Preventing reading di" culties in young children. Washington, DC: National Academy Press.
Snyder, I. (2008). The literacy wars: Why teaching children to read and write is a battleground in Australia. Crow’s Nest NSW: Allen & Unwin.
Stahl, S. A. (2001). Teaching phonics and phonological awareness. In S. Neuman & D. K. Dickinson (Eds.), Handbook of early literacy research (Vol. 1, pp. 333-347). New York: The Guildford Press.
Strickland, D. S. (2001). Early intervention for African American children considered to be at risk. In S. Neuman & D. K. Dickinson (Eds.), Handbook of early literacy research (Vol. 1, pp. 348-360). New York: The Guildford Press.
Strickland, D. S. (2002). The importance of early interventions. In A. E. Farstrup & S. J. Samuels (Eds.), What research has to say about reading instruction (pp. 69-86). Newark: International Reading Association.
Taylor, B. M., Anderson, R. C., Au, K. H., & Raphael, T. E. (2000). Discretion in the translation of research to policy: A case from beginning reading. Educational Researcher, August-September, 16-26.
Taylor, B. M., Pearson, P. D., Clark, K. F., & Walpole, S. (1999). Beating the odds in teaching all children to read. Ann Arbor: Center for the Improvement of Early Reading Achievement, University of Michigan.
Teale, W.H., Paciga, K.A., & Ho! man, J.L. (2007). Beginning reading instruction in urban schools: The curriculum gap ensures a continuing achievement gap. The Reading Teacher, 61(4), 344–348.
Thurstone, L.L. (1927). A law of comparative judgement. Psychological Review, 34, 273-286.
Tunmer, W. E., Herriman, M. L., & Nesdale, A. R. (1988). Metalinguistic abilities and beginning reading. Reading Research Quarterly, 23, 134-158.
Tunmer, W.E & Hoover, W.A. (1992). Cognitive and linguistic factors in learning to read. In P.B. Gough, L.C. Ehri and R. Treiman (Eds.), Reading acquisition. Hillsdale, NJ: Earlbaum.
Tunmer, W.E., Pratt, C., Herriman, M.L. (Eds.) (1984). Metalinguistic awareness in children: Theory, research, and implications. Berlin : Springer-Verlag.
Tymms, P. (1999). Baseline assessment, value-added and the predication of reading. Journal of Research in Reading, 22(1), 27-36.
Victorian Department of Education & Training, Catholic Education Commission of Victoria, & Association of Independent Schools of Victoria (2004). Researching numeracy teaching approaches in primary school. Retrieved Jan 17, 2006, Australian Government Department of Education and Training Database: http://www.dest.gov.au
Vygotsky, L.S. (1962). Thought and Language. Cambridge, MA: MIT Press.
Watson, 2001. Literacy and oral language: Implications for early literacy acquisition. In S. Neuman & D. K. Dickinson (Eds.), Handbook of early literacy research (Vol. 1, pp. 43-53). New York: The Guildford Press.
Wayne, A. J., & Youngs, P. Teacher characteristics and student achievement gains: A review. Review of Educational Research, 73(1), 89-122.
Wray, D., Medwell, J., Fox, R., & Poulson, L. (2000). The teaching practices of e! ective teachers of literacy. Educational Review, 52(1), 75-84.
Wray, D., Medwell, J., Poulson, L., & Fox, R. (2002). Teaching literacy e! ectively in the primary school. London: Routledge/Falmer.
Ramey, S.L., & Ramey, C.T. (2000). Early childhood experiences and developmental comptence. In J. Waldfogel & S. Danziger (Eds.), Securing the future: Investing in children from birth to college (pp. 122-150). New York: Russell Sage.
Rose, J. (2006). Independent review of the teaching of early reading: Final report. Department for Education and Skills. Available at http://www.standards.dfes.gov.uk/phonics/report.pdf

98
3.0 | | | 2SWg | 2SWf X | X | 2SWe X | 2.0 X | XX | 2SWd X | 2HS7.2 2MR5.4 2MR6.3 X | XX | 2SWc XX | 2HS2.3 2PC9 XXX | 2HW7.2 2SW8 2SW0 2SWb 1.0 XX | 2OBa.3 XXXXX | XXXX | XXXX | 2HS5 2SW9 2MR5.3 XXXXX | 2SW6 XXXXXXX | 2SWa XXXXXXX | 2MR6.2 0.0 XXXXXXX | 2SW5 XXXXXXXX | 2OBa.2 2MR5.2 XXXXXXXXXXXX | 2HS2.2 2HW6.3 2SW3 2PC8 XXXXXXXX | 2HW7.1 2SW2 XXXXXXXXXXX | 2HS3 2HW4.2 2MR5.1 XXXXXXXXXXXXXX | 2HS9 2SW7 XXXXXXXXXXXXXX | 2HS4.2 2WS5 2WSd.2 2WSe.2 2WSf.2 2LS3 2MR3.3 2MR6.1 -1.0 XXXXXXXXXXXXXXX | 2HW6.2 2WSc.2 XXXXXXXXXXXXXXXXXXXX | 2WSf.1 2LSf 2PC5 XXXXXXXXXXXXX | 2OB6 2WSc.1 2WSk 2MR3.2 XXXXXXXXXXXXXXXXXX | 2HW5.2 2HW6.1 2WSd.1 2WSe.1 2MR1.2 XXXXXXXXXXX | 2HW4.1 2OB7 2OB9 2PC7 XXXXXXXXXXXXXX | 2OB8 2OB0 2LS9 2PC6 -2.0 XXXXXXXXXXXXXXXXX | 2OBa.1 2WS2 2SW4 2PC3 XXXXXXXXXX | 2OB1.2 2LS0 2LSl 2LSm 2LSn 2MR3.1 XXXXXXXXXX | 2HW3 2OB4 2WS8 2WSh 2WSi 2LSj 2MR2 2PC4 XXXXXXXXX | 2HS7.1 2HW5.1 2OB5 2WS7 2WS9 XXXXXXXXX | 2WS0 2WSa 2WSm 2LS8 2LSa XXXXXXXX | 2HS8 2WSl 2LS6 2MR1.1 XXXXXXX | 2OB1.1 2WS4 2WSj 2LS5 2LSb 2LSc -3.0 XXX | 2LS4 2MR7 2PC2 XXXXX | 2LS7 2LSe 2LSi 2PC1 XX | 2WS3 2LS2 2LSp 2LSq XXX | 2LSk XXXXX | 2LSh 2MR8 XX | 2LSg X | -4.0 XX | | 2OB2 X | 2HS4.1 2OB3 X | 2HW1 X | | X | -5.0 | 2HS6 | | 2HS2.1 | ----------------------------------------------------------------------------------------------=============================================================================================== Each X represents 4 students ============================================================================================== Figure A1.1 Pre-primary literacy item estimates for Term 4
A P P E N D I X 1
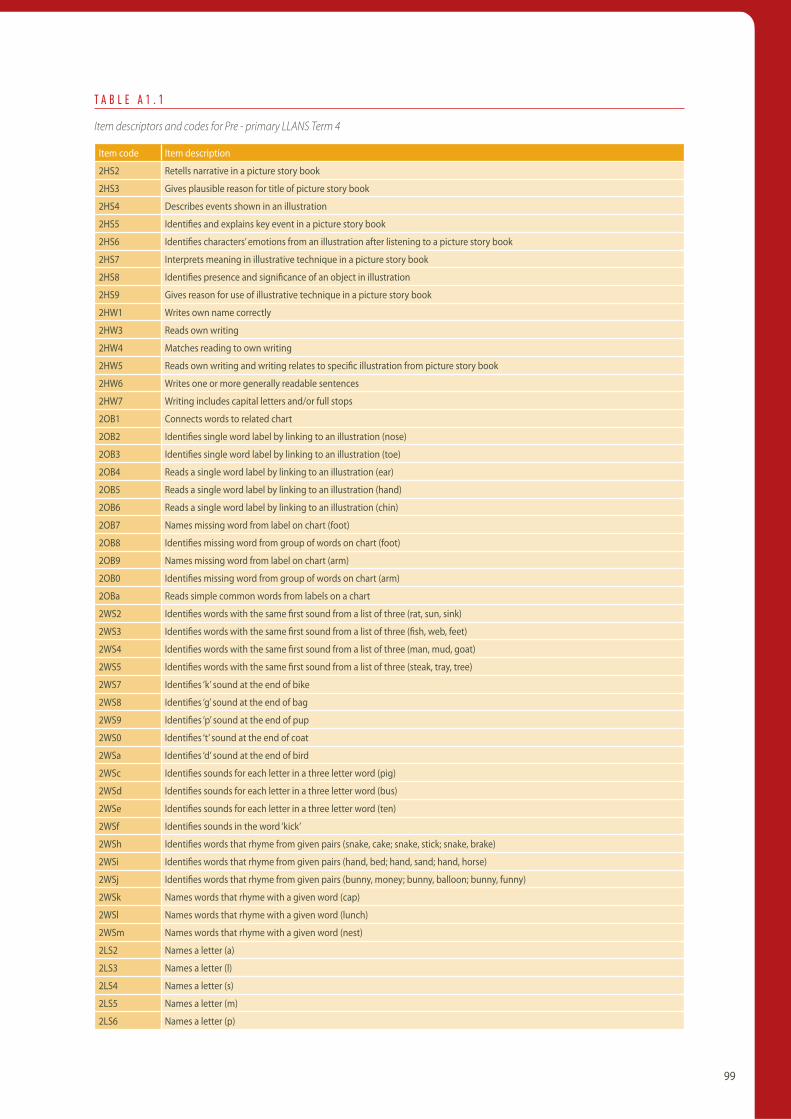
99
T A B L E A 1 . 1
Item descriptors and codes for Pre - primary LLANS Term 4
Item code Item description
2HS2 Retells narrative in a picture story book
2HS3 Gives plausible reason for title of picture story book
2HS4 Describes events shown in an illustration
2HS5 Identi! es and explains key event in a picture story book
2HS6 Identi! es characters’ emotions from an illustration after listening to a picture story book
2HS7 Interprets meaning in illustrative technique in a picture story book
2HS8 Identi! es presence and signi! cance of an object in illustration
2HS9 Gives reason for use of illustrative technique in a picture story book
2HW1 Writes own name correctly
2HW3 Reads own writing
2HW4 Matches reading to own writing
2HW5 Reads own writing and writing relates to speci! c illustration from picture story book
2HW6 Writes one or more generally readable sentences
2HW7 Writing includes capital letters and/or full stops
2OB1 Connects words to related chart
2OB2 Identi! es single word label by linking to an illustration (nose)
2OB3 Identi! es single word label by linking to an illustration (toe)
2OB4 Reads a single word label by linking to an illustration (ear)
2OB5 Reads a single word label by linking to an illustration (hand)
2OB6 Reads a single word label by linking to an illustration (chin)
2OB7 Names missing word from label on chart (foot)
2OB8 Identi! es missing word from group of words on chart (foot)
2OB9 Names missing word from label on chart (arm)
2OB0 Identi! es missing word from group of words on chart (arm)
2OBa Reads simple common words from labels on a chart
2WS2 Identi! es words with the same ! rst sound from a list of three (rat, sun, sink)
2WS3 Identi! es words with the same ! rst sound from a list of three (! sh, web, feet)
2WS4 Identi! es words with the same ! rst sound from a list of three (man, mud, goat)
2WS5 Identi! es words with the same ! rst sound from a list of three (steak, tray, tree)
2WS7 Identi! es ‘k’ sound at the end of bike
2WS8 Identi! es ‘g’ sound at the end of bag
2WS9 Identi! es ‘p’ sound at the end of pup
2WS0 Identi! es ‘t’ sound at the end of coat
2WSa Identi! es ‘d’ sound at the end of bird
2WSc Identi! es sounds for each letter in a three letter word (pig)
2WSd Identi! es sounds for each letter in a three letter word (bus)
2WSe Identi! es sounds for each letter in a three letter word (ten)
2WSf Identi! es sounds in the word ‘kick’
2WSh Identi! es words that rhyme from given pairs (snake, cake; snake, stick; snake, brake)
2WSi Identi! es words that rhyme from given pairs (hand, bed; hand, sand; hand, horse)
2WSj Identi! es words that rhyme from given pairs (bunny, money; bunny, balloon; bunny, funny)
2WSk Names words that rhyme with a given word (cap)
2WSl Names words that rhyme with a given word (lunch)
2WSm Names words that rhyme with a given word (nest)
2LS2 Names a letter (a)
2LS3 Names a letter (l)
2LS4 Names a letter (s)
2LS5 Names a letter (m)
2LS6 Names a letter (p)
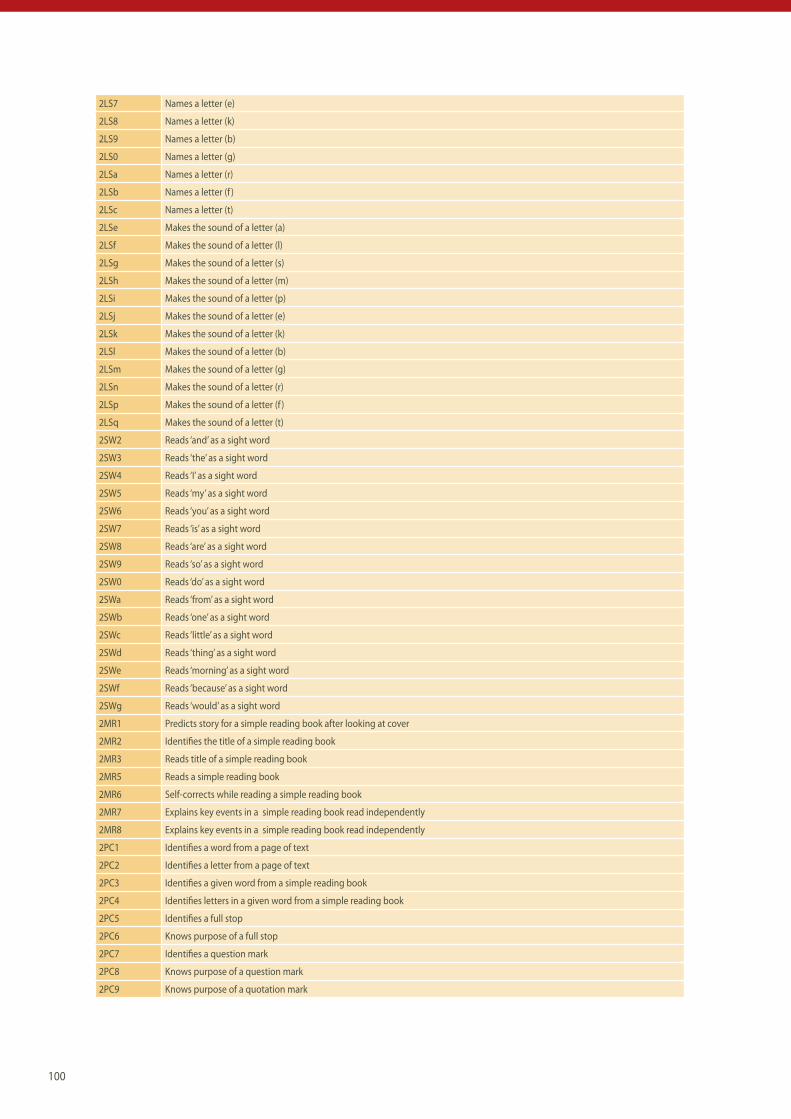
100
2LS7 Names a letter (e)
2LS8 Names a letter (k)
2LS9 Names a letter (b)
2LS0 Names a letter (g)
2LSa Names a letter (r)
2LSb Names a letter (f )
2LSc Names a letter (t)
2LSe Makes the sound of a letter (a)
2LSf Makes the sound of a letter (l)
2LSg Makes the sound of a letter (s)
2LSh Makes the sound of a letter (m)
2LSi Makes the sound of a letter (p)
2LSj Makes the sound of a letter (e)
2LSk Makes the sound of a letter (k)
2LSl Makes the sound of a letter (b)
2LSm Makes the sound of a letter (g)
2LSn Makes the sound of a letter (r)
2LSp Makes the sound of a letter (f )
2LSq Makes the sound of a letter (t)
2SW2 Reads ‘and’ as a sight word
2SW3 Reads ‘the’ as a sight word
2SW4 Reads ‘I’ as a sight word
2SW5 Reads ‘my’ as a sight word
2SW6 Reads ‘you’ as a sight word
2SW7 Reads ‘is’ as a sight word
2SW8 Reads ‘are’ as a sight word
2SW9 Reads ‘so’ as a sight word
2SW0 Reads ‘do’ as a sight word
2SWa Reads ‘from’ as a sight word
2SWb Reads ‘one’ as a sight word
2SWc Reads ‘little’ as a sight word
2SWd Reads ‘thing’ as a sight word
2SWe Reads ‘morning’ as a sight word
2SWf Reads ‘because’ as a sight word
2SWg Reads ‘would’ as a sight word
2MR1 Predicts story for a simple reading book after looking at cover
2MR2 Identi! es the title of a simple reading book
2MR3 Reads title of a simple reading book
2MR5 Reads a simple reading book
2MR6 Self-corrects while reading a simple reading book
2MR7 Explains key events in a simple reading book read independently
2MR8 Explains key events in a simple reading book read independently
2PC1 Identi! es a word from a page of text
2PC2 Identi! es a letter from a page of text
2PC3 Identi! es a given word from a simple reading book
2PC4 Identi! es letters in a given word from a simple reading book
2PC5 Identi! es a full stop
2PC6 Knows purpose of a full stop
2PC7 Identi! es a question mark
2PC8 Knows purpose of a question mark
2PC9 Knows purpose of a quotation mark

101
Figure A1.2 Year 1 literacy item estimates Term 1
4.0 | | | | 3KS4.3 | 3MW1.4 | | 3.0 | | | 3MB2.2 | | 3SS6.3 | 3MW2.4 | 3MW4.3 2.0 X | 3SS4.3 3SS5.3 3IW8 3MW1.3 X | 3KS3.3 X | 3IW7 3MW3.3 3MW4.2 X | 3KC7 X | 3KS2.2 XXX | XXXX | 3SS3.3 3IW4 3IWo 1.0 XXXX | 3KC8 3MW1.2 3MW4.1 XXXXX | 3SS5.2 3SS6.2 XXXXXXXX | 3KC2.2 3SS3.2 3IW9 3MB1.2 3MB9.2 3MW2.3 XXXXX | 3SS2.3 3SS4.2 3PA4 3IW3 XXXXXX | 3KC4.2 3SS6.1 XXXXXXXXXXX | 0.0 XXXXXXXX | 3KC5 3KS4.2 3SS4.1 3SS5.1 3IW5 3MB6.2 XXXXXXXXXXXXXXXXX | XXXXXXXXX | 3KC3.2 3KS3.2 3SS2.2 3SS3.1 3PA3 3IW6 3MB4.2 3MW3.2 XXXXXXXXXXXXXXXXXXX | 3KC4.1 XXXXXXXXXX | 3KC2.1 3PA2 3IW2 3MB5 XXXXXXXXXXXX | 3PA1 3MW2.2 XXXXXXXXXXX | 3KC3.1 3SS2.1 3MB3 -1.0 XXXXXXXXXX | 3KC1.2 XXXXXXXXXXXX | 3KC6 3KS1.2 3IW1 3MB8 3MW3.1 XXXXXXXXXXX | 3MW2.1 XXXXXXXXXXX | 3KS3.1 3KS4.1 3MW1.1 XXXXXXXXX | 3KS1.1 3KS2.1 XXXXXXXX | 3SS1 3MB2.1 XXXXXXX | 3MB7.2 -2.0 XXXXXXXXXXX | 3MB9.1 XXXX | XXX | 3MB1.1 3MB6.1 XXX | XXXX | 3MB4.1 XX | | -3.0 | X | | 3MB7.1 | | 3KC1.1 X | | -4.0 | ---------------------------------------------------------------------------------------------------- Each X represents 5 students ====================================================================================================

102
T A B L E A 1 . 2
Item descriptors and codes for Year 1 LLANS Term 1
Item code Item description
3KC1 Predicts content after looking at the front cover of a simple picture story book (Kitty Cat Plays Inside)
3KC2 Reads the title of a simple picture book
3KC3 Reads all or most of a simple picture story book with moderate accuracy
3KC4 Identi! es and reads words that a character says in a picture story book
3KC5 Gives plausible motive for a character’s behaviour in a simple picture story book
3KC6 O" ers opinion and gives plausible reason concerning a character’s situation in a simple picture story book
3KC7 Recognises and names quotation marks
3KC8 Describes purpose of quotation marks
3KS1 Spells and writes high frequency words with a range of patters (big)
3KS2 Spells and writes high frequency words with a range of patters (come)
3KS3 Spells and writes high frequency words with a range of patters (played)
3KS4 Spells and writes high frequency words with a range of patters (basket)
3SS1 Pronounces words that require segmenting of letters, blends and syllables (sun)
3SS2 Pronounces words that require segmenting of letters, blends and syllables (satin)
3SS3 Pronounces words that require segmenting of letters, blends and syllables (sandal)
3SS4 Pronounces words that require segmenting of letters, blends and syllables (seminar)
3SS5 Pronounces words that require segmenting of letters, blends and syllables (satellite)
3SS6 Pronounces words that require segmenting of letters, blends and syllables (sentimental)
3PA1 Manipulates sounds in words, e.g.. takes out m in meat and make eat
3PA2 Manipulates sounds in words (bend/end)
3PA3 Manipulates sounds in words (card/car)
3PA4 Manipulates sounds in words (black/back)
3IW1 Reads words with a similar structure (like/bike)
3IW2 Reads words with a similar structure (like/hike)
3IW3 Reads words with a similar structure (like/spike)
3IW4 Reads words with a similar structure (like/strike)
3IW5 Reads words with a similar structure (like/likes)
3IW6 Reads words with a similar structure (like/liked)
3IW7 Reads words with a similar structure (like/likely)
3IW8 Reads words with a similar structure (like/likeness)
3IW9 Spells and writes a given word (bike)
3IW0 Spells and writes a given word (liked)
3MB1 After listening to a picture story book identi! es main idea in a retelling (Magical Bicycle)
3MB2 Explains a story complication and resolution in a picture story book
3MB3 Identi! es a key detail in a picture story book
3MB4 Makes a link between illustration, text and narrative in a picture story book
3MB5 Recognises and interprets meaning behind an illustration in a picture story book
3MB6 Links images and text to construct meaning from own reading and listening to a picture story book
3MB7 Links images and text to construct meaning from own reading and listening to a picture story book
3MB8 Recognises and interprets meaning behind an illustration in a picture story book
3MB9 Makes a generalisation about an illustration at the conclusion of a picture story book
3MW1 Writes a well connected extended piece that shows the beginning of a recognisable structure e.g. Recount, narrative
3MW2 Writing includes one or more complex sentences
3MW3 Writing is very readable with many words spelt correctly
3MW4 Writing included several sentences with capital letters and full stops used consistently and accurately

103
WA growth study (Year 1 Term 4 anchored on LLANS S4) ------------------------------------------------------------------------------------------------- Item Estimates (Thresholds) LitY1T4 (N = 1152 L = 48 Probability Level=0.50) ------------------------------------------------------------------------------------------------- 5.0 | | | | | | 4.0 X | | X | 4SP8.2 X | X | 4TW6.3 X | 4SP7.2 4WR2.4 3.0 X | 4WR5.3 XXXX | 4ST5 4SP6.2 XXXXX | 4WR5.2 XXX | 4ST1.2 4STa.2 4TW5.3 4WR1.4 XXXXXXXX | 4WR4.3 XXXXXXXX | 4WR2.3 2.0 XXXXXXXXXXXX | 4ST6 4TW6.2 XXXXXXXXXXX | 4TW5.2 XXXXXXXXX | 4ST9 4MM2.4 4WR3.3 XXXXXXXXXXXXXXXX | 4ST4 4ST7.2 4ST8.2 4STc 4TW2.2 4TW6.1 4PA5 XXXXXXXXXXXXXXXXXXXX | 4MM5 4WR4.2 XXXXXXXXXXXX | 4PA8 4WR1.3 1.0 XXXXXXXXXXXXX | 4TW3.2 4TW5.1 XXXXXXXXXXX | 4STa.1 4TW4.2 4PA3 4SP3.2 4WR5.1 XXXXXXXXXXX | 4ST1.1 4PA4 4MM2.3 XXXXXXXXXXXXXX | 4PA9 4MM1.2 4MM7 XXXXXXXXXXX | 4ST7.1 4PA6 4SP2.2 4SP5.2 4MM6.3 4WR3.2 4WR4.1 XXXXXXXXX | 4ST0 4TW4.1 4SP5.1 4MM2.2 XXXXXXXXXX | 4TW3.1 4WR1.2 4WR2.2 0.0 XXXXXXX | 4PA7 4SP4.2 4SP6.1 4MM1.1 4MM6.2 XXXXX | 4ST2 4ST8.1 4SP1.2 4SP2.1 4SP7.1 4MM3 4MM4.2 4WR1.1 4WR2.1 4WR3.1 XXXXXXX | 4TW2.1 XX | 4SP3.1 XXX | 4PA2 4SP1.1 4MM6.1 XXX | 4MM2.1 4MM4.1 -1.0 X | 4ST3 4PA1 4SP4.1 4SP8.1 XX | 4STb 4TW1 XX | X | X | X | -2.0 | | X | | | | -3.0 | | | | | | -4.0 | -------------------------------------------------------------------------------------------------- Each X represents 5 students ================================================================================================== Figure A1.3 Year 1 literacy item estimates Term 2

104
T A B L E A 1 . 3
Item descriptors and codes for year 1 LLANS term 4
Item code Item description
4ST1 Gives relevant information from an informational book after hearing the text read aloud (Size of Sea Turtle)
4ST2 Gives relevant information from an informational book after hearing the text read aloud (Sea Turtles’ Mouths)
4ST3 Gives relevant information from an informational book after hearing the text read aloud (What Sea Turtles Eat)
4ST4 Identi! es relevant title for information box after hearing related text read aloud
4ST5 Identi! es information from obvious clues in an informational book
4ST6 Uses context to provide meaning for an unfamiliar word in an informational text after hearing the text read aloud
4ST7 Identi! es the purpose of a photo caption in an informational text
4ST8 Identi! es from listening a speci! c in an informational text (How Seat Turtles Have Babies)
4ST9 Identi! es from listening a speci! c in an informational text (Who Looks After Baby Sea Turtles)
4ST0 Locates explicit details from listening to an informational text
4STa Provides generalised de! nition of glossary page
4STb Identi! es purpose of repeated graphic element and connects to text
4STc Recognises internet addresses of connects address with computer
4TW1 Pronounces words that require segmenting of letters, blends and syllables (ten)
4TW2 Pronounces words that require segmenting of letters, blends and syllables (tablet)
4TW3 Pronounces words that require segmenting of letters, blends and syllables (ticket)
4TW4 Pronounces words that require segmenting of letters, blends and syllables (target)
4TW5 Pronounces words that require segmenting of letters, blends and syllables (tactical)
4TW6 Pronounces words that require segmenting of letters, blends and syllables (tetrahedron)
4PA1 Manipulates middle sounds in words e.g swaps h in hat with m to make mat
4PA2 Manipulates middle sounds in words e.g swaps c in camp with l to make lamp
4PA3 Manipulates middle sounds in words e.g swaps n in bin with g to make big
4PA4 Manipulates middle sounds in words e.g swaps t in art with m to make arm
4PA5 Manipulates middle sounds in words e.g swaps m in stem with p to make step
4PA6 Manipulates middle sounds in words e.g swaps u in cup with a to make cap
4PA7 Manipulates middle sounds in words e.g swaps o in shop with i to make ship
4PA8 Manipulates middle sounds in words e.g swaps m in smell with p to make spell
4PA9 Manipulates middle sounds in words e.g swaps l in blush with r to make brush
4SP1 Spells and writes a given word (his)
4SP2 Spells and writes a given word (plan)
4SP3 Spells and writes a given word (games)
4SP4 Spells and writes a given word (time)
4SP5 Spells and writes a given word (thin)
4SP6 Spells and writes a given word (running)
4SP7 Spells and writes a given word (great)
4SP8 Spells and writes a given word (basket)
4MM1 Identi! es author and/or photographer names beneath title of informational book
4MM2 Reads some or all of a simple reading book with accuracy
4MM3 Identi! es speci! c information in a simple informative reading book read independently (Purpose of Mouse Whiskers)
4MM4 Identi! es speci! c information in a simple informative reading book read independently (Information About Teeth)
4MM5 Identi! es speci! c information in a simple informative reading book read independently (Why Mice Chew)
4MM6 Locates speci! c information in a simple informative reading book read independently (Keeping Pet Mouse)
4MM7 Recognises purpose of ellipsis at the end of the page
4WR1 Writes with control and/or coherence in response to simple informative reading book
4WR2 Writes a variety of simple and complex sentences
4WR3 Writes readable text with correct or plausible spelling
4WR4 Uses full stops and capital letters consistently and accurately
4WR5 Uses a variety of common punctuation

105
Date
:Re
sear
cher
s :
Teac
her c
amer
a:St
uden
t cam
era:
Scho
ol:
Year
gro
up: P
re-p
rimar
y / Ye
ar 1
Teac
her/a
dult
pres
ent:
No. o
f stu
dent
s: 40
+
Activ
ityRe
al Ti
me
(Not
e St
art &
End
Tim
e of
an A
ctiv
ity
Grou
ping
Who
le
(W) S
mal
l (S)
In
divi
dual
(I)
Com
men
ts/O
bser
vatio
ns (I
f les
s tha
n w
hole
gr
oup
wha
t are
the
othe
r chi
ldre
n do
ing?
)De
scrip
tion
of ac
tivity
- id
entif
y the
likel
y lite
racy
pur
pose
and
cont
ent.
Read
ing
8.44
lCh
ildre
n ar
rive
with
par
ents
who
read
with
ch
ildre
n. P
aren
ts, li
ttle
kids
.
Teac
her a
ssist
ants
and
wor
k exp
erie
nce
stud
ents
also
read
ing
with
chn.
All s
eem
to h
ave
read
ing
book
s.
Child
ren
wor
king
on:
read
ing
to p
aren
ts an
d te
ache
r ass
istan
ts; w
ritin
g di
ary;
initi
al le
tter
gam
es -
soun
ds, w
ord
fam
ilies
, sig
ht w
ords
.
Busy
and
prod
uctiv
e at
mos
pher
e.
Read
ing
of h
ome
read
ers w
ith fo
lder
8.5
7 Tea
cher
talk
s to
rese
arch
ers.
Teac
her w
orki
ng w
ith in
divi
dual
child
ren
- hea
ring
them
read
.
Fold
er tr
acki
ng re
adin
g, w
hen
child
is re
ady t
o m
ove
up a
leve
l, not
e is
sent
hom
e to
par
ents
exp
lain
ing
purp
ose
and
aim
s of t
he n
ext
read
ing
stag
e, an
d ho
w th
e pa
rent
s can
wor
k with
the
child
. It’s
bille
d as
an e
xciti
ng th
ing.
9.06
wTc
hr ch
ecks
who
has
n’t r
ead
yet (
none
), th
en p
uts o
n m
usic
- goo
d m
orni
ng so
ng -
this
cues
child
ren
to p
ack a
way
and
com
e to
mat
(n
o ve
rbal
inst
ruct
ion
to d
o so
)
Mor
ning
talk
9.08
wNo
te - T
hurs
day s
ched
ule
on w
hite
boa
rd.
Vick
i stil
l pul
ling
som
e ch
ildre
n ou
t one
at a
time
to re
ad
Teac
her t
alks
abou
t say
ing
good
mor
ning
to o
ther
s whe
n th
ey !
rst a
rrive
. (Sh
e no
ted
late
r tha
t her
bac
kgro
und
is in
HR,
and
she
feel
s it
is im
porta
nt to
enc
oura
ge th
e ch
n to
dev
elop
goo
d pe
ople
skill
s)
Days
of t
he w
eek w
ork -
chn
enco
urag
ed to
use
a w
hole
sent
ence
.
9.16
wTe
ache
r rea
ds th
roug
h sc
hedu
le o
n w
hite
boa
rd. Q
uest
ion
of th
e da
y - ‘R
esea
rch’
- whe
re -
in a
book
, on
the
net -
Goo
gle.
Talk
s abo
ut th
eir r
esea
rch
topi
c - Th
e Hu
man
Bod
y.
Read
ing
rota
tions
9.21
s6
Grou
ps -
Snak
es, K
oala
s, El
epha
nts,
Dino
saur
s, An
ts, T
iger
s - Th
ese
are
abili
ty
grou
ps.
Teac
her i
ntro
duce
s Rea
ding
Rot
atio
ns -
Each
gro
up w
orks
with
an ad
ult.
Chn
mov
e to
gro
ups.
9.27
sTe
ache
r ini
tially
wor
king
with
gro
up (A
nts)
who
can’
t be
! lm
ed. (
Mar
y too
k not
es o
n ot
her g
roup
s). S
hare
d re
adin
g - 7
boy
s, 0
girls
.
Asks
: Wha
t’s th
e bo
ok ab
out?
Look
ing
at co
ver-w
hat c
an w
e se
e? R
eadi
ng ti
tle-h
ow m
any w
ords
? 9.3
4 Op
ens B
ook -
Chi
ldre
n ! n
d w
here
stor
y sta
rts. T
each
er re
adin
g - i
nvite
s chn
to jo
in in
- so
unds
out
som
e w
ords
- m
odel
ling
- mat
chin
g m
eani
ng o
f wor
ds w
ith
pict
ure.
Wha
t mak
es se
nse?
Chi
ldre
n re
ad w
ith te
ache
r - te
ache
r rea
ds se
nten
ce, c
hn re
ad af
ter. T
each
er p
oint
s out
quo
tatio
n m
arks
, bu
t doe
sn’t
nam
e th
em. V
ery p
ositi
ve to
war
ds ch
n fo
r tal
king
and
enco
urag
ing
of th
eir r
espo
nses
. Tch
r ask
s que
stio
ns - W
hy is
this
happ
enin
g? Te
ache
r also
obs
ervi
ng g
roup
at b
ack,
who
are
wor
king
with
hea
dpho
nes a
nd d
raw
ing.
Incid
enta
l tea
chin
g of
initi
al
soun
ds. T
each
er te
asin
g ch
n ab
out t
he la
st p
age
- We
don’
t nee
d to
read
that
.Chn
usin
g ta
mbo
urin
es to
tap
for e
ach
wor
d in
sent
ence
“I’
ll cat
ch
the
dog”
.
T A B L E A 2 . 1
Running sheet for classroom observations
A P P E N D I X 2
106
A P P E N D I X 3
Introduction to CLOS-R and the CLOS-R manual
The Classroom Literacy Observation Schedule – Revised (CLOS-R) was based on the Classroom Literacy Observation Schedule (CLOS) from the In Teachers’ Hands project (Louden & Rohl, 2003). CLOS was developed from an extensive literature review of e! ective teaching, e! ective teaching of literacy and early years literacy teaching. CLOS was reviewed for this study and as a result, overlapping teaching practices were consolidated, some practices were expanded, and some practices were added, changing it from 33 teaching practices in CLOS to 27 in CLOS-R. Items on CLOS & CLOS-R refl ect literacy teaching practices, not literacy teaching activities.
A detailed manual was developed for CLOS-R to facilitate greater understanding of the 27 teaching practices. This manual outlines teaching practices that develop or extend literacy. The manual provides key indicators for each teaching practice, and gives examples of what that teaching practice could look like in the classroom. Some of these indicators refer to teacher behaviour, and some to the behaviour of the children. The manual was initially based on a draft manual from the In Teachers’ Hands project, and was extensively revised and refi ned during the initial pilot coding phase of Teaching for Growth. Minor changes were made during the coding process in order to clarify teaching practice defi nitions, as a result of observations of teachers and children, and discussions held amongst the research team during coding.
The manual was a valuable tool during the coding and pair-wise process, as it allowed members of the research team to develop a common understanding of teaching practices in both Year 1 and Pre-primary classrooms. During coding and pair-wise analysis, the manual was constantly referred to in order to ensure a clear understanding of each teaching practice, and therefore to enable consistency in coding, both among members of the research team and across teachers.
Inter-rater reliability
Each episode was coded by two members of the research team working together. In order to establish reliability among the four researchers, 28 episodes were coded twice, each time by a di! erent pair of researchers. The number of teaching practices observed in each coding was recorded, and di! erences were noted. The average percentage of agreement between research pairs was 94%.

107
C L A S S R O O M L I T E R A C Y O B S E R V A T I O N S U R V E Y - R E V I S E D ( C L O S - R )
Respect
1 RapportThe teacher creates a warm, positive and inviting classroom where relationships with children encourage literacy learning.
2 Credibility Children’s respect for the teacher enables her to maintain order and lesson # ow.
3 CitizenshipThe teacher promotes equality, tolerance, inclusively and awareness of the needs to others.
Knowledge
4 PurposeChildren’s responses indicate tacit or explicit understanding of the purpose of the literacy task.
5 SubstanceThe teacher provides a lesson/task that leads to substantial literacy engagement, not busy work.
6 Explanation word The teacher clearly explains speci! c word, letter or sound strategies or concepts.
7 Explanation sentenceThe teacher clearly explains speci! c grammatical strategies or concepts.
8 Explanation text The teacher clearly explains Textual strategies or concepts.
9 MetalanguageThe teacher provides children with language for talking about and exemplifying literacy concepts.
10 Oral languageThe teacher focuses on the development of children’s oral language.
11 Oral/written language The teacher makes logical connections between oral and written language.
Orchestration
12 AwarenessThe teacher has a high level of awareness of literacy activities and participation by children.
13 EnvironmentThe teacher uses the literate physical environment as a resource.
14 StructureThe teacher manages a predictable environment in which children understand consistent literacy routines.
15 IndependenceChildren take some responsibility for their ownliteracy learning.
16 PaceThe teacher provides strong forward momentum in literacy lessons.
17 Transition The teacher spends minimal time changing activities or uses this time productively.
18 AttentionThe teacher ensures that children are focused on the literacy task.
19 StimulationThe teacher motivates interest in literacy through the creation of a pleasurable, enthusiastic and energetic classroom.
Support
20 AssessmentThe teacher uses ! ne-grained knowledge of children’s literacy performance in planning and teaching.
21 Sca" oldingThe teacher extends literacy learning through reinforcement, modi! cation or modelling.
22 FeedbackThe teacher intervenes in timely, focused, tactful and explicit ways that support children’s literacy learning.
23 Responsiveness The teacher is # exible in sharing and building on children’s literacy contributions.
24 PersistenceThe teacher provides many opportunities to practise and master new literacy learning.
Di" erentiation
25 Challenge The teacher extends and promotes higher levels of thinking in literacy learning.
26 Inclusion The teacher di" erentiates literacy instruction to recognize individual needs.
27 ConnectionThe teacher makes connections between class or community literacy-related knowledge for individuals or groups.

108
T H E C L O S - R M A N U A L
D I M E N S I O N 1 : R E S P E C T
1. Rapport
The teacher creates a warm, positive and inviting classroom where relationships with children encourage literacy learning
• Mutual respect and trust between the children and the teacher is clearly evident throughout the teaching and learning e.g., in body language, in dialogue.
• The teacher demonstrates enjoyment of literacy, and of the children, and encourages and accepts all students’ contributions during activities.
• Teacher interventions are tactful and supportive, and aim for improvement in a particular literacy skill or conceptual understanding.
• The teacher encourages children to take risks with their learning, and children appear confi dent and supported to do so.
• The teacher articulates her expectation of the children’s abilities and capabilities.
• The teacher frequently praises and encourages children in their acquisition of specifi c literacy concepts and skills.
• Children participate readily, and there is energy, excitement and enjoyment around the literacy learning tasks.
2. Credibility
Children’s respect for the teacher enables her to maintain order and lesson " ow
• The teacher establishes and reinforces fi rm rules for classroom behaviour.
• The teacher provides positive reinforcement of appropriate learning behaviours.
• Disruptions to the literacy lesson are minimal - the teacher either anticipates and prevents disturbance from occurring, or quickly responds to and resolves any potential disrupting behaviour.
• Children respond quickly to teacher’s directions.
3. Citizenship
The teacher promotes equality, tolerance, inclusively and awareness of the needs of others
• The teacher places strong and explicit emphasis on fostering a range of values in the classroom.
• The teacher constantly reinforces consideration of others’ learning needs and styles in acquiring understanding of newly taught literacy concepts and skills.
• The teacher often names appropriate behaviour for particular classroom literacy related activities, e.g., listening for specifi c sounds, looking at the book.
• Children acknowledge, encourage and support successful literacy learning by others.
D I M E N S I O N 2 : K N O W L E D G E
4. Purpose
Children’s responses indicate tacit or explicit understanding of the purpose of the literacy task
• The teacher gives very explicit, clear instructions that leave no room for doubt about what is expected as engagement in and outcome/s of the task, and checks children’s understanding before allowing them to begin a literacy task.
• The teacher uses a variety of teaching practices and strategies to describe the literacy task (e.g. questioning…) and consistently reinforces the purpose of a literacy task throughout the activity.
• The teacher provides students with a metacognitive explanation and reason for doing a particular task (e.g., “We are reading this book to understand why…”).
• The teacher constantly checks that childrenhave understood each step, and corrects or o! ers additional explanations to ensure children’s understanding before proceeding.
• The teacher structures and delivers the content of the literacy lessons in a timely, logical and e" cient way.
• Children demonstrate their understanding of the purpose of the literacy task by being able to articulate what the teacher wants them to do.
• Children’s oral or written responses show an understanding of the requirements of the literacy task.
5. Substance
The teacher provides a lesson/task that leads to substantial literacy engagement, not busy-work
• Literacy discussion and tasks/activities provided by the teacher are of a high quality, and go beyond simple routines to require higher levels of conceptual thinking.
• Activities are highly productive and provide for signifi cant learning or consolidation of literacy concepts, appropriate to the level of the children.
• The teacher links or integrates literacy concepts into other learning areas.
6. Explanation word
The teacher clearly explains speci! c word, letter or sound strategies or concepts
• The teacher explains specifi c word, letter or sound strategies and concepts at an appropriate level for the children.
• The teacher integrates and teaches concepts of

109
phonological/phonemic awareness in a variety of contexts.
• The teacher clearly explains the di! erence between letter sounds and letter names.
• The teacher consistently models and/or uses the terms ‘sound’ and ‘letter’ appropriately
• The teacher clearly explains or reinforces word reading and writing strategies e.g., sounding out, re-reading, making sense within the text, using the context.
• The teacher provides opportunities for children to practise and extend their sight word bank.
• The teacher models and provides opportunities for children to practise handwriting and letter formation skills
• Children demonstrate understanding of word level concepts they have been taught.
• Decoding and graphophonic concepts taught are appropriate to the level of the children, and include: alphabetical order, rhyme, onset, sounds (beginning, middle, end), vowels, word, letter, sound, blend, ‘magic/fairy/bossy’ E, spelling, syllables.
7. Explanation sentence
The teacher clearly explains speci! c grammatical strategies or concepts
• The teacher integrates and teaches sentence level concepts in a variety of contexts and ways e.g., consistent and repeated modelling.
• Children demonstrate understanding of sentence level concepts they have been taught.
• Grammatical concepts are taught at an appropriate level for the children.
• Syntax concepts taught include: capital letters, full stops, sentence, talking/speech marks, inverted commas, apostrophes, noun, verb, adjective/describing words, contractions, compound words, word order, question marks, exclamation marks.
8. Explanation text
The teacher clearly explains speci! c textual strategies or concepts
• The teacher uses a variety of texts such as pictures, day charts/calendars, video, postcards, newspapers, narrative, fi ction and nonfi ction.
• The teacher engages children in pre-reading discussion of the text to predict likely plot, characterization and setting.
• The teacher engages Pre-primary children in emergent reading and writing activities, e.g., describing pictures, locating letters, fi nding words in a written text
• The teacher guides children in discussion or activities to develop their comprehension of a text.
• The teacher guides children in a discussion of theme after reading a fi ction text.
• The teacher guides children in a discussion about factual
information gleaned from a nonfi ction text.
• The teacher guides children in the presentation of their writing (layout, spacing, selection of information, labelling etc).
• Children identify reading strategies they have been taught (e.g., read from left to right……….).
• Children demonstrate understanding of text-level concepts they have been taught.
• Children make use of text-level concepts in their own writing.
• Textual strategies and concepts are taught at an appropriate level for the children.
• Text level concepts taught include: predict, picture, title, author, illustrator, cover, caption, sign, ISBN, copyright, web address, label, paragraph, planning, drafting, revising/editing, story, text type (narrative/story, recount, report, diary, letters, poem, recipe, nursery rhymes), headings, structure (beginning, middle, end), character, setting, alliteration, ingredients, list, fi ction, nonfi ction, information, layout, address, salutation, meaning (including word defi nitions), dictionary, alphabetical order.
• The teacher discusses the meaning of vocabulary within a text.
9. MetalanguageThe teacher provides children with language for talking about and exemplifying literacy concepts
• The teacher directs children’s attention to features of words and texts through the use of specifi c metalinguistic vocabulary.
• The teacher uses metalinguistic terms accurately and consistently and provides clear metacognitive explanations within appropriate contexts and at an appropriate level.
• Children demonstrate understanding of a concept and its application.
• Children identify and use correctly metalinguistic terms and concepts that have been taught.
• Children explain metalinguistic concepts in their own words.
• Metalinguistic terms include: letter names, letter sounds, title, author, illustrator, visualisation, ‘sound it out’, research, bullets, labels, capital letters, full stops, sentence, talking/speech marks, inverted commas, apostrophes, noun, verb, adjective/describing words, contractions, compound words, word order, question marks, exclamation marks.
10. Oral language
The teacher focuses on the development of children’s oral language
• The teacher provides opportunities for receptive and expressive oral language that may focus on development of phonological awareness, vocabulary, sentence structure,

110
prosody, pragmatics.
• The teacher provides opportunities to develop children’s comprehension and vocabulary.
• The teacher engages children in discussions which extend oral language concepts of speaking and listening - their ability to express themselves, and their level of understanding.
• The teacher interacts with and questions the children in ways which develop oral language.
• The teacher engages children in songs and rhymes that have a strong literacy base e.g., alliteration, rhyming words.
Note: - Oral language may be implicit or explicit, and must have
the potential to contribute to the children’s language and/or
literacy development.
11. Oral/written language
The teacher makes logical connections between oral and written language
• The teacher relates phonological awareness to alphabet letters.
• The teacher links oral discussion of a text with the reading of it (can be before, during or after the reading).
• Oral discussion points are recorded in an appropriate written form.
• The teacher encourages dramatisation or visualisation of read text.
• The teacher makes connections between environmental print in the classroom in conversation with the children.
• The teacher makes use of songs to link oral and written language.
• Children recognise di! erences between written letters, words and numbers.
• The teacher models writing as she articulates the words.
• The teacher reads aloud from a Big Book, pointing to the words.
D I M E N S I O N 3 : O R C H E S T R A T I O N
12 . Awareness
The teacher has a high level of awareness of literacy activities and participation by children
• The teacher monitors and evaluates children’s participation and progress during activities, and responds accordingly to ensure that as many children as possible are engaged in meaningful learning activity for most of the class time e.g., progressing an activity in response to the children’s understanding, reviewing a concept in response to children’s needs.
• The teacher monitors, responds to, corrects and supervises individuals and groups constantly, and remains aware of each child’s individual progress in the activity.
• The teacher maintains fi rm control over keeping all
children on task, whether working with an individual, a group or the whole class.
• Children are rarely observed o! -task.
13. EnvironmentThe teacher uses the literate physical environment as a resource
• The teacher has a wide variety of print and other literacy related resources in and on display around the classroom and uses them regularly.
• The teacher uses charts and other props as part of a routine activity, which involves literacy learning, e.g., weather, days of the week, months of the year, vocabulary.
• The teacher frequently encourages children to refer to the literacy environment to solve literacy problems (e.g., “Go and fi nd that word on our daily word chart. ”Directs children’s attention to focus words on the THRASS chart).
• The teacher modifi es the environment from time to time to suit di! erent needs or topics e.g., providing an area for theme exploration with books, posters, models.
• Children are observed using the literacy environment independently.
14. StructureThe teacher manages a predictable environment in which children understand consistent literacy routines
• The teacher uses routine attention-directing strategies to which the children respond quickly (e.g., clapping hands, use of props, verbal commands, physical commands…).
• The teacher uses structured ways for rewarding appropriate learning behaviour (e.g., ticks on the board, behaviour charts, verbal cues, physical cues, eye contact…).
• The teacher is consistent in the ways in which she reminds students of established routines for literacy practices (e.g., decoding words, spelling, handwriting, drafting, mechanics of writing…).
• The sequence of activities fl ows logically from one to another and may be linked to previous learning or to subsequent activities.
• The teacher structures group or individual literacy activities so that children understand the task, understand what constitutes task completion, and understand the sequence of tasks i.e., what to do next.
• Children understand what is expected of them in literacy routines and understand the structure and time frame of given tasks.
• Children’s responses show their familiarity with classroom structures by quickly commencing set routines that the teacher has established (e.g., regular routines for participating in activities such as shared book, modelled writing, moving into small group tasks quickly and getting started immediately).

111
• Children know where to get regular equipment (e.g., pencils, paper) as well as additional resources and learning aids from around the classroom (e.g., dictionary cards or wall charts) to assist their literacy learning.
15. IndependenceChildren take some responsibility for their own literacy learning
• The teacher encourages children to regulate their progress in literacy learning by drawing the children’s attention to the learning processes in which they are engaging as well as the literacy content.
• The teacher encourages children to proof-read and edit their own writing.
• The teacher actively encourages children to refl ect on and evaluate the quality of their own work and to articulate key learning points.
• Children can work without teacher supervision in small groups, completing the task as instructed.
• Children share their knowledge independently of the teacher in a literacy task.
• Children choose to engage in purposeful literacy activities independent of the teacher-directed program.
• The teacher provides children with strategies or opportunities to work independently.
16. PaceThe teacher provides strong forward momentum in literacy lessons
• The teacher’s clear and e" cient instructions ensure that children are focused on the literacy task.
• The teacher’s carefully structured pace is responsive to the needs of all children.
• The teacher sequences lessons at an appropriate pace, utilizing time e" ciently.
• The teacher is constantly encouraging, motivating, correcting, directing, monitoring and inspiring the children to master another skill, fi nish o! something, or begin something new.
• The teacher’s organization of the class equipment facilitates e" cient use of time for both children and teacher.
• Children respond to questions and activities, and the teacher keeps encouraging them to contribute.
17. Transition
The teacher spends minimal time changing activities or uses this time productively
• Transitions demonstrate e" cient use of time, where the teacher ensures that minimum time is wasted on non-learning activities.
• Transition times are used to practise and consolidate literacy learning.
• The teacher use a range of transition strategies e.g., specifi c cues, props to signal the end of activities, preparing cross-
over tasks, staggering the movement of di! erent groups of students and managing to oversee the e! ective and e" cient movement of all groups simultaneously.
• The teacher gives clear and precise instructions to organise the movement of children into the next activity, and encourages children to see time as a valuable commodity in their learning.
• The teacher organises e" cient collection and distribution of resources so that minimal time is wasted between tasks.
• The teacher spends minimal time gaining or regaining order after movement from one activity to the next.
• Individual or small group transitions occur where children are working in groups or independently, and move e" ciently from one literacy task to another upon completion of the task.
• Children clearly understand and respond totransition strategies.
18. Attention
The teacher ensures that children are focused on the literacy task
• The teacher applies various strategies as required to gain and maintain the children’s attention.
• The teacher keeps all children focused on the learning task using a variety of classroom management strategies e.g., by tactfully naming; asking questions.
• The teacher requires a posture that maximizes attention e.g., eyes this way, sitting up straight, legs crossed, hands in laps.
• Teacher’s explanations and instructions are timed to suit the concentration span of the children so children remain attentive and engaged throughout the explanation.
• The teacher frequently draws children’s attention to key concepts in a task, o! ering additional information.
• The teacher seeks contributions from all individuals.• The teacher creates an atmosphere of a ‘conspiracy of
learning’ e.g., I’m going to trick you’, ‘I bet you can’t…’.• Almost all children are attending to and engaged with the
literacy task.
19. Stimulation
The teacher motivates interest in literacy through the creation of a pleasurable, enthusiastic and energetic classroom
• The teacher uses a variety of learning strategies, e.g., movement, music, manipulation, listening, observation, use of technology.
• The teacher makes positive, meaningful comments in order to encourage participation in the literacy task.
• The teacher encourages children to share success in literacy learning with others.
• The teacher encourages individuals or groups to strive for high standards.
• The teacher uses questions strategically to create and sustain interest in the topic/task.
112
• The teacher provides tasks and activities which are interesting and which contribute to literacy learning.
• The teacher models enthusiasm for and enjoyment of literacy learning which results in a classroom atmosphere of mutual excitement for literacy learning.
D I M E N S I O N 4 : S U P P O R T
20. Assessment
The teacher uses ! ne-grained knowledge of children’s literacy performance in planning and teaching
• The teacher’s responses to children indicate awareness of individual progress.
• The teacher’s careful observation of children leads to specifi c literacy teaching.
• The teacher makes judgements about what to teach next based on her assessment of the children’s needs.
• The teacher provides additional support or challenge at the point of need e.g., modelling, metacognitive explanations, requesting more detail or greater quantity.
• The teacher’s clear and specifi c instructions reduce the need for individualised teaching, and instructions or teaching points are reiterated to the whole class if many children are observed to have the same need.
21. Sca# olding
The teacher extends literacy learning through reinforcement, modi! cation or modelling
• The teacher provides a very clear initial introduction to the task (instructions, modelling, checking for understanding) which reduces the need for individual support.
• The teacher a" rms correct responses and corrects or makes a brief teaching point of incorrect responses, which lead to continued engagement in the literacy task.
• The teacher adjusts and adapts instructions and responses according to the needs of the children.
• The teacher’s interventions lead to children modifying their understanding and performance of literacy tasks.
• The teacher models or re-models literacy concepts and skills which include metacognitive explanations where appropriate.
• The teacher’s use of voice emphasises teaching points or important concepts.
• The teacher breaks a complex literacy task or concept into smaller parts or steps and clearly explains each critical part, providing su" cient time for children to comprehend and practise each step before moving on to the next part.
22. Feedback
The teacher intervenes in timely, focused, tactful and explicit ways that support children’s literacy learning
• The teacher’s comments to children lead to improvement in the children’s understanding and knowledge of literacy.
• The teacher is constantly encouraging, motivating,
correcting, directing, monitoring and inspiring the children to master another skill, fi nish o! something, or begin something new.
• The teacher quickly adapts the cues, amount of participation or the use of reinforcement to the child’s particular needs.
• The teacher reacts to students’ responses through acceptance of correct responses, follow up of partially correct responses and use of student responses in making teaching points.
• The teacher uses positive reinforcement to show acceptance of correct responses and explanations that focus on specifi c aspects of literacy learning, e.g., Fantastic I like the way you sounded out that word.
Note - Feedback is secondary to clear instruction or explanation about the task or concept.
23. Responsiveness
The teacher is " exible in sharing and building on children’s literacy contributions
• The teacher shares and builds on children’s literacy contributions, making the child’s contribution a teaching point, where appropriate for children’s immediate needs.
• The teacher spontaneously makes a specifi c learning point that she fi nds for one child (e.g., the spelling of climbed) into a whole class learning opportunity.
• The teacher demonstrates sophisticated judgment in knowing when to let a class discussion take a tangent and when to keep it fl owing along the planned line.
• The teacher responds to the opportunity (planned or unplanned) to model and reinforce concepts learned previously by making the link from past learning to the current lesson.
Note - Responsiveness is also characterised in some instances by its absence. It is sometimes not appropriate to spontaneously follow a potential diversion to a lesson plan no matter how tempting .
24. Persistence
The teacher provides many opportunities to practise and master new literacy learning
• The teacher provides signifi cant amounts of time and opportunity for practising new literacy skills and concepts and then in applying the new skills in di! erent contexts.
• The teacher ensures that children complete literacy tasks to a particular standard.
• The teacher displays drive for improved literacy outcomes and passion for improving children’s understanding and skills.
• The teacher reinforces a particular literacy concept multiple times, and in di! erent ways.
Note - Persistence will often occur across episodes

113
D I M E N S I O N 5 : D I F F E R E N T I A T I O N
25. Challenge
The teacher extends and promotes higher levels of thinking in literacy learning
• The teacher plans demanding tasks based on knowledge of children’s levels of attainment.
• The teacher encourages higher levels of thinking through the use of higher order questioning, usually open-ended, that encourage the exploration of ideas or multiple solutions, rather than simply providing a ‘correct’ answer.
• The teacher encourages children to explore multiple interpretations of text and respond at higher levels of abstract and critical thinking.
• The teacher provides cognitively challenging interactions.
• The teacher provides higher level explanations that extend the task for children who have understood the concept ahead of other children.
• The teacher uses and encourages children to use a wide, or high level specifi c vocabulary, e.g., ‘exoskeleton’ for shell of an insect, use of terminology such as ‘alliteration’ .
• The teacher provides su" cient challenge for both higher and lower achieving children.
• The teacher sca! olds children’s learning through careful sequencing and analysis of tasks to help them achieve deeper understanding.
• The teacher provides learning opportunities for children to synthesise, generalise or transfer concepts.
• The teacher has high expectations of children’s achievement and children aspire to achieve the learning goals set by the teacher.
• The teacher builds on unpredictable responses in ways which further challenge children’s thinking.
• The teacher encourages children to self-regulate their progress in their literacy learning by drawing the children’s attention to the learning processes in which they are engaging, as well as the literacy content.
• The teacher provides children with opportunities to take responsibility for their learning, reinforcing children’s belief in themselves as learners and enhancing their sense of confi dence.
• The teacher provides opportunities for children to refl ect on and evaluate the quality of their own work.
• The teacher’s intervention encourages children to take risks with their learning so that she can ‘stretch’ individual children’s capacity to succeed in challenging literacy tasks.
26. Inclusion
The teacher di# erentiates literacy instruction to recognise individual needs
• The teacher structures literacy activities so that opportunity is provided to work e! ectively 1-to-1 with
individual students or in small groups, where specifi c support on an aspect of literacy learning is required.
• The teacher monitors the progress of individuals during literacy tasks, and provides specifi c and targeted support or feedback at point of need or error for each child.
• The teacher adapts general feedback to suit the specifi c learning needs of each child as she checks children’s understanding of literacy concepts.
• The teacher adjusts groupings and explicitness of instruction during literacy tasks according to individual needs.
• The teacher presents opportunities for children to pursue tasks at their own level and provides individual feedback during whole class literacy activities.
• The teacher includes all children in subtle ways in literacy tasks while still catering for individual needs.
• The teacher provides additional learning supports or modifi ed learning materials that have been adapted for children with specifi c learning needs, which enable them to participate e! ectively in the whole class literacy task.
• The teacher provides many open-ended tasks to ensure that all children can participate at their own level.
• Children participate in peer-support activities whereby a more able child supports a less able child.
27. ConnectionThe teacher makes connections between class or community literacy-related knowledge for individuals or groups
• The teacher encourages children to use prior knowledge or to refer to previous learning to assist in a new situation (e.g., remember ‘ea’ in ‘leaf’ to read ‘eating’; it’s the ‘ou’ sound as in ‘house’).
• The teacher explicitly connects current and previously learned literacy concepts in new contexts and activities
• The teacher draws on previous learning opportunities, e.g., excursions, to contextualise and connect literacy learning activities.
• The teacher uses knowledge of children’s experiences to contextualise, to sca! old and to make links to literacy learning within and across tasks.
• The teacher includes additional literacy tasks, such as shared writing at home with the family, which connects the classroom learning to home life.
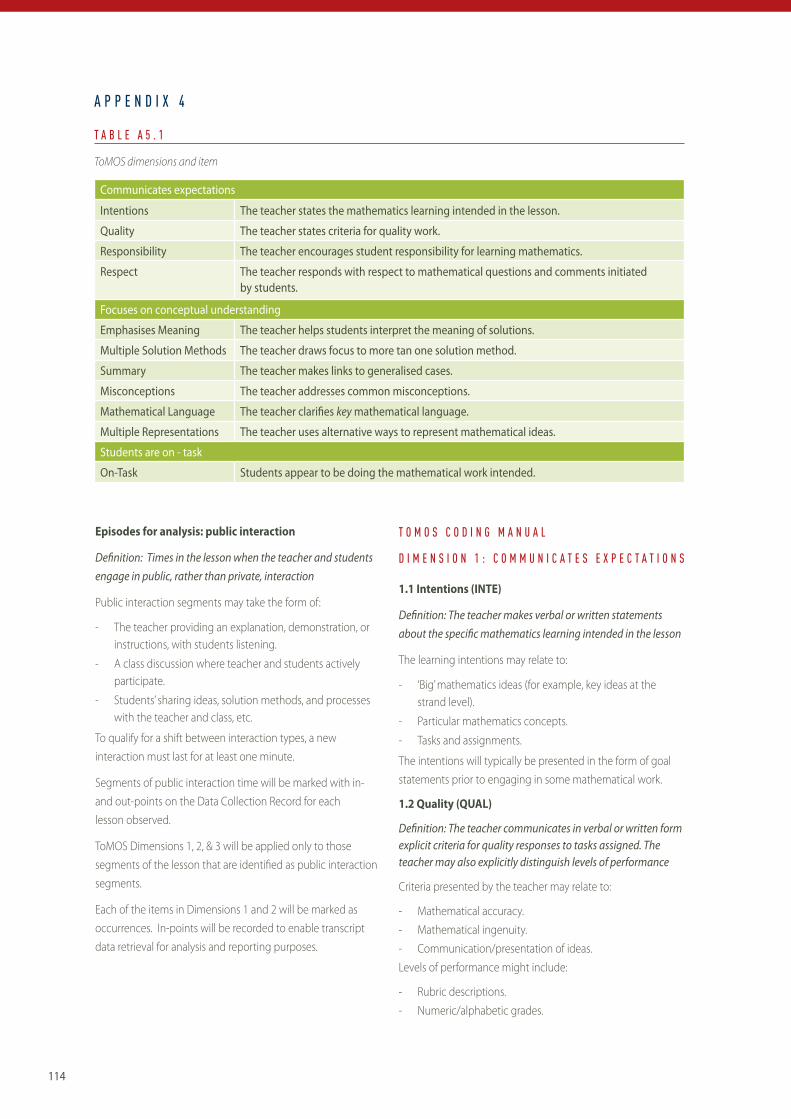
114
A P P E N D I X 4
T A B L E A 5 . 1
ToMOS dimensions and item
Communicates expectations
Intentions The teacher states the mathematics learning intended in the lesson.
Quality The teacher states criteria for quality work.
Responsibility The teacher encourages student responsibility for learning mathematics.
Respect The teacher responds with respect to mathematical questions and comments initiated by students.
Focuses on conceptual understanding
Emphasises Meaning The teacher helps students interpret the meaning of solutions.
Multiple Solution Methods The teacher draws focus to more tan one solution method.
Summary The teacher makes links to generalised cases.
Misconceptions The teacher addresses common misconceptions.
Mathematical Language The teacher clari! es key mathematical language.
Multiple Representations The teacher uses alternative ways to represent mathematical ideas.
Students are on - task
On-Task Students appear to be doing the mathematical work intended.
Episodes for analysis: public interaction
De! nition: Times in the lesson when the teacher and students engage in public, rather than private, interaction
Public interaction segments may take the form of:
- The teacher providing an explanation, demonstration, or instructions, with students listening.
- A class discussion where teacher and students actively participate.
- Students’ sharing ideas, solution methods, and processes with the teacher and class, etc.
To qualify for a shift between interaction types, a new interaction must last for at least one minute.
Segments of public interaction time will be marked with in- and out-points on the Data Collection Record for each lesson observed.
ToMOS Dimensions 1, 2, & 3 will be applied only to those segments of the lesson that are identifi ed as public interaction segments.
Each of the items in Dimensions 1 and 2 will be marked as occurrences. In-points will be recorded to enable transcript data retrieval for analysis and reporting purposes.
T O M O S C O D I N G M A N U A L
D I M E N S I O N 1 : C O M M U N I C A T E S E X P E C T A T I O N S
1.1 Intentions (INTE)
De! nition: The teacher makes verbal or written statements about the speci! c mathematics learning intended in the lesson
The learning intentions may relate to:
- ‘Big’ mathematics ideas (for example, key ideas at the strand level).
- Particular mathematics concepts.
- Tasks and assignments.
The intentions will typically be presented in the form of goal statements prior to engaging in some mathematical work.
1.2 Quality (QUAL)
De! nition: The teacher communicates in verbal or written form explicit criteria for quality responses to tasks assigned. The teacher may also explicitly distinguish levels of performance
Criteria presented by the teacher may relate to:
- Mathematical accuracy.- Mathematical ingenuity.- Communication/presentation of ideas.Levels of performance might include:
- Rubric descriptions.- Numeric/alphabetic grades.

115
1.3 Responsibility (RESP)
De! nition: The teacher makes statements that encourage student responsibility for learning mathematics
The kinds of student responsibilities that teachers might encourage include:
- Asking questions to seek clarifi cation.- Asking questions to inquire about, or suggest, new ideas
or possibilities.- Focusing or concentrating on their mathematical work.- Allocating appropriate time for independent studies.
associated with their mathematical learning.- Checking and justifying solutions and solution methods.- Self and peer assessment.
1.4 Respect (REPT)
De! nition: The teacher responds with respect to mathematical questions and comments initiated by students
The kinds of teacher responses that indicate respect include:
- Addressing with the class a response to a student’s mathematical question or idea.
- Redirecting a student’s mathematical question or idea to the class, e.g. “What do the rest of you think about that?”.
D I M E N S I O N 2 : F O C U S E S O N C O N C E P T U A L U N D E R S T A N D I N G
Items 2.1 – 2.3 refer to worked examples. A worked example is a mathematical task worked on during the current lesson.
2.1 Emphasises meaning (EMEA)
De! nition: The teacher helps students to interpret the meaning of solutions to worked examples
This means that either:
- The solution is explicitly linked to the original question.- The solution is interpreted contextually.
2.2 Multiple solution methods (MSOL)
De! nition: The teacher draws focus to more than one solution method for a worked example
The multiple solution methods will either:
- Be presented by the teacher.
- Be presented by students with acknowledgment by the teacher .
2.3 Summary (SUMM)De! nition: The teacher provides a summary statement that clearly links the worked example(s) to a more generalised case
The summary statement will include information about either:
- A strategy for solving similar examples.
- The key features of these general mathematical ideas.
2.4 Misconceptions (MISC)
De! nition: The teacher intentionally addresses common student misconceptions by requiring students to analyse examples, solutions, or ideas
The kinds of questions that might indicate the teacher’s intention to address a misconception include:
- Why wouldn’t this work?
- Why isn’t this correct?
- Could this be correct? Why/why not?
2.5 Mathematical language (MLAN)
De! nition: The teacher clari! es key mathematical terms and symbols to promote student understanding of mathematical language
Teacher clarifi cation will take the form of either:
- The introduction of new key terms and symbols.
- The refi nement of existing key language through questioning, rephrasing, or additional explanation.
The teacher’s verbal or written description of the key mathematical term or symbol will be followed by either:
- A question to students that probes their understanding of the term or symbol.
- A question to students that requires an application of the term or symbol.
- An elaborated example of how the term is used in a particular context.
2.6 Multiple representations (MREP)
De! nition: The teacher uses alternative ways to represent mathematical ideas
For an episode to be coded Multiple Representations (MREP), the teacher would use two or more of the following at any point in the episode:
- Written symbols, formulae, or descriptive examples.
- Graphs and tables.
- Drawings or diagrams.
- Physical materials.Graphs, tables, drawings and diagrams may be part of a problem statement, used in a solution process, or used in a discussion of a mathematical idea or concept. Physical materials may be used to demonstrate a solution process or in a discussion of a mathematical idea or concept.
A table is an arrangement of numbers, signs, or words that exhibits a set of facts or relations in a defi nite, compact, and comprehensive form. Typically the rows and/or columns of a table are labelled and have borders.
To count as a drawing or diagram, the drawing must include information relevant to doing the mathematics. It does not count as a drawing if the symbols are spatially arranged to
116
highlight certain features, if arrows are pointing to certain symbols to highlight them, or if arrows or other nonstandard marks are used in place of standard symbols (e.g. an arrow is used instead of an equal sign).
Physical materials include:
- Measuring instruments (e.g. ruler, protractor, compass).- Special mathematical materials (e.g. tiles, tangrams, base-
ten blocks).- Geometric solids.- Cut-out plane fi gures (e.g. triangles and trapeziums cut
from paper).Papers, pencils, calculators and computers are not included here.
Notes -
- The use of measuring instruments for non-measurement purposes, such as underlining or drawing straight lines with a ruler, or drawing a circle of unspecifi ed measure with a compass, does not count. If it is unclear whether or not measuring instruments are being used to measure, assume they are not.
- Using graph paper to plot points on the coordinate plane does not count, but using graph paper to measure the surface area of an object, or to fi nd shapes with a common area of 12 square cm does. That is, using graph paper as a measuring tool counts as a use of physical materials.
D I M E N S I O N 3 : S T U D E N T S A R E O N - T A S K
3.1 On-task (ONTA)
De! nition: Students appear to be doing the mathematical work intended by the teacher
For an episode to be coded On-Task (ONTA), less than 25% of students would be observably not on-task at any point in the episode.
Additional notes are to be recorded on the Data Collection Record for each lesson observed.
Notes -
These notes may relate to:
- The mathematical content of the lesson
- Materials and resources used
- Images presented on a blackboard, whiteboard, or OHP
- Student groupings
- Any event that is unusual, surprising, striking, etc.
- Any information that may be helpful to understand particular circumstances of the lesson observed
- etc.
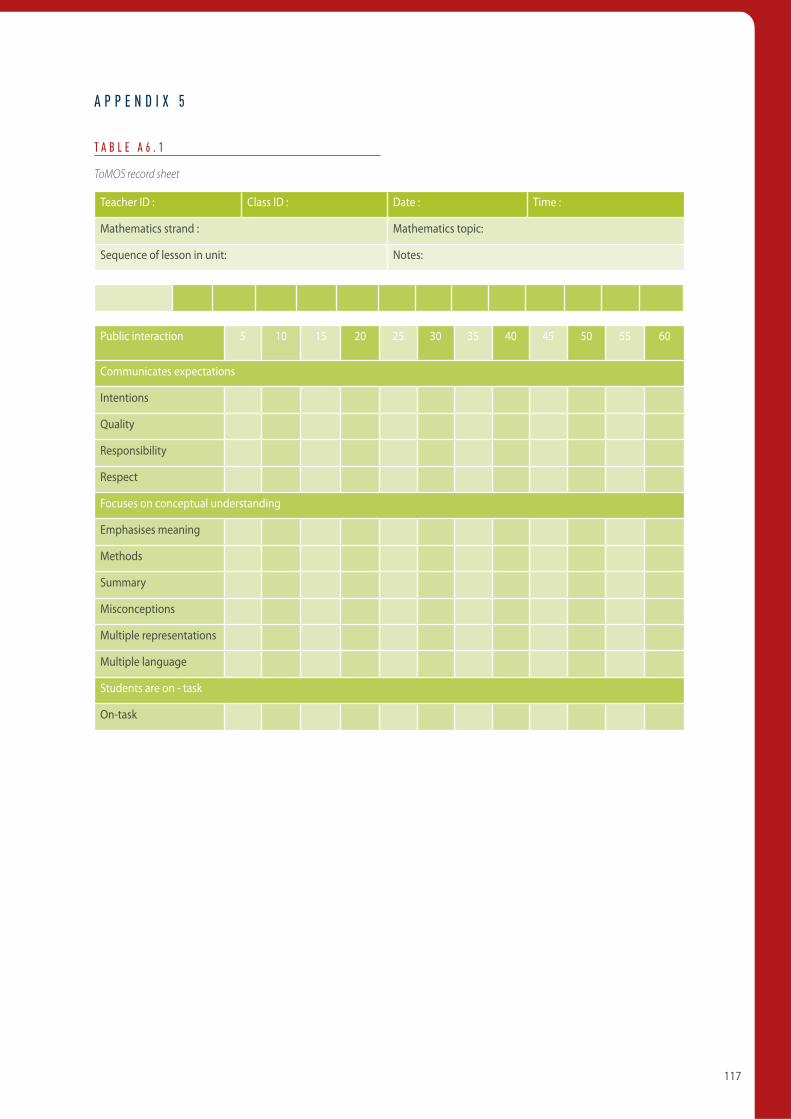
117
A P P E N D I X 5
T A B L E A 6 . 1
ToMOS record sheet
Teacher ID : Class ID : Date : Time :
Mathematics strand : Mathematics topic:
Sequence of lesson in unit: Notes:
Public interaction 5 10 15 20 25 30 35 40 45 50 55 60
Communicates expectations
Intentions
Quality
Responsibility
Respect
Focuses on conceptual understanding
Emphasises meaning
Methods
Summary
Misconceptions
Multiple representations
Multiple language
Students are on - task
On-task