td london conference final.ppt - enerplus - home · london energy conference ... but without...
TRANSCRIPT
The Game Plan
TD NewcrestLondon Energy Conference
January 2011

1
Advisory• This presentation contains certain forward-looking information and statements ("forward-looking information") within the meaning of applicable securities laws. The use of any of the
words "expect", "anticipate", "continue", "estimate", “guidance”, "objective", "ongoing", "may", "will", "project", "should", "believe", "plans", "intends", “budget”, "strategy" and similar expressions are intended to identify forward-looking information. In particular, but without limiting the foregoing, this presentation contains forward-looking information pertaining to the following: Enerplus' strategy; the performance of Enerplus' assets and operations; future growth prospects, acquisitions and dispositions; future dividends to securityholders; capital and development expenditures and the timing and allocation thereof; the volumes and estimated value of Enerplus’ oil and gas reserves and contingent resource volumes; the life of Enerplus’ reserves; the volume and product mix of Enerplus' oil and gas production; future results from operations; future development and drilling locations and plans; the installation of infrastructure; receipt of regulatory approvals; commodity prices and foreign exchange rates; the amount of future asset retirement obligations; returns on Enerplus' capital program; Enerplus' tax position; and future costs, expenses and royalty rates.
• The forward-looking information contained in this presentation reflect several material factors and expectations and assumptions of Enerplus including, without limitation: that Enerplus will continue to conduct its operations in a manner consistent with past operations; the general continuance of current or, where applicable, assumed industry conditions; the continuance of existing (and in certain circumstances, the implementation of proposed) tax, royalty and regulatory regimes; the accuracy of the estimates of Enerplus' reserve and resource volumes; certain commodity price and other cost assumptions; the continued availability of adequate debt and/or equity financing and cash flow to fund its capital and operating requirements as needed; and the extent of its liabilities. Enerplus believes the material factors, expectations and assumptions reflected in the forward-looking information are reasonable but no assurance can be given that these factors, expectations and assumptions will prove to be correct.
• The forward-looking information included in this presentation are not guarantees of future performance and should not be unduly relied upon. Such information involves known and unknown risks, uncertainties and other factors that may cause actual results or events to differ materially from those anticipated in such forward-looking information including, without limitation: changes in commodity prices; changes in the demand for or supply of Enerplus' products; unanticipated operating results or production declines; changes in tax or environmental laws, royalty rates or other regulatory matters; changes in the development plans of Enerplus or by third party operators of Enerplus' properties, increased debt levels or debt service requirements; inaccurate estimation of Enerplus' oil and gas reserve and resource volumes; limited, unfavourable or a lack of access to capital markets; increased costs; a lack of adequate insurance coverage; the impact of competitors; reliance on industry partners; and certain other risks detailed from time to time in Enerplus' public disclosure documents (including, without limitation, those risks identified in Enerplus' Annual Information Form and Form 40-F described above).
• All financial figures are in Canadian dollars unless otherwise stated.
• Enerplus’ financial statements are prepared in accordance with Canadian generally accepted accounting principles (“GAAP”). Canadian GAAP differs in some significant respects from U.S. GAAP and therefore this financial information may not be directly comparable to the financial information typically provided by U.S. companies. The principal differences as they may apply to Enerplus are summarized in Note 14 to Enerplus' audited consolidated financial statements for the year ended December 31, 2009. A complete copy of the audited financial statements and notes is available without charge from Enerplus.
• Our payout ratio is calculated as cash distributions/dividends divided by cash flow from operating activities. The term payout ratio does not have a standardized meaning as prescribed by GAAP and therefore may not be comparable with the calculation of a similar measure by other entities. This reflects the proportion of cash flow paid out to investors and not reinvested in the business.
• This presentation contains references to "Mcfe" (thousand cubic feet of gas equivalent), “MMcfe” (million cubic feet of gas equivalent), "Bcfe" (billion cubic feet of gas equivalent) and “Tcfe” (trillion cubic feet of gas equivalent). Enerplus has adopted the standard of one barrel of oil to six thousand cubic feet of gas (1 bbl: 6 Mcf) when converting oil to Mcfe, MMcfe, Bcfe or Tcfe. Mcfes, MMcfes, Bcfes and Tcfes may be misleading, particularly if used in isolation. A conversion ratio of 1 bbl: 6 Mcf is based on an energy equivalency conversion method primarily applicable at the burner tip and does not represent a value equivalency at the wellhead.

2
Advisory• Enerplus has adopted the standard of six thousand cubic feet of gas to one barrel of oil (6 Mcf: 1 bbl) when converting natural gas to BOEs, and one barrel of oil to six
thousand cubic feet of gas (1 bbl: 6 Mcf) when converting oil to Mcfes, MMcfes, Bcfes and Tcfes. BOEs, Mcfes, MMcfes, Bcfes and Tcfes may be misleading, particularly if used in isolation. The foregoing conversion ratios are based on an energy equivalency conversion method primarily applicable at the burner tip and do not represent a value equivalency at the wellhead. "MBOE" and "MMBOE" mean "thousand barrels of oil equivalent" and "million barrels of oil equivalent", respectively.
• Unless otherwise stated, all production volumes are stated on a gross basis, that is, our working interest production before the deduction of any royalty interest production.
• Unless otherwise specified, all reserves volumes in this presentation (and all information derived therefrom) are based on "company interest reserves" using forecast prices and costs. "Company interest reserves" consist of "gross reserves" (as defined in National Instrument 51-101 adopted by the Canadian securities regulators ("NI 51-101") plus Enerplus' royalty interests in reserves. “Company interest reserves" are not a measure defined in NI 51-101 and do not have a standardized meaning under NI 51-101. Accordingly, our company interest reserves may not be comparable to reserves presented or disclosed by other issuers. Our oil and gas reserves statement for the year ended December 31, 2009, which will include complete disclosure of our oil and gas reserves and other oil and gas information in accordance with NI 51-101, will be contained within our Annual Information Form for the year ended December 31, 2009 ("our AIF") which is available on our website at www.enerplus.com and on our SEDAR profile at www.sedar.com. Additionally, the Annual Information Form forms part of our Form 40-F that is filed with the U.S. Securities and Exchange Commission and is available on EDGAR at www.sec.gov. Readers are also urged to review the Management’s Discussion & Analysis and financial statements filed on SEDAR and EDGAR concurrently with this presentation for more complete disclosure on our operations.
• This presentation contains estimates of "contingent resources". "Contingent resources" are not, and should not be confused with, oil and gas reserves. "Contingent resources" are defined in the Canadian Oil and Gas Evaluation Handbook (the "COGE Handbook") as "those quantities of petroleum estimated, as of a given date, to be potentially recoverable from known accumulations using established technology or technology under development, but which are not currently considered to be commercially recoverable due to one or more contingencies. Contingencies may include factors such as economic, legal, environmental, political and regulatory matters or a lack of markets. It is also appropriate to classify as contingent resources the estimated discovered recoverable quantities associated with a project in the early evaluation stage." There is no certainty that Enerplus will produce any portion of the volumes currently classified as contingent resources or that Enerplus will produce any portion of the volumes currently classified as contingent resources. The contingent resource estimates contained herein are presented as the "best estimate" of the quantity that will actually be recovered, effective as of December 31, 2009. A "best estimate" of contingent resources means that it is equally likely that the actual remaining quantities recovered will be greater or less than the best estimate, and if probabilistic methods are used, there should be at least a 50% probability that the quantities actually recovered will equal or exceed the best estimate.
• For information regarding the primary contingencies which currently prevent the classification of Enerplus' disclosed contingent resources associated with its Marcellus shale gas and Fort Berthold assets as reserves and the positive and negative factors relevant to the contingent resource estimate, see Enerplus' material change report dated August 27, 2009, copies of which are available on SEDAR and EDGAR as described above.
• For additional information with respect to the presentation and disclosure of oil and gas reserves and resources, see "Presentation of Enerplus' Oil and Gas Reserves, Resources and Production" in the AIF.

3
Enerplus Overview
• High-yielding North American energy producer
• Annual income and growth target of 10% - 15%
• Diversified asset base of high quality, low decline oil and gas assets complimented by growth assets in resource plays with superior economics - Bakken crude oil and Marcellus shale gas
• Cash flow from operations and strong financial position support capital reinvestment and monthly dividend
• Strong internal technical and commercial expertise
Monthly dividend
plus growth potential

4
Repositioning Portfolio to add Unconventional Assets
• New growth assets acquired with superior economics and ability to add meaningful production and reserves
– Marcellus Shale Gas:
~200,000 net acres in PA, WV and Maryland
– Bakken Crude Oil:
+210,000 net acres in ND and SK
– Deep Basin:
65,000 net acres in Alberta & British Columbia
• Over 10,000 BOE/day of non-core conventional production sold, improving operating performance and funding acquisitions of new growth assets
Over 475,000 net new acres of
undeveloped land added
Non-core dispositions have
funded new growth
acquisitions

Resource Potential within our Portfolio
5
* Marcellus: internal and third party best estimate contingent resources. North Dakota Bakken: internal estimates of best estimate contingent resources and. Waterfloods: internal estimates of upside potential assuming increased ultimate recoverability from 27% to 30%-37%** Reserves are as at December 31, 2009 and are adjusted to reflect impact of 2010 asset dispositions. Crude Oil 2P reserves also include expected 2P reserves additions at time of North Dakota Bakken acquisition
• Marcellus, North Dakota Bakken and waterflood assets could increase P+P reserves by nearly 3x if fully developed
• Does not reflect any potential resources in our Saskatchewan Bakken or Deep Basin lands
Natural Gas
Crude Oil
0.97 Tcf
Upside Potential*
ND Bakken: 50 MMBOE
Marcellus2.4 Tcf
167 MMBOE
Waterfloods: 50-150 MMBOE
100-200 MMBOE
Proved + Probable Reserves**
Proved + Probable Reserves**
Upside Potential*

6
Production Growth Outlook
75
80
85
90
95
2010 2011 2012
MB
OE/
day
Annual Average Exit
42% oil
48% oil
50% oil
• Bakken production growth:• 25% of total by 2011
• 30% of total by 2012
• Marcellus production growth:• 10% of total by 2011
• 12% of total by 2012

7
2011/2012 Strategy
• Capital spending focused on oil projects and increases by 25% to $650 million
85% of spending on Bakken, Waterfloods and Marcellus
Similar level of spending in 2012
• Production growth of 10 – 15% over next two years
• Crude oil volumes increase by 20% over next two yearsOil weighting increases from 42% to 50% of total volumes by end of 2012
• Cash flow expected to grow 15% by 2012
• Dividend maintained at $0.18/share
• Balance sheet used to support plans
Production growth of 10 – 15% over next two years

8
2011 Capital Outlook
Resource PlayCapital($MM)
# of Net Wells
2010E Exit Production*
(BOE/day)
2011EExit Production*
(BOE/day)
% Change
Exit to Exit
Bakken/Tight Oil 300 48 13,000 18,000 – 21,000 50%
Waterfloods 110 26 14,500 13,500 – 15,000 -%
Marcellus Shale Gas 160 27 3,000 7,000 – 8,000 150%
Resource Play Total $570 101 30,500 38,500 – 44,000 35%
Company Total $650 113 ~80,000 80,000 – 84,000 ~5%
Over 90% are horizontal wells

9
Financial Outlook
Cash Flow Estimates
$0
$100
$200
$300
$400
$500
$600
$700
$800
$900
2010 2011 2012
$ M
illio
ns
115%
120%
125%
130%
135%
140%
145%
150%
155%GasOilAdjusted Payout Ratio
• 2011 and 2012 cash flow is 70% weighted to liquids, up from approximately 65% today
• Balance sheet supports growth plans through 2012• Debt/cash flow ratio
increases from 1.3x at YE2010 to 2.0x at YE2012
• Debt/cash flow and payout ratios decline as production from growth plays increase
• Non-cash flow generating asset sales expected to help maintain financial flexibility
* Based upon the forward commodity prices (WTI US$90/bbl, AECO $4.15/Mcf, NYMEX Gas US$4.70/MMBtu) and forecast costs as of December 8, 2010 including the impact of hedging

Crude Oil

11
Fort Berthold, North Dakota
• >90% operated & ~90% working interest
• 85% of land is prospective
• Long lease tenure
• Upside from Three Forks
• 2011 capital program - $230 million
Key Facts
Net Acreage 74,500
Current Production ~4,000 BOE/day
Internal Bakken Reserve Est. 18 million BOE
Internal Bakken Contingent Resource Est. (Best)
50 million BOE

12
Fort Berthold ResultsShort Horizontals
(~4,300 feet, 12 stage frac)Long Horizontals
(9,000 feet, 24 stage frac)30 day IPs 550 - 650 bbls/day 1,100 – 1,200 bbls/dayEUR 300 - 400 Mbbls 600 - 800 MbblsCost/Well (US$) $6.0 million $8.0 million120 Day Cum. Prod. 40 Mbbls 81 MbblsPayout Period 2 – 3 yrs 1 – 1.7 yrsNPV12% $2.2 - $5.0 million $8.4 - $14.0 million
-
20,000
40,000
60,000
80,000
100,000
120,000
140,000
160,000
1 31 61 91 121
Days Producing
Bar
rels
Actual Short Bakken Laterals (4 Wells)
Actual Long Bakken Laterals (3 Wells)
Average Cumulative Short Type Well
Average Cumulative Long Type Well

13
2011 North Dakota Bakken Plans
• 32 net operated wells, 75% long horizontal, Bakken and Three Forks
• 3 to 4 rigs working in the play
• Recently entered into agreements to secure rigs and access to frac services to help ensure timely execution of plans
• Expect to have mid-stream service agreements in place in mid 2011 to capture associated gas volumes
• 300 MBOE/day of new and expanded pipeline capacity proposed to address the takeaway shortfall
– Evaluating securing additional capacity to address our production growth
Production grows from
4,000 bbls/day to +20,000 BOE/day over next 4 years

Waterfloods Overview
• Mature, cash generating assets in various plays such as the Glauconitic, Viking, Cardium and Ratcliffe
• Free cash flow supports dividend and growth strategy• ~18% of total production• Low decline of ~16% with average oil quality of 30° API• Significant OOIP
• 22% recovered to date• Reserves booked to 27% (12/31/2009)
• Drilling & EOR upside could improve recoverability to 30-37% and add 50 – 150 million barrels
• 2011 plans: Drill 26 production/injection wells and initiate polymer pilots at two properties
• Expect to maintain production at ~14,000 BOE/day
Key Facts
P+P Reserves (2009 adj. for dispositions)
83.1 million barrels
2011E Annual Production 13.5 – 15.0 MBOE/day
2011 Capital Budget $110 million
14

Natural Gas
16
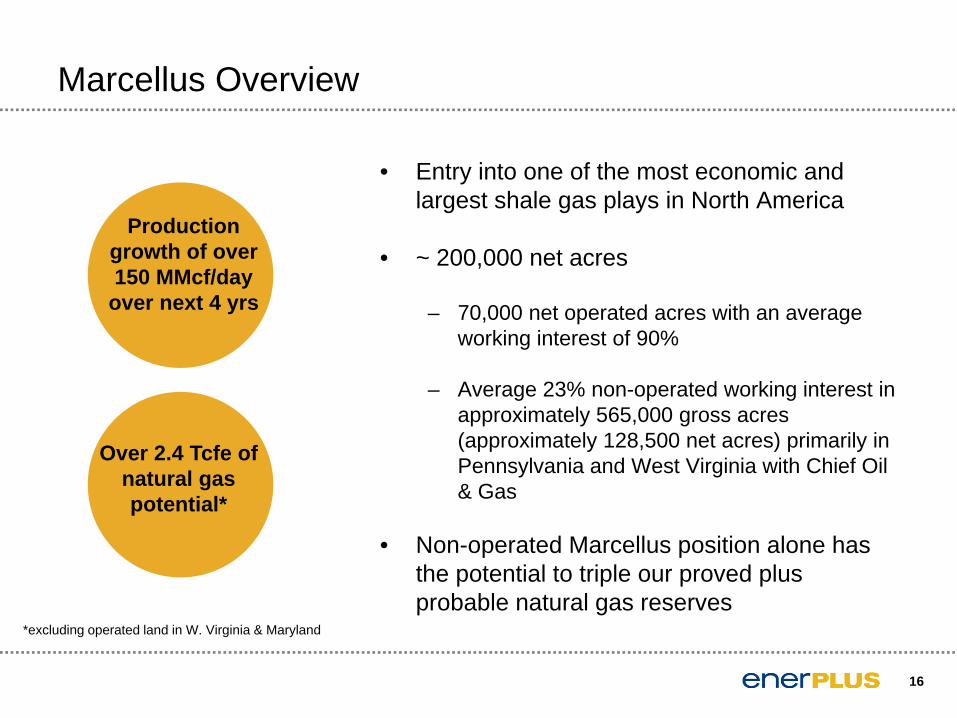
Marcellus Overview
• Entry into one of the most economic and largest shale gas plays in North America
• ~ 200,000 net acres
– 70,000 net operated acres with an average working interest of 90%
– Average 23% non-operated working interest in approximately 565,000 gross acres (approximately 128,500 net acres) primarily in Pennsylvania and West Virginia with Chief Oil & Gas
• Non-operated Marcellus position alone has the potential to triple our proved plus probable natural gas reserves
Production growth of over 150 MMcf/day
over next 4 yrs
Over 2.4 Tcfe of natural gas potential*
*excluding operated land in W. Virginia & Maryland

17
Marcellus Shale Gas
• Expect to grow net production by 150% to 45 MMcf/day in 2011
25% of 2011 spending
Typical EUR - 4.0 Bcf
45% of 2011 spending
Typical EUR- 4.5 to 5.5 Bcf
Key Facts
Original Gas in Place 13 to 15 Tcfe
Booked P+P Reserves (YE09) 24.9 Bcfe
Contingent Resource “Best Estimate” 2.4 Tcfe
Land Utilization 55%
EUR/well 3.5 – 6.0 Bcfe
Well Costs $4.5 – $6.0 MM
Well Density 4 - 8 wells/section
2011 Capital $160 million

2011 Plans
• Results over past 18 months have either met or exceeded expectations
• 150 gross wells planned (22.4 net), 8 – 10 rigs running
• Expect to complete ~121 gross wells with 94 new gross wells on stream by the end of the year
• Capital breakdown:– 25% directed to liquids rich gas in SW PA and NW
West Virginia – 30% directed to delineation activity to preserve
lease positions and identify future potential– 45% of capital directed to development drilling in
areas with EUR’s of 4.5 to 5.5 Bcf
• Plan to drill 4 net operated wells
18
Production growth of
150% in 2011

0%
20%
40%
60%
80%
100%
$3 $4 $5 $6
NYMEX Gas ($US/MMBtu)
BTAX
IRR
19
Potential in the Marcellus
6.0 Bcf Type Curve
3.5 Bcf Type Curve
4.0 Bcf Well 5.0 Bcf Well 6.0 Bcf Well
NYMEX$/MMbtu
IRR Payout Years
NPV 12%($MM)
IRR Payout Years
NPV 12%($MM)
IRR Payout Years
NPV 12%($MM)
$6.00 27% 3.4 $2.51 41% 2.5 $4.57 57% 2.0 $6.62
$5.00 16% 4.9 $0.75 26% 3.4 $2.37 37% 2.6 $3.99
$4.00 7% 8.6 ($1.02) 13% 5.7 $0.17 20% 4.2 $1.35

20
Marcellus Performance – Cumulative Production
Type curve estimates have been increased as well results have either met or exceeded our expectations
-
100
200
300
400
500
600
700
800
900
1,000
1 26 51 76 101 126 151 176 201 226
Days Producing
MM
cfe
6.0 Bcfe Type Curve
3.5 Bcfe Type Curve
Actual Average Marcellus HZ Well

21
Executing on our Strategy
• Enerplus is well positioned in our transition toward a growth and income business
• Significant progress has been made in acquiring early stage resource plays
– ~475,000 net acres of prospective undeveloped land in the Marcellus, Bakken/tight oil and Deep Basin tight gas plays
• Production growth of 10 – 15% over next two years
• Cash flow from existing portfolio with strong balance sheet will support growth and dividend plans
• Current focus on executing development programs

The Game PlanSupplemental Information

23
Corporate Profile
• Trading Symbol (TSX/NYSE) ERF
• Market Capitalization (1) $5.6 billion
• Enterprise Value (2) $6.3 billion
• Average Daily Trading Value (Dec 2010) $30 million
• Average Daily Production (Q3/2010) 82,869 BOE/day– Gas Weighting 57%
• Long-Term Debt /Trailing 12-Month Cash Flow Ratio (3) 0.9x
• Current Monthly Cash Dividend $0.18/share
• Current Annualized Yield 6.8%
(1) Market Cap. at January 5, 2011 – based upon 178,118,000 shares outstanding at September 30, 2010(2) Market Cap. at January 5, 2011 plus outstanding debt (net of cash) at September 30, 2010(3) Using outstanding debt and Cash Flow from Operations at September 30, 2010

24
Corporate Conversion
• Unitholder and court approvals obtained and conversion to a dividend paying corporation effective January 1, 2011
• Intend to maintain dividend at $0.18/share/month based upon current commodity prices and capital spending plans
• Will continue to pay monthly dividend post conversion
• No change to name or ticker symbols (elimination of .un on TSX)
• No acceleration or vesting of any compensation awards to employees or Directors
No Canadian cash taxes
expected for 3-5 years

25
Progress on Portfolio Transition – 2009/2010
Dispositions ProductionProceeds($ Million)
Non-Core Conventional Assets(1) ~10,500 BOE/day ~$600Kirby Oil Sands - $405Total Proceeds ~$1,005
Acquisitions Net AcreageCost
($ Million)Marcellus Non-Operated Acreage 128,500 acres $448Marcellus Operated Acreage 70,200 acres $185North Dakota Bakken 74,500 acres $618
Saskatchewan Bakken 140,000 acres $176Deep Basin 65,000 acres $40Total 478,200 acres $1,467

26
2010 Year to Date Operating Performance
Cal 2010Guidance*
YTD Sept 30, 2010
Annual Average Production (MBOE/day)
Natural Gas
83 – 84
58%
84.2
58%Exit Rate Production (MBOE/day)
Natural Gas
80 – 82
55%N/A
Capital Spending ($MM) $515 $314
Operating Costs ($/BOE) $10.20 $10.02
Distributions Paid ($MM) - $288
Annual Adjusted Payout Ratio 128% 108%
Debt/Cash Flow Ratio at Year-End 1.1x 0.9x
• Production volumes on track with expectations, post divestment activity
• Sold 6,000 BOE/day YTD
• Operating costs declining
• 60% of capital spending on oil projects
• Significant production increases in Bakken and Marcellus
*adjusted for divestments

27
Hedging Strategy
• Protect a portion of cash flow to support capital spending, economics of our acquisitions and income distribution
• Provide downside protection and retain upside price increases
• Typically hedging forward 2 years
• Combination of instruments utilized - puts, calls, swaps
• Not hedging in current natural gas price environment
2011 Hedge Positions:56% of crude oil production hedged at US$87.10/bbl
32% of natural gas production hedged at effective price of $6.14/Mcf through March 2011
2012 Hedge Positions:7% of crude oil production hedged at US$90.29/bbl
28
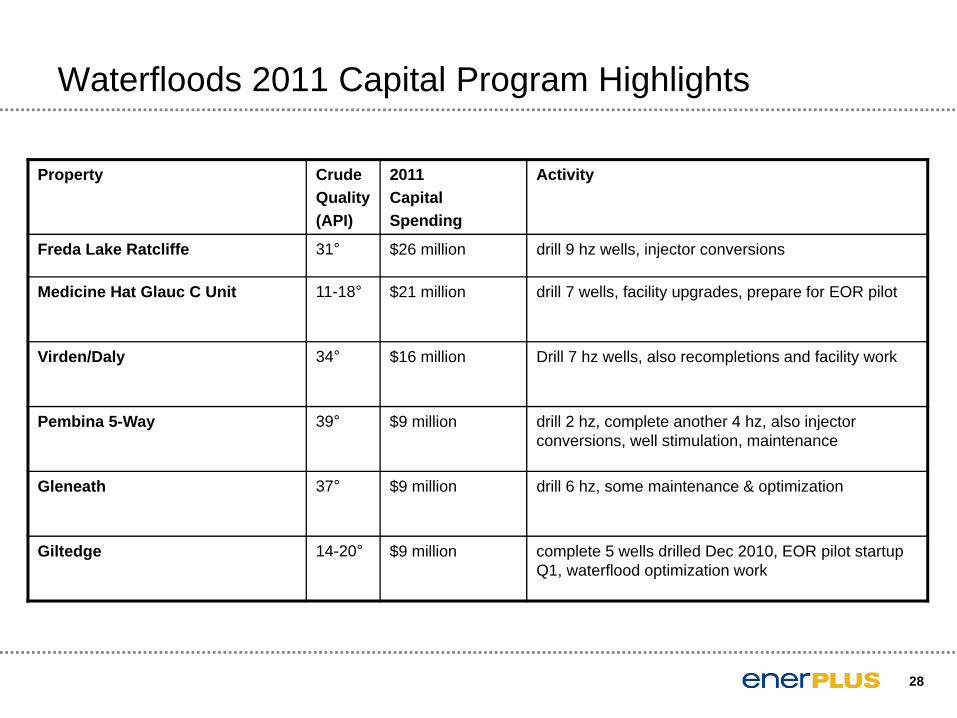
Waterfloods 2011 Capital Program Highlights
Property Crude Quality(API)
2011 Capital Spending
Activity
Freda Lake Ratcliffe 31° $26 million drill 9 hz wells, injector conversions
Medicine Hat Glauc C Unit 11-18° $21 million drill 7 wells, facility upgrades, prepare for EOR pilot
Virden/Daly 34° $16 million Drill 7 hz wells, also recompletions and facility work
Pembina 5-Way 39° $9 million drill 2 hz, complete another 4 hz, also injector conversions, well stimulation, maintenance
Gleneath 37° $9 million drill 6 hz, some maintenance & optimization
Giltedge 14-20° $9 million complete 5 wells drilled Dec 2010, EOR pilot startup Q1, waterflood optimization work

29
Marcellus Drilling ActivityGross Wells Drilled (at Dec 10, 2010) Horizontal Vertical Total
Producing 35 7 42
Partially Drilled* 2 1 3
Waiting on Completion 33 6 39
Waiting on Pipeline 9 6 15
Total Gross Wells 79 20 99
• Planned drilling activity in 9 counties in PA, Marshall and Preston counties in West Virginia, and Garrett county in Maryland
• Non-op drilling will focus mostly on retaining leases. Operated activity will be primarily delineation work to better identify the resource.
• Majority of producing wells in Bradford, Lycoming and Susquehanna Counties in PA (>80% of current production) and Marshall County in WV
* Vertical portion of well drilled, awaiting horizontal extension

30
Marcellus Environmental Concerns
• Freshwater aquifers range in depth from 80 to 500 feet below surface
• Drilling depth in the Marcellus ranges from 4,500 feet to over 7,500 feet across the play
• Drilling and completion techniques are designed to minimize contamination risks:
– Surface casing set and cemented to approximately 900 feet below surface
– Intermediate casing set and cemented to 2,400 feet below surface
• Surface containment system being used – Poly liner covering well site– Isolates spills from fracture process– Flowback/water storage pits double lined with 2 layers of 40 ml.
plastic liner – Greatly reduces off-pad migration potential

31
$1 Billion Credit Facility
0.4x*
Canadian Imperial Bank of Commerce $145
Royal Bank of Canada $120
Bank of Montreal $120
Bank of Nova Scotia $110
Toronto Dominion Bank $100
National Bank of Canada $85Alberta Treasury Branches $50Total Canadian $730
HSBC Bank $85
Citibank N.A. $85
Union Bank of California $50
Sumitomo Mitsui Bank $50
Total Foreign $270
Canadian Banks70%
Foreign Banks 30%

32
Analyst Coverage
Research Firm Analyst Rating
Bank of America Andrew Fairbanks Sell
BMO Capital Markets Gordon Tait Hold
CIBC World Markets Jeremy Kaliel Sell
Canaccord Capital Kyle Preston Hold
Citigroup Richard Roy Buy
Dundee Securities Corp. Travis Wood Buy
FirstEnergy Capital Corp. Jill Angevine Buy
Macquarie Capital Markets Cristina Lopez Hold
National Bank Financial n/a Under Review
Odlum Brown Limited Mark Barclay Buy
Peters & Co. Limited Kam Sandhar Hold
Raymond James Kristopher Zack Hold
RBC Dominion Securities Fergal Kelly Hold
Scotia Capital Patrick Bryden Sell
TD Newcrest Roger Serin Buy
UBS Matt Donohue Hold

Jo-Anne M. CazaVice President, Corporate & Investor [email protected]
Garth DollManager, Investor [email protected]
www.enerplus.com
The Dome TowerSuite 3000, 333 - 7th Ave SWCalgary, AB CanadaT2P 2Z1
33
Investor Relations Contacts