tcc fact book - web.tcc.edu · tcc fact book office of ... ti. io. onn . mission, core values,...
TRANSCRIPT
TCC FACT BOOKOFFiCe OF insTiTuTiOnAl eFFeCTiveness
2015
TIDEWATER COMMUNITY COLLEGE
From here, go anywhere.TM
CHESAPEAKE • NORFOLK • PORTSMOUTH • SUFFOLK • VIRGINIA BEACH

FACT BOOK
Office of Institutional Effectiveness
2015
34th EDITION
The Tidewater Community College Fact Book is a summary of current and historical statistical information. Anyone seeking additional information may contact the Off ice of Institutional Effectiveness .

FFAACCTT BBOOOOKK TABLE OF CONTENTS
MMIISSSSIIOONN,, CCOORREE VVAA LLUUEESS,, AACCCCRREEDDIITTAATTIIOONN
Mission, Core Values, Accreditation ..................................................................................1
SSEERRVVIICCEE AARREEAA DDEEMMOO GGRRAAPPHHIICCSS
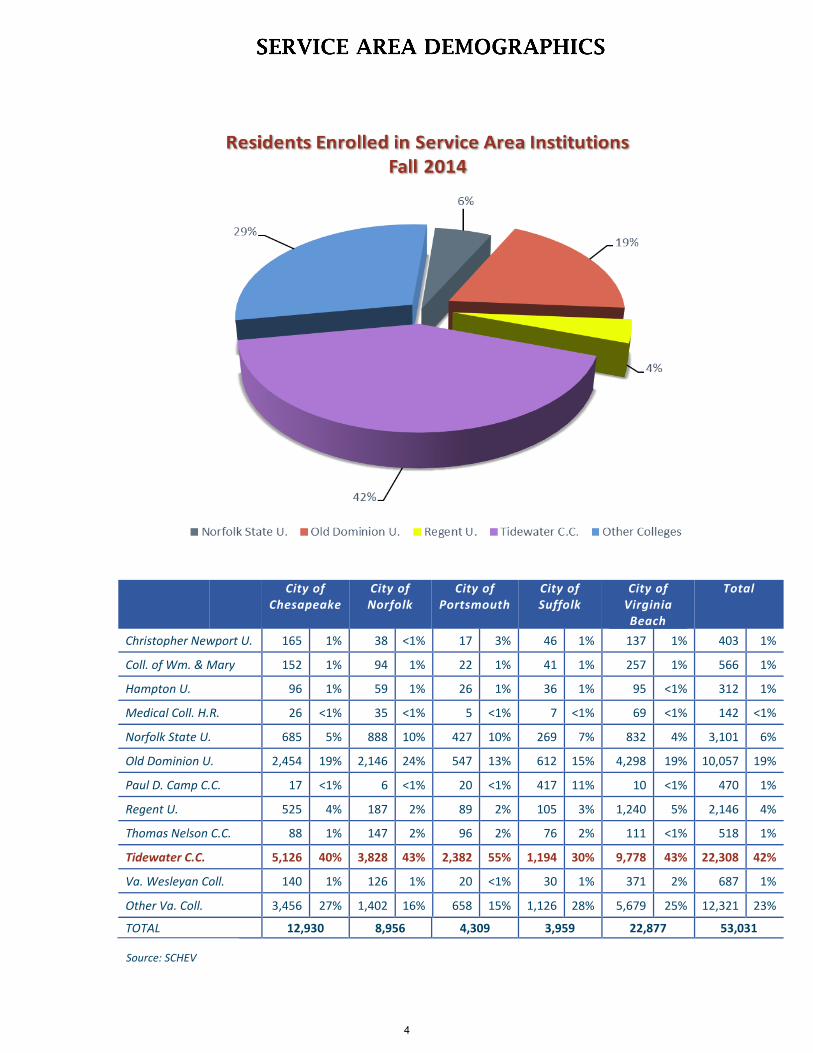
Service Area Population Trends .........................................................................................3 2014 Service Area Population Characteristics ...................................................................3 Residents Enrolled in Service Area Institutions – Fall 2014 ...............................................4
SSTTUUDDEENNTT IINNFFOO RRMMAATTIIOONN
At A Glance .........................................................................................................................5 Academic Programs for 2014-15 by Campus ................................................................. 7-9 College Student Profile 2014–15 .....................................................................................10 Annual Enrollment by Campus 2003-04 to 2014-15 (FTES/Headcount) ..........................11 Annual Enrollment Regional Automotive Center & Visual Arts Center ...........................11 VCCS Annual FTES 2011-12 to 2014-15 ...........................................................................12 Special Population Enrollment Fall 2012-2014 Military and Veterans ...........................13 Proportion of Public High School Graduates Attending TCC 2009 – 2014 .......................13
CCAAMMPPUUSS PPRROOFFII LLEESS
Chesapeake Campus 10-Year Historical Profile ...............................................................14 Norfolk Campus 10-Year Historical Profile ......................................................................15 Portsmouth Campus 10-Year Historical Profile ...............................................................16 Virginia Beach Campus 10-Year Historical Profile ...........................................................17
GGRRAADDUUAATTEE IINNFFOORRMMAA TTIIOONN
2015 Graduate Profile .....................................................................................................18 Top 10 TCC Graduate Institutions 2013 – 2014 ...............................................................18 Graduate Awards by Curriculum Five-Year Average 2011 – 2015 ............................ 19-21
FFAACCTT BBOOOOKK TABLE OF CONTENTS
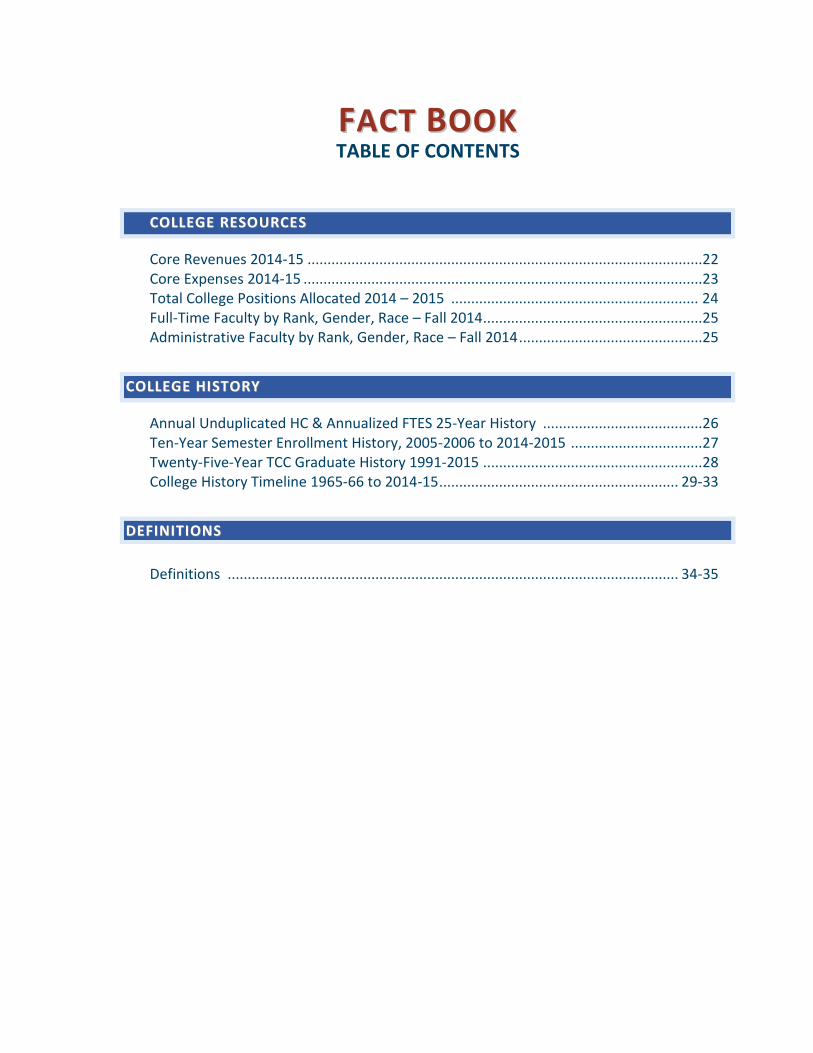
CCOOLLLLEEGGEE RREESSOO UURRCCEESS
Core Revenues 2014-15 ...................................................................................................22 Core Expenses 2014-15 ....................................................................................................23 Total College Positions Allocated 2014 – 2015 .............................................................. 24 Full-Time Faculty by Rank, Gender, Race – Fall 2014 .......................................................25 Administrative Faculty by Rank, Gender, Race – Fall 2014 ..............................................25
CCOOLLLLEEGGEE HHIISSTTOORRYY
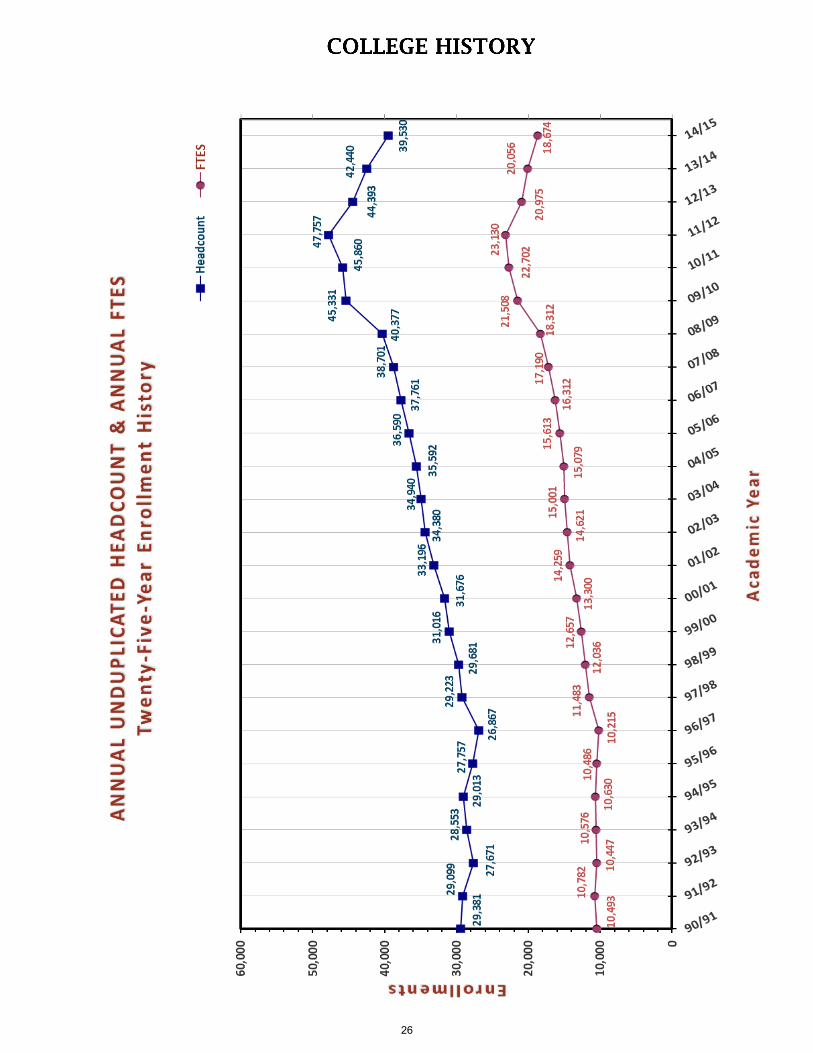
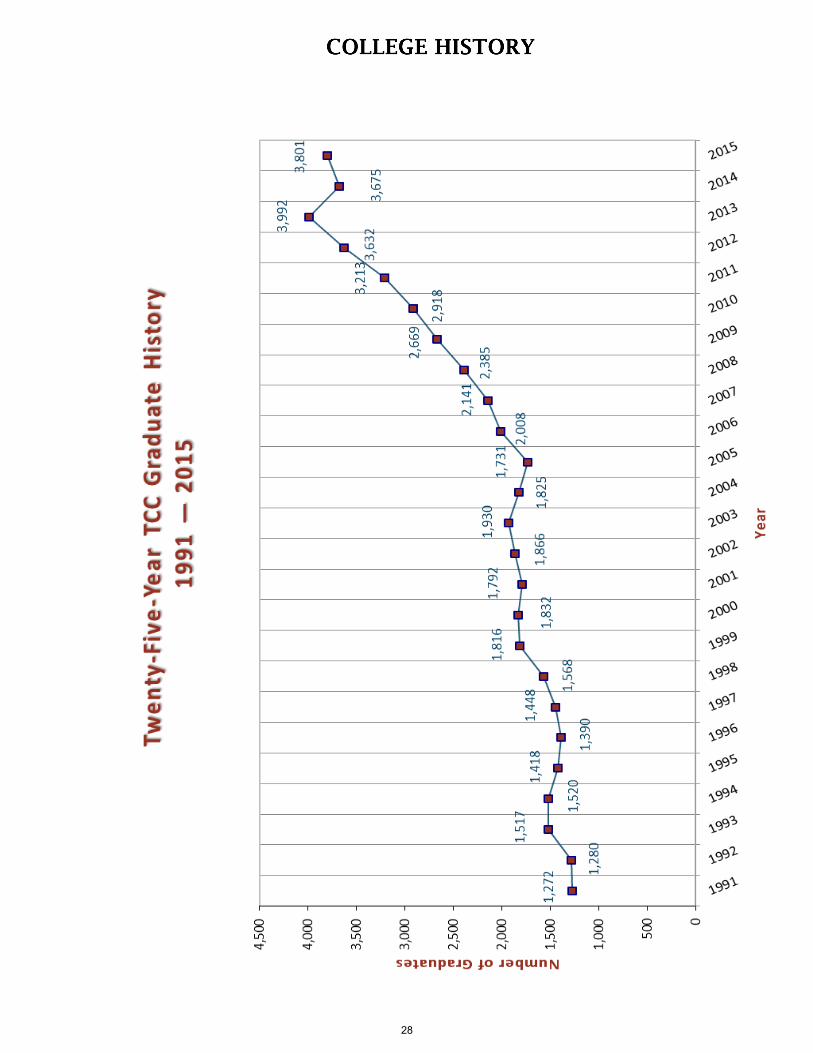
Annual Unduplicated HC & Annualized FTES 25-Year History ........................................26 Ten-Year Semester Enrollment History, 2005-2006 to 2014-2015 .................................27 Twenty-Five-Year TCC Graduate History 1991-2015 .......................................................28 College History Timeline 1965-66 to 2014-15 ............................................................ 29-33
DDEEFFIINNIITTIIOONNSS
Definitions ................................................................................................................. 34-35
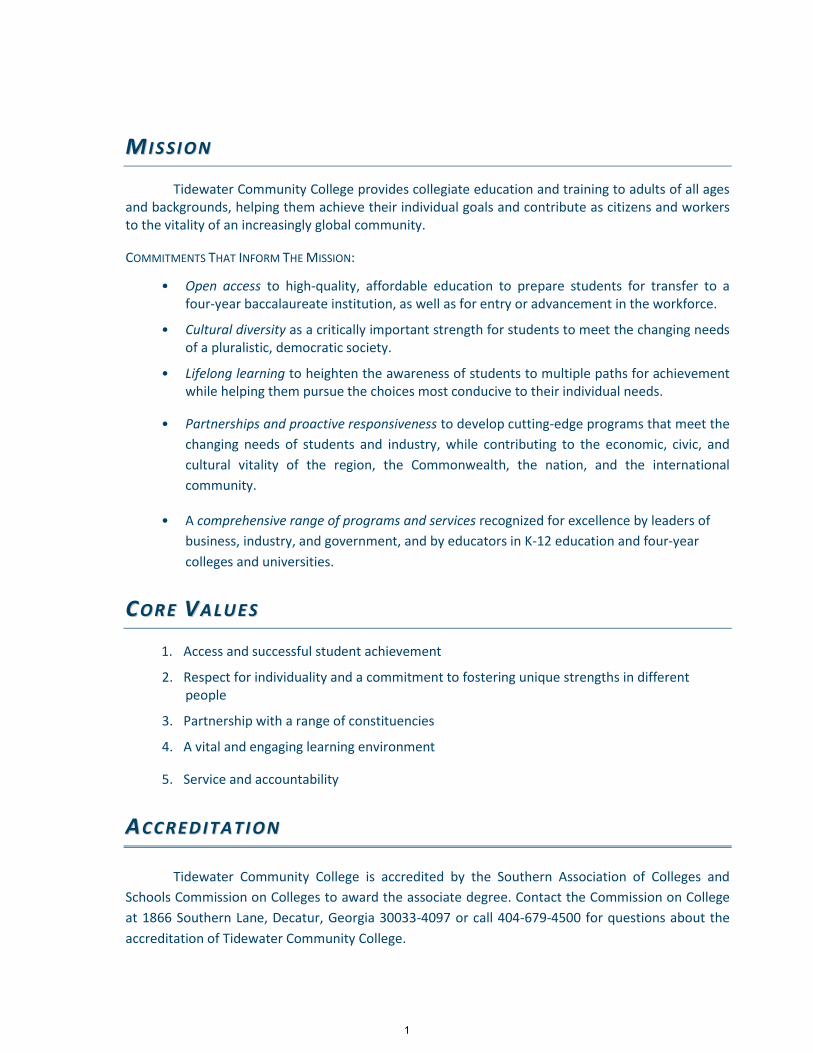
MM II SS SS II OO NN
Tidewater Community College provides collegiate education and training to adults of all ages and backgrounds, helping them achieve their individual goals and contribute as citizens and workers to the vitality of an increasingly global community.
COMMITMENTS THAT INFORM THE MISSION:
• Open access to high-quality, affordable education to prepare students for transfer to a four-year baccalaureate institution, as well as for entry or advancement in the workforce.
• Cultural diversity as a critically important strength for students to meet the changing needs of a pluralistic, democratic society.
• Lifelong learning to heighten the awareness of students to multiple paths for achievement while helping them pursue the choices most conducive to their individual needs.
• Partnerships and proactive responsiveness to develop cutting-edge programs that meet the
changing needs of students and industry, while contributing to the economic, civic, and
cultural vitality of the region, the Commonwealth, the nation, and the international
community.
• A comprehensive range of programs and services recognized for excellence by leaders of
business, industry, and government, and by educators in K-12 education and four-year
colleges and universities.
CC OO RR EE VV AA LL UU EE SS
1. Access and successful student achievement
2. Respect for individuality and a commitment to fostering unique strengths in different people
3. Partnership with a range of constituencies
4. A vital and engaging learning environment
5. Service and accountability
AA CC CC RR EE DD II TT AA TT II OO NN
Tidewater Community College is accredited by the Southern Association of Colleges and
Schools Commission on Colleges to award the associate degree. Contact the Commission on College
at 1866 Southern Lane, Decatur, Georgia 30033-4097 or call 404-679-4500 for questions about the
accreditation of Tidewater Community College.
1

2
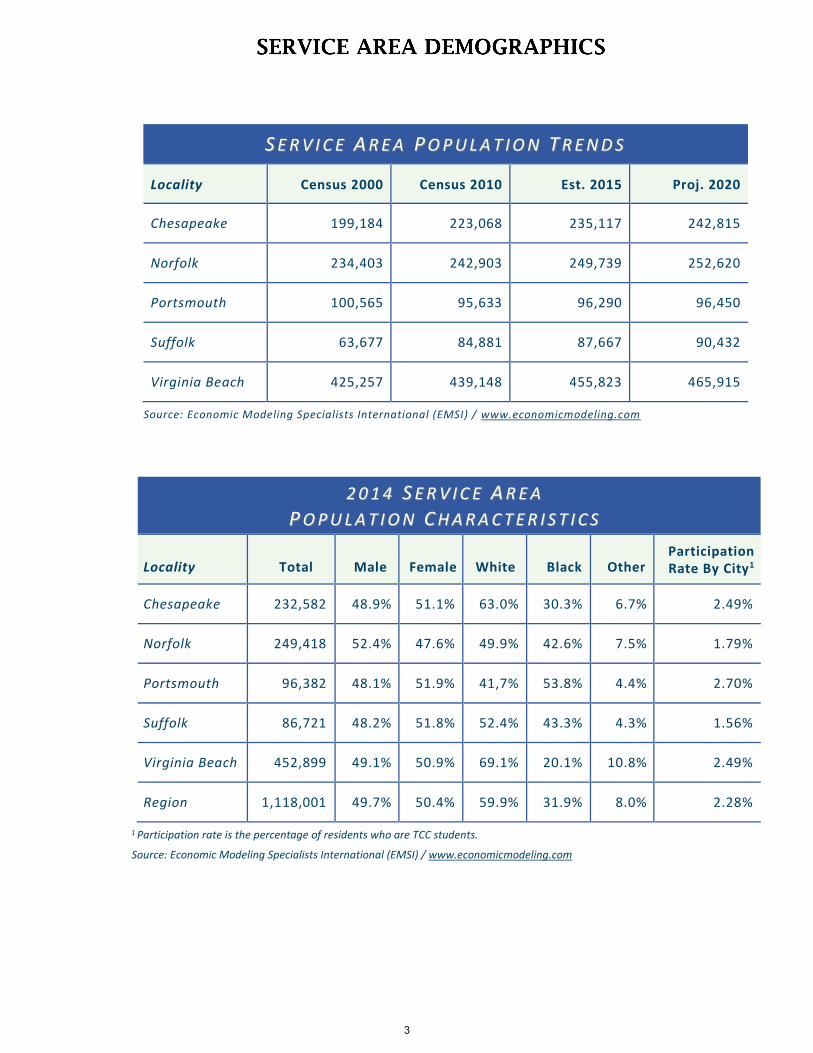
SS EE RR VV II CC EE AA RR EE AA PP OO PP UU LL AA TT II OO NN TT RR EE NN DD SS
Locality Census 2000 Census 2010 Est. 2015 Proj. 2020
Chesapeake 199,184 223,068 235,117 242,815
Norfolk 234,403 242,903 249,739 252,620
Portsmouth 100,565 95,633 96,290 96,450
Suffolk 63,677 84,881 87,667 90,432
Virginia Beach 425,257 439,148 455,823 465,915
Source: Economic Modeling Specialists International (EMSI) / www.economicmodeling.com
22 00 11 44 SS EE RR VV II CC EE AA RR EE AA
PP OO PP UU LL AA TT II OO NN CC HH AA RR AA CC TT EE RR II SS TT II CC SS
Locality Total Male Female White Black Other Participation Rate By City1
Chesapeake 232,582 48.9% 51.1% 63.0% 30.3% 6.7% 2.49%
Norfolk 249,418 52.4% 47.6% 49.9% 42.6% 7.5% 1.79%
Portsmouth 96,382 48.1% 51.9% 41,7% 53.8% 4.4% 2.70%
Suffolk 86,721 48.2% 51.8% 52.4% 43.3% 4.3% 1.56%
Virginia Beach 452,899 49.1% 50.9% 69.1% 20.1% 10.8% 2.49%
Region 1,118,001 49.7% 50.4% 59.9% 31.9% 8.0% 2.28%
1 Participation rate is the percentage of residents who are TCC students.
Source: Economic Modeling Specialists International (EMSI) / www.economicmodeling.com
3
City of
Chesapeake City of
Norfolk City of
Portsmouth City of Suffolk
City of Virginia Beach
Total
Christopher Newport U. 165 1% 38 <1% 17 3% 46 1% 137 1% 403 1%
Coll. of Wm. & Mary 152 1% 94 1% 22 1% 41 1% 257 1% 566 1%
Hampton U. 96 1% 59 1% 26 1% 36 1% 95 <1% 312 1%
Medical Coll. H.R. 26 <1% 35 <1% 5 <1% 7 <1% 69 <1% 142 <1%
Norfolk State U. 685 5% 888 10% 427 10% 269 7% 832 4% 3,101 6%
Old Dominion U. 2,454 19% 2,146 24% 547 13% 612 15% 4,298 19% 10,057 19%
Paul D. Camp C.C. 17 <1% 6 <1% 20 <1% 417 11% 10 <1% 470 1%
Regent U. 525 4% 187 2% 89 2% 105 3% 1,240 5% 2,146 4%
Thomas Nelson C.C. 88 1% 147 2% 96 2% 76 2% 111 <1% 518 1%
Tidewater C.C. 5,126 40% 3,828 43% 2,382 55% 1,194 30% 9,778 43% 22,308 42%
Va. Wesleyan Coll. 140 1% 126 1% 20 <1% 30 1% 371 2% 687 1%
Other Va. Coll. 3,456 27% 1,402 16% 658 15% 1,126 28% 5,679 25% 12,321 23%
TOTAL 12,930 8,956 4,309 3,959 22,877 53,031
Source: SCHEV
4

AATT AA GGLLAANNCCEE
THE COLLEGE
14th largest public two-year community college in the U.S.
The second largest provider of undergraduate public education in Virginia
Largest undergraduate African American enrollment in Virginia higher education−7th largest associate degree producer among two-year colleges for African American students
The 16th largest associate degree producer in the U.S. among two-year institutions
12 nationally accredited degree programs
OUR STUDENTS
39,530 students served; 18,674 annual FTES 42% of south Hampton Roads residents who enrolled in higher education enrolled at TCC 38% full-time; 62% part-time 45% college transfer; 44% career/technical* Cities of residence: 41% Virginia Beach, 21% Chesapeake, 16% Norfolk, 9% Portsmouth, 5%
Suffolk Average age is 28 years; 48% 18-24 years of age 55% White, 34% African American, 11% other minorities 56% receive financial aid
OUR GRADUATES
3,801 graduates in 2014-2015 45% transfer degrees, 31% career/technical degrees, 36% certificates 63% of college-transfer graduates continue their education at a four-year institution
RESOURCES
2014-15 core revenue: 185.3 million 353 full-time teaching faculty 4 campuses, 7 regional centers
*Career/Technical = AAS, AAA, Certificate (Career Technical), Diploma, CSC
5

6
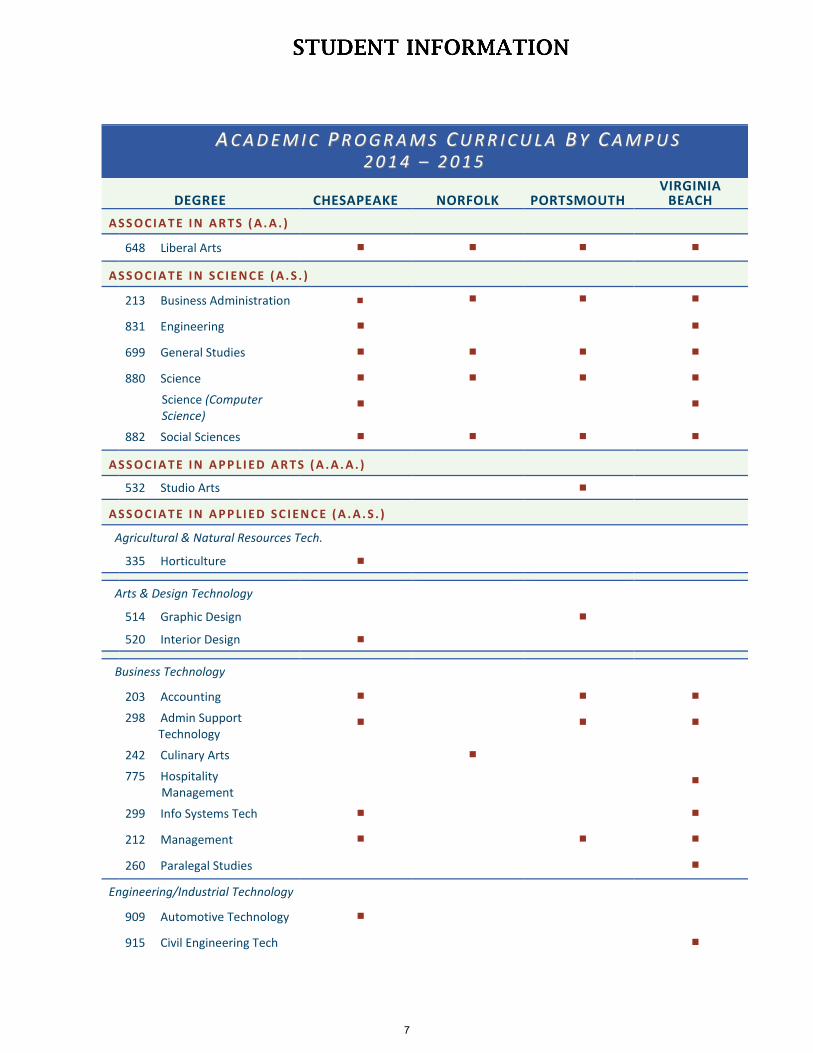
AA CC AA DD EE MM II CC PP RR OO GG RR AA MM SS CC UU RR RR II CC UU LL AA BB YY CC AA MM PP UU SS 22 00 11 44 –– 22 00 11 55
DEGREE CHESAPEAKE NORFOLK PORTSMOUTH VIRGINIA
BEACH
A S S O C I A T E I N A R T S ( A . A . )
648 Liberal Arts A S S O C I A T E I N S C I EN C E ( A . S . )
213 Business Administration 831 Engineering 699 General Studies 880 Science Science (Computer
Science)
882 Social Sciences A S S O C I A T E I N A P P L I ED A R T S ( A . A . A . )
532 Studio Arts
A S S O C I A T E I N A P P L I ED S C I EN C E ( A . A . S . )
Agricultural & Natural Resources Tech.
335 Horticulture
Arts & Design Technology
514 Graphic Design
520 Interior Design
Business Technology
203 Accounting
298 Admin Support Technology
242 Culinary Arts
775 Hospitality Management
299 Info Systems Tech
212 Management
260 Paralegal Studies
Engineering/Industrial Technology
909 Automotive Technology
915 Civil Engineering Tech
7

AA CC AA DD EE MM II CC PP RR OO GG RR AA MM SS CC UU RR RR II CC UU LL AA BB YY CC AA MM PP UU SS 22 00 11 44 –– 22 00 11 55
DEGREE CHESAPEAKE NORFOLK PORTSMOUTH VIRGINIA
BEACH 729 Computer Aided
Drafting & Design Tech
904 Heating, Ventilation, Air Conditioning, & Refrigeration (HVAC/R)
706 Mechatronics
981 Electronics Technology
963 Industrial Technology
746 Maritime Technologies
Health Technology
109 Diagnostic Medical Sonography
146 Emergency Medical Services
152 Health Info Mgmt.
151 Medical Lab Tech
156 Nursing
126 Occupational Therapy Assistant
180 Physical Therapist Assistant
172 Radiography
181 Respiratory Therapy
Public Service Technology
400 Administration of Justice
640 ASL-English Interpretation
636 Early Childhood Development
427 Fire Science Technology
155 Funeral Service
480 Human Services
8

AA CC AA DD EE MM II CC PP RR OO GG RR AA MM SS CC UU RR RR II CC UU LL AA BB YY CC AA MM PP UU SS 22 00 11 44 –– 22 00 11 55
DEGREE CHESAPEAKE NORFOLK PORTSMOUTH VIRGINIA
BEACH
C ER T I F I C A T E
Business Technology
202 Accounting Specialist
200 Information Systems Tech
261 Legal Assistant
Engineering/Industrial Tech 903 Air Conditioning &
Refrigeration
727 Comp Aided Draft & Design Tech
942 Electrical Wiring 943 Electronics Engineering
Tech
995 Welding
General Education
695 General Education
Public Service Technology
221 Career Studies
632 Early Childhood Instruction
9
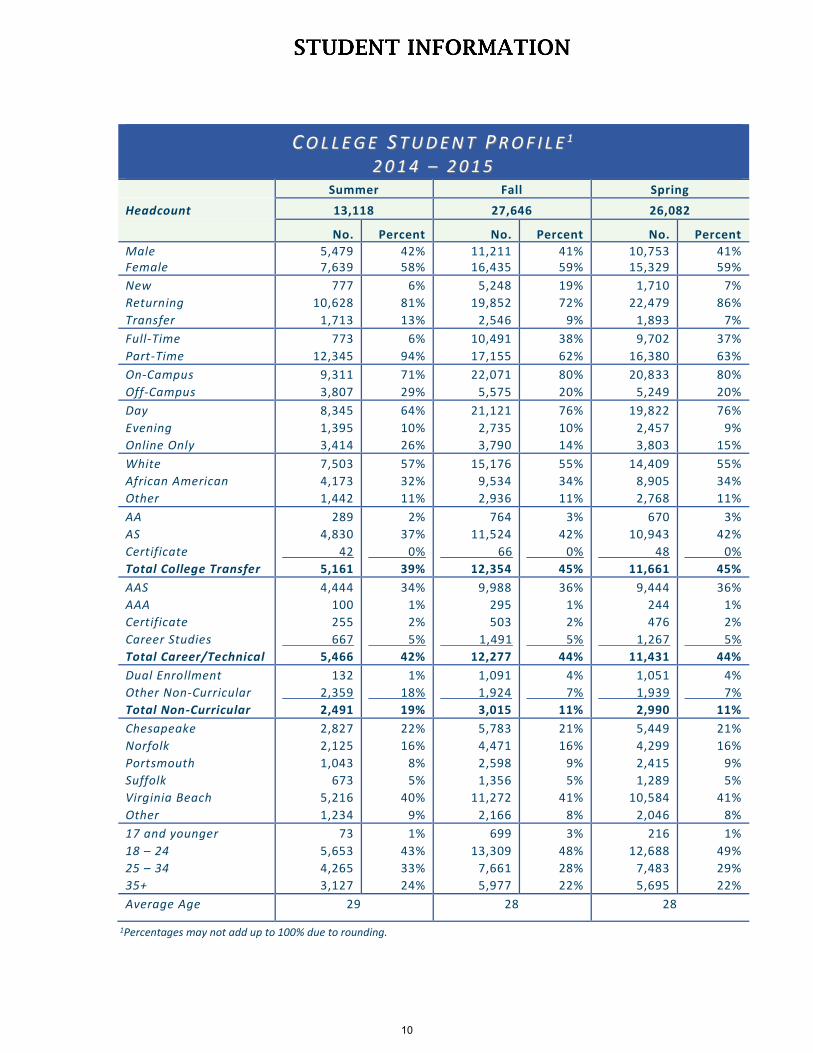
CC OO LL LL EE GG EE SS TT UU DD EE NN TT PP RR OO FF II LL EE 11
22 00 11 44 –– 22 00 11 55 Summer Fall Spring
Headcount 13,118 27,646 26,082
No. Percent No. Percent No. Percent
Male Female
5,479 7,639
42% 58%
11,211 16,435
41% 59%
10,753 15,329
41% 59%
New
Returning
Transfer
777
10,628
1,713
6%
81%
13%
5,248
19,852
2,546
19%
72%
9%
1,710
22,479
1,893
7%
86%
7%
Full-Time
Part-Time
773
12,345
6%
94%
10,491
17,155
38%
62%
9,702
16,380
37%
63%
On-Campus
Off-Campus
9,311
3,807
71%
29%
22,071
5,575
80%
20%
20,833
5,249
80%
20%
Day
Evening
Online Only
8,345
1,395
3,414
64%
10%
26%
21,121
2,735
3,790
76%
10%
14%
19,822
2,457
3,803
76%
9%
15%
White
African American
Other
7,503
4,173
1,442
57%
32%
11%
15,176
9,534
2,936
55%
34%
11%
14,409
8,905
2,768
55%
34%
11%
AA
AS
Certificate
Total College Transfer
289
4,830
42
5,161
2%
37%
0%
39%
764
11,524
66
12,354
3%
42%
0%
45%
670
10,943
48
11,661
3%
42%
0%
45%
AAS
AAA
Certificate
Career Studies
Total Career/Technical
4,444
100
255
667
5,466
34%
1%
2%
5%
42%
9,988
295
503
1,491
12,277
36%
1%
2%
5%
44%
9,444
244
476
1,267
11,431
36%
1%
2%
5%
44%
Dual Enrollment
Other Non-Curricular
Total Non-Curricular
132
2,359
2,491
1%
18%
19%
1,091
1,924
3,015
4%
7%
11%
1,051
1,939
2,990
4%
7%
11%
Chesapeake
Norfolk
Portsmouth
Suffolk
Virginia Beach
Other
2,827
2,125
1,043
673
5,216
1,234
22%
16%
8%
5%
40%
9%
5,783
4,471
2,598
1,356
11,272
2,166
21%
16%
9%
5%
41%
8%
5,449
4,299
2,415
1,289
10,584
2,046
21%
16%
9%
5%
41%
8%
17 and younger
18 – 24
25 – 34
35+
73
5,653
4,265
3,127
1%
43%
33%
24%
699
13,309
7,661
5,977
3%
48%
28%
22%
216
12,688
7,483
5,695
1%
49%
29%
22%
Average Age 29 28 28
1Percentages may not add up to 100% due to rounding.
10
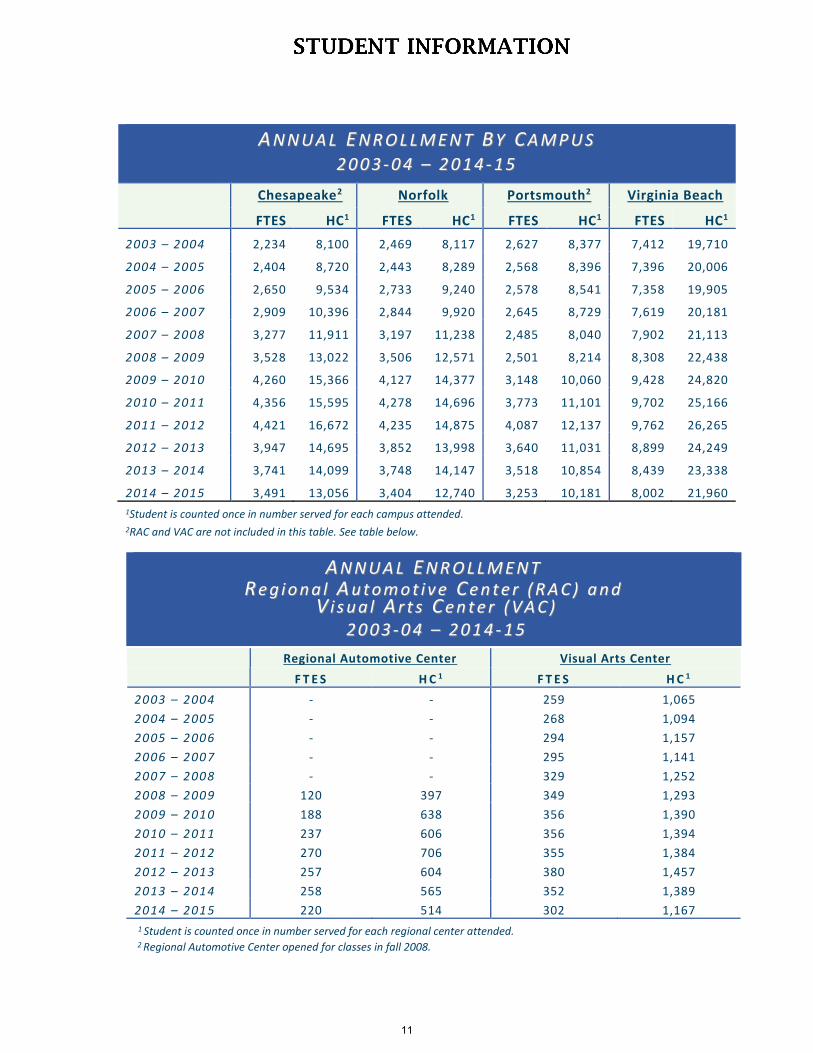
AA NN NN UU AA LL EE NN RR OO LL LL MM EE NN TT BB YY CC AA MM PP UU SS 22 00 00 33 -- 00 44 –– 22 00 11 44 -- 11 55
Chesapeake2 Norfolk Portsmouth2 Virginia Beach
FTES HC1 FTES HC1 FTES HC1 FTES HC1
2003 – 2004 2,234 8,100 2,469 8,117 2,627 8,377 7,412 19,710
2004 – 2005 2,404 8,720 2,443 8,289 2,568 8,396 7,396 20,006
2005 – 2006 2,650 9,534 2,733 9,240 2,578 8,541 7,358 19,905
2006 – 2007 2,909 10,396 2,844 9,920 2,645 8,729 7,619 20,181
2007 – 2008 3,277 11,911 3,197 11,238 2,485 8,040 7,902 21,113
2008 – 2009 3,528 13,022 3,506 12,571 2,501 8,214 8,308 22,438
2009 – 2010 4,260 15,366 4,127 14,377 3,148 10,060 9,428 24,820
2010 – 2011 4,356 15,595 4,278 14,696 3,773 11,101 9,702 25,166
2011 – 2012 4,421 16,672 4,235 14,875 4,087 12,137 9,762 26,265
2012 – 2013 3,947 14,695 3,852 13,998 3,640 11,031 8,899 24,249
2013 – 2014 3,741 14,099 3,748 14,147 3,518 10,854 8,439 23,338
2014 – 2015 3,491 13,056 3,404 12,740 3,253 10,181 8,002 21,960
1Student is counted once in number served for each campus attended. 2RAC and VAC are not included in this table. See table below.
AA NN NN UU AA LL EE NN RR OO LL LL MM EE NN TT RR ee gg ii oo nn aa ll AA uu tt oo mm oo tt ii vv ee CC ee nn tt ee rr (( RR AA CC )) aa nn dd
VV ii ss uu aa ll AA rr tt ss CC ee nn tt ee rr (( VV AA CC ))
22 00 00 33 -- 00 44 –– 22 00 11 44 -- 11 55
Regional Automotive Center Visual Arts Center
F T E S H C 1 F T E S H C 1
2003 – 2004 - - 259 1,065
2004 – 2005 - - 268 1,094
2005 – 2006 - - 294 1,157
2006 – 2007 - - 295 1,141
2007 – 2008 - - 329 1,252
2008 – 2009 120 397 349 1,293
2009 – 2010 188 638 356 1,390
2010 – 2011 237 606 356 1,394
2011 – 2012 270 706 355 1,384
2012 – 2013 257 604 380 1,457
2013 – 2014 258 565 352 1,389
2014 – 2015 220 514 302 1,167
1 Student is counted once in number served for each regional center attended. 2 Regional Automotive Center opened for classes in fall 2008.
11
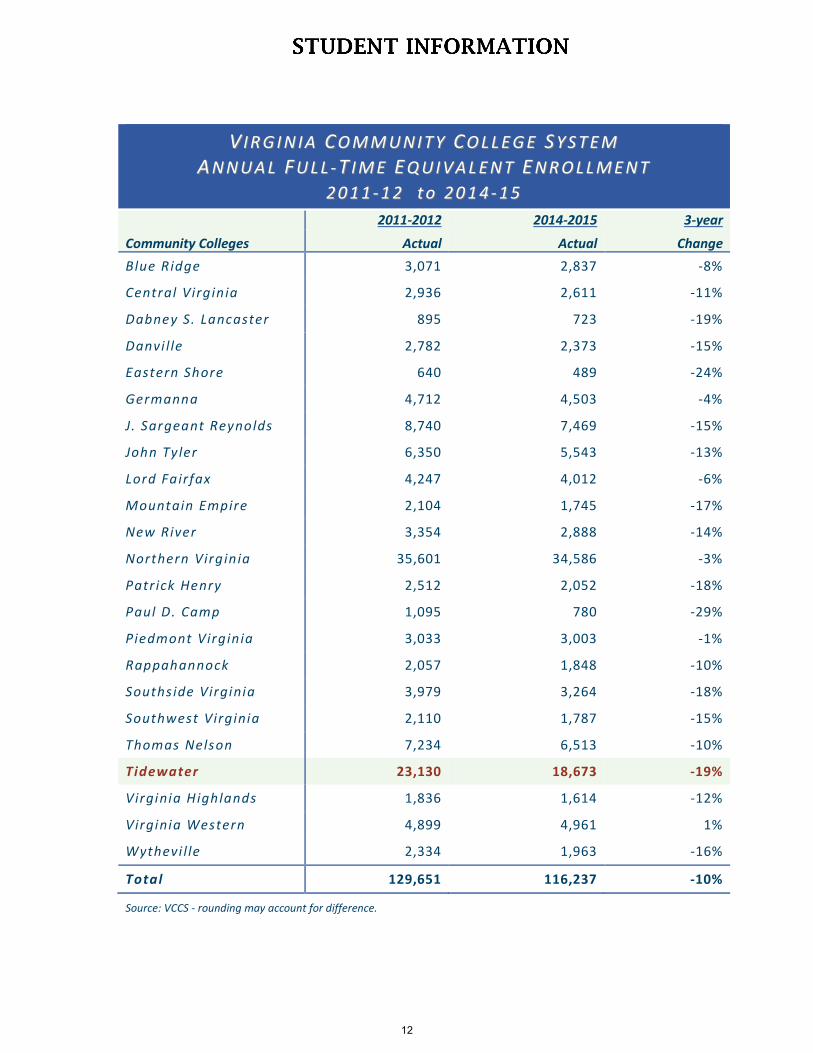
VV II RR GG II NN II AA CC OO MM MM UU NN II TT YY CC OO LL LL EE GG EE SS YY SS TT EE MM
AA NN NN UU AA LL FF UU LL LL -- TT II MM EE EE QQ UU II VV AA LL EE NN TT EE NN RR OO LL LL MM EE NN TT
22 00 11 11 -- 11 22 tt oo 22 00 11 44 -- 11 55
Community Colleges
2011-2012 2014-2015 3-year
Actual Actual Change
Blue Ridge 3,071 2,837 -8%
Central Virginia 2,936 2,611 -11%
Dabney S. Lancaster 895 723 -19%
Danvi l le 2,782 2,373 -15%
Eastern Shore 640 489 -24%
Germanna 4,712 4,503 -4%
J. Sargeant Reynolds 8,740 7,469 -15%
John Tyler 6,350 5,543 -13%
Lord Fairfax 4,247 4,012 -6%
Mountain Empire 2,104 1,745 -17%
New River 3,354 2,888 -14%
Northern Virginia 35,601 34,586 -3%
Patrick Henry 2,512 2,052 -18%
Paul D. Camp 1,095 780 -29%
Piedmont Virginia 3,033 3,003 -1%
Rappahannock 2,057 1,848 -10%
Souths ide Virginia 3,979 3,264 -18%
Southwest Virginia 2,110 1,787 -15%
Thomas Nelson 7,234 6,513 -10%
Tidewater 23,130 18,673 -19%
Virginia Highlands 1,836 1,614 -12%
Virginia Western 4,899 4,961 1%
Wythevi l le 2,334 1,963 -16%
Total 129,651 116,237 -10%
Source: VCCS - rounding may account for difference.
12
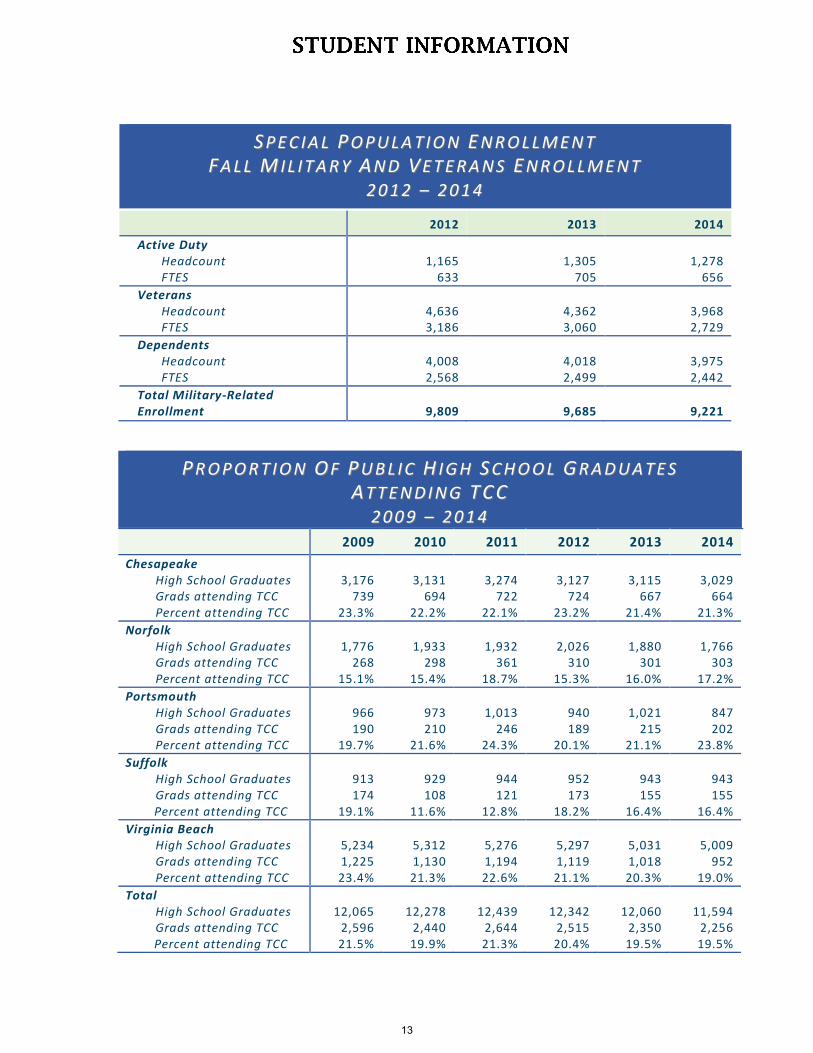
SS PP EE CC II AA LL PP OO PP UU LL AA TT II OO NN EE NN RR OO LL LL MM EE NN TT
FF AA LL LL MM II LL II TT AA RR YY AA NN DD VV EE TT EE RR AA NN SS EE NN RR OO LL LL MM EE NN TT
22 00 11 22 –– 22 00 11 44
2012 2013 2014
Active Duty Headcount FTES
1,165
633
1,305
705
1,278
656
Veterans Headcount FTES
4,636 3,186
4,362 3,060
3,968 2,729
Dependents Headcount FTES
4,008 2,568
4,018 2,499
3,975 2,442
Total Military-Related Enrollment
9,809
9,685
9,221
PP RR OO PP OO RR TT II OO NN OO FF PP UU BB LL II CC HH II GG HH SS CC HH OO OO LL GG RR AA DD UU AA TT EE SS
AA TT TT EE NN DD II NN GG TT CC CC
22 00 00 99 –– 22 00 11 44
2009 2010 2011 2012 2013 2014
Chesapeake High School Graduates Grads attending TCC Percent attending TCC
3,176
739 23.3%
3,131
694 22.2%
3,274
722 22.1%
3,127
724 23.2%
3,115
667 21.4%
3,029
664 21.3%
Norfolk High School Graduates Grads attending TCC Percent attending TCC
1,776
268 15.1%
1,933
298 15.4%
1,932
361 18.7%
2,026
310 15.3%
1,880
301 16.0%
1,766
303 17.2%
Portsmouth High School Graduates Grads attending TCC Percent attending TCC
966 190
19.7%
973 210
21.6%
1,013
246 24.3%
940 189
20.1%
1,021
215 21.1%
847 202
23.8%
Suffolk High School Graduates Grads attending TCC Percent attending TCC
913 174
19.1%
929 108
11.6%
944 121
12.8%
952 173
18.2%
943 155
16.4%
943 155
16.4%
Virginia Beach High School Graduates Grads attending TCC Percent attending TCC
5,234 1,225 23.4%
5,312 1,130 21.3%
5,276 1,194 22.6%
5,297 1,119 21.1%
5,031 1,018 20.3%
5,009
952 19.0%
Total High School Graduates Grads attending TCC Percent attending TCC
12,065
2,596 21.5%
12,278
2,440 19.9%
12,439
2,644 21.3%
12,342
2,515 20.4%
12,060
2,350 19.5%
11,594
2,256 19.5%
13

CC HH EE SS AA PP EE AA KK EE CC AA MM PP UU SS
Located on sixty-nine acres off Cedar Road between Great Bridge and Deep Creek, the Chesapeake Campus was
established in 1973 when the City of Chesapeake purchased the former Chesapeake College. The George W. Pass
building houses academic programs, administration, student services, and the Library. The Marian P. Whitehurst
Technology Center, contains classrooms, laboratories, and a conference center. The Regional Automotive
Technology Center opened for classes in fall 2008 with nine classrooms, fifteen 20-foot-high bays – one designed
for an 18 wheeler – and the latest in instructional equipment. Additionally, a new 60,000 square-foot, state-of-
the-art academic building and a new student center opened during the 2013-14 academic year.
10-Year Historical Student Profi le 1
Category
Prof i le*
200 4-05 2009 -10 2014 -15
Annual Headcount
Annua l FTES
8,720
2,405
15,755
4,449
13,455
3,712
Ful l -Time
Part -Time
38%
62%
42%
58%
40%
60%
New
Return ing
Transfer
17%
75%
8%
20%
70%
10%
16%
75%
9%
Col lege Transfer
Career/Techn ical
Unclass i f ied
57%
27%
16%
45%
42%
13%
45%
45%
10%
Male
Female
36%
64%
37%
63%
42%
58%
White
Afr ican Amer ican
Other
66%
25%
8%
58%
31%
11%
61%
30%
9%
Day
Evening
On l ine
70%
16%
14%
69%
12%
19%
66%
12%
22%
Financia l A id 30% 46% 55%
17 or younger
18-24 years
25-34 years
35 or o lder
1%
49%
25%
25%
3%
50%
26%
21%
2%
46%
29%
23%
Average Age 28 28 28
*Except where noted, data reflect fall enrollment.
1 Percentages may not add up to 100% due to rounding.
14
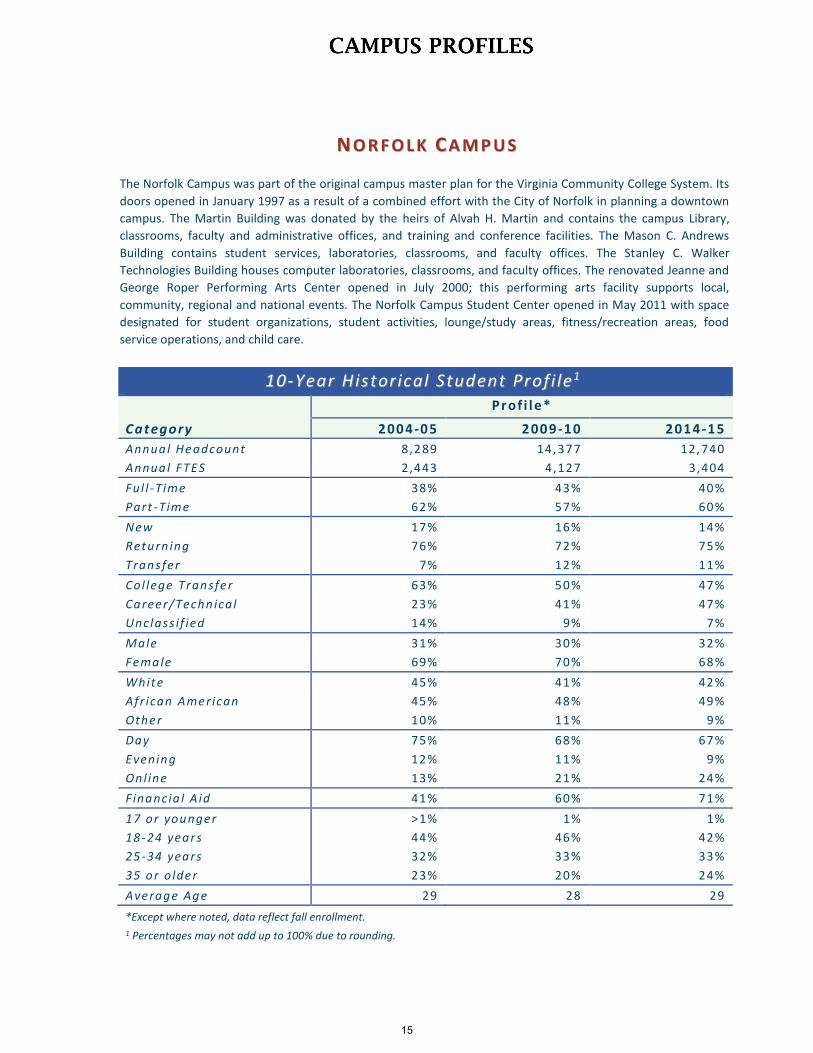
NN OO RR FF OO LL KK CC AA MM PP UU SS
The Norfolk Campus was part of the original campus master plan for the Virginia Community College System. Its
doors opened in January 1997 as a result of a combined effort with the City of Norfolk in planning a downtown
campus. The Martin Building was donated by the heirs of Alvah H. Martin and contains the campus Library,
classrooms, faculty and administrative offices, and training and conference facilities. The Mason C. Andrews
Building contains student services, laboratories, classrooms, and faculty offices. The Stanley C. Walker
Technologies Building houses computer laboratories, classrooms, and faculty offices. The renovated Jeanne and
George Roper Performing Arts Center opened in July 2000; this performing arts facility supports local,
community, regional and national events. The Norfolk Campus Student Center opened in May 2011 with space
designated for student organizations, student activities, lounge/study areas, fitness/recreation areas, food
service operations, and child care.
11 00 -- YY ee aa rr HH ii ss tt oo rr ii cc aa ll SS tt uu dd ee nn tt PP rr oo ff ii ll ee 11
Category
Prof i le*
200 4-05 2009 -10 2014 -15
Annual Headcount
Annua l FTES
8,289
2,443
14,377
4,127
12,740
3,404
Ful l -Time
Part -Time
38%
62%
43%
57%
40%
60%
New
Return ing
Transfer
17%
76%
7%
16%
72%
12%
14%
75%
11%
Col lege Transfer
Career/Techn ical
Unclass i f ied
63%
23%
14%
50%
41%
9%
47%
47%
7%
Male
Female
31%
69%
30%
70%
32%
68%
White
Afr ican Amer ican
Other
45%
45%
10%
41%
48%
11%
42%
49%
9%
Day
Evening
On l ine
75%
12%
13%
68%
11%
21%
67%
9%
24%
Financia l A id 41% 60% 71%
17 or younger
18-24 years
25-34 years
35 or o lder
>1%
44%
32%
23%
1%
46%
33%
20%
1%
42%
33%
24%
Average Age 29 28 29
*Except where noted, data reflect fall enrollment.
1 Percentages may not add up to 100% due to rounding.
15

PP OO RR TT SS MM OO UU TT HH CC AA MM PP UU SS
The new Fred W. Beazley Portsmouth Campus opened for classes in spring 2010 and is located in the Victory
Village area of Portsmouth on 35 acres near Interstate 264 and Victory Boulevard. Totaling 183,000 square
feet, four buildings house academic programs, administrative offices, student services, and a physical plant. In
2013-14, a new student center opened on the campus. The new Portsmouth Campus replaces TCC’s founding
campus, which opened in 1968 when the Beazley Foundation donated the former Frederick College in
northern Suffolk and $1 million to the Commonwealth of Virginia to establish a community college to serve
South Hampton Roads.
11 00 -- YY ee aa rr HH ii ss tt oo rr ii cc aa ll SS tt uu dd ee nn tt PP rr oo ff ii ll ee 11
Category
Prof i le*
200 4-05 2009 -10 2014 -15
Annual Headcount
Annua l FTES
9,302
2,836
11,118
3,504
10,956
3,556
Ful l -Time
Part -Time
31%
69%
44%
56%
44%
56%
New
Return ing
Transfer
24%
70%
6%
19%
71%
10%
18%
74%
9%
Col lege Transfer
Career/Techn ical
Unclass i f ied
39%
34%
27%
40%
49%
11%
39%
53%
8%
Male
Female
45%
55%
38%
62%
38%
62%
White
Afr ican Amer ican
Other
55%
36%
8%
49%
41%
10%
48%
45%
7%
Day
Evening
On l ine
85%
12%
3%
77%
12%
11%
76%
10%
14%
Financia l A id 26% 50% 64%
17 or younger
18-24 years
25-34 years
35 or o lder
2%
45%
29%
24%
2%
48%
29%
20%
3%
46%
27%
24%
Average Age 29 28 29
*Except where noted, data reflect fall enrollment.
1 Percentages may not add up to 100% due to rounding.
16

VV II RR GG II NN II AA BB EE AA CC HH CC AA MM PP UU SS
The campus was established in temporary quarters on Camp Pendleton, a state military reservation, in 1971. It opened in fall of 1974 as a permanent campus, constructed on 115 acres off Princess Anne Road. Each of the buildings is named for a borough of Virginia Beach – Princess Anne, Bayside, Blackwater, Kempsville, Pungo, Lynnhaven and Virginia Beach. The Advanced Technology Center (ATC) opened at the end of 2002; it is a cooperative venture and partnership between the City of Virginia Beach, The Virginia Beach Public Schools, and TCC. The Science Building, opened in spring 2008, is a 70,000 square-foot building featuring a 90-seat planetarium, an outside “living laboratory”, an oceanography lab with a 30-foot wave tank, anatomy and physiology labs, a greenhouse, and a observatory. In 2011, the Regional Health Professions Center opened—a 65,000 square-foot facility providing clinical learning in simulated medical settings. In 2013-14, a $43 million Joint-Use Library, funded by both TCC and the City of Virginia Beach, opened on the campus, and the largest of four campus student centers opened as well.
11 00 -- YY ee aa rr HH ii ss tt oo rr ii cc aa ll SS tt uu dd ee nn tt PP rr oo ff ii ll ee 11
Category
Prof i le*
200 4-05 2009 -10 2014 -15
Annual Headcount
Annua l FTES
20,006
7,396
24,820
9,428
21,960
8,002
Ful l -Time
Part -Time
37%
63%
43%
57%
41%
59%
New
Return ing
Transfer
19%
74%
7%
21%
70%
9%
18%
74%
9%
Col lege Transfer
Career/Techn ical
Unclass i f ied
58%
25%
17%
52%
37%
11%
48%
42%
10%
Male
Female
40%
60%
41%
59%
42%
58%
White
Afr ican Amer ican
Other
63%
22%
15%
58%
25%
17%
61%
25%
14%
Day
Evening
On l ine
81%
14%
5%
78%
12%
10%
79%
10%
11%
Financia l A id 28% 44% 54%
17 or younger
18-24 years
25-34 years
35 or o lder
2%
50%
26%
22%
2%
52%
27%
19%
2%
48%
29%
21%
Average Age 28 27 28
*Except where noted, data reflect fall enrollment. 1 Percentages may not add up to 100% due to rounding.
17

GG RR AA DD UU AA TT EE PP RR OO FF II LL EE
22 00 11 55 Male
Female
1,589
2,212
42%
58%
White
Afr ican Amer ican
Other
2,248
1,178
375
59%
31%
10%
21 and under
22-29
30-44
45+ above
862
1,422
1,041
476
23%
37%
27%
13%
AA/AS *
AAA/AAS *
Cert i f icate/Dip loma/CSC *
1,716
1,178
1,358
45%
31%
36%
Tota l 3,801
* Graduates may have more than one award.
TT OO PP 11 00 TT RR AA NN SS FF EE RR II NN SS TT II TT UU TT II OO NN SS FF OO RR CC OO LL LL EE GG EE
TT rr aa nn ss ff ee rr DD ee gg rr ee ee GG rr aa dd uu aa tt ee ss
22 00 11 33 –– 22 00 11 44
I n s t i t u t i o n N u m b e r o f T r a n s f e r s
% o f T r a n s f e r D e g r e e G r a d u a t e s 1
Old Domin ion Un iversi ty 603 56%
Norfolk State Uni versity 73 7%
Regent Univers ity 48 5%
Virg in ia Commonwealth University
46 4%
Virg in ia Wesleyan Col lege 38 4%
James Madison Un iversi ty 23 2%
Saint Leo University 22 2%
George Mason Univers ity 18 2%
University o f Vi rg in ia 16 2%
Col lege of Wil l iam and Mary 15 1%
1 Percent of 2013-14 transfer degree graduates who initially enrolled in each institution.
18

GG RR AA DD UU AA TT EE AA WW AA RR DD SS BB YY CC UU RR RR II CC UU LL UU MM
FF II VV EE –– YY EE AA RR AA VV EE RR AA GG EE
22 00 11 11 –– 22 00 11 55
A W A R D S
C U R R I C U L U M 2 0 1 1 2 0 1 2 2 0 1 3 2 0 1 4 2 0 1 5 5 Y E A R
A V ER A G E
ASSOCIATE IN ARTS (A.A.)
648 Liberal Arts 99 99 88 69 70 85.0
ASSOCIATE IN SCIENCE (A.S.)
213 Business Administration 389 399 354 303 302 349.4
831 Engineering 59 79 82 71 89 76.0
699 General Studies 193 160 130 100 110 138.6
880 Science 314 309 348 326 351 329.6
8821 Social Sciences 694 894 926 860 794 824.6
ASSOCIATE IN APPLIED ARTS (A.A.A.)
532 Studio Arts 26 32 21 35 42 31.2
ASSOCIATE IN APPLIED SCIENCE (A.A.S.)
203 Accounting 47 48 47 41 33 43.2
2982 Admin Support Technology 37 49 56 77 81 60.0
400 Administration of Justice 55 102 108 108 85 91.6
640 ASL-English Interpretation 0 0 2 3 1 1.2
909 Automotive Technology 18 27 28 44 31 29.6
915 Civil Engineering Tech 15 11 13 7 12 11.6
7293 Computer Aided Drafting and Design Technology
28 25 24 17 19 22.6
242 Culinary Arts 11 27 34 27 43 28.4
109 Diagnostic Medical Sonography
12 13 16 14 12 13.4
636 Early Childhood Dev’t 66 70 62 65 60 64.6
981 Electronics Technology 13 18 10 21 22 16.8
146 Emergency Medical Services 27 25 29 34 40 31.0
427 Fire Science Technology 30 13 17 19 21 20.0
155 Funeral Services 14 13 16 25 15 16.6
19
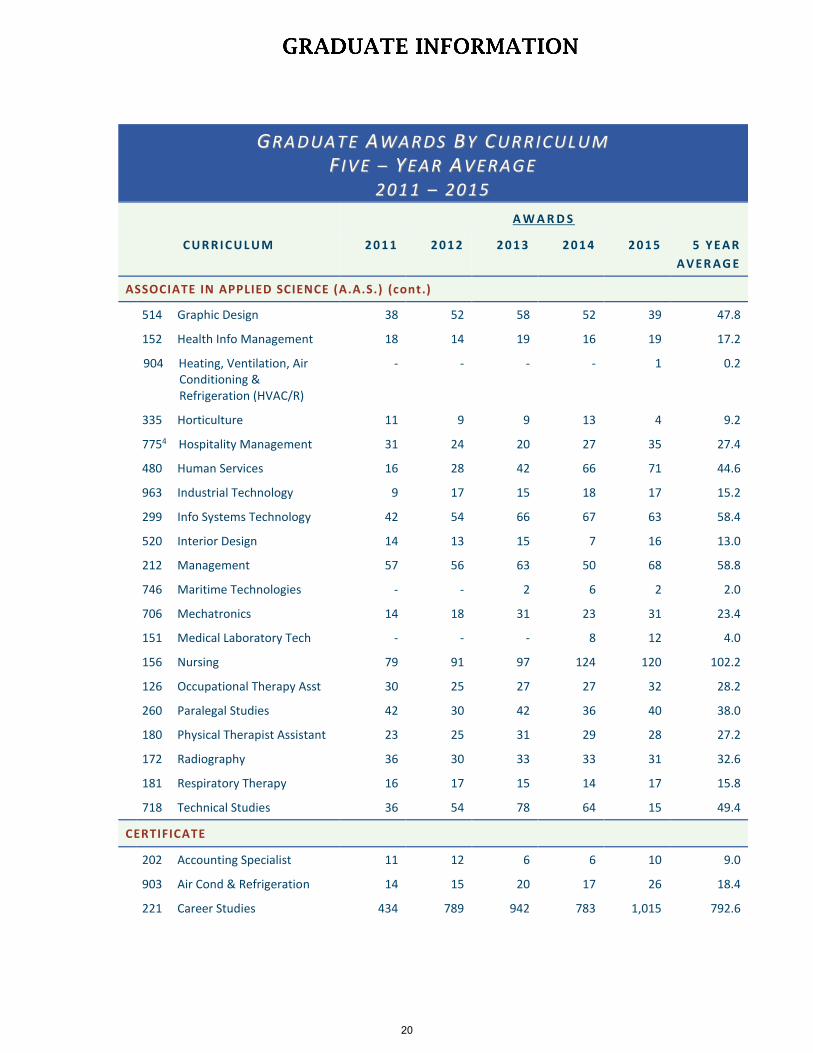
GG RR AA DD UU AA TT EE AA WW AA RR DD SS BB YY CC UU RR RR II CC UU LL UU MM
FF II VV EE –– YY EE AA RR AA VV EE RR AA GG EE
22 00 11 11 –– 22 00 11 55
A W A R D S
C U R R I C U L U M 2 0 1 1 2 0 1 2 2 0 1 3 2 0 1 4 2 0 1 5 5 Y E A R
A V ER A G E
ASSOCIATE IN APPLIED SCIENCE (A.A.S.) (cont.)
514 Graphic Design 38 52 58 52 39 47.8
152 Health Info Management 18 14 19 16 19 17.2
904 Heating, Ventilation, Air Conditioning & Refrigeration (HVAC/R)
- - - - 1 0.2
335 Horticulture 11 9 9 13 4 9.2
7754 Hospitality Management 31 24 20 27 35 27.4
480 Human Services 16 28 42 66 71 44.6
963 Industrial Technology 9 17 15 18 17 15.2
299 Info Systems Technology 42 54 66 67 63 58.4
520 Interior Design 14 13 15 7 16 13.0
212 Management 57 56 63 50 68 58.8
746 Maritime Technologies - - 2 6 2 2.0
706 Mechatronics 14 18 31 23 31 23.4
151 Medical Laboratory Tech - - - 8 12 4.0
156 Nursing 79 91 97 124 120 102.2
126 Occupational Therapy Asst 30 25 27 27 32 28.2
260 Paralegal Studies 42 30 42 36 40 38.0
180 Physical Therapist Assistant 23 25 31 29 28 27.2
172 Radiography 36 30 33 33 31 32.6
181 Respiratory Therapy 16 17 15 14 17 15.8
718 Technical Studies 36 54 78 64 15 49.4
CERTIFICATE
202 Accounting Specialist 11 12 6 6 10 9.0
903 Air Cond & Refrigeration 14 15 20 17 26 18.4
221 Career Studies 434 789 942 783 1,015 792.6
20

GG RR AA DD UU AA TT EE AA WW AA RR DD SS BB YY CC UU RR RR II CC UU LL UU MM
FF II VV EE –– YY EE AA RR AA VV EE RR AA GG EE
22 00 11 11 –– 22 00 11 55
A W A R D S
C U R R I C U L U M 2 0 1 1 2 0 1 2 2 0 1 3 2 0 1 4 2 0 1 5 5 Y E A R
A V ER A G E
CERTIFICATE (cont.)
727 Computer Aided Drafting & Design Tech
5 7 8 9 13 8.4
632 Early Childhood Instruction 32 28 27 31 23 28.2
942 Electrical Wiring 7 4 11 8 15 9.0
943 Electronics Engineering Tech 2 7 5 5 9 5.6
695 General Education 374 87 210 234 216 186.8
190 Health Sciences 6 4 2 3 1 3.2
200 Information System Tech 2 3 2 2 8 3.4
261 Legal Assistant 8 7 11 9 7 8.4
166 Medical Assisting 12 13 24 2 1 10.4
995 Welding 15 11 13 17 14 14.0
Notes:
* Graduates may have more than 1 award; includes only curricula that are currently active. 1 Replaced 625-Education 2 Replaced 294-Office System Tech 3 Replaced 921-Draft/Design 4 Replaced 235-HRI Management
21
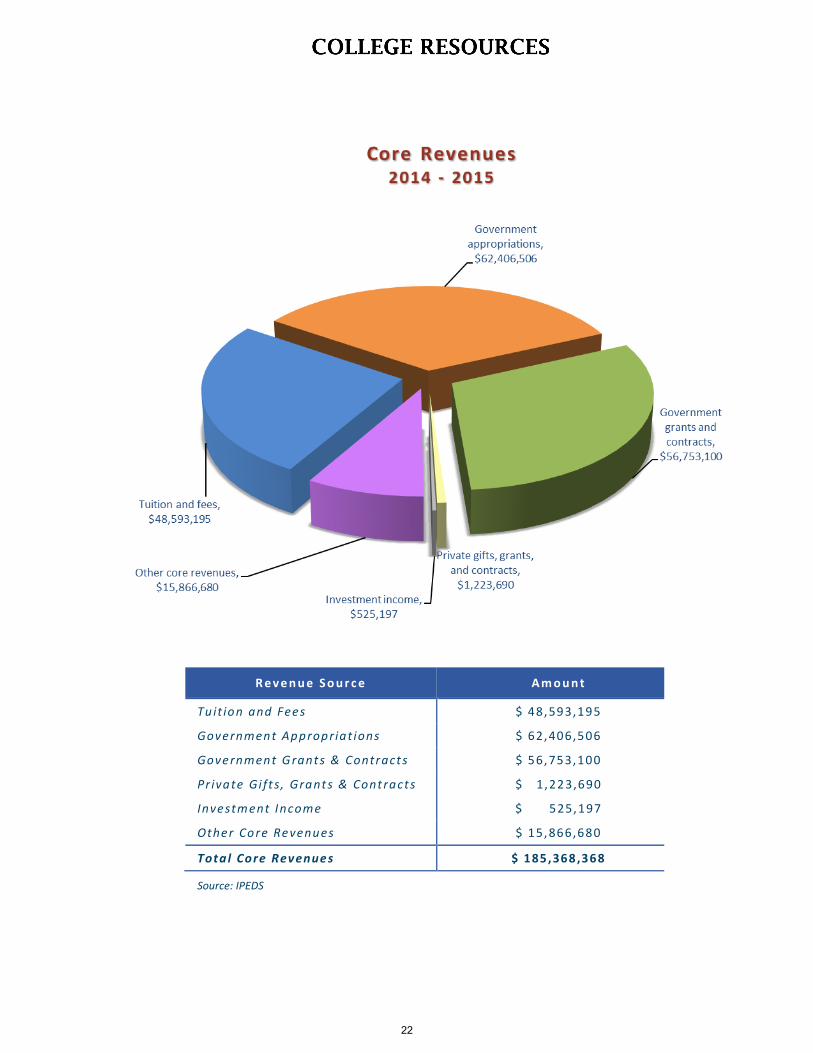
R e v e n u e S o u r c e A m o u n t
Tu it ion and Fees $ 48,593,195
Government Appropriat ions $ 62,406,506
Government G rants & Contracts $ 56,753,100
Pr ivate Gi ft s , Grants & Contracts $ 1,223,690
Investment Income $ 525,197
Other Core Revenues $ 15,866,680
Tota l Core Revenues $ 185,368,368
Source: IPEDS
22
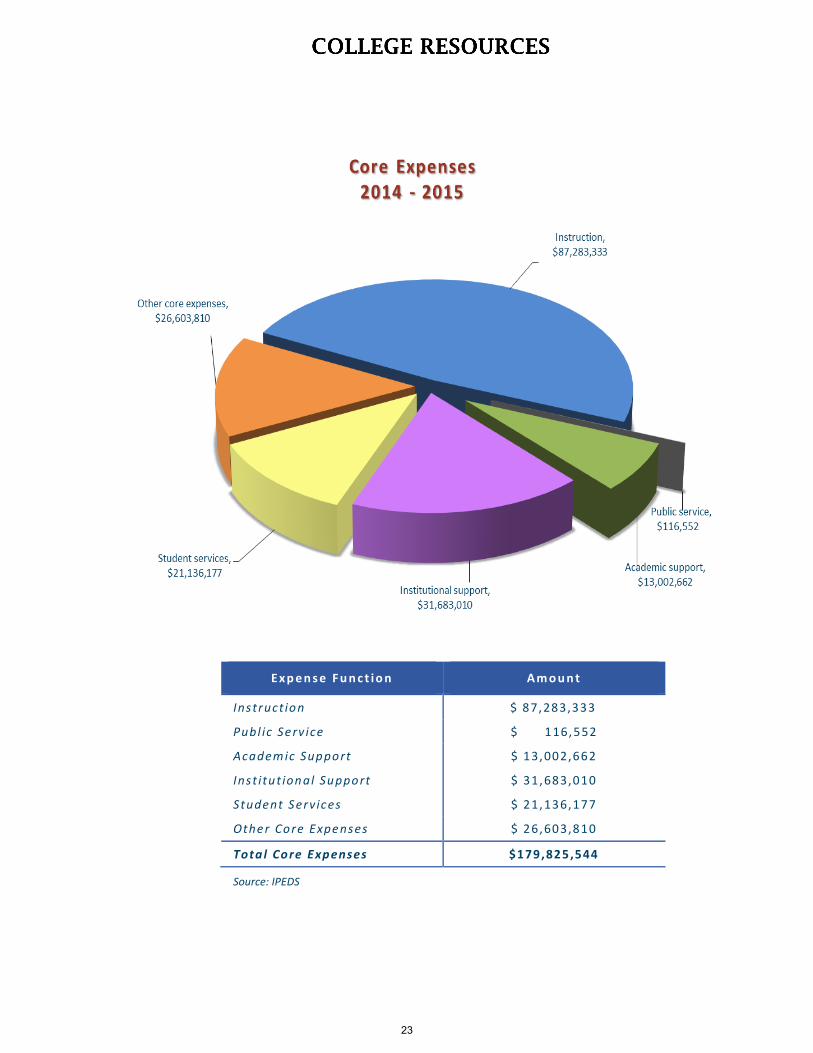
Ex p e n s e F u n c t i o n A m o u n t
Instruct ion $ 87,283,333
Publ ic Serv ice $ 116,552
Academic Support $ 13,002,662
Inst itut ional Support $ 31,683,010
Student Services $ 21,136,177
Other Core Expenses $ 26,603,810
Tota l Core Expenses $179,825,544
Source: IPEDS
23

C A M P U S P R O F ES S I O N A L A D M I N I S T R A T I V E F A C U L T Y C L A S S I F I E D
Chesapeake 7 5 69 47
Portsmouth 10 6 77 57
Virg in ia Beach 22 13 155 104
Norfolk 7 4 52 40
Dist r ic t 3 34 0 185
Tota l 49 62 353 430
Note: Excludes College President
Source: Office of Human Resources
24

FF UU LL LL -- TT II MM EE FF AA CC UU LL TT YY BB YY RR AA NN KK ,, GG EE NN DD EE RR && RR AA CC EE
FF AA LL LL 22 00 11 44
M a l e F e m a l e A v e r a g e
S a l a r y W h i t e N o n - W h i t e W h i t e N o n - W h i t e
P r o f e s s o r 4 5 4 2 6 4 $ 6 9 , 4 8 8
A s s o c i a t e P r o f e s s o r 4 0 2 3 3 1 4 $ 6 3 , 7 1 3
A s s i s t a n t P r o f e s s o r 3 2 5 3 6 1 1 $ 5 5 , 0 9 1
I n s t r u c t o r 2 5 6 3 8 6 $ 4 9 , 5 0 7
L e c t u r e 1 1 1 1 $ 3 8 , 4 9 6
T o t a l 1 4 3 1 8 1 3 4 3 6 $ 5 5 , 2 5 9
Source: Office of Human Resources
AA DD MM II NN II SS TT RR AA TT II VV EE // PP RR OO FF EE SS SS II OO NN AA LL FF AA CC UU LL TT YY
BB YY RR AA NN KK ,, GG EE NN DD EE RR && RR AA CC EE
FF AA LL LL 22 00 11 44
M a l e F e m a l e A v e r a g e S a l a r y W h i t e N o n - W h i t e W h i t e N o n - W h i t e
P r o f e s s o r 9 1 5 4 $ 1 0 9 , 5 7 2
A s s o c i a t e P r o f e s s o r 5 2 9 4 $ 8 8 , 7 8 0
A s s i s t a n t P r o f e s s o r 1 0 2 9 6 $ 8 7 , 6 6 3
I n s t r u c t o r 4 4 2 4 1 5 $ 7 0 , 3 4 2
T o t a l 2 8 9 4 7 2 9 $ 8 9 , 0 8 9
Source: Office of Human Resources
25
26

TT EE NN -- YY EE AA RR SS EE MM EE SS TT EE RR EE NN RR OO LL LL MM EE NN TT HH II SS TT OO RR YY HH ee aa dd cc oo uu nn tt aa nn dd FF TT EE SS
22 00 00 55 -- 00 66 tt oo 22 00 11 44 -- 11 55
Summer Fal l Spring
2005-2006
Headcount
Semester FTES
12,951
4,676
23,718
13,403
23,648
13,146
2006-2007
Headcount
Semester FTES
13,078
4,743
24,938
14,294
24,350
13,584
2007-2008
Headcount
Semester FTES
13,586
4,934
25,857
15,022
25,312
14,425
2008-2009
Headcount
Semester FTES
14,399
5,193
26,898
15,709
27,124
15,721
2009-2010
Headcount
Semester FTES
15,245
5,618
30,447
18,512
31,422
18,885
2010-2011
Headcount
Semester FTES
16,839
6,739
31,308
19,353
31,942
19,312
2011-2012
Headcount
Semester FTES
18,187
7,240
32,101
20,013
32,169
19,007
2012-2013
Headcount
Semester FTES
15,836
6,268
30,134
18,474
28,642
17,207
2013-2014
Headcount
Semester FTES
14,777
5,773
28,999
17,755
27,392
16,585
2014-2015
Headcount
Semester FTES
13,118
5,023
27,646
16,737
26,082
15,587
27
28
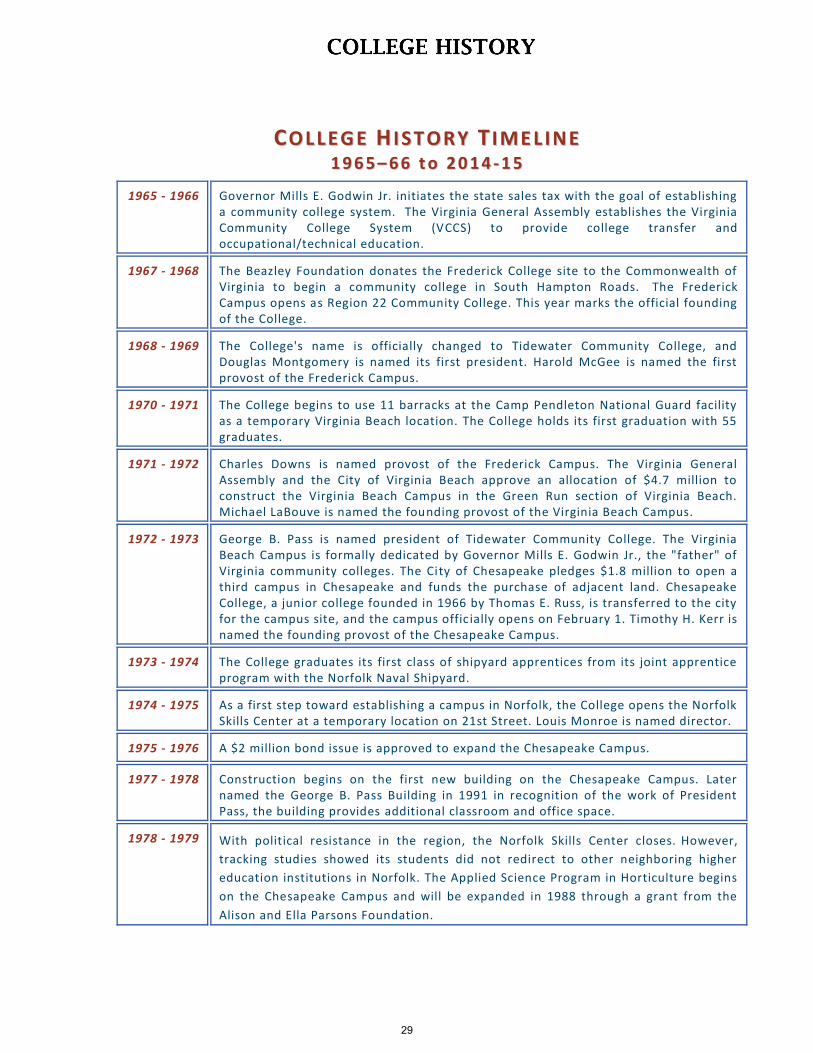
CC OO LL LL EE GG EE HH II SS TT OO RR YY TT II MM EE LL II NN EE
11 99 66 55 –– 66 66 tt oo 22 00 11 44 -- 11 55
1965 - 1966 Governor Mills E. Godwin Jr. initiates the state sales tax with the goal of establishing a community college system. The Virginia General Assembly establishes the Virginia Community College System (VCCS) to provide college transfer and occupational/technical education.
1967 - 1968 The Beazley Foundation donates the Frederick College site to the Commonwealth of Virginia to begin a community college in South Hampton Roads. The Frederick Campus opens as Region 22 Community College. This year marks the official founding of the College.
1968 - 1969 The College's name is officially changed to Tidewater Community College, and Douglas Montgomery is named its first president. Harold McGee is named the first provost of the Frederick Campus.
1970 - 1971 The College begins to use 11 barracks at the Camp Pendleton National Guard facility as a temporary Virginia Beach location. The College holds its first graduation with 55 graduates.
1971 - 1972 Charles Downs is named provost of the Frederick Campus. The Virginia General Assembly and the City of Virginia Beach approve an allocation of $4.7 million to construct the Virginia Beach Campus in the Green Run section of Virginia Beach. Michael LaBouve is named the founding provost of the Virginia Beach Campus.
1972 - 1973 George B. Pass is named president of Tidewater Community College. The Virginia Beach Campus is formally dedicated by Governor Mills E. Godwin Jr., the "father" of Virginia community colleges. The City of Chesapeake pledges $1.8 million to open a third campus in Chesapeake and funds the purchase of adjacent land. Chesapeake College, a junior college founded in 1966 by Thomas E. Russ, is transferred to the city for the campus site, and the campus offic ially opens on February 1. Timothy H. Kerr is named the founding provost of the Chesapeake Campus.
1973 - 1974 The College graduates its first class of shipyard apprentices from its joint apprentice program with the Norfolk Naval Shipyard.
1974 - 1975 As a first step toward establishing a campus in Norfolk, the College opens the Norfolk Skills Center at a temporary location on 21st Street. Louis Monroe is named director.
1975 - 1976 A $2 million bond issue is approved to expand the Chesapeake Campus.
1977 - 1978 Construction begins on the first new building on the Chesapeake Campus. Later named the George B. Pass Building in 1991 in recognition of the work of President Pass, the building provides additional classroom and office space.
1978 - 1979 With political resistance in the region, the Norfolk Skills Center closes. However,
tracking studies showed its students did not redirect to other neighboring higher
education institutions in Norfolk. The Applied Science Program in Horticulture begins
on the Chesapeake Campus and will be expanded in 1988 through a grant from the
Alison and Ella Parsons Foundation.
29

1979 - 1980 Governor John Dalton dedicates the new classroom building at the Chesapeake Campus. The Grammar Hotline, which quickly rises to national recognition, is established on the Virginia Beach Campus.
1980 - 1981 James C. Sears is named provost of the Frederick Campus. Tidewater Community College, through the Virginia Tidewater Consortium, begins offering college telecourses on Cox cable television. A $6.2 million, three-phase construction project at the Frederick Campus is completed.
1981 - 1982 Groundbreaking begins on the Pungo Building at the Virginia Beach Campus. The building will house humanities classes, including art and drama programs .
1983 - 1984 The Chesapeake Campus opens the region's first robotics lab, and the Frederick Campus initiates a $126,000 computer-aided drafting program.
1984 - 1985 Deborah M. DiCroce is named provost of the Frederick Campus.
1985 - 1986 Gov. Gerald L. Baliles dedicates the Pungo Building at the Virginia Beach Campus. A two-year decline in enrollment mandates the first TCC reduction in force.
1986 - 1987 The Frederick Campus is renamed the Frederick W. Beazley Portsmouth Campus to better reflect its ties to the city. TCC's international education program is established, the first among community colleges in Virginia. The first Aids Awareness Seminar is taught at the Portsmouth Campus.
1987 - 1988 As a part of the VCCS, Tidewater Community College con verts from the quarter system to the semester system.
1988 - 1989 Belle S. Wheelan is named provost of the Portsmouth Campus. The Norfolk City Council endorses the establishment of a TCC campus in Norfolk.
1989 - 1990 The Norfolk Center opens in downtown Norfolk.
1990 - 1991 Former President George B. Pass dies. Larry L. Whitworth is named the third president of TCC.
1991 - 1992 Samuel H. Lamb is named provost of the Portsmouth Campus. John Massey is named director of development for the Norfolk Campus.
1992 - 1993 The Women's Center is established on the Portsmouth Campus to promote economic self-sufficiency for women. Within three years, it evolves from a single campus to a college-wide entity with offices on all four campuses.
1993 - 1994 With start-up costs funded by the Virginia General Assembly and a substantial contribution by the City of Norfolk, construction begins on the Norfolk Campus. TCC begins offering on-line, distance learning. Construction begins on the Chesapeake Campus Marian P. Whitehurst Technology building with funding provided through the state's General Obligation Bond for Higher Education.
1994 - 1995 The Visual Arts Center opens in the old Famous department store building in Olde Towne Portsmouth with Anne Lott serving as the founding director.
1995 - 1996 Michael LaBouve dies unexpectedly, and E.T. (Joe) Buchanan is named provost of the Virginia Beach Campus.
30
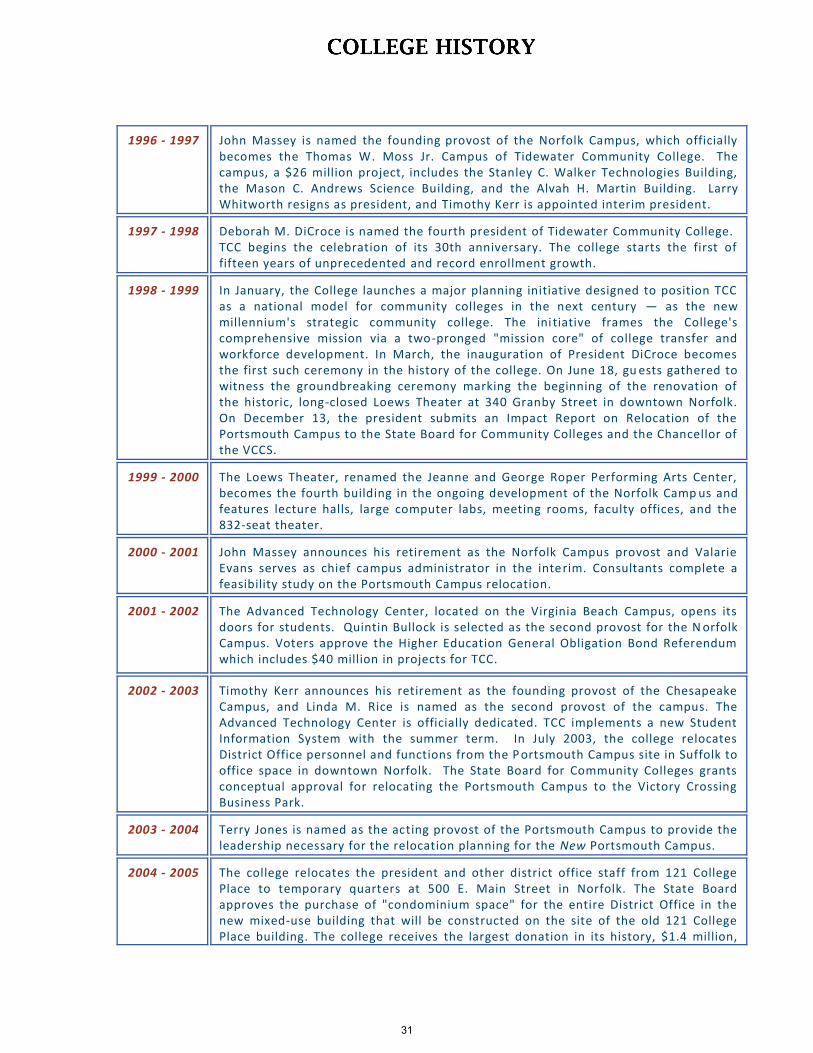
1996 - 1997 John Massey is named the founding provost of the Norfolk Campus, which officially becomes the Thomas W. Moss Jr. Campus of Tidewater Community College. The campus, a $26 million project, includes the Stanley C. Walker Technologies Building, the Mason C. Andrews Science Building, and the Alvah H. Martin Building. Larry Whitworth resigns as president, and Timothy Kerr is appointed interim president.
1997 - 1998 Deborah M. DiCroce is named the fourth president of Tidewater Community College. TCC begins the celebration of its 30th anniversary. The college starts the first of fifteen years of unprecedented and record enrollment growth.
1998 - 1999 In January, the College launches a major planning initiative designed to position TCC as a national model for community colleges in the next century — as the new millennium's strategic community college. The ini tiative frames the College's comprehensive mission via a two-pronged "mission core" of college transfer and workforce development. In March, the inauguration of President DiCroce becomes the first such ceremony in the history of the college. On June 18, gu ests gathered to witness the groundbreaking ceremony marking the beginning of the renovation of the historic, long-closed Loews Theater at 340 Granby Street in downtown Norfolk. On December 13, the president submits an Impact Report on Relocation of the Portsmouth Campus to the State Board for Community Colleges and the Chancellor of the VCCS.
1999 - 2000 The Loews Theater, renamed the Jeanne and George Roper Performing Arts Center, becomes the fourth building in the ongoing development of the Norfolk Camp us and features lecture halls, large computer labs, meeting rooms, faculty offices, and the 832-seat theater.
2000 - 2001 John Massey announces his retirement as the Norfolk Campus provost and Valarie Evans serves as chief campus administrator in the interim. Consultants complete a feasibility study on the Portsmouth Campus relocation.
2001 - 2002 The Advanced Technology Center, located on the Virginia Beach Campus, opens its doors for students. Quintin Bullock is selected as the second provost for the N orfolk Campus. Voters approve the Higher Education General Obligation Bond Referendum which includes $40 million in projects for TCC.
2002 - 2003 Timothy Kerr announces his retirement as the founding provost of the Chesapeake Campus, and Linda M. Rice is named as the second provost of the campus. The Advanced Technology Center is officially dedicated. TCC implements a new Student Information System with the summer term. In July 2003, the college relocates District Office personnel and functions from the P ortsmouth Campus site in Suffolk to office space in downtown Norfolk. The State Board for Community Colleges grants conceptual approval for relocating the Portsmouth Campus to the Victory Crossing Business Park.
2003 - 2004 Terry Jones is named as the acting provost of the Portsmouth Campus to provide the leadership necessary for the relocation planning for the New Portsmouth Campus.
2004 - 2005 The college relocates the president and other district office staff from 121 College Place to temporary quarters at 500 E. Main Street in Norfolk. The State Board approves the purchase of "condominium space" for the entire District Office in the new mixed-use building that will be constructed on the site of the old 121 College Place building. The college receives the largest donation in its history, $1.4 million,
31

from the Beazley Foundation to help establish the Beazley School of Nursing on the New Portsmouth Campus. Terry Jones is named provost of the Portsmouth Campus.
2005 - 2006 Joe Buchanan retires as provost of the Virginia Beach Campus and Quintin Bullock moves from the provost position in Norfolk to assume the provost position of the Virginia Beach Campus. Alex Kajstura is named as the new provost of the Norfolk Campus.
2006 - 2007 The State Board for Community Colleges approves the TCC Business Plan for four student centers. TCC partners with Barnes and Noble College Booksellers Inc. to create a two-story academic superstore at MacArthur Center in downtown Norfolk, a permanent satellite bookstore at the Virginia Beach Campus, and on-campus distribution centers and kiosks at the Chesapeake and Portsmouth campuses.
2007 - 2008 The TCC district office staff move to their new offices in the District Administration Building located in Downtown Norfolk — the first time in the college's history that all TCC district offices are housed under the same roof. The TCC Regional Automotive Center, located in the Oakbrooke Business and Technology Center, opens for classes in fall 2008. Construction begins for the New Portsmouth Campus. The Science Building opens in spring 2008 on the Virginia Beach Campus.
2008 - 2009 Michael Summers is named provost of the Virginia Beach Campus. The College breaks ground in Norfolk for the first of four Student Centers. Dedications ar e held for the Regional Automotive Center and the Green District Administration Building.
2009 - 2010 The New Portsmouth Campus opens for classes in January 2010, relocating from its original site in Suffolk. The college experiences the largest one -year enrollment increase in its history—with all campuses reporting double digit increases — and serves over 45,000 students.
2010 - 2011 The first of four student centers opens on the Norfolk Campus with space designated for student organizations, student act ivities, lounge/study areas, fitness/recreation areas, food service operations and child minding. Student services are enhanced with an inter-campus shuttle service, a textbook rental program, and the implementation of the “StormCard” for use with various auxiliary services such as vending, child minding, and the bookstore.
2011 - 2012 Deborah M. DiCroce retires as president of Tidewater Community College in February 2012, and Peter A. Spina is appointed interim president. Edna B. Baehre -Kolovani is named the fifth president of TCC in July 2012. Marvin L. Bright is named provost of the Norfolk Campus, and Michelle W. Woodhouse is named provost of the Portsmouth Campus. The Regional Health Professions Center, located on the Virginia Beach Campus, opens and is dedicated in January 2012.
2012 - 2013 Linda Rice retires as provost of the Chesapeake Campus in February 2013, and Greg Frank is named interim provost. The Center for Military and Veterans Education (CMVE), located on the Virginia Beach Campus, is dedi cated in November 2012. The CMVE provides a centralized and comprehensive clearing house for academic and student support services for the 14,000-plus military-related students at TCC.
2013 - 2014 Marvin Bright resigns as provost of the Norfolk Campus, and Michelle Woodhouse assumes interim leadership at the campus in addition to her Portsmouth provost duties. Lisa B. Rhine is named the third provost of the Chesapeake Campus. In
32
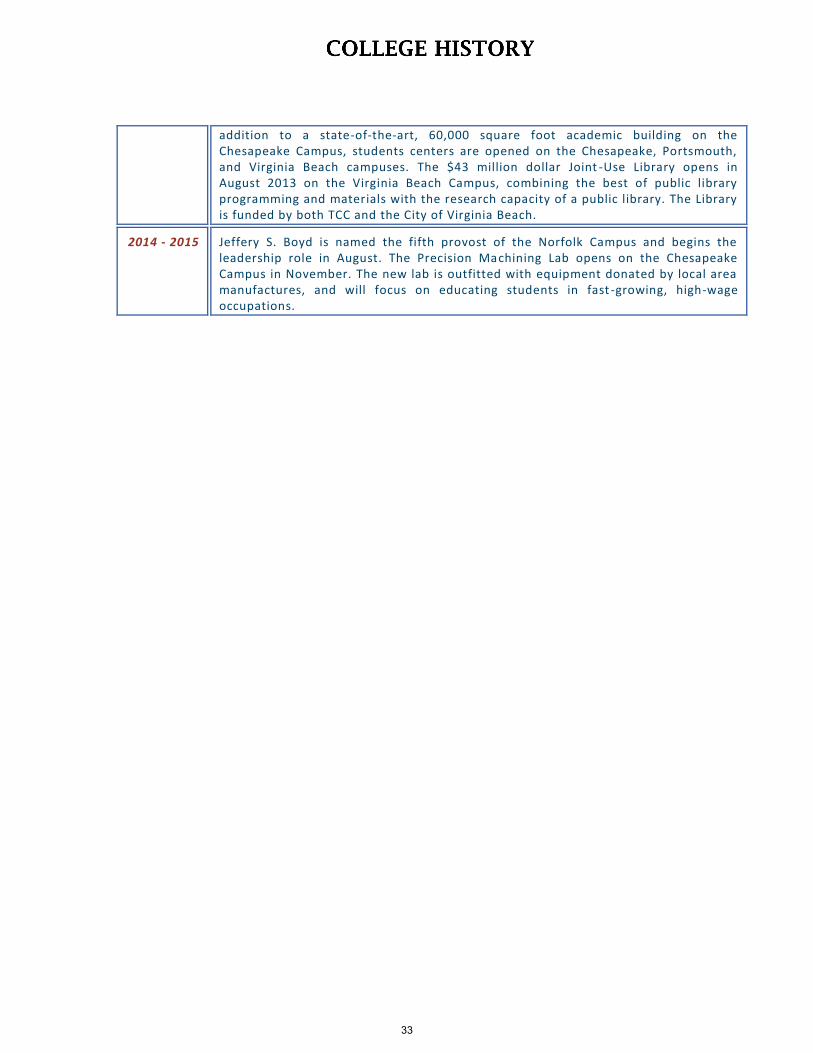
addition to a state-of-the-art, 60,000 square foot academic building on the Chesapeake Campus, students centers are opened on the Chesapeake, Portsmouth, and Virginia Beach campuses. The $43 million dollar Joint -Use Library opens in August 2013 on the Virginia Beach Campus, combining the best of public library programming and materials with the research capacity of a public library. The Library is funded by both TCC and the City of Virginia Beach.
2014 - 2015 Jeffery S. Boyd is named the fifth provost of the Norfolk Campus and begins the leadership role in August. The Precision Machining Lab opens on the Chesapeake Campus in November. The new lab is outfitted with equipment donated by local area manufactures, and will focus on educating students in fast -growing, high-wage occupations.
33
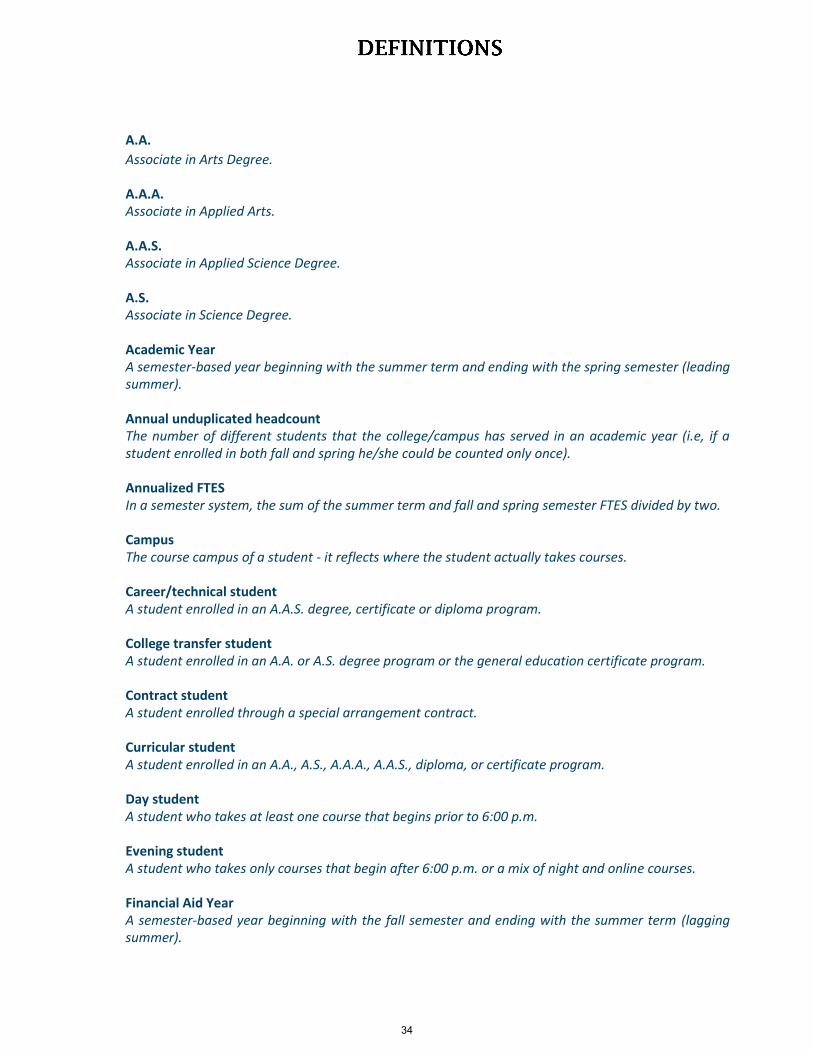
A.A.
Associate in Arts Degree. A.A.A. Associate in Applied Arts. A.A.S. Associate in Applied Science Degree. A.S. Associate in Science Degree. Academic Year A semester-based year beginning with the summer term and ending with the spring semester (leading summer). Annual unduplicated headcount The number of different students that the college/campus has served in an academic year (i.e, if a student enrolled in both fall and spring he/she could be counted only once). Annualized FTES In a semester system, the sum of the summer term and fall and spring semester FTES divided by two. Campus The course campus of a student - it reflects where the student actually takes courses. Career/technical student A student enrolled in an A.A.S. degree, certificate or diploma program. College transfer student A student enrolled in an A.A. or A.S. degree program or the general education certificate program. Contract student A student enrolled through a special arrangement contract. Curricular student A student enrolled in an A.A., A.S., A.A.A., A.A.S., diploma, or certificate program. Day student A student who takes at least one course that begins prior to 6:00 p.m. Evening student A student who takes only courses that begin after 6:00 p.m. or a mix of night and online courses. Financial Aid Year A semester-based year beginning with the fall semester and ending with the summer term (lagging summer).
34
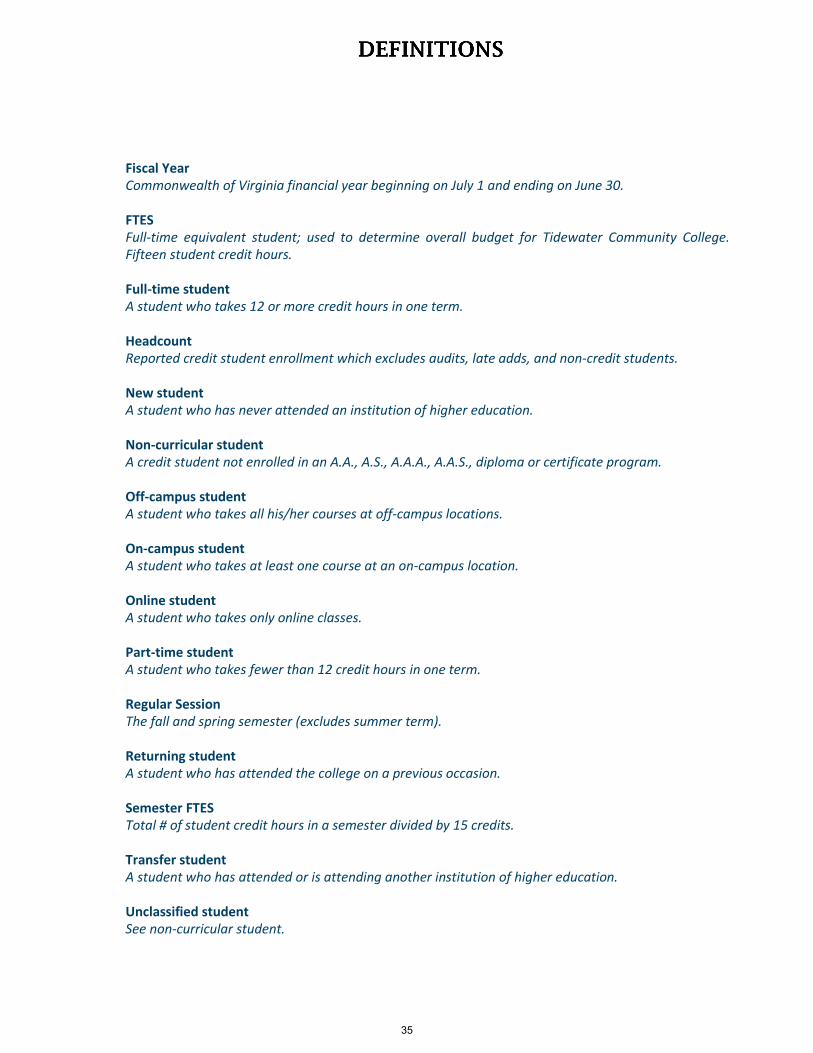
Fiscal Year Commonwealth of Virginia financial year beginning on July 1 and ending on June 30. FTES Full-time equivalent student; used to determine overall budget for Tidewater Community College. Fifteen student credit hours. Full-time student A student who takes 12 or more credit hours in one term. Headcount Reported credit student enrollment which excludes audits, late adds, and non-credit students. New student A student who has never attended an institution of higher education. Non-curricular student A credit student not enrolled in an A.A., A.S., A.A.A., A.A.S., diploma or certificate program. Off-campus student A student who takes all his/her courses at off-campus locations. On-campus student A student who takes at least one course at an on-campus location. Online student A student who takes only online classes. Part-time student A student who takes fewer than 12 credit hours in one term. Regular Session The fall and spring semester (excludes summer term). Returning student A student who has attended the college on a previous occasion. Semester FTES Total # of student credit hours in a semester divided by 15 credits. Transfer student A student who has attended or is attending another institution of higher education. Unclassified student See non-curricular student.
35
The 2014-15 edition of the Fact Book may be found on the web at www.tcc.edu/welcome/collegeadmin/
Oie/iR/factbook/index.htm
TIDEWATER COMMUNITY COLLEGE
From here, go anywhere.TM
CHESAPEAKE • NORFOLK • PORTSMOUTH • SUFFOLK • VIRGINIA BEACH