taxes, transfers, inequality and the poor in the developing world
TRANSCRIPT

Taxes, Transfers,
Inequality and the Poor in the Developing World
Nora Lustig
Tulane University; CGD and IAD www.commitmentoequity.org
Lustig, Nora. 2014. “Taxes, Transfers, Inequality and the Poor in the Developing World. Round 1.” CEQ Working Paper No. 23, Center for Inter-American Policy and Research and Department of Economics, Tulane University and Inter-American Dialogue
CEQ Workshop
Accra, Ghana, June 17, 2014
1
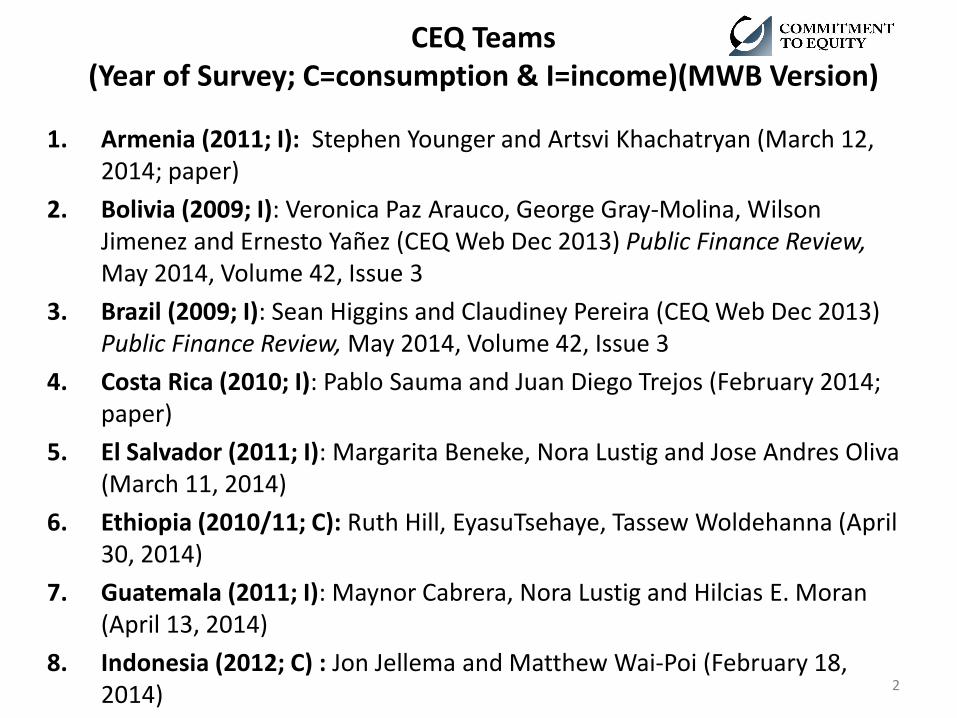
CEQ Teams (Year of Survey; C=consumption & I=income)(MWB Version)
1. Armenia (2011; I): Stephen Younger and Artsvi Khachatryan (March 12, 2014; paper)
2. Bolivia (2009; I): Veronica Paz Arauco, George Gray-Molina, Wilson Jimenez and Ernesto Yañez (CEQ Web Dec 2013) Public Finance Review, May 2014, Volume 42, Issue 3
3. Brazil (2009; I): Sean Higgins and Claudiney Pereira (CEQ Web Dec 2013) Public Finance Review, May 2014, Volume 42, Issue 3
4. Costa Rica (2010; I): Pablo Sauma and Juan Diego Trejos (February 2014; paper)
5. El Salvador (2011; I): Margarita Beneke, Nora Lustig and Jose Andres Oliva (March 11, 2014)
6. Ethiopia (2010/11; C): Ruth Hill, EyasuTsehaye, Tassew Woldehanna (April 30, 2014)
7. Guatemala (2011; I): Maynor Cabrera, Nora Lustig and Hilcias E. Moran (April 13, 2014)
8. Indonesia (2012; C) : Jon Jellema and Matthew Wai-Poi (February 18, 2014)
2

CEQ Teams (Year of Survey; C=consumption & I=income)(MWB Version)
9. Jordan (2010; C) : Morad Abdel-Halim, Shamma Adeeb Alam, Yusuf Mansur, Umar Serajuddin, Paolo Verme (April 18, 2014)
10. Mexico (2010; I): John Scott (CEQ Web Dec 2013) Public Finance Review, May 2014, Volume 42, Issue 3
11. Peru (2009; I): Miguel Jaramillo (CEQ Web Dec 2013) Public Finance Review, May 2014, Volume 42, Issue 3
12. South Africa (2010; I): Ingrid Woolard, Precious Zikhali, Mashekwa Maboshe, Jon Jellema (May 5, 2014)
13. Sri Lanka (2009/10; C): Nisha Arunatilake, Gabriela Inchauste and Nora Lustig (April 8, 2014; paper)
14. United States (2011; I): Sean Higgins, Nora Lustig, Whitney Ruble and Timothy Smeeding
15. Uruguay (2009; I): Marisa Bucheli, Nora Lustig, Maximo Rossi and Florencia Amabile (CEQ Web Dec 2013) Public Finance Review, May 2014, Volume 42, Issue 3
• Research Assistant: Yang Wang, Tulane University
3

Message to Viewers and Users
• Data is still under review except for Bolivia, Brazil, Costa Rica, Guatemala, Mexico, Peru and Uruguay
• Except for what is published in CEQ website or other places, information can be cited with permission only
If permission to cite is granted please use the following: • Lustig, Nora. 2014. “Taxes, Transfers, Inequality and the
Poor in the Developing World. Round 1” CEQ Working Paper No. 23, Tulane University and Inter-American Dialogue.
• AND, please cite the authors and date of submission for each country as noted in “CEQ Teams.”
4

Outline
• Governments come in all sizes
– Primary Spending and GDP: outliers everywhere – Composition of Social Spending: hello diversity – Composition of Tax Revenues: again, hello diversity, but…
• Taxes, Transfers and Inequality: Robin Hood, or Robin Hood Paradox? (Lindert, 2006) – How do consumption taxes affect redistribution?
• Taxes, Transfers and Poverty Reduction: much less auspicious
• A glimpse at Ethiopia 5
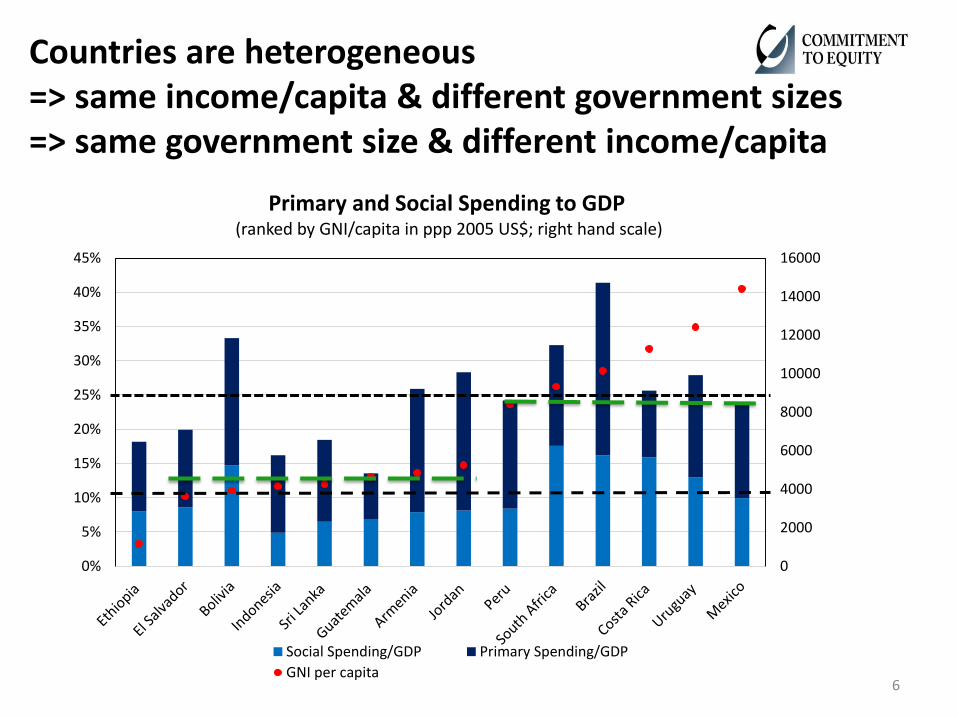
Countries are heterogeneous => same income/capita & different government sizes => same government size & different income/capita
0
2000
4000
6000
8000
10000
12000
14000
16000
0%
5%
10%
15%
20%
25%
30%
35%
40%
45%
Primary and Social Spending to GDP (ranked by GNI/capita in ppp 2005 US$; right hand scale)
Social Spending/GDP Primary Spending/GDP
GNI per capita6

However, both the size of government and social spending rise with income/ capita…
BOL
BRA
CRI
SLV
GTM
MEX PER
URY
AMR
ETH
IND
JOR
ZAF
LKA
BOL
BRA CRI
SLV
GTM
MEX
PER
URY
AMR ETH
IND
JOR
ZAF
LKA
0%
5%
10%
15%
20%
25%
30%
35%
40%
45%
0 2000 4000 6000 8000 10000 12000 14000 16000
GNI/Capita
Primary and Social Spending vs GNI/capita
Primary Spending/GDP Social Spending/GDP7
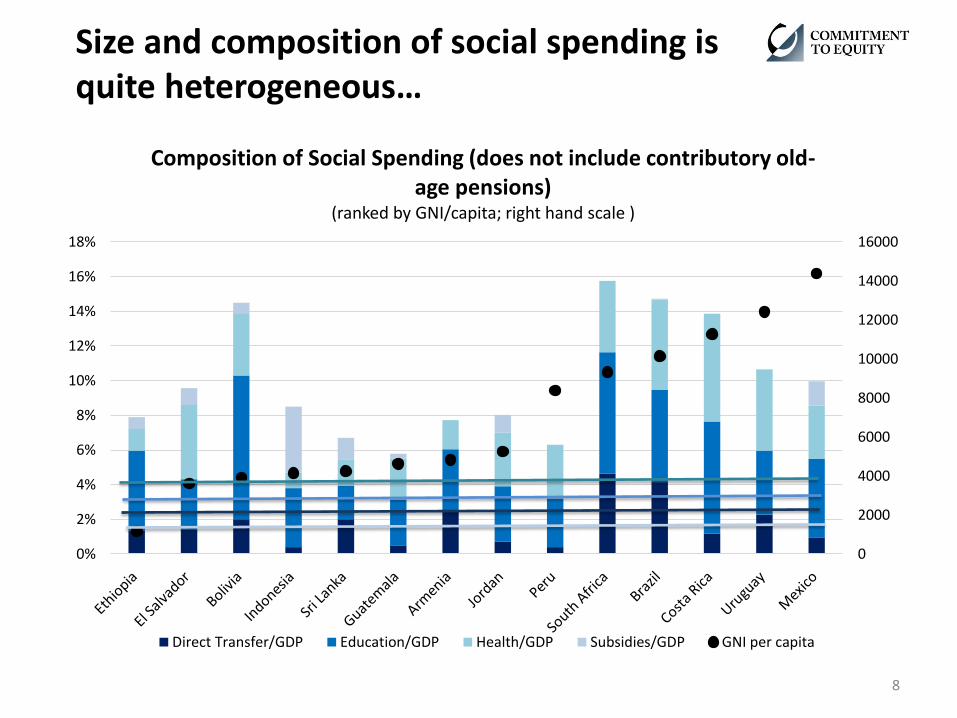
Size and composition of social spending is quite heterogeneous…
0
2000
4000
6000
8000
10000
12000
14000
16000
0%
2%
4%
6%
8%
10%
12%
14%
16%
18%
Composition of Social Spending (does not include contributory old-age pensions)
(ranked by GNI/capita; right hand scale )
Direct Transfer/GDP Education/GDP Health/GDP Subsidies/GDP GNI per capita
8

As expected, size and composition of taxes is heterogeneous too
Note: Direct Taxes include PIT and contributions to social security; Indirect Taxes include VAT, excise and other consumption taxes depending on the country.
Dashed Line: Average Indirect Taxes 9 percent Solid Line: Average Direct Taxes 6 percent
0
2000
4000
6000
8000
10000
12000
14000
16000
0%
5%
10%
15%
20%
25%
30%
Composition of Taxes (ranked by GNI/capita; right hand scale )
Direct Tax/GDP Indirect Tax/GDP GNI per capita
9

=> Share of Direct Taxes increases with the size of the economy => Share of Consumption Taxes does not
0%
5%
10%
15%
20%
25%
30%
0 2000 4000 6000 8000 10000 12000 14000 16000
GNI/capita
Taxes/GDP vs. GNI/capita
Direct Tax/GDP Indirect Tax/GDP Total Tax/GDP
10

Outline
• Governments come in all sizes – Primary Spending and GDP: outliers everywhere – Composition of Social Spending: hello diversity – Composition of Tax Revenues: again, hello diversity, but…
• Taxes, Transfers and Inequality: Robin Hood, or Robin Hood Paradox? (Lindert, 2006) – How do consumption taxes affect redistribution?
• Taxes, Transfers and Poverty Reduction: much less auspicious
• A glimpse at Ethiopia 11
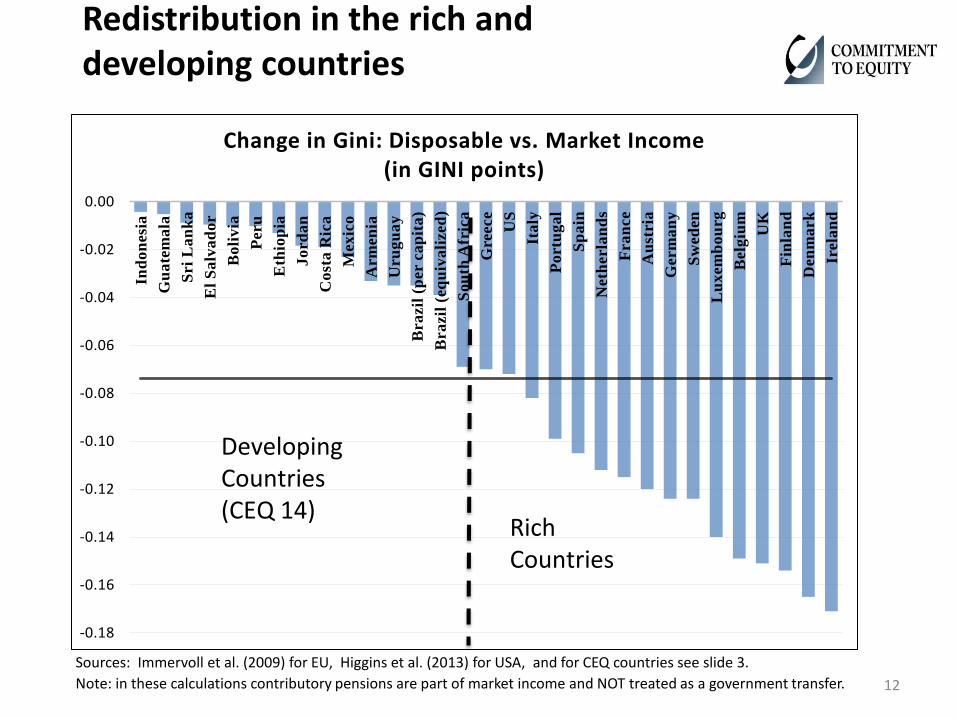
Redistribution in the rich and developing countries
Sources: Immervoll et al. (2009) for EU, Higgins et al. (2013) for USA, and for CEQ countries see slide 3.
Note: in these calculations contributory pensions are part of market income and NOT treated as a government transfer.
-0.18
-0.16
-0.14
-0.12
-0.10
-0.08
-0.06
-0.04
-0.02
0.00
Ind
on
esi
a
Gu
ate
ma
la
Sri
La
nk
a
El
Sa
lva
do
r
Bo
liv
ia
Peru
Eth
iop
ia
Jo
rd
an
Co
sta
Ric
a
Mex
ico
Arm
en
ia
Uru
gu
ay
Bra
zil
(p
er
ca
pit
a)
Bra
zil
(eq
uiv
ali
zed
)
So
uth
Afr
ica
Gre
ece
US
Ita
ly
Po
rtu
ga
l
Sp
ain
Neth
erla
nd
s
Fra
nce
Au
stria
Germ
an
y
Sw
ed
en
Lu
xem
bo
urg
Belg
ium
UK
Fin
lan
d
Den
ma
rk
Irela
nd
Change in Gini: Disposable vs. Market Income (in GINI points)
Developing Countries (CEQ 14)
Rich Countries
12

Zooming in (CEQ 14 countries)
-0.08
-0.07
-0.06
-0.05
-0.04
-0.03
-0.02
-0.01
0.00
Change in Gini: Disposable vs. Market Income (in GINI points)
13

Redistribution rises with income per capita
BOL
BRA
CRI
SLV GTM
MEX
PER
URY AMR
ETH
IND
JOR
ZAF
LKA
0.00
0.01
0.02
0.03
0.04
0.05
0.06
0.07
0.08
0 2000 4000 6000 8000 10000 12000 14000 16000
GNI/Capita
Change in Gini: Disposable vs Market (decline in Gini points shown in positive quadrant)
14
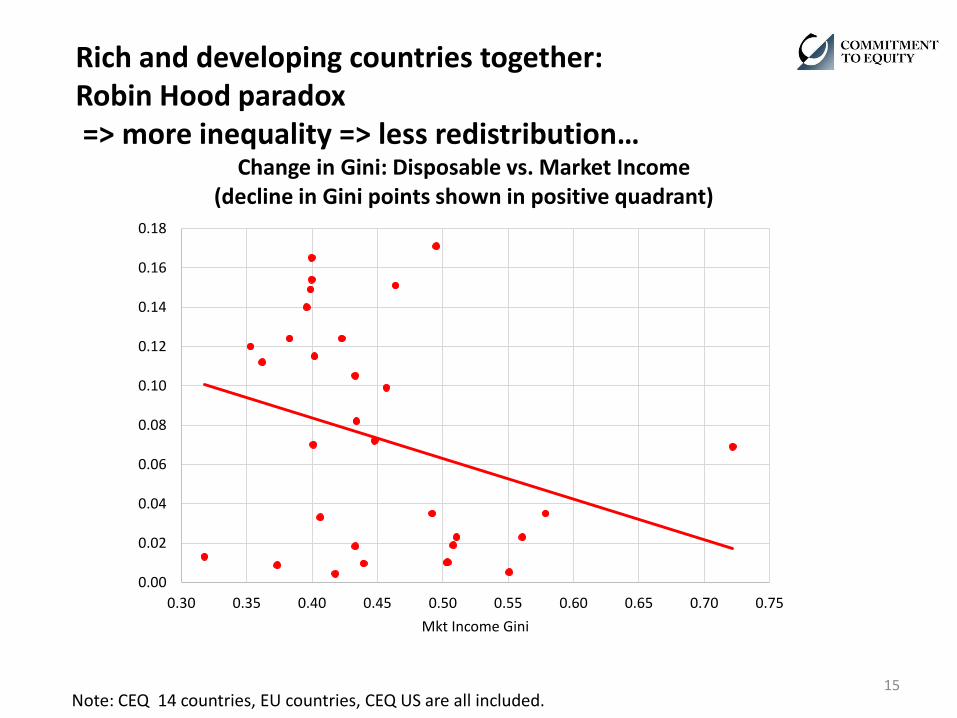
Rich and developing countries together: Robin Hood paradox => more inequality => less redistribution…
Note: CEQ 14 countries, EU countries, CEQ US are all included.
0.00
0.02
0.04
0.06
0.08
0.10
0.12
0.14
0.16
0.18
0.30 0.35 0.40 0.45 0.50 0.55 0.60 0.65 0.70 0.75
Mkt Income Gini
Change in Gini: Disposable vs. Market Income (decline in Gini points shown in positive quadrant)
15

…but in rich countries a mild Robin Hood
Note: CEQ countries, EU countries, US are all included. Decline is in Gini points.
GRC USA
ITA
PRT
NLD
ESP FRA
AUT DEU SWE
LUX
BEL UK FIN
DNK
IRL
0.06
0.08
0.10
0.12
0.14
0.16
0.18
0.30 0.35 0.40 0.45 0.50 0.55
Mkt Income Gini
Change in Gini: Disposable vs. Market Income (decline in Gini points shown in positive quadrant)
16

…in developing countries: the more unequal, the more redistribution =>Robin Hood is around
IND GTM SLV 0.01 PER
BOL
LKA
JOR
CRI MEX
ARM URY BRA
ZAF
0.00
0.01
0.02
0.03
0.04
0.05
0.06
0.07
0.08
0.30 0.35 0.40 0.45 0.50 0.55 0.60 0.65 0.70 0.75
Mkt Income Gini
Change in Gini: Disposable vs. Market Income (decline in Gini points shown in positive quadrant)
17
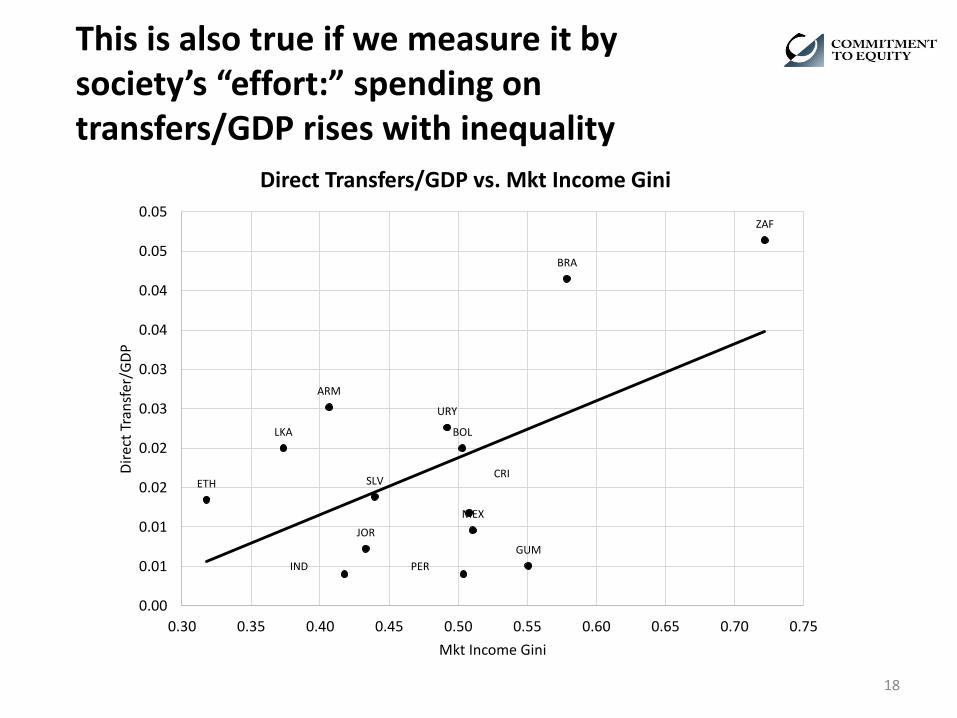
This is also true if we measure it by society’s “effort:” spending on transfers/GDP rises with inequality
IND PER
GUM
JOR
MEX
CRI ETH SLV
BOL LKA
URY
ARM
BRA
ZAF
0.00
0.01
0.01
0.02
0.02
0.03
0.03
0.04
0.04
0.05
0.05
0.30 0.35 0.40 0.45 0.50 0.55 0.60 0.65 0.70 0.75
Dir
ect
Tran
sfer
/GD
P
Mkt Income Gini
Direct Transfers/GDP vs. Mkt Income Gini
18

…and so does social spending/GDP
IND
PER GUM
JOR
MEX
CRI
ETH
SLV
BOL
LKA
URY
ARM
BRA
ZAF
0.00
0.02
0.04
0.06
0.08
0.10
0.12
0.14
0.16
0.18
0.20
0.30 0.35 0.40 0.45 0.50 0.55 0.60 0.65 0.70 0.75
Soci
al S
pen
din
g/G
DP
Mkt Income Gini
Social Spending/GDP vs. Mkt Income Gini
19

Note:
-0.08
-0.07
-0.06
-0.05
-0.04
-0.03
-0.02
-0.01
0.00
Change in Gini points: Post-fiscal vs. Market
20

Basic story does not change when you add the effect of consumption subsidies and consumption taxes
GTM BOL
IND
LKA SLV PER
ETH
CRI
JOR MEX ARM URY BRA
ZAF
0.00
0.01
0.02
0.03
0.04
0.05
0.06
0.07
0.08
0 2000 4000 6000 8000 10000 12000 14000 16000
GNI/Capita
Change in Gini: Post-fiscal vs. Market (decline in Gini points shown in positive quadrant)
21

Robin Hood stays around…
GTM BOL
IND LKA
SLV PER
ETH
CRI
JOR MEX ARM URY BRA
ZAF
0.00
0.01
0.02
0.03
0.04
0.05
0.06
0.07
0.08
0.30 0.35 0.40 0.45 0.50 0.55 0.60 0.65 0.70 0.75
Mkt Income Gini
Change in Gini: Post-fiscal vs. Market (decline in Gini points shown in positive quadrant)
22

Or, when you add (monetized) Education & Health
ETH
GUM LKA
IND
SLV
JOR
PER
ARM
BOL
MEX
URY
CRI
BRA
ZAF
0.00
0.05
0.10
0.15
0.20
0.25
0 2000 4000 6000 8000 10000 12000 14000 16000
GNI/Capita
Change in Gini: Final vs. Market Income (decline in Gini points shown in positive quadrant)
23

Again, Robin Hood stays around
ZAF
BRA
USA CRI
URY
MEX BOL ARM
PER JOR
SLV
IND
LKA GUM ETH
0.00
0.05
0.10
0.15
0.20
0.25
0.30 0.35 0.40 0.45 0.50 0.55 0.60 0.65 0.70 0.75
Mkt Income Gini
Change in Gini: Final vs. Market Income (decline in Gini points shown in positive
quadrant)
24

Outline
• Governments come in all sizes – Primary Spending and GDP: outliers everywhere – Composition of Social Spending: hello diversity – Composition of Tax Revenues: again, hello diversity, but…
• Taxes, Transfers and Inequality: Robin Hood, or Robin Hood Paradox? (Lindert, 2006) – How do consumption taxes affect redistribution?
• Taxes, Transfers and Poverty Reduction: much less auspicious
• A glimpse at Ethiopia 25

The Poverty Reduction story is broadly similar, when we look at what people get in disposable income…
Poverty in this slide and all subsequent ones is measured with the international line of US$2.50 ppp (2005) per day.
-12%
-10%
-8%
-6%
-4%
-2%
0%
2%
Change in Headcount Ratio: Disposable vs. Market Income
(in percentage points)
26

…however, story changes quite dramatically with Consumption Taxes …
Note: Post-fiscal income equals disposable income plus consumption subsidies minus consumption taxes
-12%
-10%
-8%
-6%
-4%
-2%
0%
2%
4%
6%
Change in Headcount Ratio (in percentage points)
Disposable vs. Market Post-fiscal vs. Market
27

Note: Positive number indicates a decline, all CEQ countries are included.
-6%
-4%
-2%
0%
2%
4%
6%
8%
10%
12%
0 2000 4000 6000 8000 10000 12000 14000 16000
GNI/capita
Change in Headcount Ratio (decline in percentage points in positive quadrant)
Change in Headcount: Disposable vs. Mkt Change in Headcount: Post-fiscal vs. Mkt
28
0 1 2 3 4 5 6 7 8 9 10
Mexico
Sri Lanka
Brazil
Bolivia
Uruguay
Armenia
Costa Rica
EI Salvador
Peru
Guatemala
Decile
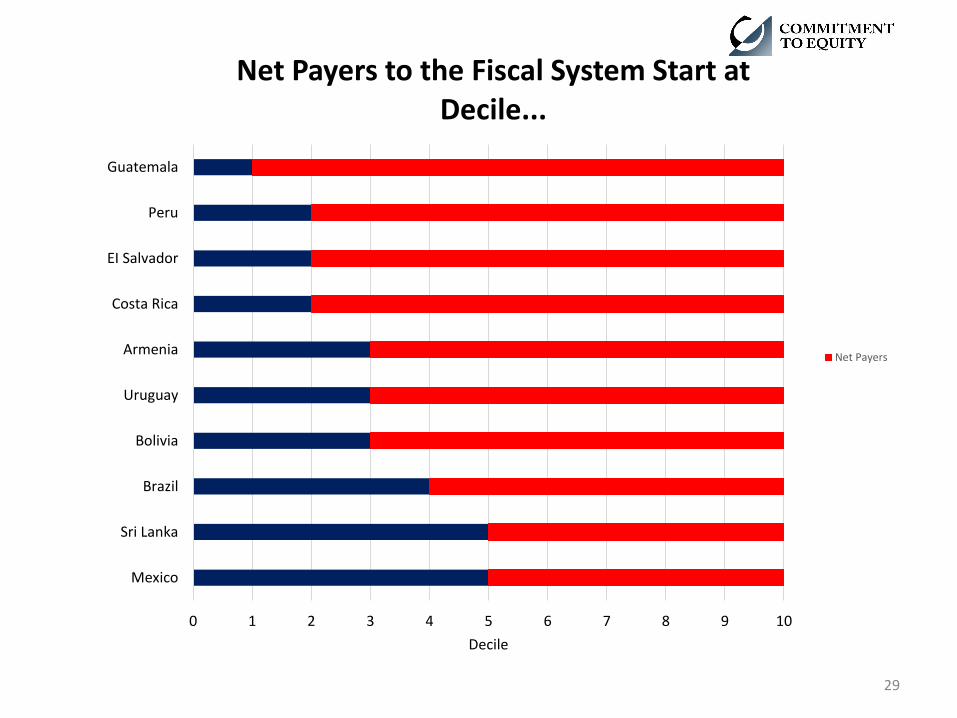
Net Payers to the Fiscal System Start at Decile...
Net Payers
29

Outline
• Incidence Analysis: What is it? • Governments come in all sizes
– Primary Spending and GDP: outliers everywhere – Composition of Social Spending: hello diversity – Composition of Tax Revenues: again, hello diversity, but…
• Taxes, Transfers and Inequality: Robin Hood, or Robin Hood Paradox? (Lindert, 2006) – How do consumption taxes affect redistribution?
• Taxes, Transfers and Poverty Reduction: much less auspicious
• A glimpse at Ethiopia 30

Redistribution in Ethiopia is above prediction…
BOL
BRA
CRI
SLV GTM
MEX
PER
URY AMR
ETH
IND
JOR
ZAF
LKA
0.00
0.01
0.02
0.03
0.04
0.05
0.06
0.07
0.08
0 2000 4000 6000 8000 10000 12000 14000 16000
GNI/Capita
Change in Gini: Disposable vs Market (in GINI points)
31

Direct taxes AND consumption taxes are PROGRESSIVE (equalizing)
0
0.2
0.4
0.6
0.8
1
1.2
1 2 3 4 5 6 7 8 9 10 11
Market Income
Direct Taxes
Indirect Taxes
Total Taxes
32
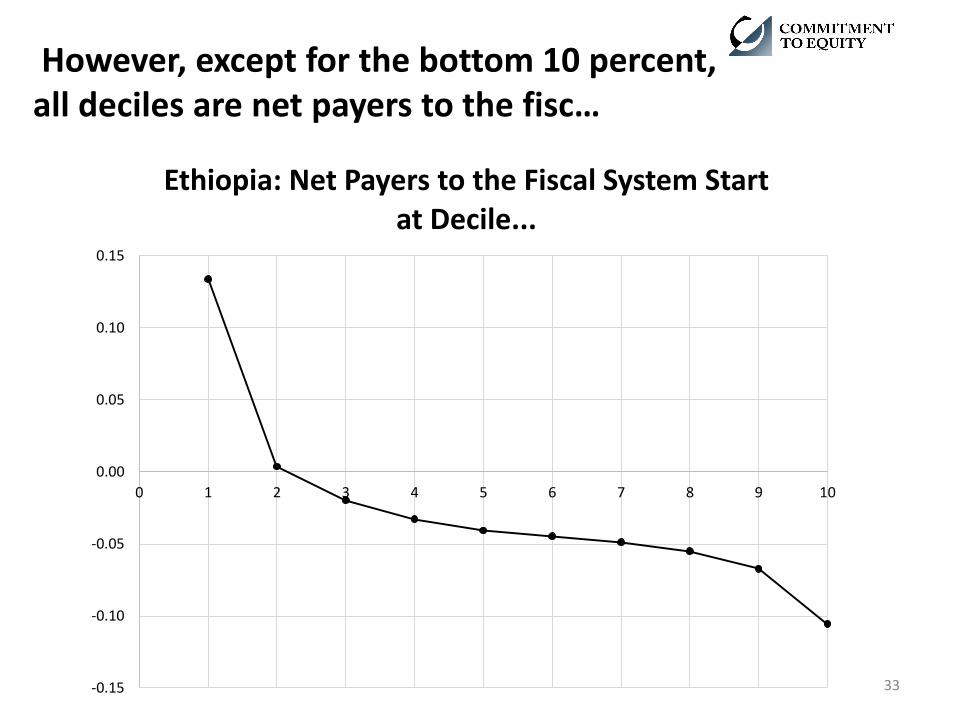
However, except for the bottom 10 percent, all deciles are net payers to the fisc…
-0.15
-0.10
-0.05
0.00
0.05
0.10
0.15
0 1 2 3 4 5 6 7 8 9 10
Ethiopia: Net Payers to the Fiscal System Start at Decile...
33

Except for the bottom income category (<US$1.25/day), the rest are net payers to the fisc…
-0.25
-0.20
-0.15
-0.10
-0.05
0.00
0.05
y < 1.25 1.25 < = y < 2.50 2.50 <= y < 4.00 4.00 <= y < 10.00 10.00 <= y < 50.00 50.00 <= y
Ethiopia: Net Payers to the Fiscal System Start at Income Category...
34

0%
5%
10%
15%
20%
25%
30%
35%
40%
45%
50%
Market Income Net Market Income Disposable Income Post-fiscal Income
Ethiopia: Headcount Ratios
National Moderate PL $1.24 PPP National Extreme PL $0.65 PPP
In Ethiopia, post-fiscal poverty is higher than pre-fisc poverty even when using the official US$1.24 (daily ppp) “moderate” poverty line
35

Main Take Aways
• Government size (primary spending as a share of GDP) is quite heterogeneous but—on average-- it increases with per capita income
• Ditto Social Spending
• Composition of Social Spending and Taxes is also heterogeneous but, as expected, Consumption Taxes are—on average- 50 percent higher (as a share of GDP) than Direct Taxes
36

Main Take Aways
INEQUALITY
• When rich and developing world are combined, the more unequal, the less redistributive (Robin Hood Paradox)
• However, when separated, Robin Hood is around, especially for the developing world
• This result is true for disposable and post-fiscal income
37

Main Take Aways
POVERTY
• The combination of direct taxes and cash transfers reduce poverty around 2 percentage points on average
• However, when the effect of consumption taxes (net of subsidies) is taken into account, poverty (with the US2.50/day line) IS HIGHER than pre-fisc poverty in 6 out of 14 countries
• Net payers to the fisc can begin as low as the second decile
38

Main Take Aways
ETHIOPIA
• Reduction in inequality is above that expected for its income per capita
• However, when the effect of consumption taxes (net of subsidies) is taken into account
Net payers to the fisc start in the SECOND decile and in the income group between US$1.25 and US$2.50/day
Poverty (with the US$1.2439/day line) IS HIGHER than pre-fisc poverty
39

Thank you!
40