tax evasion in oil-exporting countries: the case of iran
TRANSCRIPT

Iran. Econ. Rev. Vol. 21, No. 2, 2017. pp. 241-267
Tax Evasion in Oil-Exporting Countries:
The Case of Iran
Ali Hussein Samadi*
1, Najmeh Sajedianfard
2
Received: February 15, 2016 Accepted: December 20, 2016
Abstract
umerous studies have been conducted about the determinants of tax
evasion. In all of these studies, this phenomenon has been taken
into account in the framework of balanced budget and a non-oil
economy. In this study the determinants are examined by extending an
endogenous growth model and considering two cases for the
government budget in an oil-exporting country along with its budget
deficit. In addition, optimal tax rate, effective tax rate, economic growth
rate, and rate of tax evasion are estimated. Based on Iran’s economy,
the results show that the probability of detecting individuals and fine
rate lead to an ambiguous effect on the rate of tax evasion, and
furthermore, depending on the targeting, it could be positive or
negative. Meanwhile the relationship between the changes in the
parameter of private sector’s cost for tax evasion and changes in tax
evasion is negative.
Keywords: Endogenous Growth, Tax Evasion, Oil-Exporting
Countries, Iran.
JEL Classification: H11, H22, H31, H32, H53, C61, C63, O41.
1. Introduction
Tax evasion is an illegal phenomenon which exerts significant
negative socio-economic effects on society. Gary Becker first
introduced the economic theory of crime in 1968 and based on that,
Allingham and Sandmo (1972) provided an economic model for tax
evasion in which they consider both the income and substitution effect
in their analysis. Two years later, contrary to Allingham and Sandmo,
& Yitzhaki (1974) ignored the substitution effect and stated that there
1. Department of Economics, Shiraz University, Shiraz, Iran (Corresponding Author:
2. Department of Economics, Shiraz University, Shiraz, Iran ([email protected]).
N

242/ Tax Evasion in Oil-Exporting Countries: The Case of Iran
was only the income effect; because fines were imposed upon
concealed income and therefore, there only would be income effect. In
order to categorize the studies that have been conducted to investigate
tax evasion phenomenon, it is stated that these studies can be divided
into three branches. Firstly, determinants of tax evasion (e.g. Nicolini,
1998; Yaniv, 1990; MosaviJahromi et al., 2009; Ostad Mohammad
and Farhoodi, 2010; Fakhari et al., 2010, Ghorbani and Alilo, 2010;
Tonin, 2011; Levaggi and Menoncin, 2012; 2013; Pickhardt and
Prinz, 2014; Samadi and Tabandeh, 2013; Hadian and Tahvili, 2013).
Secondly, the impact of tax evasion on other economic variables (e.g.
Kesselman, 1989; Haj Mohammad and Aghai, 2010; Rezai et al.,
2010; Blackburn et al., 2012; Freire-Serén and Panadés i Martí, 2013;
Samadi and Tabandeh, 2014). Thirdly, measuring the tax evasion (e.g.
Cagan, 1958; Feige, 1989; Zelner, 1970; Seyyed Nourani, 2009;
Samadi and Tabandeh, 2014).
In particular, some studies have conducted about the effect of tax
evasion on economic growth which indicate the positive effect of tax
evasion on growth (e.g. Eichhorn, 2004; Aziz Khani and Afshari,
2007; Zodrow and Diamond, 2013) or negative effect (e.g. Kato and
Yanagihara, 2005; Gillman and Kejak, 2008; Seyyed Nourani, 2009)
or ambiguous effect (e.g. Chen, 2003). These kinds of studies consider
the economies in which the balanced budget is established and oil
revenues have not taken into account as an income source for the
government.
Due to two main reasons, discussing about these subjects is of high
importance. On one hand, balanced budget does not make sense for
many countries. On the other, owing to the dependence on oil
revenues and oil products, the government budget of most oil-
exporting countries confronted with significant fluctuations.
Furthermore, the Dutch disease is observed in most of these countries.
Thus, most of these countries have low economic growth rate.
Accordingly, as the main problem of these countries is inefficient
government and hence inefficient tax system, these countries’
dependence on an efficient tax system and more reliance on tax
incomes will be very necessary and effective. So, the main objective
of this study is to examine these problems in Iran as an oil-exporting
country. Furthermore, the contribution of this study is considering tax

Iran. Econ. Rev. Vol. 21, No.2, 2017 /243
evasion phenomenon in an oil exporting country with budget deficit,
Iran, in an endogenous growth model framework.
Thus, the present study explores the determinants of tax evasion in
the framework of an endogenous growth model for an oil-exporting
country with budget deficit. Additionally, by Iran’s data as an oil-
exporting country, the model is calibrated and the optimal values of
variables are obtained.
The rest of the paper is organized as follows. In the second section,
the endogenous growth model which is in accordance with economic
conditions of an oil-exporting country, Iran is extended and solved. In
the third section, based on Iran’s economy, the model is calibrated and
the result is presented. In the last section, the summary and policy
considerations are provided.
2. Model
It is assumed that time is continuous and the private sector consists of
household and firms – households that live in an infinite lifetime
horizon with no population growth. In addition, the firms act
competitively in product market. Moreover, capital depreciation is
zero and households own stocks of firms and in this case the private
sector are actually a representative household-firm agent. The
government purchase part of private sector’s products and provides
free services to private sector. Given the existence of tax evasion, the
government punishes identified lawbreaking individuals.
Following Skinner and Slemrod (1985), it is assumed that rate of the
expected fine is less than 1 and the administrative cost of fines is minor,
and thus can be ignored. Furthermore, based on Lin and Yang (2001),
each generation has a sense of altruism toward the next generation and
their tax evasion does not transfer to the next generation.
Another distinctive assumption of this study is the consideration of an
oil-exporting country with budget deficit. In addition to tax revenues from
income tax, there are other tax revenues. Moreover, for eliminating the
effect of inflation in the model, it is assumed that all variables are real.
2.1. Private Sector
It is assumed that the discounted lifetime utility of households,
following numerous studies, is presented as:

244/ Tax Evasion in Oil-Exporting Countries: The Case of Iran
∫ 𝑒−𝜌𝑡 𝑐(𝑡)1−𝜎−1
1−𝜎𝑑𝑡
∞
0 (1)
Where ρ > 0 represents the instantaneous time preference rate, 𝜎 is
the reverse of intertemporal elasticity of substitution and c (t) refers to
instantaneous private per capita expenditure. The production function,
following Barro (1990), is shown in Eq. 2 and assumed has constant
returns to scale:
𝑦(𝑡) = 𝐴𝑘𝜂(𝑡)𝑔1−𝜂(𝑡) (2)
Where y (t), k (t), g (t) and A represent non-oil Gross Domestic
Product (GDP) per capita, per capita capital, productive government
services per capita and the parameter of efficiency, respectively. In
addition, (1-η) refers to the degree of government externality. The
government services (g) are regarded as an input of private sector
production and is a flow variable.
Assuming that the percentage of revealed income for taxation is β,
the amount of tax revenue will be 𝜏𝛽𝑦 in which τ is the tax rate and y
is non-oil GDP per capita.
Furthermore, in order to be compatible with steady-state, it is
assumed that the cost of tax evasion is equal to ℎ0(1 − β)2, where
ℎ0 > 0 is the cost parameter of private sector for tax evasion1. There
are two cases of success and failure tax evasion for individuals.
Therefore, the detection and arrest of these household or firms will be
with probability. In fact, if an individual is identified as criminal or
he/she concealed a part of their income ((1 − β)𝑦), that individual
must pay both the unpaid tax ((𝜏(1 − β)𝑦)) and the fixed fine (𝜋). In
this case, the disposable income of private sector will be as Eq. 3:
yd=(1-p) [(1-τβ)-h0(1-β)
2] y + p [(1-τβ)-h0(1-β)
2- πτ(1-β)] y⇒ y
d=(1-τE)𝑦 (3)
Where p refers to probability of detection, 𝜏𝐸 is the effective tax
rate2 and other variables are defined as before. In this case, the
investment will be k = (1 − 𝜏𝐸)𝑦 − 𝑐. With these assumptions, the
individual not only choose c (private expenditure per capita) and k
(capital input per capita), but also chooses 𝛽 (percentage of revealed
1. Costs of hiring a lawyer or bribing the tax auditors to enable tax evasion
2. Which is 𝜏𝐸 = 𝜏(1 − (1 − 𝛽)(1 − 𝑝𝜋)) + ℎ0(1 − 𝛽)2

Iran. Econ. Rev. Vol. 21, No.2, 2017 /245
income) so as to maximize the discounted lifetime utility in regard to
the following restrictions (Eqs. 4, 5, and 6), given p (probability of
detection), 𝜋 (fine rate) and g (government services):
𝑦𝑡 = 𝐴𝑘𝑡𝜂𝑔𝑡
1−𝜂 (4)
𝑦𝑑 = (1 − 𝜏𝐸)𝑦 (5)
�� = (1 − 𝜏𝐸)𝑦 − 𝑐 (6)
By solving this model, Eqs. 7, 8 and 9 will be extracted:1
1 − 𝛽∗ = 𝜏(1−𝑝𝜋)
2ℎ0 (7)
c
c=1
σ[Aη (1-τ(1-(1-β)(1-pπ))-h0(1-β)
2) (gk⁄ )1-η
-ρ] (8)
lim𝑡→0 𝑘𝑡𝜆𝑡 = 0 (9)
Eq. 7 determines the rate of tax evasion in which the marginal
benefit of the reduction of the tax is equal to the marginal cost of tax
evasion. Eq. 8 represents the consumption growth rate. It also
determines the income growth rate. Additionally, Eq. 9 represents the
transversality condition which restricts capital input per capita from
rapid growth.
2.2. Government
Given the private sector’s budget constraint and that the household
optimally respond to fiscal policy by modifying tax evasion and
consumption-savings (Eqs. 7 and 8), the government seeks to
determine the optimal tax rate in a way that maximizes the private
sector’s discounted lifetime utility.
According to the point that the government has two revenue
sources to provide services, the proposed model in this paper
significantly differs from other studies especially Barro (1990) and
Chen (2003). In addition, the government have encountered budget
deficit, and the government are financed by income tax and oil
revenues. In this model, the tax revenues are divided into two
categories of income tax and other tax revenues. This classification is
presented, due to the emphasis of this paper on tax evasion resulting
from income tax. Therefore, it is assumed that the cost of tax audit is
1. See appendix, equations (A.5) to (A.18)

246/ Tax Evasion in Oil-Exporting Countries: The Case of Iran
𝑓0𝑝𝑦, where 𝑓0 > 0 is the parameter of government expenditures to do
tax audit, p refers to the probability of detecting tax evasion and y
refers to GDP without oil.
Accordingly, two sources of tax revenues are considered for the
government budget; the first is tax revenues of income tax which is
τ[β + pπ (1-β)]y. The second is the other tax revenues defined as 𝛼𝑦
where α is the ratio of other tax revenues of non-oil GDP. This model
seeks to examine the tax evasion in an oil-exporting country, Iran.
Therefore, the oil revenues should be considered in the model. In this
case, oil revenues are defined as χy, where χ is the ratio of oil
revenues to non-oil GDP. Also, given the budget deficit of the
government, it can be defined as γ𝑦, where γ is the ratio of budget
deficit to non-oil GDP. Thus, the government budget constraint is as
follows:
𝜏[𝛽 + 𝑝𝜋 (1 − 𝛽)]𝑦 + 𝛼𝑦 + 𝜒𝑦 ≡ 𝑇 ≡ 𝑓0𝑝𝑦 + 𝑔 − 𝛾𝑦 (10)
Where 𝜏 is rate of income tax, 𝛽 is the percentage of private sector’s
revealed income, p is the probability of detection, 𝜋 is the fine rate
and g represents the government services. The rest are defined as
before.
In this study, two cases for government budget are considered:
1. Government budget regarding tax revenues and excluding oil
revenues (First Case)
2. Government budget simultaneously regarding tax and oil
revenues (Second Case)
Accordingly, the government budget constraint is discussed as:
2.2.1. Government Budget Excluding Oil Revenues
In this case, the government budget will be:
[𝛽 + 𝑝𝜋 (1 − 𝛽)]𝑦 + 𝛼𝑦 ≡ 𝑇 ≡ 𝑓0𝑝𝑦 + 𝑔 − 𝛾𝑦 (11)
Where τ is the tax rate, β refers to revealed income, p is the
probability of detection, π refers to fine rate, y refers to non-oil GDP, f
is the parameter of government expenditure for tax auditing, g refers
to government services, α is the rate of income tax to non-oil GDP,
and γ refers to rate of budget deficit to non-oil GDP.
As mentioned before, it is assumed that the government have to

Iran. Econ. Rev. Vol. 21, No.2, 2017 /247
deal with the budget deficit and the government’s total tax revenues
consists of income tax and other tax revenues. In this case, the
equation of the government budget can be rewritten as Eq. 121:
((𝜏[𝛽 + 𝑝𝜋 (1 − 𝛽)] − 𝑓0𝑝 + 𝛼 + 𝛾)𝐴)1
𝜂⁄=
𝑔
𝑘 (12)
Therefore, considering the first case of the government budget, the
problem of the government will be as the following:
𝑚𝑎𝑥{𝜏}c
c=1
σ[𝐴
1η⁄ η (1-τ+
𝜏2(1−𝑝𝜋)2
4ℎ0) ((τ-
𝜏2(1−𝑝𝜋)2
2ℎ0-f0p+α+γ))
1-ηη⁄
-ρ] (13)
By solving it, we have:2 1-η
η(1-
(1−𝑝𝜋)2
h0τ*) (1-τ*+
(1−𝑝𝜋)2
4h0τ*2
)= (τ*-(1−𝑝𝜋)2
2h0τ*2
-f0p+α+γ) (1-
(1−𝑝𝜋)2
2h0τ*) (14)
In order to find the optimal tax rate, the roots of this equation must
be obtained.
2.2.2. Government Budget regarding Oil Revenues
In this case, the government budget will be:
𝜏[𝛽 + 𝑝𝜋 (1 − 𝛽)]𝑦 + 𝛼𝑦 + 𝜒𝑦 ≡ 𝑇 ≡ 𝑓0𝑝𝑦 + 𝑔 − 𝛾𝑦 (15)
Where χ is the ratio of oil revenues to non-oil GDP and the rest of the
parameters are defined as before.
In this case, it is also assumed that the government has to deal with
the budget deficit and the government’s total tax revenues consist of
income tax and other tax revenues. The difference of this case from
the previous one is that the government not only possesses tax
revenues, but also considers oil revenues as financing sources.
Therefore, it is assumed that the government’s total revenue are
financed by both tax and oil revenues. As a result, the government
budget will be:3
((𝜏[𝛽 + 𝑝𝜋 (1 − 𝛽)] + 𝜒 − 𝑓0𝑝 + 𝛼 + 𝛾)𝐴)1
𝜂⁄=
𝑔
𝑘 (16)
Now, maximization problem is:
1. See appendix, equations (A.19) to (A.29)
2. See appendix, equations (A.30) to (A.39)
3. See appendix, equations (A.40) to (A.44)

248/ Tax Evasion in Oil-Exporting Countries: The Case of Iran
max{τ}c
c=
1
σ[𝐴
1η⁄ η (1-τ+
𝜏2(1−𝑝𝜋)2
4ℎ0) ((χ+τ-
𝜏2(1−𝑝𝜋)2
2ℎ0-f0p+α+γ))
1-ηη⁄
-ρ](17)
Now, after derivation of growth rate of per capita consumption
with respect to tax rate, the equation will be:1
1-η
η(1-
(1-pπ)2
h0τ*) (1-τ*+
(1-pπ)2
4h0τ*
2
) = (χ+τ*-(1-pπ)
2
2h0τ*
2
-f0p+α+γ) (1-(1-pπ)
2
2h0τ*) (18)
In sum, the government seeks to determine the optimal tax rate in a
way that maximizes the private sector’s welfare. Thus, the
government, based on the budget constraint, maximizes the growth
rate of per capita consumption. In this model, two cases are
considered for the government budget; both cases deal with the budget
deficit. As mentioned before, in order to determine the optimal tax
rate, we need to relate the government budget to economic growth
rate. Therefore, the optimal tax rate and economic growth rate are
affected by presence or lack of oil revenues. With the effect of oil
revenues on optimal tax rate, the rate of tax evasion and the optimal
effective tax rate are also affected. Accordingly, by adding oil
revenues to the model, both the private and the public sector of the
economy are also affected. Adding budget deficit and other tax
revenues such as oil revenues will affect the whole economy.
3. Empirical Results2
This paper attempts to cast light on the economic growth rate, optimal
tax rate, effective tax rate and rate of tax evasion, by the proposed
model along with MATLAB software based on Iran’s economy. After
changing the policy parameters (i.e. probability of detection, fine rate,
private sector’s cost parameter for tax evasion), their effects on tax
evasion will be investigated. In this section, after defining the
variables and the parameters in the model (table 1), with the help of
annual data of 2003-2013 of Islamic Republic of Iran, the numerical
solution and the analysis of the model will be manipulated.
1. See appendix, equations (A.45) to (A.47)
2. It should be noted that these results are based on Iran's economic data. So, it is possible that
the results wouldn't be consistent with economic structure of all the oil exporting countries.

Iran. Econ. Rev. Vol. 21, No.2, 2017 /249
Table 1: Definition and Values of Parameters
Row Definition Symbol Value Source
1 Parameter of Government Cost
for Tax Auditing f0 0.0002 Annual Government Budget
2 Probability of Detecting
Offenders P 0.71 Research Estimations*
3 Fine Rate of Offenders π 0.4 Law of Direct Taxes, Islamic
Republic of Iran
4 Inverse of Intertemporal
Elasticity of Substitution σ 0.93 Shahnazi et al. (2012)
5 Time Preference ρ 0.01 Shahnazi et al. (2012)
6 Degree of Government
Externality 1-η 0.1-0.45 Assumption**
7 Parameter of Private Sector’s
Cost of Tax Evasion h0 0.01-1 Assumption***
8 Efficiency Parameter A 2.7631 Arabi (2008)
9 Ratio of Oil Income to GDP
without Oil χ 0.11 Research Estimations
10 Ratio of Budget Deficit to
GDP without Oil ϒ 0.04 Research Estimations
11 Ratio of Other Tax Revenues
to GDP without Oil α 0.05 Research Estimations****
Source: Research Findings
Notes:
* Best indicator for denoting the probability of detecting offenders is the value of
verified cases to total value of cases. Due to confidentiality of statistics and its
unavailability, the probability of detecting offenders is estimated by equation
𝑝 <1
1+𝜋 introduced by Hindriks and Myles (2006) which signifies the existence of
tax evasion.
** Barro and Sala-i-Martin (2004) regard the government externality to be very low.
This is while Aschauer (1989) believed that the government externality is high. In
this study, just like these researchers, the lowest limit of external effects is 0.1 and
its highest limit is 0.45.
*** The maximum value of household costs to tax evasion could be 0.35. This value
is determined by Eq.7.
**** The values of rows 9, 10, 11 are determined by estimating geometric mean
during the intended period.
Now, by considering two cases of the government budget, the
general state of Iran's economy is investigated. To this end, the
government externality is considered from 25%. Moreover, to give a
crystal clear analysis, by considering government externality with 0.05
steps (i.e. from 25%, 5% to 5%, the government externality will be
increased to 45%), along with the two objectives including achieving
maximum economic growth and minimum tax evasion, a summary of
the results will be provided. It should be noted that the government

250/ Tax Evasion in Oil-Exporting Countries: The Case of Iran
externality in Iran’s economy is equal to 0.31 as the benchmark.1
3.1. First Case: Government Budget Excluding Oil Revenues
In this case, it is assumed that the only financing source for the
government is tax revenues. In this section, the effects of three
policies i.e. increasing probability of detecting individuals, fine rate of
individuals, and private sector’s cost parameter for tax evasion to tax
evasion are taken into account.
3.1.1. Increase Possibility of Detection from 31% to 71% (Objective: Maximum
Rate of Economic Growth)
Table 2 shows the effect of increase in the parameter of detection
probability. It should be noted that the parameter of detection
probability increases from 31% to 71% with 10% steps.
As shown in Table 2, when the objective is the maximum
economic growth, the effect of increase in probability of detection on
tax evasion is direct. In other words, when probability of detection
increases, the tax evasion increases as well.
3.1.2. Increase Possibility of Detection from 31% to 71% (Object: Minimum Tax
Evasion)
Table 3 shows the effect of increase in parameter of detection
probability.
As shown in Table 3, the effect of increase in probability of
detection on tax evasion is inverse when the objective is minimum tax
evasion. In other words, when the probability of detection increases,
tax evasion decreases.2
1. This is determined by the estimation of algebraic mean of rate of expenditure and
investment of public sector to non-oil GDP in the intended period.
2. According to Chen (2003), the ambiguity of effect of detection probability on the rate of
economic growth and tax evasion is provided. The results of this study concerning the
ambiguous effect of detection probability on optimal tax evasion level are evident. Based on
the objective, this effect could be positive. The decreased probability of detection is followed
by decreased tax evasion.

Iran. Econ. Rev. Vol. 21, No.2, 2017 /251
Table 2: Effect of Increase in Detection Probability on Tax Evasion in First
Case of Government Budget (Object: Maximum Rate of Economic Growth)
Row
Degree of
Government
Externality
Detection
Probabilit
y
Optimal Economic
Growth Rate
Optimal Rate
of Tax
Evasion
1 0.25
0.71 0.0582 0.2132
0.61 0.0582 0.2031
0.51 0.0582 0.1947
0.41 0.0582 0.1875
0.31 0.0582 0.1813
2 0.3
0.71 0.093 0.2264
0.61 0.093 0.2246
0.51 0.0929 0.2226
0.41 0.0926 0.2207
0.31 0.0923 0.2187
3 0.31
0.71 0.1005 0.2366
0.61 0.1004 0.2345
0.51 0.1001 0.2324
0.41 0.0997 0.2303
0.31 0.0992 0.2281
4 0.35
0.71 0.1308 0.2766
0.61 0.13 0.2737
0.51 0.129 0.2708
0.41 0.1278 0.2729
0.31 0.1264 0.2647
5 0.4
0.71 0.1683 0.3253
0.61 0.166 0.3211
0.51 0.1633 0.3168
0.41 0.1605 0.3123
0.31 0.1574 0.3078
6 0.45
0.71 0.2035 0.3721
0.61 0.1987 0.3661
0.51 0.1936 0.36
0.41 0.1882 0.3537
0.31 0.1827 0.3474
Source: Research Findings

252/ Tax Evasion in Oil-Exporting Countries: The Case of Iran
Table 3: Effect of Increase in Detection Probability on Tax Evasion in First
Case of the Government Budget (Object: Minimum Tax Evasion)
Row
Degree of
Government
Externality
Detection
Probability
Optimal
Economic
Growth Rate
Optimal Rate
of Tax
Evasion
1 0.25
0.71 0.0574 0.1725
0.61 0.0578 0.1828
0.51 0.0581 0.1899
0.41 0.0582 0.1964
0.31 0.058 0.2024
2 0.3
0.71 0.093 0.2264
0.61 0.0929 0.2354
0.51 0.0922 0.2435
0.41 0.091 0.2506
0.31 0.0893 0.2566
3 0.31
0.71 0.1005 0.2366
0.61 0.1001 0.2458
0.51 0.0991 0.254
0.41 0.0975 0.261
0.31 0.0953 0.2669
4 0.35
0.71 0.1308 0.2766
0.61 0.1289 0.2863
0.51 0.126 0.2945
0.41 0.1222 0.3011
0.31 0.1176 0.3061
5 0.4
0.71 0.1683 0.3253
0.61 0.1631 0.3348
0.51 0.1564 0.3421
0.41 0.1485 0.3471
0.31 0.1397 0.35
6 0.45
0.71 0.2035 0.3721
0.61 0.193 0.3804
0.51 0.1808 0.3856
0.41 0.1675 3.8809
0.31 0.1537 3.881
Source: Research Findings
Iran. Econ. Rev. Vol. 21, No.2, 2017 /253
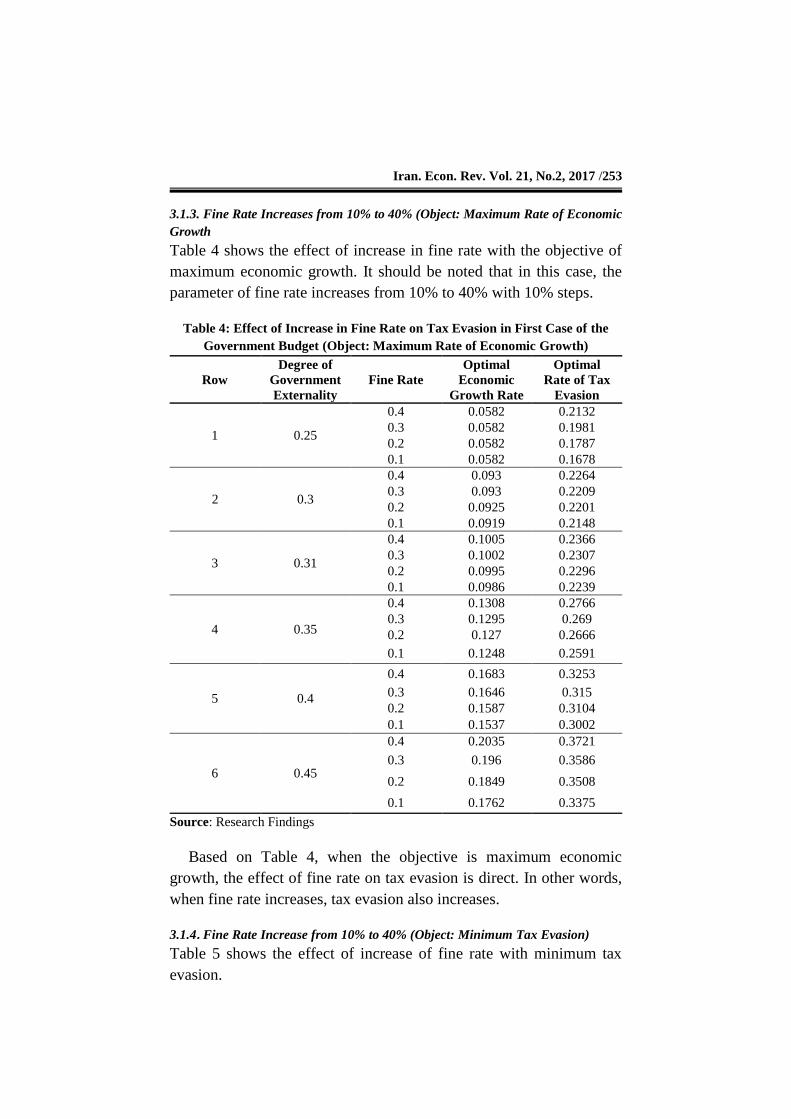
3.1.3. Fine Rate Increases from 10% to 40% (Object: Maximum Rate of Economic
Growth
Table 4 shows the effect of increase in fine rate with the objective of
maximum economic growth. It should be noted that in this case, the
parameter of fine rate increases from 10% to 40% with 10% steps.
Table 4: Effect of Increase in Fine Rate on Tax Evasion in First Case of the
Government Budget (Object: Maximum Rate of Economic Growth)
Row
Degree of
Government
Externality
Fine Rate
Optimal
Economic
Growth Rate
Optimal
Rate of Tax
Evasion
1 0.25
0.4 0.0582 0.2132
0.3 0.0582 0.1981
0.2 0.0582 0.1787
0.1 0.0582 0.1678
2 0.3
0.4 0.093 0.2264
0.3 0.093 0.2209
0.2 0.0925 0.2201
0.1 0.0919 0.2148
3 0.31
0.4 0.1005 0.2366
0.3 0.1002 0.2307
0.2 0.0995 0.2296
0.1 0.0986 0.2239
4 0.35
0.4 0.1308 0.2766
0.3 0.1295 0.269
0.2 0.127 0.2666
0.1 0.1248 0.2591
5 0.4
0.4 0.1683 0.3253
0.3 0.1646 0.315
0.2 0.1587 0.3104
0.1 0.1537 0.3002
6 0.45
0.4 0.2035 0.3721
0.3 0.196 0.3586
0.2 0.1849 0.3508
0.1 0.1762 0.3375
Source: Research Findings
Based on Table 4, when the objective is maximum economic
growth, the effect of fine rate on tax evasion is direct. In other words,
when fine rate increases, tax evasion also increases.
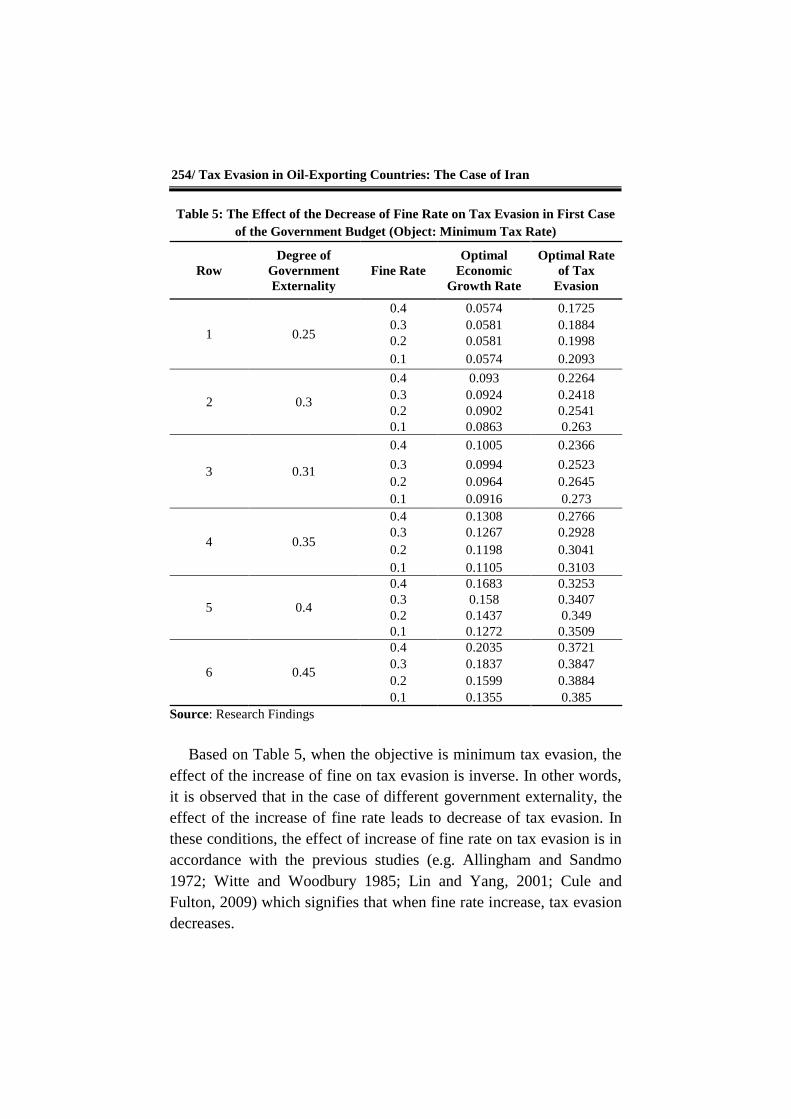
3.1.4. Fine Rate Increase from 10% to 40% (Object: Minimum Tax Evasion)
Table 5 shows the effect of increase of fine rate with minimum tax
evasion.
254/ Tax Evasion in Oil-Exporting Countries: The Case of Iran
Table 5: The Effect of the Decrease of Fine Rate on Tax Evasion in First Case
of the Government Budget (Object: Minimum Tax Rate)
Row
Degree of
Government
Externality
Fine Rate
Optimal
Economic
Growth Rate
Optimal Rate
of Tax
Evasion
1 0.25
0.4 0.0574 0.1725
0.3 0.0581 0.1884
0.2 0.0581 0.1998
0.1 0.0574 0.2093
2 0.3
0.4 0.093 0.2264
0.3 0.0924 0.2418
0.2 0.0902 0.2541
0.1 0.0863 0.263
3 0.31
0.4 0.1005 0.2366
0.3 0.0994 0.2523
0.2 0.0964 0.2645
0.1 0.0916 0.273
4 0.35
0.4 0.1308 0.2766
0.3 0.1267 0.2928
0.2 0.1198 0.3041
0.1 0.1105 0.3103
5 0.4
0.4 0.1683 0.3253
0.3 0.158 0.3407
0.2 0.1437 0.349
0.1 0.1272 0.3509
6 0.45
0.4 0.2035 0.3721
0.3 0.1837 0.3847
0.2 0.1599 0.3884
0.1 0.1355 0.385
Source: Research Findings
Based on Table 5, when the objective is minimum tax evasion, the
effect of the increase of fine on tax evasion is inverse. In other words,
it is observed that in the case of different government externality, the
effect of the increase of fine rate leads to decrease of tax evasion. In
these conditions, the effect of increase of fine rate on tax evasion is in
accordance with the previous studies (e.g. Allingham and Sandmo
1972; Witte and Woodbury 1985; Lin and Yang, 2001; Cule and
Fulton, 2009) which signifies that when fine rate increase, tax evasion
decreases.

Iran. Econ. Rev. Vol. 21, No.2, 2017 /255
3.1.5. Increases the Private Sector’s Cost Parameter for Tax Evasion from 10% to
30%
In this section, the effect of increase on the private sector’s cost
parameter for tax evasion is investigated. In this regard, this parameter
is increased from 10% to 30% with 10% steps. The obtained results
are shown in Table 6.
Table 6: Effect of Increase of Household Cost for Tax Evasion on Tax Evasion
in First Case of the Government Budget
Row
Degree of
Government
Externality
Household Cost
for Tax Evasion
Optimal
Economic
Growth Rate
Optimal
Rate of Tax
Evasion
1 0.25
0.1 0.043 0.4308
0.2 0.061 0.289
0.3 0.062 0.2077
2 0.3
0.1 0.051 0.4942
0.2 0.0885 0.3586
0.3 0.0967 0.2647
3 0.31
0.1 0.0517 0.5045
0.2 0.0934 0.3714
0.3 0.1037 0.2758
4 0.35
0.1 0.0525 0.5396
0.2 0.1103 0.419
0.3 0.1313 0.3193
5 0.4
0.1 0.0494 0.573
0.2 0.124 0.4699
0.3 0.163 0.3709
6 0.45
0.1 0.0433 0.5982
0.2 0.1292 0.5122
0.3 0.1892 0.4187
Source: Research Findings
Based on Table 6, it is observed that when the private sector’s cost
parameter increase, tax evasion rate decreases.
In this section, the effects of policy parameters of detection
probability, fine rate and the private sector’s cost parameter for tax
evasion on tax evasion were examined. The analysis of the effects of
detection probability signified that when the objective is maximum
economic growth, there is not a reverse relationship between

256/ Tax Evasion in Oil-Exporting Countries: The Case of Iran
probability of detection and tax evasion. Meanwhile, when the
objective is to minimum tax evasion, the inverse relationships between
probability of detection and tax evasion is established. Moreover, the
effect of fine rate on tax evasion is similar to detection probability.
Additionally, the relation between the private sector’s cost parameter
for tax evasion and rate of tax evasion is inverse.
3.2. Second Case (Government Budget regarding Oil Revenues)
In this case, it is assumed that oil revenues and tax revenues are the
financing sources for the government budget. In this section, the
effects of three policies including increasing the probability of
detecting individuals, fine rate of individuals, and the private sector’s
cost parameter for tax evasion to tax evasion are investigated.
3.2.1. Increase Probability of Detection from 31% to 71% (Objective: Maximum
Economic Growth Rate)
Table 7 shows the effect of increase of probability of detection. It
should be noted that the probability of detection increases from 31%
to 71% with 10% steps.
As shown in Table 7, when the objective is maximum economic
growth, the effect of increase of detection probability on tax evasion is
positive. In other words, when probability of detection increases, tax
evasion also increases.
3.2.2. Increase of Probability of Detection from 31% to 71% (Object: Minimum
Tax Evasion)
Table 8 shows the effects of increase of detection probability with the
objective of minimum tax evasion.
As shown in Table 8, when the objective is minimum tax evasion,
there is a reverse relationship between variation of probability of
detection and tax evasion.
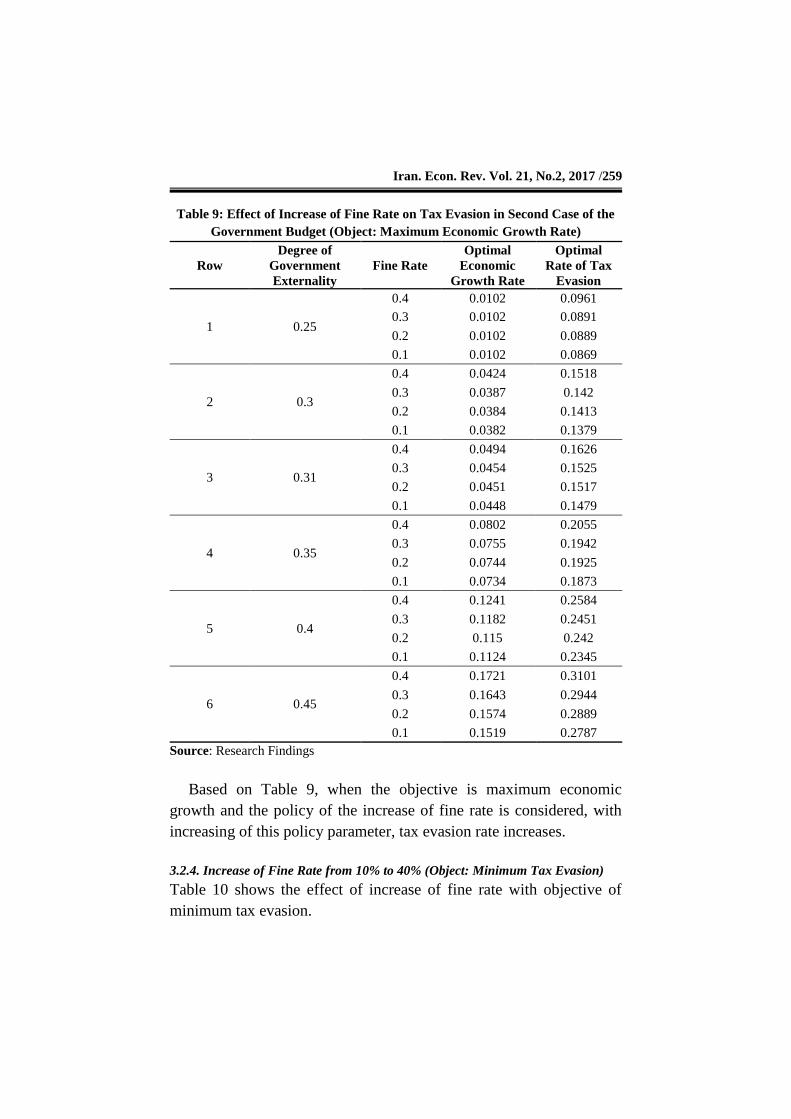
3.2.3. Increase of Fine Rate from 10% to 40% (Object: Maximum Economic
Growth)
Similar to the previous section and analysis of effects of policy
parameter of detection probability on tax evasion, the effect of fine
rate on other variables are investigated in two cases. In this case, the
objective is maximum growth rate. The results are shown in Table 9.

Iran. Econ. Rev. Vol. 21, No.2, 2017 /257
Table 7: Effect of Increase of Detection Probability on Tax Evasion in Second
Case of the Government Budget (Object: Maximum Economic Growth Rate)
Row
Degree of
Government
Externality
Detection
Probability
Optimal
Economic
Growth Rate
Optimal
Rate of Tax
Evasion
1 0.25
0.71 0.0102 0.0961
0.61 0.0102 0.0927
0.51 0.0102 0.0898
0.41 0.0102 0.089
0.31 0.0101 0.0883
2 0.3
0.71 0.0388 0.1458
0.61 0.0387 0.1444
0.51 0.0386 0.1431
0.41 0.0385 0.1417
0.31 0.0383 0.1404
3 0.31
0.71 0.0456 0.1566
0.61 0.0455 0.1551
0.51 0.0454 0.1536
0.41 0.0452 0.1521
0.31 0.045 0.1507
4 0.35
0.71 0.0762 0.1998
0.61 0.0758 0.1976
0.51 0.0753 0.1996
0.41 0.0747 0.1933
0.31 0.0741 0.1912
5 0.4
0.71 0.1202 0.253
0.61 0.1189 0.2498
0.51 0.1175 0.2466
0.41 0.116 0.2433
0.31 0.1143 0.24
6 0.45
0.71 0.169 0.305
0.61 0.166 0.3004
0.51 0.1628 0.2957
0.41 0.1595 0.291
0.31 0.156 0.2863
Source: Research Findings

258/ Tax Evasion in Oil-Exporting Countries: The Case of Iran
Table 8: Effect of Increase of Detection Probability on Tax Evasion in Second
Case of the Government Budget (Object: Minimum Tax Evasion)
Row
Degree of
Government
Externality
Detection
Probability
Optimal
Economic
Growth Rate
Minimum
Optimal Rate
of Tax
Evasion
1 0.25
0.71 0.0101 0.0913
0.61 0.0102 0.095
0.51 0.0102 0.0984
0.41 0.0101 0.1016
0.31 0.0101 0.1046
2 0.3
0.71 0.0388 0.1458
0.61 0.0386 0.1513
0.51 0.0383 0.1563
0.41 0.0379 0.1609
0.31 0.0373 0.1649
3 0.31
0.71 0.0456 0.1566
0.61 0.0454 0.1625
0.51 0.0449 0.1678
0.41 0.0443 0.1725
0.31 0.0436 0.1766
4 0.35
0.71 0.0762 0.1998
0.61 0.0752 0.2067
0.51 0.0739 0.2127
0.41 0.0723 0.2179
0.31 0.0703 0.2222
5 0.4
0.71 0.1202 0.253
0.61 0.1174 0.2606
0.51 0.1138 0.2669
0.41 0.1096 0.2717
0.31 0.1048 0.2753
6 0.45
0.71 0.169 0.305
0.61 0.1625 0.3125
0.51 0.1548 0.318
0.41 0.1463 0.3216
0.31 0.1373 0.3233
Source: Research Findings
Iran. Econ. Rev. Vol. 21, No.2, 2017 /259
Table 9: Effect of Increase of Fine Rate on Tax Evasion in Second Case of the
Government Budget (Object: Maximum Economic Growth Rate)
Row
Degree of
Government
Externality
Fine Rate
Optimal
Economic
Growth Rate
Optimal
Rate of Tax
Evasion
1 0.25
0.4 0.0102 0.0961
0.3 0.0102 0.0891
0.2 0.0102 0.0889
0.1 0.0102 0.0869
2 0.3
0.4 0.0424 0.1518
0.3 0.0387 0.142
0.2 0.0384 0.1413
0.1 0.0382 0.1379
3 0.31
0.4 0.0494 0.1626
0.3 0.0454 0.1525
0.2 0.0451 0.1517
0.1 0.0448 0.1479
4 0.35
0.4 0.0802 0.2055
0.3 0.0755 0.1942
0.2 0.0744 0.1925
0.1 0.0734 0.1873
5 0.4
0.4 0.1241 0.2584
0.3 0.1182 0.2451
0.2 0.115 0.242
0.1 0.1124 0.2345
6 0.45
0.4 0.1721 0.3101
0.3 0.1643 0.2944
0.2 0.1574 0.2889
0.1 0.1519 0.2787
Source: Research Findings
Based on Table 9, when the objective is maximum economic
growth and the policy of the increase of fine rate is considered, with
increasing of this policy parameter, tax evasion rate increases.
3.2.4. Increase of Fine Rate from 10% to 40% (Object: Minimum Tax Evasion)
Table 10 shows the effect of increase of fine rate with objective of
minimum tax evasion.

260/ Tax Evasion in Oil-Exporting Countries: The Case of Iran
Table 10: Effect of Increase of Fine Rate on Tax Evasion in Second Case of the
Government Budget (Objective: Minimum Tax Evasion)
Row
Degree of
Government
Externality
Fine Rate
Optimal
Economic
Growth Rate
Optimal Rate
of Tax
Evasion
1 0.25
0.4 0.0101 0.0913
0.3 0.0102 0.0977
0.2 0.0101 0.1033
0.1 0.0099 0.1082
2 0.3
0.4 0.0424 0.1518
0.3 0.0384 0.1553
0.2 0.0376 0.1632
0.1 0.0363 0.1695
3 0.31
0.4 0.0494 0.1626
0.3 0.0451 0.1666
0.2 0.044 0.1749
0.1 0.0423 0.1813
4 0.35
0.4 0.0802 0.2055
0.3 0.0743 0.2115
0.2 0.0712 0.2204
0.1 0.0672 0.2265
5 0.4
0.4 0.1241 0.2584
0.3 0.1147 0.2656
0.2 0.1071 0.2739
0.1 0.098 0.278
6 0.45
0.4 0.1721 0.3101
0.3 0.1567 0.317
0.2 0.1414 0.3228
0.1 0.1249 0.3233
Source: Research Findings
Based on Table 10, it is evident that when the objective is
minimum tax evasion, the relationship between variations of fine rate
and tax evasion is negative. Here, the effect of increase of fine rate on
tax evasion is analogous with the previous studies. It is meant to
suggest that with increasing of fine rate, tax evasion decreases.
3.2.5. Increase of the Private Sector’s Cost Parameter from 10% to 30% for Tax
Evasion
In this section, the effects of increase of the private sector’s cost
parameter for tax evasion are examined. In this regard, the value of

Iran. Econ. Rev. Vol. 21, No.2, 2017 /261
this policy parameter has been increased from 10% to 40% with 10%
steps and is shown in Table 11.
Table 11: Effect of Increase of Household’s Cost Parameter for Tax Evasion on
Tax Evasion in Second Case of the Government Budget
Row
Degree of
Government
Externality
Household Cost
for Tax Evasion
Optimal
Economic
Growth Rate
Optimal
Rate of Tax
Evasion
1 0.25
0.1 0.0091 0.2421
0.2 0.0126 0.1546
0.3 0.0129 0.1114
2 0.3
0.1 0.0261 0.3448
0.2 0.0394 0.2353
0.3 0.0421 0.1727
3 0.31
0.1 0.0291 0.3623
0.2 0.0453 0.2508
0.3 0.0489 0.1849
4 0.35
0.1 0.0395 0.4234
0.2 0.0694 0.3096
0.3 0.0787 0.2327
5 0.4
0.1 0.0478 0.4827
0.2 0.0981 0.3758
0.3 0.1195 0.2907
6 0.45
0.1 0.0512 0.5277
0.2 0.122 0.4332
0.3 0.162 0.346
Source: Research Findings
We can conclude that from Table 11 in different levels of the
external effects of the government, when the private sector’s cost
parameter for tax evasion, tax evasion decreases.
In this section, by considering the second case of the government
budget, the effects of policy parameters of detection probability, fine
rate, and the private sector’s cost for tax evasion on the tax evasion
were examined. At first, by investigating the effect of parameter of
detection probability, it became clear that when the objective is the
maximum economic growth, there is an inverse relationship between
probability of detection and tax evasion; but when the objective is
minimum tax evasion, there is a reverse relationship between

262/ Tax Evasion in Oil-Exporting Countries: The Case of Iran
probability of detection and tax evasion. Therefore, regarding the
government externality, we conclude that the effect of variation of
probability of detection on tax evasion is ambiguous, and based on the
objective may be positive or negative. This conclusion is also similar
to the effect of fine rate on tax evasion. Additionally, the relationship
between the private sector’s cost parameter for tax evasion to tax
evasion is reverse. It should be noted here that the results of policy
parameters on tax evasion in two cases of the government budget are
similar.
4. Conclusion
In this study, the effects of policy parameters including probability of
detection, fine rate and the private sector’s cost parameter for tax
evasion to tax evasion were investigated. Thus, the effects of these
policy parameters in the two cases of the government budget were
examined. Results show that in both cases, based on the objective of
economic growth maximization or tax evasion minimization, the
effect of detection probability and fine rate on tax evasion is different.
When the objective is maximum economic growth, the effect of these
two policy parameters on tax evasion is positive. Otherwise, when the
objective is minimum tax evasion, the relationship between two policy
parameters with tax evasion is negative.
Accordingly, considering different levels of the government
externality, the overall conclusion is that the effect of variation in the
parameter of detection probability and fine rate on tax evasion is
ambiguous and based on the objective, may be positive or negative.
Furthermore, by exploring the effect of increase of the private sector’s
cost parameter of on tax evasion, we conclude that by increasing of
this policy parameter in different levels of the government externality,
tax evasion decreases. Thus, with the difference that the rates of
economic growth in the second case of the budget are lower than the
first case, the economic conditions in both cases of government
budget could be the same. This implies the restrictive effect of oil
revenues on economic growth in Iran.
To put it another way, entering oil revenues into government
budget leads to Dutch disease and decreases economic growth.
Consequently, in order to achieve higher economic growth rate, the

Iran. Econ. Rev. Vol. 21, No.2, 2017 /263
government budget need to be more dependent on tax revenues.
Another result is that due to the presence of oil revenues in the second
case of government budget, tax evasion will be lower; because the
dependence of government budget on tax incomes is lower and as a
result the tax evasion decreases.
It should be noted that based on Chen (2003), the ambiguity of effect
of detection probability and fine rate on tax evasion was observed, and
the results of this study signify the ambiguous effect of these two
factors on optimal amount of tax evasion. Besides, based on Gillman
and Kejak (2008), for a certain policy, tax evasion leads to the decrease
of effective tax rate and the result shows that in the case of minimum
tax evasion, the relationship between tax evasion and effective tax rate
is reverse. In addition, Allingham and Sandmo (1972), Witte and
Woodbury (1985), Lin and Yang (2001), and Cule and Fulton (2009)
signified the reverse relationship of variation of detection probability
and fine rate with tax evasion and the result of this study demonstrates
that based on targeting, this relationship can be reverse.
For further studies, by calibration, the researchers can focus on the
analysis of the effects of increase of government expenditure or
revolve around model analysis by adding government services in
utility function of private sector and investigation of tax evasion in the
framework of Dynamic Stochastic General Equilibrium (DSGE).
References
Allingham, M. G., & Sandmo, A. (1972). Income Tax Evasion: A
Theoretical Analysis. Journal of Public Economics, 1, 323-338.
Arabi, H. (2008). The Effect of Trade Liberalization on Poverty and
Income Distribution in Iran through Computable General Equilibrium
Model (Unpublished Thesis). Shiraz Islamic Azad University, Shiraz.
Aschauer, D. A. (1989). Is Public Expenditure Productive? Journal of
Monetary Economics, 23, 177-200.
264/ Tax Evasion in Oil-Exporting Countries: The Case of Iran
Azizkhani, F., & Afshari, G. (2007). Tax Evasion and Its Effect on GDP
and Income Distribution. Majlis and Research, 12(49-50), 395-422.
Barro, R. J. (1990). Government Spending in a Simple Model of
Endogenous Growth. Journal of Political Economy, 98(5), S103-S125.
Barro, R. J., & Sala-i-Martin, X. (2004). Economic Growth (2nd
Ed.).
London: MIT Press.
Blackburn, K., Bose, N., & Capasso, S. (2012). Tax Evasion: The
Underground Economy and Financial Development. Journal of
Economic Behavior & Organization, 83(2), 243-253.
Cagan, P. (1958). The Demand for Currency Relative to Total Money
Supply. Journal of Political Economy, 66, 303-29.
Chen, B. L. (2003). Tax Evasion in a Model of Endogenous Growth.
Review of Economic Dynamics, 6(2), 381-403.
Cule, M., & Fulton, M. (2009). Business Culture and Tax Evasion:
Why Corruption and the Unofficial Economy Can Persist. Journal of
Economic Behavior & Organization, 72(3), 811-822.
Eichhorn, C. (2004). Tax Evasion and Economic Growth - A
Neutrality Result. Retrieved from
https://www.ethz.ch/content/dam/ethz/special-interest/mtec/cer-eth /
resource-econ-dam/documents/research/ws-and-conf/sgvs-2005/147.pdf
Fakhari, H., Ramezani, A. A., & Ibrahimi, M. (2010). The Analysis of
Effects of Legal, Executive, Economic and Environmental Factors on
Tax Evasion, Fourth Conference of Fiscal and Tax Policies of Iran
(617-634). Shiraz: Shiraz University.
Feige, E. L. (1989). The Underground Economics: Tax Evasion and
Information Distortion. Cambridge: Cambridge University Press.

Iran. Econ. Rev. Vol. 21, No.2, 2017 /265
Freire-Serén, M. J., & Panadés i Marti, J. (2013). Tax Avoidance,
Human Capital Accumulation and Economic Growth. Economic
Modelling, 30, 22- 29.
Gillman, M., & Kejak, M. (2008). Tax Evasion and Growth: A Banking
Approach. IEHAS Discussion Papers, 0806, Retrieved from
http://econ.core.hu/file/download/mtdp/MTDP0806.pdf.
Ghorbani, S., & Alilo, R. (2010). The Study of Solutions for
Promotion of Tax Culture: A Case Study on Manufacturing
Companies of Tabriz Town. Fourth National Conference of Fiscal
and Tax Policies (638-656). Shiraz: Shiraz University.
Hadian, E., & Tahvili, A. (2013). Identification of Factors Affecting
Tax Evasion in Economy of Iran. Quarterly Journal of Planning and
Budgeting, 18(2), 39-58.
Hindriks, J., & Myles, G. D. (2006). Intermediate Public Economics.
London: MIT Press.
Kato, H., & Yanagihara, M. (2005). Capital Income Tax Evasion and
Welfare Levels in an Overlapping Generation Model. Economic
Research Center Discussion Paper, Retrieved from
https://www.researchgate.net/profile/Mitsuyoshi_Yanagihara/publication
/37504737_Capital_Income_Tax_Evasion_and_Welfare_Levels_in_an_
Overlapping_Generations_Model/links/0c96053bf9862bf71e000000/Cap
ital-Income-Tax-Evasion-and-Welfare-Levels-in-an-Overlapping-
Generations-Model.pdf.
Kesselman, J. R. (1989). Income Tax Evasion: An Inter-sectoral
Analysis. Journal of Public Economics, 38(2), 137-182.
Levaggi, R., & Menoncin, F. (2013). Optimal Dynamic Tax Evasion.
Journal of Economic Dynamics & Control, 37(11), 2157- 2167.
---------- (2012). Tax Audits, Fines and Optimal Tax Evasion in a
Dynamic Context. Economics Letters, 117(1), 318-321.
266/ Tax Evasion in Oil-Exporting Countries: The Case of Iran
Lin, W. Z., & Yang, C. C. (2001). A Dynamic Portfolio Choice Model
of Tax Evasion: Comparative Statistics of Tax Rates and Its
Implication for Economic Growth. Journal of Economic Dynamics &
Control, 25(11), 1827-1840.
Mosavi Jahromi, Y., Tahmasbi Boldaji, F., & Khaki, N. (2009). Tax
Evasion in a Value-added Tax System: A Theoretical Model.
Quarterly Journal of Tax Research, 5(53), 27-38.
Nicolini, J. P. (1998). Tax Evasion and the Optimal Inflation Tax.
Journal of Development Economics, 55(1), 215-232.
Ostad Mohammad, S., & Farhoodi, G. (2010). The Analysis of the
Role of Endogenous and Exogenous Factors Affecting Tax
Consistency. Fourth National Conference of Fiscal and Tax Policies
of Iran (473-510). Shiraz: Shiraz University.
Pickhardt, M., & Prinz, A. (2014). Behavioral Dynamics of Tax
Evasion: A Survey. Journal of Economic Psychology, 40, 1-19.
Rezai, M. G., Khademi Jamkhane, A. A., & Montazer Al-zohor, M.
(2010). The Significance of Change and Compliance in Reformation
of Tax System: International Experience and Challenges of Tax
System of Iran. Quarterly Journal of Tax Research, 9(57), 83-99.
Samadi, A. H., & Tabandeh, R. (2013). Tax Evasion in Iran: An
Analysis of Causes, Effects and Estimation of Its Level. Quarterly
Journal of Tax Research, 19(67), 77-106.
Seyed Norani, M. R. (2009). Tax Evasion and Economic Growth of
Iran. Tehran: Research Center for Islamic Consultative Council.
Shahnazi, R., Khoshakhlagh, R., & Renani, M. (2012). The Optimal
Assignment of Government Oil Incomes: A Case Study on Islamic
Republic of Iran. Quarterly Journal of Energy and Environmental
Economics, 1(3), 35-65.
Iran. Econ. Rev. Vol. 21, No.2, 2017 /267
Skinner, J., & Slemrod, J. (1985). An Economic Perspective on Tax
Evasion. National Tax Journal, 38(3), 345-353.
Tonin, M. (2011). Minimum Wage and Tax Evasion: Theory and
Evidence. Journal of Public Economics, 95(11-12), 1635-1651.
Witte, A. D., & Woodbury, D. F. (1985). The Effect of Tax Laws and
Tax Administration on Tax Compliance: The Case of the U.S
Individual Income Tax. National Tax Journal, 38(1), 1-13.
Yaniv, G. (1990). Tax Evasion under Differential Taxation: The
Economics of Income Source Misreporting. Journal of Public
Economics, 43(3), 327-337.
Yitzhaki, S. (1974). Income Tax Evasion: A Theoretical Analysis.
Journal of Public Economics, 3, 201-202.
Zelner, A. (1970). Estimation of Regression Relationships Containing
Unobservable Variables. International Economic Review, 11(3), 441-
454.
Zodrow, G. R. & Diamond, J. W. (2013). Dynamic Overlapping
Generations, Computable General Equilibrium Models and the
Analysis of Tax Policy: The Diamond-Zodrow Model. Handbook of
CGE Modeling, 11(1), 743- 813.