tax chronology of south africa: 1979–2015 and publications...tax chronology of south africa:...
TRANSCRIPT

Tax Chronology of South Africa: 1979–2015
Supplement to the South African
Reserve Bank Quarterly Bulletin
March 2015
South African Reserve Bank
Tax Chronology of South Africa: 1979–2015
Supplement to the South AfricanReserve Bank Quarterly Bulletin
March 2015

Tax Chronology: 1979–2015
© South African Reserve Bank
All rights reserved. No part of this publication may be reproduced, stored in a retrieval system, or transmitted in any form or by any means, electronic, mechanical, photocopying, recording or otherwise, without fully acknowledging the Tax Chronology of South Africa: 1979–2015 of the South African Reserve Bank as the source. The contents of this publication are intended for general information only and are not intended to serve as financial or other advice. While every precaution is taken to ensure the accuracy of information, the South African Reserve Bank shall not be liable to any person for inaccurate information or opinions contained in this publication.
Enquiries relating to this Supplement should be addressed to:
Head: Economic Research and Statistics Department South African Reserve Bank P O Box 427 Pretoria 0001 Tel. +27 12 313-3874/3668
http://www.reservebank.co.za
Acknowledgements
Many people need to be thanked for their invaluable input, suggestions and comments. Although it is not possible to mention all contributors by name, of note, are Johan van den Heever, Vukani Mamba and various other senior members of the Economic Research and Statistics Department of the South African Reserve Bank (the Bank). We also thank the Publishing Section, especially Ronel Thomas and Tracy Muller of the Group Strategy and Communications Department of the Bank as well as, Kym Naidoo of the Economic Research and Statistics Department. We would also like to thank staff members from National Treasury, and here we need to mention members by name: Muzi Mathema and Cecil Mordem, and staff from the South African Revenue Service for their invaluable contributions to this publication.
The compilation of the Tax Chronology of South Africa: 1979–2015 would not have been possible if it were not for the efforts of the following members of the Bank’s Public Finance Division:
Mandy Barends, Eldoret Gerber, Christelle Groenewald, Theresa Gumbi, Selwyn Jacobs, Lize Janse van Rensburg, Tshegofatso Mashele, Thabo Mboweni, Mogale Phakedi, Victor Ramphele, and Abonga Sodawe.
Michael Adams Head: Public Finance Division

Tax Chronology: 1979–2015
Contents1. Basis of the tax system ....................................................................................................... 1 1.1 Introduction ................................................................................................................... 1 1.2 Source-based income tax before 2001 ......................................................................... 1 1.3 Residence-based income tax from 2001 onwards ........................................................ 1
2. Taxes on income, profits and capital gains ....................................................................... 1 2.1 Persons and individuals ................................................................................................ 1 2.1.1 Interest and dividend income exemption .......................................................... 2 2.1.2 Discontinuation of the standard income tax on employees (SITE) system......... 3 2.1.3 Exchange controls ............................................................................................ 3 2.1.4 Encouragement to take out medical scheme membership ............................... 4 2.1.5 Motor vehicle allowance ................................................................................... 5 2.1.6 Employee-related fringe benefits ...................................................................... 5 2.1.7 Retrenchment package merger ........................................................................ 5 2.1.8 Pre-retirement lump-sump taxation .................................................................. 5 2.1.9 Tax on income of retirement funds.................................................................... 6 2.1.10 Taxation of lump sums upon retirement ............................................................ 6 2.2 Corporations and other enterprises .............................................................................. 8 2.2.1 Graduated tax on small business corporations ................................................. 9 2.2.2 Mining companies .......................................................................................... 11 2.2.3 Oil and gas companies ................................................................................... 13 2.2.4 Insurance companies ..................................................................................... 14 2.2.5 Employment companies ................................................................................. 15 2.2.6 Personal service providers that are companies .............................................. 16 2.2.7 Companies which are not resident and derive taxable income ....................... 16 2.2.8 Tax holiday companies ................................................................................... 16 2.2.9 Public benefit organisations or recreational clubs ........................................... 17 2.2.10 Micro businesses ............................................................................................ 18 2.2.11 Regional Services Council (RSC) levy reform .................................................. 19 2.2.12 Treatment of collective investment scheme distributions ................................ 19 2.2.13 Energy-efficency savings tax incentive ........................................................... 19 2.2.14 Environmental fiscal reform ............................................................................. 19 2.2.15 Emission reduction credits from clean development projects ......................... 19 2.2.16 Tax incentives to support industrial policy ....................................................... 19 2.2.17 Bursaries for relatives of employees ............................................................... 20 2.3 Capital gains tax ......................................................................................................... 20
3. Taxes on payroll and workforce ........................................................................................ 21 3.1 Skills development levy ............................................................................................... 21
4. Taxes on property .............................................................................................................. 21 4.1 Estate, inheritance and gift taxes ................................................................................ 22 4.1.1 Estate duty ....................................................................................................... 22 4.1.2 Transfer duty .................................................................................................... 22 4.1.3 Donations tax ................................................................................................... 23 4.2 Taxes on financial and capital transactions ................................................................. 23 4.2.1 Marketable securities tax ................................................................................. 24 4.2.2 Uncertified securities tax .................................................................................. 24
5. Taxes on goods and services ........................................................................................... 24 5.1 Trends in General Sales Tax (GST) and Value-added Tax (VAT) ................................... 24 5.2 VAT voluntary registration threshold ............................................................................ 25 5.3 False statements on VAT reforms ................................................................................ 25 5.4 VAT and residential property developers ..................................................................... 25 5.5 Specific excise duties .................................................................................................. 26 5.6 Ad valorem excise duties ............................................................................................ 26 5.7 General fuel levy ......................................................................................................... 28

Tax Chronology: 1979–2015
5.8 Mineral and petroleum royalties ..................................................................................30 5.9 Base oils for lubricating ...............................................................................................30 5.10 Plastic bag levy (environmental levy) ...........................................................................30 5.11 Electricity tax/levy .......................................................................................................30 5.12 Taxation of incandescent (filament) light bulbs ............................................................ 31 5.13 Carbon dioxide vehicle emission tax ........................................................................... 31 5.14 Taxes on use of goods and permission to use goods or to perform activities ............. 32 5.15 Mining leases and ownership ...................................................................................... 32
6. Taxes on international trade and transactions ................................................................ 32 6.1 Surcharge on imports ................................................................................................. 33
7. Other taxes .........................................................................................................................34 7.1 Stamp duty .................................................................................................................34 7.2 Implementing the Municipal Property Rate Act ........................................................... 35 7.3 Closure of sophisticated tax loopholes ....................................................................... 35 7.4 Tax expenditure statements ........................................................................................ 35
8. National goverment tax revenue .......................................................................................36
9. Annexures: Personal income tax rate and bracket adjustments ...................................38 Annexure A: Budget Review 1979 ........................................................................................38 Annexure B: Budget Review 1980 ........................................................................................ 40 Annexure C: Budget Review 1981 ........................................................................................ 42 Annexure D: Budget Review 1982 ........................................................................................44 Annexure E: Budget Review 1983 ........................................................................................ 46 Annexure F: Budget Review 1984 ........................................................................................ 48 Annexure G: Budget Review 1985........................................................................................ 50 Annexure H: Budget Review 1986 ........................................................................................ 52 Annexure I: Budget Review 1987 .......................................................................................... 54 Annexure J: Budget Review 1988 ........................................................................................ 56 Annexure K: Budget Review 1989 ........................................................................................ 58 Annexure L: Budget Review 1990 ........................................................................................60 Annexure M: Budget Review 1991 ....................................................................................... 62 Annexure N: Budget Review 1992 ........................................................................................64 Annexure O: Budget Review 1993........................................................................................65 Annexure P: Budget Review 1994 ........................................................................................66 Personal income tax relief .................................................................................................... 67 Annexure Q: Budget Review 1995........................................................................................68 Annexure R: Budget Review 1996 ........................................................................................68 Annexure S: Budget Review 1997 ........................................................................................69 Annexure T: Budget Review 1998.........................................................................................69 Annexure U: Budget Review 1999 ........................................................................................ 70 Annexure V: Budget Review 2000 ........................................................................................ 70 Annexure W: Budget Review 2001 ....................................................................................... 71 Annexure X: Budget Review 2002 ........................................................................................ 71 Annexure Y: Budget Review 2003 ........................................................................................ 72 Annexure Z: Budget Review 2004 ........................................................................................ 72 Annexure AA: Budget Review 2005 ..................................................................................... 73 Annexure AB: Budget Review 2006 ..................................................................................... 73 Annexure AC: Budget Review 2007 ..................................................................................... 74 Annexure AD: Budget Review 2008 ..................................................................................... 74 Annexure AE: Budget Review 2009...................................................................................... 75 Annexure AF: Budget Review 2010 ...................................................................................... 75 Annexure AG: Budget Review 2011 ...................................................................................... 76 Annexure AH: Budget Review 2012 ...................................................................................... 76 Annexure AI: Budget Review 2013 ....................................................................................... 77 Annexure AJ: Budget Review 2014 ...................................................................................... 77 Annexure AK: Taxable income level in 2015/16 price terms in which maximum
marginal rate kicks in (R per annum) .............................................................. 78

1Tax Chronology: 1979–2015
Tax chronology
1. Basis of the South African tax system
1.1 Introduction
This publication covers the period 1979 to 2015. Although the South African Revenue Service (SARS) publishes information on the South African tax system in various documents, no previous supplement of this nature has been published by the South African Reserve Bank (the Bank) before. This supplement provides an overview of the current and historical rates for various taxes, duties and levies collected by SARS. For the most important types of taxes, the coverage goes back to 1979, but for the less important ones, only a more recent subset is covered. While care has been taken in the preparation of this document to ensure that the rates published at the date of publication are correct, minor errors may have occurred. The contents are intended for general purpose and research only and are not intended to serve as financial or other advice.
This publication will be updated and published every five years. Updates for the years in between will only be added on the Bank’s website.
1.2 Source-based income tax before 2001
This is a tax system where income is taxed in the country where it originates. Its point of departure is that irrespective of residence, any person who derives income in a country should contribute to the cost of rendering government services in that country.
1.3 Residence-based income tax from 2001 onwards
Residents of a country are taxed on their income, irrespective of where in the world that income is earned, and non-residents are only subject to tax on domestic source income. This dispensation commenced on 1 January 2001.
2 Taxes on income, profits and capital gains
2.1 Persons and individuals*
Table 2.1.1 Marginal tax rates applicable to top income group
Period
Top income group starts at annual income of:
(Rand)
Marginal rate (Per cent)
Married Single
1961/62–1968/69 .......................................... 50 50
1969/70–1970/71 .......................................... 45 45
1971/72–1978/79 .......................................... 60 60
1979/80 ......................................................... 55 55
1980/81–1981/82 .......................................... 50 50
1982/83 ......................................................... 50 50
1983/84–1986/87 .......................................... 50 50
1987/88–1989/90 .......................................... 45 45
1990/91 ......................................................... 44 44
1991/92–1994/95 .......................................... 43 43
1995/96–1999/2000 ...................................... 45 45
2000/01–2001/02 .......................................... 42 42
2002/03–2014/15 .......................................... 40 40
2015/16 ......................................................... 701 301* 701 301* 41 41
* Annexure AK: Taxable income level in 2015/16 price terms in which the maximum marginal rate kicks in (R per annum)

Tax Chronology: 1979–20152
Table 2.1.2 Personal income tax rate and bracket adjustments
2014/15 2015/16
Taxable income(R per annum) Rates of tax
Taxable income(R per annum) Rates of tax
R1–R174 550 18 per cent of each R1 R1–R181 900 18 per cent of each R1
R174 551–R272 700 R31 419 + 25 per cent of the amount above R174 550
R181 901–R284 100 R32 742 + 26 per cent of the amount above R181 900
R272 701–R377 450 R55 957 + 30 per cent of the amount above R272 700
R284 101–R393 200 R59 314 + 31 per cent of the amount above R284 100
R377 451–R528 000 R87 382 + 35 per cent of the amount above R377 450
R393 201–R550 100 R93 135 + 36 per cent of the amount above R393 200
R528 001–R673 100 R140 074 + 38 per cent of the amount above R528 000
R550 101–R701 300 R149 619 + 39 per cent of the amount above R550 100
R673 101 and above R195 212 + 40 per cent of the amount above R673 100
R701 301 and above R208 587 + 41 per cent of the amount above R701 300
Rebates 2014/15 Rebates 2015/16
Primary R12 726 Primary R13 257
Secondary R 7 110 Secondary R 7 407
Tertiary R 2 367 Tertiary R 2 466
Tax threshold Tax threshold
Below age 65 R70 700 Below age 65 R73 650
Age 65 and over R110 200 Age 65 and over R114 800
Age 75 and over R123 350 Age 75 and over R128 500
To ensure that the direct personal income tax burden on individuals remains reasonable, personal income tax brackets and rebates are adjusted to take account of inflation or ‘bracket creep’, and occasionally also to provide limited real tax relief. In addition to the primary and secondary rebates, a third rebate was introduced for taxpayers of 75 years and older from 1 March 2011.
From 1 March 2015, a natural person of any age is exempt from provisional tax if:
– he/she does not carry on any business; and
– his/her taxable income is below the tax threshold; or
– his/her taxable income derived from interest, foreign dividends and rental from fixed property does not exceed R30 000.
2.1.1 Interest and dividend income exemption
Table 2.1.1.1 Interest and dividend income exemption
Fiscal year Under 65 years 65 years and over
Pre-2000 ............................................................................................... R2 000 R2 000
Budget Review 2000* ............................................................................ R3 000 R4 000
Budget Review 2001* ............................................................................ R4 000 R5 000
Budget Review 2002* ............................................................................ R6 000 R10 000
Budget Review 2003* ............................................................................ R10 000 R15 000
Budget Review 2004* ............................................................................ R11 000 R16 000
Budget Review 2005* ............................................................................ R15 000 R22 000
Budget Review 2006* ............................................................................ R16 500 R24 500
Budget Review 2007*… ........................................................................ R18 000 R26 000
Budget Review 2008* ............................................................................ R19 000 R27 500
Budget Review 2009* ............................................................................ R21 000 R30 000
Budget Review 2010* ............................................................................ R22 300 R32 000
Budget Review 2011* ............................................................................ R22 800 R33 000
* Effective from 1 March following the budget announcement

3Tax Chronology: 1979–2015
The exemption applicable to foreign interest and foreign dividend income was increased from R3 500 per annum to R3 700 per annum, as from 1 March 2010. From 1 March 2012, this exemption was repealed.
Withholding tax on dividends took effect on 1 April 2012, replacing secondary tax on companies. The introduction of the tax corrected the impression that a tax on dividends is another tax on businesses. Legally and economically, dividend tax is a tax on individuals and non-resident shareholders. Refer to company tax page 8 and 9.
Table 2.1.1.2 Withholding tax on dividends
Withholding tax on dividends Rate (Per cent)
Budget Review 2012 ........................................................................................................... 15
Budget Reviews 2013–2015* .............................................................................................. 15
* Effective from 1 April 2012 following the budget announcement
2.1.2 Discontinuation of the standard income tax on employees (SITE) system
The standard income tax on employees (SITE) system was introduced in March 1988 for the tax year 1988/89 to limit the number of personal income tax returns filed annually, freeing resources to deal with more complicated returns. Government repealed SITE with effect from 1 March 2011. It has systematically been phased out as from the 2012–2014 tax years. It was totally abolished with effect from 1 March 2013.
2.1.3 Exchange controls
– From 15 February 2006, the offshore capital investment allowance for individuals was increased from R750 000 to R2 million per person. From 27 October 2009, the R2 million was increased to R4 million. From 5 November 2010, the one-off limit was replaced with an annual limit. From 1 April 2015, the R4 million was increased to R10 million per annum.
– From 15 February 2006, the requirement by South African corporates and mandated parastatals to obtain a majority interest of 50 per cent plus 1 share of foreign direct investments was replaced with a lower significant interest of at least 25 per cent.
Modernising capital flow management
The exchange control manual is in the process of being modernised and split into two manuals which deal with Authorised Dealers and Authorised Dealers with Limited Authority. Guidance documents will be issued covering transactions for business entities and individuals.
The following threshold changes took effect from 1 April 2015:
− Authorised Dealers may process corporate investment up to R1 billion per year, from R500 million previously, as well as carrying forward any unused allowances.
− South African residents’ foreign capital allowance increased from R4 million to R10 million per calendar year or upon emigration, and from R8 million to R20 million per family unit.
− The subcategories under the individual single discretionary allowance was removed and the annual R1 million allowance may be used for any legal purpose abroad.
− The dispensation for credit card usage, currently limited to individuals, was extended to corporates.
Exchange control amnesty
In 2003 an exchange control amnesty with accompanying tax measures was enacted to provide an opportunity for South Africans to regularise illegal offshore income and assets.
The objectives of the amnesty process were to:
– broaden the tax base and increase future revenue collections through the disclosure of assets;
– enable SARS to regularise taxpayers’ affairs without them being prosecuted;

Tax Chronology: 1979–20154
– provide SARS and the Bank with details of foreign assets; and– facilitate the repatriation of foreign assets to South Africa without fear of recrimination.
Amnesty applicants could disclose or repatriate offshore amounts, subject to prescribed levy payments of 10 per cent or 5 per cent respectively, with an additional 2 per cent for accompanying domestic tax violations.
The amnesty window period was initially from 1 June 2003 to 30 November 2003, but it was extended to 29 February 2004 in view of various changes to the regulations and the strong growth in applications received in October and November 2003.
Over 43 000 applications were submitted in total. At finalisation, 42 672 were adjudicated of which 456 were duplicates.
The total foreign assets disclosed in amnesty applications amounted to R68,6 billion.
2.1.4 Encouragement to take out medical scheme membership
From 1 March 2006, the following arrangements applied:
– A monthly monetary cap that takes into account the number of beneficiaries covered by medical scheme membership replaced the two-thirds tax-free provision.
– The threshold for individual tax-deductible medical expenses increased from 5,0 to 7,5 per cent of income.
– Taxpayers who were 65 years and older continued to enjoy full deduction for all medical expenses.
Table 2.1.4.1 Medical deductions
Effective dateFor each of the first
two beneficiaries For each additional
beneficiary
01/03/2007 ........................................................................ R500 to R530 R300 to R320
01/03/2008 ........................................................................ R530 to R570 R320 to R345
01/03/2009 ........................................................................ R570 to R625 R345 to R380
01/03/2010 ........................................................................ R625 to R670 R380 to R410
01/03/2011 ........................................................................ R670 to R720 R410 to R440
01/03/2012 (medical tax credit) .......................................... R216 to R230 R144 to R154
01/03/2013 ........................................................................ R230 to R242 R154 to R162
01/03/2014 ........................................................................ R242 to R257 R162 to R172
01/03/2015 ........................................................................ R257 to R270 R172 to R181
Effective from 1 March 2012, the following applied:
– Medical deductions were converted to medical tax credits. – Income tax deductions for medical scheme contributions for taxpayers who were below the
age of 65 years were converted into tax credits.
Effective from 1 March 2015, the following applied:
– All medical expenses for all taxpayers (below the age of 65 years and 65 years or older) were converted into tax credits.
Effective from 1 March 2015, the following applied:
– Taxpayers who were 65 years and older were required to pay provisional tax. – Individuals who were 65 years and older were exempt from provisional tax if they were
not company directors and only received employment income, interest, rental income or dividends amounting to a taxable income of up to R80 000. The threshold was increased to R120 000.
5Tax Chronology: 1979–2015
2.1.5 Motor vehicle allowance
From 1 March 2005, the deemed method for calculating fixed business travel cost was adjusted by introducing a residual value element and by capping the maximum car value at R360 000. The revised tables assumed that five-year old vehicles commonly had a 30 per cent residual value.
The deemed private kilometres were increased from 14 000 to 16 000 on 1 March 2005, and to 18 000 on 1 March 2006.
From 1 March 2006, the percentage of the monthly motor vehicle allowances subject to tax was increased from 50 per cent to 60 per cent. From 1 March 2009, the percentage of the monthly motor vehicle allowances subject to tax was increased from 60 per cent to 80 per cent.
From 1 March 2010, the deemed business kilometre procedure was scrapped. A logbook has to be kept for actual business kilometres travelled to record beginning and end readings of the trip. From 1 March 2014 the maximum car value was fixed at R560 000.
Company cars
In order to pre-empt a switch from travel allowance arrangements to company cars over the short to medium term, the deemed value of a company car was increased from 1,8 per cent per month of the car’s value to 2,5 per cent from 1 March 2006. The deemed value of a second or additional company car remained at 4 per cent per month.
The deemed maintenance and fuel costs were adjusted to reflect the latest applicable average running cost rates for motor vehicles, and would be reviewed annually in future.
For value-added tax (VAT) purposes, the value for the deemed supply of the right of use of a motor vehicle is determined by applying a percentage to the determined value of the vehicle.
The company car fringe benefit rules were tightened by increasing the deemed monthly taxable values. This amendment would limit the potential abuse of company car fringe benefits. With effect from 1 March 2011, the vehicle fringe benefit changed to 3,5 per cent for a company car without a maintenance plan and 3,25 per cent for a company car with a maintenance plan.
Use of a company car by an employee is a taxable fringe benefit based on the market value of the vehicle. To align the treatment of company car fringe benefits for all employees, government introduced a requirement that actual retail market value be used in all cases.
2.1.6 Employee-related fringe benefitsEmployer contributions would be deemed to be a fringe benefit in the hands of the employee. Both employee and employer contributions would then be deductible, up to a limit, for income-tax purposes by the employee.
The employee accommodation threshold was increased from R59 750 to R63 556 per annum with effect from 1 March 2012. The accommodation threshold was further increased as follows:
– R63 556 to R67 111 on 1 March 2013; and
– R67 111 to R70 700 on 1 March 2015.
2.1.7 Retrenchment package mergerThe R30 000 income tax exemption for retrenchment packages has not been adjusted for years. From 1 March 2011, the R30 000 exemption was repealed.
The above repealed exemption was merged into the retirement lump sum tax exemption. In future, all retirement and retrenchment lump sum payments would be treated equally.
2.1.8 Pre-retirement lump-sump taxationPre-retirement lump-sump taxation came into effect on 1 March 2009 and remained the same up until 2014/15, whereafter it changed in 2015/16.

Tax Chronology: 1979–20156
Table 2.1.8.1 Pre-retirement lump-sum taxation
2014/15 2015/16
Taxable income (R per annum) Rate of tax
Taxable income (R per annum)
Taxable income Rate of tax
R0–R22 500 0 per cent of taxable income
R0–R25 000 0 per cent of taxable income
R22 501–R600 000 18 per cent of taxable income above R22 500
R25 001–R660 000 18 per cent of taxable income above R25 000
R600 001–R900 000 R103 950 plus 27 per cent of taxable income above R600 000
R660 001–R990 000 R114 300 plus 27 per cent of taxable income above R660 000
R900 001 and above R184 950 plus 36 per cent of taxable income above R900 000
R900 001 and above R203 400 plus 36 per cent of taxable income above R990 000
2.1.9 Tax on income of retirement funds
Retirement fund tax on interest and rental income of such funds was introduced in 1996 and was abolished from 1 March 2007.
Withholding taxes on lump sum retirement payments to persons with taxable income of less than R43 000 was abolished from March 2007.
From March 2008, the taxation of other withdrawals from retirement funds was also simplified. From 1 March 2015, retirement fund members may defer the drawing of their retirement income until after retirement date.
Table 2.1.9.1 Retirement funds
Year of assessment that ended during the period
Rate of normal tax on taxable income
(Per cent)
01/03/1996–28/02/1997 ..................................................................................... 17
01/03/1997–28/02/1998 ..................................................................................... 17
01/03/1998–28/02/1999 ..................................................................................... 25
01/03/1999–28/02/2000 ..................................................................................... 25
01/03/2000–28/02/2001 ..................................................................................... 25
01/03/2001–28/02/2002 ..................................................................................... 25
01/03/2002–28/02/2003 ..................................................................................... 25
01/03/2003–28/02/2004 ..................................................................................... 18
01/03/2004–28/02/2005 ..................................................................................... 18
01/03/2005–28/02/2006 ..................................................................................... 18
01/03/2006–28/02/2007 ..................................................................................... 9
Note:
Tax on retirement funds was abolished with effect from 1 March 2007.
2.1.10 Taxation of lump sums upon retirement
From March 2011 government increased the tax-free lump sum benefit upon retirement from
R300 000 to R315 000.

7Tax Chronology: 1979–2015
Table 2.1.10.1 Taxation of lump sums upon retirement
Taxable lump sum Rate of tax (2011/12)
R0–R315 000 ................................................. 0 per cent of amount
R315 001–R630 000 ...................................... R0 plus 18 per cent of amount exceeding R315 000
R630 001–R945 000 ...................................... R56 700 plus 27 per cent of amount exceeding R630 000
R945 001 and above...................................... R141 750 plus 36 per cent of amount exceeding R945 000
Taxable lump sum Rate of tax (2014/15)
R0–R500 000 ................................................. 0 per cent of amount
R500 001–R700 000 ...................................... R0 plus 18 per cent of amount exceeding R500 000
R700 001–R1 050 000 ................................... R36 000 plus 27 per cent of amount exceeding R700 000
R1 050 001 and above .................................. R130 500 plus 36 per cent of amount exceeding R1 050 000
Lump sum withdrawals upon retirement from pension and retirement annuity funds are restricted to a maximum of one third of accumulated savings. A uniform approach to retirement fund withdrawals was legislated in 2013, to be effective on 1 March 2016.
Divorce settlement payments made by retirement funds are now taxable in the hands of the non-member spouse.
From 1 March 2012, the clean-break principle applied fully to the overall tax treatment of all divorce order retirement benefits paid out as a result of a divorce order.
National government total gross tax revenue
Percentage of gross domestic product
17
18
19
20
21
22
23
24
25
26
27
1979 1985 1990 1995 2000 2005 2010
Fiscal years
Downward phases of the business cycle 36-year average
2015
Taken as a proportion of gross domestic product, tax revenue has fluctuated higher around its long-term average of 22,6 per cent between 1985 and 2004. Since 2005 it has consistently exceeded the average.

Tax Chronology: 1979–20158
2.2 Corporations and other enterprises
Companies including close corporation (Note 1) but excluding companies referred to in 2.2.1 to 2.2.12 for those particular years of assessment.
Table 2.2.1 South African company tax rates
Year of assessment ending during the period:
Rate of normal tax on taxable
income SurchargeTransitional levy
(Note 2)
UPT(Note 3)
(Per cent)
01/04/1980–31/03/1981 ...................... 40 5 – 33⅓01/04/1981–31/03/1982 ...................... 40 5 – 33⅓01/04/1982–31/03/1983 ...................... 42 10 – 33⅓01/04/1983–31/03/1984 ...................... 42 10 – 33⅓01/04/1984–31/03/1985 ...................... 50 – – 33⅓01/04/1985–31/03/1986 ...................... 50 – – 33⅓01/04/1986–31/03/1987 ...................... 50 – – 33⅓01/04/1987–31/03/1988 ...................... 50 – – 33⅓01/04/1988–31/03/1989 ...................... 50 – – 33⅓01/04/1989–31/03/1990 ...................... 50 – – 33⅓01/04/1990–31/03/1991 ...................... 50 – – –
01/04/1991–31/03/1992 ...................... 48 – – –
01/04/1992–31/03/1993 ...................... 48 – – –
01/04/1993–31/03/1994 ...................... 40 – – –
01/04/1994–31/03/1995 ...................... 35 – 5 –
01/04/1995–31/03/1996 ...................... 35 – – –
01/04/1996–31/03/1997 ...................... 35 – – –
01/04/1997–31/03/1998 ...................... 35 – – –
01/04/1998–31/03/1999 ...................... 35 – – –
01/04/1999–31/03/2000 ...................... 30 – – –
01/04/2000–31/03/2001 ...................... 30 – – –
01/04/2001–31/03/2002 ...................... 30 – – –
01/04/2002–31/03/2003 ...................... 30 – – –
01/04/2003–31/03/2004 ...................... 30 – – –
01/04/2004–31/03/2005 ...................... 30 – – –
01/04/2005–31/03/2006 ...................... 29 – – –
01/04/2006–31/03/2007 ...................... 29 – – –
01/04/2007–31/03/2008 ...................... 29 – – –
01/04/2008–31/03/2009 ...................... 28 – – –
01/04/2009–31/03/2010 ...................... 28 – – –
01/04/2010–31/03/2011 ...................... 28 _ _ _
01/04-2011–31/03/2012 ...................... 28 – – –
01/04/2012–31/03/2013 ...................... 28 – – –
01/04/2013–31/03/2014 ...................... 28 – – –
01/04/2014–31/03/2015 ...................... 28 – – –
Notes:
(1) Close corporations (CCs): CCs became liable to tax with effect from the 1985 year of assessment.
(2) Transitional levy: To finance transitional costs incurred during the 1993 and 1994 transitional process to democracy, a one-off transitional levy was charged during the 1995 year of assessment. This levy was calculated as a certain percentage of taxable income in excess of R50 000 before set-off of any balance of assessed loss brought forward.
(3) Undistributed profits tax (UPT): UPT was payable by companies at the rate of 33⅓ per cent on the amount by which the distributable profit of a company exceeded the dividends distributed during the specified period relating to the year of assessment. In light of the exemption of income in the form of dividends in the hands of natural persons and CCs, this tax was no longer warranted as from 1 April 1990.
Secondary tax on companies (STC):STC was payable by a company on net dividends declared during the company’s dividend cycle, the last cycle of which ended on 31 March 2012. The STC credits of such a company can be used until 31 March 2015 to ensure that the after-tax profits of a company that were distributed to shareholders, and that were subject to STC, are not also subjected to dividends tax when distributed to shareholders.

9Tax Chronology: 1979–2015
Rates at which STC was levied
Period Rate of STC Period Rate of STC17/03/1993–21/06/1994 15 per cent 14/03/1996–30/09/2007 12,5 per cent22/06/1994–13/03/1996 25 per cent 01/10/2007–31/03/2012 10 per cent
Dividends tax replaced STC as from 1 April 2012.
2.2.1 Graduated tax on small business corporations
Small business companies that are eligible for tax relief came into operation in 2001. The amendments to section 12 E on small business corporations, whereby they were given an accelerated depreciation regime and where personal service providers can get the benefit (if they employ 4 or more people) came into effect in 2005. They would benefit from a simplified and enhanced depreciation regime to encourage fixed-capital formation.
Depreciation write-off at a 50:30:20 per cent rate over a three-year period for all depreciable assets, while manufacturing assets will retain their immediate 100 per cent write-off.
The R20 000 double deduction for start-ups was removed from 1 April 2005.
An immediate 100 per cent depreciation exists for individual small items purchased for business purposes. This threshold was increased from R2 000 to R5 000 for assets purchased on or after 1 March 2006. This threshold of R5 000 was further increased to R7 000 for assets purchased on or after 1 March 2009.
Table 2.2.1.1 Graduated tax on small business corporations
Effective dateTurnover of small business corporation Taxable income (Rand) Company tax rate applicable (Per cent)
1 April 2000 and 1 April 2001 ......
Less than R1 million R1–R100 000 15 per cent of the amount not exceeding R100 000
R100 001 and above 15 per cent of the amount not exceeding R100 000 plus 30 per cent of the amount as does exceed R100 000
1 April 2002 ...... Less than R3 million R1–R150 000 15 per cent of the amount not exceeding R150 000
R150 001 and above 15 per cent of the amount not exceeding R150 000 plus 30 per cent of the amount as does exceed R150 000
1 April 2003 and 1 April 2004 ......
Less than R5 million R1–R150 000 15 per cent of the amount not exceeding R150 000
R150 001 and above 15 per cent of the amount not exceeding R150 000 plus 30 per cent of the amount as does exceed R150 000
1 April 2005 ...... Less than R6 million R1–R35 000 0 per cent
R35 001–R250 000 10 per cent of the amount above R35 000
R250 001 and above R21 500 plus 29 per cent of the amount above R250 000
1 April 2006 ...... Less than R14 million R1–R40 000 0 per cent
R40 001–R300 000 10 per cent of the amount above R40 000
R300 001 and above R26 000 plus 29 per cent of the amount above R300 000
1 April 2007 ...... Less than R14 million R1–R43 000 0 per cent
R43 001–R300 000 10 per cent of the amount above R43 000
R300 001 and above R27 500 plus 29 per cent of the amount above R300 000
1 April 2008 ...... Less than R14 million R1–R46 000 0 per cent

Tax Chronology: 1979–201510
Table 2.2.1.1 Graduated tax on small business corporations
Effective dateTurnover of small business corporation Taxable income (Rand) Company tax rate applicable (Per cent)
R46 001–R300 000 10 per cent of the amount above R46 000
R300 001 and above R25 400 plus 28 per cent of the amount above R300 000
1 April 2009 ...... Less than R14 million R1–R54 200 0 per cent
R54 201–R300 000 10 per cent of the amount above R54 200
R300 001 and above R24 580 plus 28 per cent of the amount above R300 000
1 April 2010 ...... Less than R14 million R1–R57 000 0 per cent
R57 001–R300 000 10 per cent of the amount above R57 000
R300 001 and above R24 300 plus 28 per cent of the amount above R300 000
1 April 2011 ...... Less than R14 million R1–R59 750 0 per cent
R59 751–R300 000 10 per cent of the amount above R59 750
R300 001 and above R24 025 plus 28 per cent of the amount above R300 000
1 April 2012 ...... Less than R14 million R1–R63 556 0 per cent
R63 557–R350 000 7 per cent of the amount above R63 556
R350 001 and above R20 051 plus 28 per cent of the amount above R350 000
1 April 2013 ...... Less than R20 million R1–R67 111 0 per cent
R67 112–R365 000 7 per cent of the amount above R67 111
R365 001–R550 000 R20 852 plus 21 per cent of the amount above R365 000
R550 001 and above R59 702 plus 28 per cent of the amount above R550 000
1 April 2014 ...... Less than R20 million R1–R70 700 0 per cent
R70 701–R365 000 7 per cent plus of the amount above R70 700
R365 001–R550 000 R20 601 plus 21 per cent of the amount above R365 000
R550 001 and above R59 451 plus 28 per cent of the amount above R550 000
From 1 March 2012, micro businesses (i.e. those businesses with an annual turnover below R1 million) were given the option of making payments for turnover tax, VAT and employee tax at twice-yearly intervals.
11Tax Chronology: 1979–2015
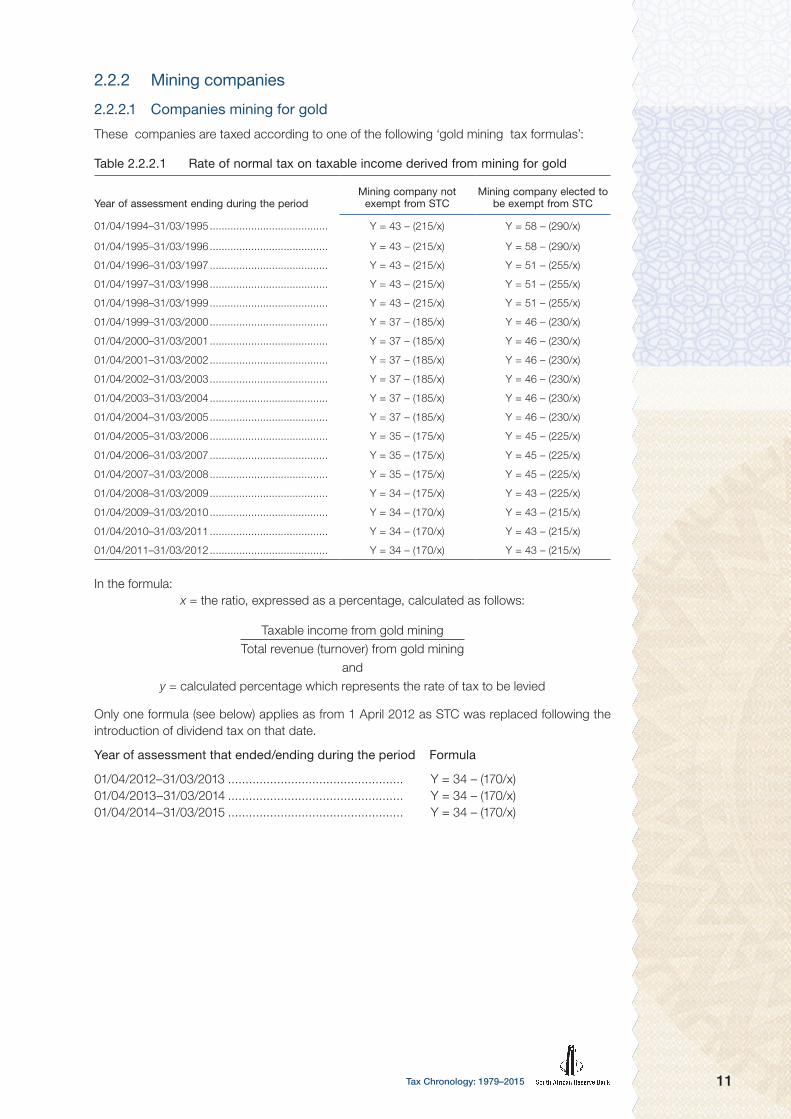
2.2.2 Mining companies
2.2.2.1 Companies mining for gold
These companies are taxed according to one of the following ‘gold mining tax formulas’:
Table 2.2.2.1 Rate of normal tax on taxable income derived from mining for gold
Year of assessment ending during the periodMining company not
exempt from STC Mining company elected to
be exempt from STC
01/04/1994–31/03/1995 ........................................ Y = 43 – (215/x) Y = 58 – (290/x)
01/04/1995–31/03/1996 ........................................ Y = 43 – (215/x) Y = 58 – (290/x)
01/04/1996–31/03/1997 ........................................ Y = 43 – (215/x) Y = 51 – (255/x)
01/04/1997–31/03/1998 ........................................ Y = 43 – (215/x) Y = 51 – (255/x)
01/04/1998–31/03/1999 ........................................ Y = 43 – (215/x) Y = 51 – (255/x)
01/04/1999–31/03/2000 ........................................ Y = 37 – (185/x) Y = 46 – (230/x)
01/04/2000–31/03/2001 ........................................ Y = 37 – (185/x) Y = 46 – (230/x)
01/04/2001–31/03/2002 ........................................ Y = 37 – (185/x) Y = 46 – (230/x)
01/04/2002–31/03/2003 ........................................ Y = 37 – (185/x) Y = 46 – (230/x)
01/04/2003–31/03/2004 ........................................ Y = 37 – (185/x) Y = 46 – (230/x)
01/04/2004–31/03/2005 ........................................ Y = 37 – (185/x) Y = 46 – (230/x)
01/04/2005–31/03/2006 ........................................ Y = 35 – (175/x) Y = 45 – (225/x)
01/04/2006–31/03/2007 ........................................ Y = 35 – (175/x) Y = 45 – (225/x)
01/04/2007–31/03/2008 ........................................ Y = 35 – (175/x) Y = 45 – (225/x)
01/04/2008–31/03/2009 ........................................ Y = 34 – (175/x) Y = 43 – (225/x)
01/04/2009–31/03/2010 ........................................ Y = 34 – (170/x) Y = 43 – (215/x)
01/04/2010–31/03/2011 ........................................ Y = 34 – (170/x) Y = 43 – (215/x)
01/04/2011–31/03/2012 ........................................ Y = 34 – (170/x) Y = 43 – (215/x)
In the formula:x = the ratio, expressed as a percentage, calculated as follows:
Taxable income from gold miningTotal revenue (turnover) from gold mining
andy = calculated percentage which represents the rate of tax to be levied
Only one formula (see below) applies as from 1 April 2012 as STC was replaced following the introduction of dividend tax on that date.
Year of assessment that ended/ending during the period Formula
01/04/2012–31/03/2013 .................................................. Y = 34 – (170/x)01/04/2013–31/03/2014 .................................................. Y = 34 – (170/x)01/04/2014–31/03/2015 .................................................. Y = 34 – (170/x)
Tax Chronology: 1979–201512
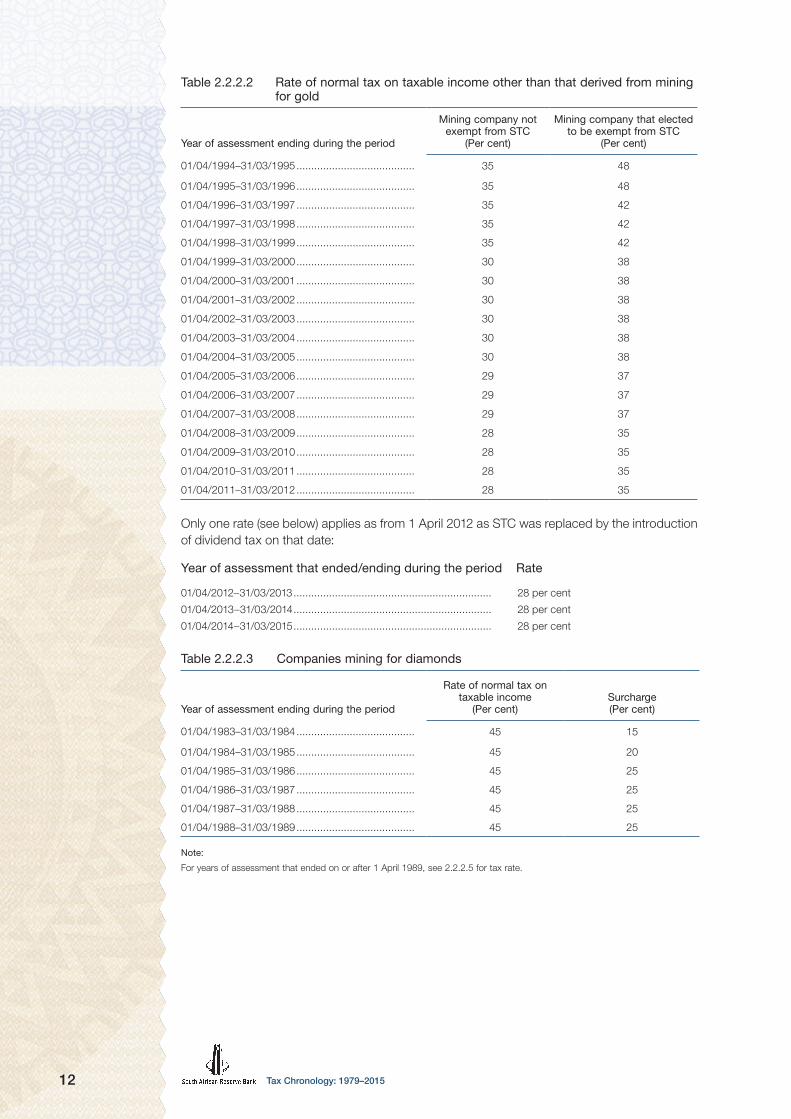
Table 2.2.2.2 Rate of normal tax on taxable income other than that derived from mining for gold
Year of assessment ending during the period
Mining company not exempt from STC
(Per cent)
Mining company that elected to be exempt from STC
(Per cent)
01/04/1994–31/03/1995 ........................................ 35 48
01/04/1995–31/03/1996 ........................................ 35 48
01/04/1996–31/03/1997 ........................................ 35 42
01/04/1997–31/03/1998 ........................................ 35 42
01/04/1998–31/03/1999 ........................................ 35 42
01/04/1999–31/03/2000 ........................................ 30 38
01/04/2000–31/03/2001 ........................................ 30 38
01/04/2001–31/03/2002 ........................................ 30 38
01/04/2002–31/03/2003 ........................................ 30 38
01/04/2003–31/03/2004 ........................................ 30 38
01/04/2004–31/03/2005 ........................................ 30 38
01/04/2005–31/03/2006 ........................................ 29 37
01/04/2006–31/03/2007 ........................................ 29 37
01/04/2007–31/03/2008 ........................................ 29 37
01/04/2008–31/03/2009 ........................................ 28 35
01/04/2009–31/03/2010 ........................................ 28 35
01/04/2010–31/03/2011 ........................................ 28 35
01/04/2011–31/03/2012 ........................................ 28 35
Only one rate (see below) applies as from 1 April 2012 as STC was replaced by the introduction of dividend tax on that date:
Year of assessment that ended/ending during the period Rate
01/04/2012–31/03/2013 ................................................................... 28 per cent
01/04/2013–31/03/2014 ................................................................... 28 per cent
01/04/2014–31/03/2015 ................................................................... 28 per cent
Table 2.2.2.3 Companies mining for diamonds
Year of assessment ending during the period
Rate of normal tax on taxable income
(Per cent) Surcharge (Per cent)
01/04/1983–31/03/1984 ........................................ 45 15
01/04/1984–31/03/1985 ........................................ 45 20
01/04/1985–31/03/1986 ........................................ 45 25
01/04/1986–31/03/1987 ........................................ 45 25
01/04/1987–31/03/1988 ........................................ 45 25
01/04/1988–31/03/1989 ........................................ 45 25
Note:
For years of assessment that ended on or after 1 April 1989, see 2.2.2.5 for tax rate.

13Tax Chronology: 1979–2015
Table 2.2.2.4 Mining companies (other than companies mining for gold or diamonds)
Year of assessment ending during the period
Rate of normal tax on taxable income
(Per cent) Surcharge (Per cent)
01/04/1983–31/03/1984 ........................................ 42 10
01/04/1984–31/03/1985 ........................................ 50 . . .
01/04/1985–31/03/1986 ........................................ 50 15
01/04/1986–31/03/1987 ........................................ 50 15
01/04/1987–31/03/1988 ........................................ 50 15
01/04/1988–31/03/1989 ........................................ 50 15
Note:
As from years of assessment that ended on or after 1 April 1989, see 2.2.1 for tax rate.
Table 2.2.2.5 Mining companies (including companies mining for diamonds, but excluding companies mining for gold)
Year of assessment ending during the period
Rate of normal tax on taxable income
(Per cent)Surcharge (Per cent)
01/04/1989–31/03/1990 ........................................ 50 12
01/04/1990–01/03/1991 ........................................ 50 9
01/04/1991–31/03/1992 ........................................ 48 6
01/04/1992–31/03/1993 ........................................ 48 3
Note:
For years of assessment ending on or after 1 April 1993, see 2.2.1 on page 8 for tax rate.
2.2.3 Oil and gas companies
2.2.3.1 Rate of normal tax on taxable income derived by an oil and gas company
2.2.3.1.1 Commencing with years of assessment that ended on or after 1 January 1992
The same rate of normal tax applicable to companies (see 2.2.1) is applicable to an oil and gas company on taxable income derived from oil and gas, plus an additional normal tax equal to 40 per cent of the amount remaining after the deduction of the normal tax from such taxable income. The normal tax and the additional normal tax may, however, be reduced in terms of section 5(2A)(b) of the Taxation Law Amendment Act.
2.2.3.1.2 Any year of assessment that commenced on or after 2 November 2006
(see paragraph 2 of the Tenth Schedule to the Act 43 of 2014)
The rate of tax on taxable income derived from oil and gas by an oil and gas company that:
– is a resident (or an oil and gas company which is not a resident that carries on a trade within the Republic of South Africa and which solely derives its income from oil and gas solely by virtue of an OP26 right [as defined in the Mineral and Petroleum Resources Development Act 28 of 2002] previously held by such company), will not exceed 29 per cent; and
– is not a resident, and carries on a trade within the Republic of South Africa, will not exceed 32 per cent if it solely derives its income from oil and gas by virtue of an OP26 right.
2.2.3.1.3 For the years of assessment that ended on or after 1 April 2008
The rate of tax on taxable income derived from oil and gas by an oil and gas company that:
– is a resident (or for an oil and gas company which is not a resident that carries on a trade within the Republic of South Africa and which derives its income from oil and gas solely by virtue of an OP26 right [as defined in the Mineral and Petroleum Resources Development Act 28 of 2002] previously held by such company), will not exceed 28 per cent; and

Tax Chronology: 1979–201514
– is not a resident, and carries on a trade within the Republic of South Africa, will not exceed 31 per cent.
2.2.3.1.4 For years of assessment that ended on or after 1 January 2010
The definition of an ‘oil and gas company’ has been narrowed in order to limit the benefits available under the Tenth Schedule to the Act to ‘oil and gas production’ as defined in the said Schedule.
2.2.3.1.5 For the years of assessment that ended during the 12-month period up to 31 March 2013 and subsequent years of assessment
The rate of tax on taxable income derived from oil and gas by any oil and gas company must not exceed 28 per cent.
2.2.3.2 Rate of STC on the net amount of any dividend declared by an oil and gas company
The rate of STC on the net amount of any dividend declared by any oil and gas company will not exceed 5 per cent. STC is not applicable where a company is engaged in refining.
The rate of STC on the net amount of any dividend declared by any oil and gas company derived from the profits of its oil and gas income, if all its oil and gas rights are solely derived (directly or indirectly) from an OP26 right previously held by that company, may not exceed 0 per cent. STC is not applicable where the company is engaged in refining.
Dividends tax replaced STC as from 1 April 2012.
2.2.3.3 Rate of dividends tax in respect of dividends paid by an oil and gas company
The rate of dividends tax payable by an oil and gas company will not exceed 5 per cent of the amount of a dividend paid out of amounts attributable to its income from oil and gas.
The rate of dividends tax payable may not exceed 0 per cent of the amount of any dividend paid by an oil and gas company out of amounts attributable to its income from oil and gas if all of its oil and gas rights are solely derived (directly or indirectly) by virtue of an OP26 right previously held by that company.
2.2.3.4 For year of assessment commencing on or after 1 January 2014
The rate of dividends tax that will be payable by an oil and gas company on the amount of any dividend arising from oil and gas income must not exceed 0 per cent of the amount of that dividend.
2.2.4 Insurance companies
2.2.4.1 Long-term insurance companies
For taxation purposes the business of long-term insurance companies is disaggregated and the various ‘funds’ taxed separately. There are four funds: (a) corporate fund (CF); (b) individual policyholder fund (IPF); (c) company policyholder fund (CPF); and (d) untaxed policyholder fund (UPF).
15Tax Chronology: 1979–2015
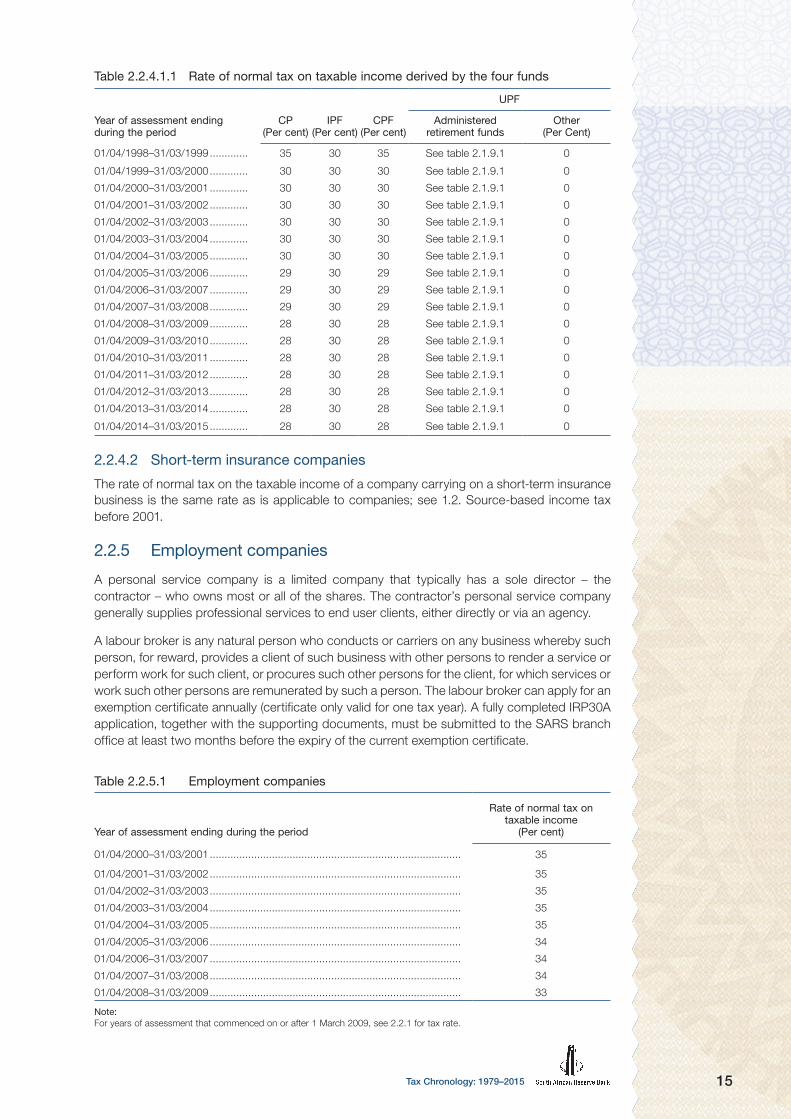
Table 2.2.4.1.1 Rate of normal tax on taxable income derived by the four funds
Year of assessment ending during the period
CP (Per cent)
IPF (Per cent)
CPF(Per cent)
UPF
Administered retirement funds
Other (Per Cent)
01/04/1998–31/03/1999 ............. 35 30 35 See table 2.1.9.1 0
01/04/1999–31/03/2000 ............. 30 30 30 See table 2.1.9.1 0
01/04/2000–31/03/2001 ............. 30 30 30 See table 2.1.9.1 0
01/04/2001–31/03/2002 ............. 30 30 30 See table 2.1.9.1 0
01/04/2002–31/03/2003 ............. 30 30 30 See table 2.1.9.1 0
01/04/2003–31/03/2004 ............. 30 30 30 See table 2.1.9.1 0
01/04/2004–31/03/2005 ............. 30 30 30 See table 2.1.9.1 0
01/04/2005–31/03/2006 ............. 29 30 29 See table 2.1.9.1 0
01/04/2006–31/03/2007 ............. 29 30 29 See table 2.1.9.1 0
01/04/2007–31/03/2008 ............. 29 30 29 See table 2.1.9.1 0
01/04/2008–31/03/2009 ............. 28 30 28 See table 2.1.9.1 0
01/04/2009–31/03/2010 ............. 28 30 28 See table 2.1.9.1 0
01/04/2010–31/03/2011 ............. 28 30 28 See table 2.1.9.1 0
01/04/2011–31/03/2012 ............. 28 30 28 See table 2.1.9.1 0
01/04/2012–31/03/2013 ............. 28 30 28 See table 2.1.9.1 0
01/04/2013–31/03/2014 ............. 28 30 28 See table 2.1.9.1 0
01/04/2014–31/03/2015 ............. 28 30 28 See table 2.1.9.1 0
2.2.4.2 Short-term insurance companies
The rate of normal tax on the taxable income of a company carrying on a short-term insurance business is the same rate as is applicable to companies; see 1.2. Source-based income tax before 2001.
2.2.5 Employment companies
A personal service company is a limited company that typically has a sole director – the contractor – who owns most or all of the shares. The contractor’s personal service company generally supplies professional services to end user clients, either directly or via an agency.
A labour broker is any natural person who conducts or carriers on any business whereby such person, for reward, provides a client of such business with other persons to render a service or perform work for such client, or procures such other persons for the client, for which services or work such other persons are remunerated by such a person. The labour broker can apply for an exemption certificate annually (certificate only valid for one tax year). A fully completed IRP30A application, together with the supporting documents, must be submitted to the SARS branch office at least two months before the expiry of the current exemption certificate.
Table 2.2.5.1 Employment companies
Year of assessment ending during the period
Rate of normal tax on taxable income
(Per cent)
01/04/2000–31/03/2001 ..................................................................................... 35
01/04/2001–31/03/2002 ..................................................................................... 35
01/04/2002–31/03/2003 ..................................................................................... 35
01/04/2003–31/03/2004 ..................................................................................... 35
01/04/2004–31/03/2005 ..................................................................................... 35
01/04/2005–31/03/2006 ..................................................................................... 34
01/04/2006–31/03/2007 ..................................................................................... 34
01/04/2007–31/03/2008 ..................................................................................... 34
01/04/2008–31/03/2009 ..................................................................................... 33
Note:For years of assessment that commenced on or after 1 March 2009, see 2.2.1 for tax rate.

Tax Chronology: 1979–201516
2.2.6 Personal service providers that are companies
Year of assessment ending during the period
Rate of normal tax on taxable income
(Per cent)
01/03/2009–31/03/2010 ..................................................................................... 33
01/04/2010–31/03/2011 ..................................................................................... 33
01/04/2011–31/03/2012 ..................................................................................... 33
Note:
For years of assessment that commenced on or after 1 March 2013, see 2.1.1 for tax rate. For personal service providers that are trusts, see 3.3 for the tax rate.
2.2.7 Companies that are not residents and derive taxable income
Table 2.2.7.1 Companies that are not residents and derive taxable income
Year of assessment ending during the period
Rate of normal tax on taxable income
(Per cent)
01/04/1996–31/03/1997 ..................................................................................... 40
01/04/1997–31/03/1998 ..................................................................................... 40
01/04/1998–31/03/1999 ..................................................................................... 40
01/04/1999–31/03/2000 ..................................................................................... 35
01/04/2000–31/03/2001 ..................................................................................... 35
01/04/2001–31/03/2002 ..................................................................................... 35
01/04/2002–31/03/2003 ..................................................................................... 35
01/04/2003–31/03/2004 ..................................................................................... 35
01/04/2004–31/03/2005 ..................................................................................... 35
01/04/2005–31/03/2006 ..................................................................................... 34
01/04/2006–31/03/2007 ..................................................................................... 34
01/04/2007–31/03/2008 ..................................................................................... 34
01/04/2008–31/03/2009 ..................................................................................... 33
01/04/2009–31/03/2010 ..................................................................................... 33
01/04/2010–31/03/2011 ..................................................................................... 33
01/04/2011–31/03/2012 ..................................................................................... 33
Note:
Companies that are not residents are not subject to STC.For years of assessment that ended after 31 March 2012, see 2.2.1 for tax rate.
2.2.8 Tax holiday companies
These are qualifying companies that enjoy ‘tax holiday status’ in terms of section 37H of the Act. Companies could only qualify under this section in terms of approved qualifying projects applied for up until 30 September 1999.
Table 2.2.8.1 Tax holiday companies
Year of assessment that ended during the period
Rate of normal tax on taxable income
(Per cent)
During the tax holiday status ............................................................................... 0
Note:
Tax holiday companies are exempt from STC.This concession has been repealed from the commencement of years of assessment commencing on or after 1 January 2013

17Tax Chronology: 1979–2015
2.2.9 Public benefit organisations or recreational clubs
A public benefit organisation (PBO) that is approved in terms of section 30(3) of the Act is taxable on its taxable income as from its first year of assessment when it commenced on or after 1 April 2006.
A recreational club that is approved in terms of section 30A(2) of the Act is taxable on its taxable income as from its first year of assessment when it commenced on or after 1 April 2007.
Table 2.2.9.1 Public benefit organisation
Year of assessment that ended during the period
Rate of normal tax on taxable income
(Per cent)
01/04/2006–31/03/2007 ..................................................................................... 29
Table 2.2.9.2 Public benefit organisation or recreational club that is a person other than a company
Year of assessment that ended during the period
Rate of normal tax on taxable income
(Per cent)
01/03/2007–29/02/2008 ..................................................................................... 29
01/03/2008–29/02/2009 ..................................................................................... 28
Table 2.2.9.3 Public benefit organisation or recreational club that is a company
Year of assessment that ended during the period
Rate of normal tax on taxable income
(Per cent)
01/04/2007–31/03/2008 ..................................................................................... 29
01/04/2008–31/03/2009 ..................................................................................... 28
01/04/2009–31/03/2010 ..................................................................................... 28
01/04/2010–31/03/2011 ..................................................................................... 28
01/04/2011–31/03/2012 ..................................................................................... 28
01/04/2012–31/03/2013 ..................................................................................... 28
01/04/2013–31/03/2014 ..................................................................................... 28
Table 2.2.9.4 Public benefit organisation that is a trust
Year of assessment that ended during the period
Rate of normal tax on taxable income
(Per cent)
28/02/2010 ......................................................................................................... 28
28/02/2011 ......................................................................................................... 28
29/02/2012 ......................................................................................................... 28
that commenced on 01/03/2012 or ended on 28/02/2013 ................................. 28
that commenced on 01/03/2013 or ended on 28/02/2014 ................................. 28
that commenced on 01/03/2014 or ended on 28/02/2015 ................................. 28

Tax Chronology: 1979–201518
2.2.10 Micro businesses
A person qualifies as a micro business (as defined in the Sixth Schedule to the Act) if that person is a: – natural person (or the deceased or insolvent estate of a natural person that was a registered
micro business at the time of death or insolvency); or
– company, and
– the qualifying turnover of that person for the year of assessment does not exceed an amount of R1 million.
Table 2.2.10.1 Micro business corporations
Year of assessment that ended during the period
Taxable turnover (Rand) Rate of tax
01/04/2009–31/03/2010 R1–R100 000 0 per cent
R100 001–R300 000 1 per cent of the amount above R100 000
R300 001–R500 000 R2 000 plus 3 per cent of the amount above R300 000
R500 001–R750 000 R8 000 plus 5 per cent of the amount above R500 000
R750 001 and above R20 500 plus 7 per cent of the amount above R750 000
01/04/2010–31/03/2011 R1–R100 000 0 per cent
R100 001–R300 000 1 per cent of the amount above R100 000
R300 001–R500 000 R2 000 plus 3 per cent of the amount above R300 000
R500 001–R750 000 R8 000 plus 5 per cent of the amount above R500 000
R750 001 and above R20 500 plus 7 per cent of the amount above R750 000
01/04/2011–31/03/2012 R1–R150 000 0 per cent
R150 001–R300 000 1 per cent of the amount above R150 000
R300 001–R500 000 R1 000 plus 2 per cent of the amount above R300 000
R500 001–R750 000 R5 500 plus 4 per cent of the amount above R500 000
R750 001 and above R15 500 plus 6 per cent of the amount above R750 000
01/04/2012–31/03/2013 R1–R150 000 0 per cent
R150 001–R300 000 1 per cent of the amount above R150 000
R300 001–R500 000 R1 500 plus 2 per cent of the amount above R300 000
R500 001–R750 000 R5 500 plus 4 per cent of the amount above R500 000
R750 001 and above R15 500 plus 6 per cent of the amount above R750 000
01/04/2013–31/03/2014 R1–R150 000 0 per cent
R150 001–R300 000 1 per cent of the amount above R150 000
R300 001–R500 000 R1 500 plus 2 per cent of the amount above R300 000
R500 001–R750 000 R5 500 plus 4 per cent of the amount above R500 000
R750 000 and above R15 500 plus 6 per cent of the amount above R750 000
01/04/2014–31/03/2015 R1–R150 000 0 per cent
R150 001–R300 000 1 per cent of the amount above R150 000
R300 001–R500 000 R1 500 plus 2 per cent of the amount above R300 000
R500 001–R750 000 R5 500 plus 4 per cent of the amount above R500 000
R750 000 and above R15 500 plus 6 per cent of the amount above R750 000

19Tax Chronology: 1979–2015
2.2.11 Regional Services Council (RSC) levy reform
RSC levies were abolished on 30 June 2006 and replaced with alternative funding arrangements to ensure the continued independence and financial viability of municipalities.
This provided significant direct tax relief to businesses. The administrative burden was significantly lowered as RSC levies required monthly submissions. Since one of the levies was imposed on payroll, its removal effectively lowered the costs of job creation.
2.2.12 Treatment of collective investment scheme distributions
A collective investment scheme (CIS) in shares was treated as a company whose distributions were treated as a special form of dividend until 2009.
The Budget Review 2009 proposed that distributions by these schemes should generally follow a flow-through principle from 2010.
If a CIS distributes dividends received, this should be viewed as dividends in the hands of holders of participatory interests. If it distributes interest received, it should be viewed as interest in the hands of holders of participatory interests.
2.2.13 Energy-efficency savings tax credit incentive
The energy-efficiency savings tax credit incentive complements the proposed future carbon tax and would be extended to cogeneration projects. It encourages firms to support a greener economy. Businesses can claim deductions based on energy saved.
Table 2.2.13.1 Energy-efficency savings tax incentive
Effective date* Rate per kWh
1 November 2013 .......................................................................................................... 0,45c
To be determined in the Taxation Laws Amendment Act of 2015 .................................... 0,95c
* Effective from 1 April following the budget announcement
2.2.14 Environmental fiscal reform
Incentives for cleaner production: energy efficiency
Current legislation provides for a three-year 50:30:20 per cent accelerated depreciation allowance for investments in renewable energy and biofuels production.
It was proposed that investments by companies in energy-efficient equipment should qualify for an additional allowance of up to 15 per cent on condition that there is documentary proof of the resulting energy efficiencies (after a two- or three-year period), certified by the Energy Efficiency Agency.
2.2.15 Emission reduction credits from clean development projects
From 1 March 2009, income derived from the disposal of primary certified emission reductions (CERs) is tax-exempt or subject to capital gains tax (CGT) instead of normal income tax. From 1 March 2009, secondary CERs are to be classified as trading stock and taxed accordingly.
2.2.16 Tax incentives to support industrial policy
An amount of R5 billion was set aside for tax incentives to be used over the three financial years (2012/13–2014/15) in support of sectors identified as key to the emerging industrial strategy. This was addressed in the Budget Review 2012 under ‘Business taxes: special economic zones’.

Tax Chronology: 1979–201520
2.2.17 Bursaries for relatives of employees
To facilitate employer-sponsored education and training of the dependants of low- and middle-income workers, this tax-free fringe benefit was increased from 1 March 2008 to R10 000 per year for employees earning up to R100 000 per year.
With effect from 1 March 2013, this threshold was increased from R10 000 to R30 000 for students attending tertiary education and remains at R10 000 for certain students at schools, for employees earning up to R200 000 per year.
2.3 Capital gains tax (CGT)
CGT was introduced on 1 October 2001, whereby income tax is levied on a portion of the gains realised from the disposal of certain assets by corporate and individual taxpayers. A capital gain arises when the proceeds of the disposal of an asset exceeds the base cost of the asset.
The effective rate applicable to the four funds (individual policyholders, company policyholders, corporate and untaxed policyholder funds) is calculated by multiplying the inclusion rate applicable to each fund by the tax rate of that particular fund.
From 1 March 2008, the annual capital gain or loss exclusion was increased from R15 000 to R16 000.
From 1 March 2009 the following applied:
– The annual exclusion ceiling for capital gains and losses for individuals was increased from R16 000 to R17 500.
– The CGT regime contains several exclusions, one such exclusion is for an individual’s primary residence, where a capital gain or loss of up to R1,5 million upon the disposal of such residence is excluded from taxable capital gains. The exclusion was extended so that an alternative would be available based on the gross sale proceeds of the residence.
– The CGT exclusions fully apply to the primary residence with a gross value of R2 million. Thus, people selling their primary residence with a gross value below R2 million are not liable for CGT. For primary residences valued above this threshold, the normal rules apply.
Table 2.3.1 Capital gains tax (CGT)
Inclusion rate (Per cent)
Effective rate of tax (Per cent)
Budget Review 2001
Individuals, special trusts and testamentary trusts set up for the benefit of minor children .................................................. 25 0–10
All other trusts ....................................................................... 50 20
Companies and close corporations ....................................... 50 14,5
Individual policyholder fund .................................................... 25 7,5
Company policyholder fund ................................................... 50 14,5
Corporate fund ...................................................................... 50 14,5
Untaxed policyholder fund ..................................................... 0 0
Budget Review 2012
Individuals, special trusts and testamentary trusts set up for the benefit of minor children .................................................. 33,3 13,3
All other trusts ....................................................................... 66,6 26,7
Companies and close corporations ....................................... 66,6 18,6

21Tax Chronology: 1979–2015
From 1 March 2012 the following applied:
– The annual exclusion increased from R20 000 to R30 000. – The exclusion amount on death increased from R200 000 to R300 000. – The exclusion amount on the disposal of a small business when a person is over the age of
55 years increased from R900 000 to R1,8 million. – The maximum market value of assets allowed for a small business disposal for business
owners over 55 years increased from R5 million to R10 million.
3. Taxes on payroll and workforce
3.1 Skills development levy
The levy was meant to provide funding for the training and upgrading of skills levels of the workforce.
Table 3.1.1 Taxes on payroll and workforce: skills development levy
Effective date
Rate:percentage of payroll Payroll bill
01/04/2000–31/03/2001 ......................................... 0,5 More than R250 000
01/04/2001–31/07/2005 ......................................... 1,0 More than R250 000
01/08/2005 to date ................................................. 1,0 More than R500 000
4. Taxes on propertyTable 4.1 Taxes on property
Donations tax
Effective dateRebate per year
(natural persons)*
16/03/1988–29/02/1996 ...................................................................... R20 000
01/03/1996–28/02/2002 ...................................................................... R25 000
01/03/2002–28/02/2006 ...................................................................... R30 000
01/03/2006–28/02/2007 ...................................................................... R50 000
01/03/2007–28/02/2015 ...................................................................... R100 000
* Natural persons defined as individuals
Uncertified securities taxBefore 2007, this was a tax payable in respect of the issue of, and change in, beneficial ownership in any listed securities. From 2007, there was a proposed migration of the tax on unlisted shares to the Uncertified Securities Tax Act, which was renamed the Securities Tax Act.
Table 4.2 Uncertified securities tax
Effective date Rate (Per cent)
01/06/1999 ..................................................................................................... 0,25
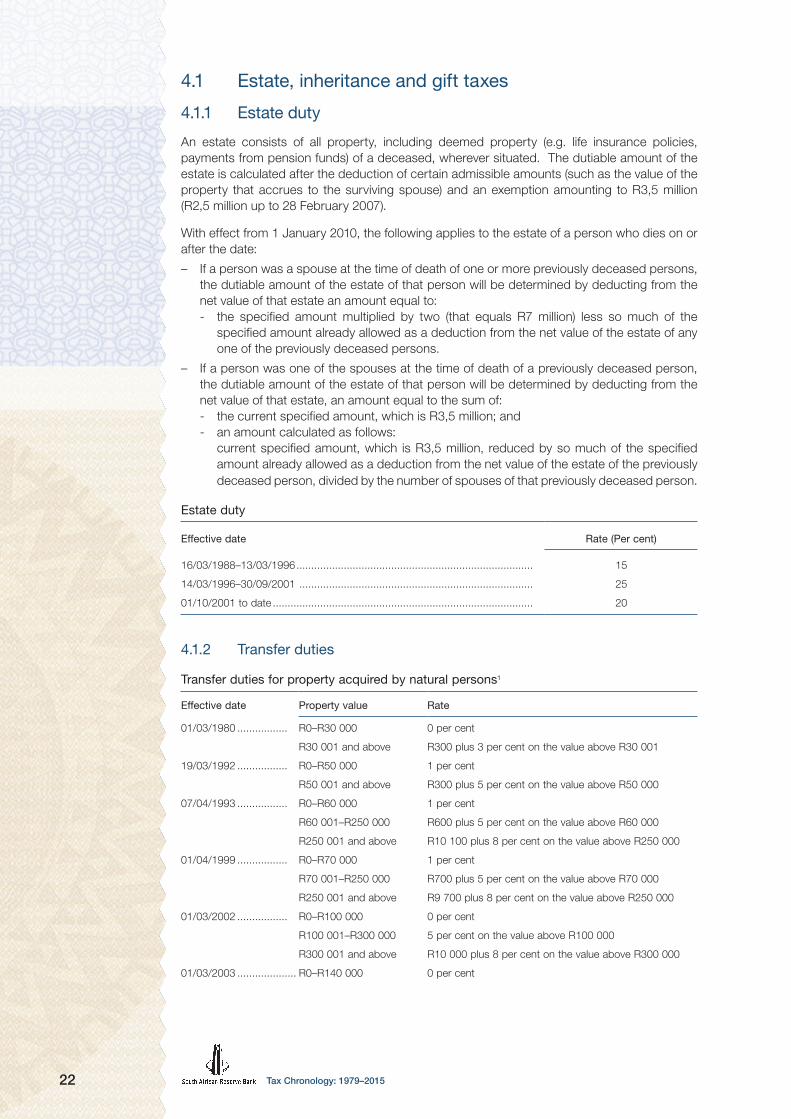
Tax Chronology: 1979–201522
4.1 Estate, inheritance and gift taxes
4.1.1 Estate duty
An estate consists of all property, including deemed property (e.g. life insurance policies, payments from pension funds) of a deceased, wherever situated. The dutiable amount of the estate is calculated after the deduction of certain admissible amounts (such as the value of the property that accrues to the surviving spouse) and an exemption amounting to R3,5 million (R2,5 million up to 28 February 2007).
With effect from 1 January 2010, the following applies to the estate of a person who dies on or after the date:
– If a person was a spouse at the time of death of one or more previously deceased persons, the dutiable amount of the estate of that person will be determined by deducting from the net value of that estate an amount equal to:
- the specified amount multiplied by two (that equals R7 million) less so much of the specified amount already allowed as a deduction from the net value of the estate of any one of the previously deceased persons.
– If a person was one of the spouses at the time of death of a previously deceased person, the dutiable amount of the estate of that person will be determined by deducting from the net value of that estate, an amount equal to the sum of:
- the current specified amount, which is R3,5 million; and - an amount calculated as follows: current specified amount, which is R3,5 million, reduced by so much of the specified
amount already allowed as a deduction from the net value of the estate of the previously deceased person, divided by the number of spouses of that previously deceased person.
Estate duty
Effective date Rate (Per cent)
16/03/1988–13/03/1996 ................................................................................ 15
14/03/1996–30/09/2001 ............................................................................... 25
01/10/2001 to date ........................................................................................ 20
4.1.2 Transfer duties
Transfer duties for property acquired by natural persons1
Effective date Property value Rate
01/03/1980 ................. R0–R30 000 0 per cent
R30 001 and above R300 plus 3 per cent on the value above R30 001
19/03/1992 ................. R0–R50 000 1 per cent
R50 001 and above R300 plus 5 per cent on the value above R50 000
07/04/1993 ................. R0–R60 000 1 per cent
R60 001–R250 000 R600 plus 5 per cent on the value above R60 000
R250 001 and above R10 100 plus 8 per cent on the value above R250 000
01/04/1999 ................. R0–R70 000 1 per cent
R70 001–R250 000 R700 plus 5 per cent on the value above R70 000
R250 001 and above R9 700 plus 8 per cent on the value above R250 000
01/03/2002 ................. R0–R100 000 0 per cent
R100 001–R300 000 5 per cent on the value above R100 000
R300 001 and above R10 000 plus 8 per cent on the value above R300 000
01/03/2003 .................... R0–R140 000 0 per cent

23Tax Chronology: 1979–2015
Transfer duties for property acquired by natural persons1
Effective date Property value Rate
R140 001–R320 000 5 per cent on the value above R140 000
R320 001 and above R9 000 plus 8 per cent on the value above R320 000
01/03/2004 ................. R0–R150 000 0 per cent
R150 001–R320 000 5 per cent on the value above R150 000
R320 001 and above R8 500 plus 8 per cent on the value above R320 000
01/03/2005 ................. R0–R190 000 0 per cent
R190 001–R330 000 5 per cent on the value above R190 000
R330 001 and above R7 000 plus 8 per cent on the value above R330 000
01/03/2006 ................. R0–R500 000 0 per cent
R500 001–R1 000 000 5 per cent on the value above R500 000
R1 000 001 and above R25 000 plus 8 per cent on the value above R1 000 000
23/02/2011 ................. R0–R600 000 0 per cent
R600 001–R1 000 000 3 per cent on the value above R600 000
R1 000 001–R1 500 000 R12 000 plus 5 per cent on the value up to R1 500 000
R1 500 001 and above R37 000 plus 8 per cent on the value above R1 500 000
01/03/2015 ................. R0–R750 000 0 per cent
R750 001–R1 250 000 3 per cent on the value above R750 000R1 250 001–R1 750 000 R15 000 plus 6 per cent on the value above R1 250 000R 1 750 001–R2 250 000 R45 000 plus 8 per cent on the value above R1 750 000
R2 250 001 and above R85 000 plus 11 per cent on the value above R2 250 000
* Natural persons defined as individuals.
4.1.3 Donations tax
From 2007, donations made by individuals to qualifying public benefit organisations up to a maximum of 10 per cent (previously 5 per cent) of these individuals’ taxable income during the tax year are deductible. From 2008, donations made by taxpayers to qualifying public benefit organisations up to a maximum of 10 per cent (previously 5 per cent) of their taxable income during the tax year would be deductible. The same rates that are applicable to estate duty is applicable to donations, except it is not triggered at death.
4.2 Taxes on financial and capital transactions
4.2.1 Marketable securities tax
Tax payable by stockbrokers on behalf of clients is in respect of purchases of marketable securities at a rate of 0,25 per cent of the consideration. Some securities such as bonds were exempted, but marketable securities tax applied to share transactions. From 1 July 2008, the name was changed to Securities Transfer Tax.
Marketable securities tax (MST)
Effective date Rate (Per cent)
Prior to 1 April 1996 ....................................................................................... 1,00
01/04/1996–31/08/1997 ................................................................................. 0,50
01/04/1997–21/12/2003* ................................................................................ 0,25
* The Marketable Securities Tax Act 32 of 1948 was repealed and promulgated on 22 December 2003. This was replaced by the Uncertificated Securities Tax Act, 31 of 1998.

Tax Chronology: 1979–201524
4.2.2 Uncertified securities tax (UST)
Before 2007, this was a tax payable in respect of the issue of, and change in, beneficial ownership in any listed securities. From 2007, there was a proposed migration of the tax on unlisted shares to the Uncertified Securities Tax Act, which would be renamed the Securities Tax Act. The Security Transfer Tax Act replaces the UST and MST Acts.
5. Taxes on goods and services
5.1 Trends in general sales tax (GST) and value-added tax (VAT)
Table 5.1.1 Trends in GST and VAT
Effective date Rate (Per cent)
GST ............................................................................................. 03/07/1978 4
GST ............................................................................................. 01/03/1982 5
GST ............................................................................................. 01/09/1982 6
GST ............................................................................................. 01/02/1984 7
GST ............................................................................................. 01/07/1984 10
GST ............................................................................................. 25/03/1985 12
GST ............................................................................................. 08/05/1989 13
VAT .............................................................................................. 30/09/1991 10
VAT .............................................................................................. 07/04/1993 14
Zero-rated and exempt supplies
Table 5.1.2 Zero-rated and exempt supplies
The following goods and services are zero-rated:Exports
19 basic food items (Table 5.1.3)
Illuminating paraffin
Goods which are subject to fuel levy (petrol and diesel)
International transport services
Farming inputs
Sales of going concerns
Certain grants by government
Goods and services exempted from VAT are:
Non-fee-related financial services
Educational services provided by an approved educational institution
Residential rental accommodation
Public road and rail transport

25Tax Chronology: 1979–2015
Basic food zero-rated in South Africa
Table 5.1.3 Basic food zero-rated in South Africa
Brown bread Rice
Maize meal Vegetables
Samp Fruit
Mealie rice Vegetable oil
Dried mealies Milk
Dried beans Cultured milk
Lentils Brown wheaten meal
Pilchards/Sardinella in tins Eggs
Milk powder Edible legumes and pulses of leguminous plants
Dairy powder blend
Table 5.1.4 Calculation of VAT and duties (domestic) – only an example
Tariff Cost (Rand)
Cost of goods ................................................................................................ 100,00
Ad valorem (dependent on the tariff book) for example .................................. 3 per cent 3,00
103,00
VAT (cost of goods + all duties) ...................................................................... 14 per cent 14,42
Total .............................................................................................................. 117,42
5.2 VAT voluntary registration threshold
From 1 March 2010, the threshold was increased from R20 000 to R50 000.
To encourage taxpayers to come forward and avoid the future imposition of interest, a voluntary disclosure programme was instituted from 1 November 2010 to 31 October 2011. During this period, taxpayers could disclose their defaults and regularise their tax affairs.
A defaulting taxpayer would be granted relief under the programme, provided:
– the disclosure was complete; and – SARS was not aware of the default.
A penalty or additional tax would have been imposed had SARS discovered the default in the normal course of business. Government proposed to do away with the discretion of SARS to waive interest charged on unpaid provisional tax.
5.3 False statements on VAT reforms
Any false statement on any VAT form submitted to SARS, not only on returns, is considered an offence.
5.4 VAT and residential property developers
The sale of residential property by developers is subject to VAT at the standard rate, while the leasing is VAT exempt. The temporary leasing of residential units would require a full claw-back of the VAT input credits for leased units. Options would be investigated to determine equitable value and rate of claw-back for developers.

Tax Chronology: 1979–201526
5.5 Specific excise duties
Table 5.5.1 Specific excise duties
Product Unit
Fiscal years
2007/08 2008/09 2009/10 2010/11
Rand
Malt beer
Average alcohol ................................. ℓ 39,6100 42,3800 46,4100 50,2000
Average can ...................................... 340 ml 0,6734 0,7200 0,7890 0,8534
Traditional beer ..................................... ℓ 0,0782 0,0782 0,0782 0,0782
Traditional beer powder ........................ kg 0,3470 0,3470 0,3470 0,3470
Unfortified wine ..................................... ℓ 1,7153 1,8400 1,9800 2,1400
Fortified wine ........................................ ℓ 3,1667 3,4000 3,7200 4,0300
Sparkling wine ...................................... ℓ 5,1214 5,6300 6,1600 6,6700
Ciders and alcoholic fruit beverages ..... ℓ 1,9805 2,1200 2,3300 2,5200
Spirits
Absolute alcohol ................................ ℓ 61,0100 67,7200 77,6700 84,5700
Average bottle ................................... 750 ml 19,6700 21,8400 25,0500 27,2700
Cigarettes ............................................. 20 pkt 6,1565 6,8200 7,7000 8,9400
Cigarette tobacco ................................. 50 g 8,2418 8,6700 9,1500 9,7300
Pipe tobacco ........................................ 25 g 2,1847 2,3000 2,5000 2,7000
Cigars ................................................... 23 g 37,7300 39,7200 44,8800 47,6600
… denotes not available
Table 5.5.1 Specific excise duties
Product Unit
Fiscal years
2011/12 2012/13 2013/14 2014/15 2015/16
Rand
Malt beer
Average alcohol ..................... ℓ 53,9700 59,3600 63,8100 68,9200 73,0500
Average can .......................... 340 ml … … 0,1085 0,1170 0,1240
Traditional beer ......................... ℓ 0,0782 0,0782 0,0782 0,0782 0,7820
Traditional beer powder ............ kg 0,3470 0,3470 0,3470 0,3470 0,3470
Unfortified wine ......................... ℓ 2,3200 2,5000 2,7000 2,8700 3,0700
Fortified wine ............................ ℓ 4,3300 4,5900 4,8500 5,2100 5,4600
Sparkling wine .......................... ℓ 6,9700 7,5300 8,2800 9,1100 9,7500Ciders and alcoholic fruit beverages ................................ ℓ 2,7100 2,9700 3,190 3,4500 3,6500
Spirits
Absolute alcohol .................... ℓ 93,0300 111,6400 122,8000 137,5400 149,2300
Average bottle ....................... 750 ml … … 39,6000 44,3600 48,1300
Cigarettes ................................. 20 pkt 9,7400 10,3200 10,9200 11,6000 12,4200
Cigarette tobacco ..................... 50 g 10,5300 11,0500 12,1600 13,0300 13,9400
Pipe tobacco ............................ 25 g 2,9800 3,2200 3,5400 3,6300 3,8900
Cigars ....................................... 23 g 50,5200 53,0500 56,7600 61,8700 64,9600
… denotes not available

27Tax Chronology: 1979–2015
5.6 Ad valorem excise duties
The list of products subject to ad valorem excise duties is revisited on an ongoing basis. For example, ad valorem excise duties on the following items were abolished in 2004 and 2005:
– computer monitors from 2004 based on the assumption that they were used as computer screens; and
– cosmetic sun protection products with a sun protection factor of 15 and more, from 1 April 2005.
Digital video cameras with a value in excess of R15 000 were not subjected to ad valorem excise duty from 1 April 2005 as such cameras are used almost exclusively for commercial purposes.
The following ad valorem excise duties were abolished from 1 April 2006:
– aqueous distillates and aqueous solutions of essential oils; – automatic goods vending machines; – facsimile machines; – parts of facsimile transmission apparatus; and – road tractors.
The following ad valorem excise duties were abolished from 1 April 2007:
– air conditioning machines installed in motor vehicles; – domestic dish washing machines; – camera lenses; – sunglasses; – binoculars; – telescopes; – instant print cameras; – other photographic cameras; – flashlights and flashbulbs; – cinematographic cameras; – cinematographic projectors; – slide projectors; and – image projectors.
The following ad valorem excise duties were abolished from 1 April 2008: – sound-recording or reproducing apparatus operated by coins, banknotes, bank cards,
tokens or by other means of payment;
– turntables (record decks);
– sound-recording or reproducing apparatus using magnetic media;
– magnetic tape-type; and
– video games with self-contained screen and games of skill or chance with an electronic display, including parts thereof.
Passenger cars and light commercial vehicles are subject to a ‘luxury’ excise tax that increases with the price of the vehicle. The Budget Review 2011 proposed that the maximum nominal ad valorem excise tax rate on these vehicles be increased from 20 per cent to 25 per cent.

Tax Chronology: 1979–201528
Tabl
e 5.
7.1
Tota
l com
bine
d fu
el le
vy o
n le
aded
pet
rol a
nd d
iese
l
2003
/04
2004
/05
2005
/06
2006
/07
2007
/08
2008
/09
Cen
ts/li
tre
93 o
ctan
e pe
trol
Die
sel
93 o
ctan
e pe
trol
Die
sel
93 o
ctan
e pe
trol
Die
sel
93 o
ctan
e pe
trol
Die
sel
93 o
ctan
e pe
trol
Die
sel
93 o
ctan
e pe
trol
Die
sel
Gen
eral
fuel
levy
.....
......
......
......
....
101,
085
,011
1,0
85,0
116,
010
0,0
116,
010
0,0
121,
010
5,0
127,
011
1,0
Roa
d A
ccid
ent
Fund
(RA
F) le
vy ..
..21
,521
,526
,526
,531
,531
,536
,531
,541
,541
,546
,546
,5
Cus
tom
s an
d ex
cise
levy
.....
......
...4,
04,
04,
04,
04,
04,
04,
04,
04,
04,
04,
04,
0
Illum
inat
ing
para
ffin
mar
ker .
......
....
-0,
2-
0,2
-0,
01-
0,01
-0,
01-
0,01
Tota
l ....
......
......
......
......
......
......
.....
126,
511
0,7
141,
512
5,7
151,
513
5,5
156,
513
5,5
166,
515
0,5
177,
516
1,5
Pum
p pr
ice:
Gau
teng
(as
in F
eb)*
392,
035
5,1
408,
034
7,5
420,
038
4,5
550,
038
4,5
561,
056
1,0
750,
073
2,1
Taxe
s as
per
cen
t of p
ump
pric
e ...
.32
,3
31,2
34,7
36
,2
36,1
35,2
28
,535
,2
29,7
27,8
23,7
22,1
* D
iese
l (0,
05 p
er c
ent
sulp
hur)
who
lesa
le p
rice
(reta
il pr
ice
not
regu
late
d)
2009
/10
2010
/11
2011
/201
220
12/2
013
2013
/14
2014
/15
2015
/16
Cen
ts/li
tre
93 o
ctan
e pe
trol
Die
sel
93 o
ctan
e pe
trol
Die
sel
93 o
ctan
e pe
trol
Die
sel
93 o
ctan
e pe
trol
Die
sel
93 o
ctan
e pe
trol
Die
sel
93 o
ctan
e pe
trol
Die
sel
93 o
ctan
e pe
trol
Die
sel
Gen
eral
fuel
levy
.....
......
......
......
....
150,
013
5,0
16
7,5
15
2,5
17
7,5
16
2,5
19
7,5
18
2,5
212,
519
7,5
224,
520
9,5
255,
024
0,0
Roa
d A
ccid
ent
Fund
(RA
F) le
vy ..
..64
,064
,0
72,0
72
,0
80,0
80
,0
88,0
88
,096
,096
,010
4,0
104,
015
4,0
154,
0
Cus
tom
s an
d ex
cise
levy
.....
......
...4,
04,
0
4,0
4,
0
4,0
4,
0
4,0
4,
04,
04,
04,
04,
04,
04,
0
Illum
inat
ing
para
ffin
mar
ker .
......
....
-0,
01
-
0,01
-
0,
01
-
0,01
0,0
0,01
0,0
0,01
0,0
0,01
Tota
l ....
......
......
......
......
......
......
.....
218,
020
3,01
24
3,5
22
8,51
26
1,5
24
6,51
28
9,5
27
4,51
312,
529
7,51
332,
5031
7,51
413,
0039
8,01
Pum
p pr
ice:
Gau
teng
(as
in F
eb)*
643,
064
9,35
78
5,0
70
1,85
88
4,0
81
4,05
1
077,
0
1 02
6,69
1 20
6.0
1 12
9,17
1 37
5, 0
01
311,
351
009,
0092
6,09
Taxe
s as
per
cen
t of p
ump
pric
e ...
.33
,9
31,3
31,0
32
,6
29,6
30
,3
26,9
26
,729
,029
,027
,628
,140
,943
,0
* D
iese
l (0,
05 p
er c
ent
sulp
hur)
who
lesa
le p
rice
(reta
il pr
ice
not
regu
late
d)
5.7
Gen
eral
fuel
levy
The
equa
lisat
ion
fund
levy
was
abo
lishe
d fro
m 1
Mar
ch 2
000.

29Tax Chronology: 1979–2015
Table 5.7.2 General fuel levy
DatePetrol:
unleaded Petrol:leaded
Distillatefuels (Diesel)
Rate (cents)
01/07/1987–31/03/1988 ............................................ - 23,5 24,7
01/04/1988–31/08/1988 ............................................ - 22,5 18,0
01/09/1988–15/01/1989 ............................................ - 22,9 19,9
16/01/1989–14/04/1989 ............................................ - 31,9 28,9
15/04/1989–24/03/1991 ............................................ - 31,9 31,4
25/03/1991–22/08/1991 ............................................ - 36,9 33,4
23/08/1991–20/03/1992 ............................................ - 46,9 41,4
21/03/1992–01/04/1993 ............................................ - 54,9 47,4
02/04/1993–04/04/1995 ............................................ - 60,9 53,4
05/04/1995–02/05/1995 ............................................ - 61,9 54,4
03/05/1995–31/03/1996 ............................................ - 62,9 55,4
01/02/1996–31/03/1996 ............................................ 56,7 62,9 55,4
01/04/1996–02/04/1996 ............................................ 59,9 66,1 58,6
03/04/1996–02/07/1996 ............................................ 62,9 69,1 61,6
03/07/1996–06/08/1996 ............................................ 63,9 70,1 62,6
07/08/1996–04/02/1997 ............................................ 65,4 71,6 62,6
05/02/1997–01/04/1997 ............................................ 66,4 72,6 63,6
02/04/1997–31/03/1998 ........................................... 70,4 76,6 66,1
01/04/1998–31/03/1999 ........................................... 80,4 86,6 76,1
01/04/1999–04/04/2000 ............................................ 84,4 90,6 76,1
05/04/2000–03/04/2001 ............................................ 89,4 95,6 79,1
04/04/2001–01/04/2003 ............................................ 91,8 98,0 81,0
02/04/2003–06/04/2004 ............................................ 101,0 101,0 85,0
07/04/2004–05/04/2005 ............................................ 111,0 111,0 85,0
07/04/2005–03/04/2006 ............................................ 116,0 116,0 100,0
06/04/2006–03/04/2007 ............................................ 116,0 116,0 100,0
04/04/2007–01/04/2008 ............................................ 121,0 121,0 105,0
02/04/2008–31/03/2009 ............................................ 127,0 127,0 111,0
01/04/2009–31/03/2010 ............................................ 150,0 150,0 135,0
01/04/2010–31/03/2011 ............................................ 167,5 167,5 152,5
01/04/2011–31/03/2012 ............................................ 177,5 177,5 162,5
01/04/2012–31/03/2013 ............................................ 197,5 197,5 182,5
01/04/2013–31/03/2014 ............................................ 212,5 212,5 197,5
01/04/2014–31/03/2015 ............................................ 224,5 224,5 209,5
01/04/2015–31/03/2016 ............................................ 225,0 225,0 240,0
Diesel fuel rebate
This rebate started on 1 June 2000 and was afterwards extended to other industries. It applies to all coastal industries along with fishing, agricultural, mining, forestry, farming and rail freight industries.
The general fuel levy and Road Accident Fund levy are partially refunded. Refunds are administered through the VAT system. The biodiesel fuel concession refund percentage to producers in agriculture, mining and forestry increased from 38,8 per cent of the general fuel levy to 40 per cent, from 6 April 2005. The actual concession increased from 36,86 cent to 40,00 cent per litre. From 2008, the biodiesel fuel tax concession increased from 40 per cent to 50 per cent.
From 7 April 2010, an additional 7,5 cents per litre increase on both petrol and diesel was implemented to help fund the new multi-product petroleum pipeline between Durban and Gauteng.

Tax Chronology: 1979–201530
Table 5.7.3 Road Accident Fund levy
Date 93 octane petrol Diesel
Rate (cents)
05/04/2000–03/04/2001 .................................................... – –
04/04/2001–01/04/2003 .................................................... 21,5 21,5
02/04/2003–06/04/2004 .................................................... 26,5 26,5
07/04/2004–05/04/2005 .................................................... 31,5 31,5
06/04/2005–03/04/2007 .................................................... 36,5 31,5
04/04/2007–01/04/2008 .................................................... 41,5 41,5
02/04/2008–31/03/2009 .................................................... 46,5 46,5
01/04/2009–31/03/2010 .................................................... 64,0 64,0
01/04/2010–31/03/2011 .................................................... 72,0 72,0
01/04/2011–31/03/2012 .................................................... 80,0 80,0
01/04/2012–31/03/2013 .................................................... 88,0 88,0
01/04/2013–31/03/2014 .................................................... 96,0 96,0
01/04/2014–31/03/2015 .................................................... 104,0 104,0
01/04/2015–31/03/2016 .................................................... 154,0 154,0
Customs and excise levy
The customs and excise levy will remain at 4,0 cents per litre for 2012/13.
Diesel power plants with a capacity of more than 200 megawatts will receive a full refund of the general fuel and RAF levies.
5.8 Mineral and petroleum royalties
The Mineral and Petroleum Resources Royalty Act 28 of 2008 was scheduled to be implemented from 1 May 2009. Mineral royalties are classified as a resource rent and therefore fall into the non-tax revenue category. The introduction of mining royalties was postponed for a year due to the recession and would be levied on minerals disposed of or exported from 1 March 2010.
5.9 Base oils for lubricating
Excise duty on base oils for lubrication was abolished from 1 April 2005. The duty was 20 cents per litre for many years.
5.10 Plastic bag levy (environmental levy)
The levy was first introduced in 2003 at 3 cents per bag. The plastic bag levy was increased from 3 cents per bag to 4 cents per bag from 1 April 2009.
The levy on plastic shopping bags, which had been at 4 cents per bag since 2009 was increased to 6 cents per bag from 1 April 2013.
5.11 Electricity tax/levy
Government introduced a 2c/kWh tax on the sale of electricity generated from non-renewable sources, to be collected at source by the producers or generators of electricity from 2009.
From 1 April 2011, the levy applied to electricity generated from renewable and nuclear energy sources was increased by 0,5c/kWh to 2,5c/kWh. The increase would have no impact on electricity tariffs because it had already been taken into account in the National Energy Regulator tariff structure.
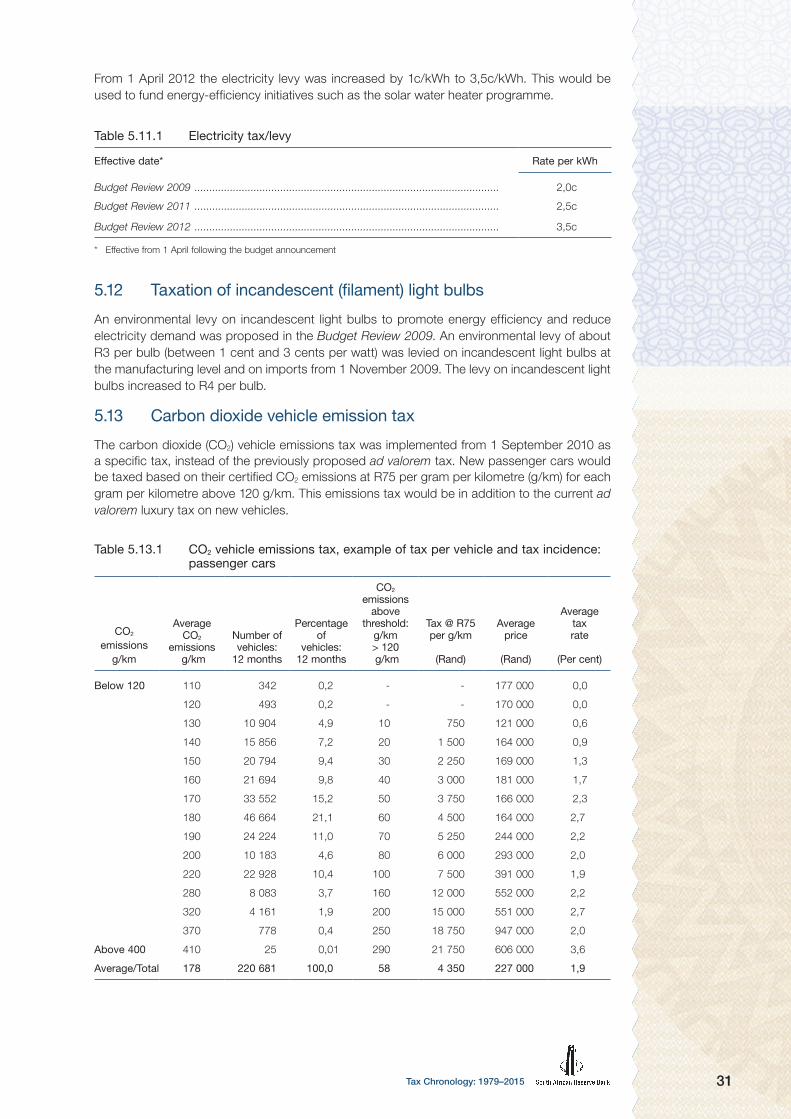
31Tax Chronology: 1979–2015
From 1 April 2012 the electricity levy was increased by 1c/kWh to 3,5c/kWh. This would be used to fund energy-efficiency initiatives such as the solar water heater programme.
Table 5.11.1 Electricity tax/levy
Effective date* Rate per kWh
Budget Review 2009 ....................................................................................................... 2,0c
Budget Review 2011 ....................................................................................................... 2,5c
Budget Review 2012 ....................................................................................................... 3,5c
* Effective from 1 April following the budget announcement
5.12 Taxation of incandescent (filament) light bulbs
An environmental levy on incandescent light bulbs to promote energy efficiency and reduce electricity demand was proposed in the Budget Review 2009. An environmental levy of about R3 per bulb (between 1 cent and 3 cents per watt) was levied on incandescent light bulbs at the manufacturing level and on imports from 1 November 2009. The levy on incandescent light bulbs increased to R4 per bulb.
5.13 Carbon dioxide vehicle emission tax
The carbon dioxide (CO2) vehicle emissions tax was implemented from 1 September 2010 as a specific tax, instead of the previously proposed ad valorem tax. New passenger cars would be taxed based on their certified CO2 emissions at R75 per gram per kilometre (g/km) for each gram per kilometre above 120 g/km. This emissions tax would be in addition to the current ad valorem luxury tax on new vehicles.
Table 5.13.1 CO2 vehicle emissions tax, example of tax per vehicle and tax incidence: passenger cars
CO2 emissions
g/km
AverageCO2
emissions g/km
Number of vehicles:
12 months
Percentage of
vehicles: 12 months
CO2 emissions
above threshold:
g/km > 120 g/km
Tax @ R75 per g/km
(Rand)
Average price
(Rand)
Average tax rate
(Per cent)
Below 120 110 342 0,2 - - 177 000 0,0
120 493 0,2 - - 170 000 0,0
130 10 904 4,9 10 750 121 000 0,6
140 15 856 7,2 20 1 500 164 000 0,9
150 20 794 9,4 30 2 250 169 000 1,3
160 21 694 9,8 40 3 000 181 000 1,7
170 33 552 15,2 50 3 750 166 000 2,3
180 46 664 21,1 60 4 500 164 000 2,7
190 24 224 11,0 70 5 250 244 000 2,2
200 10 183 4,6 80 6 000 293 000 2,0
220 22 928 10,4 100 7 500 391 000 1,9
280 8 083 3,7 160 12 000 552 000 2,2
320 4 161 1,9 200 15 000 551 000 2,7
370 778 0,4 250 18 750 947 000 2,0
Above 400 410 25 0,01 290 21 750 606 000 3,6
Average/Total 178 220 681 100,0 58 4 350 227 000 1,9

Tax Chronology: 1979–201532
5.14 Taxes on use of goods and permission to use goods or to perform activities
Table 5.14.1 Air departure tax
Effective date Rate
01/11/2000 .................... R50 per fee-paying passenger travelling to SACU countries R100 per fee-paying passenger travelling to all other international destinations
01/07/2003 .................... R55 per fee-paying passenger travelling to SACU countries R110 per fee-paying passenger travelling to all other international destinations
01/08/2005 .................... R60 per fee-paying passenger travelling to SACU countries R120 per fee-paying passenger travelling to all other international destinations
01/10/2009 .................... R80 per fee-paying passenger travelling to SACU countries R150 per fee-paying passenger travelling to all other international destinations
01/10/2011 .................... R100 per fee-paying passenger travelling to SACU countries R190 per fee-paying passenger travelling to all other international destinations
SACU countries: Botswana, Lesotho, Namibia, South Africa and Swaziland
5.15 Mining leases and ownership
Mining leases and ownership are calculated at differentiated rates pending the nature of the activities of the mines.
6. Taxes on international trade and transactionsTable 6.1 Calculation of taxes on international trade and transactions – only an example
Calculation of VAT and duties (imports) Tariff Cost (Rand)
Goods are imported free on board (fob) for R100
Import value (fob) ............................................................................ 100,00
Adjustment ..................................................................................... 10 per cent 10,00
The reason for the 10 per cent adjustment relates to the import value (R100 above) based on the fob cost
Adjusted value for VAT purposes .................................................... 110,00
Customs duty (dependent on the tariff book), for example ............ 2 per cent
Ad valorem (dependent on the tariff book), for example ................ 3 per cent
Total cost for importer
Purchase price ............................................................................... 100,00
Customs duty on R100 (based on import value) ............................. 2 per cent 2,00
Ad valorem on R100 (based on import value) ................................. 3 per cent 3,00
Adjustment ..................................................................................... 10,00
115,00
VAT (based on adjusted value plus all duties) 14 per cent 16,10
Total ................................................................................................. 131,10

33Tax Chronology: 1979–2015
6.1 Surcharge on imports
Table 6.1.1 Surcharge
Fiscal year AnnouncementImplemen-tation date Rate Important provisions
Amount collected:fiscal year ending
31 March(R millions)
1978/79 Budget speech on 1978/03/29
1978/03/30 12,5 Provisions remain unchanged. 359,4
1979/80 Budget speech on 1979/03/28
1979/03/29 7,5 Provisions remain unchanged. 250,6
1980/81 Budget speech on 1980/03/26
1980/03/27 Abolished Surcharge on all goods is abolished. This abolishment is also applicable to all goods at customs and excise offices, which have not yet been cleared for domestic consumption.
-2,9
1981/82 Partial appropriation draft act on 1982/02/10
1982/02/11 10 Surcharge is reinstated on all imported goods with the exception of goods for government stock.
100,3
1982/83 Special government notice 1982/11/26
1982/11/26 7,5 The 2,5 per cent reduction applies in order to comply with the IMF’s agreement to phase out the surcharge completely by the end of 1983.
598,2
Special government notice on 1983/11/25
1983/11/25 5
1983/84 Special government notice on 1983/11/29
1983/11/29 Abolished 226,0
1985/86 Special government notice on 1985/09/23
1985/09/23 10 Surcharge is reinstated on all imported goods with the exception of goods for government stock. Goods are subject to GATT.
498,6
1986/87 Budget speech on 1986/03/17
1986/03/18 10 Surcharge on all books is abolished.
837,8
Special notice 1986/06 10 Surcharge on certain imported natural resources and goods used in the production processes (as specified in the annexures to the Customs and Excise Act) are abolished.
1987/88 Budget speech on 1987/06/03
1987/06/04 10 All natural resources and intermediate products that are subject to the customs duties and which are used in the production process are exempted from surcharge.
742,6
1988/89 Special notice on 1988/08/12
1988/08/15 0-60 As above and essential food imports are exempted from the surcharge. Certain discounts on natural resources and intermediate products.
1875,6
1989/90 Special notice on 1989/05/05
1989/05/05 0-60 Discounts in respect of intermediate goods are abolished, but taxed at a lower rate (15 per cent, previously 30 per cent).
2625,4

Tax Chronology: 1979–201534
Table 6.1.1 Surcharge
Fiscal year AnnouncementImplemen-tation date Rate Important provisions
Amount collected:fiscal year ending
31 March(R millions)
1990/91 Budget speech on 1990/03/14
1990/03/14 0-40 Reduction of differentiated rates:60 per cent to 40 per cent on luxury goods20 per cent to 15 per cent on white goods15 per cent to 10 per cent on capital goods10 per cent to 7,5 per cent on intermediate goods.
2075,3
1991/92 Budget speech on 1991/03/20
0-40 Change in differentiated rates:Luxury goods 40 per centWhite goods 15 per centCapital goods 5 per centIntermediate goods 5 per cent
1455,5
1992/93 Unchanged 1520,8
1993/94 Unchanged 1756,1
1994/95 Budget Review 1994
1994/06/23 0–40 Surcharge on capital and intermediate goods is abolished.
1 170,8
Government Gazette on 1994/09/02
1994/09/02 Surcharge on vehicles is abolished.
1995/96Budget Review 1995 1995/10/01
Remaining surcharge on luxury and white goods is abolished.
7. Other taxes
7.1 Stamp duty
A duty was imposed on debit entries by banks, instalment credit agreements, lease agreements of fixed property, unlisted marketable securities and previously on the issue of official documents such as passports, contracts, deeds for the transfer of ownership and cheques.
Stamp duties on:
– share transactions were reduced from 1 per cent to 0,5 per cent from 1 April 1996; – share transactions were reduced from 0,5 per cent to 0,25 per cent from 1 April 1997; – antenuptial and postnuptial contracts, duplicate originals, partnership agreements and
power of attorney were abolished from 1 April 1999; – bills of exchange, bills of entry and securities and suretyships were abolished from
1 April 2001; – the cession of mortgages and the cession of insurance policies were abolished from
1 April 2002; – insurance policies against accident, bodily injury, incapacity or sickness were abolished
from 1 April 2002; – insurance policies and fixed deposits were abolished from 1 April 2003; – mortgages were abolished from 1 March 2004; – negotiable certificates of deposits (NCDs) were abolished from 1 April 2004; – all debit entries were eliminated from 1 March 2005; and – the issue of shares was eliminated from 1 January 2006.
The threshold exemption for stamp duties on leases was increased from R200 to R500 per agreement from 1 March 2006.
From March 2007, stamp duties on short-term leases (less than five years) were abolished.
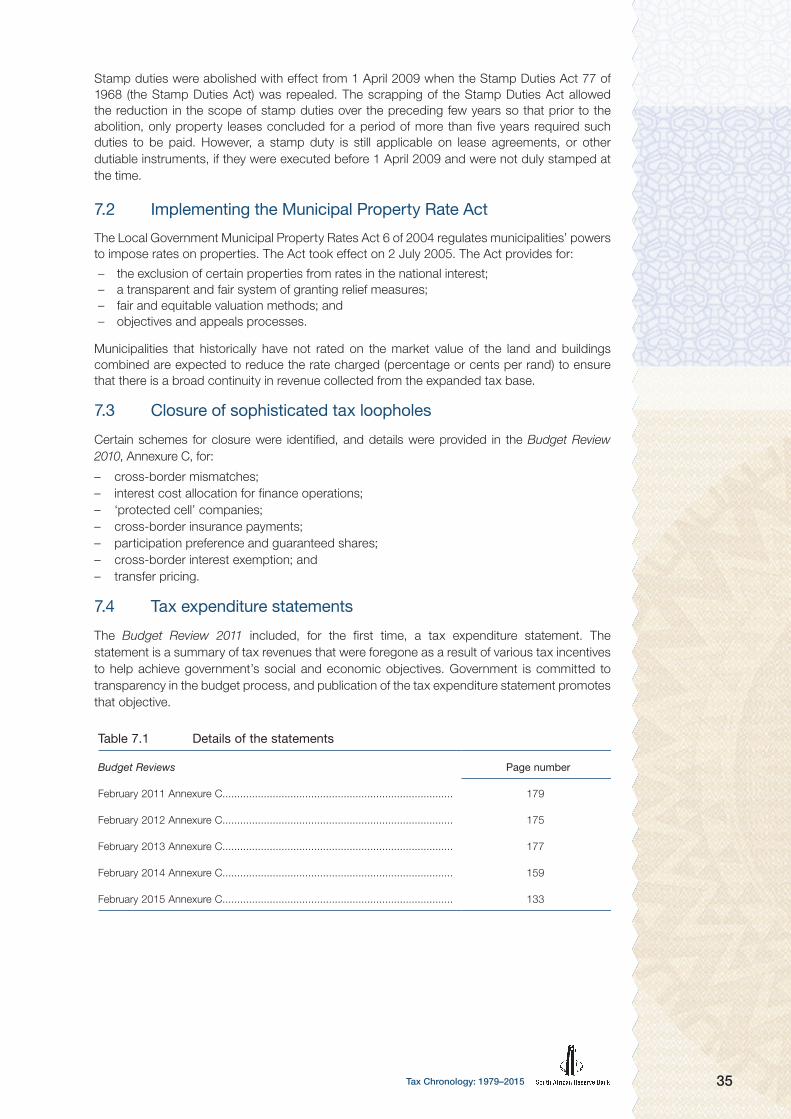
35Tax Chronology: 1979–2015
Stamp duties were abolished with effect from 1 April 2009 when the Stamp Duties Act 77 of 1968 (the Stamp Duties Act) was repealed. The scrapping of the Stamp Duties Act allowed the reduction in the scope of stamp duties over the preceding few years so that prior to the abolition, only property leases concluded for a period of more than five years required such duties to be paid. However, a stamp duty is still applicable on lease agreements, or other dutiable instruments, if they were executed before 1 April 2009 and were not duly stamped at the time.
7.2 Implementing the Municipal Property Rate Act
The Local Government Municipal Property Rates Act 6 of 2004 regulates municipalities’ powers to impose rates on properties. The Act took effect on 2 July 2005. The Act provides for:
– the exclusion of certain properties from rates in the national interest; – a transparent and fair system of granting relief measures; – fair and equitable valuation methods; and – objectives and appeals processes.
Municipalities that historically have not rated on the market value of the land and buildings combined are expected to reduce the rate charged (percentage or cents per rand) to ensure that there is a broad continuity in revenue collected from the expanded tax base.
7.3 Closure of sophisticated tax loopholes
Certain schemes for closure were identified, and details were provided in the Budget Review 2010, Annexure C, for:
– cross-border mismatches; – interest cost allocation for finance operations; – ‘protected cell’ companies; – cross-border insurance payments; – participation preference and guaranteed shares; – cross-border interest exemption; and – transfer pricing.
7.4 Tax expenditure statements
The Budget Review 2011 included, for the first time, a tax expenditure statement. The statement is a summary of tax revenues that were foregone as a result of various tax incentives to help achieve government’s social and economic objectives. Government is committed to transparency in the budget process, and publication of the tax expenditure statement promotes that objective.
Tax chronology: 1979 – 201536
From 1 April 2009 stamp duty was abolished with effect from 1 April 2009 when the Stamp Duties Act 77 of 1968 (the Stamp Duty Act) was repealed. The scrapping of the Stamp Duties Act allowed the reduction in the scope of stamp duties over the preceding few years so that prior to the abolition, only property leases concluded for a period of more than five years required such duties to be paid. However, stamp duty is still applicable on lease agreements, or other dutiable instruments, if they were executed before 1 April 2009 and were not duly stamped at the time.
7.2 Implementing the Municipal Property Rate Act
The Local Government Municipal Property Rates Act, 2004 (Act No. 6 of 2004) regulates municipalities’ powers to impose rates on properties. The Act took effect on 2 July 2005. The Act provides for:
– the exclusion of certain properties from rates in the national interest;
– a transparent and fair system of granting relief measures;
– fair and equitable valuation methods; and
– objectives and appeals processes.
Municipalities that historically have not rated on the market value of the land and buildings combined are expected to reduce the rate charged (percentage or cents per rand) to ensure that there is a broad continuity in revenue collected from the expanded tax base.
7.3 Closure of sophisticated tax loopholes
Certain schemes for closure was identified, and details was provided in the Budget Review 2010, Annexure C: – cross-border mismatches; – interest cost allocation for finance operations; – “protected cell” companies; – cross-border insurance payments; – participation preference and guaranteed shares; – cross-border interest exemption; and – transfer pricing.
7.4 Tax expenditure statement
The Budget Review 2011 included, for the first time, a tax expenditure statement. The statement is a summary of tax revenues that were foregone as a result of various tax incentives to help achieve government’s social and economic objectives. Government is committed to transparency in the budget process, and publication of the tax expenditure statement promotes that objective.
Table 7.1 Details of the statements
Budget Reviews Page number
February 2011 Annexure C.............................................................................. 179
February 2012 Annexure C.............................................................................. 175
February 2013 Annexure C.............................................................................. 177
February 2014 Annexure C.............................................................................. 159
February 2015 Annexure C.............................................................................. 133
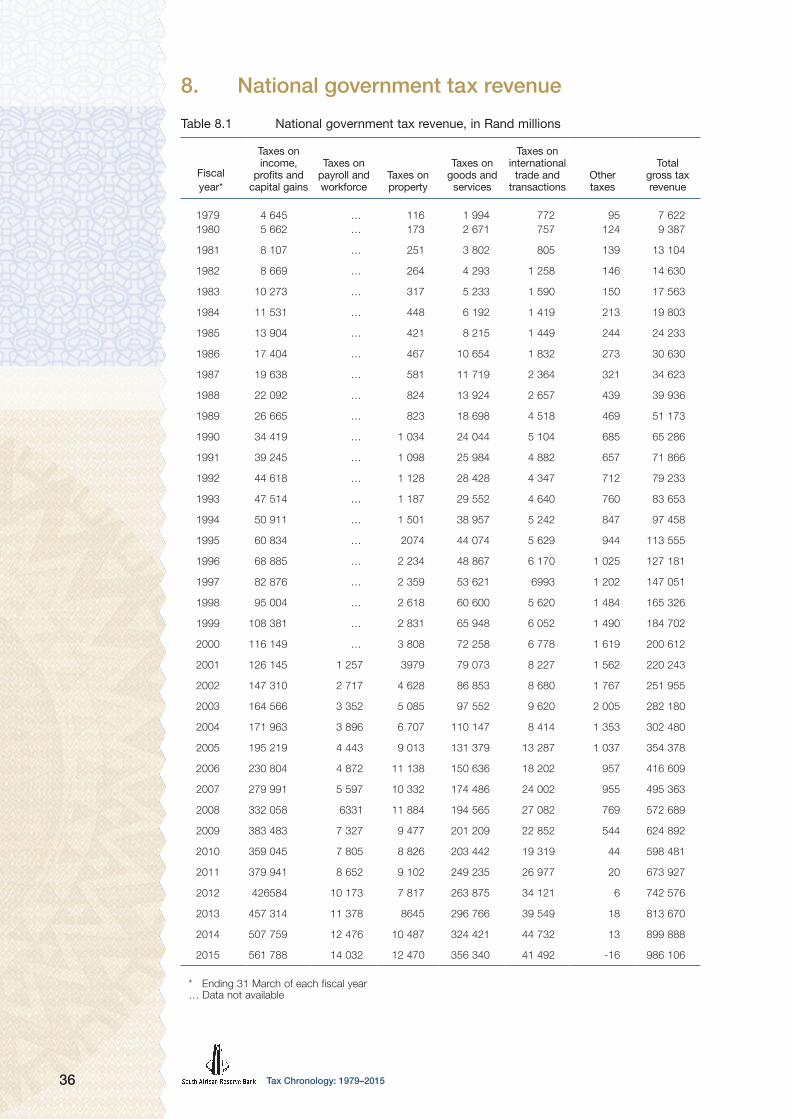
Tax Chronology: 1979–201536
8. National government tax revenue
Table 8.1 National government tax revenue, in Rand millions
Fiscal year*
Taxes on income,
profits and capital gains
Taxes on payroll and workforce
Taxes on property
Taxes on goods and
services
Taxes on international
trade and transactions
Other taxes
Totalgross tax revenue
1979 4 645 … 116 1 994 772 95 7 6221980 5 662 … 173 2 671 757 124 9 387
1981 8 107 … 251 3 802 805 139 13 104
1982 8 669 … 264 4 293 1 258 146 14 630
1983 10 273 … 317 5 233 1 590 150 17 563
1984 11 531 … 448 6 192 1 419 213 19 803
1985 13 904 … 421 8 215 1 449 244 24 233
1986 17 404 … 467 10 654 1 832 273 30 630
1987 19 638 … 581 11 719 2 364 321 34 623
1988 22 092 … 824 13 924 2 657 439 39 936
1989 26 665 … 823 18 698 4 518 469 51 173
1990 34 419 … 1 034 24 044 5 104 685 65 286
1991 39 245 … 1 098 25 984 4 882 657 71 866
1992 44 618 … 1 128 28 428 4 347 712 79 233
1993 47 514 … 1 187 29 552 4 640 760 83 653
1994 50 911 … 1 501 38 957 5 242 847 97 458
1995 60 834 … 2074 44 074 5 629 944 113 555
1996 68 885 … 2 234 48 867 6 170 1 025 127 181
1997 82 876 … 2 359 53 621 6993 1 202 147 051
1998 95 004 … 2 618 60 600 5 620 1 484 165 326
1999 108 381 … 2 831 65 948 6 052 1 490 184 702
2000 116 149 … 3 808 72 258 6 778 1 619 200 612
2001 126 145 1 257 3979 79 073 8 227 1 562 220 243
2002 147 310 2 717 4 628 86 853 8 680 1 767 251 955
2003 164 566 3 352 5 085 97 552 9 620 2 005 282 180
2004 171 963 3 896 6 707 110 147 8 414 1 353 302 480
2005 195 219 4 443 9 013 131 379 13 287 1 037 354 378
2006 230 804 4 872 11 138 150 636 18 202 957 416 609
2007 279 991 5 597 10 332 174 486 24 002 955 495 363
2008 332 058 6331 11 884 194 565 27 082 769 572 689
2009 383 483 7 327 9 477 201 209 22 852 544 624 892
2010 359 045 7 805 8 826 203 442 19 319 44 598 481
2011 379 941 8 652 9 102 249 235 26 977 20 673 927
2012 426584 10 173 7 817 263 875 34 121 6 742 576
2013 457 314 11 378 8645 296 766 39 549 18 813 670
2014 507 759 12 476 10 487 324 421 44 732 13 899 888
2015 561 788 14 032 12 470 356 340 41 492 -16 986 106
* Ending 31 March of each fiscal year… Data not available

Annexures A–AK

Tax Chronology: 1979–201538
9. Annexures: Personal income tax rate and bracket adjustments
Annexure A Budget Review 1979
1979/80
Income (R per annum) Rate Tax scale (R)
Married ................................................. 1–1 000 7 0
1 000–2 000 8 70
2 000–3 000 9 150
3 000–4000 10 240
4 000–5 000 11 340
5 000–6000 12 450
6 000–7 000 14 570
7 000–8 000 16 710
8 000–9 000 18 870
9 000–10 000 20 1050
10 000–11 000 22 1250
11 000–12 000 24 1470
12 000–13 000 26 1710
13 000–4 000 28 1970
14 000–15 000 30 2250
15 000–16 000 33 2550
16 000–18 000 36 2880
18 000–20 000 39 3600
20 000–22 000 42 4380
22 000–24 000 45 5220
24 000–26 000 48 6120
26 000–28 000 51 7080
28 000–30 000 54 8100
30 000– 55 9180
Single ................................................... 1–1 000 10 0
1 000–2 000 11 100
2 000–3 000 12 210
3 000–4 000 13 330

39Tax Chronology: 1979–2015
Annexure A Budget Review 1979
1979/80
Income (R per annum) Rate Tax scale (R)
4 000–5 000 14 460
5 000–6 000 16 600
6 000–7 000 18 760
7 000–8 000 20 940
8 000–9 000 22 1 140
9 000–10 000 24 1 360
10 000–11 000 27 1 600
11 000–12 000 30 1 870
12 000–13 000 33 2 170
13 000–14 000 36 2 500
14 000–15 000 39 2 860
15 000–16 000 42 3 250
16 000–18 000 45 3 670
18 000–20 000 48 4 570
20 000–22 000 52 5 530
22 000– 55 6 570
Rebates
Married ................................................. R1 500
Single ................................................... R1 000
Dependants……………….. .................. R200 if maintenance is R200 R350 if maintenance is R350
Child ..................................................... R600 first two 200 thereafter
Age over 65 .......................................... R1 000
Medical and insurance (Married) ........... R1 200
Medical and insurance (Single) ............. R 950
Loan levy
If the normal tax calculated at these rates amounts to R150 or more, a loan levy at the following rate is added thereto:
– If the taxpayer falls in the age group ‘60 and older’ and his taxable income does not exceed R5 000, no levy is added.– In all other cases, the loan levy amounts to 10 per cent; in calculating the loan levy, fractions of a rand are discarded.
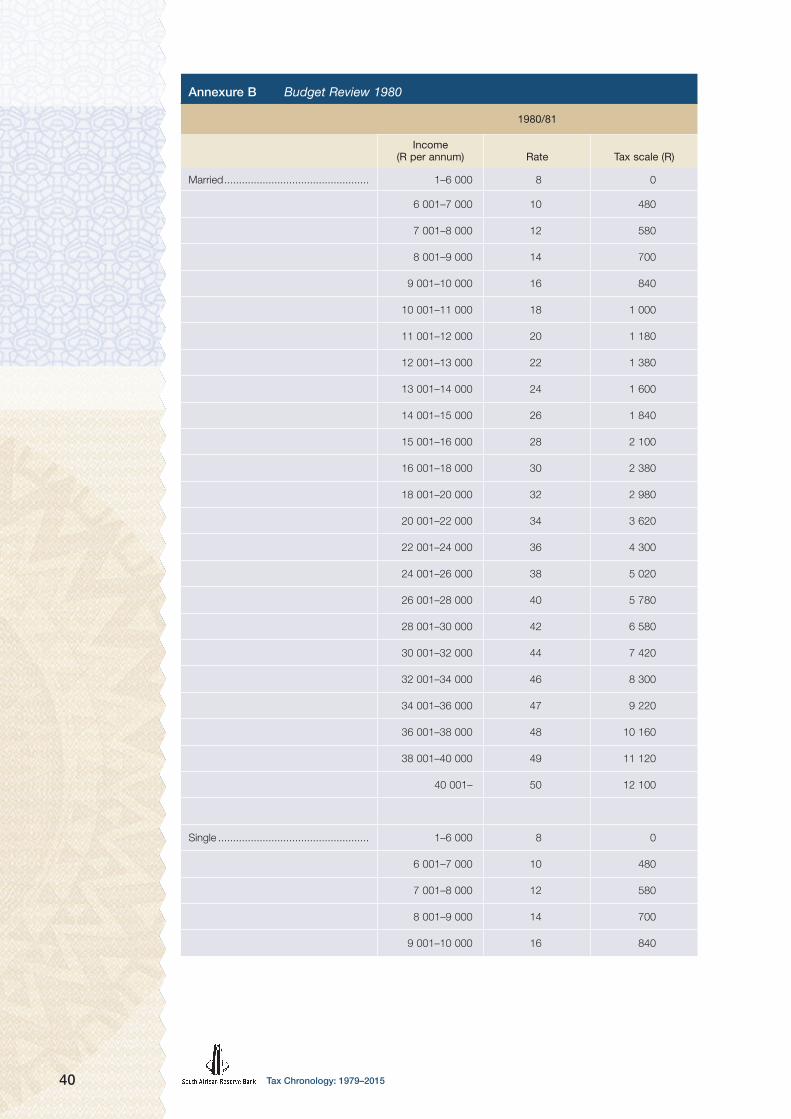
Tax Chronology: 1979–201540
Annexure B Budget Review 1980
1980/81
Income (R per annum) Rate Tax scale (R)
Married ................................................. 1–6 000 8 0
6 001–7 000 10 480
7 001–8 000 12 580
8 001–9 000 14 700
9 001–10 000 16 840
10 001–11 000 18 1 000
11 001–12 000 20 1 180
12 001–13 000 22 1 380
13 001–14 000 24 1 600
14 001–15 000 26 1 840
15 001–16 000 28 2 100
16 001–18 000 30 2 380
18 001–20 000 32 2 980
20 001–22 000 34 3 620
22 001–24 000 36 4 300
24 001–26 000 38 5 020
26 001–28 000 40 5 780
28 001–30 000 42 6 580
30 001–32 000 44 7 420
32 001–34 000 46 8 300
34 001–36 000 47 9 220
36 001–38 000 48 10 160
38 001–40 000 49 11 120
40 001– 50 12 100
Single ................................................... 1–6 000 8 0
6 001–7 000 10 480
7 001–8 000 12 580
8 001–9 000 14 700
9 001–10 000 16 840

41Tax Chronology: 1979–2015
Annexure B Budget Review 1980
1980/81
Income (R per annum) Rate Tax scale (R)
10 001–11 000 18 1 000
11 001–12 000 20 1 180
12 001–13 000 22 1 380
13 001–14 000 24 1 600
14 001–15 000 26 1 840
15 001–16 000 28 2 100
16 001–18 000 30 2 380
18 001–20 000 32 2 980
20 001–22 000 34 3 620
22 001–24 000 36 4 300
24 001–26 000 38 5 020
26 001–28 000 40 5 780
28 001–30 000 42 6 580
30 001–32 000 44 7 420
32 001–34 000 46 8 300
34 001–36 000 47 9 220
36 001–38 000 48 10 160
38 001–40 000 49 11 120
40 001– 50 12 100
Rebates
Married ................................................. R200
Single ................................................... R120
Dependants……………….. .................. R350 R30 if maintenance is > R200
R50 if maintenance is > R350
Child ..................................................... R100 Extra R50 in excess of five
Age over 60 .......................................... R120
Medical and insurance .......................... 10 per cent (max. R75)
Surcharge on normal tax payable by unmarried persons.
Where the taxable income does not exceed R28 000, a surcharge is added equal to 20 per cent of the tax so calculated, after deducting an amount equal to the rebates. Where the taxable income of such person exceeds R28 000, the tax payable is the amount of tax calculated as aforesaid on the taxable income of R28 000, plus 50 per cent of the amount by which the taxable income exceeds R28 000.

Tax Chronology: 1979–201542
Annexure C Budget Review 1981
1981/82
Income (R per annum) Rate Tax scale (R)
Married ................................................. 1–6 000 8 0
6 001–7 000 10 480
7 001–8 000 12 580
8 001–9 000 14 700
9 001–10 000 16 840
10 001–11 000 18 1 000
11 001–12 000 20 1 180
12 001–13 000 22 1 380
13 001–14 000 24 1 600
14 001–15 000 26 1 840
15 001–16 000 28 2 100
16 001–18 000 30 2 380
18 001–20 000 32 2 980
20 001–22 000 34 3 620
22 001–24 000 36 4 300
24 001–26 000 38 5 020
26 001–28 000 40 5 780
28 001–30 000 42 6 580
30 001–32 000 44 7 420
32 001–34 000 46 8 300
34 001–36 000 47 9 220
36 001–38 000 48 10 160
38 001–40 000 49 11 120
40 001– 50 12 100
Single ................................................... 1–6 000 8 0
6 001–7 000 10 480
7 001–8 000 12 580
8 001–9 000 14 700
9 001–10 000 16 840

43Tax Chronology: 1979–2015
Annexure C Budget Review 1981
1981/82
Income (R per annum) Rate Tax scale (R)
10 001–11 000 18 1 000
11 001–12 000 20 1 180
12 001–13 000 22 1 380
13 001–14 000 24 1 600
14 001–15 000 26 1 840
15 001–16 000 28 2 100
16 001–18 000 30 2 380
18 001–20 000 32 2 980
20 001–22 000 34 3 620
22 001–24 000 36 4 300
24 001–26 000 38 5 020
26 001–28 000 40 5 780
28 001–30 000 42 6 580
30 001–32 000 44 7 420
32 001–34 000 46 8 300
34 001–36 000 47 9 220
36 001–38 000 48 10 160
38 001–40 000 49 11 120
40 001– 50 12 100
Rebates
Married ................................................. R200
Single ................................................... R120
Dependants……………….. .................. R30 if maintenance is > R200
R50 if maintenance is > R350
Child ..................................................... R100 Extra R50 in excess of five
Age 60–70............................................ R120 Age over 70............. R80
Medical and insurance .......................... 10 per cent (max. R75)
Surcharge on normal tax payable by unmarried persons.
Where the taxable income does not exceed R28 000, a surcharge is added equal to 20 per cent of the tax so calculated, after deducting an amount equal to the rebates. Where the taxable income of such person exceeds R28 000, the tax payable is the amount of tax calculated as aforesaid on the taxable income of R28 000, plus 50 per cent of the amount by which the taxable income exceeds R28 000.
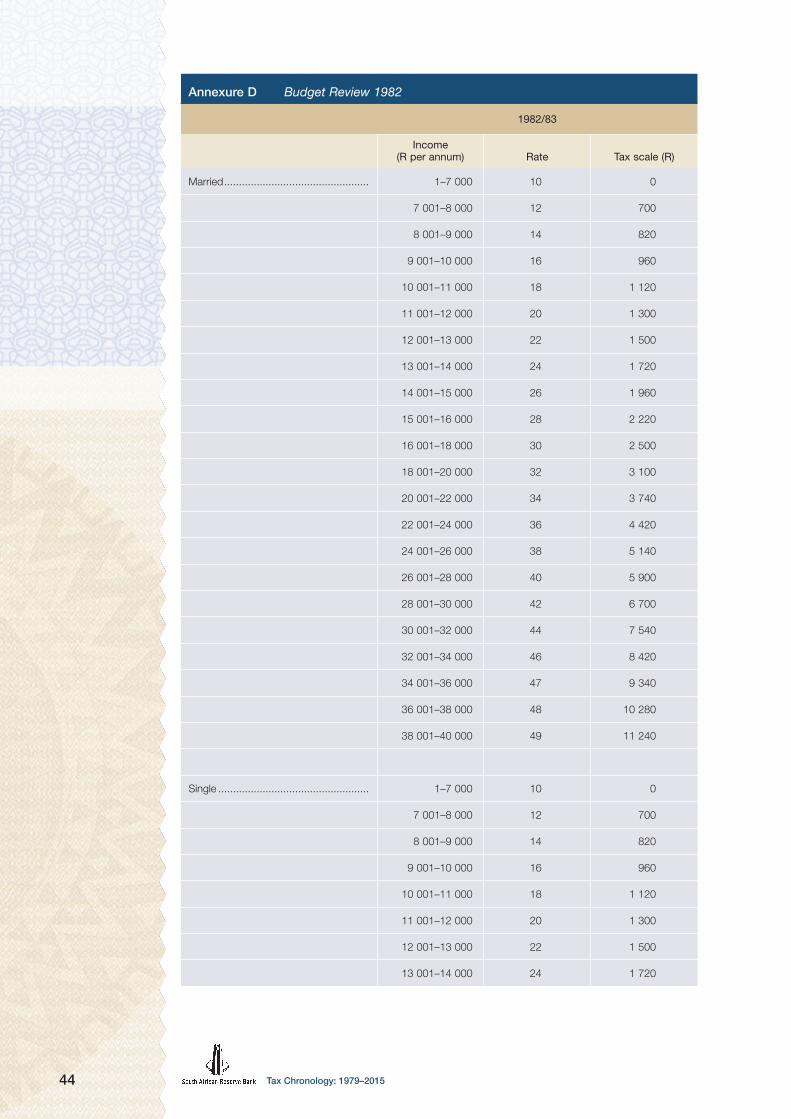
Tax Chronology: 1979–201544
Annexure D Budget Review 1982
1982/83
Income (R per annum) Rate Tax scale (R)
Married ................................................. 1–7 000 10 0
7 001–8 000 12 700
8 001–9 000 14 820
9 001–10 000 16 960
10 001–11 000 18 1 120
11 001–12 000 20 1 300
12 001–13 000 22 1 500
13 001–14 000 24 1 720
14 001–15 000 26 1 960
15 001–16 000 28 2 220
16 001–18 000 30 2 500
18 001–20 000 32 3 100
20 001–22 000 34 3 740
22 001–24 000 36 4 420
24 001–26 000 38 5 140
26 001–28 000 40 5 900
28 001–30 000 42 6 700
30 001–32 000 44 7 540
32 001–34 000 46 8 420
34 001–36 000 47 9 340
36 001–38 000 48 10 280
38 001–40 000 49 11 240
Single ................................................... 1–7 000 10 0
7 001–8 000 12 700
8 001–9 000 14 820
9 001–10 000 16 960
10 001–11 000 18 1 120
11 001–12 000 20 1 300
12 001–13 000 22 1 500
13 001–14 000 24 1 720

45Tax Chronology: 1979–2015
Annexure D Budget Review 1982
1982/83
Income (R per annum) Rate Tax scale (R)
14 001–15 000 26 1 960
15 001–16 000 28 2 220
16 001–18 000 30 2 500
18 001–20 000 32 3 100
20 001–22 000 34 3 740
22 001–24 000 36 4 420
24 001–26 000 38 5 140
26 001–28 000 40 5 900
28 001–30 000 42 6 700
30 001–32 000 44 7 540
32 001–34 000 46 8 420
34 001–36 000 47 9 340
36 001–38 000 48 10 280
38 001–40 000 49 11 240
40 001– 50 12 220
Rebates
Married ................................................. R320
Single ................................................... R240
Dependants……………….. .................. R30 if maintenance is > R200
R50 if maintenance is > R350
Child ..................................................... R100 Extra R50 in excess of five
Age over 60–70 .................................... R120 Age over 70 R80
Medical and insurance .......................... 10 per cent (max. R75) Single (R20 min.)
Surcharge on normal tax payable by unmarried persons.
Where the taxable income does not exceed R28 000, a surcharge is added equal to 20 per cent of the tax so calculated, after deducting an amount equal to the rebates. Where the taxable income of such person exceeds R28 000, the tax payable is the amount of tax calculated as aforesaid on the taxable income of R28 000, plus 50 per cent of the amount by which the taxable income exceeds R28 000.
Loan levy
A 5 per cent loan levy must be added to normal tax calculated according to the above-mentioned rates of tax.
A loan levy is not payable:
1. where the taxable income does not exceed R7 000;
2. where the basic normal tax is less than R150; and
3. by a person over the age of 70 whose taxable income does not exceed R15 000.
In calculating the loan levy, fractions of a rand are discarded.

Tax Chronology: 1979–201546
Annexure E Budget Review 1983
1983/84
Income (R per annum) Rate Tax scale (R)
Married ................................................. 1–7 000 10 0
7 001–8 000 12 700
8 001–9 000 14 820
9 001–10 000 16 960
10 001–11 000 18 1 120
11 001–12 000 20 1 300
12 001–13 000 22 1 500
13 001–14 000 24 1 720
14 001–15 000 26 1 960
15 001–16 000 28 2 220
16 001–18 000 30 2 500
18 001–20 000 32 3 100
20 001–22 000 34 3 740
22 001–24 000 36 4 420
24 001–26 000 38 5 140
26 001–28 000 40 5 900
28 001–30 000 42 6 700
30 001–32 000 44 7 540
32 001–34 000 46 8 420
34 001–36 000 47 9 340
36 001–38 000 48 10 280
38 001–40 000 49 11 240
40 001– 50 12 220
Single ................................................... 1–7 000 10 0
7 001–8 000 12 700
8 001–9 000 14 820
9 001–10 000 16 960
10 001–11 000 18 1 120
11 001–12 000 20 1 300
12 001–13 000 22 1 500
13 001–14 000 24 1 720

47Tax Chronology: 1979–2015
Annexure E Budget Review 1983
1983/84
Income (R per annum) Rate Tax scale (R)
14 001–15 000 26 1 960
15 001–16 000 28 2 220
16 001–18 000 30 2 500
18 001–20 000 32 3 100
20 001–22 000 34 3 740
22 001–24 000 36 4 420
24 001–26 000 38 5 140
26 001–28 000 40 5 900
28 001–30 000 42 6 700
30 001–32 000 44 7 540
32 001–34 000 46 8 420
34 001–36 000 47 9 340
36 001–38 000 48 10 280
38 001–40 000 49 11 240
40 001– 50 12 220
Rebates
Married ................................................. R460
Single ................................................... R380
Dependants……………….. .................. R30 if maintenance is > R200
R50 if maintenance is > R350
Child ..................................................... R100 Extra R50 in excess of five
Age 60–70............................................ R120 Age over 70 R300
Medical and insurance ..........................10 per cent (max. R75) (min. R30)
Single (R20 min.)
Surcharge on normal tax payable by unmarried persons.
Where the taxable income does not exceed R28 000, a surcharge is added equal to 20 per cent of the tax so calculated, after deducting an amount equal to the rebates. Where the taxable income of such person exceeds R28 000, the tax payable is the amount of tax calculated as aforesaid on the taxable income of R28 000, plus 50 per cent of the amount by which the taxable income exceeds R28 000.
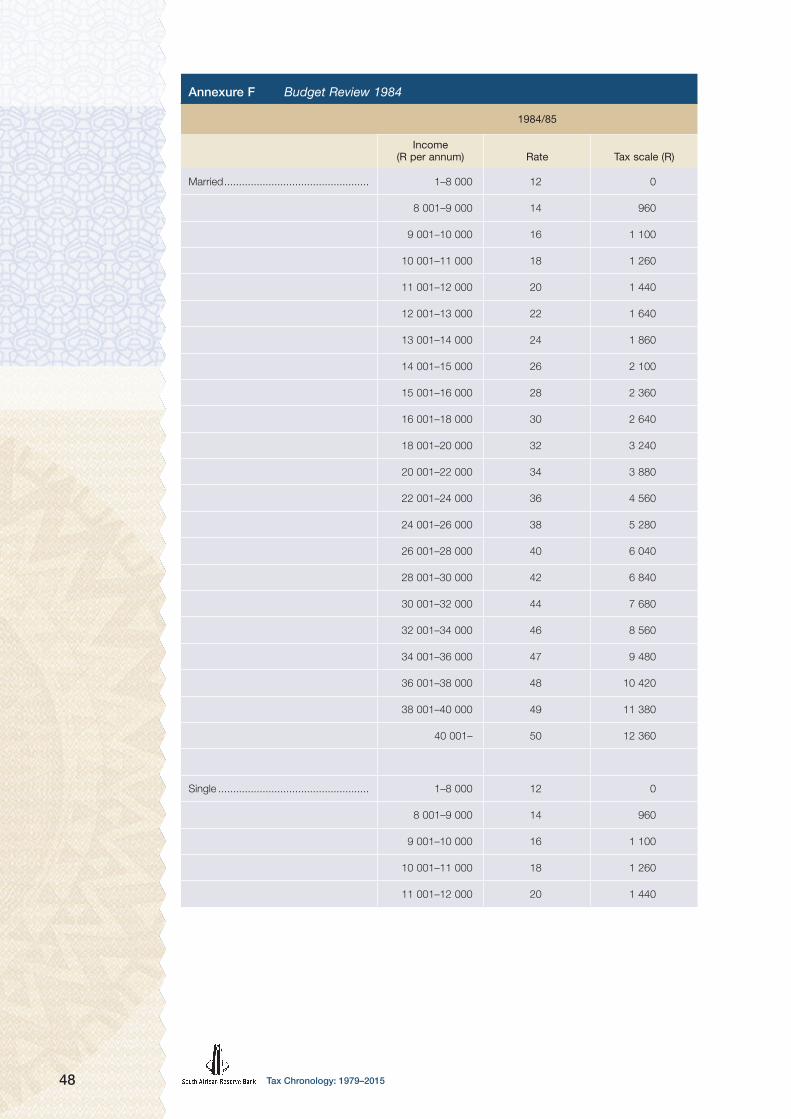
Tax Chronology: 1979–201548
Annexure F Budget Review 1984
1984/85
Income (R per annum) Rate Tax scale (R)
Married ................................................. 1–8 000 12 0
8 001–9 000 14 960
9 001–10 000 16 1 100
10 001–11 000 18 1 260
11 001–12 000 20 1 440
12 001–13 000 22 1 640
13 001–14 000 24 1 860
14 001–15 000 26 2 100
15 001–16 000 28 2 360
16 001–18 000 30 2 640
18 001–20 000 32 3 240
20 001–22 000 34 3 880
22 001–24 000 36 4 560
24 001–26 000 38 5 280
26 001–28 000 40 6 040
28 001–30 000 42 6 840
30 001–32 000 44 7 680
32 001–34 000 46 8 560
34 001–36 000 47 9 480
36 001–38 000 48 10 420
38 001–40 000 49 11 380
40 001– 50 12 360
Single ................................................... 1–8 000 12 0
8 001–9 000 14 960
9 001–10 000 16 1 100
10 001–11 000 18 1 260
11 001–12 000 20 1 440

49Tax Chronology: 1979–2015
Annexure F Budget Review 1984
1984/85
Income (R per annum) Rate Tax scale (R)
12 001–13 000 22 1 640
13 001–14 000 24 1 860
14 001–15 000 26 2 100
15 001–16 000 28 2 360
16 001–18 000 30 2 640
18 001–20 000 32 3 240
20 001–22 000 34 3 880
22 001–24 000 36 4 560
24 001–26 000 38 5 280
26 001–28 000 40 6 040
28 001–30 000 42 6 840
30 001–32 000 44 7 680
32 001–34 000 46 8 560
34 001–36 000 47 9 480
36 001–38 000 48 10 420
38 001–40 000 49 11 380
40 001– 50 12 360
Rebates
Married ................................................. R460
Single ................................................... R380
Dependants……………….. .................. R30 if maintenance is > R200
R50 if maintenance is > R350
Child ..................................................... R100 Extra R50 in excess of five
Age 60–70............................................ R120 Age over 70 R300
Medical and insurance ..........................10 per cent (max. R75) (min. R30)
Single (R20 min.)
Surcharge on normal tax payable by unmarried persons.
Where the taxable income does not exceed R28 000, a surcharge is added equal to 20 per cent of the tax so calculated, after deducting an amount equal to the rebates. Where the taxable income of such person exceeds R28 000, the tax payable is the amount of tax calculated as aforesaid on the taxable income of R28 000, plus 50 per cent of the amount by which the taxable income exceeds R28 000.

Tax Chronology: 1979–201550
Annexure G Budget Review 1985
1985/86
Income (R per annum) Rate Tax scale (R)
Married ................................................. 1–12 000 16 0
12 000–13 000 18 1 920
13 000–14 000 20 2 100
14 000–15 000 22 2 300
15 000–16 000 24 2 520
16 000–18 000 26 2 760
18 000–20 000 28 3 280
20 000–22 000 30 3 840
22 000–24 000 32 4 440
24 000–26 000 34 5 080
26 000–28 000 36 5 760
28 000–30 000 38 6 480
30 000–32 000 40 7 240
32 000–34 000 42 8 040
34 000–36 000 43 8 880
36 000–38 000 44 9 740
38 000–40 000 45 10 620
40 000–50 000 46 11 520
50 000–60 000 48 16 120
60 000– 50 20 920
Single ................................................... 1–10 000 16 0
10 000–11 000 18 1 600
11 000–12 000 20 1 780
12 000–13 000 22 1 980
13 000–14 000 24 2 200

51Tax Chronology: 1979–2015
Annexure G Budget Review 1985
1985/86
Income (R per annum) Rate Tax scale (R)
14 000–15 000 26 2 440
15 000–16 000 28 2 700
16 000–18 000 30 2 980
18 000–20 000 32 3 580
20 000–22 000 34 4 220
22 000–24 000 36 4 900
24 000–26 000 38 5 620
26 000–28 000 40 6 380
28 000–30 000 42 7 180
30 000–32 000 44 8 020
32 000–34 000 45 8 900
34 000–36 000 46 9 800
36 000–38 000 47 10 720
38 000–40 000 48 11 660
40 000–42 000 49 12 620
42 000– 50 13 600
Rebates
Married ................................................. R880
Single ................................................... R620
Dependants……………….. .................. R30 if maintenance is > R200
R50 if maintenance is > R350
Child ..................................................... R100 Extra R50 in excess of five
Age 60–64............................................ R120 Age over 65 R500
Medical and insurance ..........................10 per cent (max. R75) (min. R30)
Single (R20 min.)
Surcharge on normal tax payable.
A surcharge is added to the tax calculated in accordance with the rates above. The surcharge is calculated at the rate of 7 per cent on the tax (after deduction of the rebates) if it exceeds R750. (The surcharge is payable by all married and unmarried persons, regardless of their ages).

Tax Chronology: 1979–201552
Annexure H Budget Review 1986
1986/87
Income (R per annum) Rate Tax scale (R)
Married ................................................. 1–12 000 16 0
12 000–13 000 18 1 920
13 000–14 000 20 2 100
14 000–15 000 22 2 300
15 000–16 000 24 2 520
16 000–18 000 26 2 760
18 000–20 000 28 3 280
20 000–22 000 30 3 840
22 000–24 000 32 4 440
24 000–26 000 34 5 080
26 000–28 000 36 5 760
28 000–30 000 38 6 480
30 000–32 000 40 7 240
32 000–34 000 42 8 040
34 000–36 000 43 8 880
36 000–38 000 44 9 740
38 000–40 000 45 10 620
40 000–50 000 46 11 520
50 000–60 000 48 16 120
60 000– 50 20 920
Single ................................................... 1–10 000 16 0
10 000–11 000 18 1 600
11 000–12 000 20 1 780
12 000–13 000 22 1 980
13 000–14 000 24 2 200
14 000–15 000 26 2 440
15 000–16 000 28 2 700

53Tax Chronology: 1979–2015
Annexure H Budget Review 1986
1986/87
Income (R per annum) Rate Tax scale (R)
16 000–18 000 30 2 980
18 000–20 000 32 3 580
20 000–22 000 34 4 220
22 000–24 000 36 4 900
24 000–26 000 38 5 620
26 000–28 000 40 6 380
28 000–30 000 42 7 180
30 000–32 000 44 8 020
32 000–34 000 45 8 900
34 000–36 000 46 9 800
36 000–38 000 47 10 720
38 000–40 000 48 11 660
40 000–42 000 49 12 620
42 000– 50 13 600
Rebates
Married ................................................. R880
Single ................................................... R620
Dependants……………….. .................. R30 if maintenance is > R200
R50 if maintenance is > R350
Child ..................................................... R100 Extra R50 in excess of five
Age 60–64............................................ R120 Age over 65 R500
Medical and insurance ..........................10 per cent (max. R75) (min. R30)
Single (R20 min.)
According to the above tax rates, after rebates, a discount of 5 per cent is given.

Tax Chronology: 1979–201554
Annexure I Budget Review 1987
1987/88
Income (R per annum) Rate Tax scale (R)
Married ................................................. 1–12 000 15 0
12 000–13 000 16 1 800
13 000–14 000 18 1 960
14 000–15 000 20 2 140
15 000–16 000 22 2 340
16 000–18 000 24 2 560
18 000–20 000 26 3 040
20 000–22 000 28 3 560
22 000– 24 000 30 4 120
24 000–26 000 32 4 720
26 000–28 000 34 5 360
28 000–30 000 36 6 040
30 000–35 000 38 6 760
35 000–40 000 40 8 660
40 000–45 000 42 10 660
45 000–50 000 43 12 760
50 000–60 000 44 14 910
60 000 45 19 310
Single ................................................... 1–10 000 15 0
10 000–11 000 16 1 500
11 000–12 000 18 1 660

55Tax Chronology: 1979–2015
Annexure I Budget Review 1987
1987/88
Income (R per annum) Rate Tax scale (R)
12 000–13 000 20 1 840
13 000–14 000 22 2 040
14 000–15 000 24 2 260
15 000–16 000 26 2 500
16 000–18 000 28 2 760
18 000–20 000 30 3 320
20 000–22 000 32 3 920
22 000– 24 000 34 4 560
24 000–26 000 36 5 240
26 000–28 000 38 5 960
28 000–30 000 40 6 720
30 000–34 000 42 7 520
34 000–38 000 43 9 200
38 000–42 000 44 10 920
42 000– 45 12 680
Rebates
Married ................................................. R920
Single ................................................... R650
Dependants……………….. .................. R30 if maintenance is > R200
R50 if maintenance is > R350
Child ..................................................... R100 Extra R50 in excess of five
Age 60–70............................................ R120 Age over 70 R500
Medical and insurance ..........................10 per cent (max. R75) (min. R30)
Single (R20 min.)

Tax Chronology: 1979–201556
Annexure J Budget Review 1988
1988/89
Income (R per annum) Rate Tax scale (R)
Married ................................................. 1–12 000 14 0
12 000–13 000 15 1 680
13 000–14 000 17 1 830
14 000–15 000 19 2 000
15 000–16 000 21 2 190
16 000–18 000 23 2 400
18 000–20 000 25 2 860
20 000–22 000 27 3 360
22 000–24 000 29 3 900
24 000–26 000 31 4 480
26 000–28 000 33 5 100
28 000–30 000 35 5 760
30 000–35 000 37 6 460
35 000–40 000 39 8 310
40 000–50 000 41 10 260
50 000–60 000 42 14 360
60 000–70 000 43 18 560
70 000–80 000 44 22 860
80 000– 45 27 260
Single ................................................... 1–10 000 14 0
10 000–11 000 15 1 400
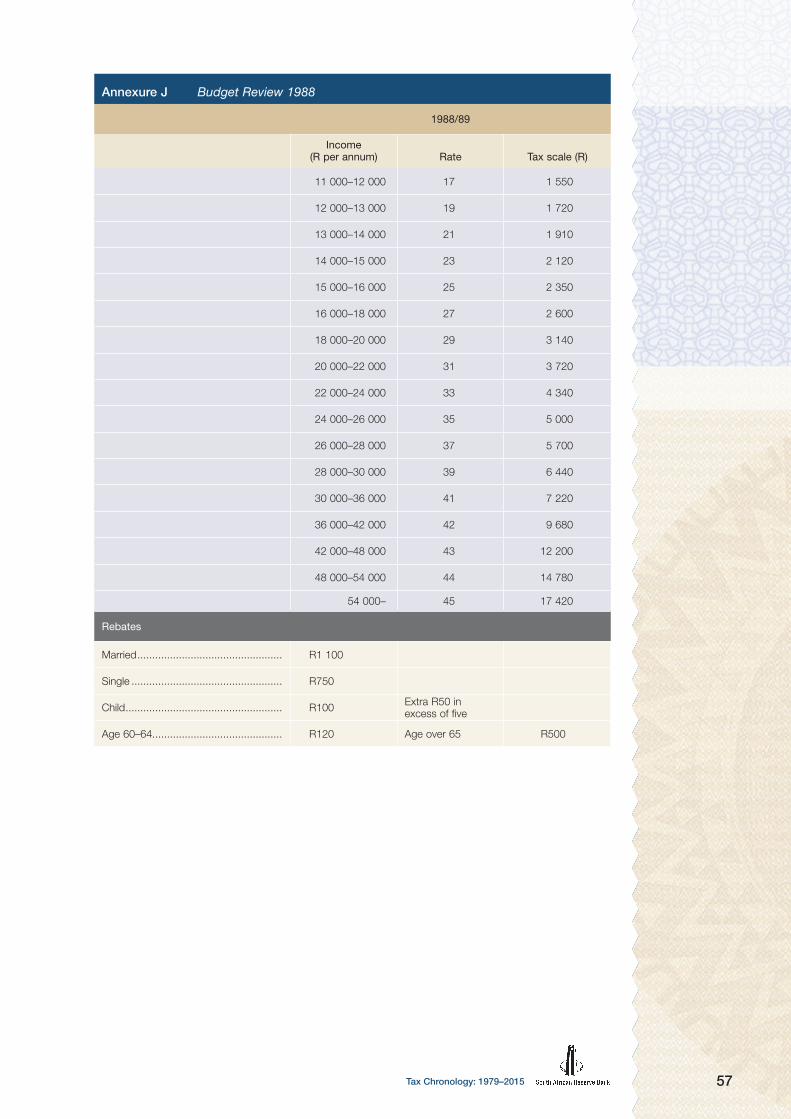
57Tax Chronology: 1979–2015
Annexure J Budget Review 1988
1988/89
Income (R per annum) Rate Tax scale (R)
11 000–12 000 17 1 550
12 000–13 000 19 1 720
13 000–14 000 21 1 910
14 000–15 000 23 2 120
15 000–16 000 25 2 350
16 000–18 000 27 2 600
18 000–20 000 29 3 140
20 000–22 000 31 3 720
22 000–24 000 33 4 340
24 000–26 000 35 5 000
26 000–28 000 37 5 700
28 000–30 000 39 6 440
30 000–36 000 41 7 220
36 000–42 000 42 9 680
42 000–48 000 43 12 200
48 000–54 000 44 14 780
54 000– 45 17 420
Rebates
Married ................................................. R1 100
Single ................................................... R750
Child ..................................................... R100 Extra R50 in excess of five
Age 60–64............................................ R120 Age over 65 R500

Tax Chronology: 1979–201558
Annexure K Budget Review 1989
1989/90
Income (R per annum) Rate Tax scale (R)
Married ................................................. 1–12 000 14 0
12 000–13 000 15 1 680
13 000–14 000 17 1 830
14 000–15 000 19 2 000
15 000–16 000 21 2 190
16 000–18 000 23 2 400
18 000–20 000 25 2 860
20 000–22 000 27 3 360
22 000– 24 000 29 3 900
24 000–26 000 31 4 480
26 000–28 000 33 5 100
28 000–30 000 35 5 760
30 000–35 000 37 6 460
35 000–40 000 39 8 310
40 000–50 000 41 10 260
50 000–60 000 42 14 360
60 000–70 000 43 18 560
70 000–80 000 44 22 860
80 000– 45 27 260
Single ................................................... 1–10 000 14 0
10 000–11 000 15 1 400
11 000–12 000 17 1 550
12 000–13 000 19 1 720
13 000–14 000 21 1 910
14 000–15 000 23 2 120

59Tax Chronology: 1979–2015
Annexure K Budget Review 1989
1989/90
Income (R per annum) Rate Tax scale (R)
15 000–16 000 25 2 350
16 000–18 000 27 2 600
18 000–20 000 29 3 140
20 000–22 000 31 3 720
22 000–24 000 33 4 340
24 000–26 000 35 5 000
26 000–28 000 37 5 700
28 000–30 000 39 6 440
30 000–36 000 41 7 220
36 000–42 000 42 9 680
42 000–48 000 43 12 200
48 000–54 000 44 14 780
54 000– 45 17 420
Married women .................................... 1–20 000 25 0
20 000–24 000 28 5 000
24 000–28 000 30 6 120
28 000–32 000 32 7 320
32 000–36 000 34 8 600
36 000–40 000 36 9 960
40 000 38 11 400
Rebates
Married ................................................. R1 250
Single ................................................... R850
Married women .................................... R1 075
Child ..................................................... R100
Age 1 ................................................... R120
Age 2 ................................................... R1 450

Tax Chronology: 1979–201560
Annexure L Budget Review 1990
1990/91
Income (R per annum) Rate Tax scale (R)
Married ................................................. 1–5 000 16 0
5 000–10 000 18 800
10 000–15 000 20 1 700
15 000–20 000 22 2 700
20 000–25 000 24 3 800
25 000–30 000 27 5 000
30 000–35 000 30 6 350
35 000–40 000 33 7 850
40 000–45 000 36 9 500
45 000–50 000 39 11 300
50 000–55 000 40 13 250
55 000–60 000 41 15 250
60 000–70 000 42 17 300
70 000–80 000 43 21 500
80 000– 44 25 800
Single ................................................... 1–4 000 15 0
4 000–8 000 18 600
8 000–12 000 21 1 320
12 000–16 000 24 2 160
16 000–20 000 27 3 120
20 000–24 000 30 4 200
24 000–28 000 33 5 400
28 000–32 000 36 6 720
32 000–36 000 39 8 160
36 000–40 000 40 9 720
40 000-44 000 41 11 320
44 000–48 000 42 12 960
48 000–56 000 43 14 640
56 000– 44 18 080

61Tax Chronology: 1979–2015
Annexure L Budget Review 1990
1990/91
Income (R per annum) Rate Tax scale (R)
Married women .................................... 1–4 000 15 0
4 000–8 000 18 600
8 000–12 000 21 1 320
12 000–16 000 24 2 160
16 000–20 000 27 3 120
20 000–24 000 30 4 200
24 000–28 000 32 5 400
28 000–32 000 34 6 680
32 000–36 000 36 8 040
36 000–40 000 37 9 480
40 000 38 10 960
Rebates
Married ................................................. R2 100
Single ................................................... R1 800
Married women .................................... R700
Child ..................................................... R100
Age 1 ................................................... R120
Age 2 ................................................... R2 100

Tax Chronology: 1979–201562
Annexure M Budget Review 1991
1991/92
Income (R per annum) Rate Tax scale (R)
Married ................................................. 1–5 000 15 0
5 000–10 000 17 750
10 000–15 000 19 1 600
15 000–20 000 21 2 550
20 000–25 000 23 3 600
25 000–30 000 26 4 750
30 000–35 000 29 6 050
35 000–40 000 32 7 500
40 000–45 000 35 9 100
45 000–50 000 38 10 850
50 000–55 000 39 12 750
55 000–60 000 40 14 700
60 000–70 000 41 16 700
70 000–80 000 42 20 800
80 000– 43 25 000
Single ................................................... 1–5 000 14 0
5 000–10 000 17 700
10 000–15 000 21 1 550
15 000–20 000 25 2 600
20 000–25 000 29 3 850
25 000–30 000 33 5 300
30 000–35 000 36 6 950
35 000–40 000 39 8 750
40 000–45 000 40 10 700
45 000–50 000 41 12 700
50 000–56 000 42 14 750
56 000– 43 17 270

63Tax Chronology: 1979–2015
Annexure M Budget Review 1991
1991/92
Income (R per annum) Rate Tax scale (R)
Married women .................................... 1–4 000 15 0
4 000–8 000 18 600
8 000–12 000 21 1 320
12 000–16 000 24 2 160
16 000–20 000 27 3 120
20 000–24 000 30 4 200
24 000–28 000 32 5 400
28 000–32 000 34 6 680
32 000–36 000 36 8 040
36 000–40 000 37 9 480
40 000– 38 10 960
Rebates
Married ................................................. R2 000
Single ................................................... R1 625
Married women .................................... R800
Child ..................................................... R100
Age 1 ................................................... R120
Age 2 ................................................... R2 100

Tax Chronology: 1979–201564
Annexure N Budget Review 1992
1992/93
Income (R per annum) Rate Tax scale (R)
Married ................................................. 1–5 000 17 0
5 000–10 000 18 850
10 000–15 000 19 1 750
15 000–20 000 20 2 700
20 000–30 000 21 3 700
30 000–40 000 28 5 800
40 000–50 000 36 8 600
50 000–60 000 41 12 200
60 000–80 000 42 16 300
80 000– 43 24 700
Single ................................................... 1–5 000 17 0
5 000–10 000 19 850
10 000–15 000 21 1 800
15 000–20 000 24 2 850
20 000–30 000 28 4 050
30 000–40 000 36 6 850
40 000–50 000 41 10 450
50 000–56 000 42 14 550
56 000– 43 17 070
Married women .................................... 1–5 000 17 0
5 000–10 000 19 850
10 000–15 000 21 1 800
15 000–20 000 24 2 850
20 000–30 000 28 4 050
30 000–40 000 36 6 850
40 000–50 000 38 10 450
50 000– 40 14 250
Rebates
Married ................................................. R2 225
Single ................................................... R1 950
Married women .................................... R900
Child ..................................................... R100
Age 1 ................................................... R120
Age 2 ................................................... R2 500
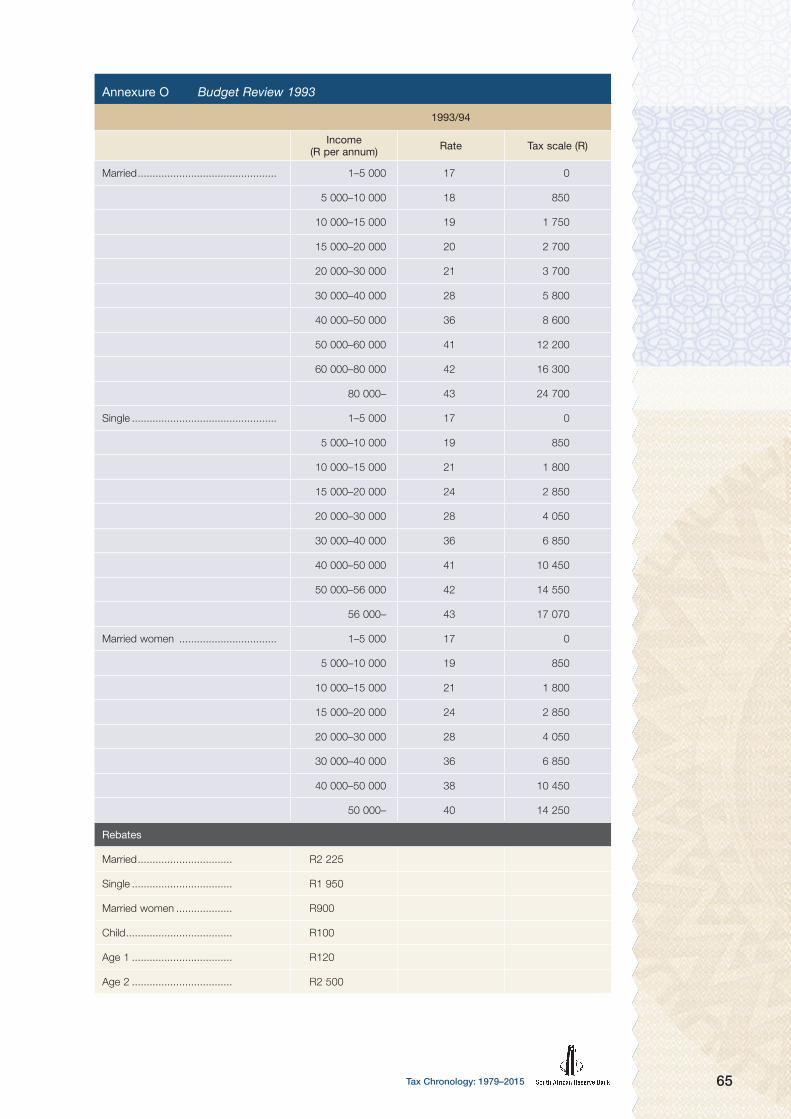
65Tax Chronology: 1979–2015
Annexure O Budget Review 1993
1993/94
Income (R per annum) Rate Tax scale (R)
Married ............................................... 1–5 000 17 0
5 000–10 000 18 850
10 000–15 000 19 1 750
15 000–20 000 20 2 700
20 000–30 000 21 3 700
30 000–40 000 28 5 800
40 000–50 000 36 8 600
50 000–60 000 41 12 200
60 000–80 000 42 16 300
80 000– 43 24 700
Single ................................................. 1–5 000 17 0
5 000–10 000 19 850
10 000–15 000 21 1 800
15 000–20 000 24 2 850
20 000–30 000 28 4 050
30 000–40 000 36 6 850
40 000–50 000 41 10 450
50 000–56 000 42 14 550
56 000– 43 17 070
Married women ................................. 1–5 000 17 0
5 000–10 000 19 850
10 000–15 000 21 1 800
15 000–20 000 24 2 850
20 000–30 000 28 4 050
30 000–40 000 36 6 850
40 000–50 000 38 10 450
50 000– 40 14 250
Rebates
Married ................................ R2 225
Single .................................. R1 950
Married women ................... R900
Child .................................... R100
Age 1 .................................. R120
Age 2 .................................. R2 500

Tax Chronology: 1979–201566
Annexure P Budget Review 1994
1994/95
Income(R per annum) Rate Tax scale (R)
Married .............................................. 1–5 000 17 0
5 000–10 000 18 850
10 000–15 000 19 1 750
15 000–20 000 20 2 700
20 000–30 000 21 3 700
30 000–40 000 28 5 800
40 000–50 000 36 8 600
50 000–60 000 41 12 200
60 000–80 000 42 16 300
80 000– 43 24 700
Single ................................................ 1–5 000 17 0
5 000–10 000 19 850
10 000–15 000 21 1 800
15 000–20 000 24 2 850
20 000–30 000 28 4 050
30 000–40 000 36 6 850
40 000–50 000 41 10 450
50 000–56 000 42 14 550
56 000– 43 17 070
Married women ................................ 1–5 000 17 0
5 000–10 000 19 850
10 000–15 000 21 1 800
15 000–20 000 24 2 850
20 000–30 000 28 4 050
30 000–40 000 36 6 850
40 000–50 000 38 10 450
50 000– 40 14 250
Rebates
Married .............................................. R2 225
Single ................................................ R1 950
Married women ................................. R900
Child .................................................. R100
Age 1 ................................................ R120
Age 2 ................................................ R2 500
Note: The transitional levy is applicable and calculated as follows:
1. Married and unmarried persons: 3,33 per cent of taxable income exceeding R50 000 (taxable income excludes certain retirement benefits).
2. Married women: 3,33 per cent of taxable income exceeding R175 000 (taxable income excludes certain retirement benefits).
3. Companies (including close corporations): 5 per cent of taxable income exceeding R50 000.
4. Trusts and estates (taxable as unmarried persons): 3,33 per cent of taxable income exceeding R50 000.

67Tax Chronology: 1979–2015
Impact on tax proposals
Proposals after fiscal drag (R billions)
Fiscal reliefRate increase in income tax
2015/16 ................................................................ -8 500 9 420
2014/15 ................................................................ -9 250 …
2013/14 ................................................................ -7 032 …
2012/13 ................................................................ -9 500 …
2011/12 ................................................................ -8 100 …
2010/11 ................................................................ -6 500 …
2009/10 ................................................................ -13 000 …
2008/09 ................................................................ -7 700 …
2007/08 ................................................................ -8 400 …
2006/07 ................................................................ -12 125 …
2005/06 ................................................................ -6 800 …
2004/05 ................................................................ -4 000 …
1994/95 to 2003/04 .............................................. -62 763 …
Total ...................................................................... -100 907 9 420
Personal income tax relief
Personal income tax provides the foundation for an equitable and progressive tax system. Personal income tax brackets and rebates are partially adjusted for ‘fiscal drag’ to take inflation into account. To compensate the effects of inflation, which pushes some individuals into higher tax brackets and reduces their purchasing power, the personal income brackets and rebates have been adjusted, providing individuals with personal income tax relief as shown in the table below.

Tax Chronology: 1979–201568
Annexure Q Budget Review 1995
1995/96
Taxable income(R per annum) Rates of tax
1–5 000 17 per cent of each R1
5 001–10 000 R850 + 18 per cent of the amount above R5 000
10 001–15 000 R1 750 + 19 per cent of the amount above R10 000
15 001–20 000 R2 700 + 20 per cent of the amount above R15 000
20 001–30 000 R3 700 + 21 per cent of the amount above R20 000
30 001–40 000 R5 830 + 31 per cent of the amount above R30 000
40 001–50 000 R8 900 + 42 per cent of the amount above R40 000
50 001–70 000 R13 100 + 43 per cent of the amount above R50 000
70 001–80 000 R21 700 + 44 per cent of the amount above R70 000
80 001–and above R26 100 + 45 per cent of the amount above R80 000
Rebates
Primary R2 625
Age 65 and over (additional to primary rebate R2 500
Tax threshold
Below age 65 R14 600
Age 65 and over R26 785
Note: In addition, a transitional levy of 1,67 per cent of taxable income exceeding R50 000 is applicable to all persons, including trusts and estates.
Annexure R Budget Review 1996
1996/97
Taxable income(R per annum) Rates of tax
1–15 000 17 per cent of each R1
15 001–20 000 R2 550 + 19 per cent of the amount above R15 000
20 001–30 000 R3 500 + 21 per cent of the amount above R20 000
30 001–40 000 R5 600 + 30 per cent of the amount above R30 000
40 001–60 000 R8 600 + 41 per cent of the amount above R40 000
60 001–80 000 R16 800 + 43 per cent of the amount above R60 000
80 001–100 000 R25 400 + 44 per cent of the amount above R80 000
100 001–and above R34 200 + 45 per cent of the amount above R100 000
Rebates
Primary R2 660
Age 65 and over (additional to primary rebate) R2 500
Tax threshold
Below age 65 R15 800
Age 65 and over R27 905

69Tax Chronology: 1979–2015
Annexure S Budget Review 1997
1997/98
Taxable income(R per annum) Rates of tax
1–30 000 19 per cent of each R1
30 001–35 000 R5 700 + 30 per cent of the amount above R30 000
35 001–45 000 R7 200 + 32 per cent of the amount above R35 000
45 001–60 000 R10 400 + 41 per cent of the amount above R45 000
60 001–70 000 R16 550 + 43 per cent of the amount above R60 000
70 001–100 000 R20 850 + 44 per cent of the amount above R70 000
100 001 and above R34 050 + 45 per cent of the amount above R100 000
Rebates
Primary R3 215
Age 65 and over (additional to primary rebate R2 500
Tax threshold
Below age 65 R16 921
Age 65 and over R30 050
Annexure T Budget Review 1998
1998/99
Taxable income(R per annum) Rates of tax
1–31 000 19 per cent of each R1
31 001–46 000 R5 890 + 30 per cent of the amount above R31 000
46 001–60 000 R10 390 + 39 per cent of the amount above R46 000
60 001–70 000 R15 850 + 43 per cent of the amount above R60 000
70 001–120 000 R20 150 + 44 per cent of the amount above R70 000
120 001 and above R42 150 + 45 per cent of the amount above R120 000
Rebates
Primary R3 515
Age 65 and over (additional to primary rebate) R2 660
Tax threshold
Below age 65 R18 500
Age 65 and over R31 950

Tax Chronology: 1979–201570
Annexure U Budget Review 1999
1999/00
Taxable income(R per annum) Rates of tax
1–33 000 19 per cent of each R1
33 001–50 000 R6 270 + 30 per cent of the amount above R33 000
50 001–60 000 R11 370 + 35 per cent of the amount above R50 000
60 001–70 000 R14 870 + 40 per cent of the amount above R60 000
70 001–120 000 R18 870 + 44 per cent of the amount above R70 000
120 001 and above R40 870 + 45 per cent of the amount above R120 000
Rebates
Primary R3 710
Age 65 and over (additional to primary rebate) R2 775
Tax threshold
Below age 65 R19 526
Age 65 and over R33 717
Annexure V Budget Review 2000
1999/00 2000/01
Taxable income(R per annum) Rates of tax Taxable income
(R per annum) Rates of tax
1–33 000 19 per cent of each R1 1–35 000 18 per cent of each R1
33 001–50 000 R6 270 + 30 per cent of the amount above R33 000
35 001–45 000 R6 300 + 26 per cent of the amount above R35 000
50 001–60 000 R11 370 + 35 per cent of the amount above R50 000
45 001–60 000 R8 900 + 32 per cent of the amount above R45 000
60 001–70 000 R14 870 + 40 per cent of the amount above R60 000
60 001–70 000 R13 700 + 37 per cent of the amount above R60 000
70 001–120 000 R18 870 + 44 per cent of the amount above R70 000
70 001–200 000 R17 400 + 40 per cent of the amount above R70 000
120 001 and above R40 870 + 45 per cent of the amount above R120 000
200 001 and above R69 400 + 42 per cent of the amount above R200 000
Rebates Rebates
Primary R3 710 Primary R3 800
Age 65 and over (additional to primary rebate)
R2 775Age 65 and over (additional to primary rebate)
R2 900
Tax threshold Tax threshold
Below age 65 R19 526 Below age 65 R21 111
Age 65 and over R33 717 Age 65 and over R36 538
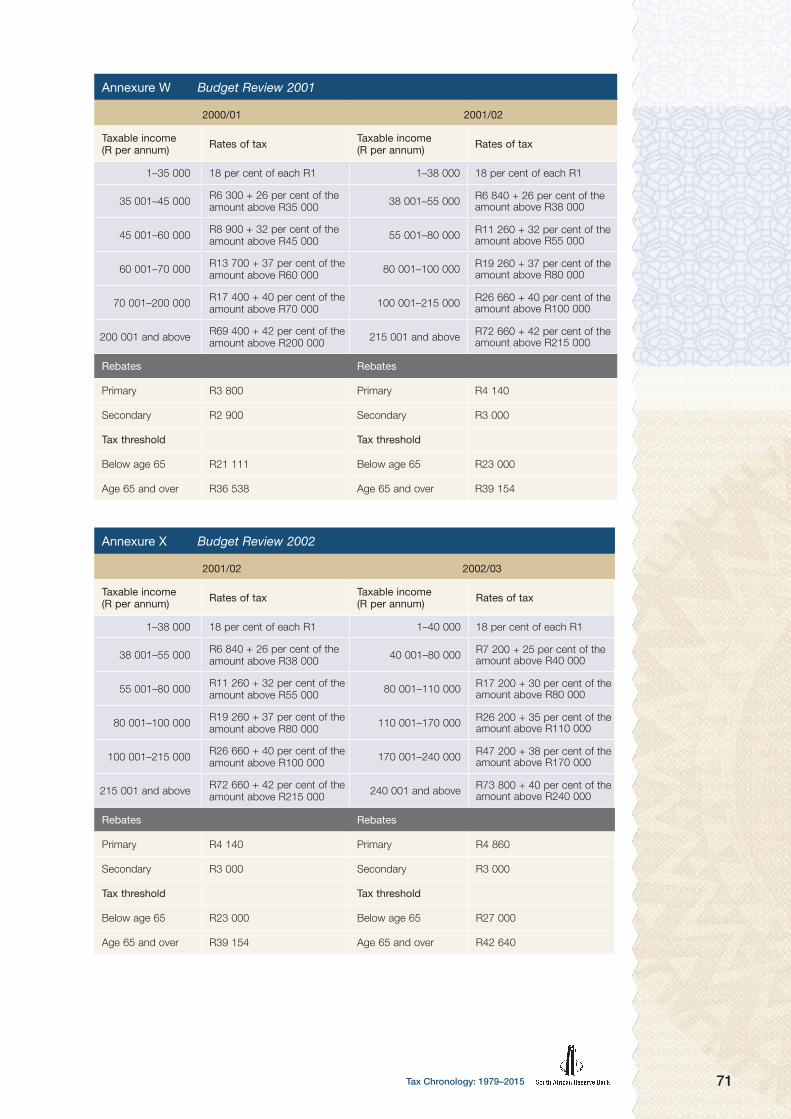
71Tax Chronology: 1979–2015
Annexure W Budget Review 2001
2000/01 2001/02
Taxable income(R per annum) Rates of tax Taxable income
(R per annum) Rates of tax
1–35 000 18 per cent of each R1 1–38 000 18 per cent of each R1
35 001–45 000 R6 300 + 26 per cent of the amount above R35 000 38 001–55 000 R6 840 + 26 per cent of the
amount above R38 000
45 001–60 000 R8 900 + 32 per cent of the amount above R45 000 55 001–80 000 R11 260 + 32 per cent of the
amount above R55 000
60 001–70 000 R13 700 + 37 per cent of the amount above R60 000 80 001–100 000 R19 260 + 37 per cent of the
amount above R80 000
70 001–200 000 R17 400 + 40 per cent of the amount above R70 000 100 001–215 000 R26 660 + 40 per cent of the
amount above R100 000
200 001 and above R69 400 + 42 per cent of the amount above R200 000 215 001 and above R72 660 + 42 per cent of the
amount above R215 000
Rebates Rebates
Primary R3 800 Primary R4 140
Secondary R2 900 Secondary R3 000
Tax threshold Tax threshold
Below age 65 R21 111 Below age 65 R23 000
Age 65 and over R36 538 Age 65 and over R39 154
Annexure X Budget Review 2002
2001/02 2002/03
Taxable income(R per annum) Rates of tax Taxable income
(R per annum) Rates of tax
1–38 000 18 per cent of each R1 1–40 000 18 per cent of each R1
38 001–55 000 R6 840 + 26 per cent of the amount above R38 000 40 001–80 000 R7 200 + 25 per cent of the
amount above R40 000
55 001–80 000 R11 260 + 32 per cent of the amount above R55 000 80 001–110 000 R17 200 + 30 per cent of the
amount above R80 000
80 001–100 000 R19 260 + 37 per cent of the amount above R80 000 110 001–170 000 R26 200 + 35 per cent of the
amount above R110 000
100 001–215 000 R26 660 + 40 per cent of the amount above R100 000 170 001–240 000 R47 200 + 38 per cent of the
amount above R170 000
215 001 and above R72 660 + 42 per cent of the amount above R215 000 240 001 and above R73 800 + 40 per cent of the
amount above R240 000
Rebates Rebates
Primary R4 140 Primary R4 860
Secondary R3 000 Secondary R3 000
Tax threshold Tax threshold
Below age 65 R23 000 Below age 65 R27 000
Age 65 and over R39 154 Age 65 and over R42 640

Tax Chronology: 1979–201572
Annexure Y Budget Review 2003
2002/03 2003/04
Taxable income(R per annum) Rates of tax Taxable income
(R per annum) Rates of tax
1–40 000 18 per cent of each R1 1–70 000 18 per cent of each R1
40 001–80 000 R7 200 + 25 per cent of the amount above R40 000 70 001–110 000 R12 600 + 25 per cent of the
amount above R70 000
80 001–110 000 R17 200 + 30 per cent of the amount above R80 000 110 001–140 000 R22 600 + 30 per cent of the
amount above R110 000
110 001–170 000 R26 200 + 35 per cent of the amount above R110 000 140 001–180 000 R31 600 + 35 per cent of the
amount above R140 000
170 001–240 000 R47 200 + 38 per cent of the amount above R170 000 180 001–255 000 R45 600 + 38 per cent of the
amount above R180 000
240 001 and above R73 800 + 40 per cent of the amount above R240 000 255 001 and above R74 100 + 40 per cent of the
amount above R255 000
Rebates Rebates
Primary R4 860 Primary R5 400
Secondary R3 000 Secondary R3 100
Tax threshold Tax threshold
Below age 65 R27 000 Below age 65 R30 000
Age 65 and over R42 640 Age 65 and over R47 222
Annexure Z Budget Review 2004
2003/04 2004/05
Taxable income(R per annum) Rates of tax Taxable income
(R per annum) Rates of tax
1–70 000 18 per cent of each R1 1–74 000 18 per cent of each R1
70 001–110 000 R12 600 + 25 per cent of the amount above R70 000 74 001–115 000 R13 320 + 25 per cent of the
amount above R74 000
110 001–140 000 R22 600 + 30 per cent of the amount above R110 000 115 001–155 000 R23 570 + 30 per cent of the
amount above R115 000
140 001–180 000 R31 600 + 35 per cent of the amount above R140 000 155 001–195 000 R35 570 + 35 per cent of the
amount above R155 000
180 001–255 000 R45 600 + 38 per cent of the amount above R180 000 195 001–270 000 R49 570 + 38 per cent of the
amount above R195 000
255 001 and above R74 100 + 40 per cent of the amount above R255 000 270 001 and above R78 070 + 40 per cent of the
amount above R270 000
Rebates Rebates
Primary R5 400 Primary R5 800
Secondary R3 100 Secondary R3 200
Tax threshold Tax threshold
Below age 65 R30 000 Below age 65 R32 222
Age 65 and over R47 222 Age 65 and over R50 000
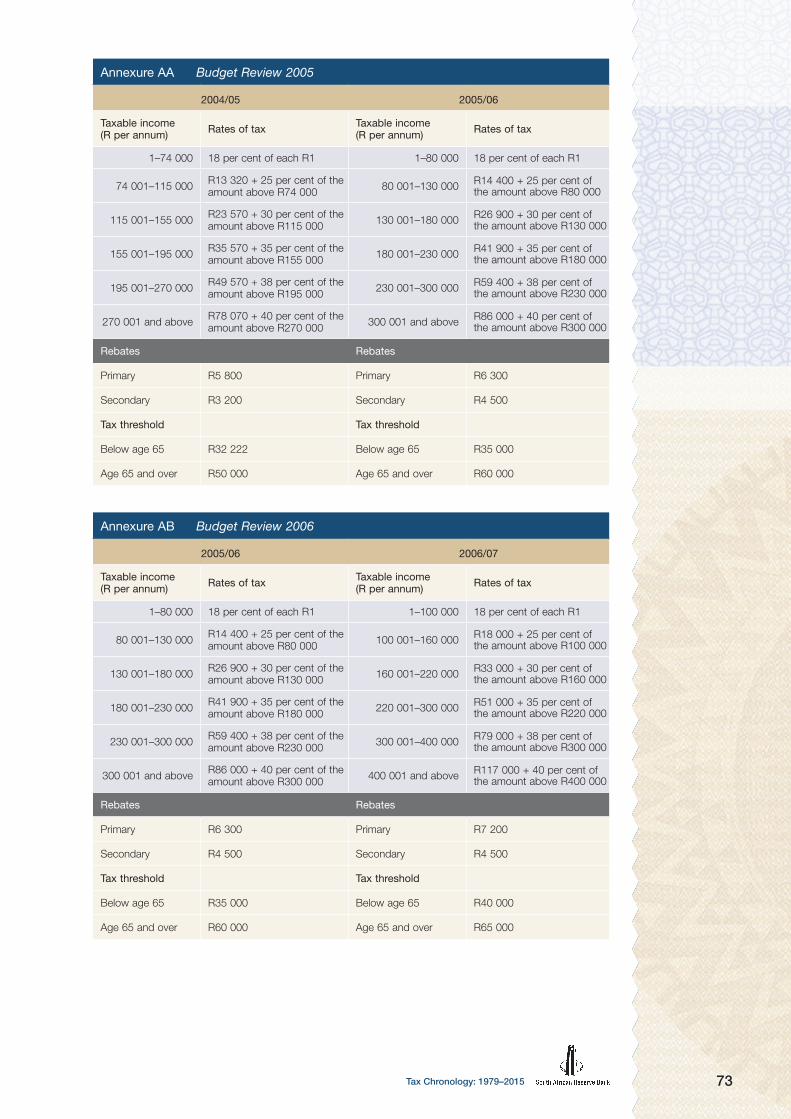
73Tax Chronology: 1979–2015
Annexure AA Budget Review 2005
2004/05 2005/06
Taxable income(R per annum) Rates of tax Taxable income
(R per annum) Rates of tax
1–74 000 18 per cent of each R1 1–80 000 18 per cent of each R1
74 001–115 000 R13 320 + 25 per cent of the amount above R74 000 80 001–130 000 R14 400 + 25 per cent of
the amount above R80 000
115 001–155 000 R23 570 + 30 per cent of the amount above R115 000 130 001–180 000 R26 900 + 30 per cent of
the amount above R130 000
155 001–195 000 R35 570 + 35 per cent of the amount above R155 000 180 001–230 000 R41 900 + 35 per cent of
the amount above R180 000
195 001–270 000 R49 570 + 38 per cent of the amount above R195 000 230 001–300 000 R59 400 + 38 per cent of
the amount above R230 000
270 001 and above R78 070 + 40 per cent of the amount above R270 000 300 001 and above R86 000 + 40 per cent of
the amount above R300 000
Rebates Rebates
Primary R5 800 Primary R6 300
Secondary R3 200 Secondary R4 500
Tax threshold Tax threshold
Below age 65 R32 222 Below age 65 R35 000
Age 65 and over R50 000 Age 65 and over R60 000
Annexure AB Budget Review 2006
2005/06 2006/07
Taxable income(R per annum) Rates of tax Taxable income
(R per annum) Rates of tax
1–80 000 18 per cent of each R1 1–100 000 18 per cent of each R1
80 001–130 000 R14 400 + 25 per cent of the amount above R80 000 100 001–160 000 R18 000 + 25 per cent of
the amount above R100 000
130 001–180 000 R26 900 + 30 per cent of the amount above R130 000 160 001–220 000 R33 000 + 30 per cent of
the amount above R160 000
180 001–230 000 R41 900 + 35 per cent of the amount above R180 000 220 001–300 000 R51 000 + 35 per cent of
the amount above R220 000
230 001–300 000 R59 400 + 38 per cent of the amount above R230 000 300 001–400 000 R79 000 + 38 per cent of
the amount above R300 000
300 001 and above R86 000 + 40 per cent of the amount above R300 000 400 001 and above R117 000 + 40 per cent of
the amount above R400 000
Rebates Rebates
Primary R6 300 Primary R7 200
Secondary R4 500 Secondary R4 500
Tax threshold Tax threshold
Below age 65 R35 000 Below age 65 R40 000
Age 65 and over R60 000 Age 65 and over R65 000

Tax Chronology: 1979–201574
Annexure AC Budget Review 2007
2006/07 2007/08
Taxable income(R per annum) Rates of tax Taxable income
(R per annum) Rates of tax
1–100 000 18 per cent of each R1 1–112 500 18 per cent of each R1
100 001–160 000 R18 000 + 25 per cent of the amount above R100 000 112 501–180 000 R20 250 + 25 per cent of the
amount above R112 500
160 001–220 000 R33 000 + 30 per cent of the amount above R160 000 180 001–250 000 R37 125 + 30 per cent of the
amount above R180 000
220 001–300 000 R51 000 + 35 per cent of the amount above R220 000 250 001–350 000 R58 125 + 35 per cent of the
amount above R250 000
300 001–400 000 R79 000 + 38 per cent of the amount above R300 000 350 001–450 000 R93 125 + 38 per cent of the
amount above R350 000
400 001 and above R117 000 + 40 per cent of the amount above R400 000 450 001 and above R131 125 + 40 per cent of the
amount above R450 000
Rebates Rebates
Primary R7 200 Primary R7 740
Secondary R4 500 Secondary R4 680
Tax threshold Tax threshold
Below age 65 R40 000 Below age 65 R43 000
Age 65 and over R65 000 Age 65 and over R69 000
Annexure AD Budget Review 2008
2007/08 2008/09
Taxable income(R per annum) Rates of tax Taxable income
(R per annum) Rates of tax
1–112 500 18 per cent of each R1 1–122 000 18 per cent of each R1
112 501–180 000 R20 250 + 25 per cent of the amount above R112 500 122 001–195 000 R21 960 + 25 per cent of the
amount above R122 000
180 001–250 000 R37 125 + 30 per cent of the amount above R180 000 195 001–270 000 R40 210 + 30 per cent of the
amount above R195 000
250 001–350 000 R58 125 + 35 per cent of the amount above R250 000 270 001–380 000 R62 710 + 35 per cent of the
amount above R270 000
350 001–450 000 R93 125 + 38 per cent of the amount above R350 000 380 001–490 000 R101 210 + 38 per cent of
the amount above R380 000
450 001 and above R131 125 + 40 per cent of the amount above R450 000 490 001 and above R143 010 + 40 per cent of
the amount above R490 000
Rebates Rebates
Primary R7 740 Primary R8 280
Secondary R4 680 Secondary R5 040
Tax threshold Tax threshold
Below age 65 R43 000 Below age 65 R46 000
Age 65 and over R69 000 Age 65 and over R74 000

75Tax Chronology: 1979–2015
Annexure AE Budget Review 2009
2008/09 2009/10
Taxable income(R per annum) Rates of tax Taxable income
(R per annum) Rates of tax
1–122 000 18 per cent of each R1 1–132 000 18 per cent of each R1
122 001–195 000 R21 960 + 25 per cent of the amount above R122 000 132 001–210 000 R23 760 + 25 per cent of the
amount above R132 000
195 001–270 000 R40 210 + 30 per cent of the amount above R195 000 210 001–290 000 R43 260 + 30 per cent of the
amount above R210 000
270 001–380 000 R62 710 + 35 per cent of the amount above R270 000 290 001–410 000 R67 260 + 35 per cent of the
amount above R290 000
380 001–490 000 R101 210 + 38 per cent of the amount above R380 000 410 001–525 000 R109 260 + 38 per cent of
the amount above R410 000
490 001 and above R143 010 + 40 per cent of the amount above R490 000 525 001 and above R152 960 + 40 per cent of
the amount above R525 000
Rebates Rebates
Primary R8 280 Primary R9 756
Secondary R5 040 Secondary R5 400
Tax threshold Tax threshold
Below age 65 R46 000 Below age 65 R54 200
Age 65 and over R74 000 Age 65 and over R84 200
Annexure AF Budget Review 2010
2009/10 2010/11
Taxable income(R per annum) Rates of tax Taxable income
(R per annum) Rates of tax
1–132 000 18 per cent of each R1 1–140 000 18 per cent of each R1
132 001–210 000 R23 760 + 25 per cent of the amount above R132 000 140 001–221 000 R25 200 + 25 per cent of the
amount above R140 000
210 001–290 000 R43 260 + 30 per cent of the amount above R210 000 221 001–305 000 R45 450 + 30 per cent of the
amount above R221 000
290 001–410 000 R67 260 + 35 per cent of the amount above R290 000 305 001–431 000 R70 650 + 35 per cent of the
amount above R305 000
410 001–525 000 R109 260 + 38 per cent of the amount above R410 000 431 001–552 000 R114 750 + 38 per cent of
the amount above R431 000
525 001 and above R152 960 + 40 per cent of the amount above R525 000 552 001 and above R160 730 + 40 per cent of
the amount above R552 000
Rebates Rebates
Primary R9 756 Primary R10 260
Secondary R5 400 Secondary R 5 675
Tax threshold Tax threshold
Below age 65 R54 200 Below age 65 R57 000
Age 65 and over R84 200 Age 65 and over R88 528

Tax Chronology: 1979–201576
Annexure AG Budget Review 2011
2010/11 2011/12
Taxable income(R per annum) Rates of tax Taxable income
(R per annum) Rates of tax
1–140 000 18 per cent of each R1 1–150 000 18 per cent of each R1
140 001–221 000 R25 200 + 25 per cent of the amount above R140 000 150 001–235 000 R27 000 + 25 per cent of the
amount above R150 000
221 001–305 000 R45 450 + 30 per cent of the amount above R221 000 235 001–325 000 R48 250 + 30 per cent of the
amount above R235 000
305 001–431 000 R70 650 + 35 per cent of the amount above R305 000 325 001–455 000 R75 250 + 35 per cent of the
amount above R325 000
431 001–552 000 R114 750 + 38 per cent of the amount above R431 000 455 001–580 000 R120 750 + 38 per cent of the
amount above R455 000
552 001 and above R160 730 + 40 per cent of the amount above R552 000 580 001 and above R168 250 + 40 per cent of the
amount above R580 000
Rebates Rebates
Primary R10 260 Primary R10 755
Secondary R5 675 Secondary R6 012
Tertiary R2 000
Tax threshold Tax threshold
Below age 65 R57 000 Below age 65 R59 750
Age 65 and over R88 528 Age 65 and over R93 150
Age 75 and over R104 261
Annexure AH Budget Review 2012
2011/12 2012/13
Taxable income(R per annum) Rates of tax Taxable income
(R per annum) Rates of tax
1–150 000 18 per cent of each R1 1–160 000 18 per cent of each R1
150 001–235 000 R27 000 + 25 per cent of the amount above R150 000 160 001–250 000 R28 800 + 25 per cent of the
amount above R160 000
235 001–325 000 R48 250 + 30per cent of the amount above R235 000 250 001–346 000 R51 300 + 30 per cent of the
amount above R200 000
325 001–455 000 R75 250 + 35 per cent of the amount above R325 000 346 001–484 000 R80 100 + 35 per cent of the
amount above R346 000
455 001–580 000 R120 750 + 38 per cent of the amount above R455 000 484 001–617 000 R128 400 + 38 per cent of the
amount above R484 000
580 001 and above R168 250 + 40 per cent of the amount above R580 000 617 001 and above R178 940 + 40 per cent of the
amount above R617 000
Rebates Rebates
Primary R10 755 Primary R11 440
Secondary R6 012 Secondary R6 390
Tertiary R2 000 Tertiary R2 130
Tax threshold Tax threshold
Below age 65 R59 750 Below age 65 R63 556
Age 65 and over R93 150 Age 65 and over R99 056
Age 75 and over R104 261 Age 75 and over R110 889

77Tax Chronology: 1979–2015
Annexure AI Budget Review 2013
2012/13 2013/14
Taxable income(R per annum) Rates of tax Taxable income
(R per annum) Rates of tax
1–160 000 18 per cent of each R1 1–165 600 18 per cent of each R1
160 001–250 000 R28 800 + 25 per cent of the amount above R160 000 165 601–258 750 R29 808 + 25 per cent of
the amount above R165 600
250 001–346 000 R51 300 + 30 per cent of the amount above R230 000 258 751–358 110 R53 096 + 30 per cent of
the amount above R258 750
346 001–484 000 R80 100 + 35 per cent of the amount above R346 000 358 111–500 940 R82 904 + 35 per cent of
the amount above R358 110
484 001–617 000 R128 400 + 38 per cent of the amount above R484 000 500 941–638 600 R132 894 + 38 per cent of
the amount above R500 940
617 001 and above R178 940 + 40 per cent of the amount above R617 000 638 601 and above R185 205 + 40 per cent of
the amount above R638 600
Rebates Rebates
Primary R11 440 Primary R12 080
Secondary R 6 930 Secondary R 6 750
Tertiary R 2 130 Tertiary R 2 250
Tax threshold Tax threshold
Below age 65 R63 556 Below age 65 R67 111
Age 65 and over R99 056 Age 65 and over R104 611
Age 75 and over R110 889 Age 75 and over R117 111
Annexure AJ Budget Review 2014
2013/14 2014/15
Taxable income(R per annum) Rates of tax Taxable income
(R per annum) Rates of tax
1–165 600 18 per cent of each R1 1–174 550 18 per cent of each R1
165 601–258 750 R29 808 + 25 per cent of the amount above R165 600 174 551–272 700 R31 419 + 25 per cent of
the amount above R174 550
258 751–358 110 R53 096 + 30 per cent of the amount above R258 750 272 701–377 450 R55 957 + 30 per cent of
the amount above R272 700
358 111–500 940 R82 904 + 35 per cent of the amount above R358 110 377 451–528 000 R87 382 + 35 per cent of
the amount above R377 450
500 941–638 600 R132 894 + 38 per cent of the amount above R500 940 528 001–673 100 R140 074 + 38 per cent of
the amount above R528 000
638 601 and above R185 204 + 40 per cent of the amount above R638 600 673 101 and above R195 212 + 40 per cent of
the amount above R673 100
Rebates Rebates
Primary R12 080 Primary R12 726
Secondary R 6 750 Secondary R 7 110
Tertiary R 2 250 Tertiary R 2 367
Tax threshold Tax threshold
Below age 65 R67 111 Below age 65 R70 700
Age 65 and over R104 611 Age 65 and over R110 200
Age 75 and over R117 111 Age 75 and over R123 350

Tax Chronology: 1979–201578
Annexure AK Taxable income level in 2015/16 price terms in which maximum marginal rate kicks in (R per annum)
R millions
Fiscal year* All Married Single
Married women All Married Single
Married women
Nominal Real
1980 … 22 000 22 000 … … 527 273 527 273 …
1981 … 40 001 40 001 … … 837 566 837 566 …
1982 … 40 001 40 001 … … 729 578 729 578 …
1983 … 40 001 40 001 … … 637 379 637 379 …
1984 … 40 001 40 001 … … 572 147 572 147 …
1985 … 40 001 40 001 … … 507 117 507 117 …
1986 … 60 000 42 000 … … 648 649 454 054 …
1987 … 60 000 42 000 … … 549 763 384 834 …
1988 … 60 000 42 000 … … 476 386 333 470 …
1989 … 80 000 54 000 … … 563 107 380 097 …
1990 … 80 000 54 000 40 000 … 489 193 330 206 244 597
1991 … 80 000 56 000 40 000 … 428 637 300 046 214 319
1992 … 80 000 56 000 40 000 … 370 459 259 321 185 230
1993 … 80 000 56 000 50 000 … 330 014 231 010 206 259
1994 … 80 000 56 000 50 000 … 300 615 210 431 187 885
1995 … 80 000 56 000 50 000 … 275 780 193 046 172 363
1996 80 000 … … … 255 788 … … …
1997 100 000 … … … 295 617 … … …
1998 100 000 … … … 274 882 … … …
1999 120 000 … … … 306 540 … … …
2000 120 000 … … … 295 291 … … …
2001 200 001 … … … 462 154 … … …
2002 215 001 … … … 471 904 … … …
2003 240 001 … … … 477 123 … … …
2004 255 001 … … … 490 549 … … …
2005 270 001 … … … 509 270 … … …
2006 300 001 … … … 546 055 … … …
2007 400 001 … … … 692 229 … … …
2008 450 001 … … … 720 498 … … …
2009 490 001 … … … 703 815 … … …
2010 525 001 … … … 710 454 … … …
2011 552 001 … … … 719 543 … … …
2012 580 001 … … … 716 127 … … …
2013 617 001 … … … 721 711 … … …
2014 638 601 … … … 706 040 … … …
2015 673 101 … … … 704 627 … … …
2016 701 301 … … … 701 301 … … …
* Ending 31 March of each fiscal year
… not available