tao, s., eglinton, t. i., zhang, l., yi, z., montluçon, d
TRANSCRIPT

Tao, S., Eglinton, T. I., Zhang, L., Yi, Z., Montluçon, D. B., McIntyre,
C. , Yu, M. and Zhao, M. (2018) Temporal variability in composition and
fluxes of Yellow River particulate organic matter. Limnology and
Oceanography, 63(S1), S119-S141.
There may be differences between this version and the published version.
You are advised to consult the publisher’s version if you wish to cite from
it.
Tao, S., Eglinton, T. I., Zhang, L., Yi, Z., Montluçon, D. B., McIntyre,
C. , Yu, M. and Zhao, M. (2018) Temporal variability in composition and
fluxes of Yellow River particulate organic matter. Limnology and
Oceanography, 63(S1), S119-S141. (doi:10.1002/lno.10727)
This article may be used for non-commercial purposes in accordance with
Wiley Terms and Conditions for Self-Archiving.
http://eprints.gla.ac.uk/149990/
Deposited on: 18 October 2017
Enlighten – Research publications by members of the University of Glasgow
http://eprints.gla.ac.uk

1
Temporal variability in composition and fluxes of Yellow River particulate organic 1
matter 2
Shuqin Tao,1,2,3 Timothy I. Eglinton,3,* Liang Zhang,4 Zhiwei Yi,2 Daniel B. Montluçon,3 3
Cameron McIntyre,3,5† Meng Yu,1,3 Meixun Zhao1,* 4
1 Key Laboratory of Marine Chemistry Theory and Technology (Ocean University of 5
China), Ministry of Education/Laboratory for Marine Ecology and Environmental Science, 6
Qingdao National Laboratory for Marine Science and Technology, Qingdao 266071, China 7
2 Third Institute of Oceanography, SOA, Xiamen 361005, China 8
3 Geological Institute, Department of Earth Sciences, ETH Zürich, 8092 Zürich, 9
Switzerland 10
4 State Oceanographic Administration, Xiamen marine environmental monitoring center 11
station, Xiamen 361008, China 12
5 Laboratory for Ion Beam Physics, Department of Physics, ETH Zürich, 8093 Zürich, 13
Switzerland 14
† Present address: Scottish Universities Environmental Research Centre (SUERC), 15
G750QF, Glasgow, UK 16
* Corresponding authors: 17
Timothy I. Eglinton, E-mail: [email protected], Tel.: +41 44 6339291, Fax: 18
+41 44 6331296 19
Meixun Zhao, E-mail: [email protected], Tel.: +86 532 66782103, Fax: +86 532 20
66782103 21
22
2
Abstract 23
This study examines temporal variations of the abundance and carbon isotopic 24
characteristics of particulate organic carbon (POC) and specific-source compounds in the 25
context of hydrological variability in the Yellow River. The content and bulk carbon isotopic 26
characteristics (13C and 14C) of POC were relatively uniform over the hydrologic (seasonal) 27
cycle. We attribute these temporally invariant geochemical characteristics to the dominant 28
contribution of loess material to the suspended particulate matter (SPM). In contrast, 29
molecular-level signals revealed that hydrologic conditions exert a significant influence on 30
the proportional contributions of petrogenic and especially fresh plant-derived OC, while 31
pre-aged soil OC is mobilized via deeper erosion processes (e.g., gully erosion, mudslides) 32
and is independent of hydrodynamics and surface runoff. A coupled biomarker-isotope 33
mixing model was applied to estimate the time-varying supply of contemporary/modern 34
biomass, pre-aged soil, and fossil OC components to Chinese marginal seas from the 35
Yellow River. We found that natural (e.g., precipitation) and human-induced (e.g., water and 36
sediment regulation) variations in hydrological regime strongly influence the flux with the 37
magnitude of the corresponding annual fluxes of POC ranging between 0.343±0.122 to 38
0.581±0.213 Mt/yr, but less strongly infleunce proportions of the different OC constituents. 39
Inter-annual differences in pre-aged soil and fossil OC fluxes imply that extreme climate 40
events (e.g., floods) modulate the exhumation and export of old carbon to the ocean, but the 41
OC homogeneity in the pre-aged mineral soil-dominated watersheds facilitates robust 42
predictions in terms of OC transport dynamics in the past (sediment cores) and in the 43
future. 44
Keyword: The Yellow River, compound-specific carbon isotopes (14C and 13C), 45

3
contemporary OC, pre-aged soil OC, fossil OC, temporal variability 46
47
The residence time of biospheric OC in terrestrial reservoirs such as soils can play an 48
important role in buffering variations in atmospheric carbon dioxide concentrations. 49
Erosion, transport and burial of terrestrial OC in continental margin sediments can also 50
result in a long-term carbon sink. Rivers connect terrestrial and marine reservoirs, exporting 51
~ 0.45 Pg C yr ̶ 1 (Pg = 1 ´ 1015 g) of organic carbon and ~ 0.26 Pg C yr ̶ 1 of inorganic 52
carbon to the ocean from various terrestrial sources including plants, soils and weathered 53
rocks (Cole et al. 2007). This corresponds to ~25% of the terrestrial sink for anthropogenic 54
CO2 emissions (2.8 Pg C/yr; Battin et al., 2009), and thus represents a significant 55
component of both regional and global carbon cycles. Although spatially localized, over 56
prolonged time the net OC fluxes in aquatic systems tend to be greater per unit area than in 57
much of the surrounding land (Cole et al. 2007 and references therein). 58
POC in river networks is supplied via diverse processes that operate on a range of 59
timescales. In addition of autochthonous production within fluvial systems, relatively fresh 60
(young) terrestrial POC may be mobilized from the land via surface run-off, while of aged 61
OC in deeper mineral soils is remobilized largely through collapse of riverbanks or and 62
erosion of surrounding soils, contributing POC depleted in 14C content to the river 63
(Raymond and Bauer 2001; Blair and Aller 2012; Feng et al. 2013b; Vonk et al. 2014). 64
Riverine POC can be thus considered as a combination of freshly-produced and pre-aged 65
biospheric organic matter augmented by ancient petrogenic OC eroding from bedrock 66
within the drainage basin. The majority of recently-synthesized biospheric OC, such as 67

4
plant detritus is rapidly recycled to the atmosphere as CO2 during fluvial transport 68
(Mayorga et al. 2005; Ward et al. 2013). In contrast, mineral-bound soil and petrogenic OC 69
may be more efficiently exported and buried in coastal environments (Aller et al. 2008; Tao 70
et al. 2016). The balance between remineralization and sequestration of these different 71
components is of importance in determining whether fluvial transport serves as a long-term 72
carbon sink or a source of atmospheric CO2 (Berner 1982; Aller and Blair 2004; Bianchi 73
2011). Thus, improved understanding of the composition of riverine OC, as well as the 74
magnitude and timescales of fluvial export, are necessary to develop robust constraints on 75
the terrestrial OC cycle and its links to OC burial in marine environments. 76
Molecular tools, particularly when coupled with isotopic information, can be used to 77
trace sources and processes acting upon OC in the environment. Although source-specific 78
biomarker compounds are generally trace constituents of POC, their isotopic signatures 79
reflect and are representative of the corresponding carbon source. In particular, the 14C 80
content of biomass will reflect its biological source independent of its metabolism (e.g, 81
autotroph vs. heterotroph), and irrespective of the specific class of biochemical (e.g., lipid, 82
polysaccharide, protein, lignin). Thus, by measuring the 14C content of a source-specific 83
lipid biomarker (e.g., higher plant wax fatty acid) we can gain insights into the isotopic 84
characteristics of the overall OC derived from this source, and hence can assess its 85
contribution to a bulk OC signal. The situation is similar for stable carbon isotopes, 86
although biosynthetic fractionation effects that impart different isotope compositions to 87
different cellular components must also be considered (Schouten et al. 1998; Wiesenberg et 88
al. 2004). Source apportionment approaches involving coupled 13C and 14C measurements on 89
both bulk OC and specific biomarkers have been applied in prior studies (Drenzek et al. 2007; 90

5
Drenzek et al. 2009; Feng et al. 2013a; Tao et al. 2015; Tao et al. 2016), and while subject to 91
improvement and refinement, these approaches offer a means to resolve multiple 92
contributions to riverine POC. 93
Besides, POC sources and transport processes within fluvial systems likely vary both 94
spatially and temporally, being influenced by changes in both the provenance of exported 95
materials and hydrological conditions (e.g., Voss et al., 2015). Moreover, superimposed on 96
natural variability, are changing dynamics in OC export brought about by on-going 97
anthropogenic climate change and perturbations to watersheds and river networks. The 98
latter may result in return of now-dormant OC, held in deep soils or bedrock, to the active 99
carbon cycle. Determining of the nature and magnitude of OC, as well as putative 100
remineralization to CO2 during or subsequent to transport to the ocean represents an 101
important question for assessment of carbon-climate couplings (Tarnocai et al. 2009; Galy 102
and Eglinton 2011). Molecular-level biomarker [isotope] approaches are particularly 103
powerful as they distinguish 'pre-aged' and 'fossil' sourced OC signatures and enable OC 104
derived from these pools to be traced into fluvial and marine systems where they become 105
admixed with organic matter from other sources (Drenzek et al. 2007; Galy and Eglinton 106
2011; Gustafsson et al. 2011; Feng et al. 2013a). At present, however, while there is 107
growing information on the 13C and 14C isotopic compositions of terrestrial biomarker 108
compounds exported from different river systems, there is a paucity of information 109
regarding how vary on seasonal or inter-annual timescales (Drenzek et al. 2009; Martin et 110
al. 2013). Thus, long-term measurements (≥ 1 year) are important for understanding how 111
terrestrial-ocean carbon transfer by rivers will be impacted by climate and anthropogenic 112
change. 113

6
In this study, we applied a coupled biomarker-isotope approach to investigate 114
time-varying fluxes and sources of OC transported by the Yellow River (Huanghe). A 115
previous study focused on establishing a three end-member mixing model in order to 116
apportion Yellow River suspended POC into three components based on bulk OC and 117
molecular carbon isotopic characteristics (Tao et al. 2015). This study, based on dual 118
carbon isotopic mass balance, concluded that pre-aged (ave. 1770 years 14C age) soil OC 119
(53±12%) and fossil (ave. 24590 years 14C age) OC (31±2%) dominated the annual POC 120
load. The large flux of pre-aged and fossil OC carries important implications for our 121
understanding of OC cycling associated with erosion and carbon export from this globally 122
significant fluvial system to the adjacent marginal sea. Temporal variability in the limited 123
dataset acquired, as this prior study was only examined in the context of uncertainty in 124
end-member compositions, and did not permit in-depth assessment of the degree and nature 125
of temporal variability inherent within the river system. The Yellow River exhibits 126
pronounced inter- and intra-annual variations in sediment and water flux in response to both 127
natural (e.g., East Asian monsoon) and anthropogenic factors (e,g,, dam construction and 128
river flow regulation) (Milliman et al. 1987; Wang et al. 2006; Peng et al. 2010), the impacts 129
of the latter being particularly pronounced over the past 100 years. Comprehensive 130
investigation of anthropogenic influences is thus a prerequisite for understanding current 131
and predicting future OC dynamics of the Yellow River. Building on our prior investigation 132
(Tao et al. 2015), this paper focuses on temporal variations of abundance and carbon 133
isotopic characteristics of bulk OC and specific biomarker compounds in the context of 134
hydrological variability in the river. Using an extended time-series sample set collected 135

7
quasi bi-monthly (June 2011 - July 2013) from the main channel near the outlet of the river, 136
we assess how the proportions and fluxes of different OC source components changes on a 137
seasonal and inter-annual basis. 138
139
Study areas and methods 140
Study area 141
The Yellow River, originating on the Qinghai-Tibet Plateau at an elevation of 4500 m, is 142
the world's fifth longest river, running 5464 km from its source to the Bohai Sea and 143
encompassing a drainage area of 75.2×10⁴ km2 (Fig. 1). The Yellow River basin spans the 144
entire semi-arid and arid region of northern China (Xu et al. 2006), and encompasses diverse 145
geological, geomorphic and ecological gradients from the Tibet Plateau in the upper drainage 146
basin, through the Mu Us desert and the Loess Plateau in the middle basin, to the extensive 147
floodplain of the lower basin (Zhang et al. 1995; Hu et al. 2012a). Precipitation is influenced 148
by the East Asian monsoon and exhibits strong seasonal variability (An 2000). Frequent 149
heavy storms during the wet season (June–September) can account for 50% of annual total 150
precipitation (Wang et al. 2006), forming a distinct summer-autumn natural high flow (NHF) 151
period, whereas intensive ice-melting during the dry season (February–April) can also cause 152
higher runoff in the spring NHF period (Zhang et al. 2013). The monsoon season typically 153
accounts for about 60% and 80% of the annual Yellow River water runoff and TSS export, 154
respectively (Fig. 2; archived data from the Yellow River Water Network; 155
http://www.sdhh.gov.cn/hhsq/). 156
157

8
Experimental methods 158
All samples were collected from the main channel at Kenli, near the Lijing 159
Hydrological Station (ca. 50 km upstream of the river mouth). Near-surface SPM was 160
collected due to the shallowness of the main channel during most months (0.4–2.0 m; ave. 161
∼1.5m, Wang et al., 2012). Water (typically 120 ̶ 200 L) was filtered through pre-combusted, 162
pre-weighed 150 mm diameter GF/F filters (nominal pore size of 0.7 µm, Whatman) to 163
recover enough SPM for the bulk and compound-specific carbon isotope analysis. 164
For bulk POC content, bulk 13C and 14C measurements, small aliquots of freeze-dried, 165
homogenized and acidified SPM were prepared to remove inorganic carbon (Komada et al. 166
2008). For source-specific biomarker measurement, a detailed description of methods for 167
extraction, purification and isolation of target biomarkers (lipids and lignin derived phenols) 168
was provided by Tao et al. (2015). Briefly, about 50–100 g of freeze-dried and homogenized 169
suspended sediment was solvent-extracted, and after saponification (0.5 M KOH in CH3OH) 170
the total lipid extract was chromatographically separated to obtain three classes of target 171
n-alkyl lipid biomarkers including n-fatty acid methyl esters (analyzed as n-FAMEs), 172
n-alkanes and n-alkanols (analyzed as n-alkanol acetates). To check purity and for 173
quantification, a small aliquot of each fraction was analyzed by gas chromatography (GC) 174
and another aliquot (<5%) was kept for stable carbon isotopic analysis. The remaining 175
fractions (n-alkanes, n-alkanol acetates and n-FAMEs) were further purified and isolated by 176
preparative capillary gas chromatography (PCGC) prior to compound-specific 14C analysis 177
(Eglinton et al., 1996) using modified protocols described by Tao et al. (2015). 178
Lignin-derived phenols were released from the solvent-extracted SPM residues by 179
microwave-assisted alkaline CuO oxidation (MARS 5; CEM Corporation) (Goñi and 180
9
Montgomery 2000). The resulting phenolic monomers were isolated using an HPLC-based 181
method developed for compound-specific 14C analysis (Feng et al. 2013a). 182
Stable carbon isotopic compositions of bulk OC and source specific biomarkers 183
obtained from each sample were determined in duplicate by a EA-isotope ratio Mass 184
Spectrometry and GC-isotope ratio Mass Spectrometry, respectively, at ETH-Zürich. 185
Results are reported as δ13C values (δ13CTOC, δ13CCompound) relative to VPDB standard (‰). 186
Their corresponding radiocarbon isotopic compositions were measured on a gas-ion source 187
MICADAS accelerator mass spectrometry (AMS) system at the Laboratory for Ion Beam 188
Physics, ETH Zürich (Ruff et al. 2010; Wacker et al. 2010). All radiocarbon data were 189
expressed as Δ14C (Δ14CTOC, Δ14CCompound) and corresponding radiocarbon age (years before 190
1950 AD). All carbon isotopic compositions of n-FAMEs and n-alkanol acetates were 191
corrected for the contribution of the added methyl (–1000±1‰) and acetyl carbon 192
(–999±1‰), respectively, based on isotopic mass balance in order to derive carbon isotope 193
values and associated errors for underivatized compounds. Analytical uncertainty for 14C 194
analysis of specific compounds isolated with the PCGC was within 40‰ (ave., 12‰) after 195
the error propagation calculation (Hou et al. 2010). 196
197
Monte Carlo calculations 198
This study quantifies temporal variations in relative fractional proportions of three 199
different components (i.e. recently synthesized biomass (fB), pre-aged mineral soil/loess (fS) 200
and 14C-free fossil (fF) OC) in Yellow River suspended POC by applying a three 201
end-member mixing model with two carbon isotopic signals for each end-member (δ13C 202

10
and Δ14C). 203
14 14 14 14POC B B S S F FΔ C Δ C Δ C Δ Cf f fé ù é ù é ù= ´ + ´ + ´ë û ë û ë û (1) 204
13 13 13 13POC B B S S F Fδ C δ C δ C δ Cf f fé ù é ù é ù= ´ + ´ + ´ë û ë û ë û (2) 205
B S F1 f f f= + + (3) 206
We constrain end-member values using δ13C and Δ14C values of source-specific 207
biomarkers in individual SPM samples. Molecular-level δ13C and Δ14C measurements on 208
compounds representing known end-members allows direct assessment of the fractional 209
contribution of the three components to river suspended POC for any specific sample 210
independent of ancillary data. The specific compounds investigated in this study are 211
well-established biomarkers due to their source specificity, relative diagenetic stability, and 212
amenability for extraction and purification from geological matrices such as soils, river 213
suspended particles and marine sediments (Eglinton and Hamilton 1967; Freeman and 214
Colarusso 2001; Zhao et al. 2006; Galy et al. 2011). One important and inherent limitation 215
in the approach stems from the unknown and potentially variable fractionation effects 216
imparted on stable carbon isotope compositions to different cellular components. 217
Differences in δ13C between lipid biomarkers and bulk OM resulting from isotopic 218
fractionation during biosynthesis, diagenesis or thermal alteration (δ13Cbulk – δ13Clipid) need 219
to be taken in account. This is especially the case for lipids, which tend to be significantly 220
depleted in 13C (5~10‰ for algae and 7~10‰ for vascular plants; 1~7‰ for petrogenic 221
materials; Tao et al., 2015 and references therein). Since we presently have no data on 222
δ13Cbulk – δ13Clipid offsets of typical source materials within and surrounding the Yellow 223
River drainage basin, a moderate offset of 5 to 7‰ is applied to the measured δ13C values 224
11
for each of the biomarker class used here to approximate lipid-bulk OC differences. 225
We have applied a random sampling (Monte Carlo, MC) computer simulation strategy 226
to incorporate the effect of a potential spread in end-member values on the quantitative 227
source apportionment. The MC simulations were based on the assumption that the 228
end-member values (Δ14CB, Δ14CS, Δ14CF, δ13CB, δ13CS and δ13CF) could be represented by a 229
normal distribution, where the mean and standard deviation are estimated from measured 230
source-specific lipid compound isotopic compositions and their measurement uncertainty. 231
The calculations were performed using random sampling from these normal distributions, 232
while simultaneously fulfilling Eqs. (1) to (3) and constraining the solutions to be between 233
1 and 0 (i.e., fractional contributions). By repeating the random sampling (4,000,000 times) 234
and sorting the results in histograms (256 bins), distributions (as probability density 235
functions) of the fractions fB, fS and fF were obtained (Fig. S4a ̶ S4d). These distributions 236
were used to calculate the mean and the standard deviation as summarized in Figure 7a and 237
Table S1. Details regarding end-member ranges are provided in the Discussion section. The 238
MC calculations were performed in Python (Jupyter Network). 239
240
Hierarchical Cluster Analysis 241
In this study, the content and stable carbon isotopes of multiple compounds were 242
determined. In order to avoid repetitive discussion, Hierarchical Cluster Analysis was used 243
to classify various compounds into groups according to similarity of molecular 244
characteristics (content and d13CCompound values), and the Pearson correlation coefficient (R) 245
measures the similarities between variables. The concentration matrix is standardized using 246

12
the Z-score as follows: 247
-= ij i
iji
X XZ
s 248
Where Xij is the concentration of the i-homolog on the j-sample, and Xi and σi are the 249
mean and standard deviation of the i-homolog, respectively. For this application, the TOC 250
normalized content and δ13CCompound matrixes (X(n × m)) with n-rows (the number of 251
homologs) and m-columns (the number of samples analyzed) was constructed. The Pearson 252
correlation coefficient (R) was used as a measure of the similarities between variables. The 253
number and the structure of clusters formed using these methods are not affected with 254
either the addition of small numbers of “bad” points or the use of a limited number of 255
measurements. 256
257
Results 258
Hydrological characteristics (discharge and TSS) 259
Water discharge (m3/s) and TSS (kg/m3) were monitored on daily to monthly 260
frequencies by the Yellow River Conservancy Commission (YRCC) (Fig. 2). The 261
hydrological dataset was collected from the nearest hydrometric station (Lijin) to the 262
sampling site (Shengli floating bridge, Kenli) and from Tongguan hydrometric station, 263
which is located near the boundary of the middle and lower reaches (Fig. 1). Only limited 264
daily TSS data are available. Water discharge and TSS exhibit large seasonal variations; the 265
middle reach and lower reach showed broadly similar seasonal patterns but slightly different 266
inter-annual patterns (Fig. 2). The highest water discharge at Tongguan occurred usually in 267
September with a second smaller peak in March, while the lowest discharge occurred in May 268

13
or December–January just before the onset of summer-autumn and spring NHF periods. The 269
maximum in TSS concentrations coincided with the timing of several NHF events over the 270
middle reach or on the whole drainage basin scale in the wet season (e.g., August–September 271
2011, July–early September 2012). In addition to this peak, water discharge and TSS at Lijin 272
shows a distinct second maximum in June–July, which is due to man-made release of turbid 273
floodwaters from the Sanmenxia and Xiaolangdi reservoir cascades located in the front of 274
lower reach (Fig. 1). This period of water and sediment regulation (WSR), carried out by the 275
YRCC, usually takes place from mid-June to mid-July and is designed to induce artificial 276
hyperpycnal flow in order to de-silt the whole lower reach below the Xiaolangdi reservoir. 277
The lowest water discharge was recorded in February–May, and is due to sparse 278
precipitations and extensive irrigation practices in downstream areas. The lowest TSS 279
concentrations were observed in the dry season (November–May), likely as a consequence of 280
weak hydrodynamic conditions and limited surface land or riverbed erosion. Based on the 281
hydrological characteristics, the middle reach of the Yellow River is dominantly influenced 282
by natural processes whereas the lower reach is significantly affected by both natural and 283
man-made processes. Among different years, discharge and TSS in the lower reach during 284
the WSR period (20 June–10 July in every year) are similar, with maxima of ~ 3500–4000 285
m3/s and 12–18 kg/m3, respectively (Fig. 2a and 2b). During the summer-autumn NHF 286
period, discharge and TSS peak intensity and amplitude vary among different years, with 287
stronger maxima in 2012 (Fig. 2), indicating enhanced flow and turbidity events. Over our 288
2-year observation period (June 2011–July 2013), total runoff (282.5´ 108 m3) in 2012 was 289
53% and 98% of that in 2011 and 2013, respectively. The corresponding sediment load (1.83 290

14
´ 108 t) was 19% and 6% higher than those in 2011 and 2013 respectively, due to the heavy 291
and high-frequent storm events in the wet season of 2012 (Yellow River Sediment Bulletin, 292
2011, 2012 and 2013; http://www.yellowriver.gov.cn/nishagonggao/, accessed on 22 293
January 2017). Moreover, the winter season of 2012 (December 2011–February 2012) 294
represented the first time in almost a decade that the lower reach of the Yellow River did not 295
freeze over, resulting in higher than normal flow rates (monthly ave. max. 1160 m3/s in 296
December 2011; Fig. 2c). 297
298
POC characteristics 299
Measurements on twelve SPM samples collected from June 2011 to July 2013 were 300
investigated in order to assess seasonal and inter-annual variations of different organic 301
components transported by the Yellow River. Over the two-year observation period, POC 302
concentrations (mg/L) co-varied strongly (R = 0.98 and 0.84; P < 0.01) with hydrological 303
parameters (TSS and water discharge), with higher POC concentrations (6.97 ̶ 9.41 mg/L) 304
in the summer WSR period (June) and autumn flooding season (September) and lower 305
values (1.56 ̶ 2.86 mg/L) during most other times of the year (Fig. 3a). Despite this 306
variability in concentrations (ave., 4.20±2.79 mg/L), there is no systematic change in POC 307
content normalized to TSS (POC%; 0.26–0.47 wt.%; ave., 0.34±0.07 wt.%) but a slightly 308
higher value was observed in April (Fig. 3b). The time-series dataset also reveals only minor 309
variability in the carbon isotopic composition of POC, with no distinct seasonal variations 310
(Fig. 4 and 5). This isotopic consistency is reflected in both δ13C values (−23.4±0.1 to 311
−24.2±0.1‰; ave., −23.8±0.3‰) and Δ14C values (−397±7 to −447±6‰; ave., −424±18‰). 312

15
313
Molecular abundance characteristics 314
Molecular distributions of three target lipid biomarkers in all twelve SPM samples 315
exhibited similar patterns, with an even-carbon number predominance and maxima centered 316
on n-C16 for n-fatty acids (n-FAs), an even-carbon number predominance and maxima 317
centered on n-C28 for n-alkanols, and an odd-carbon number predominance centered on 318
n-C31 for n-alkanes (Appendix a. Supplementary raw data). Based on the hierarchical 319
cluster analysis of the content and stable carbon isotopes of all even-carbon-numbered 320
n-FAs, n-alkanols and all n-alkanes homologs, the even-chain-length n-FAs were divided 321
into three groups according to similarity of molecular characteristics: (i) short-chain 322
homologs including n-C16 and n-C18 FA, (ii) mid-chain homologs including n-C20, n-C22 323
and n-C24 FA, and (iii) long-chain homologs including n-C26, n-C28 and n-C30 FA 324
(Supplementary Fig. S1a and S2a). n-alkanols reveal two groups: short-chain homologs 325
(n-C18 and n-C20 alkanols), and longer-chain homologs (C ≥ 22 n-alkanols; Supplementary 326
Fig. S1b). All odd-chain n-FAs and n-alkanols were excluded due to lower abundance and 327
ambiguous sources. Among the n-alkanes, four groups were evident comprising of 328
short-chain (incl. n-C17), mid-chain (n-C18–n-C25 alkanes), long-chain even (n-C26, n-C28, 329
n-C30 and n-C32 alkanes), and long-chain odd (n-C27, n-C29, n-C31 and n-C33 alkanes) 330
homologs (Supplementary Fig. S1c and S2b). 331
The concentration of short-chain compounds was uniformly low throughout the year, 332
with the exception of a maximum during the flooding event in September 2011 (13.6, 7.44 333
and 0.10 µg/L for n-C16 FA, n-C18 FA and n-C17 alkane, respectively).For example, n-FAs 334

16
(n-C16, n-C18) and n-alkanes (n-C17) ranged from 1.1 to 13.6 µg/L (avg., 3.1±3.4 µg/L), 0.3 335
to 7.4 µg/L (avg., 1.3±2 µg/L) and 0.01 to 0.10 µg/L (avg., 0.03±0.01 µg/L), respectively 336
(Fig. 3a). In contrast, their TOC-normalized contents varied more significantly, ranging 337
from 269 to 1446 µg/g OC (avg., 739±334 µg/g OC), 68 to 791 µg/g OC (avg., 300±208 µg/g 338
OC) and 3 to 17 µg/g OC (avg., 8±4 µg/g OC), respectively, with higher values during low 339
flow period and the lowest value during the WSR period (Fig. 3b). 340
In contrast to short-chain compounds, the concentration of long-chain plant wax 341
derived lipid compounds co-varied more strongly with daily TSS (R = 0.90 ̶0.96; P < 0.01) 342
and daily water discharge (R = 0.67 ̶ 0.74; P < 0.01). For example, the summed 343
concentration of long-chain even n-FAs (C26+28+30), n-alkanols (C24+26+28) and long-chain 344
odd n-alkanes (C27+29+31) ranged from 0.7 to 5.0 µg/L (ave., 1.8±1.2 µg/L), 0.9 to 5.6 µg/L 345
(ave., 2.2±1.5 µg/L) and 0.6 to 2.3 µg/L (ave., 1.2±0.6 µg/L), with higher values during the 346
high-flow WSR period and the flood events in September 2011, and lower values during 347
those times of year characterized by lower flow (Fig. 3a). However, TOC-normalized 348
contents of long-chain n-FAs (312 to 571 µg/g OC; ave., 442±80 µg/g OC) and n-alkanols 349
(374 to 694 µg/g OC; ave., 539±93 µg/g OC) did not show any relationship with hydrologic 350
parameters, but instead exhibit a distinct seasonal cycle over the two-year observation 351
period. Specifically, higher relative abundances occurred in autumn (September-October) 352
and during the non-WSR period in summer (June), while cold/dry seasons (November-April) 353
and the WSR period were characterized by lower OC-normalized values (Fig. 3b). 354
Long-chain odd n-alkanes (187 to 405 µg/g OC; ave., 316±76 µg/g OC) displayed higher 355
values during low flow-rates (January-April) and the non-WSR period in June, but lower 356
values during the WSR period and autumn (Fig. 3b). 357

17
Concentrations (0.1 to 0.4 µg/L; ave., 0.3±0.1 µg/L) and TOC-normalized contents (24 358
to 153 µg/g OC; ave., 89±48 µg/g OC) of long-chain even-carbon-numbered n-alkanes (i.e., 359
C26, C28, C30) exhibit a pattern of temporal variability that is similar to, but more variable 360
than those of middle-chain even homologs (i.e., C20, C22, C24; 0.05 to 0.2 µg/L; ave., 361
0.1±0.05 µg/L, and 13 to 114 µg/g OC; avg., 37±29 µg/g OC, respectively). Long-chain 362
even-carbon-numbered n-alkane concentrations exhibited no obvious temporal patterns (Fig. 363
3a), but the TOC-normalized content increased from summer (June) to winter (January) and 364
then decreased to a relatively low level by the following summer (Fig. 3b). 365
366
Molecular isotopic characteristics 367
Stable carbon isotope and radiocarbon (δ13C and Δ14C) compositions of n-FAs and 368
n-alkanes in the twelve SPM samples were also determined in this study. For short-chain 369
compounds, δ13C values ranged from –26.3±0.1 to −28.7±0.1‰ (ave., −27.5±0.8‰) and 370
from –26.4±0.1 to −28.4±0.2‰ (ave., –27.6±0.8‰) for δ13C16FA and δ13C18FA, respectively 371
(Fig. 4a). Corresponding Δ14C values (Δ14C16FA and Δ14C18FA) varied from +115±10 to 372
−85±8‰ (ave., −20±54‰) and +44±10 to −84±11‰ (ave.,–21±46‰), respectively (Fig. 373
5). Over the two-year observation period, short-chain n-FA δ13C values decreased from the 374
WSR period to autumn, and then increased to relatively high values by the following 375
summer (Fig. 4a), while Δ14C values displayed an opposite trend, increasing from WSR 376
period to autumn and then gradually decreasing the following summer (Fig. 5). Although 377
short-chain (C17) n-alkane abundances exhibited the same temporal change as short-chain 378
n-FAs, corresponding δ13C values were more variable and generally lower, ranging from 379

18
–29.5±0.1 to –38.0±0.1‰ (ave., –33.3±2.7‰), with the lowest δ13C values in autumn 380
(October 2012) and the summer low-flow period (June 2013), and highest values in winter 381
(January 2013) and during the summer WSR period (Fig. 4a). Δ14C values of n-C17 alkane 382
were not measured due to low abundances (Fig. 3). 383
For long-chain compounds, we investigated temporal variability in 13C and 14C isotopic 384
compositions of plant wax-derived long-chain even-carbon-numbered n-FAs (C26, C28, C30) 385
and n-alkanols (C24, C26, C28), long-chain odd- (C29, C31) and even-carbon-numbered (C26, 386
C28, C30, C32) n-alkanes (Fig. 4b and 5). Over the two-year observation period, 387
abundance-weighted average δ13C26+28+30FAs and Δ14C26+28+30FAs were systematically lower 388
and less variable than corresponding short-chain FAs, ranging from −30.7±0.1 to −31.7±0.1‰ 389
(ave., −31.3±0.3‰) and from −172±11 to −244±7‰ (ave., −208±23‰), respectively (Fig. 390
4b and 5). Abundance-weighted average Δ14C24+26+28alkanols values exhibited a similar 391
temporal pattern with those of Δ14C26+28+30FAs, but with slightly greater variability and less 392
negative values (–143±10 to –243±18‰, ave., –177±32‰; Fig. 5). The δ13C and Δ14C 393
values of long-chain n-alkanes were the lowest and exhibited the widest ranges among the 394
three long-chain biomarker classes. Abundance-weighted average δ13C29+31alkanes of 395
long-chain odd (i.e., C29 and C31) n-alkanes ranged from −28.2±0.1 to −31.6±0.1‰ (ave., 396
−30.0±1.9‰) and those (δ13Ceven alkanes) of even n-alkanes (i.e., C26, C28, C30 and C32) 397
ranged from −27.0±0.1 to −30.1±0.1‰ (ave., −28.8±1.1‰) (Fig. 4b). These values were 398
generally more variable and higher compared to those of long-chain n-FA. 399
Abundance-weighted average Δ14C29+31alkanes and Δ14Ceven alkanes values, which varied from 400
−288±10 to −612±9‰ (ave., –469±94‰), and from −700±40 to –961±21‰ (ave., –858±401

19
99‰), respectively (Fig. 5), were also more variable and markedly lower than those of 402
corresponding long-chain n-FAs and n-alkanols. Over the observation period, cold and dry 403
seasons (November to April) always corresponded to higher δ13C and lower Δ14C values for 404
long-chain n-alkanes, while warm and wet seasons (June to October) corresponded to lower 405
δ13C and higher Δ14C values. Long-chain even-carbon number (i.e., C26, C28, C30 and C32) 406
n-alkanes were most strongly 14C-depleted, especially during winter and spring time (Fig. 407
5). 408
For lignin derived phenols, the abundance-weighted average Δ14C values of syringyl 409
and vanillyl phenol Δ14CV+S phenols exhibited strong temporal variability (1σ = 65‰), with 410
the highest value (+21±8‰) in summer (June) and the lowest value (–132±36‰) in winter 411
(January). Lignin phenol Δ14C values were generally higher than those of plant wax derived 412
long-chain lipid biomarkers from corresponding SPM samples (Fig. 5). 413
414
Discussion 415
Molecular isotopic insights into temporal variability in POC sources 416
In this study, we undertake a detailed examination of temporal variations in carbon 417
isotopic compositions of POC and of source-specific biomarkers. Yellow River POC δ13C 418
values (–23.4 to –24.2‰; Fig. 4a) are relatively high compared to those draining 419
watersheds dominated by C3 vegetation (Raymond and Bauer 2001; Zou et al. 2006; Martin 420
et al. 2013; Bouchez et al. 2014). C4-dominanted vegetation and heterotrophic aquatic 421
organisms, especially near wetlands and reservoirs, along the lower Yellow River may be 422
responsible for inputs of 13C-enriched OC input (Fig. 6). The relatively depleted 14C content 423
and corresponding old radiocarbon age (4000–4690 14C yr; Fig. 5) may reflect large 424
20
contributions from relict floodplain soil sediments, heavily weathered loess deposits or old 425
sedimentary rock inputs (Keil et al. 1997; Wu et al. 2005; Wang et al. 2012; Tao et al. 2015). 426
As shown in Figure 4 and 5, standard deviations (1σ) of POC isotopic characteristics of 427
samples spanning different seasons fall within threefold analytical error. Despite this 428
invariance in POC 13C and 14C contents, distinct isotopic variability is apparent at the 429
molecular level (Fig. 6), implying that OC inputs and dynamics are more complex and 430
variable than apparent at the bulk level. We therefore further examine molecular isotopic 431
signals in order to derive insights into intrinsic temporal variability in Yellow River 432
suspended POC. 433
Isotopic compositions of molecular markers provide a window into the specific source 434
inputs contributing to the overall (bulk) OC signature, and provide a valuable approach for 435
quantitative apportionment of OC sources. Although there are intrinsic uncertainties in the 436
isotope mass balance approach, these uncertainties are sharply reduced when multiple lines 437
of molecular (isotopic) evidence converge on similar end-member values. We consider, 438
therefore, that this approach provides a crucial means to track different OC sources to 439
highly complex bulk OM pools (e.g., riverine POC), and to assess temporal variability in 440
source inputs. 441
442
Contemporary/modern biomass OC 443
Short-chain (C16 and C18) n-FAs are ubiquitous molecular marker compounds that are 444
abundant in terrestrial plant leaf tissue, aquatic biomass and soil OM (Chikaraishi and 445
Naraoka 2006; Volkman et al. 2008). In the Yellow River, relatively high 446

21
abundance-weighted average △14C values of C16 and C18 n-FAs (△14C16+18FA: +44‰ to 447
−85‰, ave., ̶ 20‰) imply an origin from a relatively labile and fast turnover (decades) 448
biogenic material pool that is only slightly lower than △14C of atmospheric CO2. 449
In order to distinguish and examine temporal variability in contributions from different 450
biogenic sources, short-chain n-FA characteristics were compared with those of n-C17 451
alkane - an aquatic biomarker (Gelpi et al. 1970; Collister et al. 1994a) with very low d13C 452
values (as low as ̶ 38.0‰; Fig. 4a). Temporal variability in d13C values of this marker 453
should therefore be tightly coupled with the abundance and isotopic composition of 454
dissolved inorganic carbon (DIC) due to photosynthesis and carbon fixation. The n-C17 455
alkane is most 13C-depleted in autumn and during the low flow summer period, with higher 456
d13C values in winter and during the WSR period (Fig. 4a). This trend is consistent with 457
higher concentrations and a more 13C-depleted DIC signature in autumn as a consequence 458
of organic matter decomposition and also terrestrially-derived groundwater DIC inputs 459
(Hotchkiss et al. 2015), while more 13C-enriched DIC signals stem from dissolution of 460
carbonate and siliciclastic rocks during weathering reactions in spring and winter (Wang et 461
al. 2016). The pattern of seasonal variability in δ13C of short-chain n-FA is similar to that of 462
the n-C17 alkane (δ13C17alkane), albeit lower in amplitude (Fig. 4a). Although there are only 463
two data point available for Δ14CDIC in the Yellow River (Wang et al. 2016), higher 464
△14C16+18FA values ( ̶2‰) and △14CDIC values ( ̶125‰) were observed in October, while 465
lower △14C16+18FA values (̶ 50‰) and △14CDIC values (̶ 164‰) were evident in Spring 466
(April). These parallel time-series variations suggest that aquatic production is likely a 467
source of short-chain n-FAs, and hence corresponding carbon isotopic compositions of 468

22
short-chain n-FAs echoes that of aquatic biomass produced via photosynthetic DIC 469
fixation. 470
However, 14C signals of short-chain n-FAs are consistently ca. 110 ̶ 120‰ higher than 471
that of Yellow River DIC, indicating that the former partly derive from fresh vascular plant 472
carbon or heterotrophic organisms that utilize a different carbon source (e.g., fresh 473
terrestrial plant detritus). As evident from Figure 6, δ13C16+18FA values are also consistently 474
1.9 ̶ 9.5‰ higher than that of aquatic lipid biomarker (n-C17 alkane), indicating 475
13C-enriched (e.g., C4-dominanted vegetation and heterotrophic aquatic organisms) sources 476
could partly contribute short-chain n-FAs in the Yellow River. 477
Short-chain n-FAs are also prevalent in soils (Otto and Simpson 2005; Chikaraishi and 478
Naraoka 2006). In order to estimate potential contributions from the soil end member, 479
short-chain n-FA isotopic characteristics were compared with those of a well-established 480
suite of terrestrial plant biomarkers – lignin phenols. Lignin has been proposed to be 481
primarily supplied to rivers via surface export (run-off) of fresh, younger plant-derived 482
(detritus, litter) or surface soil OC (Feng et al. 2013b; Martin et al. 2013). In the Yellow 483
River, lignin-derived phenols from the same samples exhibited younger ages in summer and 484
autumn and older ages in winter and spring (Fig. 5), which is consistent with more plant 485
growth in warm and wet seasons relative to cold and dry seasons. Erosion from 486
less-vegetated land surfaces, particularly in cold and dry seasons, would promote 487
mobilization of older plant markers (plant wax lipids, lignin phenols) from surface and 488
deeper soil layers. Given that the temporal variability in △14C values of short-chain n-FAs 489
does not parallel that of lignin-derived phenols (i.e., 14C ages short-chain n-FAs do not 490

23
increase in winter; Fig. 5), we therefore infer that contributions of aged (mineral soil-derived) 491
short-chain n-FAs are insignificant compared to those from fresh plant-derived and aquatic 492
sources. Accordingly, we interpret short-chain n-FAs exported by the Yellow River SPM as 493
reflecting fresh biogenic contributions from both 13C-enriched (e.g., C4-dominanted 494
vegetation and heterotrophic aquatic organisms), and 13C-depleted (e.g., aquatic primary 495
production and/or C3 plants) sources (Fig. 6). Therefore, their carbon isotopic compositions 496
are considered representative of isotopic end-member values for overall OC derived from 497
contemporary/modern biomass inputs to the Yellow River. 498
For a quantitative estimation, a three end-member isotopic approach was applied to assess 499
the relative contribution of n-C16,18 FAs derived from aquatic production (faquatic), vascular 500
C3 plants (fC3) and vascular C4 plants (fC4), in SPM from two different time intervals 501
(October and April). δ13Caquatic, δ13CC3, δ13CC4 and Δ14Caquatic, Δ14CC3, Δ14CC4 are 502
corresponding end-member isotopic compositions of individual sources, respectively. The 503
MC simulation (see method) was used to account for variability in the end-member values 504
in the source apportionment calculation. 505
3 3 4 4
14 14 14 14B aquatic aquatic C C C CΔ C Δ C Δ C Δ Cf f fé ù é ùé ù= ´ + ´ + ´ë û ë ûë û 506
3 3 4 4
13 13 13 13B aquatic aquatic C C C Cδ C δ C δ C δ Cf f fé ù é ùé ù= ´ + ´ + ´ë û ë ûë û 507
3 4aquatic C C1 f f f= + + 508
We defined δ13C16+18FAs and Δ14C16+18FAs as isotopic representatives of contemporary 509
biomass inputs (δ13CB and Δ14CB). We used literature Δ14CDIC values ( ̶ 125±2.1‰ in 510
October; ̶164±2.1‰ in April) and δ13C values ( ̶ 32.7±0.1‰ in October; ̶30.9±0.1‰ 511

24
in April) of typical aquatic lipid biomarkers (n-C17 alkane) for the aquatic autotrophic (and 512
associated heterotrophic) end-member. Based on literature data for the stable carbon 513
isotopic composition of plant wax-derived n-alkanes (Collister et al. 1994b; Freeman and 514
Colarusso 2001) and considering ~2‰ 13C-depletion for corresponding n-FAs relative to 515
n-alkanes (Wiesenberg et al. 2004), we assumed a fixed Δ14C and δ13C values of +50±10‰ 516
and –32.8±2.4‰ for recently-synthesized higher C3 plant-sourced n-C16,18 FAs, and +50±517
50‰ and –20.6±2.1‰ for higher C4 plant-sourced n-C16,18 FAs, respectively. In these two 518
SPM samples, the fraction of contemporary biomass-sourced organic compounds in 519
October and April, taking n-C16,18 FAs as an example (Table 2). Short-chain n-FAs (and 520
associated contemporary/modern biomass OC) in the lower reach of the Yellow River stem 521
from at least three sources, and includes a significant proportion of C4 higher plant and 522
aquatic sources despite the dominance of C3 vegetation in the upper and middle reaches of 523
the Yellow River. The proportion of recently-fixed higher plant input was predominant in 524
October (71%), which is consistent with strong surface terrestrial material erosion during 525
the autumn NHF period. Zhang et al. (2010) reported vegetation coverage in the Yellow 526
River drainage basin, indicating that C3 vegetation predominates in higher altitude regions 527
of upper and middle reaches whereas contributions of C4 vegetation generally increases 528
with decreasing elevation towards the lower basin. In some regions of the lower part of the 529
river basin, especially near wetlands and reservoirs, C4 vegetation contribution can reach up 530
to 50%. From the MC source apportionment of contemporary biomass OC, the greater C3 531
plant contribution to Yellow River SPM in October (31±10%) than in April (13±6%) 532
may reflect intensified erosion of surface land during the autumn NHF period that promotes 533

25
mobilization of C3 plant tissue from the upper to the lower reach. Notably, however, ~40% 534
of the contemporary biomass organic component originated from C4 plant sources. The 535
relative constancy of this proportion during different sampling times implies that 536
contemporary C4 plant biomass inputs are local, and independent of temporal variations in 537
hydrodynamic processes associated with physical erosion or transportation. In addition, 538
fractional contributions from aquatic sources to the overall contemporary biomass-derived 539
organic component tended to be higher in April (46%) under conditions of low flow where 540
light limitation is alleviated due to lower turbidity. While aquatic primary production is 541
unlikely to be prominent in such a turbid river, there could certainly be secondary 542
(heterotrophic) aquatic productivity fueled by supply of fresh carbon from the surrounding 543
landscape. In this case, light availability would not be an issue. However, it is important to 544
point out that although aquatic production comprises a major source for n-C16, 18 FAs and 545
associated contemporary biomass-derived OC, this does not mean that aquatic production is 546
a major source for bulk OC. In fact, results from the three end-member mixing model 547
suggest that contemporary biomass OC - including aquatic production and freshly 548
synthesized terrestrial plant detritus - accounts for a relatively minor component (13 ̶ 22%) of 549
bulk POC in this turbid river system (see discussion below; Fig. 7a). 550
551
Soil OC 552
Approximately 88% of the sediment load of the Yellow River originates from the Loess 553
Plateau (Wang et al. 2011; Hu et al. 2012b), and corresponding loess/soil-derived OC likely 554
comprises a substantial fraction of the OC discharged to the and buried in the, adjacent 555
Chinese marginal seas. Plant wax n-alkyl lipids and lignin-derived phenols are two 556

26
well-established groups of biomarker compounds of terrestrial plant biomass which have 557
been widely applied to trace the fate of vascular plant-derived OC in soils and fluvial 558
systems (e.g., Feng et al. 2013; Martin et al. 2013). Gustafsson et al. (2011) performed 559
compound-specific 14C analysis of plant wax n-alkyl lipids (FAs and alkanes) in 560
river-dominated Siberian margin sediments and concluded that the distinct old OC 14C ages 561
is consistent with supply from deeper layers of Arctic soils. In this study, we also consider 562
14C and 13C-depleted (pre-aged) plant wax FAs and alkanols (Fig. 6; i.e., n-C26, 28, 30 FAs, 563
n-C24, 26, 28 alkanols) as isotopically representative of bulk pre-aged soil OC, and use these 564
signatures to track temporal variability in pre-aged mineral-bound soil OC contiributions to 565
Yellow River SPM. 566
As shown in Figure 4b and 5, 13C and 14C isotopic characteristics of n-C26+28+30 FAs and 567
n-C24+26+28 alkanols exhibit minor temporal variability, with 1σ values (0.3‰ for δ13C and 568
27‰ for Δ14C, respectively) falling within measurement uncertainty (0.2‰ and 40‰, 569
respectively; see experiment methods). Furthermore, their carbon isotopic compositions and 570
OC-normalized concentrations do not co-vary with TSS or water discharge (Fig. 3b and 571
Fig. S3a ̶ S3d). Both of these observations imply relatively constant soil organic matter 572
contributions to the Yellow River POC. Furthermore, the uniform isotopic compositions 573
suggest a common origin for plant wax lipids and associated pre-aged soil OC irrespective 574
of hydrological regime. Any type of erosion, especially deep mobilization process such as 575
transport via underground conduits, gully erosion or occasional mudslides, seems to 576
transfer pre-aged soil/loess OC from the Loess Plateau to the Yellow Rive system. 577
In contrast, 14C characteristics of lignin-derived phenols exhibit greater seasonality. In 578
the Yellow River SPM, lignin phenol 14C ages are younger in warm and wet seasons 579

27
(summer and autumn; Fig. 5), indicating more rapid mobilization of surface soil OC and 580
greater inputs of fresh terrestrial primary production via relatively high run-off (Fig. 2a and 581
2c). However, lignin-derived phenols generally become older in the dry and cold seasons 582
with values closer to n-alkyl long-chain lipids (Fig. 5). This suggests pre-aged 583
mineral-bound lignin are proportionally greater in cooler and less extensively vegetated 584
conditions, and both plant-derived organic compounds (lignin derived phenols and n-alkyl 585
lipids) more strongly reflect re-mobilization of deeper mineral-bound soil OC during winter 586
and early spring time. The 14C contents of lignin-derived phenols also weakly correlate with 587
hydrological parameters, as the proportion of fresh (14C-enriched) phenols increases with 588
increasing turbidity and flow rate (Fig. S3g and S3h). We concluded that hydrologic 589
conditions seasonally influence contributions of fresh higher plant-derived detritus OC via 590
rapid surface export (run-off), while both the proportion and isotopic characteristics of the 591
predominant pre-aged soil OC component remains relatively invariant. Overall, these 592
findings imply that different terrestrially-derived organic compounds may exhibit temporal 593
variability due to contrasting stabilization, mobilization and transport processes within the 594
river basin. 595
596
Fossil/petrogenic OC 597
Although long-chain odd-carbon-numbered n-alkanes (i.e., C29+31) are frequently-used 598
biomolecular tracers of vascular plant-derived carbon (Eglinton and Hamilton 1967; 599
Collister et al. 1992; Collister et al. 1994b), their distributions in contemporary soils and 600
sediments may be influenced by petrogenic and anthropogenic hydrocarbon inputs (Pearson 601
and Eglinton 2000; Drenzek et al. 2007; Kusch et al. 2010). In the Yellow River, 602

28
abundance-weighted average δ13C values of long-chain odd n-C29+31 alkanes display 603
distinct seasonal variability (1σ = 1.1‰), with the lowest values (min. –31.6‰) in wet and 604
warm seasons (autumn and summer) and higher values (max., –28.2‰) in dry and cold 605
seasons (winter and spring) (Fig. 4b). The seasonal growth pattern of C4/C3 vegetation 606
along the Yellow River drainage cannot readily explain this more 13C-enriched signal of 607
n-C29+31 alkanes in cold seasons. However, sedimentary rock outcrops and numerous coal 608
mines in upper and middle sections of the drainage basin may serve as an additional source 609
of 13C-enriched n-alkanes (Wiesenberg et al. 2004; Jia and Peng 2005; Tao et al. 2015), 610
with proportionally greater contributions in winter and spring (Wang et al. 2016). 611
Corresponding 14C data also support this interpretation: n-C29+31 alkanes exhibit older 14C 612
ages (2670 to 7550 yr) compared to those of n-C26+28+30 FAs and n-C24+26+28 alkanols, with 613
the oldest 14C ages in cold seasons (Fig. 5), consistent with fossil inputs. We therefore 614
attribute the large temporal variation in D14C values of n-alkanes to variable fossil 615
hydrocarbon contributions, with higher proportions during cold seasons when terrestrial 616
primary productivity is low. Long-chain even-carbon-numbered n-alkanes (i.e., C26+28+30+32) 617
show similar seasonal variability in carbon isotopic composition to the n-C29+31 alkanes, but 618
with more significant 13C-enrichment and 14C-depletion (Fig. 4b and 5). In particular, Δ14C 619
values of n-C26+28+30+32 alkanes from cold season samples range from –934 to –961‰ (Fig. 620
5), indicating an almost exclusive origin from fossil sources. However, the biospheric 621
contribution of n-C26+28+30+32 alkanes increases in warm seasons with relatively 622
13C-depleted and 14C-enriched signals. 623
In contrast to plant wax FAs and alkanols, hydrologic influence on long-chain 624

29
n-alkanes manifests itself in their carbon isotopic compositions in a manner similar to that 625
of lignin-derived phenols. Specifically, parallel isotopic variability is evident in long-chain 626
n-C29+31 alkanes and n-C26+28+30+32 alkanes when the proportion of plant-derived n-alkanes 627
(characterized by 13C-depletion and 14C-enrichment) increases with increasing turbidity and 628
flow rate (Fig. S3e, S3f, S3i and S3j). Feng et al (2013b) measured 14C contents of 629
lignin-derived phenols and plant wax lipids in a suite fluvially-dominated Arctic sediment 630
samples, and found that plant wax n-alkanes and lignin-derived phenols both carried a 631
strong plant debris 14C signal whereas plant wax FAs did not. Overall, long-chain n-alkanes 632
appear to derive from multiple sources, including plant detritus, mineral soils/loess and 633
fossil materials. The seasonality of the former source can be attributed to temporal 634
variability in carbon isotopic compositions of long-chain n-alkanes. Notablely, carbon 635
isotopic characteristics of long-chain even-carbon-numbered n-alkanes in colder and low 636
flow periods show a predominant petrogenic signal with minor influence from plant detritus, 637
and provide a window into the isotopic characteristics of petrogenically-sourced OC 638
contributing to the bulk POC signal. 639
640
Temporal variations in OC component fluxes 641
Over the observation period, the composition and isotope characteristics of bulk OC in 642
the Yellow River SPM remained relatively invariant despite significant variability in 643
sediment and water flux. However, distinct variations in molecular isotopic characteristics 644
were evident, and these can be used to gain insights into the dynamics of specific OC 645
components contributing to the suspended load. A three end-member mixing model based 646
on the δ13C and Δ14C values of bulk and source-specific biomarkers is used here to estimate 647

30
seasonal variations in the relative fractional proportions of contemporary/modern biomass 648
(fB), pre-aged soil (fS), and fossil (fF) OC (see method; and more details in Tao et al., 2015). 649
Based on the source assignments discussed above, we constrain end-member values 650
using δ13C and Δ14C values of corresponding source-specific biomarkers in each sample 651
(the black triangle in Fig. 6). The abundance-weighted average carbon isotopic composition 652
of n-C16, 18 FAs were to define contemporary biomass end-member values (Δ14CB, δ13CB), 653
with δ13C values of ̶ 22.61 to ̶ 20.46‰ (+6‰ corrected after δ13Cbulk ̶ δ13Cbiogenic lipid 654
fractionation) and standard deviation of 1.00 to 1.03‰, and Δ14C values of ̶ 83 to +85‰ 655
and standard deviation of 6 to 9‰). The abundance-weighted average carbon isotopic 656
composition of long-chain fatty acids (n-C26,28,30 FAs) were selected as the pre-aged soil end 657
member (Δ14CS, δ13CS), with δ13C values of ̶ 25.72 to ̶ 24.72‰ (+6‰ corrected after 658
δ13Cbulk ̶ δ13Cbiogenic lipid fractionation) and standard deviation of 1.00 to 1.02‰, and Δ14C 659
of ̶ 244 to ̶172‰ and standard deviation of 7 to 14‰. We assign Δ14CF as −1000‰ and 660
δ13CF as the abundance-weighted average δ13C value (−28.0‰) of even-carbon-numbered 661
n-alkanes (C26,28,30,32) in cold seasons when they show extremely low 14C content <920‰), 662
with standard deviation of 1.07‰ for δ13CF and with standard deviation of 21‰ for Δ14C. 663
Standard deviation of end-member Δ14C values only include measurement uncertainty for 664
compound-specific 14C analysis, while standard deviation of end-member δ13C values 665
consist of measurement uncertainty for compound-specific 13C analysis and ±1‰ spread 666
due to 5 ̶7‰ correction for δ13Cbulk ̶ δ13Clipid fractionation. 667
Figure 7a shows average values of all possible solutions derived from three 668
end-member mixing model calculations, and reveals the temporal variability in fractional 669

31
proportions of contemporary biomass, pre-aged soil and fossil OC (fB, fS, and fF, respectively) 670
in Yellow River SPM. Error bars represent standard deviations of all possible solutions 671
estimated via the MC simulation strategy for source apportionment calculations 672
incorporating uncertainties in end-member values (Fig. S4). Over the investigation period, 673
we find that Yellow River POC comprises 13±8% to 22±13% contemporary biomass OC, 674
44±15% to 57±11% pre-aged soil OC, and 29±2% to 35±3% fossil OC (Table S1). fB is high 675
in summer and autumn, likely reflecting elevated productivity and surface runoff due to 676
high precipitation during wet and warm summer seasons (June to October), and dead leaf 677
fall in autumn, respectively. Moreover, higher temperatures and lower turbidity in upstream 678
tributaries/reservoir would promote high biogenic productivity (Liu et al. 2003; Gong et al. 679
2006; Wang et al. 2010), as well as to increase aquatic secondary (heterotrophic) 680
productivity fueled by supply of fresh carbon from the surrounding landscape downstream. 681
The lowest fB values occurred in winter and spring, suggesting relatively weak surface 682
erosion during low flow periods. In contrast, fS is high in winter and spring (December to 683
April), implying different mechanisms of supply of loess/mineral soil supply to the river. 684
Thus, whereas variations in fB imply surficial pools of terrestrial OC (traced by short-chain 685
FAs) increase during high flow conditions, deeper-sourced OC materials, including mineral 686
soil/loess OC (long-chain n-FAs and n-alkanols) and fossil OC (even-carbon-numbered 687
n-alkanes) reflect more constant base flow conditions (Sanderman et al. 2009). Temporal 688
variations in fS may thus reflect processes intrinsic to the source region, such as preferential 689
mobilization of deeper soils and pre-aged OC relative to fresh vegetation cover. 690
Alternatively, mobilization processes associated with ice- and snow-melt may increase 691

32
pre-aged soil OC (fS) export in winter and spring. Finally, fF is relatively uniform with only 692
slightly elevated proportions during wet and warm seasons (Fig. 7a). The latter may reflect 693
resuspension of higher-density petrogenic materials (e.g., rock debris) along the main 694
stream by intensive riverbed scouring/erosion processes (Galy et al. 2015) during autumn 695
NHF and WSR period. In summary, our findings indicate that hydrologic conditions exert 696
an influence on the proportional contributions of petrogenic and especially fresh 697
plant-derived OC, while the proportion and isotopic characteristics of the predominant 698
pre-aged soil OC component remain relatively insensitive to variations in TSS and 699
discharge. 700
Our sampling site is near the last hydrological station (Lijin) of the Yellow River, ~50 701
km upstream from the estuary. Thus, POC flux at this location likely reflects overall fluvial 702
POC supply to the adjacent marginal seas. Since 1855, a modern Yellow River delta formed 703
at the interface between the river and the adjacent marginal sea, along with total land 704
expansion of 2849 km2 till to the present. From 2000 to 2007, the delta experienced erosion 705
due to the decrease of sediment load in the lower Yellow River and the delta region (Peng et 706
al. 2010). Annually, modern Yellow River sediment export accounts for ~70% of annual 707
sediment burial in the Bohai & Yellow Sea (Tao et al. 2016 and references therein). Thus, 708
understanding the variations in the flux and composition of exported fluvial material is 709
essential for prediction of the future evolution of this marginal sea system, and likely for 710
other river-dominated margins. Combining estimates of the monthly suspended sediment 711
flux at Lijin station (Table 3, Yellow River Sediment Bulletin, 2011, 2012 and 2013) and 712
our isotopic mass balance estimates, we calculate a seasonal supply budget for the three 713
different OC components to the Chinese marginal seas (Fig. 7b). Although temporal 714

33
variability in fractional contributions is very small for each component contributing to bulk 715
POC (Fig. 7a), fluxes of each component show large temporal variability, peaking in 716
September and June, synchronous with the autumn flood event and WSR episodes, 717
respectively (Fig. 7b). These temporal variations imply that typical strong seasonality in 718
rainfall, extreme climate events and human activity (water and sediment regulation) can all 719
significantly influence fluvial OC export from the Yellow River to the adjacent Chinese 720
marginal seas. As expected, monthly fluxes of TSS and the three different OC components 721
exhibit significant correlations with monthly discharge, Q (Fig. 8). Since the latter is 722
monitored almost monthly, these correlations imply that fluxes for the three different OC 723
components can be extrapolated to periods when OC information is unavailable, thereby 724
reducing the uncertainty introduced by relatively low sampling frequency, in particular 725
during high flow events. Our calculations indicate large monthly variations in Yellow River 726
delivered OC to the adjacent Bohai/Yellow Sea, ranging between 0.03±0.42 to 3.58±2.99 ´ 727
104 t/month of contemporary OC, 0.15±1.33 to 10.62±9.33 ´ 104 t/month of pre-aged soil 728
OC, and 0.08±0.87 to 6.43±6.02 ´ 104 t/month of fossil OC (Table 3). 729
We calculate that 6.1±3.2 ´ 104 t/yr and 10.2±4.8 ´ 104 t/yr, 17.1±6.4 ´ 104 t/yr and 730
29.7±14.4 ´ 104 t/yr, 11.1±9.9´ 104 t/yr and 18.24±15.0 ´ 104 t/yr of modern biomass 731
derived, pre-aged soil derived and fossil OC was exported to the Chinese marginal seas for 732
different study years, respectively (Table 3). Our calculated POC fluxes for the second year 733
of our study (0.581±0.213 Mt/yr) are 70% greater than those in the first year of our study 734
(0.343±0.122 Mt/yr), consistent with heavier and more high-frequent storm events during 735
the wet season (June to September) of 2012 compared to 2011 (Fig. 2; Yellow River 736

34
Sediment Bulletin, 2011, 2012 and 2013). These values are broadly similar to other recent 737
estimates of annual POC flux (0.389 Mt/yr from 2009, Wang et al., 2012; 0.41 Mt/yr from 738
July 2011 to June 2012, Ran et al., 2013). Taking the month of July as an example, pre-aged 739
and fossil OC fluxes in 2012 are about 4.5 times as large as those in 2011, consistent with 740
early arrival of intense precipitation and the occurrence of a basin-scale flood event in July, 741
2012. 742
Overall, natural and human-induced variations in discharge and TSS strongly 743
influence the flux but not the composition of POC exported by the modern Yellow River. 744
Pre-aged soil OC consistently represents the major component irrespective of hydrologic 745
and hydrodynamic conditions. The annual POC export by the Yellow River corresponds to 746
less than 1% of global POC flux to global oceans. However, the very high burial efficiency 747
of pre-aged soil and fossil OC in the adjacent Chinese marginal seas (up to 100% and 70%, 748
respectively; (Tao et al. 2016) implies that Yellow River represents a significant source of 749
non-modern terrestrial OC to marine sediments, with extreme climate events (e.g, floods) 750
modulating transport of this old OC from the continent into the sea. 751
752
Comparison of the OC composition of the Yellow River with other major world rivers 753
Despite its extremely high sediment load, the POC flux (0.344–0.584 Mt/yr) of the 754
Yellow River is relatively low as a result of significantly lower POC content (0.26–0.47%) 755
than the global mean (0.95%; with mean per river flux of 2.833–4.651 Mt/yr calculated 756
based on 60-river dataset from Ludwig et al., 1996 and 43-river dataset from Galy et al., 757
2015). Nevertheless, the predominance of refractory and pre-aged OC (~80%) from 758
loess/mineral soil deposits results in burial of significant amounts of old OC in adjacent 759

35
margin sediments. However, an unusual characteristic of the Yellow River is the temporal 760
uniformity in the carbon isotopic composition of POC (Fig. 9), and several other rivers 761
show marked seasonal variability in the proportions of different sourced OC as estimated 762
by two end-member or three end-member models (Raymond et al. 2004; Hossler and Bauer 763
2012; Martin et al. 2013; Lamoureux and Lafrenière 2014). Although time-series studies of 764
radiocarbon characteristics fluvial POC remain rare and those reported are generally 765
insufficient to capture seasonal or inter-annual OC cycles, some comparisons can be drawn 766
from the limited 14C dataset shown in Figure 9, For example, large tropical rivers, such as 767
the Amazon and Mekong, are also characterized by high sediment load, and exhibited 768
significant temporal variability in Δ14C values of exported POC when compared to our 769
observations from the Yellow River. This may be a consequence of greater and more 770
variable proportions of young biospheric OC exported from the watershed and floodplain in 771
response to seasonal (monsoon) rainfall patterns (Martin et al. 2013; Moreira-Turcq et al. 772
2013). POC 14C characteristics in non-monsoon rivers such as Hudson, Parker, York 773
draining the northeastern USA, may be primarily influenced by seasonal variations in OC 774
fluxes from river aquatic productivity (Raymond and Bauer 2001; Hossler and Bauer 2012). 775
In high latitude regions, such as the Arctic rivers (West River and East River), highly 776
seasonal permafrost thaw and plant growth likely influence the composition and age of 777
POC transported by streams and rivers (Lamoureux and Lafrenière 2014). Moreover, small 778
high mountainous rivers, such as Lanyang His (Taiwan) and Narayani (a tributary of 779
Ganges), tend to carry more variable and greater proportions of 14C-free petrogenic POC 780
via sedimentary rock erosion, which is strongly influenced by seasonal changes in 781
precipitation and surface run-off (Kao and Liu 1996). 782

36
In addition to the Yellow River, relatively constant POC 14C compositions have been 783
found in some other fluvial systems, especially the large Asian rivers originating from the 784
Qinghai-Tibet Plateau (Brahmaputra, Ganges and Changjiang; Fig. 9). This may reflect 785
substantial soil OC contributions from cold, semi-arid and scarcely vegetated areas north of 786
the Himalayan range or the Chinese Loess Plateau. Alternatively, homogeneous 787
compositions may be a product of modification of fluvial POC during long-distance river 788
transport. Meanwhile, a predominant input of pre-aged permafrost soil from a highly 789
disturbed Arctic watershed (Ptarmigan; Fig. 9) has also been suggested as an explanation 790
for the lack of temporal variability in 14C composition of fluvial POC (Lamoureux and 791
Lafrenière 2014). Figure 5 shows that time-series variations (trend and amplitude) in 792
Yellow River bulk POC 14C compositions generally co-varied with that of the plant wax 793
biomarkers (n-C26+28+30 FAs). As previously mentioned, we consider the latter as tracers for 794
pre-aged mineral-bound soil inputs, which display a narrow temporal change. The 795
relatively invariant composition of Yellow River POC is thus attributed to the high 796
proportion of SPM in the Yellow River derived from the loess deposits, a phenomenon that 797
is analogous to permafrost-dominated watersheds in polar region. The OC homogeneity in 798
these pre-aged mineral soil-dominated watersheds facilitates robust predictions in terms of 799
OC transport dynamics. It also provides a relatively stable benchmark against which to 800
compare compositions of such river systems in the past (sediment cores) and in the future. 801
802
Conclusions 803
An investigation of Yellow River SPM collected over a 2-year period revealed 804
relatively invariant bulk OC characteristics, while the carbon isotopic characteristics of 805

37
source-specific biomarkers indicate that the OC is inherently heterogeneous. At least three 806
source components are distinguished that exhibit distinct and systematic temporal variation 807
in proportional abundance and composition: (i) contemporary sources (aquatic OC, surface 808
detrital terrestrial plant OC), influenced by aquatic production, plant phenology and 809
hydrological conditions, (ii) pre-aged terrestrial sources (mineral-bound OC derived from 810
loess/soil deposits), influenced by deep soil mobilization processes that are largely 811
independent of hydrodynamics and surface runoff, and (iii) fossil OC (derived from 812
petrogenic sources and fossil fuels), influenced by erosion of sedimentary rocks or 813
anthropogenic processes. 814
Application of a mixing model based on bulk and molecular isotopic (δ13C and Δ14C) 815
signatures revealed that the Yellow River POC composition exhibits minor temporal 816
variability on both seasonal and inter-annual scales despite dramatic changes in TSS and 817
discharge. While changes in overall flux of each source component is dominated by 818
seasonally varying hydrological conditions (especially TSS), constancy in composition of 819
fluvial OC was linked to a predominant input of the homogeneous loess/soil OC. 820
Variations in fractional contributions of the three different OC components have 821
significant implications for regional scale carbon cycling given their different connection to 822
atmospheric reservoirs and fates (i.e., remineralization vs burial efficiency). Both natural 823
and human modulation of hydrological conditions exerts dominant control on fluxes of all 824
three components in the Yellow River. Moreover, the consistent relationships that emerge 825
between OC composition and seasonally varying fluvial dynamics provide a means to 826
reconstruct past and predict future changes in the flux and nature of OC discharge from the 827
river. In this context, a key facet of the biomarker [isotope] approach is the ability to trace 828

38
OC signatures into the sedimentary record, where they provide one of the key tools for 829
paleoclimate and paleoenvironmental reconstruction. Such records are frequently targeted 830
in land-proximal marine sedimentary sequences where interpretation of bulk OC signatures 831
is confounded by contributions from marine productivity. Thus, understanding [temporal] 832
variability of the amount and isotope characteristics of specific organic compounds is 833
important not only in the context of understanding source-to-sink carbon dynamics, but also 834
for more informed interpretation of down-core records. 835
836
References 837
Aller, R. C., and N. E. Blair. 2004. Early diagenetic remineralization of sedimentary organic 838
C in the Gulf of Papua deltaic complex (Papua New Guinea): Net loss of terrestrial C 839
and diagenetic fractionation of C isotopes. Geochim. Cosmochim. Acta 68: 1815-1825. 840
Aller, R. C., N. E. Blair, and G. J. Brunskill. 2008. Early diagenetic cycling, incineration, and 841
burial of sedimentary organic carbon in the central Gulf of Papua (Papua New Guinea). J. 842
Geophys. Res.: Earth Surface 113: 2156-2202. 843
An, Z. 2000. The history and variability of the East Asian paleomonsoon climate. Quat. Sci. 844
Rev. 19: 171–187. 845
Battin, T. J., S. Luyssaert, L. A. Kaplan, A. K. Aufdenkampe, A. Richter, and L. J. Tranvik. 846
2009. The boundless carbon cycle. Nat. Geosci. 2: 598-600. 847
Berner, R. A. 1982. Burial of organic carbon and pyrite sulfur in the modern ocean: its 848
geochemical and environmental significance. Am. J. Sci. 282: 451-473. 849

39
Bianchi, T. S. 2011. The role of terrestrially derived organic carbon in the coastal ocean: A 850
changing paradigm and the priming effect. Proc. Natl. Acad. Sci. 108: 19473-19481. 851
Blair, N. E., and R. C. Aller. 2012. The fate of terrestrial organic carbon in the marine 852
environment. Annu. Rev. Mar. Sci. 4: 401-423. 853
Bouchez, J., V. Galy, R. G. Hilton, J. Gaillardet, P. Moreira-Turcq, M. A. Pérez, C. 854
France-Lanord, and L. Maurice. 2014. Source, transport and fluxes of Amazon River 855
particulate organic carbon: Insights from river sediment depth-profiles. Geochim. 856
Cosmochim. Acta 133: 280-298. 857
Chikaraishi, Y., and H. Naraoka. 2006. Carbon and hydrogen isotope variation of plant 858
biomarkers in a plant–soil system. Chem. Geol. 231: 190–202. 859
Cole, J. J. and others 2007. Plumbing the global carbon cycle: Integrating inland waters into 860
the terrestrial carbon budget. Ecosystems 10: 172-185. 861
Collister, J. W., R. E. Summons, E. Lichtfouse, and J. M. Hayes. 1992. An isotopic 862
biogeochemical study of the Green River oil shale. Org. Geochem. 19: 265-276. 863
Collister, J. W., E. Lichtfouse, G. Hieshima, and J. M. Hayes. 1994a. Partial resolution of 864
sources of n-alkanes in the saline portion of the Parachute Creek Member, Green River 865
Formation (Piceance Creek Basin, Colorado). Org. Geochem. 21: 645-659. 866
Collister, J. W., G. Rieley, B. Stern, G. Eglinton, and B. Fry. 1994b. Compound-specific δ13C 867
analyses of leaf lipids from plants with differing carbon dioxide metabolisms. Org. 868
Geochem. 21: 619-627. 869

40
Drenzek, N. J., D. B. Montluçon, M. B. Yunker, R. W. Macdonald, and T. I. Eglinton. 2007. 870
Constraints on the origin of sedimentary organic carbon in the Beaufort Sea from 871
coupled molecular 13C and 14C measurements. Mar. Chem. 103: 146-162. 872
Drenzek, N. J., K. A. Hughen, D. B. Montluçon, J. R. Southon, G. M. dos Santos, E. R. M. 873
Druffel, L. Giosan, and T. I. Eglinton. 2009. A new look at old carbon in active margin 874
sediments. Geology 37: 239-242. 875
Eglinton, G., and R. J. Hamilton. 1967. Leaf epicuticular waxes. Science 156: 1322-1335. 876
Feng, X., B. C. Benitez-Nelson, D. B. Montluçon, F. G. Prahl, A. P. McNichol, L. Xu, D. J. 877
Repeta, and T. I. Eglinton. 2013a. 14C and 13C characteristics of higher plant biomarkers 878
in Washington margin surface sediments. Geochim. Cosmochim. Acta 105: 14-30. 879
Feng, X. and others 2013b. Differential mobilization of terrestrial carbon pools in Eurasian 880
Arctic river basins. Proc. Natl. Acad. Sci. 110: 14168-14173. 881
Freeman, K. H., and L. A. Colarusso. 2001. Molecular and isotopic records of C4 grassland 882
expansion in the late miocene. Geochim. Cosmochim. Acta 65: 1439–1454. 883
Galy, V., T. Eglinton, C. France-Lanord, and S. Sylva. 2011. The provenance of vegetation 884
and environmental signatures encoded in vascular plant biomarkers carried by the 885
Ganges–Brahmaputra rivers. Earth Planet. Sci. Lett. 304: 1-12. 886
Galy, V., and T. I. Eglinton. 2011. Protracted storage of biospheric carbon in the 887
Ganges-Brahmaputra basin. Nat. Geosci. 4: 843-847. 888
Galy, V., B. Peucker-Ehrenbrink, and T. I. Eglinton. 2015. Global carbon export from the 889
terrestrial biosphere controlled by erosion. Nature 521: 204-207. 890
41
Gelpi, E., H. Schneider, J. Mann, and J. Oro. 1970. Hydrocarbons of geochemical 891
significance in microscopic algae. Phytochemistry 9: 603-612. 892
Goñi, M. A., and S. Montgomery. 2000. Alkaline CuO oxidation with a microwave digestion 893
system: lignin analyses of geochemical samples. Anal. Chem. 72: 3116-3121. 894
Gong, M., L. Zhang, and P. Gong. 2006. Sources and spatial trends of n-alkanes in suspended 895
particulate matter in the Huanghe River. Periodical of Ocean University of China 36: 896
139–142 (in Chinese with English abstract). 897
Gustafsson, Ö., B. E. van Dongen, J. E. Vonk, O. V. Dudarev, and I. P. Semiletov. 2011. 898
Widespread release of old carbon across the Siberian Arctic echoed by its large rivers. 899
Biogeosciences 8: 1737-1743. 900
Hossler, K., and J. E. Bauer. 2012. Estimation of riverine carbon and organic matter source 901
contributions using time-based isotope mixing models. Journal of Geophysical Research: 902
Biogeosciences 117: G03035. 903
Hotchkiss, E. R., R. O. Hall Jr, R. A. Sponseller, D. Butman, J. Klaminder, H. Laudon, M. 904
Rosvall, and J. Karlsson. 2015. Sources of and processes controlling CO2 emissions 905
change with the size of streams and rivers. Nat. Geosci. 8: 696–699. 906
Hou, J., Y. Huang, C. Brodsky, M. R. Alexandre, A. P. McNichol, J. W. King, F. S. Hu, and 907
J. Shen. 2010. Radiocarbon dating of individual lignin phenols: A new approach for 908
establishing chronology of late quaternary lake sediments. Anal. Chem. 82: 7119-7126. 909
Hu, B., G. Li, J. Li, J. Bi, J. Zhao, and R. Bu. 2012a. Provenance and climate change inferred 910
from Sr–Nd–Pb isotopes of late Quaternary sediments in the Huanghe (Yellow River) 911
Delta, China. Quat. Res. 78: 561-571. 912

42
Hu, L., X. Shi, Z. Yu, T. Lin, H. Wang, D. Ma, Z. Guo, and Z. Yang. 2012b. Distribution of 913
sedimentary organic matter in estuarine–inner shelf regions of the East China Sea: 914
Implications for hydrodynamic forces and anthropogenic impact. Mar. Chem. 142–144: 915
29–40. 916
Jia, W., and P. Peng. 2005. Molecular structure of kerogens from source rocks of the Tarim 917
Basin: A study by Py-GC-MS and methylation-Py-GC-MS. Sci. China Ser. D-Earth Sci. 918
48: 313-325. 919
Kao, S. J., and K. K. Liu. 1996. Particulate organic carbon export from a subtropical 920
mountainous river (Lanyang Hsi) in Taiwan. Limnol. Oceanogr. 41: 1749–1757. 921
Keil, R. G., L. M. Mayer, P. D. Quay, J. E. Richey, and J. I. Hedges. 1997. Loss of organic 922
matter from riverine particles in deltas. Geochim. Cosmochim. Acta 61: 1507-1511. 923
Komada, T., M. R. Anderson, and C. L. Dorfmeier. 2008. Carbonate removal from coastal 924
sediments for the determination of organic carbon and its isotopic signatures, δ13C and 925
Δ14C: comparison of fumigation and direct acidification by hydrochloric acid. Limnol. 926
Oceanogr. 6: 254-262. 927
Kusch, S., J. Rethemeyer, E. Schefuß, and G. Mollenhauer. 2010. Controls on the age of 928
vascular plant biomarkers in Black Sea sediments. Geochim. Cosmochim. Acta 74: 929
7031-7047. 930
Lamoureux, S. F., and M. J. Lafrenière. 2014. Seasonal fluxes and age of particulate organic 931
carbon exported from Arctic catchments impacted by localized permafrost slope 932
disturbances. Environ. Res. Lett. 9: 045002. 933
43
Liu, W., Z. An, W. Zhou, M. J. Head, and D. Cai. 2003. Carbon isotope and C/N ratios of 934
suspended matter in rivers: an indicator of seasonal change in C4/C3 vegetation. Appl. 935
Geochem. 18: 1241-1249. 936
Liu, W., Y. Ning, Z. An, Z. Wu, H. Lu, and Y. Cao. 2005. Carbon isotopic composition of 937
modern soil and paleosol as a response to vegetation change on the Chinese Loess 938
Plateau. Sci. China Ser. D-Earth Sci. 48: 93-99. 939
Liu, W., H. Yang, Y. Ning, and Z. An. 2007. Contribution of inherent organic carbon to the 940
bulk δ13C signal in loess deposits from the arid western Chinese Loess Plateau. Org. 941
Geochem. 38: 1571-1579. 942
Ludwig, W., J.-L. Probst, and S. Kempe. 1996. Predicting the oceanic input of organic 943
carbon by continental erosion. Glob. Biogeochem. Cycles 10: 23–41. 944
Martin, E. E., A. E. Ingalls, J. E. Richey, R. G. Keil, G. M. Santos, L. T. Truxal, S. R. Alin, 945
and E. R. Druffel. 2013. Age of riverine carbon suggests rapid export of terrestrial 946
primary production in tropics. Geophys. Res. Lett. 40: 5687-5691. 947
Mayorga, E., A. K. Aufdenkampe, C. A. Masiello, A. V. Krusche, J. I. Hedges, P. D. Quay, J. 948
E. Richey, and T. A. Brown. 2005. Young organic matter as a source of carbon dioxide 949
outgassing from Amazonian rivers. Nature 436: 538–541. 950
Milliman, J. D., Q. Yun-Shan, R. Mei-E, and Y. Saito. 1987. Man's Influence on the Erosion 951
and Transport of Sediment by Asian Rivers: The Yellow River (Huanghe) Example. The 952
Journal of Geology 95: 751–762. 953
Moreira-Turcq, P., M. P. Bonnet, M. Amorim, M. Bernardes, C. Lagane, L. Maurice, M. 954
Perez, and P. Seyler. 2013. Seasonal variability in concentration, composition, age, and 955

44
fluxes of particulate organic carbon exchanged between the floodplain and Amazon 956
River. Glob. Biogeochem. Cycles 27: 119–130. 957
Moyer, R. P., J. E. Bauer, and A. G. Grottoli. 2013. Carbon isotope biogeochemistry of 958
tropical small mountainous river, estuarine, and coastal systems of Puerto Rico. 959
Biogeochemistry 112: 589–612. 960
Otto, A., and M. Simpson. 2005. Degradation and preservation of vascular plant-derived 961
biomarkers in grassland and forest soils from western Canada. Biogeochemistry 74: 962
377-409. 963
Pearson, A., and T. I. Eglinton. 2000. The origin of n-alkanes in Santa Monica Basin surface 964
sediment: a model based on compound-specific D14C and d13C data. Org. Geochem. 31: 965
1103-1116. 966
Peng, J., S. Chen, and P. Dong. 2010. Temporal variation of sediment load in the Yellow 967
River basin, China, and its impacts on the lower reaches and the river delta. CATENA 968
83: 135-147. 969
Ran, L., X. X. Lu, H. Sun, J. Han, R. Li, and J. Zhang. 2013. Spatial and seasonal variability 970
of organic carbon transport in the Yellow River, China. J. Hydrol. 498: 76-88. 971
Raymond, P. A., and J. E. Bauer. 2001. Use of 14C and 13C natural abundances for evaluating 972
riverine, estuarine, and coastal DOC and POC sources and cycling: a review and 973
synthesis. Org. Geochem. 32: 469-485. 974
Raymond, P. A., J. E. Bauer, N. F. Caraco, J. J. Cole, B. Longworth, and S. T. Petsch. 2004. 975
Controls on the variability of organic matter and dissolved inorganic carbon ages in 976
northeast US rivers. Mar. Chem. 92: 353–366. 977

45
Ruff, M., S. Szidat, H. W. Gäggeler, M. Suter, H. A. Synal, and L. Wacker. 2010. Gaseous 978
radiocarbon measurements of small samples. Nucl. Instrum. Methods Phys. Res. 268: 979
790–794. 980
Sanderman, J., K. A. Lohse, J. A. Baldock, and R. Amundson. 2009. Linking soils and 981
streams: Sources and chemistry of dissolved organic matter in a small coastal watershed. 982
Water Resour. Res. 45: 450-455. 983
Schouten, S., W. C. M. Klein Breteler, P. Blokker, N. Schogt, W. I. C. Rijpstra, K. Grice, M. 984
Baas, and J. S. Sinninghe Damsté. 1998. Biosynthetic effects on the stable carbon 985
isotopic compositions of algal lipids: Implications for deciphering the carbon isotopic 986
biomarker record. Geochim. Cosmochim. Acta 62: 1397-1406. 987
Shen, C., P. Ding, N. Wang, J. Han, S. Zhang, K. Liu, X. Ding, and D. Fu. 2007. Distribution 988
of comogenic 14C and 10Be of falling dust in beijing on april 16-17, 2006. Quat. Sci. 6: 989
919-921. 990
Tao, S., T. I. Eglinton, D. B. Montluçon, C. McIntyre, and M. Zhao. 2015. Pre-aged soil 991
organic carbon as a major component of the Yellow River suspended load: Regional 992
significance and global relevance. Earth Planet. Sci. Lett. 414: 77-86. 993
Tao, S., T. I. Eglinton, D. B. Montluçon, C. McIntyre, and M. Zhao. 2016. Diverse origins 994
and pre-depositional histories of organic matter in contemporary Chinese marginal sea 995
sediments. Geochim. Cosmochim. Acta 191: 70–88. 996
Tarnocai, C., J. G. Canadell, E. A. G. Schuur, P. Kuhry, G. Mazhitova, and S. Zimov. 2009. 997
Soil organic carbon pools in the northern circumpolar permafrost region. Glob. 998
Biogeochem. Cycles 23: GB2023. 999
Deleted: Nuclear Instruments & Methods in Physics 1000 Research1001

46
Volkman, J. K., A. T. Revill, D. G. Holdsworth, and D. Fredericks. 2008. Organic matter 1002
sources in an enclosed coastal inlet assessed using lipid biomarkers and stable isotopes. 1003
Org. Geochem. 39: 689-710. 1004
Vonk, J. E. and others 2014. Preferential burial of permafrost- derived organic carbon in 1005
Siberian- Arctic shelf waters. J. Geophys. Res. 119: 8410–8421. 1006
Voss, B. M. and others 2015. Seasonal hydrology drives rapid shifts in the flux and 1007
composition of dissolved and particulate organic carbon and major and trace ions in the 1008
Fraser River, Canada. Biogeosciences 12: 5597-5618. 1009
Wacker, L. and others 2010. MICADAS: Routine and high-precision radiocarbon dating. 1010
Radiocarbon 52: 252–262. 1011
Wang, C. L., J. Tang, H. Wang, X. Yu, and S. Mi. 2010. Analysis of the seasonal variation of 1012
the Yellow River flux and the chlorophyll concentration in Laizhou Bay in 2007, p. 1013
243-251. IITA Second International Conference on Geoscience & Remote Sensing. 1014
Wang, H., Z. Yang, Y. Saito, J. P. Liu, and X. Sun. 2006. Interannual and seasonal variation 1015
of the Huanghe (Yellow River) water discharge over the past 50 years: Connections to 1016
impacts from ENSO events and dams. Glob. Planet. Change 50: 212-225. 1017
Wang, H., Y. Saito, Y. Zhang, N. Bi, X. Sun, and Z. Yang. 2011. Recent changes of sediment 1018
flux to the western Pacific Ocean from major rivers in East and Southeast Asia. Earth Sci. 1019
Rev. 108: 80-100. 1020
Wang, X., H. Ma, R. Li, Z. Song, and J. Wu. 2012. Seasonal fluxes and source variation of 1021
organic carbon transported by two major Chinese Rivers: The Yellow River and 1022
Changjiang (Yangtze) River. Glob. Biogeochem. Cycles 26: GB2025. 1023
47
Wang, X., C. Luo, T. Ge, C. Xu, and Y. Xue. 2016. Controls on the sources and cycling of 1024
dissolved inorganic carbon in the Changjiang and Huanghe River estuaries, China: 14C 1025
and 13C studies. Limnol. Oceanogr. 61: 1358–1374. 1026
Ward, N. D. and others 2013. Degradation of terrestrially derived macromolecules in the 1027
Amazon River. Nat. Geosci. 6: 530-533. 1028
Wiesenberg, G. L. B., J. Schwarzbauer, M. W. I. Schmidt, and L. Schwark. 2004. Source and 1029
turnover of organic matter in agricultural soils derived from n-alkane/n-carboxylic acid 1030
compositions and C-isotope signatures. Org. Geochem. 35: 1371-1393. 1031
Wu, L., Y. Huh, J. Qin, G. Du, and S. van Der Lee. 2005. Chemical weathering in the Upper 1032
Huang He (Yellow River) draining the eastern Qinghai-Tibet Plateau. Geochim. 1033
Cosmochim. Acta 69: 5279-5294. 1034
Xu, J., J. Yang, and Y. Yan. 2006. Erosion and sediment yields as influenced by coupled 1035
eolian and fluvial processes: The Yellow River, China. Geomorphology 73: 1–15. 1036
Zhang, J., W. W. Huang, R. Létolle, and C. Jusserand. 1995. Major element chemistry of the 1037
Huanghe (Yellow River), China-weathering processes and chemical fluxes. J. Hydrol. 1038
168: 173-203. 1039
Zhang, L., L. Wang, W.-J. Cai, D. Liu, and Z. Yu. 2013. Impact of human activities on 1040
organic carbon transport in the Yellow River. Biogeosciences 10: 2513-2524. 1041
Zhang, X., H. Wang, H. Ru, and W. Zhao. 2010. Riparian C4 Plants on the Mainstream of the 1042
Yellow River: Assemblage Characteristics and Their Indication on the Effects of 1043
Reservoirs. Journal of Wuhan Botanical Research 28: 568–576 (in Chinese with English 1044
abstract). 1045

48
Zhao, M., J. L. Mercer, G. Eglinton, M. J. Higginson, and C. Huang. 2006. Comparative 1046
molecular biomarker assessment of phytoplankton paleoproductivity for the last 160 kyr 1047
off Cap Blanc, NW Africa. Org. Geochem. 37: 72–97. 1048
Zou, L., M.-Y. Sun, and L. Guo. 2006. Temporal variations of organic carbon inputs into the 1049
upper Yukon River: Evidence from fatty acids and their stable carbon isotopic 1050
compositions in dissolved, colloidal and particulate phases. Org. Geochem. 37: 1051
944-956. 1052
1053
Acknowledgements 1054
We would like to thank Dr. Zineng Yuan for sampling help; all members of Ion Beam 1055
Physics Laboratory at ETH for AMS measurements; Dr. Rui Bao for assistance with SA 1056
measurements, and Stewart Bishop and Madalina Jaggi for stable carbon isotope 1057
measurements. This work was supported by the National Key Research and Development 1058
Program of China (grant NO. 2016YFA0601403), by the National Natural Science 1059
Foundation of China (Grant No. 41506089, 41520104009, 41521064), the “111” Project (No. 1060
B13030), the Project Sponsored by the Scientific Research Foundation of Third Institute of 1061
Oceanography, SOA of China (NO. 2017013), and the Swiss National Science Foundation 1062
(SNF Grant No. 200021_140850). This is MCTL contribution #129. 1063
1064
Figure Captions 1065
Fig. 1. The Yellow River basin and location of the Kenli sampling station (37.68°N, 1066
118.52°E). The up-left panel is a map of the East Asia showing the Yellow River drainage 1067

49
basin, coal-bearing areas within the watershed, and Chinese marginal seas. 1068
1069
Fig. 2. Temporal variations in water discharge and TSS at the middlestream Tongguan (the 1070
boundary of the middle-lower Yellow River, blue) and downstream Lijin station (red) during 1071
2011 to 2013: (a) daily water discharge; (b) daily TSS; (c) monthly averaged discharge and 1072
(d) monthly averaged TSS. Our study period begins from June 2011 to July 2013, and 1073
includes three water and sediment regulation (WSR) periods (grey vertical bars) and two 1074
autumn natural high flow (NHF) periods (blue vertical bars). All data are provided by the 1075
YRCC (http://www.yellowriver.gov.cn/nishagonggao/). Monthly average water discharge 1076
was calculated based on the daily measurements, whereas monthly average TSS was 1077
calculated based on monthly sediment load (kg) divided by monthly discharge (Q; m3). 1078
1079
Fig. 3. (a) Temporal variations of in situ discharge, in situ TSS and concentrations of various 1080
OC components. (b) Temporal variations of in situ discharge, in situ TSS and TOC 1081
normalized contents of various OC components. The solid line represents the first year of 1082
our study and dash line represents the second year of our study. The in situ TSS 1083
concentration and discharge were measured instantaneously, the in situ discharge was the 1084
daily value in specific sampling time collected from YRCC website; TSS was determined 1085
based on the weight of SPM on the filters and the volume of water filtered in specific 1086
sampling time. 1087
1088
Fig. 4. Temporal variations in δ13C values of various biomarker compounds (n-FAs and 1089
n-alkanes) compared with that of POC from the Yellow River: (a) short-chain lipid 1090

50
biomarkers; (b) long-chain lipid biomarkers. The solid line represents the first year of our 1091
study and dash line represents the second year of our study. Note: there is a break and a 1092
change of y-axis of Figure 4a. 1093
1094
Fig. 5. Temporal variation in radiocarbon contents (expressed as Δ14C and conventional 14C 1095
age) of various biomarker compounds compared with that of POC from the Yellow River. 1096
The solid line represents the first year of our study and dash line represents the second year 1097
of our study. 1098
1099
Fig. 6. Cross-plot of the stable isotopic compositions (δ13C) versus the radiocarbon 1100
compositions (Δ14C) of different organic components for POC from the Yellow River and for 1101
other putative source organic materials from northern China and from the Yellow River 1102
watershed. The latter includes published δ13C compositions of typical C3 and C4 plants from 1103
the Chinese Loess Plateau (–27.1±2.4‰ for C3 plants, n = 39; –12.7±2.1‰ for C4 plants, n = 1104
18; Liu et al. 2005), kerogen from the Tarim Basin with numerous petroleum source rocks in 1105
northwestern China (–28.0±1.6‰, n = 10; Jia and Peng, 2005), source rock from the 1106
mountains of the Qinghai plateau located in the upstream of the Yellow River (–21.2±1.2‰; 1107
Liu et al., 2007). For comparability in δ13C between lipid biomarkers and bulk OM, a center 1108
value of 6‰ was added to δ13C values of individual lipid compounds since 13C isotopic 1109
fractionation effects (δ13Cbulk – δ13Clipid) need to be taken in account. Modern plant sources 1110
are assigned a Δ14C value of 0 ± 50‰, and ancient or fossil sources (ancient sedimentary 1111
rocks) have a Δ14C value of -1000‰. Also shown are values for dust particles collected in 1112
Beijing (Shen et al. 2007). 1113

51
1114
Fig. 7. (a) Coupled isotope mass balance results for the temporal variations of the fractional 1115
contributions of contemporary biomass, pre-aged soil and fossil OC in the Yellow River 1116
suspended matter. Data points represent average values of all possible solution derived from 1117
three endmember mixing model calculation over a range of prescribed δ13CBulk ̶ δ13Clipid 1118
offset (5–7‰). Warm and wet seasons correspond to summer June–August) and autumn 1119
(September–November), cold/dry seasons infer to winter (September–February) and spring 1120
(March ̶ May). (b) Temporal variations of fluxes of contemporary biomass, pre-aged soil and 1121
fossil OC in the Yellow River suspended matter. 1122
1123
Fig. 8. Relationships between monthly discharges (Q) and monthly fluxes of different 1124
source OC (a) and TSS (b). 1125
1126
Fig. 9. Comparison of the time-series Δ14C dataset of POC in different river systems in the 1127
world. All included data are only referred from temporal studies at fixed locations. n values 1128
indicate the number of time points: Yellow River (this study); Changjiang (Wang et al. 1129
2012); Amazon (Mayorga et al. 2005; Moreira-Turcq et al. 2013); Mekong (Martin et al. 1130
2013); Brahmaputra, Ganges and their tributaries such as Karnali, Kosi and Narayani 1131
(Ganges-Brahmaputra basin) (Galy and Eglinton 2011); Lanyang His (Kao and Liu 1996); 1132
Hudson, Parker and York Rivers (U.S.A.) (Raymond et al. 2004); Rio Loco and Rio 1133
Fajardo Rivers (Puerto Rico) (Moyer et al. 2013); East River, West River and their 1134
tributaries such as Ptamigan and Goose (Cape Bounty Arctic Watershed) (Lamoureux and 1135
Lafrenière 2014). 1136

52
1137

53
Tables 1138
Table 1. Sampling information and bulk organic carbon characteristics. 1139
Month Sampling date Description POC% Surface area
[m2/g]
Monthly discharge
[m3/s]
Monthly TSS
[g/L]
2011
June* 2011/06/28 WSR 0.40 20.4 1820 10.26
September 2011/09/22 Flood event 0.33 17.3 1016 7.93
November 2011/11/17 0.45 27.4 998 1.96
2012
January 2012/01/13 0.32 18.1 703 1.94
April 2012/04/22 0.47 28.8 288 1.76
June 2012/06/19 0.27 16.8 1324 6.96
June* 2012/06/27 WSR 0.32 18.4
October 2012/10/13 0.30 24.3 898 4.15
2013
January 2013/01/ 04 0.26 22.1 592 0.85
April 2013/04/28 0.37 25.9 261 1.55
June 2013/06/19 0.28 20.2 1623 7.74
July* 2013/07/04 WSR 0.31 24.8
* WSR: water and sediment regulation period 1140
1141
1142

54
Table 2. Results from the Monte Carlo source apportionment calculations (given as mean ± 1143
standard deviation) for the total contemporary biomass OC in two SPM exported by the 1144
Yellow River (October 2012 and April 2013). The end-members and the standard deviations 1145
used in the simulations are further explained and referred to in the main text. 1146
Month Season Fractions
Faquatic fC3 fC4
October 2012 Autumn 0.29±0.03 0.31±0.10 0.40±0.10
April 2013 Spring 0.46±0.02 0.13±0.06 0.41±0.06
1147 1148

55
Table 3. Monthly TSS fluxes and estimated monthly fluxes of modern biomass OC, 1149
pre-aged soil OC and fossil OC carried by the Yellow River SPM. 1150
Month Monthly Q
[108 m3]
Monthly TSS
[Mt]
Modern OC
[104 t/yr]
Pre-aged OC
[104 t/yr]
Fossil OC
[104 t/yr]
June 17.06 17.50 1.19±0.73 3.32±2.27 2.44±1.47
July 28.12 26.50 0.83±1.22 2.32±3.81 1.45±2.47
August 12.35 1.57 0.11±0.56 0.29±1.76 0.19±1.14
September 27.73 22.00 0.81±1.2 2.24±3.75 1.41±2.43
October 32.14 12.00 1.14±1.44 3.21±4.50 2.00±2.91
November 24.60 4.82 0.61±1.05 1.66±3.27 1.05±2.12
December 27.86 7.42 0.82±1.21 2.26±3.77 1.42±2.45
January 19.34 3.75 0.34±0.82 0.89±2.55 0.58±1.66
February 7.31 0.66 0.03±0.43 0.15±1.33 0.08±0.87
March 9.24 1.31 0.05±0.47 0.17±1.48 0.11±0.96
April 7.78 1.37 0.03±0.44 0.15±1.36 0.08±0.89
May 14.60 3.16 0.16±0.64 0.43±1.99 0.29±1.29
2011.6~2012.5 228.1 102.1 6.1±0.64 (18%) 17.1±6.4(50%) 11.1±9.9(32%)
June 34.21 23.80 1.31±1.56 3.74±4.87 2.31±3.16
July 53.57 56.50 3.58±2.99 10.62±9.33 6.43±6.02
August 47.94 65.90 2.80±2.52 8.25±7.86 5.02±5.07
September 30.33 10.60 0.99±1.34 2.79±4.18 1.74±2.71
October 22.47 9.32 0.49±0.95 1.32±2.96 0.84±1.92
November 14.59 2.62 0.16±0.64 0.43±1.99 0.28±1.29
December 20.89 4.04 0.41±0.88 1.09±2.75 0.70±1.79
January 15.13 1.29 0.18±0.66 0.47±2.05 0.31±1.33
February 14.90 2.34 0.17±0.65 0.46±2.02 0.30±1.32
March 10.10 1.56 0.06±0.50 0.20±1.55 0.12±1.01
April 7.05 1.09 0.03±0.42 0.15±1.31 0.08±0.85
May 8.76 1.42 0.04±0.46 0.16±1.44 0.10±0.94

56
June 36.55 28.30 1.53±1.71 4.38±5.32 2.70±3.45
2012.6~2013.5 279.9 180.5 10.2±4.8(18%) 29.7±14.4 (51%) 18.2±15.0(31%)
1151

Ele
va
tion
m()
-5
60
0
12
00
18
00
24
00
30
00
36
00
42
00
63
00
Lijin
He
ko
u
La
nzh
ou
To
ng
gu
an
Ke
nli1
20
96
11
811
611
411
211
01
08
10
61
04
10
21
00
98
444240383634
!
Ch
ine
se
Se
as
Hua
ngH
e
Co
al
be
arin
g_
Sa
mp
ling
site
s
Da
ms
Ga
ug
ing
sta
tion
s
Bo
ha
iS
ea
Ba
ya
nka
laM
t.
Qilia
nM
t.
An
ym
aq
en
Mt.
Tib
et
Pla
tea
u
He
lan
Mt.
Yin
Mt.
Hu
an
gH
ua
iH
ai
--
Pla
in
Lo
es
sP
late
au
Ho
bq
De
se
rt
Mu
Us
De
se
rt
Liu
lian
gM
t.
Hu
ay
ua
nk
ou
Xia
ola
ng
di
Sa
nm
en
gx
ia
Lo
es
sP
late
au
Up
stre
am
Mid
dle
stre
am
Do
wn
stre
am


CF
A1
6C
FA
18
CA
lka
ne
17
CF
As
26
+2
8+
30
CA
lka
ne
s2
7+
29
+3
1C
Alk
an
ols
24
+2
6+
28
CA
lka
ne
s2
6+
28
+3
0C
Alk
an
es
20
+2
2+
24

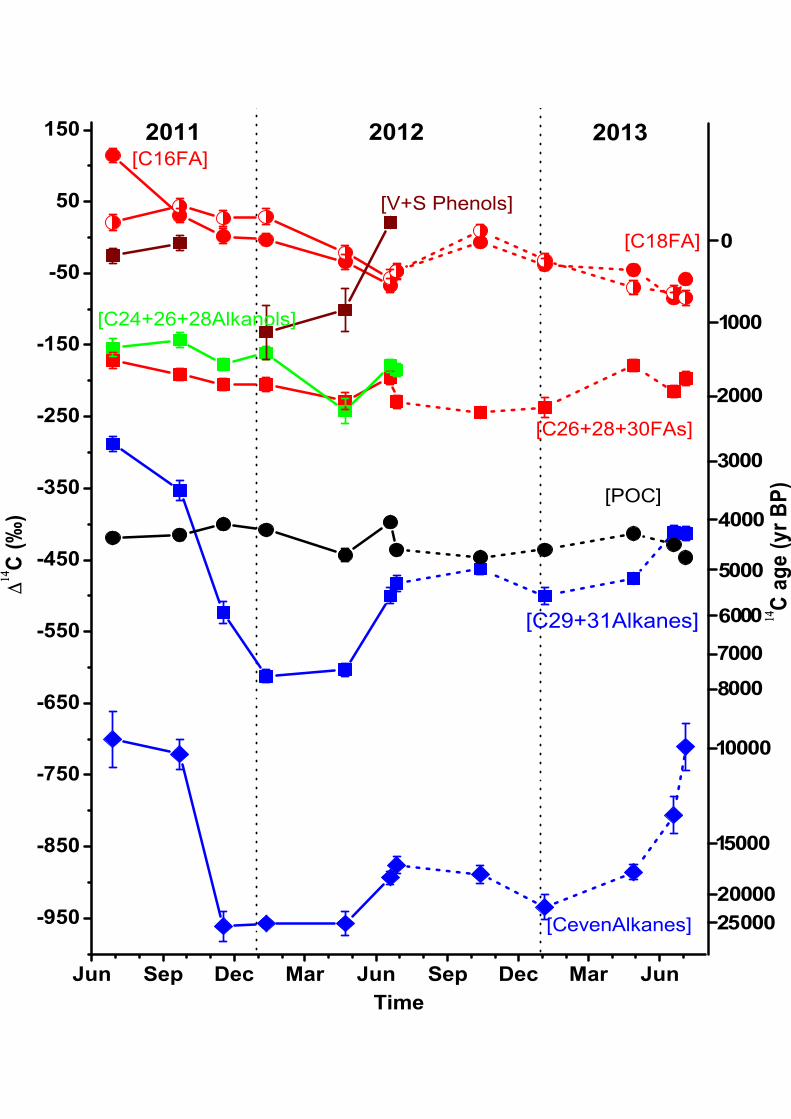
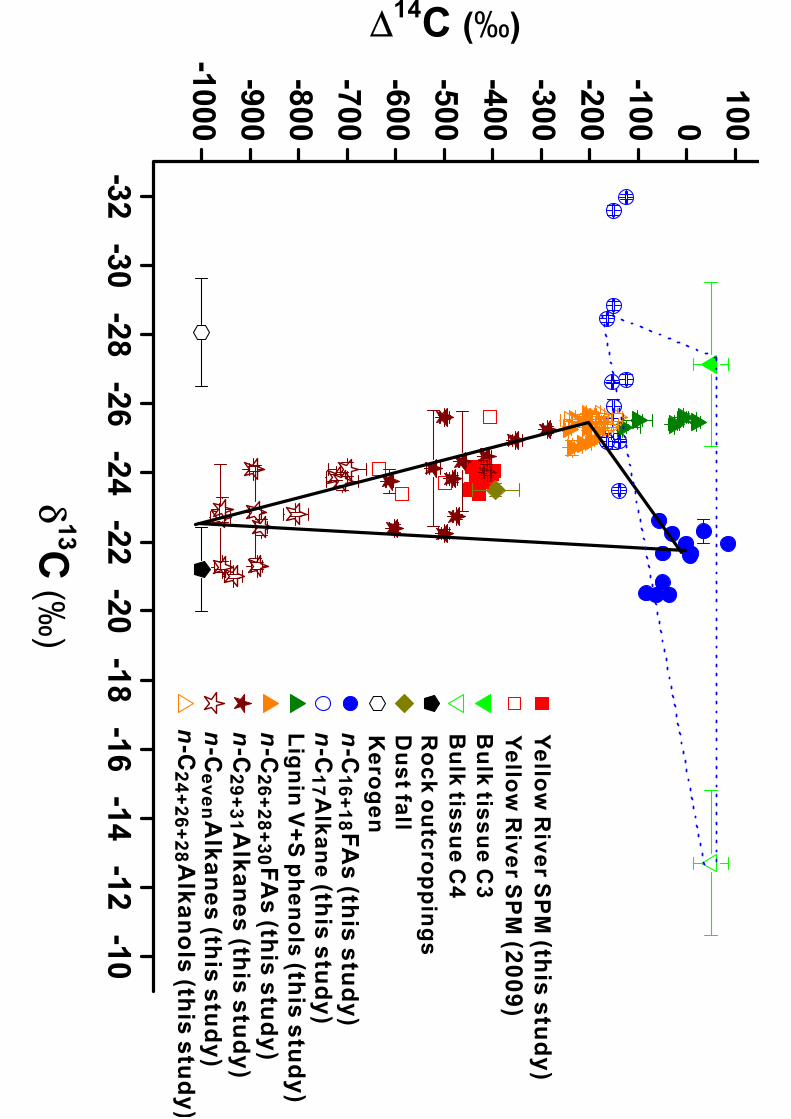
n-C
FA
s (th
is s
tud
y)
16
+1
8
n-C
(this
stu
dy
)1
7A
lka
ne
n-C
FA
s (th
is s
tud
y)
26
+2
8+
30
n-C
Alk
an
es (th
is s
tud
y)
29
+3
1
n-C
Alk
an
es
(this
stu
dy
)e
ve
n
n-C
Alk
an
ols
(this
stu
dy
)2
4+
26
+2
8
Lig
nin
V+
S p
he
no
ls(th
is s
tud
y)
Ye
llow
Riv
er S
PM
(this
stu
dy
)Y
ello
w R
ive
r SP
M(2
00
9)
Bu
lk tis
su
e C
3B
ulk
tiss
ue
C4
Ro
ck
ou
tcro
pp
ing
sD
us
t fall
Ke
rog
en


1
1

1
1


Supplementary information (SI) 1
Content (Caption): 2
The supplementary materials include four figures and one table: 3
Fig. S1. Hierarchical cluster analysis on TOC normalized contents of different lipid biomarkers. 4
Fig. S2. Hierarchical cluster analysis on stable carbon isotopes of different lipid biomarkers. 5
Fig. S3. Plots of typical biomarker stable carbon and radiocarbon isotopic compositions v.s. monthly discharge and 6
monthly TSS. 7
Fig. S4. Examples of Monte Carlo probability density functions for the fractions fB, fS and fF to the POC from the 8
Yellow River at different times. 9
Table S1. Coupled isotope mass balance results from the Monte Carlo source apportionment calculations for the 10
fractional contributions of three different OC components.11

Figures 1
2
3
4
Fig. S1. Hierarchical cluster analysis on TOC normalized contents of different lipid biomarkers. (a) n-FAs, (b) 5
n-alkanols and (c) n-alkanes. 6
7
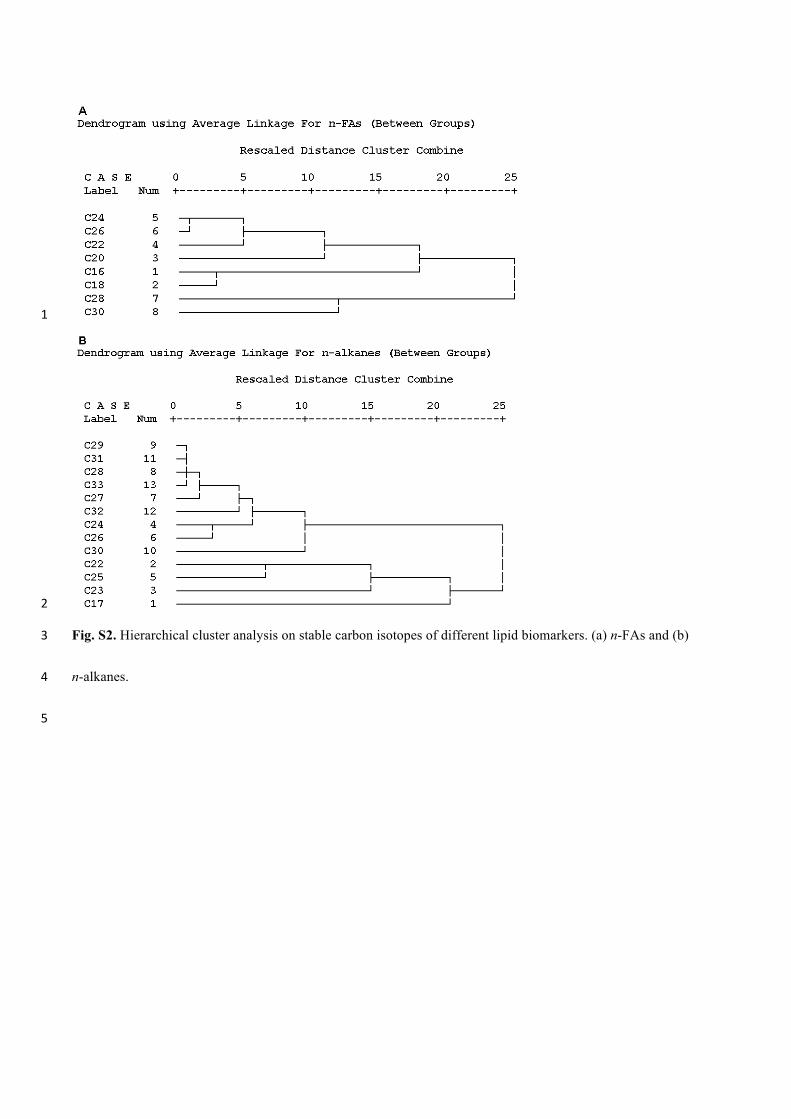
1
2
Fig. S2. Hierarchical cluster analysis on stable carbon isotopes of different lipid biomarkers. (a) n-FAs and (b) 3
n-alkanes. 4
5

1
2
3
4
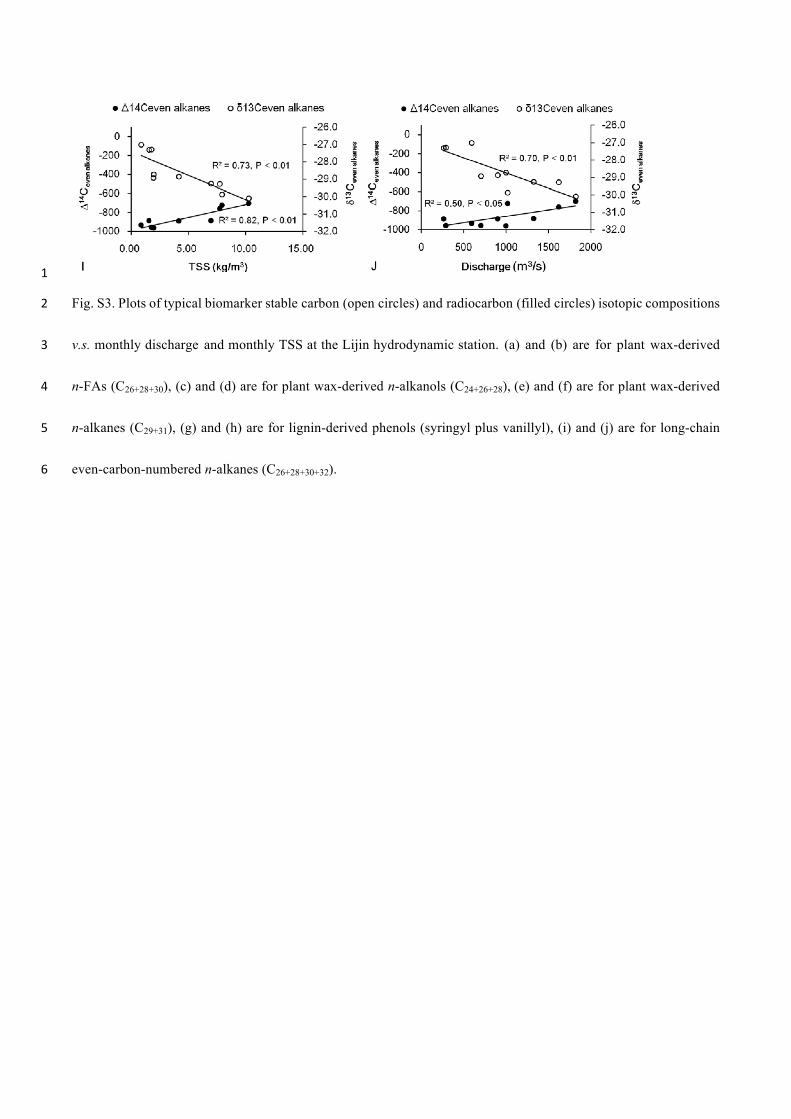
1
Fig. S3. Plots of typical biomarker stable carbon (open circles) and radiocarbon (filled circles) isotopic compositions 2
v.s. monthly discharge and monthly TSS at the Lijin hydrodynamic station. (a) and (b) are for plant wax-derived 3
n-FAs (C26+28+30), (c) and (d) are for plant wax-derived n-alkanols (C24+26+28), (e) and (f) are for plant wax-derived 4
n-alkanes (C29+31), (g) and (h) are for lignin-derived phenols (syringyl plus vanillyl), (i) and (j) are for long-chain 5
even-carbon-numbered n-alkanes (C26+28+30+32). 6

1
Fig. S4. Examples of Monte Carlo probability density functions for the fractions fB, fS and fF to the POC from the 2
Yellow River at different times: (a) October 2012, (b) January 2013, (c) April 2013 and (d) June 2013. Dashed 3
vertical lines show the mean values plus and minus one standard deviation (vertical lines). 4
5
6
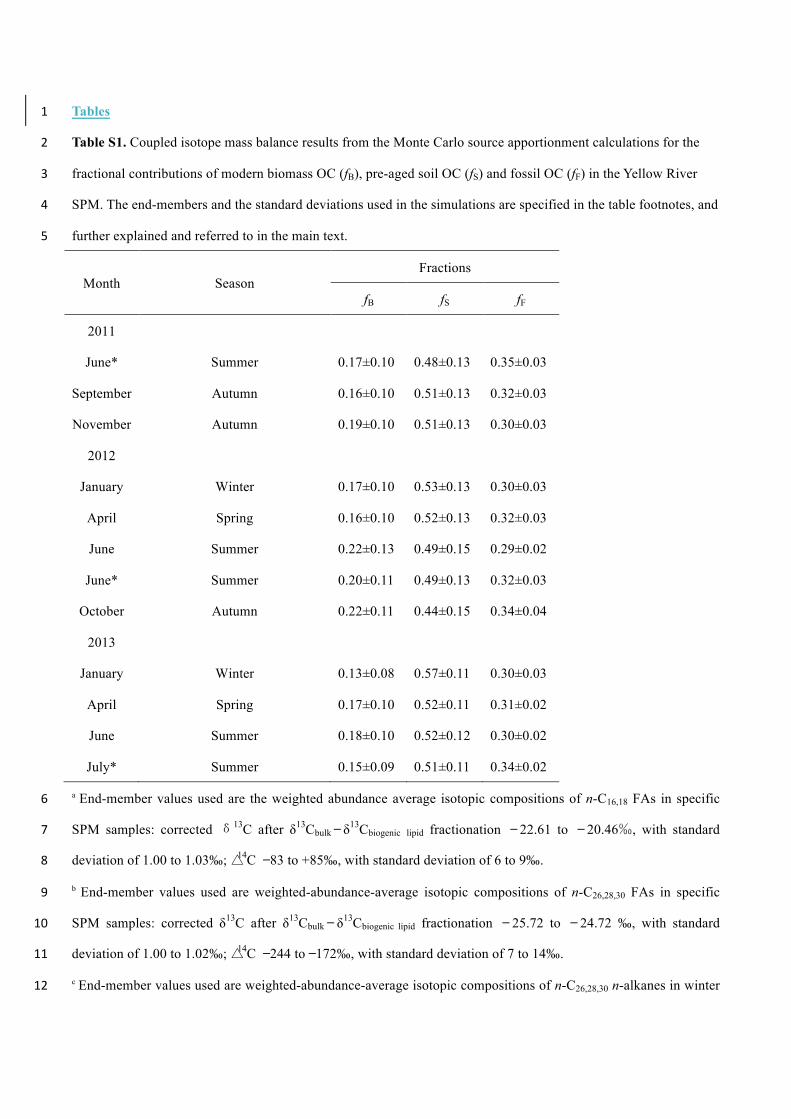
Tables 1
Table S1. Coupled isotope mass balance results from the Monte Carlo source apportionment calculations for the 2
fractional contributions of modern biomass OC (fB), pre-aged soil OC (fS) and fossil OC (fF) in the Yellow River 3
SPM. The end-members and the standard deviations used in the simulations are specified in the table footnotes, and 4
further explained and referred to in the main text. 5
Month Season Fractions
fB fS fF
2011
June* Summer 0.17±0.10 0.48±0.13 0.35±0.03
September Autumn 0.16±0.10 0.51±0.13 0.32±0.03
November Autumn 0.19±0.10 0.51±0.13 0.30±0.03
2012
January Winter 0.17±0.10 0.53±0.13 0.30±0.03
April Spring 0.16±0.10 0.52±0.13 0.32±0.03
June Summer 0.22±0.13 0.49±0.15 0.29±0.02
June* Summer 0.20±0.11 0.49±0.13 0.32±0.03
October Autumn 0.22±0.11 0.44±0.15 0.34±0.04
2013
January Winter 0.13±0.08 0.57±0.11 0.30±0.03
April Spring 0.17±0.10 0.52±0.11 0.31±0.02
June Summer 0.18±0.10 0.52±0.12 0.30±0.02
July* Summer 0.15±0.09 0.51±0.11 0.34±0.02
a End-member values used are the weighted abundance average isotopic compositions of n-C16,18 FAs in specific 6
SPM samples: corrected δ13C after δ13Cbulk ̶ δ13Cbiogenic lipid fractionation ̶ 22.61 to ̶ 20.46‰, with standard 7
deviation of 1.00 to 1.03‰; △14C ̶ 83 to +85‰, with standard deviation of 6 to 9‰. 8
b End-member values used are weighted-abundance-average isotopic compositions of n-C26,28,30 FAs in specific 9
SPM samples: corrected δ13C after δ13Cbulk ̶ δ13Cbiogenic lipid fractionation ̶ 25.72 to ̶ 24.72 ‰, with standard 10
deviation of 1.00 to 1.02‰; △14C ̶ 244 to ̶172‰, with standard deviation of 7 to 14‰. 11
c End-member values used are weighted-abundance-average isotopic compositions of n-C26,28,30 n-alkanes in winter 12

and spring SPM samples: corrected δ13C after δ13Cbulk ̶ δ13Cpetrogenic lipid offset ̶ 22.00‰, with standard deviation of 1
1.07‰; △14C ̶ 1000‰, with standard deviation of 21‰. 2
3