tanf spending factsheet state by state - peer ta network · pdf filein a given year varies...
TRANSCRIPT

The value of the TANF block grant has declined while need remains high.
State TANF Block Grant amounts, after adjusting for inflation, eroded by 25 percent between fiscal years 1997 and
2009 and by 28 percent by 2011.
The block grant did not rise or fall to meet Connecticut's changing needs. In 2008-09, 41,308 Connecticut families with
children lived in poverty. The number of families in poverty reached a low of 37,000 in 1999-00 and a high of 56,000 in
1996-97.
The amount of federal TANF and state maintenance-of-effort (MOE) funds spent
in a given year varies over time and reflects the condition of the economy and
state policy and budgeting choices.
Spending from federal TANF Block Grant in
Connecticut has remained relatively flat since
the creation of TANF while MOE spending has
increased slightly in recent years.
MOE and Block Grant Spending in Connecticut
2009 Federal TANF Allocations
TANF Block Grant Amount 267
TANF Supplemental Grant n/a
Contingency Fund 0
Emergency Fund 0
MOE Obligation
80% MOE Obligation 196
75% MOE Obligation 183
MOE and Block Grant Spending in Connecticut
In millions of dollars FY 2001 FY 2009
Total Federal TANF Funds Used 256 267
TANF Funds spent 229 240
Funds transferred to SSBG 27 27
Funds transferred to CCDBG 0 0
Reported MOE Spending 183 237
Additional background on TANF and MOE funds and technical notes for this fact
sheet are available in following pages.

Use of federal TANF and state MOE funds has changed over time.
Total Spending by Category in Connecticut
Trends in Selected Spending Categories
(in millions of dollars and as a percentage of spending)
FY 2001 FY 2009
Reported Spending
Percentage of Total Funds Used
Reported Spending
Percentage of Total Funds Used
Basic Assistance 151 34% 89 18%
Administration and Systems 35 8% 37 7%
Work-related Activities and Supports 27 6% 25 5%
Child Care 96 22% 27 5%
Pregnancy Prevention & 2-Parent Family Formation and Maintenance
21 5% 82 16%
Authorized under Prior Law and Other Nonassistance 82 19% 218 43%
In fiscal year 2009, Connecticut spent 18 percent of its TANF/MOE expenditures on Basic Assistance, 10 percentage
points below the national average for spending in this category. Connecticut has decreased its Basic Assistance
spending by 41 percent since 2001.
Connecticut spent 43 percent of its TANF/MOE expenditures, in the combined Authorized Under Prior Law/Other
Nonassistance spending category in fiscal year 2009. Most of this spending was reported as Other Nonassistance. This
is an increase of nearly $136 million from fiscal year 2001. The substantial increase in reported spending in this
category first occurred between fiscal years 2006 and 2007, shortly after the DRA was implemented.
Over the years, Connecticut has pulled back TANF/MOE spending on Child Care and now spends less than a third of
what it spent in the late 1990s. In 2009, Connecticut spent 5 percent of its TANF and MOE expenditures on Child Care,
less than one-third of the national average for spending in this category.

Federal TANF Funds:
Each state gets a fixed annual TANF Block Grant (known formally as the State Family Assistance Grant) allocation each
year. In addition, some states may get additional TANF federal funds in a year from:
o Supplemental Grants: Congress created the Supplemental Grants along with the TANF block grant in order to
provide additional funds to states potentially disadvantaged by the block grant formula, either due to high
population growth or because the state historically had provided relatively small cash grants. Seventeen states
receive Supplemental Grants. The amount they receive was constant each year until 2011, when the
Supplemental Grants were not fully funded.
o Contingency Fund: Congress created the Contingency Fund as part of the 1996 TANF law to provide additional
help to states in hard economic times. Over a third of states received TANF Contingency Funds in 2009.
o Emergency Fund: Congress created the Emergency Fund as part of the 2009 Recovery Act to reimburse
states for 80 percent of increased TANF or MOE funding. Every state but one received support from the Fund
in 2009 or 2010. The Fund expired on September 30, 2010.
o High Performance Bonus. Through 2004, states could receive additional federal TANF funds for strong
performance in meeting the objectives of TANF.
States can carry over TANF funds (except for Contingency Funds) from year to year, so a state may spend more or less
than the federal TANF allocation in a given year.
A state can transfer up to 30 percent of its block grant funds for a year to the Child Care and Development Block Grant
(CCDBG) and up to 10 percent to the Social Services Block Grant (SSBG), provided that the total amount transferred
does not exceed 30 percent of its current-year block grant.
The Tribal TANF option allows federally recognized American Indian Tribes within a state, as well as Alaska Native
organizations, to receive a portion of the state’s TANF block grant directly and then use it to operate their own TANF
programs.
Maintenance-of-Effort (MOE) Requirement:
Each year, a state is required to meet a TANF maintenance-of-effort (MOE) obligation. The amount is based on its
historical spending, defined as its 1994 contribution to Aid to Families with Dependent Children (AFDC) and related work
programs. States can count as MOE spending any state or third-party spending that benefits members of needy families
and meets one of the four purposes of TANF. MOE funds must be spent during the year in which they are claimed.
To meet its MOE obligation, a state must spend at least 80 percent of its historical spending. This minimum share is
reduced to 75 percent for any year in which a state meets the TANF Work Participation Rate (WPR). In order to qualify
for the Contingency Fund, a state must meet a 100 percent MOE requirement. Spending on child care and certain non-
TANF programs does not count toward this special Contingency Fund MOE requirement.
Using a formula used by the federal government, states can translate any MOE spending in excess of their minimum
MOE requirement into a caseload reduction credit. This helps a state to meet its WPR because the WPR a state must
achieve is reduced by one percentage point for every percentage point reduction in the caseload since 2005.
The Deficit Reduction Act of 2005 made it harder for states to meet the TANF WPR. In order to boost their caseload
reduction credit, some states found it advantageous to report MOE they had not previously reported. Once the
recession hit, some states also reported additional MOE in order to be eligible for TANF Contingency Funds. When
states more aggressively identify and report additional MOE spending, it appears to increase total TANF/MOE spending,
even if no actual increase in spending occurred. If the excess MOE spending is reported in just a few spending
categories, it will significantly change the apportionment of spending across categories.

Guide to Spending Categories
CBPP Category Federal Reporting Categories
Basic Assistance Basic Assistance
Administration and Systems Administration
Systems
Work-related Activities and Supports1
Work Subsidies
Education and Training
Other Work Activities/Expenses
Transportation (all categories) and Other Supportive Services
Individual Development Accounts
Child Care Child Care Assistance and Nonassistance
Funds Transferred to Child Care and Development Fund
Refundable Tax Credits Refundable Earned Income Tax Credit
Other Refundable Tax Credits
Nonrecurrent Short-Term Benefits Nonrecurrent Short-Term Benefits
Pregnancy Prevention& 2-Parent Family Formation and
Maintenance
Prevention of Out-of-Wedlock Pregnancies
Two-Parent Family Formation and Maintenance
Transferred to Social Services Block Grant Transferred to Social Services Block Grant
Authorized Under Prior Law and Other Nonassistance2,3 Assistance and Non-Assistance Solely Under Prior Law
Other Nonassistance
1 Federal reporting categories separate Assistance and Nonassistance; we combined them for analysis. 2 Spending on certain pre-TANF activities are permissible even if the expenditures are not otherwise consistent with the purposes of TANF and/or with the
prohibitions included in the 1996 welfare law. This spending has been reported as Authorized Under Prior Law since fiscal year 2000. 3Prior to fiscal year 2000, states reported Other instead of Other Nonassistance. Other Nonassistance is a catch-all category for expenditures that meet
one of the purposes of TANF and which do not fit in any other reporting category.
Spending Data Technical Notes Data Source: U.S. Department of Health and Human Services and the Center for Law and Social Policy DataFinder and
TANF Spending Analysis.
When the Total Federal Funds Used exceed the federal Block Grant amount it may be because the state spent funds it
had in reserve from previous years or it received additional funds from the TANF Contingency Fund or the TANF
Emergency Fund. In some instances, a state was not awarded the Emergency Funds until 2010 for increased
TANF/MOE spending that occurred in 2009.
The TANF Block Grant Amount line in the MOE and Block Grant Spending graph includes Supplemental Grants but
excludes Tribal TANF. (Tribal TANF spending is not included in the spending analysis.)
States can report adjustments for prior years that may appear as “negative expenditures” in the current year. If such
negative adjustments exceed current spending in a category, that category will show negative expenditures for the year.
In most cases, this reflects changes in the funding stream which expenditures are charged against, rather than real
reductions in funds available for an activity. However, in some cases funds may have been recovered from a program or
transferred back from SSBG or CCDBG to TANF. For the purposes of the tables, negative expenditures are included as
reported by ACF. For the purposes of the charts, negative expenditures are treated as equal to zero.
Poverty Data Technical Notes
Data Source: Current Population Survey (CPS). Two years of Current Population Survey (CPS) data were merged to
improve reliability. For example, 2008-09 represents merged CPS poverty data for calendar years 2008 and 2009.

The value of the TANF block grant has declined while need remains high.
State TANF Block Grant amounts, after adjusting for inflation, eroded by 25 percent between fiscal years 1997 and
2009 and by 28 percent by 2011.
The block grant did not rise or fall to meet Delaware's changing needs. In 2008-09, 15,632 Delaware families with
children lived in poverty. The number of families in poverty reached a low of 10,000 in 2000-01 and a high of nearly
16,000 in 2008-09.
The amount of federal TANF and state maintenance-of-effort (MOE) funds spent
in a given year varies over time and reflects the condition of the economy and
state policy and budgeting choices.
Delaware spending from the TANF Block
Grant dropped sharply in 2007 and 2008 but
increased it in 2009.
MOE and Block Grant Spending in Delaware
The data for Delaware's MOE spending in
2009 appears to be incomplete so it is difficult
to draw a conclusion for that year. From 2006-
2008, MOE Delaware claimed substantially
more than the minimum MOE requirement of
75 or 80 percent of historic state spending,
although the increased MOE claimed in recent
years does not necessarily represent any
increase in state financial effort or in benefits or
services available to needy families.
2009 Federal TANF Allocations
TANF Block Grant Amount 32
TANF Supplemental Grant n/a
Contingency Fund 6
Emergency Fund 0
MOE Obligation
80% MOE Obligation 23
75% MOE Obligation 22
MOE and Block Grant Spending in Delaware
In millions of dollars FY 2001 FY 2009
Total Federal TANF Funds Used 34 43
TANF Funds spent 31 34
Funds transferred to SSBG 4 3
Funds transferred to CCDBG -2 -2
Reported MOE Spending 25 19
Additional background on TANF and MOE funds and technical notes for this fact
sheet are available in following pages.

Use of federal TANF and state MOE funds has changed over time.
Total Spending
by Category in Delaware
(in
Trends in Selected Spending Categories
millions of dollars and as a percentage of spending)
FY 2001 FY 2009
Reported Spending
Percentage of Total Funds Used
Reported Spending
Percentage of Total Funds Used
Basic Assistance 21 35% 18 29%
Administration and Systems 7 12% 7 12%
Work-related Activities and Supports 12 20% 1 1%
Child Care 15 26% 31 49%
Pregnancy Prevention Maintenance
& 2-Parent Family Formation and 0 0% 0 0%
Authorized under Prior Law and Other Nonassistance 0 0% 1 1%
In fiscal year 2009, Delaware spent 29 percent of its TANF/MOE expenditures on Basic Assistance. Delaware has
decreased its Basic Assistance spending by 12 percent since 2001.
Delaware spent 49 percent of its TANF/MOE expenditures in the Child Care category in fiscal year 2009. Child Care
spending increased by nearly $16 million from fiscal year 2001. Delaware spends a higher percentage of funds in the
Child Care category than any other state.

Federal TANF Funds:
Each state gets a fixed annual TANF Block Grant (known formally as the State Family Assistance Grant) allocation each
year. In addition, some states may get additional TANF federal funds in a year from:
o Supplemental Grants: Congress created the Supplemental Grants along with the TANF block grant in order to
provide additional funds to states potentially disadvantaged by the block grant formula, either due to high
population growth or because the state historically had provided relatively small cash grants. Seventeen states
receive Supplemental Grants. The amount they receive was constant each year until 2011, when the
Supplemental Grants were not fully funded.
o Contingency Fund: Congress created the Contingency Fund as part of the 1996 TANF law to provide additional
help to states in hard economic times. Over a third of states received TANF Contingency Funds in 2009.
o Emergency Fund: Congress created the Emergency Fund as part of the 2009 Recovery Act to reimburse
states for 80 percent of increased TANF or MOE funding. Every state but one received support from the Fund
in 2009 or 2010. The Fund expired on September 30, 2010.
o High Performance Bonus. Through 2004, states could receive additional federal TANF funds for strong
performance in meeting the objectives of TANF.
States can carry over TANF funds (except for Contingency Funds) from year to year, so a state may spend more or less
than the federal TANF allocation in a given year.
A state can transfer up to 30 percent of its block grant funds for a year to the Child Care and Development Block Grant
(CCDBG) and up to 10 percent to the Social Services Block Grant (SSBG), provided that the total amount transferred
does not exceed 30 percent of its current-year block grant.
The Tribal TANF option allows federally recognized American Indian Tribes within a state, as well as Alaska Native
organizations, to receive a portion of the state’s TANF block grant directly and then use it to operate their own TANF
programs.
Maintenance-of-Effort (MOE) Requirement:
Each year, a state is required to meet a TANF maintenance-of-effort (MOE) obligation. The amount is based on its
historical spending, defined as its 1994 contribution to Aid to Families with Dependent Children (AFDC) and related work
programs. States can count as MOE spending any state or third-party spending that benefits members of needy families
and meets one of the four purposes of TANF. MOE funds must be spent during the year in which they are claimed.
To meet its MOE obligation, a state must spend at least 80 percent of its historical spending. This minimum share is
reduced to 75 percent for any year in which a state meets the TANF Work Participation Rate (WPR). In order to qualify
for the Contingency Fund, a state must meet a 100 percent MOE requirement. Spending on child care and certain non-
TANF programs does not count toward this special Contingency Fund MOE requirement.
Using a formula used by the federal government, states can translate any MOE spending in excess of their minimum
MOE requirement into a caseload reduction credit. This helps a state to meet its WPR because the WPR a state must
achieve is reduced by one percentage point for every percentage point reduction in the caseload since 2005.
The Deficit Reduction Act of 2005 made it harder for states to meet the TANF WPR. In order to boost their caseload
reduction credit, some states found it advantageous to report MOE they had not previously reported. Once the
recession hit, some states also reported additional MOE in order to be eligible for TANF Contingency Funds. When
states more aggressively identify and report additional MOE spending, it appears to increase total TANF/MOE spending,
even if no actual increase in spending occurred. If the excess MOE spending is reported in just a few spending
categories, it will significantly change the apportionment of spending across categories.

Guide to Spending Categories
CBPP Category Federal Reporting Categories
Basic Assistance Basic Assistance
Administration and Systems Administration
Systems
Work-related Activities and Supports1
Work Subsidies
Education and Training
Other Work Activities/Expenses
Transportation (all categories) and Other Supportive Services
Individual Development Accounts
Child Care Child Care Assistance and Nonassistance
Funds Transferred to Child Care and Development Fund
Refundable Tax Credits Refundable Earned Income Tax Credit
Other Refundable Tax Credits
Nonrecurrent Short-Term Benefits Nonrecurrent Short-Term Benefits
Pregnancy Prevention& 2-Parent Family Formation and
Maintenance
Prevention of Out-of-Wedlock Pregnancies
Two-Parent Family Formation and Maintenance
Transferred to Social Services Block Grant Transferred to Social Services Block Grant
Authorized Under Prior Law and Other Nonassistance2,3 Assistance and Non-Assistance Solely Under Prior Law
Other Nonassistance
1 Federal reporting categories separate Assistance and Nonassistance; we combined them for analysis. 2 Spending on certain pre-TANF activities are permissible even if the expenditures are not otherwise consistent with the purposes of TANF and/or with the
prohibitions included in the 1996 welfare law. This spending has been reported as Authorized Under Prior Law since fiscal year 2000. 3Prior to fiscal year 2000, states reported Other instead of Other Nonassistance. Other Nonassistance is a catch-all category for expenditures that meet
one of the purposes of TANF and which do not fit in any other reporting category.
Spending Data Technical Notes Data Source: U.S. Department of Health and Human Services and the Center for Law and Social Policy DataFinder and
TANF Spending Analysis.
When the Total Federal Funds Used exceed the federal Block Grant amount it may be because the state spent funds it
had in reserve from previous years or it received additional funds from the TANF Contingency Fund or the TANF
Emergency Fund. In some instances, a state was not awarded the Emergency Funds until 2010 for increased
TANF/MOE spending that occurred in 2009.
The TANF Block Grant Amount line in the MOE and Block Grant Spending graph includes Supplemental Grants but
excludes Tribal TANF. (Tribal TANF spending is not included in the spending analysis.)
States can report adjustments for prior years that may appear as “negative expenditures” in the current year. If such
negative adjustments exceed current spending in a category, that category will show negative expenditures for the year.
In most cases, this reflects changes in the funding stream which expenditures are charged against, rather than real
reductions in funds available for an activity. However, in some cases funds may have been recovered from a program or
transferred back from SSBG or CCDBG to TANF. For the purposes of the tables, negative expenditures are included as
reported by ACF. For the purposes of the charts, negative expenditures are treated as equal to zero.
Poverty Data Technical Notes
Data Source: Current Population Survey (CPS). Two years of Current Population Survey (CPS) data were merged to
improve reliability. For example, 2008-09 represents merged CPS poverty data for calendar years 2008 and 2009.

The value of the TANF block grant has declined while need remains high.
State TANF Block Grant amounts, after adjusting for inflation, eroded by 25 percent between fiscal years 1997 and
2009 and by 28 percent by 2011.
The block grant did not rise or fall to meet Dist. of Col.'s changing needs. In 2008-09, 13,463 Dist. of Col. families with
children lived in poverty. The number of families in poverty reached a low of 12,000 in 1999-00 and a high of 20,000 in
1996-97.
The amount of federal TANF and state maintenance-of-effort (MOE) funds spent
in a given year varies over time and reflects the condition of the economy and
state policy and budgeting choices.
Spending from federal TANF Block Grant in
the District of Columbia increased during the
2001-02 recession and during the recent
recession.
MOE and Block Grant Spending in Dist. of Col.
The District of Columbia served a substantial
portion of its caseload in a solely state-funded
program using no TANF or MOE funds in
response to the Deficit Reduction Act so the
TANF and MOE spending levels after 2007 do
not fully reflect the District's spending on needy
families.
MOE and Block Grant Spending in Dist. of Col.
In millions of dollars FY 2001 FY 2009
Total Federal TANF Funds Used 115 101
TANF Funds spent 92 97
Funds transferred to SSBG 4 4
Funds transferred to CCDBG 19 19
Reported MOE Spending 75 76
Additional background on TANF and MOE funds and technical notes for this fact
sheet are available in following pages.
2009 Federal TANF Allocations
TANF Block Grant Amount 93
TANF Supplemental Grant n/a
Contingency Fund 0
Emergency Fund 1
MOE Obligation
80% MOE Obligation 75
75% MOE Obligation 70

Use of federal TANF and state MOE funds has changed over time.
Total Spending by Category in Dist. of Col.
Trends in Selected Spending Categories
(in millions of dollars and as a percentage of spending)
FY 2001 FY 2009
Reported Spending
Percentage of Total Funds Used
Reported Spending
Percentage of Total Funds Used
Basic Assistance 67 35% 23 13%
Administration and Systems 17 9% 12 7%
Work-related Activities and Supports 23 12% 21 12%
Child Care 62 33% 81 46%
Pregnancy Prevention & 2-Parent Family Formation and Maintenance
12 6% 12 7%
Authorized under Prior Law and Other Nonassistance 4 2% 20 11%
In fiscal year 2009, the District of Columbia spent 13 percent of its TANF/MOE expenditures on Basic Assistance.
Because the District provided assistance to a substantial portion of families outside of TANF or MOE funds, the
decreased spending on Basic Assistance does not represent the complete picture here.
The District of Columbia spent 46 percent of its TANF/MOE expenditures in the Child Care category in fiscal year 2009.
This is an increase of nearly $19 million from fiscal year 2001. The amount of spending on Child Care has fluctuated
between $58 million and $81 million in the last five years.
Spending on basic assistance dropped from 2007 onwards in the wake of the DRA due to the District of Columbia's
serving a large share of cash assistance families in a solely state-funded program that does not use TANF or MOE funds.

Federal TANF Funds:
Each state gets a fixed annual TANF Block Grant (known formally as the State Family Assistance Grant) allocation each
year. In addition, some states may get additional TANF federal funds in a year from:
o Supplemental Grants: Congress created the Supplemental Grants along with the TANF block grant in order to
provide additional funds to states potentially disadvantaged by the block grant formula, either due to high
population growth or because the state historically had provided relatively small cash grants. Seventeen states
receive Supplemental Grants. The amount they receive was constant each year until 2011, when the
Supplemental Grants were not fully funded.
o Contingency Fund: Congress created the Contingency Fund as part of the 1996 TANF law to provide additional
help to states in hard economic times. Over a third of states received TANF Contingency Funds in 2009.
o Emergency Fund: Congress created the Emergency Fund as part of the 2009 Recovery Act to reimburse
states for 80 percent of increased TANF or MOE funding. Every state but one received support from the Fund
in 2009 or 2010. The Fund expired on September 30, 2010.
o High Performance Bonus. Through 2004, states could receive additional federal TANF funds for strong
performance in meeting the objectives of TANF.
States can carry over TANF funds (except for Contingency Funds) from year to year, so a state may spend more or less
than the federal TANF allocation in a given year.
A state can transfer up to 30 percent of its block grant funds for a year to the Child Care and Development Block Grant
(CCDBG) and up to 10 percent to the Social Services Block Grant (SSBG), provided that the total amount transferred
does not exceed 30 percent of its current-year block grant.
The Tribal TANF option allows federally recognized American Indian Tribes within a state, as well as Alaska Native
organizations, to receive a portion of the state’s TANF block grant directly and then use it to operate their own TANF
programs.
Maintenance-of-Effort (MOE) Requirement:
Each year, a state is required to meet a TANF maintenance-of-effort (MOE) obligation. The amount is based on its
historical spending, defined as its 1994 contribution to Aid to Families with Dependent Children (AFDC) and related work
programs. States can count as MOE spending any state or third-party spending that benefits members of needy families
and meets one of the four purposes of TANF. MOE funds must be spent during the year in which they are claimed.
To meet its MOE obligation, a state must spend at least 80 percent of its historical spending. This minimum share is
reduced to 75 percent for any year in which a state meets the TANF Work Participation Rate (WPR). In order to qualify
for the Contingency Fund, a state must meet a 100 percent MOE requirement. Spending on child care and certain non-
TANF programs does not count toward this special Contingency Fund MOE requirement.
Using a formula used by the federal government, states can translate any MOE spending in excess of their minimum
MOE requirement into a caseload reduction credit. This helps a state to meet its WPR because the WPR a state must
achieve is reduced by one percentage point for every percentage point reduction in the caseload since 2005.
The Deficit Reduction Act of 2005 made it harder for states to meet the TANF WPR. In order to boost their caseload
reduction credit, some states found it advantageous to report MOE they had not previously reported. Once the
recession hit, some states also reported additional MOE in order to be eligible for TANF Contingency Funds. When
states more aggressively identify and report additional MOE spending, it appears to increase total TANF/MOE spending,
even if no actual increase in spending occurred. If the excess MOE spending is reported in just a few spending
categories, it will significantly change the apportionment of spending across categories.

Guide to Spending Categories
Spending Data Technical Notes Data Source: U.S. Department of Health and Human Services and the Center for Law and Social Policy DataFinder and
TANF Spending Analysis.
When the Total Federal Funds Used exceed the federal Block Grant amount it may be because the state spent funds it
had in reserve from previous years or it received additional funds from the TANF Contingency Fund or the TANF
Emergency Fund. In some instances, a state was not awarded the Emergency Funds until 2010 for increased
TANF/MOE spending that occurred in 2009.
The TANF Block Grant Amount line in the MOE and Block Grant Spending graph includes Supplemental Grants but
excludes Tribal TANF. (Tribal TANF spending is not included in the spending analysis.)
States can report adjustments for prior years that may appear as “negative expenditures” in the current year. If such
negative adjustments exceed current spending in a category, that category will show negative expenditures for the year.
In most cases, this reflects changes in the funding stream which expenditures are charged against, rather than real
reductions in funds available for an activity. However, in some cases funds may have been recovered from a program or
transferred back from SSBG or CCDBG to TANF. For the purposes of the tables, negative expenditures are included as
reported by ACF. For the purposes of the charts, negative expenditures are treated as equal to zero.
Poverty Data Technical Notes
Data Source: Current Population Survey (CPS). Two years of Current Population Survey (CPS) data were merged to
improve reliability. For example, 2008-09 represents merged CPS poverty data for calendar years 2008 and 2009.
CBPP Category Federal Reporting Categories
Basic Assistance Basic Assistance
Administration and Systems Administration
Systems
Work-related Activities and Supports1
Work Subsidies
Education and Training
Other Work Activities/Expenses
Transportation (all categories) and Other Supportive Services
Individual Development Accounts
Child Care Child Care Assistance and Nonassistance
Funds Transferred to Child Care and Development Fund
Refundable Tax Credits Refundable Earned Income Tax Credit
Other Refundable Tax Credits
Nonrecurrent Short-Term Benefits Nonrecurrent Short-Term Benefits
Pregnancy Prevention& 2-Parent Family Formation and
Maintenance
Prevention of Out-of-Wedlock Pregnancies
Two-Parent Family Formation and Maintenance
Transferred to Social Services Block Grant Transferred to Social Services Block Grant
Authorized Under Prior Law and Other Nonassistance2,3 Assistance and Non-Assistance Solely Under Prior Law
Other Nonassistance
1 Federal reporting categories separate Assistance and Nonassistance; we combined them for analysis. 2 Spending on certain pre-TANF activities are permissible even if the expenditures are not otherwise consistent with the purposes of TANF and/or with the
prohibitions included in the 1996 welfare law. This spending has been reported as Authorized Under Prior Law since fiscal year 2000. 3Prior to fiscal year 2000, states reported Other instead of Other Nonassistance. Other Nonassistance is a catch-all category for expenditures that meet
one of the purposes of TANF and which do not fit in any other reporting category.

The value of the TANF block grant has declined while need remains high.
State TANF Block Grant amounts, after adjusting for inflation, eroded by 25 percent between fiscal years 1997 and
2009 and by 28 percent by 2011.
The block grant did not rise or fall to meet Maine's changing needs. In 2008-09, 22,429 Maine families with children
lived in poverty. The number of families in poverty reached a low of 19,000 in 1996-97 and a high of 27,000 in 2002-
03.
The amount of federal TANF and state maintenance-of-effort (MOE) funds spent
in a given year varies over time and reflects the condition of the economy and
state policy and budgeting choices.
Maine increased its spending from federal
TANF Block Grant in 2005 and again in 2008.
MOE and Block Grant Spending in Maine
In fiscal year 2009, Maine reported $56
million in state MOE spending. This represents
112 percent of the amount of state spending on
AFDC and related work programs prior to the
advent of TANF - substantially more than the
minimum MOE requirement of 75 or 80 percent
of historic state spending. The increased MOE
claimed in recent years does not necessarily
represent any increase in state financial effort
or in benefits or services available to needy
families.
MOE and Block Grant Spending in Maine
In millions of dollars FY 2001 FY 2009
Total Federal TANF Funds Used 61 79
TANF Funds spent 55 76
Funds transferred to SSBG 3 3
Funds transferred to CCDBG 3 3
Reported MOE Spending 46 56
Additional background on TANF and MOE funds and technical notes for this fact
sheet are available in following pages.
2009 Federal TANF Allocations
TANF Block Grant Amount 78
TANF Supplemental Grant n/a
Contingency Fund 0
Emergency Fund 0
MOE Obligation
80% MOE Obligation 40
75% MOE Obligation 38

Use of federal TANF and state MOE funds has changed over time.
Total Spending by Category in Maine
Trends in Selected Spending Categories
(in millions of dollars and as a percentage of spending)
FY 2001 FY 2009
Reported Spending
Percentage of Total Funds Used
Reported Spending
Percentage of Total Funds Used
Basic Assistance 68 63% 75 55%
Administration and Systems 7 6% 4 3%
Work-related Activities and Supports 15 14% 34 25%
Child Care 13 12% 18 13%
Pregnancy Prevention & 2-Parent Family Formation and Maintenance
0 0% 0 0%
Authorized under Prior Law and Other Nonassistance 0 0% 1 1%
In fiscal year 2009, Maine spent 55 percent of its TANF/MOE expenditures on Basic Assistance. The amount of
spending in this area has remained relatively flat after an initial decline in the early years of welfare reform and a
spending spike in 2005.
Maine spent 25 percent of TANF and MOE funds on Work-related Activities and Supports. Most of this spending was
reported as Transportation. The amount spent in this category more than doubled between fiscal years 2006 and 2009.

Federal TANF Funds:
Each state gets a fixed annual TANF Block Grant (known formally as the State Family Assistance Grant) allocation each
year. In addition, some states may get additional TANF federal funds in a year from:
o Supplemental Grants: Congress created the Supplemental Grants along with the TANF block grant in order to
provide additional funds to states potentially disadvantaged by the block grant formula, either due to high
population growth or because the state historically had provided relatively small cash grants. Seventeen states
receive Supplemental Grants. The amount they receive was constant each year until 2011, when the
Supplemental Grants were not fully funded.
o Contingency Fund: Congress created the Contingency Fund as part of the 1996 TANF law to provide additional
help to states in hard economic times. Over a third of states received TANF Contingency Funds in 2009.
o Emergency Fund: Congress created the Emergency Fund as part of the 2009 Recovery Act to reimburse
states for 80 percent of increased TANF or MOE funding. Every state but one received support from the Fund
in 2009 or 2010. The Fund expired on September 30, 2010.
o High Performance Bonus. Through 2004, states could receive additional federal TANF funds for strong
performance in meeting the objectives of TANF.
States can carry over TANF funds (except for Contingency Funds) from year to year, so a state may spend more or less
than the federal TANF allocation in a given year.
A state can transfer up to 30 percent of its block grant funds for a year to the Child Care and Development Block Grant
(CCDBG) and up to 10 percent to the Social Services Block Grant (SSBG), provided that the total amount transferred
does not exceed 30 percent of its current-year block grant.
The Tribal TANF option allows federally recognized American Indian Tribes within a state, as well as Alaska Native
organizations, to receive a portion of the state’s TANF block grant directly and then use it to operate their own TANF
programs.
Maintenance-of-Effort (MOE) Requirement:
Each year, a state is required to meet a TANF maintenance-of-effort (MOE) obligation. The amount is based on its
historical spending, defined as its 1994 contribution to Aid to Families with Dependent Children (AFDC) and related work
programs. States can count as MOE spending any state or third-party spending that benefits members of needy families
and meets one of the four purposes of TANF. MOE funds must be spent during the year in which they are claimed.
To meet its MOE obligation, a state must spend at least 80 percent of its historical spending. This minimum share is
reduced to 75 percent for any year in which a state meets the TANF Work Participation Rate (WPR). In order to qualify
for the Contingency Fund, a state must meet a 100 percent MOE requirement. Spending on child care and certain non-
TANF programs does not count toward this special Contingency Fund MOE requirement.
Using a formula used by the federal government, states can translate any MOE spending in excess of their minimum
MOE requirement into a caseload reduction credit. This helps a state to meet its WPR because the WPR a state must
achieve is reduced by one percentage point for every percentage point reduction in the caseload since 2005.
The Deficit Reduction Act of 2005 made it harder for states to meet the TANF WPR. In order to boost their caseload
reduction credit, some states found it advantageous to report MOE they had not previously reported. Once the
recession hit, some states also reported additional MOE in order to be eligible for TANF Contingency Funds. When
states more aggressively identify and report additional MOE spending, it appears to increase total TANF/MOE spending,
even if no actual increase in spending occurred. If the excess MOE spending is reported in just a few spending
categories, it will significantly change the apportionment of spending across categories.

Guide to Spending Categories
Spending Data Technical Notes Data Source: U.S. Department of Health and Human Services and the Center for Law and Social Policy DataFinder and
TANF Spending Analysis.
When the Total Federal Funds Used exceed the federal Block Grant amount it may be because the state spent funds it
had in reserve from previous years or it received additional funds from the TANF Contingency Fund or the TANF
Emergency Fund. In some instances, a state was not awarded the Emergency Funds until 2010 for increased
TANF/MOE spending that occurred in 2009.
The TANF Block Grant Amount line in the MOE and Block Grant Spending graph includes Supplemental Grants but
excludes Tribal TANF. (Tribal TANF spending is not included in the spending analysis.)
States can report adjustments for prior years that may appear as “negative expenditures” in the current year. If such
negative adjustments exceed current spending in a category, that category will show negative expenditures for the year.
In most cases, this reflects changes in the funding stream which expenditures are charged against, rather than real
reductions in funds available for an activity. However, in some cases funds may have been recovered from a program or
transferred back from SSBG or CCDBG to TANF. For the purposes of the tables, negative expenditures are included as
reported by ACF. For the purposes of the charts, negative expenditures are treated as equal to zero.
Poverty Data Technical Notes
Data Source: Current Population Survey (CPS). Two years of Current Population Survey (CPS) data were merged to
improve reliability. For example, 2008-09 represents merged CPS poverty data for calendar years 2008 and 2009.
CBPP Category Federal Reporting Categories
Basic Assistance Basic Assistance
Administration and Systems Administration
Systems
Work-related Activities and Supports1
Work Subsidies
Education and Training
Other Work Activities/Expenses
Transportation (all categories) and Other Supportive Services
Individual Development Accounts
Child Care Child Care Assistance and Nonassistance
Funds Transferred to Child Care and Development Fund
Refundable Tax Credits Refundable Earned Income Tax Credit
Other Refundable Tax Credits
Nonrecurrent Short-Term Benefits Nonrecurrent Short-Term Benefits
Pregnancy Prevention& 2-Parent Family Formation and
Maintenance
Prevention of Out-of-Wedlock Pregnancies
Two-Parent Family Formation and Maintenance
Transferred to Social Services Block Grant Transferred to Social Services Block Grant
Authorized Under Prior Law and Other Nonassistance2,3 Assistance and Non-Assistance Solely Under Prior Law
Other Nonassistance
1 Federal reporting categories separate Assistance and Nonassistance; we combined them for analysis. 2 Spending on certain pre-TANF activities are permissible even if the expenditures are not otherwise consistent with the purposes of TANF and/or with the
prohibitions included in the 1996 welfare law. This spending has been reported as Authorized Under Prior Law since fiscal year 2000. 3Prior to fiscal year 2000, states reported Other instead of Other Nonassistance. Other Nonassistance is a catch-all category for expenditures that meet
one of the purposes of TANF and which do not fit in any other reporting category.

The value of the TANF block grant has declined while need remains high.
State TANF Block Grant amounts, after adjusting for inflation, eroded by 25 percent between fiscal years 1997 and
2009 and by 28 percent by 2011.
The block grant did not rise or fall to meet Maryland's changing needs. In 2008-09, 67,370 Maryland families with
children lived in poverty. The number of families in poverty reached a low of 44,000 in 1998-99 and a high of 77,000 in
2004-05.
The amount of federal TANF and state maintenance-of-effort (MOE) funds spent
in a given year varies over time and reflects the condition of the economy and
state policy and budgeting choices.
MOE and Block Grant Spending in Maryland
Maryland increased its spending from federal
TANF Block Grant during the recession of 2001-
02 and during the recent recession.
In fiscal year 2009, Maryland reported $256
million in state MOE spending. This represents
109 percent of the amount of state spending on
AFDC and related work programs prior to the
advent of TANF - substantially more than the
minimum MOE requirement of 75 percent of
historic state spending. Until fiscal year 2009,
Maryland's MOE spending was slightly above
the required 75 percent level. The increased
MOE claimed for this year does not necessarily
represent any increase in state financial effort
or in benefits or services available to needy
families.
MOE and Block Grant Spending in Maryland
In millions of dollars FY 2001 FY 2009
Total Federal TANF Funds Used 241 289
TANF Funds spent 218 260
Funds transferred to SSBG 23 23
Funds transferred to CCDBG 0 0
Reported MOE Spending 177 256
Additional background on TANF and MOE funds and technical notes for this fact
sheet are available in following pages.
2009 Federal TANF Allocations
TANF Block Grant Amount 229
TANF Supplemental Grant n/a
Contingency Fund 38
Emergency Fund 30
MOE Obligation
80% MOE Obligation 189
75% MOE Obligation 177

Use of federal TANF and state MOE funds has changed over time.
Total Spending by Category in Maryland
Trends in Selected Spending Categories
(in millions of dollars and as a percentage of spending)
FY 2001 FY 2009
Reported Spending
Percentage of Total Funds Used
Reported Spending
Percentage of Total Funds Used
Basic Assistance 224 54% 107 20%
Administration and Systems 43 10% 55 10%
Work-related Activities and Supports 110 26% 42 8%
Child Care -6 -1% 32 6%
Pregnancy Prevention & 2-Parent Family Formation and Maintenance
27 7% 101 19%
Authorized under Prior Law and Other Nonassistance -4 -1% 0 0%
In fiscal year 2009, Maryland spent 20 percent of its TANF/MOE expenditures on Basic Assistance, 8 percentage points
below the national average for spending in this category. Maryland has decreased its Basic Assistance spending by 52
percent since 2001.
Maryland spent 23 percent of TANF and MOE expenditures on Refundable Tax Credits in 2009. Maryland first began
spending in this category in 2003.

Federal TANF Funds:
Each state gets a fixed annual TANF Block Grant (known formally as the State Family Assistance Grant) allocation each
year. In addition, some states may get additional TANF federal funds in a year from:
o Supplemental Grants: Congress created the Supplemental Grants along with the TANF block grant in order to
provide additional funds to states potentially disadvantaged by the block grant formula, either due to high
population growth or because the state historically had provided relatively small cash grants. Seventeen states
receive Supplemental Grants. The amount they receive was constant each year until 2011, when the
Supplemental Grants were not fully funded.
o Contingency Fund: Congress created the Contingency Fund as part of the 1996 TANF law to provide additional
help to states in hard economic times. Over a third of states received TANF Contingency Funds in 2009.
o Emergency Fund: Congress created the Emergency Fund as part of the 2009 Recovery Act to reimburse
states for 80 percent of increased TANF or MOE funding. Every state but one received support from the Fund
in 2009 or 2010. The Fund expired on September 30, 2010.
o High Performance Bonus. Through 2004, states could receive additional federal TANF funds for strong
performance in meeting the objectives of TANF.
States can carry over TANF funds (except for Contingency Funds) from year to year, so a state may spend more or less
than the federal TANF allocation in a given year.
A state can transfer up to 30 percent of its block grant funds for a year to the Child Care and Development Block Grant
(CCDBG) and up to 10 percent to the Social Services Block Grant (SSBG), provided that the total amount transferred
does not exceed 30 percent of its current-year block grant.
The Tribal TANF option allows federally recognized American Indian Tribes within a state, as well as Alaska Native
organizations, to receive a portion of the state’s TANF block grant directly and then use it to operate their own TANF
programs.
Maintenance-of-Effort (MOE) Requirement:
Each year, a state is required to meet a TANF maintenance-of-effort (MOE) obligation. The amount is based on its
historical spending, defined as its 1994 contribution to Aid to Families with Dependent Children (AFDC) and related work
programs. States can count as MOE spending any state or third-party spending that benefits members of needy families
and meets one of the four purposes of TANF. MOE funds must be spent during the year in which they are claimed.
To meet its MOE obligation, a state must spend at least 80 percent of its historical spending. This minimum share is
reduced to 75 percent for any year in which a state meets the TANF Work Participation Rate (WPR). In order to qualify
for the Contingency Fund, a state must meet a 100 percent MOE requirement. Spending on child care and certain non-
TANF programs does not count toward this special Contingency Fund MOE requirement.
Using a formula used by the federal government, states can translate any MOE spending in excess of their minimum
MOE requirement into a caseload reduction credit. This helps a state to meet its WPR because the WPR a state must
achieve is reduced by one percentage point for every percentage point reduction in the caseload since 2005.
The Deficit Reduction Act of 2005 made it harder for states to meet the TANF WPR. In order to boost their caseload
reduction credit, some states found it advantageous to report MOE they had not previously reported. Once the
recession hit, some states also reported additional MOE in order to be eligible for TANF Contingency Funds. When
states more aggressively identify and report additional MOE spending, it appears to increase total TANF/MOE spending,
even if no actual increase in spending occurred. If the excess MOE spending is reported in just a few spending
categories, it will significantly change the apportionment of spending across categories.

Guide to Spending Categories
Spending Data Technical Notes Data Source: U.S. Department of Health and Human Services and the Center for Law and Social Policy DataFinder and
TANF Spending Analysis.
When the Total Federal Funds Used exceed the federal Block Grant amount it may be because the state spent funds it
had in reserve from previous years or it received additional funds from the TANF Contingency Fund or the TANF
Emergency Fund. In some instances, a state was not awarded the Emergency Funds until 2010 for increased
TANF/MOE spending that occurred in 2009.
The TANF Block Grant Amount line in the MOE and Block Grant Spending graph includes Supplemental Grants but
excludes Tribal TANF. (Tribal TANF spending is not included in the spending analysis.)
States can report adjustments for prior years that may appear as “negative expenditures” in the current year. If such
negative adjustments exceed current spending in a category, that category will show negative expenditures for the year.
In most cases, this reflects changes in the funding stream which expenditures are charged against, rather than real
reductions in funds available for an activity. However, in some cases funds may have been recovered from a program or
transferred back from SSBG or CCDBG to TANF. For the purposes of the tables, negative expenditures are included as
reported by ACF. For the purposes of the charts, negative expenditures are treated as equal to zero.
Poverty Data Technical Notes
Data Source: Current Population Survey (CPS). Two years of Current Population Survey (CPS) data were merged to
improve reliability. For example, 2008-09 represents merged CPS poverty data for calendar years 2008 and 2009.
CBPP Category Federal Reporting Categories
Basic Assistance Basic Assistance
Administration and Systems Administration
Systems
Work-related Activities and Supports1
Work Subsidies
Education and Training
Other Work Activities/Expenses
Transportation (all categories) and Other Supportive Services
Individual Development Accounts
Child Care Child Care Assistance and Nonassistance
Funds Transferred to Child Care and Development Fund
Refundable Tax Credits Refundable Earned Income Tax Credit
Other Refundable Tax Credits
Nonrecurrent Short-Term Benefits Nonrecurrent Short-Term Benefits
Pregnancy Prevention& 2-Parent Family Formation and
Maintenance
Prevention of Out-of-Wedlock Pregnancies
Two-Parent Family Formation and Maintenance
Transferred to Social Services Block Grant Transferred to Social Services Block Grant
Authorized Under Prior Law and Other Nonassistance2,3 Assistance and Non-Assistance Solely Under Prior Law
Other Nonassistance
1 Federal reporting categories separate Assistance and Nonassistance; we combined them for analysis. 2 Spending on certain pre-TANF activities are permissible even if the expenditures are not otherwise consistent with the purposes of TANF and/or with the
prohibitions included in the 1996 welfare law. This spending has been reported as Authorized Under Prior Law since fiscal year 2000. 3Prior to fiscal year 2000, states reported Other instead of Other Nonassistance. Other Nonassistance is a catch-all category for expenditures that meet
one of the purposes of TANF and which do not fit in any other reporting category.

The value of the TANF block grant has declined while need remains high.
State TANF Block Grant amounts, after adjusting for inflation, eroded by 25 percent between fiscal years 1997 and
2009 and by 28 percent by 2011.
The block grant did not rise or fall to meet Massachusetts's changing needs. In 2008-09, 114,728 Massachusetts
families with children lived in poverty. The number of families in poverty reached a low of 77,000 in 2003-04 and a high
of nearly 115,000 in 2008-09.
The amount of federal TANF and state maintenance-of-effort (MOE) funds spent
in a given year varies over time and reflects the condition of the economy and
state policy and budgeting choices.
Massachusetts increased its spending from
federal TANF Block Grant by over $135 million
in 2009 which is close to the amount of
Contingency and Emergency Funds the state
received for 2009.
MOE and Block Grant Spending in Massachusetts
In fiscal year 2009, Massachusetts reported
$598 million in state MOE spending. This
represents 125 percent of the amount of state
spending on AFDC and related work programs
prior to the advent of TANF - substantially more
than the minimum MOE requirement of 75
percent of historic state spending. Until fiscal
year 2006, Massachusetts's MOE spending was
at the required 75 percent level. The increased
MOE claimed for recent years does not
necessarily represent any increase in state
financial effort or in benefits or services
available to needy families.
MOE and Block Grant Spending in Massachusetts
In millions of dollars FY 2001 FY 2009
Total Federal TANF Funds Used 459 596
TANF Funds spent 323 458
Funds transferred to SSBG 45 46
Funds transferred to CCDBG 92 92
Reported MOE Spending 359 598
Additional background on TANF and MOE funds and technical notes for this fact
sheet are available in following pages.
2009 Federal TANF Allocations
TANF Block Grant Amount 459
TANF Supplemental Grant n/a
Contingency Fund 92
Emergency Fund 42
MOE Obligation
80% MOE Obligation 383
75% MOE Obligation 359

Guide to Spending Categories
Spending Data Technical Notes Data Source: U.S. Department of Health and Human Services and the Center for Law and Social Policy DataFinder and
TANF Spending Analysis.
When the Total Federal Funds Used exceed the federal Block Grant amount it may be because the state spent funds it
had in reserve from previous years or it received additional funds from the TANF Contingency Fund or the TANF
Emergency Fund. In some instances, a state was not awarded the Emergency Funds until 2010 for increased
TANF/MOE spending that occurred in 2009.
The TANF Block Grant Amount line in the MOE and Block Grant Spending graph includes Supplemental Grants but
excludes Tribal TANF. (Tribal TANF spending is not included in the spending analysis.)
States can report adjustments for prior years that may appear as “negative expenditures” in the current year. If such
negative adjustments exceed current spending in a category, that category will show negative expenditures for the year.
In most cases, this reflects changes in the funding stream which expenditures are charged against, rather than real
reductions in funds available for an activity. However, in some cases funds may have been recovered from a program or
transferred back from SSBG or CCDBG to TANF. For the purposes of the tables, negative expenditures are included as
reported by ACF. For the purposes of the charts, negative expenditures are treated as equal to zero.
Poverty Data Technical Notes
Data Source: Current Population Survey (CPS). Two years of Current Population Survey (CPS) data were merged to
improve reliability. For example, 2008-09 represents merged CPS poverty data for calendar years 2008 and 2009.
CBPP Category Federal Reporting Categories
Basic Assistance Basic Assistance
Administration and Systems Administration
Systems
Work-related Activities and Supports1
Work Subsidies
Education and Training
Other Work Activities/Expenses
Transportation (all categories) and Other Supportive Services
Individual Development Accounts
Child Care Child Care Assistance and Nonassistance
Funds Transferred to Child Care and Development Fund
Refundable Tax Credits Refundable Earned Income Tax Credit
Other Refundable Tax Credits
Nonrecurrent Short-Term Benefits Nonrecurrent Short-Term Benefits
Pregnancy Prevention& 2-Parent Family Formation and
Maintenance
Prevention of Out-of-Wedlock Pregnancies
Two-Parent Family Formation and Maintenance
Transferred to Social Services Block Grant Transferred to Social Services Block Grant
Authorized Under Prior Law and Other Nonassistance2,3 Assistance and Non-Assistance Solely Under Prior Law
Other Nonassistance
1 Federal reporting categories separate Assistance and Nonassistance; we combined them for analysis. 2 Spending on certain pre-TANF activities are permissible even if the expenditures are not otherwise consistent with the purposes of TANF and/or with the
prohibitions included in the 1996 welfare law. This spending has been reported as Authorized Under Prior Law since fiscal year 2000. 3Prior to fiscal year 2000, states reported Other instead of Other Nonassistance. Other Nonassistance is a catch-all category for expenditures that meet
one of the purposes of TANF and which do not fit in any other reporting category.

Use of federal TANF and state MOE funds has changed over time.
Total Spending by Category in Massachusetts
Trends in Selected Spending Categories
(in millions of dollars and as a percentage of spending)
FY 2001 FY 2009
Reported Spending
Percentage of Total Funds Used
Reported Spending
Percentage of Total Funds Used
Basic Assistance 286 35% 325 27%
Administration and Systems 46 6% 44 4%
Work-related Activities and Supports 38 5% 24 2%
Child Care 299 37% 336 28%
Pregnancy Prevention & 2-Parent Family Formation and Maintenance
8 1% 56 5%
Authorized under Prior Law and Other Nonassistance 26 3% 210 18%
In fiscal year 2009, Massachusetts spent 27 percent of its TANF/MOE expenditures on Basic Assistance.
Massachusetts spent 28 percent of its TANF/MOE expenditures in the Child Care category in 2009. Child Care spending
increased by $37 million from 2001.
In fiscal year 2009, Massachusetts spent 2 percent of its TANF/MOE expenditures on Work-related Activities and
Supports, less than one quarter of the national average for spending in this category.

The value of the TANF block grant has declined while need remains high.
State TANF Block Grant amounts, after adjusting for inflation, eroded by 25 percent between fiscal years 1997 and
2009 and by 28 percent by 2011.
The block grant did not rise or fall to meet New Hampshire's changing needs. In 2008-09, 14,634 New Hampshire
families with children lived in poverty. The number of families in poverty reached a low of 10,000 in 2001-02 and a high
of 22,000 in 1997-98.
The amount of federal TANF and state maintenance-of-effort (MOE) funds spent
in a given year varies over time and reflects the condition of the economy and
state policy and budgeting choices.
New Hampshire has increased its spending
from the TANF Block Grant since 2004 and its
MOE spending since 2007.
MOE and Block Grant Spending in New Hampshire
Starting in 2007, New Hampshire reported
MOE spending in excess of the MOE
requirement of 75 percent of historic state
spending, that is, the amount of state spending
on AFDC and related work programs prior to the
advent of TANF. Previously, New Hampshire's
MOE spending was at the minimum required 75
percent level. The increased MOE claimed for
recent years does not necessarily represent any
increase in state financial effort or in benefits or
services available to needy families.
MOE and Block Grant Spending in New Hampshire
In millions of dollars FY 2001 FY 2009
Total Federal TANF Funds Used 31 50
TANF Funds spent 31 44
Funds transferred to SSBG 0 2
Funds transferred to CCDBG 0 0
Reported MOE Spending 32 39
Additional background on TANF and MOE funds and technical notes for this fact
sheet are available in following pages.
2009 Federal TANF Allocations
TANF Block Grant Amount 39
TANF Supplemental Grant n/a
Contingency Fund 0
Emergency Fund 4
MOE Obligation
80% MOE Obligation 34
75% MOE Obligation 32

Use of federal TANF and state MOE funds has changed over time.
Total Spending by Category in New Hampshire
Trends in Selected Spending Categories
(in millions of dollars and as a percentage of spending)
FY 2001 FY 2009
Reported Spending
Percentage of Total Funds Used
Reported Spending
Percentage of Total Funds Used
Basic Assistance 27 42% 34 39%
Administration and Systems 14 22% 12 13%
Work-related Activities and Supports 7 11% 11 13%
Child Care 5 7% 8 9%
Pregnancy Prevention & 2-Parent Family Formation and Maintenance
1 1% 3 3%
Authorized under Prior Law and Other Nonassistance 10 16% 15 17%
In fiscal year 2009, New Hampshire spent 39 percent of its TANF/MOE expenditures on Basic Assistance.
New Hampshire spent 17 percent of its TANF/MOE expenditures in the combined Authorized Under Prior Law/Other
Nonassistance spending category in 2009. A majority this spending was reported as Other Nonassistance. This is an
increase of over $4 million from 2001. The substantial increase in reported spending in this category first occurred
between fiscal years 2005 and 2006.

Federal TANF Funds:
Each state gets a fixed annual TANF Block Grant (known formally as the State Family Assistance Grant) allocation each
year. In addition, some states may get additional TANF federal funds in a year from:
o Supplemental Grants: Congress created the Supplemental Grants along with the TANF block grant in order to
provide additional funds to states potentially disadvantaged by the block grant formula, either due to high
population growth or because the state historically had provided relatively small cash grants. Seventeen states
receive Supplemental Grants. The amount they receive was constant each year until 2011, when the
Supplemental Grants were not fully funded.
o Contingency Fund: Congress created the Contingency Fund as part of the 1996 TANF law to provide additional
help to states in hard economic times. Over a third of states received TANF Contingency Funds in 2009.
o Emergency Fund: Congress created the Emergency Fund as part of the 2009 Recovery Act to reimburse
states for 80 percent of increased TANF or MOE funding. Every state but one received support from the Fund
in 2009 or 2010. The Fund expired on September 30, 2010.
o High Performance Bonus. Through 2004, states could receive additional federal TANF funds for strong
performance in meeting the objectives of TANF.
States can carry over TANF funds (except for Contingency Funds) from year to year, so a state may spend more or less
than the federal TANF allocation in a given year.
A state can transfer up to 30 percent of its block grant funds for a year to the Child Care and Development Block Grant
(CCDBG) and up to 10 percent to the Social Services Block Grant (SSBG), provided that the total amount transferred
does not exceed 30 percent of its current-year block grant.
The Tribal TANF option allows federally recognized American Indian Tribes within a state, as well as Alaska Native
organizations, to receive a portion of the state’s TANF block grant directly and then use it to operate their own TANF
programs.
Maintenance-of-Effort (MOE) Requirement:
Each year, a state is required to meet a TANF maintenance-of-effort (MOE) obligation. The amount is based on its
historical spending, defined as its 1994 contribution to Aid to Families with Dependent Children (AFDC) and related work
programs. States can count as MOE spending any state or third-party spending that benefits members of needy families
and meets one of the four purposes of TANF. MOE funds must be spent during the year in which they are claimed.
To meet its MOE obligation, a state must spend at least 80 percent of its historical spending. This minimum share is
reduced to 75 percent for any year in which a state meets the TANF Work Participation Rate (WPR). In order to qualify
for the Contingency Fund, a state must meet a 100 percent MOE requirement. Spending on child care and certain non-
TANF programs does not count toward this special Contingency Fund MOE requirement.
Using a formula used by the federal government, states can translate any MOE spending in excess of their minimum
MOE requirement into a caseload reduction credit. This helps a state to meet its WPR because the WPR a state must
achieve is reduced by one percentage point for every percentage point reduction in the caseload since 2005.
The Deficit Reduction Act of 2005 made it harder for states to meet the TANF WPR. In order to boost their caseload
reduction credit, some states found it advantageous to report MOE they had not previously reported. Once the
recession hit, some states also reported additional MOE in order to be eligible for TANF Contingency Funds. When
states more aggressively identify and report additional MOE spending, it appears to increase total TANF/MOE spending,
even if no actual increase in spending occurred. If the excess MOE spending is reported in just a few spending
categories, it will significantly change the apportionment of spending across categories.

Guide to Spending Categories
Spending Data Technical Notes Data Source: U.S. Department of Health and Human Services and the Center for Law and Social Policy DataFinder and
TANF Spending Analysis.
When the Total Federal Funds Used exceed the federal Block Grant amount it may be because the state spent funds it
had in reserve from previous years or it received additional funds from the TANF Contingency Fund or the TANF
Emergency Fund. In some instances, a state was not awarded the Emergency Funds until 2010 for increased
TANF/MOE spending that occurred in 2009.
The TANF Block Grant Amount line in the MOE and Block Grant Spending graph includes Supplemental Grants but
excludes Tribal TANF. (Tribal TANF spending is not included in the spending analysis.)
States can report adjustments for prior years that may appear as “negative expenditures” in the current year. If such
negative adjustments exceed current spending in a category, that category will show negative expenditures for the year.
In most cases, this reflects changes in the funding stream which expenditures are charged against, rather than real
reductions in funds available for an activity. However, in some cases funds may have been recovered from a program or
transferred back from SSBG or CCDBG to TANF. For the purposes of the tables, negative expenditures are included as
reported by ACF. For the purposes of the charts, negative expenditures are treated as equal to zero.
Poverty Data Technical Notes
Data Source: Current Population Survey (CPS). Two years of Current Population Survey (CPS) data were merged to
improve reliability. For example, 2008-09 represents merged CPS poverty data for calendar years 2008 and 2009.
CBPP Category Federal Reporting Categories
Basic Assistance Basic Assistance
Administration and Systems Administration
Systems
Work-related Activities and Supports1
Work Subsidies
Education and Training
Other Work Activities/Expenses
Transportation (all categories) and Other Supportive Services
Individual Development Accounts
Child Care Child Care Assistance and Nonassistance
Funds Transferred to Child Care and Development Fund
Refundable Tax Credits Refundable Earned Income Tax Credit
Other Refundable Tax Credits
Nonrecurrent Short-Term Benefits Nonrecurrent Short-Term Benefits
Pregnancy Prevention& 2-Parent Family Formation and
Maintenance
Prevention of Out-of-Wedlock Pregnancies
Two-Parent Family Formation and Maintenance
Transferred to Social Services Block Grant Transferred to Social Services Block Grant
Authorized Under Prior Law and Other Nonassistance2,3 Assistance and Non-Assistance Solely Under Prior Law
Other Nonassistance
1 Federal reporting categories separate Assistance and Nonassistance; we combined them for analysis. 2 Spending on certain pre-TANF activities are permissible even if the expenditures are not otherwise consistent with the purposes of TANF and/or with the
prohibitions included in the 1996 welfare law. This spending has been reported as Authorized Under Prior Law since fiscal year 2000. 3Prior to fiscal year 2000, states reported Other instead of Other Nonassistance. Other Nonassistance is a catch-all category for expenditures that meet
one of the purposes of TANF and which do not fit in any other reporting category.

The value of the TANF block grant has declined while need remains high.
State TANF Block Grant amounts, after adjusting for inflation, eroded by 25 percent between fiscal years 1997 and
2009 and by 28 percent by 2011.
The block grant did not rise or fall to meet New Jersey's changing needs. In 2008-09, 122,616 New Jersey families with
children lived in poverty. The number of families in poverty reached a low of 90,000 in 2004-05 and a high of nearly
123,000 in 2008-09.
The amount of federal TANF and state maintenance-of-effort (MOE) funds spent
in a given year varies over time and reflects the condition of the economy and
state policy and budgeting choices.
New Jersey's expenditures from the TANF
Block Grant have leveled-off at an amount
about $100 million below their highs in the mid
2000s.
In fiscal year 2009, New Jersey reported
$801 million in state MOE spending,. This
represents 200 percent of the amount of state
spending on AFDC and related work programs
prior to the advent of TANF - substantially more
than the minimum MOE requirement of 75 or
80 percent of historic state spending. The state
has reported increased MOE spending in recent
years, particularly 2008 and 2009. These
recent increases do not necessarily represent
any increase in state financial effort or in
benefits or services available to needy families.
MOE and Block Grant Spending in New Jersey
MOE and Block Grant Spending in New Jersey
In millions of dollars FY 2001 FY 2009
Total Federal TANF Funds Used 295 407
TANF Funds spent 255 310
Funds transferred to SSBG 40 17
Funds transferred to CCDBG 0 0
Reported MOE Spending 300 801
Additional background on TANF and MOE funds and technical notes for this fact
sheet are available in following pages.
2009 Federal TANF Allocations
TANF Block Grant Amount 404
TANF Supplemental Grant n/a
Contingency Fund 0
Emergency Fund 0
MOE Obligation
80% MOE Obligation 320
75% MOE Obligation 300

Use of federal TANF and state MOE funds has changed over time.
Total Spending by Category in New Jersey
Trends in Selected Spending Categories
(in millions of dollars and as a percentage of spending)
FY 2001 FY 2009
Reported Spending
Percentage of Total Funds Used
Reported Spending
Percentage of Total Funds Used
Basic Assistance 199 33% 182 15%
Administration and Systems 115 19% 73 6%
Work-related Activities and Supports 43 7% 123 10%
Child Care 58 10% 107 9%
Pregnancy Prevention & 2-Parent Family Formation and Maintenance
86 14% 458 38%
Authorized under Prior Law and Other Nonassistance 6 1% 16 1%
In fiscal year 2009, New Jersey spent 15 percent of its TANF/MOE expenditures on Basic Assistance. New Jersey has
decreased its Basic Assistance spending by 9 percent since 2001.
The largest share of New Jersey's TANF and MOE spending is on Pregnancy Prevention and Two-Parent Family Formation
and Maintenance. In 2009, New Jersey spent 38 of its total TANF/MOE expenditures in this category. The amount of
spending in this category more than tripled between fiscal years 2001 and 2002.

Federal TANF Funds:
Each state gets a fixed annual TANF Block Grant (known formally as the State Family Assistance Grant) allocation each
year. In addition, some states may get additional TANF federal funds in a year from:
o Supplemental Grants: Congress created the Supplemental Grants along with the TANF block grant in order to
provide additional funds to states potentially disadvantaged by the block grant formula, either due to high
population growth or because the state historically had provided relatively small cash grants. Seventeen states
receive Supplemental Grants. The amount they receive was constant each year until 2011, when the
Supplemental Grants were not fully funded.
o Contingency Fund: Congress created the Contingency Fund as part of the 1996 TANF law to provide additional
help to states in hard economic times. Over a third of states received TANF Contingency Funds in 2009.
o Emergency Fund: Congress created the Emergency Fund as part of the 2009 Recovery Act to reimburse
states for 80 percent of increased TANF or MOE funding. Every state but one received support from the Fund
in 2009 or 2010. The Fund expired on September 30, 2010.
o High Performance Bonus. Through 2004, states could receive additional federal TANF funds for strong
performance in meeting the objectives of TANF.
States can carry over TANF funds (except for Contingency Funds) from year to year, so a state may spend more or less
than the federal TANF allocation in a given year.
A state can transfer up to 30 percent of its block grant funds for a year to the Child Care and Development Block Grant
(CCDBG) and up to 10 percent to the Social Services Block Grant (SSBG), provided that the total amount transferred
does not exceed 30 percent of its current-year block grant.
The Tribal TANF option allows federally recognized American Indian Tribes within a state, as well as Alaska Native
organizations, to receive a portion of the state’s TANF block grant directly and then use it to operate their own TANF
programs.
Maintenance-of-Effort (MOE) Requirement:
Each year, a state is required to meet a TANF maintenance-of-effort (MOE) obligation. The amount is based on its
historical spending, defined as its 1994 contribution to Aid to Families with Dependent Children (AFDC) and related work
programs. States can count as MOE spending any state or third-party spending that benefits members of needy families
and meets one of the four purposes of TANF. MOE funds must be spent during the year in which they are claimed.
To meet its MOE obligation, a state must spend at least 80 percent of its historical spending. This minimum share is
reduced to 75 percent for any year in which a state meets the TANF Work Participation Rate (WPR). In order to qualify
for the Contingency Fund, a state must meet a 100 percent MOE requirement. Spending on child care and certain non-
TANF programs does not count toward this special Contingency Fund MOE requirement.
Using a formula used by the federal government, states can translate any MOE spending in excess of their minimum
MOE requirement into a caseload reduction credit. This helps a state to meet its WPR because the WPR a state must
achieve is reduced by one percentage point for every percentage point reduction in the caseload since 2005.
The Deficit Reduction Act of 2005 made it harder for states to meet the TANF WPR. In order to boost their caseload
reduction credit, some states found it advantageous to report MOE they had not previously reported. Once the
recession hit, some states also reported additional MOE in order to be eligible for TANF Contingency Funds. When
states more aggressively identify and report additional MOE spending, it appears to increase total TANF/MOE spending,
even if no actual increase in spending occurred. If the excess MOE spending is reported in just a few spending
categories, it will significantly change the apportionment of spending across categories.

Guide to Spending Categories
CBPP Category Federal Reporting Categories
Basic Assistance Basic Assistance
Administration and Systems Administration
Systems
Work-related Activities and Supports1
Work Subsidies
Education and Training
Other Work Activities/Expenses
Transportation (all categories) and Other Supportive Services
Individual Development Accounts
Child Care Child Care Assistance and Nonassistance
Funds Transferred to Child Care and Development Fund
Refundable Tax Credits Refundable Earned Income Tax Credit
Other Refundable Tax Credits
Nonrecurrent Short-Term Benefits Nonrecurrent Short-Term Benefits
Pregnancy Prevention& 2-Parent Family Formation and
Maintenance
Prevention of Out-of-Wedlock Pregnancies
Two-Parent Family Formation and Maintenance
Transferred to Social Services Block Grant Transferred to Social Services Block Grant
Authorized Under Prior Law and Other Nonassistance2,3 Assistance and Non-Assistance Solely Under Prior Law
Other Nonassistance
1 Federal reporting categories separate Assistance and Nonassistance; we combined them for analysis. 2 Spending on certain pre-TANF activities are permissible even if the expenditures are not otherwise consistent with the purposes of TANF and/or with the
prohibitions included in the 1996 welfare law. This spending has been reported as Authorized Under Prior Law since fiscal year 2000. 3Prior to fiscal year 2000, states reported Other instead of Other Nonassistance. Other Nonassistance is a catch-all category for expenditures that meet
one of the purposes of TANF and which do not fit in any other reporting category.
Spending Data Technical Notes Data Source: U.S. Department of Health and Human Services and the Center for Law and Social Policy DataFinder and
TANF Spending Analysis.
When the Total Federal Funds Used exceed the federal Block Grant amount it may be because the state spent funds it
had in reserve from previous years or it received additional funds from the TANF Contingency Fund or the TANF
Emergency Fund. In some instances, a state was not awarded the Emergency Funds until 2010 for increased
TANF/MOE spending that occurred in 2009.
The TANF Block Grant Amount line in the MOE and Block Grant Spending graph includes Supplemental Grants but
excludes Tribal TANF. (Tribal TANF spending is not included in the spending analysis.)
States can report adjustments for prior years that may appear as “negative expenditures” in the current year. If such
negative adjustments exceed current spending in a category, that category will show negative expenditures for the year.
In most cases, this reflects changes in the funding stream which expenditures are charged against, rather than real
reductions in funds available for an activity. However, in some cases funds may have been recovered from a program or
transferred back from SSBG or CCDBG to TANF. For the purposes of the tables, negative expenditures are included as
reported by ACF. For the purposes of the charts, negative expenditures are treated as equal to zero.
Poverty Data Technical Notes
Data Source: Current Population Survey (CPS). Two years of Current Population Survey (CPS) data were merged to
improve reliability. For example, 2008-09 represents merged CPS poverty data for calendar years 2008 and 2009.

The value of the TANF block grant has declined while need remains high.
State TANF Block Grant amounts, after adjusting for inflation, eroded by 25 percent between fiscal years 1997 and
2009 and by 28 percent by 2011.
The block grant did not rise or fall to meet New York's changing needs. In 2008-09, 463,452 New York families with
children lived in poverty. The number of families in poverty reached a low of 420,000 in 2000-01 and a high of 542,000
in 1996-97.
The amount of federal TANF and state maintenance-of-effort (MOE) funds spent
in a given year varies over time and reflects the condition of the economy and
state policy and budgeting choices.
New York's federal TANF spending increased
in the wake of the 2001-02 recession and
slightly during the recent recession. (The 2009
increase in federal TANF spending is less than
the additional federal dollars the state received
for 2009.)
In fiscal year 2009, New York reported
$3.07 billion in state MOE spending.. This
represents 134 percent of the amount of state
spending on AFDC and related work programs
prior to the advent of TANF - substantially more
than the minimum MOE requirement of 75 or
80 percent of historic state spending. New
York has claimed over 100 percent MOE since
1996 and the increased MOE claimed in recent
years does not necessarily represent any
increase in state financial effort or in benefits or
services available to needy families.
MOE and Block Grant Spending in New York
MOE and Block Grant Spending in New York
In millions of dollars FY 2001 FY 2009
Total Federal TANF Funds Used 2,642 2,634
TANF Funds spent 2,023 2,019
Funds transferred to SSBG 244 201
Funds transferred to CCDBG 375 375
Reported MOE Spending 1,782 3,073
Additional background on TANF and MOE funds and technical notes for this fact
sheet are available in following pages.
2009 Federal TANF Allocations
TANF Block Grant Amount 2,443
TANF Supplemental Grant n/a
Contingency Fund 407
Emergency Fund 149
MOE Obligation
80% MOE Obligation 1,833
75% MOE Obligation 1,719

Use of federal TANF and state MOE funds has changed over time.
Total Spending by Category in New York
Trends in Selected Spending Categories
(in millions of dollars and as a percentage of spending)
FY 2001 FY 2009
Reported Spending
Percentage of Total Funds Used
Reported Spending
Percentage of Total Funds Used
Basic Assistance 1,620 37% 1,458 26%
Administration and Systems 430 10% 457 8%
Work-related Activities and Supports 314 7% 196 3%
Child Care 477 11% 516 9%
Pregnancy Prevention& 2-Parent Family Formation and Maintenance
11 0% 340 6%
Authorized under Prior Law and Other Nonassistance 938 21% 944 17%
In fiscal year 2009, New York spent 26 percent of its TANF/MOE expenditures on Basic Assistance, slightly below the
national average for spending in this category. New York has decreased its Basic Assistance spending by 10 percent
since 2001.
New York spent 21 percent of its TANF/MOE expenditures on Refundable Tax Credits in 2009. Spending in this
category has increased relatively steadily since 2002.

Federal TANF Funds:
Each state gets a fixed annual TANF Block Grant (known formally as the State Family Assistance Grant) allocation each
year. In addition, some states may get additional TANF federal funds in a year from:
o Supplemental Grants: Congress created the Supplemental Grants along with the TANF block grant in order to
provide additional funds to states potentially disadvantaged by the block grant formula, either due to high
population growth or because the state historically had provided relatively small cash grants. Seventeen states
receive Supplemental Grants. The amount they receive was constant each year until 2011, when the
Supplemental Grants were not fully funded.
o Contingency Fund: Congress created the Contingency Fund as part of the 1996 TANF law to provide additional
help to states in hard economic times. Over a third of states received TANF Contingency Funds in 2009.
o Emergency Fund: Congress created the Emergency Fund as part of the 2009 Recovery Act to reimburse
states for 80 percent of increased TANF or MOE funding. Every state but one received support from the Fund
in 2009 or 2010. The Fund expired on September 30, 2010.
o High Performance Bonus. Through 2004, states could receive additional federal TANF funds for strong
performance in meeting the objectives of TANF.
States can carry over TANF funds (except for Contingency Funds) from year to year, so a state may spend more or less
than the federal TANF allocation in a given year.
A state can transfer up to 30 percent of its block grant funds for a year to the Child Care and Development Block Grant
(CCDBG) and up to 10 percent to the Social Services Block Grant (SSBG), provided that the total amount transferred
does not exceed 30 percent of its current-year block grant.
The Tribal TANF option allows federally recognized American Indian Tribes within a state, as well as Alaska Native
organizations, to receive a portion of the state’s TANF block grant directly and then use it to operate their own TANF
programs.
Maintenance-of-Effort (MOE) Requirement:
Each year, a state is required to meet a TANF maintenance-of-effort (MOE) obligation. The amount is based on its
historical spending, defined as its 1994 contribution to Aid to Families with Dependent Children (AFDC) and related work
programs. States can count as MOE spending any state or third-party spending that benefits members of needy families
and meets one of the four purposes of TANF. MOE funds must be spent during the year in which they are claimed.
To meet its MOE obligation, a state must spend at least 80 percent of its historical spending. This minimum share is
reduced to 75 percent for any year in which a state meets the TANF Work Participation Rate (WPR). In order to qualify
for the Contingency Fund, a state must meet a 100 percent MOE requirement. Spending on child care and certain non-
TANF programs does not count toward this special Contingency Fund MOE requirement.
Using a formula used by the federal government, states can translate any MOE spending in excess of their minimum
MOE requirement into a caseload reduction credit. This helps a state to meet its WPR because the WPR a state must
achieve is reduced by one percentage point for every percentage point reduction in the caseload since 2005.
The Deficit Reduction Act of 2005 made it harder for states to meet the TANF WPR. In order to boost their caseload
reduction credit, some states found it advantageous to report MOE they had not previously reported. Once the
recession hit, some states also reported additional MOE in order to be eligible for TANF Contingency Funds. When
states more aggressively identify and report additional MOE spending, it appears to increase total TANF/MOE spending,
even if no actual increase in spending occurred. If the excess MOE spending is reported in just a few spending
categories, it will significantly change the apportionment of spending across categories.

Guide to Spending Categories
Spending Data Technical Notes Data Source: U.S. Department of Health and Human Services and the Center for Law and Social Policy DataFinder and
TANF Spending Analysis.
When the Total Federal Funds Used exceed the federal Block Grant amount it may be because the state spent funds it
had in reserve from previous years or it received additional funds from the TANF Contingency Fund or the TANF
Emergency Fund. In some instances, a state was not awarded the Emergency Funds until 2010 for increased
TANF/MOE spending that occurred in 2009.
The TANF Block Grant Amount line in the MOE and Block Grant Spending graph includes Supplemental Grants but
excludes Tribal TANF. (Tribal TANF spending is not included in the spending analysis.)
States can report adjustments for prior years that may appear as “negative expenditures” in the current year. If such
negative adjustments exceed current spending in a category, that category will show negative expenditures for the year.
In most cases, this reflects changes in the funding stream which expenditures are charged against, rather than real
reductions in funds available for an activity. However, in some cases funds may have been recovered from a program or
transferred back from SSBG or CCDBG to TANF. For the purposes of the tables, negative expenditures are included as
reported by ACF. For the purposes of the charts, negative expenditures are treated as equal to zero.
Poverty Data Technical Notes
Data Source: Current Population Survey (CPS). Two years of Current Population Survey (CPS) data were merged to
improve reliability. For example, 2008-09 represents merged CPS poverty data for calendar years 2008 and 2009.
CBPP Category Federal Reporting Categories
Basic Assistance Basic Assistance
Administration and Systems Administration
Systems
Work-related Activities and Supports1
Work Subsidies
Education and Training
Other Work Activities/Expenses
Transportation (all categories) and Other Supportive Services
Individual Development Accounts
Child Care Child Care Assistance and Nonassistance
Funds Transferred to Child Care and Development Fund
Refundable Tax Credits Refundable Earned Income Tax Credit
Other Refundable Tax Credits
Nonrecurrent Short-Term Benefits Nonrecurrent Short-Term Benefits
Pregnancy Prevention& 2-Parent Family Formation and
Maintenance
Prevention of Out-of-Wedlock Pregnancies
Two-Parent Family Formation and Maintenance
Transferred to Social Services Block Grant Transferred to Social Services Block Grant
Authorized Under Prior Law and Other Nonassistance2,3 Assistance and Non-Assistance Solely Under Prior Law
Other Nonassistance
1 Federal reporting categories separate Assistance and Nonassistance; we combined them for analysis. 2 Spending on certain pre-TANF activities are permissible even if the expenditures are not otherwise consistent with the purposes of TANF and/or with the
prohibitions included in the 1996 welfare law. This spending has been reported as Authorized Under Prior Law since fiscal year 2000. 3Prior to fiscal year 2000, states reported Other instead of Other Nonassistance. Other Nonassistance is a catch-all category for expenditures that meet
one of the purposes of TANF and which do not fit in any other reporting category.

The value of the TANF block grant has declined while need remains high.
State TANF Block Grant amounts, after adjusting for inflation, eroded by 25 percent between fiscal years 1997 and
2009 and by 28 percent by 2011.
The block grant did not rise or fall to meet Pennsylvania's changing needs. In 2008-09, 197,738 Pennsylvania families
with children lived in poverty. The number of families in poverty reached a low of 159,000 in 1999-00 and a high of
224,000 in 2003-04.
The amount of federal TANF and state maintenance-of-effort (MOE) funds spent
in a given year varies over time and reflects the condition of the economy and
state policy and budgeting choices.
Pennsylvania's TANF and MOE spending has
declined from 2004 through 2007 with a slight
increase during the recent recession.
MOE and Block Grant Spending in Pennsylvania
2009 Federal TANF Allocations
TANF Block Grant Amount 719
TANF Supplemental Grant n/a
Contingency Fund 0
Emergency Fund 29
MOE Obligation
80% MOE Obligation 434
75% MOE Obligation 407
MOE and Block Grant Spending in Pennsylvania
In millions of dollars FY 2001 FY 2009
Total Federal TANF Funds Used 620 710
TANF Funds spent 568 545
Funds transferred to SSBG 27 23
Funds transferred to CCDBG 26 26
Reported MOE Spending 407 428
Additional background on TANF and MOE funds and technical notes for this fact
sheet are available in following pages.

Use of federal TANF and state MOE funds has changed over time.
Total Spending by Category in Pennsylvania
Trends in Selected Spending Categories
(in millions of dollars and as a percentage of spending)
FY 2001 FY 2009
Reported Spending
Percentage of Total Funds Used
Reported Spending
Percentage of Total Funds Used
Basic Assistance 305 30% 198 17%
Administration and Systems 102 10% 77 7%
Work-related Activities and Supports 135 13% 192 17%
Child Care 127 12% 428 38%
Pregnancy Prevention & 2-Parent Family Formation and Maintenance
8 1% 78 7%
Authorized under Prior Law and Other Nonassistance 319 31% 78 7%
In fiscal year 2009, Pennsylvania spent 17 percent of its TANF/MOE expenditures on Basic Assistance, 10 percentage
points below the national average for spending in this category. Pennsylvania has decreased its Basic Assistance
spending by 35 percent since 2001.
The largest share of Pennsylvania's TANF and MOE spending is on Child Care, representing 39 percent of total spending
in 2009.

Federal TANF Funds:
Each state gets a fixed annual TANF Block Grant (known formally as the State Family Assistance Grant) allocation each
year. In addition, some states may get additional TANF federal funds in a year from:
o Supplemental Grants: Congress created the Supplemental Grants along with the TANF block grant in order to
provide additional funds to states potentially disadvantaged by the block grant formula, either due to high
population growth or because the state historically had provided relatively small cash grants. Seventeen states
receive Supplemental Grants. The amount they receive was constant each year until 2011, when the
Supplemental Grants were not fully funded.
o Contingency Fund: Congress created the Contingency Fund as part of the 1996 TANF law to provide additional
help to states in hard economic times. Over a third of states received TANF Contingency Funds in 2009.
o Emergency Fund: Congress created the Emergency Fund as part of the 2009 Recovery Act to reimburse
states for 80 percent of increased TANF or MOE funding. Every state but one received support from the Fund
in 2009 or 2010. The Fund expired on September 30, 2010.
o High Performance Bonus. Through 2004, states could receive additional federal TANF funds for strong
performance in meeting the objectives of TANF.
States can carry over TANF funds (except for Contingency Funds) from year to year, so a state may spend more or less
than the federal TANF allocation in a given year.
A state can transfer up to 30 percent of its block grant funds for a year to the Child Care and Development Block Grant
(CCDBG) and up to 10 percent to the Social Services Block Grant (SSBG), provided that the total amount transferred
does not exceed 30 percent of its current-year block grant.
The Tribal TANF option allows federally recognized American Indian Tribes within a state, as well as Alaska Native
organizations, to receive a portion of the state’s TANF block grant directly and then use it to operate their own TANF
programs.
Maintenance-of-Effort (MOE) Requirement:
Each year, a state is required to meet a TANF maintenance-of-effort (MOE) obligation. The amount is based on its
historical spending, defined as its 1994 contribution to Aid to Families with Dependent Children (AFDC) and related work
programs. States can count as MOE spending any state or third-party spending that benefits members of needy families
and meets one of the four purposes of TANF. MOE funds must be spent during the year in which they are claimed.
To meet its MOE obligation, a state must spend at least 80 percent of its historical spending. This minimum share is
reduced to 75 percent for any year in which a state meets the TANF Work Participation Rate (WPR). In order to qualify
for the Contingency Fund, a state must meet a 100 percent MOE requirement. Spending on child care and certain non-
TANF programs does not count toward this special Contingency Fund MOE requirement.
Using a formula used by the federal government, states can translate any MOE spending in excess of their minimum
MOE requirement into a caseload reduction credit. This helps a state to meet its WPR because the WPR a state must
achieve is reduced by one percentage point for every percentage point reduction in the caseload since 2005.
The Deficit Reduction Act of 2005 made it harder for states to meet the TANF WPR. In order to boost their caseload
reduction credit, some states found it advantageous to report MOE they had not previously reported. Once the
recession hit, some states also reported additional MOE in order to be eligible for TANF Contingency Funds. When
states more aggressively identify and report additional MOE spending, it appears to increase total TANF/MOE spending,
even if no actual increase in spending occurred. If the excess MOE spending is reported in just a few spending
categories, it will significantly change the apportionment of spending across categories.

Guide to Spending Categories
Spending Data Technical Notes Data Source: U.S. Department of Health and Human Services and the Center for Law and Social Policy DataFinder and
TANF Spending Analysis.
When the Total Federal Funds Used exceed the federal Block Grant amount it may be because the state spent funds it
had in reserve from previous years or it received additional funds from the TANF Contingency Fund or the TANF
Emergency Fund. In some instances, a state was not awarded the Emergency Funds until 2010 for increased
TANF/MOE spending that occurred in 2009.
The TANF Block Grant Amount line in the MOE and Block Grant Spending graph includes Supplemental Grants but
excludes Tribal TANF. (Tribal TANF spending is not included in the spending analysis.)
States can report adjustments for prior years that may appear as “negative expenditures” in the current year. If such
negative adjustments exceed current spending in a category, that category will show negative expenditures for the year.
In most cases, this reflects changes in the funding stream which expenditures are charged against, rather than real
reductions in funds available for an activity. However, in some cases funds may have been recovered from a program or
transferred back from SSBG or CCDBG to TANF. For the purposes of the tables, negative expenditures are included as
reported by ACF. For the purposes of the charts, negative expenditures are treated as equal to zero.
Poverty Data Technical Notes
Data Source: Current Population Survey (CPS). Two years of Current Population Survey (CPS) data were merged to
improve reliability. For example, 2008-09 represents merged CPS poverty data for calendar years 2008 and 2009.
CBPP Category Federal Reporting Categories
Basic Assistance Basic Assistance
Administration and Systems Administration
Systems
Work-related Activities and Supports1
Work Subsidies
Education and Training
Other Work Activities/Expenses
Transportation (all categories) and Other Supportive Services
Individual Development Accounts
Child Care Child Care Assistance and Nonassistance
Funds Transferred to Child Care and Development Fund
Refundable Tax Credits Refundable Earned Income Tax Credit
Other Refundable Tax Credits
Nonrecurrent Short-Term Benefits Nonrecurrent Short-Term Benefits
Pregnancy Prevention& 2-Parent Family Formation and
Maintenance
Prevention of Out-of-Wedlock Pregnancies
Two-Parent Family Formation and Maintenance
Transferred to Social Services Block Grant Transferred to Social Services Block Grant
Authorized Under Prior Law and Other Nonassistance2,3 Assistance and Non-Assistance Solely Under Prior Law
Other Nonassistance
1 Federal reporting categories separate Assistance and Nonassistance; we combined them for analysis. 2 Spending on certain pre-TANF activities are permissible even if the expenditures are not otherwise consistent with the purposes of TANF and/or with the
prohibitions included in the 1996 welfare law. This spending has been reported as Authorized Under Prior Law since fiscal year 2000. 3Prior to fiscal year 2000, states reported Other instead of Other Nonassistance. Other Nonassistance is a catch-all category for expenditures that meet
one of the purposes of TANF and which do not fit in any other reporting category.

The value of the TANF block grant has declined while need remains high.
State TANF Block Grant amounts, after adjusting for inflation, eroded by 25 percent between fiscal years 1997 and
2009 and by 28 percent by 2011.
The block grant did not rise or fall to meet Rhode Island's changing needs. In 2008-09, 23,988 Rhode Island families
with children lived in poverty. The number of families in poverty reached a low of 15,000 in 2000-01 and a high of
24,000 in 2008-09.
The amount of federal TANF and state maintenance-of-effort (MOE) funds spent
in a given year varies over time and reflects the condition of the economy and
state policy and budgeting choices.
Spending from the TANF Block Grant has
remained relatively constant, with some dips,
over the last decade, although since 2003 more
of the TANF Block Grant funds have been
transferred to the Child Care Development
Block Grant and the Social Services Block
Grant. The data for Rhode Island's MOE
spending in 2008 and 2009 appears to be
incomplete so it is difficult to draw a conclusion
for those years.
2009 Federal TANF Allocations
TANF Block Grant Amount 95
TANF Supplemental Grant n/a
Contingency Fund 0
Emergency Fund 0
MOE Obligation
80% MOE Obligation 64
75% MOE Obligation 60
MOE and Block Grant Spending in Rhode Island
MOE and Block Grant Spending in Rhode Island
In millions of dollars FY 2001 FY 2009
Total Federal TANF Funds Used 95 99
TANF Funds spent 95 75
Funds transferred to SSBG 0 8
Funds transferred to CCDBG 1 1
Reported MOE Spending 67 26
Additional background on TANF and MOE funds and technical notes for this fact
sheet are available in following pages.
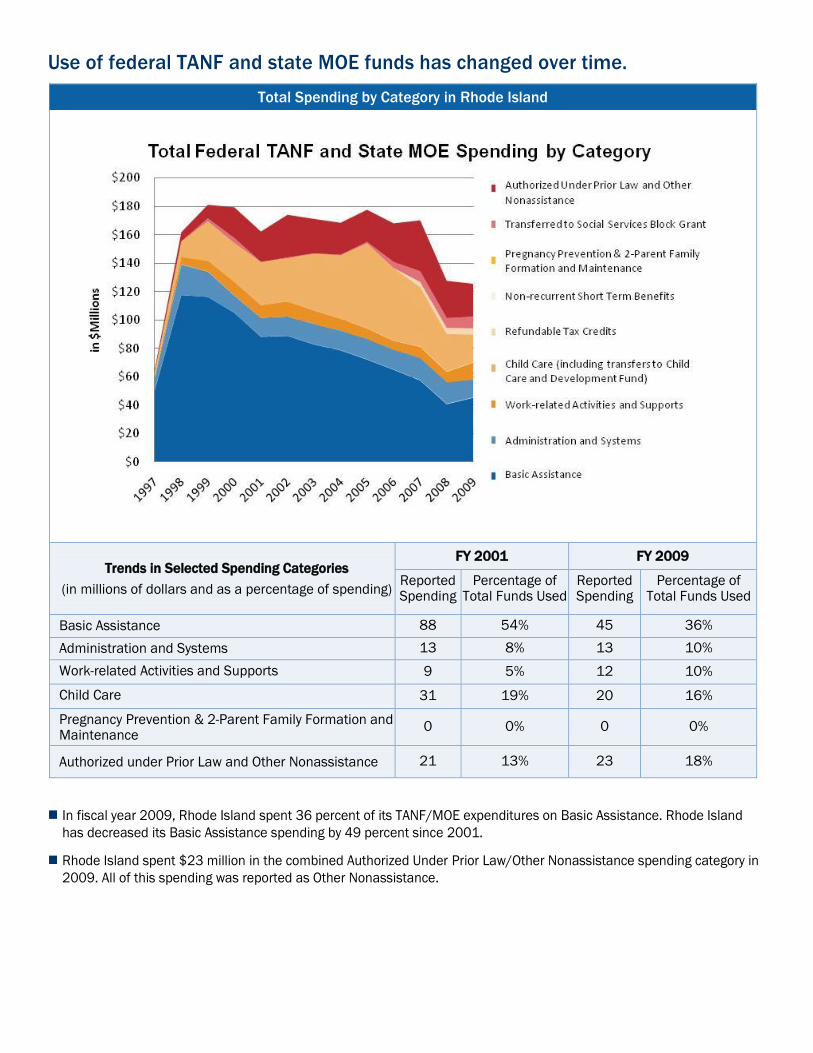
Use of federal TANF and state MOE funds has changed over time.
Total Spending by Category in Rhode Island
Trends in Selected Spending Categories
(in millions of dollars and as a percentage of spending)
FY 2001 FY 2009
Reported Spending
Percentage of Total Funds Used
Reported Spending
Percentage of Total Funds Used
Basic Assistance 88 54% 45 36%
Administration and Systems 13 8% 13 10%
Work-related Activities and Supports 9 5% 12 10%
Child Care 31 19% 20 16%
Pregnancy Prevention & 2-Parent Family Formation and Maintenance
0 0% 0 0%
Authorized under Prior Law and Other Nonassistance 21 13% 23 18%
In fiscal year 2009, Rhode Island spent 36 percent of its TANF/MOE expenditures on Basic Assistance. Rhode Island
has decreased its Basic Assistance spending by 49 percent since 2001.
Rhode Island spent $23 million in the combined Authorized Under Prior Law/Other Nonassistance spending category in
2009. All of this spending was reported as Other Nonassistance.
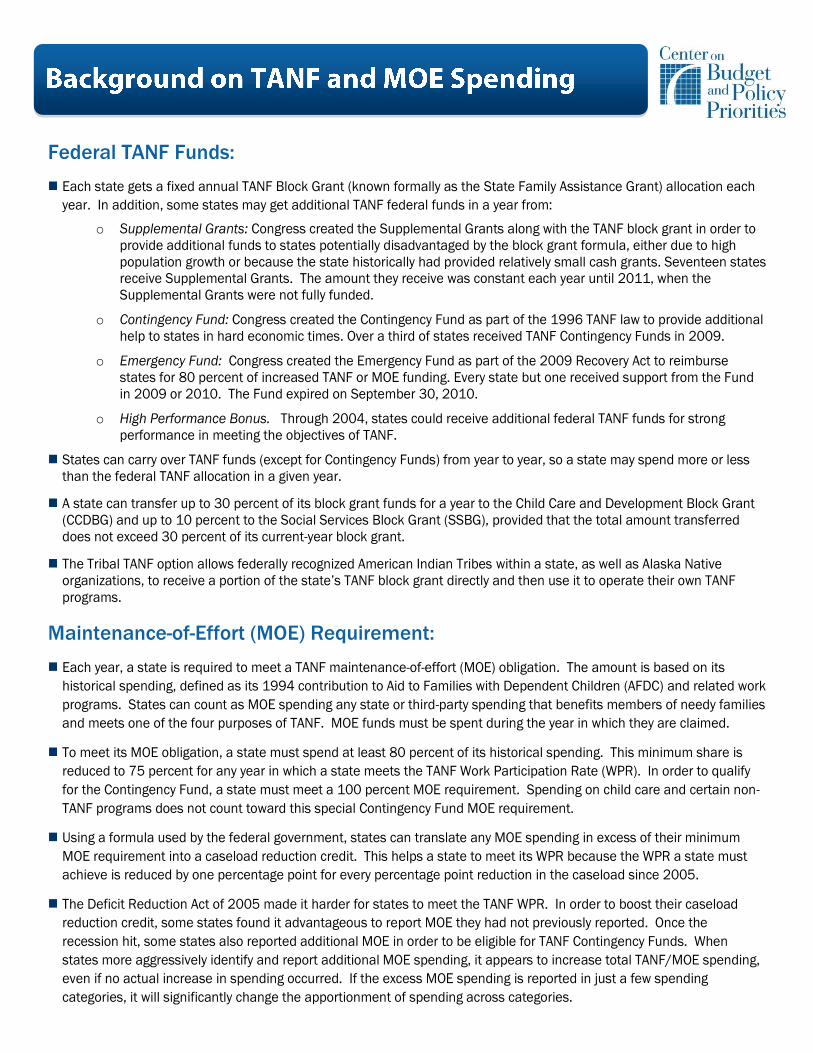
Federal TANF Funds:
Each state gets a fixed annual TANF Block Grant (known formally as the State Family Assistance Grant) allocation each
year. In addition, some states may get additional TANF federal funds in a year from:
o Supplemental Grants: Congress created the Supplemental Grants along with the TANF block grant in order to
provide additional funds to states potentially disadvantaged by the block grant formula, either due to high
population growth or because the state historically had provided relatively small cash grants. Seventeen states
receive Supplemental Grants. The amount they receive was constant each year until 2011, when the
Supplemental Grants were not fully funded.
o Contingency Fund: Congress created the Contingency Fund as part of the 1996 TANF law to provide additional
help to states in hard economic times. Over a third of states received TANF Contingency Funds in 2009.
o Emergency Fund: Congress created the Emergency Fund as part of the 2009 Recovery Act to reimburse
states for 80 percent of increased TANF or MOE funding. Every state but one received support from the Fund
in 2009 or 2010. The Fund expired on September 30, 2010.
o High Performance Bonus. Through 2004, states could receive additional federal TANF funds for strong
performance in meeting the objectives of TANF.
States can carry over TANF funds (except for Contingency Funds) from year to year, so a state may spend more or less
than the federal TANF allocation in a given year.
A state can transfer up to 30 percent of its block grant funds for a year to the Child Care and Development Block Grant
(CCDBG) and up to 10 percent to the Social Services Block Grant (SSBG), provided that the total amount transferred
does not exceed 30 percent of its current-year block grant.
The Tribal TANF option allows federally recognized American Indian Tribes within a state, as well as Alaska Native
organizations, to receive a portion of the state’s TANF block grant directly and then use it to operate their own TANF
programs.
Maintenance-of-Effort (MOE) Requirement:
Each year, a state is required to meet a TANF maintenance-of-effort (MOE) obligation. The amount is based on its
historical spending, defined as its 1994 contribution to Aid to Families with Dependent Children (AFDC) and related work
programs. States can count as MOE spending any state or third-party spending that benefits members of needy families
and meets one of the four purposes of TANF. MOE funds must be spent during the year in which they are claimed.
To meet its MOE obligation, a state must spend at least 80 percent of its historical spending. This minimum share is
reduced to 75 percent for any year in which a state meets the TANF Work Participation Rate (WPR). In order to qualify
for the Contingency Fund, a state must meet a 100 percent MOE requirement. Spending on child care and certain non-
TANF programs does not count toward this special Contingency Fund MOE requirement.
Using a formula used by the federal government, states can translate any MOE spending in excess of their minimum
MOE requirement into a caseload reduction credit. This helps a state to meet its WPR because the WPR a state must
achieve is reduced by one percentage point for every percentage point reduction in the caseload since 2005.
The Deficit Reduction Act of 2005 made it harder for states to meet the TANF WPR. In order to boost their caseload
reduction credit, some states found it advantageous to report MOE they had not previously reported. Once the
recession hit, some states also reported additional MOE in order to be eligible for TANF Contingency Funds. When
states more aggressively identify and report additional MOE spending, it appears to increase total TANF/MOE spending,
even if no actual increase in spending occurred. If the excess MOE spending is reported in just a few spending
categories, it will significantly change the apportionment of spending across categories.

Guide to Spending Categories
Spending Data Technical Notes Data Source: U.S. Department of Health and Human Services and the Center for Law and Social Policy DataFinder and
TANF Spending Analysis.
When the Total Federal Funds Used exceed the federal Block Grant amount it may be because the state spent funds it
had in reserve from previous years or it received additional funds from the TANF Contingency Fund or the TANF
Emergency Fund. In some instances, a state was not awarded the Emergency Funds until 2010 for increased
TANF/MOE spending that occurred in 2009.
The TANF Block Grant Amount line in the MOE and Block Grant Spending graph includes Supplemental Grants but
excludes Tribal TANF. (Tribal TANF spending is not included in the spending analysis.)
States can report adjustments for prior years that may appear as “negative expenditures” in the current year. If such
negative adjustments exceed current spending in a category, that category will show negative expenditures for the year.
In most cases, this reflects changes in the funding stream which expenditures are charged against, rather than real
reductions in funds available for an activity. However, in some cases funds may have been recovered from a program or
transferred back from SSBG or CCDBG to TANF. For the purposes of the tables, negative expenditures are included as
reported by ACF. For the purposes of the charts, negative expenditures are treated as equal to zero.
Poverty Data Technical Notes
Data Source: Current Population Survey (CPS). Two years of Current Population Survey (CPS) data were merged to
improve reliability. For example, 2008-09 represents merged CPS poverty data for calendar years 2008 and 2009.
CBPP Category Federal Reporting Categories
Basic Assistance Basic Assistance
Administration and Systems Administration
Systems
Work-related Activities and Supports1
Work Subsidies
Education and Training
Other Work Activities/Expenses
Transportation (all categories) and Other Supportive Services
Individual Development Accounts
Child Care Child Care Assistance and Nonassistance
Funds Transferred to Child Care and Development Fund
Refundable Tax Credits Refundable Earned Income Tax Credit
Other Refundable Tax Credits
Nonrecurrent Short-Term Benefits Nonrecurrent Short-Term Benefits
Pregnancy Prevention& 2-Parent Family Formation and
Maintenance
Prevention of Out-of-Wedlock Pregnancies
Two-Parent Family Formation and Maintenance
Transferred to Social Services Block Grant Transferred to Social Services Block Grant
Authorized Under Prior Law and Other Nonassistance2,3 Assistance and Non-Assistance Solely Under Prior Law
Other Nonassistance
1 Federal reporting categories separate Assistance and Nonassistance; we combined them for analysis. 2 Spending on certain pre-TANF activities are permissible even if the expenditures are not otherwise consistent with the purposes of TANF and/or with the
prohibitions included in the 1996 welfare law. This spending has been reported as Authorized Under Prior Law since fiscal year 2000. 3Prior to fiscal year 2000, states reported Other instead of Other Nonassistance. Other Nonassistance is a catch-all category for expenditures that meet
one of the purposes of TANF and which do not fit in any other reporting category.

The value of the TANF block grant has declined while need remains high.
State TANF Block Grant amounts, after adjusting for inflation, eroded by 25 percent between fiscal years 1997 and
2009 and by 28 percent by 2011.
The block grant did not rise or fall to meet Vermont's changing needs. In 2008-09, 7,312 Vermont families with children
lived in poverty. The number of families in poverty reached a low of 6,000 in 2005-06 and a high of 11,000 in 1998-99.
The amount of federal TANF and state maintenance-of-effort (MOE) funds spent
in a given year varies over time and reflects the condition of the economy and
state policy and budgeting choices.
Since 2003, Vermont's spending from the
TANF Block Grant has remained relatively flat
and MOE spending has increased modestly
since 2007.
MOE and Block Grant Spending in Vermont
In fiscal year 2009, Vermont reported $39
million in state MOE spending. This represents
115 percent of the amount of state spending on
AFDC and related work programs prior to the
advent of TANF – substantially more than the
minimum MOE requirement of 75 or 80 percent
of historic state spending. Until fiscal year
2003, Vermont’s MOE spending was slightly
above the required 75 or 80 percent level.
MOE and Block Grant Spending in Vermont
In millions of dollars FY 2001 FY 2009
Total Federal TANF Funds Used 45 47
TANF Funds spent 34 33
Funds transferred to SSBG 5 5
Funds transferred to CCDBG 6 6
Reported MOE Spending 27 39
Additional background on TANF and MOE funds and technical notes for this fact
sheet are available in following pages.
2009 Federal TANF Allocations
TANF Block Grant Amount 47
TANF Supplemental Grant n/a
Contingency Fund 0
Emergency Fund 0
MOE Obligation
80% MOE Obligation 27
75% MOE Obligation 26

Use of federal TANF and state MOE funds has changed over time.
Total Spending by Category in Vermont
Trends in Selected Spending Categories
(in millions of dollars and as a percentage of spending)
FY 2001 FY 2009
Reported Spending
Percentage of Total Funds Used
Reported Spending
Percentage of Total Funds Used
Basic Assistance 35 48% 17 20%
Administration and Systems 8 11% 8 9%
Work-related Activities and Supports 7 10% 8 9%
Child Care 13 18% 24 28%
Pregnancy Prevention & 2-Parent Family Formation and Maintenance
0 0% 0 0%
Authorized under Prior Law and Other Nonassistance 0 0% 3 4%
In fiscal year 2009, Vermont spent 20 percent of its TANF/MOE expenditures on Basic Assistance, 8 percentage points
below the national average for spending in this category. Vermont has decreased its Basic Assistance spending by 52
percent since 2001.
The largest share of Vermont's TANF and MOE spending is on Child Care, representing 28 percent of total spending in
2009. The amount of spending on Child Care rose sharply between fiscal years 2006 and 2007 and has plateaued
since then.
While Vermont's spending on basic assistance appears to drop after 2007, caseloads actually increased during the
recession and the drop in spending during this recent period appears to be due to Vermont serving a share of cash
assistance families in a solely state-funded program that does not use TANF or MOE funds in response to TANF changes
in the DRA.

Federal TANF Funds:
Each state gets a fixed annual TANF Block Grant (known formally as the State Family Assistance Grant) allocation each
year. In addition, some states may get additional TANF federal funds in a year from:
o Supplemental Grants: Congress created the Supplemental Grants along with the TANF block grant in order to
provide additional funds to states potentially disadvantaged by the block grant formula, either due to high
population growth or because the state historically had provided relatively small cash grants. Seventeen states
receive Supplemental Grants. The amount they receive was constant each year until 2011, when the
Supplemental Grants were not fully funded.
o Contingency Fund: Congress created the Contingency Fund as part of the 1996 TANF law to provide additional
help to states in hard economic times. Over a third of states received TANF Contingency Funds in 2009.
o Emergency Fund: Congress created the Emergency Fund as part of the 2009 Recovery Act to reimburse
states for 80 percent of increased TANF or MOE funding. Every state but one received support from the Fund
in 2009 or 2010. The Fund expired on September 30, 2010.
o High Performance Bonus. Through 2004, states could receive additional federal TANF funds for strong
performance in meeting the objectives of TANF.
States can carry over TANF funds (except for Contingency Funds) from year to year, so a state may spend more or less
than the federal TANF allocation in a given year.
A state can transfer up to 30 percent of its block grant funds for a year to the Child Care and Development Block Grant
(CCDBG) and up to 10 percent to the Social Services Block Grant (SSBG), provided that the total amount transferred
does not exceed 30 percent of its current-year block grant.
The Tribal TANF option allows federally recognized American Indian Tribes within a state, as well as Alaska Native
organizations, to receive a portion of the state’s TANF block grant directly and then use it to operate their own TANF
programs.
Maintenance-of-Effort (MOE) Requirement:
Each year, a state is required to meet a TANF maintenance-of-effort (MOE) obligation. The amount is based on its
historical spending, defined as its 1994 contribution to Aid to Families with Dependent Children (AFDC) and related work
programs. States can count as MOE spending any state or third-party spending that benefits members of needy families
and meets one of the four purposes of TANF. MOE funds must be spent during the year in which they are claimed.
To meet its MOE obligation, a state must spend at least 80 percent of its historical spending. This minimum share is
reduced to 75 percent for any year in which a state meets the TANF Work Participation Rate (WPR). In order to qualify
for the Contingency Fund, a state must meet a 100 percent MOE requirement. Spending on child care and certain non-
TANF programs does not count toward this special Contingency Fund MOE requirement.
Using a formula used by the federal government, states can translate any MOE spending in excess of their minimum
MOE requirement into a caseload reduction credit. This helps a state to meet its WPR because the WPR a state must
achieve is reduced by one percentage point for every percentage point reduction in the caseload since 2005.
The Deficit Reduction Act of 2005 made it harder for states to meet the TANF WPR. In order to boost their caseload
reduction credit, some states found it advantageous to report MOE they had not previously reported. Once the
recession hit, some states also reported additional MOE in order to be eligible for TANF Contingency Funds. When
states more aggressively identify and report additional MOE spending, it appears to increase total TANF/MOE spending,
even if no actual increase in spending occurred. If the excess MOE spending is reported in just a few spending
categories, it will significantly change the apportionment of spending across categories.

Guide to Spending Categories
Spending Data Technical Notes Data Source: U.S. Department of Health and Human Services and the Center for Law and Social Policy DataFinder and
TANF Spending Analysis.
When the Total Federal Funds Used exceed the federal Block Grant amount it may be because the state spent funds it
had in reserve from previous years or it received additional funds from the TANF Contingency Fund or the TANF
Emergency Fund. In some instances, a state was not awarded the Emergency Funds until 2010 for increased
TANF/MOE spending that occurred in 2009.
The TANF Block Grant Amount line in the MOE and Block Grant Spending graph includes Supplemental Grants but
excludes Tribal TANF. (Tribal TANF spending is not included in the spending analysis.)
States can report adjustments for prior years that may appear as “negative expenditures” in the current year. If such
negative adjustments exceed current spending in a category, that category will show negative expenditures for the year.
In most cases, this reflects changes in the funding stream which expenditures are charged against, rather than real
reductions in funds available for an activity. However, in some cases funds may have been recovered from a program or
transferred back from SSBG or CCDBG to TANF. For the purposes of the tables, negative expenditures are included as
reported by ACF. For the purposes of the charts, negative expenditures are treated as equal to zero.
Poverty Data Technical Notes
Data Source: Current Population Survey (CPS). Two years of Current Population Survey (CPS) data were merged to
improve reliability. For example, 2008-09 represents merged CPS poverty data for calendar years 2008 and 2009.
CBPP Category Federal Reporting Categories
Basic Assistance Basic Assistance
Administration and Systems Administration
Systems
Work-related Activities and Supports1
Work Subsidies
Education and Training
Other Work Activities/Expenses
Transportation (all categories) and Other Supportive Services
Individual Development Accounts
Child Care Child Care Assistance and Nonassistance
Funds Transferred to Child Care and Development Fund
Refundable Tax Credits Refundable Earned Income Tax Credit
Other Refundable Tax Credits
Nonrecurrent Short-Term Benefits Nonrecurrent Short-Term Benefits
Pregnancy Prevention& 2-Parent Family Formation and
Maintenance
Prevention of Out-of-Wedlock Pregnancies
Two-Parent Family Formation and Maintenance
Transferred to Social Services Block Grant Transferred to Social Services Block Grant
Authorized Under Prior Law and Other Nonassistance2,3 Assistance and Non-Assistance Solely Under Prior Law
Other Nonassistance
1 Federal reporting categories separate Assistance and Nonassistance; we combined them for analysis. 2 Spending on certain pre-TANF activities are permissible even if the expenditures are not otherwise consistent with the purposes of TANF and/or with the
prohibitions included in the 1996 welfare law. This spending has been reported as Authorized Under Prior Law since fiscal year 2000. 3Prior to fiscal year 2000, states reported Other instead of Other Nonassistance. Other Nonassistance is a catch-all category for expenditures that meet
one of the purposes of TANF and which do not fit in any other reporting category.

The value of the TANF block grant has declined while need remains high.
State TANF Block Grant amounts, after adjusting for inflation, eroded by 25 percent between fiscal years 1997 and
2009 and by 28 percent by 2011.
The block grant did not rise or fall to meet Virginia's changing needs. In 2008-09, 124,706 Virginia families with children
lived in poverty. The number of families in poverty reached a low of 89,000 in 1998-99 and a high of 137,000 in 1996-
97.
The amount of federal TANF and state maintenance-of-effort (MOE) funds spent
in a given year varies over time and reflects the condition of the economy and
state policy and budgeting choices.
Virginia’s spending from the TANF block grant
dipped in 2007 and 2009.
MOE and Block Grant Spending in Virginia
2009 Federal TANF Allocations
TANF Block Grant Amount 158
TANF Supplemental Grant n/a
Contingency Fund 0
Emergency Fund 0
MOE Obligation
80% MOE Obligation 137
75% MOE Obligation 128
MOE and Block Grant Spending in Virginia
In millions of dollars FY 2001 FY 2009
Total Federal TANF Funds Used 171 139
TANF Funds spent 127 112
Funds transferred to SSBG 16 14
Funds transferred to CCDBG 28 28
Reported MOE Spending 128 143
Additional background on TANF and MOE funds and technical notes for this fact
sheet are available in following pages.

Use of federal TANF and state MOE funds has changed over time.
Total Spending by Category in Virginia
Trends in Selected Spending Categories
(in millions of dollars and as a percentage of spending)
FY 2001 FY 2009
Reported Spending
Percentage of Total Funds Used
Reported Spending
Percentage of Total Funds Used
Basic Assistance 103 34% 74 26%
Administration and Systems 36 12% 26 9%
Work-related Activities and Supports 74 25% 64 23%
Child Care 49 16% 40 14%
Pregnancy Prevention & 2-Parent Family Formation and Maintenance
1 0% 32 11%
Authorized under Prior Law and Other Nonassistance 16 5% 24 8%
In fiscal year 2009, Virginia spent 26 percent of its TANF/MOE expenditures on Basic Assistance, slightly below the
national average for spending in this category. Virginia has decreased its Basic Assistance spending by 28 percent since
2001.
Virginia spent 23 percent of its TANF/MOE expenditures on Work-related Activities and Supports. Most of this spending
was reported as Other Work-related Activities. Expenditures in this category have declined by 13 percent since fiscal
year 2001.

Federal TANF Funds:
Each state gets a fixed annual TANF Block Grant (known formally as the State Family Assistance Grant) allocation each
year. In addition, some states may get additional TANF federal funds in a year from:
o Supplemental Grants: Congress created the Supplemental Grants along with the TANF block grant in order to
provide additional funds to states potentially disadvantaged by the block grant formula, either due to high
population growth or because the state historically had provided relatively small cash grants. Seventeen states
receive Supplemental Grants. The amount they receive was constant each year until 2011, when the
Supplemental Grants were not fully funded.
o Contingency Fund: Congress created the Contingency Fund as part of the 1996 TANF law to provide additional
help to states in hard economic times. Over a third of states received TANF Contingency Funds in 2009.
o Emergency Fund: Congress created the Emergency Fund as part of the 2009 Recovery Act to reimburse
states for 80 percent of increased TANF or MOE funding. Every state but one received support from the Fund
in 2009 or 2010. The Fund expired on September 30, 2010.
o High Performance Bonus. Through 2004, states could receive additional federal TANF funds for strong
performance in meeting the objectives of TANF.
States can carry over TANF funds (except for Contingency Funds) from year to year, so a state may spend more or less
than the federal TANF allocation in a given year.
A state can transfer up to 30 percent of its block grant funds for a year to the Child Care and Development Block Grant
(CCDBG) and up to 10 percent to the Social Services Block Grant (SSBG), provided that the total amount transferred
does not exceed 30 percent of its current-year block grant.
The Tribal TANF option allows federally recognized American Indian Tribes within a state, as well as Alaska Native
organizations, to receive a portion of the state’s TANF block grant directly and then use it to operate their own TANF
programs.
Maintenance-of-Effort (MOE) Requirement:
Each year, a state is required to meet a TANF maintenance-of-effort (MOE) obligation. The amount is based on its
historical spending, defined as its 1994 contribution to Aid to Families with Dependent Children (AFDC) and related work
programs. States can count as MOE spending any state or third-party spending that benefits members of needy families
and meets one of the four purposes of TANF. MOE funds must be spent during the year in which they are claimed.
To meet its MOE obligation, a state must spend at least 80 percent of its historical spending. This minimum share is
reduced to 75 percent for any year in which a state meets the TANF Work Participation Rate (WPR). In order to qualify
for the Contingency Fund, a state must meet a 100 percent MOE requirement. Spending on child care and certain non-
TANF programs does not count toward this special Contingency Fund MOE requirement.
Using a formula used by the federal government, states can translate any MOE spending in excess of their minimum
MOE requirement into a caseload reduction credit. This helps a state to meet its WPR because the WPR a state must
achieve is reduced by one percentage point for every percentage point reduction in the caseload since 2005.
The Deficit Reduction Act of 2005 made it harder for states to meet the TANF WPR. In order to boost their caseload
reduction credit, some states found it advantageous to report MOE they had not previously reported. Once the
recession hit, some states also reported additional MOE in order to be eligible for TANF Contingency Funds. When
states more aggressively identify and report additional MOE spending, it appears to increase total TANF/MOE spending,
even if no actual increase in spending occurred. If the excess MOE spending is reported in just a few spending
categories, it will significantly change the apportionment of spending across categories.

Guide to Spending Categories
Spending Data Technical Notes Data Source: U.S. Department of Health and Human Services and the Center for Law and Social Policy DataFinder and
TANF Spending Analysis.
When the Total Federal Funds Used exceed the federal Block Grant amount it may be because the state spent funds it
had in reserve from previous years or it received additional funds from the TANF Contingency Fund or the TANF
Emergency Fund. In some instances, a state was not awarded the Emergency Funds until 2010 for increased
TANF/MOE spending that occurred in 2009.
The TANF Block Grant Amount line in the MOE and Block Grant Spending graph includes Supplemental Grants but
excludes Tribal TANF. (Tribal TANF spending is not included in the spending analysis.)
States can report adjustments for prior years that may appear as “negative expenditures” in the current year. If such
negative adjustments exceed current spending in a category, that category will show negative expenditures for the year.
In most cases, this reflects changes in the funding stream which expenditures are charged against, rather than real
reductions in funds available for an activity. However, in some cases funds may have been recovered from a program or
transferred back from SSBG or CCDBG to TANF. For the purposes of the tables, negative expenditures are included as
reported by ACF. For the purposes of the charts, negative expenditures are treated as equal to zero.
Poverty Data Technical Notes
Data Source: Current Population Survey (CPS). Two years of Current Population Survey (CPS) data were merged to
improve reliability. For example, 2008-09 represents merged CPS poverty data for calendar years 2008 and 2009.
CBPP Category Federal Reporting Categories
Basic Assistance Basic Assistance
Administration and Systems Administration
Systems
Work-related Activities and Supports1
Work Subsidies
Education and Training
Other Work Activities/Expenses
Transportation (all categories) and Other Supportive Services
Individual Development Accounts
Child Care Child Care Assistance and Nonassistance
Funds Transferred to Child Care and Development Fund
Refundable Tax Credits Refundable Earned Income Tax Credit
Other Refundable Tax Credits
Nonrecurrent Short-Term Benefits Nonrecurrent Short-Term Benefits
Pregnancy Prevention& 2-Parent Family Formation and
Maintenance
Prevention of Out-of-Wedlock Pregnancies
Two-Parent Family Formation and Maintenance
Transferred to Social Services Block Grant Transferred to Social Services Block Grant
Authorized Under Prior Law and Other Nonassistance2,3 Assistance and Non-Assistance Solely Under Prior Law
Other Nonassistance
1 Federal reporting categories separate Assistance and Nonassistance; we combined them for analysis. 2 Spending on certain pre-TANF activities are permissible even if the expenditures are not otherwise consistent with the purposes of TANF and/or with the
prohibitions included in the 1996 welfare law. This spending has been reported as Authorized Under Prior Law since fiscal year 2000. 3Prior to fiscal year 2000, states reported Other instead of Other Nonassistance. Other Nonassistance is a catch-all category for expenditures that meet
one of the purposes of TANF and which do not fit in any other reporting category.
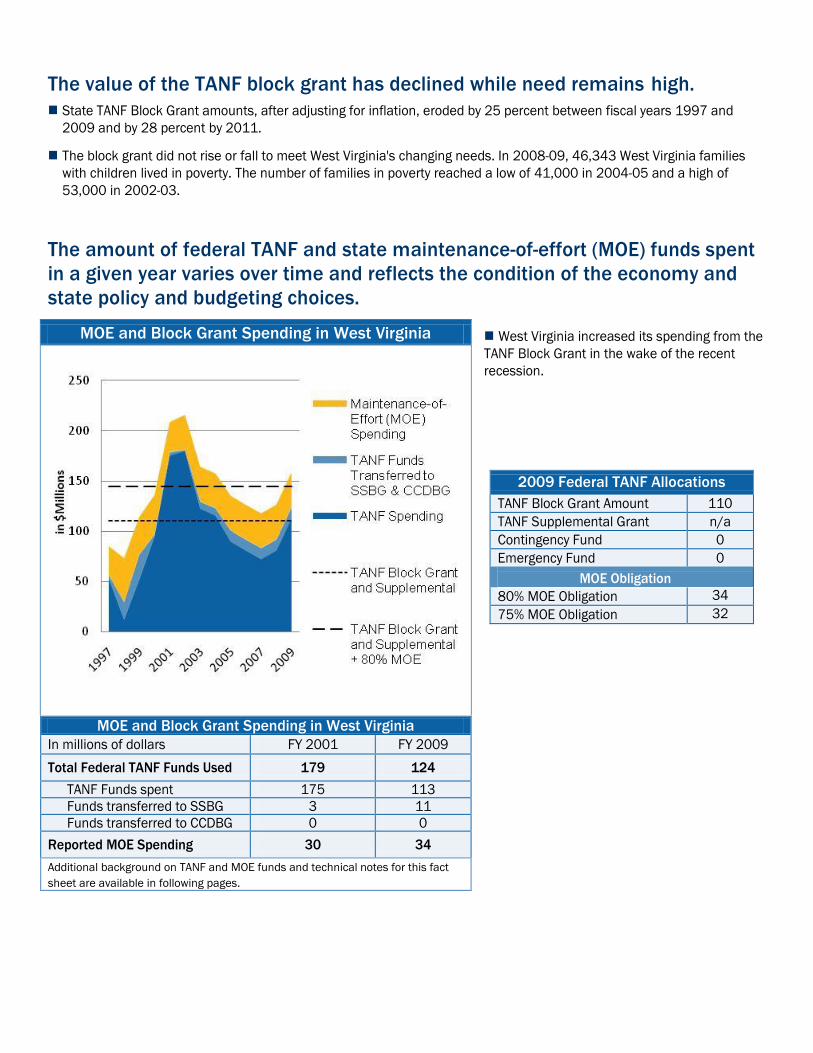
The value of the TANF block grant has declined while need remains high.
State TANF Block Grant amounts, after adjusting for inflation, eroded by 25 percent between fiscal years 1997 and
2009 and by 28 percent by 2011.
The block grant did not rise or fall to meet West Virginia's changing needs. In 2008-09, 46,343 West Virginia families
with children lived in poverty. The number of families in poverty reached a low of 41,000 in 2004-05 and a high of
53,000 in 2002-03.
The amount of federal TANF and state maintenance-of-effort (MOE) funds spent
in a given year varies over time and reflects the condition of the economy and
state policy and budgeting choices.
West Virginia increased its spending from the
TANF Block Grant in the wake of the recent
recession.
MOE and Block Grant Spending in West Virginia
2009 Federal TANF Allocations
TANF Block Grant Amount 110
TANF Supplemental Grant n/a
Contingency Fund 0
Emergency Fund 0
MOE Obligation
80% MOE Obligation 34
75% MOE Obligation 32
MOE and Block Grant Spending in West Virginia
In millions of dollars FY 2001 FY 2009
Total Federal TANF Funds Used 179 124
TANF Funds spent 175 113
Funds transferred to SSBG 3 11
Funds transferred to CCDBG 0 0
Reported MOE Spending 30 34
Additional background on TANF and MOE funds and technical notes for this fact
sheet are available in following pages.

Use of federal TANF and state MOE funds has changed over time.
Total Spending by Category in West Virginia
Trends in Selected Spending Categories
(in millions of dollars and as a percentage of spending)
FY 2001 FY 2009
Reported Spending
Percentage of Total Funds Used
Reported Spending
Percentage of Total Funds Used
Basic Assistance 64 31% 32 20%
Administration and Systems 21 10% 26 16%
Work-related Activities and Supports 42 20% 18 12%
Child Care 30 15% 28 18%
Pregnancy Prevention & 2-Parent Family Formation and Maintenance
40 19% 4 2%
Authorized under Prior Law and Other Nonassistance 5 3% 40 25%
In fiscal year 2009, West Virginia spent 20 percent of its TANF/MOE expenditures on Basic Assistance, 8 percentage
points below the national average for spending in this category. West Virginia has decreased its Basic Assistance
spending by 51 percent since 2001.
West Virginia spent 25 percent of its TANF/MOE expenditures in the combined Authorized Under Prior Law/Other
Nonassistance spending category in 2009. This is an increase of over $34 million from 2001 when less than 3 percent
of TANF/MOE funds were spend in this combined category. The substantial increase in reported spending in this
category first occurred between fiscal years 2005 and 2006. Most of this spending was reported as Authorized Under
Prior Law.
Over the years, West Virginia has pulled back TANF/MOE spending on Work-related Activities and Supports. In 2009,
West Virginia spent $18 million in TANF/MOE on child care, representing 12 percent of its TANF and MOE funds; in
contrast, in 2001, West Virginia spent $42 million in TANF/MOE on Work-related Activities and Supports representing
20 percent of TANF/MOE spending for that year.

Federal TANF Funds:
Each state gets a fixed annual TANF Block Grant (known formally as the State Family Assistance Grant) allocation each
year. In addition, some states may get additional TANF federal funds in a year from:
o Supplemental Grants: Congress created the Supplemental Grants along with the TANF block grant in order to
provide additional funds to states potentially disadvantaged by the block grant formula, either due to high
population growth or because the state historically had provided relatively small cash grants. Seventeen states
receive Supplemental Grants. The amount they receive was constant each year until 2011, when the
Supplemental Grants were not fully funded.
o Contingency Fund: Congress created the Contingency Fund as part of the 1996 TANF law to provide additional
help to states in hard economic times. Over a third of states received TANF Contingency Funds in 2009.
o Emergency Fund: Congress created the Emergency Fund as part of the 2009 Recovery Act to reimburse
states for 80 percent of increased TANF or MOE funding. Every state but one received support from the Fund
in 2009 or 2010. The Fund expired on September 30, 2010.
o High Performance Bonus. Through 2004, states could receive additional federal TANF funds for strong
performance in meeting the objectives of TANF.
States can carry over TANF funds (except for Contingency Funds) from year to year, so a state may spend more or less
than the federal TANF allocation in a given year.
A state can transfer up to 30 percent of its block grant funds for a year to the Child Care and Development Block Grant
(CCDBG) and up to 10 percent to the Social Services Block Grant (SSBG), provided that the total amount transferred
does not exceed 30 percent of its current-year block grant.
The Tribal TANF option allows federally recognized American Indian Tribes within a state, as well as Alaska Native
organizations, to receive a portion of the state’s TANF block grant directly and then use it to operate their own TANF
programs.
Maintenance-of-Effort (MOE) Requirement:
Each year, a state is required to meet a TANF maintenance-of-effort (MOE) obligation. The amount is based on its
historical spending, defined as its 1994 contribution to Aid to Families with Dependent Children (AFDC) and related work
programs. States can count as MOE spending any state or third-party spending that benefits members of needy families
and meets one of the four purposes of TANF. MOE funds must be spent during the year in which they are claimed.
To meet its MOE obligation, a state must spend at least 80 percent of its historical spending. This minimum share is
reduced to 75 percent for any year in which a state meets the TANF Work Participation Rate (WPR). In order to qualify
for the Contingency Fund, a state must meet a 100 percent MOE requirement. Spending on child care and certain non-
TANF programs does not count toward this special Contingency Fund MOE requirement.
Using a formula used by the federal government, states can translate any MOE spending in excess of their minimum
MOE requirement into a caseload reduction credit. This helps a state to meet its WPR because the WPR a state must
achieve is reduced by one percentage point for every percentage point reduction in the caseload since 2005.
The Deficit Reduction Act of 2005 made it harder for states to meet the TANF WPR. In order to boost their caseload
reduction credit, some states found it advantageous to report MOE they had not previously reported. Once the
recession hit, some states also reported additional MOE in order to be eligible for TANF Contingency Funds. When
states more aggressively identify and report additional MOE spending, it appears to increase total TANF/MOE spending,
even if no actual increase in spending occurred. If the excess MOE spending is reported in just a few spending
categories, it will significantly change the apportionment of spending across categories.

Guide to Spending Categories
Spending Data Technical Notes Data Source: U.S. Department of Health and Human Services and the Center for Law and Social Policy DataFinder and
TANF Spending Analysis.
When the Total Federal Funds Used exceed the federal Block Grant amount it may be because the state spent funds it
had in reserve from previous years or it received additional funds from the TANF Contingency Fund or the TANF
Emergency Fund. In some instances, a state was not awarded the Emergency Funds until 2010 for increased
TANF/MOE spending that occurred in 2009.
The TANF Block Grant Amount line in the MOE and Block Grant Spending graph includes Supplemental Grants but
excludes Tribal TANF. (Tribal TANF spending is not included in the spending analysis.)
States can report adjustments for prior years that may appear as “negative expenditures” in the current year. If such
negative adjustments exceed current spending in a category, that category will show negative expenditures for the year.
In most cases, this reflects changes in the funding stream which expenditures are charged against, rather than real
reductions in funds available for an activity. However, in some cases funds may have been recovered from a program or
transferred back from SSBG or CCDBG to TANF. For the purposes of the tables, negative expenditures are included as
reported by ACF. For the purposes of the charts, negative expenditures are treated as equal to zero.
Poverty Data Technical Notes
Data Source: Current Population Survey (CPS). Two years of Current Population Survey (CPS) data were merged to
improve reliability. For example, 2008-09 represents merged CPS poverty data for calendar years 2008 and 2009.
CBPP Category Federal Reporting Categories
Basic Assistance Basic Assistance
Administration and Systems Administration
Systems
Work-related Activities and Supports1
Work Subsidies
Education and Training
Other Work Activities/Expenses
Transportation (all categories) and Other Supportive Services
Individual Development Accounts
Child Care Child Care Assistance and Nonassistance
Funds Transferred to Child Care and Development Fund
Refundable Tax Credits Refundable Earned Income Tax Credit
Other Refundable Tax Credits
Nonrecurrent Short-Term Benefits Nonrecurrent Short-Term Benefits
Pregnancy Prevention& 2-Parent Family Formation and
Maintenance
Prevention of Out-of-Wedlock Pregnancies
Two-Parent Family Formation and Maintenance
Transferred to Social Services Block Grant Transferred to Social Services Block Grant
Authorized Under Prior Law and Other Nonassistance2,3 Assistance and Non-Assistance Solely Under Prior Law
Other Nonassistance
1 Federal reporting categories separate Assistance and Nonassistance; we combined them for analysis. 2 Spending on certain pre-TANF activities are permissible even if the expenditures are not otherwise consistent with the purposes of TANF and/or with the
prohibitions included in the 1996 welfare law. This spending has been reported as Authorized Under Prior Law since fiscal year 2000. 3Prior to fiscal year 2000, states reported Other instead of Other Nonassistance. Other Nonassistance is a catch-all category for expenditures that meet
one of the purposes of TANF and which do not fit in any other reporting category.