tampa electric company's big bend utility plant in
TRANSCRIPT

University of South FloridaScholar Commons
Graduate Theses and Dissertations Graduate School
January 2015
Tampa Electric Company's Big Bend Utility Plantin Hillsborough County, Florida: A Case StudyLynne M. Hodalski-ChampagneUniversity of South Florida, [email protected]
Follow this and additional works at: http://scholarcommons.usf.edu/etd
Part of the Criminology and Criminal Justice Commons
This Thesis is brought to you for free and open access by the Graduate School at Scholar Commons. It has been accepted for inclusion in GraduateTheses and Dissertations by an authorized administrator of Scholar Commons. For more information, please contact [email protected].
Scholar Commons CitationHodalski-Champagne, Lynne M., "Tampa Electric Company's Big Bend Utility Plant in Hillsborough County, Florida: A Case Study"(2015). Graduate Theses and Dissertations.http://scholarcommons.usf.edu/etd/5703
Tampa Electric Company’s Big Bend Utility Plant in
Hillsborough County, Florida: A Case Study
by
Lynne M. Hodalski-Champagne
A thesis submitted in partial fulfillment
of the requirements for the degree of
Master of Arts
Department of Criminology
College of Behavioral & Community Sciences
University of South Florida
Major Professor: Michael J. Lynch, Ph.D.
Andrew Franz, Esq.
Ráchael A. Powers, Ph.D.
Date of Approval:
July 7, 2015
Keywords: Coal fire power plants, coal fly ash, environmental crime, environmental justice,
environmental racism, corporate environmental violence
Copyright © 2015, Lynne M. Hodalski-Champagne

DEDICATION
This thesis is dedicated to my family who have supported my educational pursuits every
step of the way. In particular, the unconditional love and support of my husband Paul
Champagne, Jr., who has always been positive concerning any project that I have wanted to
pursue, and my brother, Frank Hodalski III, whose knowledge and support were invaluable to
my research. Your belief in my abilities has provided the impetus to continue my love of
learning. I humbly thank you and give you my love.

ACKNOWLEDGMENTS
This thesis was accomplished with the support I received from faculty, mentors, friends
and future colleagues in criminology. This case study was enhanced by the contributions of
Andrew Franz, Esq., whose legal expertise, particularly in environmental crime and the law, led
to many interesting and complex conversations regarding environmental injustices.
Dr. Ráchael A. Powers provided her expertise on victimization and its application to
environmental injustice, and criminological theories applicable to my study. Her assistance
throughout the process of crafting the final document was invaluable.
The entire faculty of the Criminology Department has been generous with their time. A
special thanks to Dr. Elizabeth S. Cass, for her guidance and support, Dr. Lorie Fridell, who took
a chance on someone with no special background in criminology but a desire to learn and a
passion for the subject, and Dr. Kathleen M. Heide, who has inspired me to be better, to do more,
and always be professional; a reflection of my education, past, present and future.
Two of my colleagues in the criminology department gave their assistance and friendship
throughout the process of creating this manuscript. My sincere thanks to Brittany Poyer and
Norair Khachatryan for many hours of reading drafts and providing much needed positive
reinforcement.
My major professor, Dr. Michael J. Lynch, stimulated my research interests in
environmental justice. Thank you Dr. Lynch, for providing that inspiration through the body of
work you have given students and scholars to draw from, and finally, for your mentorship
throughout this process -- I endeavor to exceed your expectations.

i
TABLE OF CONTENTS
List of Tables ................................................................................................................................. iii List of Figures ................................................................................................................................ iv List of Abbreviations and Acronyms ............................................................................................. vi Abstract .......................................................................................................................................... ix Chapter One: Introduction ...............................................................................................................1 Introduction to Case Study...................................................................................................1 The Research Questions .......................................................................................................6 Chapter Two: Literature Review of Environmental Justice ............................................................7 Environmental Law and Regulation ....................................................................................8 Green Victimization and Violence.....................................................................................10 Environmental Justice and Racism ....................................................................................11 Environmental Impacts ......................................................................................................12 What is Coal and the Effects of the Coal Combustion Process? .......................................13 Government Responses to Coal Fire Plants .......................................................................18 Theoretical Implications ....................................................................................................25 Conclusion .........................................................................................................................31 Chapter Three: Literature Review of Medical Effects of CFPP Emissions...................................33 Health and Environmental Effects of CFPP Pollutants .....................................................40 Effects of CFPP Pollutants on Wildlife .............................................................................45 Conclusion .........................................................................................................................47 Chapter Four: The Big Bend Facility.............................................................................................50 Tampa Electric Company: A Business Profile .................................................................50 The Operation of a Coal Fire Plant ....................................................................................51 The Big Bend Facility ........................................................................................................54 Toxins of Concern at TECO’s Big Bend Facility ..............................................................56 The Lawsuits ......................................................................................................................64 Specific Legal Violations ...................................................................................................70 Limitations of the Lawsuits ...............................................................................................73 Settlement of the Lawsuits .................................................................................................74 TECO’s Compliance to the Settlement: What Have They Done? .....................................75 Assessments from Environmental Groups .........................................................................78

ii
Chapter Five: Methods ...................................................................................................................81 Research Philosophy ..........................................................................................................81 Research Site and Demographics.......................................................................................83 Data Collection Methods ...................................................................................................84 Data Analysis Process ........................................................................................................84 Ethics ................................................................................................................................91 Limitations .........................................................................................................................91 Conclusion .........................................................................................................................91 Chapter Six: The Big Bend Case Study: Research Questions and Results of Inquiry ..................93 Research Question 1 ..........................................................................................................93 Research Question 2 ..........................................................................................................97 Research Question 3 ..........................................................................................................98 Research Question 4 ..........................................................................................................99 Research Question 5 ........................................................................................................105 Research Question 6 ........................................................................................................106 Conclusion .......................................................................................................................106 Chapter Seven: Discussion, Future Research and Conclusion ....................................................107 Discussion ........................................................................................................................107 TECO’s Responses and Compliance History ..................................................................107 Environmental Justice Issues ...........................................................................................110 The Utility Lobby ............................................................................................................113 Implications for Future Research and Conclusion ...........................................................115 References ....................................................................................................................................118 Appendices ...................................................................................................................................142 Appendix A: Florida Department of Environmental Protection Communication ...........142 Appendix B: Supplementary Tables ................................................................................143
iii
LIST OF TABLES
Table 1: Characteristics of the Four Major Coal Types ................................................................14
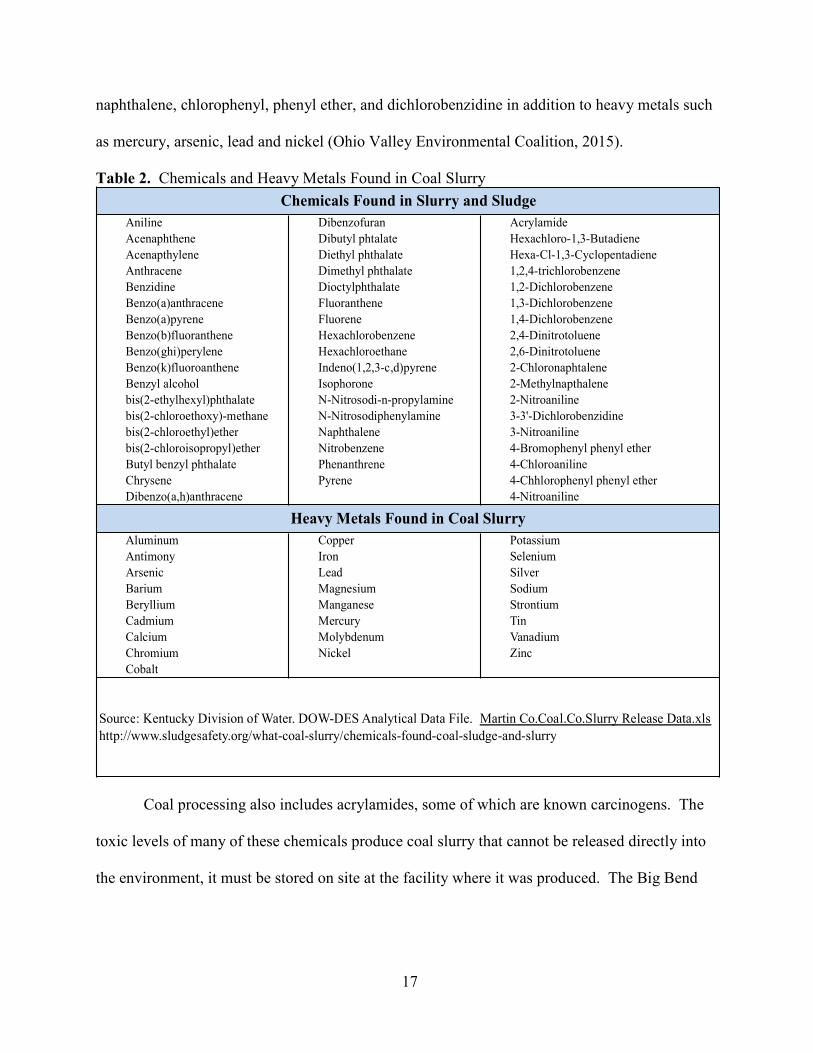
Table 2: Chemicals and Heavy Metals Found in Coal Slurry ......................................................17
Table 3: Contributions of Coal-Fired Power Plants to Selected Hazardous Air Pollutants..........19
Table 4: Industrial Sectors with the Most Hazardous Water Pollution ........................................23
Table 5: Top Ten Hazardous Industrial Water Pollutants ............................................................24
Table 6: Residence Time of Hazardous Air Pollutants in the Atmosphere ..................................37
Table 7: Properties of Hazardous Air Pollutants Emitted From Coal Fired Utilities ...................41
Table 8: Top Hazardous Drinking Water Contaminants ..............................................................48
Table 9: Top Lead Emitters, Big Bend Ranked 29th .....................................................................57
Table 10: Top Nickel Emitters, Big Bend Ranked 44th .................................................................60
Table 11: Clean Water Act Case Report .......................................................................................77
Table 12: Document Inventory .....................................................................................................85
Table 13: Document Relevance to Research Questions ...............................................................94
Table 14: Demographic Profile of Area Surrounding Big Bend Power Station .........................100
Table 15: Health Impacts Attributable to Big Bend Facility ......................................................103
Table 16: Toxic Release Inventory Pollution Report Big Bend Facility, 2005 – 2013 ..............104
Table B1: Toxic Release Inventory of Big Bend Facility, 2005 – 2013 .....................................143
Table B2: National Ambient Air Quality Standards ...................................................................144
Table B3: National Health Impacts from Coal Fired Power Plants ............................................145

iv
LIST OF FIGURES
Figure 1: Hazardous Air Pollutant Emissions by Industry ...........................................................19
Figure 2: Mercury Emissions in Air and Water ............................................................................21
Figure 3: Air Pollution Health Effects Pyramid ...........................................................................34
Figure 4: Relative Sizes of Particulate Matter ..............................................................................36
Figure 5: Spatial Range of Impact ................................................................................................38
Figure 6: TECO Big Bend Timeline of Significant Events ..........................................................65
Figure 7: TECO Big Bend Plant Layout .......................................................................................80
Figure 8: Communities That Surround Big Bend within a Ten Mile Radius ...............................98

v
LIST OF ABBREVIATIONS AND ACRONYMS
ALA American Lung Association
ARI Acute Respiratory Infection
As Arsenic
ASL Airway Surface Liquid
BACT Best Available Control Technology
BTU British Thermal Unit
CAA Clean Air Act
CAIR Clean Air Interstate Rule
CATF Clean Air Task Force
CCP Coal Combustion Products
CERCLA Comprehensive Environmental Response, Conservation and Liability Act
CEV Corporate Environmental Violence
CFA Coal Fly Ash
CFJ Consent Final Judgment
CFPP Coal Fired Power Plant
CFR Code of Federal Regulations
CO Carbon Monoxide
COPD Chronic obstructive pulmonary disease
CPP Coal Preparation Plant
Cr(VI) Hexavalent chromium
CrIII Trivalent chromium
CWA Clean Water Act
DNA Deoxyribonucleic Acid
DOJ Department of Justice
ECHO Enforcement and Compliance History Online
ECRC Environmental Cost Recovery Clause
EH&E Environmental and Engineering Report
EJ Environmental Justice
EPA Environmental Protection Agency
F.A.C. Face Amount Certificate
FDEP Florida Department of Environmental Protection
FGD Flue Gas Desulfurization System
HAP Hazardous Air Pollutant
HCSO Hillsborough County Sheriff’s Office
HC1 Hydrochloric Acid

vi
Hg Mercury
IECG International Energy Coal Generation
IRB Institutional Review Board
kg kilogram
lb pound
LLC Limited Liability Company
MCL Maximum Contaminant Level
mg milligram
mg/L milligrams per liter
MSR Market Stability Reserve
MWh MegaWatts per hour
NAACP National Association for the Advancement of Colored People
NAAQS National Ambient Air Quality Standards
Ni Nickel
nm nanoparticle
NMMAPS National Morbidity, Mortality and Air Pollution Study
NO Nitrogen
NO2 Nitrogen Dioxide
NOV Notice of Violation
NOx Nitrogen Oxide
NRC Nuclear Regulatory Commission
NSR New Source Review
NYSE New York Stock Exchange
O3 Ozone
PAC Political Action Committee
PAH Polynuclear Aromatic Hydrocarbons
Pb Lead
Pb3O4 Lead oxide
PbO Lead oxide
PbO2 Lead oxide
PERI Political Economic Research Institute
PM Particulate Matter
POTWS Publicly Owned Treatment Water Stations
ppm parts per million
PSD Prevention of Significant Deterioration
PVC PolyVinyl Chloride
RCRA Resource Conservation and Recovery Act
RSEI Risk Screening Environmental Indicators
Se Selenium
SIP State Implementation Plan
SMCL Secondary Maximum Contaminant Level
SNC Significant Noncompliance
SO2 Sulfur Dioxide

vii
TECO Tampa Electric Company
ToP Treadmill of Production
TRI Toxic Release Inventory
US United States
USEPA United States Environmental Protection Agency
UTM Universal Transverse Mercator
WEPCO Wisconsin Electric Power Company
WHO World Health Organization
wt/% Weight in Percentage
μg microgram
μm micrometer
viii
ABSTRACT
This is an in-depth analysis of coal fire burning power plants, their effects on human
health and the environment. It also employed case study data from Tampa Electric Company’s
Big Bend facility to examine environmental infractions at that facility. Tampa Electric
Company’s Big Bend Utility Plant, violated the Clean Air Act, which led to a lawsuit filed by the
Department of Justice on behalf of the United States Environmental Protection Agency and the
Florida Department of Environmental Protection in 1997. This case study details the lawsuit,
and subsequent settlement as well as Tampa Electric Company’s record of compliance since
2000. This study examines the area surrounding the plant, and impacts the facility may cause
local residents and the ecosystem in this part of Florida. Several questions are explored in this
case study revolving around environmental justice and environmental racism. Did the actions
taken by the Department of Justice in 2000 on behalf of the Environmental Protection Agency
and the people of the State of Florida through its Department of Environmental Protection fit the
corporate crimes that Tampa Electric were accused of in the lawsuit? Has this company been
compliant with state and federal law as required by the settlement? Finally, has the Tampa
Electric Company maintained their commitment to provide environmental justice for the
communities surrounding the Big Bend Utility Plant or would their actions fit a definition for the
crime of corporate environmental violence?

1
CHAPTER ONE:
INTRODUCTION
Introduction to the Case Study
Coal power provides an inexpensive, reliable power source that is plentiful in the United
States. Electricity has been essential in America’s culture, business and economy since the
eighteenth century. Coal has been a staple in the production of electricity through Coal Fire
Power Plants (CFPPs), along with fossil fuels and natural gas. The United States (US) has the
world’s largest coal reserves and is a major exporter of coal. In 2013, US coal mine production
supplied 90% of coal to power plants for the generation of electricity. Coal has previously been
the largest source of electricity generation in the United States, but saw a decline in 2007 of 39%
as some in the utility industry converted to natural gas as a cost saving measure. Concurrently,
new environmental regulations at the federal level have made it more costly for utility companies
to operate coal fired utility plants (Energy Information Administration, 2015; International
Electric Coal Generation [IECG], 1996).
Environmental and health harms caused by the use of coal begin with coal mining. For
example, “... coal mining creates erosion, resulting in the leaching of toxic chemicals into nearby
streams, waterways and aquifers ... (IECG, 1996)” and has caused natural wildlife habitats to be
destroyed (Goodell, 2010; IECG, 1996). In addition, coal fire plants produce approximately two
thirds of sulfur dioxide, one third of carbon dioxide and one quarter of the nitrogen oxide
emissions in the United States (US) as well as emission of fine particulate matter into the

2
atmosphere (IECG, 1996). Along with environmental damage to the geographic location where
the plant is located, the accompanying damage to humans can be measured in health effects such
as asthma, reduced lung function, chronic obstructive pulmonary disease (COPD), respiratory
diseases and premature death (IECG, 1996). All of these negative health effects can be
attributed to the emission of airborne fine particulate matter, dioxin, sulfur dioxide, and nitrogen
oxide found in the steam produced by CFPPs. In addition to human health risks, smog formed
from this steam contains nitrogen oxide and reactive organic gases that can cause crop failure,
deforestation and property damage to the ecological palette (Gore, 2009; IECG, 1996). In the
atmosphere, the combination of water, sulfur dioxide and nitrogen oxides creates acid rain. This
substance acidifies the soil and water sources surrounding the CFPP (Gore, 2009; IECG, 1996).
Scientists predict that these changes in the stability of the environment, caused primarily by
carbon emission pollutants, will cause irreversible damage and the eventual collapse of the
earth’s ecosystem (Bull & Goodell, 2011). These issues are reviewed in Chapters two, three and
four.
Following a review of the health and ecological harms associated with CFPP, a case
study examining the production of these pollutants at Big Bend Power Plant in Apollo Beach,
Florida, a coal fire burning power plant owned and operated by the Tampa Electric Company
(TECO) is presented. The Big Bend facility has four coal-fired units with a combined output of
1,790 megawatts. The first unit began service in 1970, the second and third were added in 1973
and 1976 respectively, and the final unit was added in 1985. A natural gas and fuel oil-fired
peaking unit was installed in 2009 to provide additional power during periods of peak electrical
demand. The Big Bend facility’s four combustion units emit pollutants 24 hours a day, 7 days a
week. The Tampa Bay Times ranked Florida third for worst power plant generating toxic air

3
pollution, while TECO’s Big Bend Plant was listed as one of the largest polluters in the state
(Klas, 2011). Further details about the kinds of volume of pollution produced at the Big Bend
facility will be reviewed.
At issue in part of this analysis is the effect of those pollutants on the communities that
surround this CFPP including Apollo Beach, Ruskin, Gibsonton, Riverview, Brandon, sections
of east St. Petersburg, as well as Parrish and Ellenton to the south. Due west of the facility is
Tampa Bay and its tributaries. Airborne emissions from the facility may travel significant
distances, and comprise an additional issue examined in the study.
Environmental justice is at the forefront of many community-based campaigns to force
the government to address the unequal distribution of pollution. Environmental Justice is
defined as “…the fair treatment of all races, cultures, incomes and educational levels with
respect to the development, implementation and enforcement of environmental laws, regulations
and policies” (Lynch, Patterson & Childs, 2008; USEPA, 1998). Affected communities, which
are typically low income and African-American, began to address this issue beginning in the
early 1980s, and there are numerous environmental justice groups in the US that seek remedies
to threats in air and water quality, natural habitats for wildlife in community parks, and
recreational areas in affected neighborhoods (Stretesky, Huss & Lynch, 2012; Stretesky &
Lynch, 2011). One issue investigated in this case study is whether the adverse health effects
caused by emissions from the plant are unequally distributed. In these communities, pollutants
could impact the environment, health and welfare of the inhabitants. Moreover, given the
population characteristics of the communities, the pollutants emitted from the TECO facility may
present environmental justice concerns related to the unequal impacts of pollution.

4
The second issue examined in the study involves scrutiny of TECO’s environmental
violations and how the company has responded to the many environmental charges filed. In
1997, the Florida Department of Environmental Protection (FDEP) teamed with the US
Environmental Protection Agency (EPA) to file a Notice of Violation (NOV) for plant
infractions of the Clean Air Act (CAA) and permit violations related to the facility’s allowable
level of pollution. The NOV was given to TECO for its Big Bend and Gannon facilities. From
1971 to 1998, TECO modified their smoke stacks to increase wattage and to service more
customers without the proper modification permits. The United States Department of Justice
(DOJ), on behalf of the EPA, filed a lawsuit against TECO on November 3, 1999, alleging that
TECO violated the Prevention of Significant Deterioration (PSD) requirements of the CAA. The
FDEP filed a lawsuit against TECO on December 7, 1999 that mirrored the EPA lawsuit. FDEP
and the EPA filed their lawsuits in joint action on December 23, 1999.
TECO entered into negotiations with DOJ to resolve the lawsuit. The details of the
settlement will be thoroughly examined for an in-depth discussion of environmental justice as it
applies to this case. The issues above have become a part of green criminology with the
examination of environmental crime and forms of environmental justice that polluting facilities
generate. In part, this case study addresses green criminological questions through an
examination of environmental crimes committed at TECO’s Big Bend Plant and its continued
noncompliance with CAA and CWA regulations according to their settlement agreement in
2000. In addition, this study addresses green criminological concerns through an examination of
environmental racism. Does an analysis of the demographic data indicate whether TECO’s
neglect of regulatory agency’s efforts to monitor this facility constitute a form of environmental
racism?

5
The outline of this case study examines these questions through a series of chapters that
highlight each research inquiry. The introductory chapter introduces the general research inquiry
and identifies this as a case study of one CFPP in Hillsborough County, Florida. Chapter two is
a review of the current literature on environmental crime and justice as it relates to the coal
industry. Additionally, relevant literature on environmental racism will be examined, related to
coal fired power plants. Chapter three is a review of the literature on medical implications
regarding adverse human and animal health effects. The health effects may be caused by
airborne and/or water contaminants inherent in coal production, particularly those produced by
CFPPs. The fourth chapter will detail TECO’s Big Bend facility, the plant layout and the
ensuing lawsuit and settlement conditions. The chapter concludes with a presentation of TECO’s
past and current settlement compliance history.
Chapter five will present the methods used to collect data from the time of the plant’s
construction to the present in order to either confirm or hinder a claim of environmental racism.
Information from the Enforcement and Compliance History Online (ECHO) database presents
demographic information from one, three, and five miles from the point source that is pertinent
for analysis. In addition, medical evaluations are made of various pollutants emitted from this
CFPP, and the effects on surrounding communities, including hospitalizations, emergency room
visits, and morbidity rates for the areas surrounding Big Bend. The information on hazardous air
pollutants from the Big Bend facility will be compared to National Ambient Air Quality
Standards (NAAQS). Chapter six will present the data and results of the comparative analyses of
National Air and Water Standards, Big Bend’s emissions data, as well as state and local
demographic and medical information within five miles of the point source. Chapter seven

6
concludes this case study with a discussion of the data, current policies regulating CFPPs, and
what effects the utility lobby has on current regulatory agencies.
Two relevant questions for discussion that follow the above analyses are as follows: Did
the actions taken by the EPA in 2000 fit the crime committed by TECO in Apollo Beach?
Finally, has there been a commitment to continued environmental justice in the communities
surrounding the Big Bend facility undertaken by the Tampa Electric Company?
The Research Questions
In summary, the research questions investigated in this case study are:
1. Did the EPA actions taken in the Settlement Agreement fit the environmental crimes
TECO was charged with?
2. Has TECO made a commitment to honor the Settlement Agreement and provide
environmental justice to the communities that surround Big Bend?
3. Are infractions and noncompliance a form of environmental injustice through the
unequal distribution of pollutants?
4. Do negative heath impacts from plant emissions constitute a form of injustice in the form
of environmental racism against low income and minority populations in and around the
site? Does the demographic data support this argument?
5. Did TECO choose the site for Big Bend based on their intent to build a CFPP in a rural
area with a low-income level, or was this just a coincidence of population growth?
6. Do negative ecological impacts from plant emissions constitute a form of environmental
injustice to the communities that surround Big Bend?

7
CHAPTER TWO:
LITERATURE REVIEW OF ENVIRONMENTAL JUSTICE
A discussion of CFPPs must include a detailed definition and description of
environmental law and crime. The topics under discussion include criminological identifiers of
this type of corporate crime, and the laws that impact the regulation and oversight of CFPPs and
their emissions. In exploring CFPP emissions, it is also useful to refer to concepts such as
environmental justice/injustice, green violence and the role corporations play in generating green
crime and victimization. In that view, CFPP emissions can constitute a form of environmental
injustice when those emissions are unevenly distributed and have unequal race, ethnicity and
class effects and distribution parameters. Recently, CFPP emissions have been characterized as
including a form of green violence that combines both corporate environmental crime and
environmental injustice (Lynch & Barrett, 2015). Green violence, in the context of CFPPs,
includes the health harms and toxic pollution exposure caused by CFPP waste. Environmental
injustice examines the unequal distribution of pollution and its consequences. As green
criminologists note, a major concern is the role corporations play in generating green violence
and environmental injustice. Theoretically, some green criminologists suggest that these
problems need to be addressed from the perspective of political economic theory, which is
capable of linking green violence and environmental injustice to economic, class, and race
structures found within society (Lynch, 1990; Lynch & Barrett, 2015; Stretesky, 2008). In this
view, green violence is a form of corporate environmental violence (Stretesky & Lynch, 1999).

8
The view described above takes what is called a harms-based approach to the definition of green
crime and violence. It is, however, also possible to adopt a more traditional criminological view
of green crime as a violation of the law, and to explore these outcomes using legal analysis as
well as more traditional forms of social, economic and political theory that place green crimes in
context (Potter, 2010, 2015). These issues are described further below.
Environmental Law and Regulation
Environmental crime and criminal enforcement of laws through regulatory agencies
started with the passage of the CAA in 1970 and the Federal Water Pollution Control Act
Amendments of 1972, also known as the Clean Water Act (CWA). These laws were passed in
response to strong public support for environmental issues in the late 1960s and 1970s. Closely
following these regulatory acts were the Resource Conservation and Recovery Act (RCRA) in
1976 and the Comprehensive Environmental Response, Conservation and Liability Act
(CERCLA) in 1980. These legislative responses provided the foundation of the environmental
crime movement in the United States. The CAA and CWA allowed the executive branch to draft
more stringent policies toward environmental crimes, addressed public attitudes toward this type
of crime, and created a framework for the prosecution and incarceration of environmental
polluters (Brickey, 2008).
A closer look at the CAA and CWA reveals that environmental crime did not possess a
well-established theory or legal concepts at the time these regulatory laws were disseminated.
The complex wording of both the CAA and CWA, as well as the diverse interpretations that are
available by courts to implement these laws, show that the basic constructs and theory behind
ecological crime had not yet been realized (Brickey, 2008).

9
Because of their unique nature, environmental laws are often considered to be hybrid
regulations, incorporating civil, administrative/regulatory and criminal law powers. Many of
these laws contain unique features imposed to track and regulate pollution. For example, RCRA
regulations provide cradle to grave regulation of hazardous waste while CERCLA established the
Superfund laws, providing a pathway for financing cleanups of the worst hazardous waste sites
in the US (Brickey, 2008). Although these four laws provide a framework for regulatory action
and oversight, they cultivate civil and administrative responses to green/environmental crime
rather than criminal enforcement of environmental regulations. Congress, over time, has made
many revisions to these laws, in order to define ecological endangerment and amend federal law
to include felony prosecutions for environmental crimes. With criminality included, prosecutors
had a more forceful tool to compel corporate entities to follow the regulatory framework
provided by these four pieces of legislation.
The Environmental Protection Agency (EPA) is charged with implementing ecological
regulation and oversight. Its success can be tracked over time as regulatory effectiveness is
paralleled with court outcomes, revisions to existing law, and agency restructuring over that
same time period. The efficacy of the EPA and the effectiveness of environmental law is in the
concurrent in the US (Brickey, 2008). The implementation phase of new laws, and cases
challenging the EPA’s regulatory authority, have made it arduous to enforce existing laws and
federal regulatory requirements for CFPPs. Criminal enforcement has been a tightly controlled
balance between the principals of environmental law and theories of criminal law (Lynch, Burns
& Stretesky, 2014).
Environmental law has three characteristics that make it distinctive from other forms of
criminal law. These distinctions appear as the aspirational nature of the law, the evolutionary

10
nature of the law since inception, and the extreme complexity of the legal language and judicial
interpretations of that language in the courts (Lynch et al. 2014). In environmental law, the
basic concepts of harm, culpability and deterrence were redefined to fit a legal model that created
revisions to the original CAA and CWA legislation. The CAA Amendments of 1990, which
expanded the scope of criminal provisions based on legal interpretation of the language, was
largely due to new concepts introduced in environmental law, such as the “knowing
endangerment” offenses (Brickey, 2008; Lynch & Michalowski, 2010).
Green Victimization and Violence
This case study highlights environmental crime, victimization and legislation within the
realm of green criminology. An important aspect of that analysis is labeling and understanding
the forms of victimization CFPP pollution produces. Lynch and Barrett (2015) describe the
green victimization that CFPPs cause in their communities. The research cites three physical
harms found in green criminology. First is harm to the ecosystem posed by the pollutants
introduced by humans into the environment. A second harm is any “ecologically destructive”
human behavior that affects the health of human beings in the ecosystem and the possible
impacts on both physical and social environments. Finally, nonhuman animals living in polluted
environments are also defined as victims of environmental crime. Although they live in the same
physical and social environments as their human counterparts, nonhuman animal victims play no
role in contributing to the addition of pollutants into the ecosystem (Lynch & Barrett, 2015).
Within green criminology, these forms of victimization can also be described as green
violence. The inhabitants of any ecosystem who contracted physical, emotional and/or social
ailments as a result of living in an environment adversely impacted by pollution can be described
as suffering from green victimization. Lynch and colleagues (2014) focused on the volume of

11
green victimization caused by CFPPs relative to street crime. CFPPs are not well regulated by
the EPA, and as we shall see in Chapter three, cause significant health harms to human and
animals alike. Current CAA and CWA regulatory laws are not meticulously examined and
compliance is not strictly enforced (Clean Air Action Report, 2010). Previous studies examine
why green crimes should not be neglected and suggest public policy changes be made to
diminish corporate environmental violence (Lynch & Barrett, 2015).
Environmental crimes and corporate environmental violence (CEV) occur when a
corporate entity pollutes the ecosystem through the introduction of toxins or withdrawal of raw
materials from that ecosystem. The enforcement and deterrence of CEV lies in the regulatory
agencies necessary to ensure that environmental laws are enforced (Lynch & Stretesky, 2014;
Stretesky, Long & Lynch, 2013; Stretesky & Lynch, 1999). These pollutants generate “indirect”
CEV when the pollutant affects human and non-human health through exposure to toxic by-
products, and damage food supplies leading to an eventual decline in species population and the
ecosystem health and stability (Lynch & Barrett, 2015; Lynch et al., 2014; Stretesky, Long &
Lynch, 2013).
Environmental Justice and Racism
Environmental racism as defined by Bullard (2002) is “... environmental policies,
practices, or directives that differentially affect or disadvantage (whether intentionally or
unintentionally) individuals, groups, or communities based on race or color. Environmental
racism is reinforced by governmental, legal, economic, political and military institutions...”
(Bullard, 2002). Though the EPA is affected by policies that direct it to consider environmental
justice concerns (USEPA, 2015), EPA does not have an unblemished record when it comes to
addressing environmental justice and environmental racism. The EPA was investigated in 1992

12
for allegations of environmental racism resulting from selective enforcement of policies and
procedures, based on race and class, by the National Law Journal (1992). This case study
questions whether the regulatory agency tasked with oversight of CFPPs can effectively monitor
corporate entities for CEV if it cannot prevent the prejudicial effects of environmental racism
from within its own doors. Later, EPA Executive Director, Christie Todd Whitman challenged
Executive Order 12898, leading the US Inspector General to criticize the EPA’s commitment to
environmental justice. In 2012, a legal article providing background for environmental racism
concluded that “...the fox now guards the henhouse...” due to the environmental community’s
inability to effectively prove discriminatory actions by a corporation (Ewall, 2012). Legally, if
one cannot prove the corporation’s discriminatory practices are intentional, all the environmental
group or individual can do is complain to the corporation, or through the EPA, request they hold
themselves accountable for any environmentally racist and/or criminally negligent practices
(Ewall, 2012).
Environmental Impacts
CFPPs produce a variety of ecological harms and victimization. Those harms begin with
the mining of coal used to operate CFPPs. Coal mining, whether underground or mountaintop,
results in toxic chemicals leaching into nearby streams and aquifers, and can cause severe
erosion (Goodell, 2010; Osnos, 2014). Additionally, coal mining has caused natural wildlife
habitats to be permanently destroyed (Bull & Goodell, 2011; Goodell, 2010). Chapter one
revealed that two thirds of sulfur dioxide, one third of carbon dioxide, and one quarter of the
nitrogen oxide emissions in the United States are produced by CFPPs (IECG, 1996). In addition
to these pollutants, the coal combustion process (CCP) creates fine particulate matter, which is
then released into the atmosphere. Nitrogen oxide and fine airborne particles exacerbate

13
asthmatic conditions, reduce lung function and cause respiratory diseases and premature death
for many Americans (Environmental Health & Engineering [EH&E], 2011; IECG, 1996). Smog
formed by nitrogen oxide and reactive organic gases causes crop, forest and property damage.
Sulfur dioxide and nitrogen oxide both combine with water in the atmosphere to create what is
commonly known as acid rain. Acid rain acidifies the soils, sand and water subsequently killing
indigenous plants, fish, and animals (Gore, 2009; IECG, 1996). Emission of these pollutants can
also accelerate climate change. Some scientists predict that climate change will damage the
ecosystem of the oceans, causing a collapse in the food chain within the next century. This
collapse has been attributed to the carbon footprint left by the human race (Bull & Goodell,
2011; Gore, 2009; IECG, 1996). These issues are examined in greater detail in the following
chapter.
What is Coal and the Effects of the Coal Combustion Process?
Coal is classified into one of four types based on its heating value, ash content and
moisture, which in part reflect the extent of impurities present in the coal. The four types of coal
include: Anthracite, Lignite, Bituminous and Sub-bituminous. Table 1 shows the various
characteristics of major coal types used in CFPPs; coal type, principal characteristics, and the
HAP breakdown for each type of coal. Bituminous and sub-bituminous coal account for over
90% of coal use in the US annually (EH&E, 2011). Pyrite, a mineral rich in iron and sulfur is a
common impurity in bituminous coal and contains both arsenic and mercury. Sub-bituminous
coal contains less sulfur and is preferred by power plants that desire lower emission rates of
sulfur dioxide. Importantly, the burning of coal with these embedded impurities enhances the
toxicity of coal-fired power plant emissions, and, as discussed later, may cause elevated rates of
green victimization and disease among those exposed to these pollutants.

14
The forms of pollution generated by coal production also include those created during the
process of preparing coal for use. Raw coal is typically washed with water and proprietary
chemicals to remove impurities. Proprietary chemicals in the coal preparation process are those
protected by patent law and the chemical breakdown of the wash belongs to the company that
created it. The Big Bend facility employs this coal washing system. A coal preparation plant
(CPP) washes the raw, mined coal of embedded soil and rock, crushing it into different size
grades and creates coal washing toxins. Those toxins are stored as liquid slurry in coal ash ponds
and impoundments.
Table 1. Characteristics of the Four Major Coal Types
Characteristic Anthracite Bituminous Sub-bituminous Lignite
Percentage of U.S. Production Less than 0.1% 46.90% 46.30% 6.90%
Heating Value (BTU/lb) 15 11 - 15 8 - 13 4 - 8
Sulfur (%) Less than 1% 3 - 10% Less than 1% Less than 1%
Arsenic NR 0.5 0.1 0.3
Beryllium NR 0.11 0.03 0.2
Cadmium NR 0.03 0.01 0.06
Chlorine NR 35 2.7 24
Chromium NR 1.1 0.4 2.2
Lead NR 0.6 0.2 1
Manganese NR 1.8 1.3 20
Mercury NR 0.007 0.006 0.03
Nickel NR 0.9 0.4 1.2
http://www.lung.org/assets/documents/healthy-air/coal-fired-plant-hazards.pdf
BTU/lb - British Thermal Units per pound of coal; a measure of energy density of coal
NR - Not Reported
Characteristics of Major Coal Types Used to Generate Electricity in the United States
(2) Geometric mean concentration of selected elements in coal; units are pounds per billion BTU (USEPA, 2010a).
Emissions of Hazardous Air Pollutants from Coal-Fired Plants, Environmental Health & Engineering, 2011
Principal Characteristics 1
Hazardous Air Pollutants in Coal 2
(1) NRC, 2010, Table 2-3.

15
Three grades of raw coal are accumulated through the washing processes, known as
“liberation” of the coal sample. The liberation process breaks down coal into low density or
“clean” coal, intermediate density rock, referred to as middling, and materials of high density
rock and sand that are rejected (EH&E, 2011).
The washing process used to clean coal includes water and chemicals, including
coagulants, flocculants and surfactants. The chemical ingredients contained in the washing
solutions are protected by patent law, and are therefore protected from scrutiny by environmental
groups and the federal government. The byproducts in wastewater that remain from this process
are known as coal slurry or coal sludge. In this case study, the toxic wastewater from the coal
production process will be referred to as slurry. Coal slurry contains this chemically saturated
water and left over particles of coal, rock and clay from the raw materials. The raw materials
contain a variety of heavy metals, including lead, arsenic, cadmium, chromium, iron, aluminum,
nickel and manganese. All of these heavy metals can dissolve in water, also in hydrocarbons,
and some organic chemicals (EH&E, 2011).
Patent law, and the passage of the Energy Law of 2005, which contains the “Halliburton
Loophole” prevents federal and state regulatory agencies as well as environmental groups, from
accessing information regarding the chemicals used in the coal washing production process (Bull
& Goodell, 2011). Prior studies, however, indicate the presence of the following pollutants in
coal wash slurry: acrylamides, lime, starches, sulfuric acid, nitric acid, aluminum sulfate, iron
oxide, diesel fuel, polynuclear aromatic hydrocarbons (PAHs) and anhydrous ammonia (EH&E,
2011). Many of the possible pollutants contained in coal slurry are unknown. What is known,
concerns general categories of possible environmental toxins including coagulants, surfactants
and flocculants. Coagulants are those chemicals that can alter a fluid into a more thick mass for

16
the purpose of separation. Surfactants are chemical compounds that lower the surface tension
between liquids or between a liquid and solid. Surfactants are used as wetting agents in chemical
washing processes. Flocculants are chemical compounds that produce flocculation of suspended
particulate matter in a substance. The process of flocculation separates individual particles into
masses or clumps that can be separated. It is a chemical reaction to clay particles and other
chemical substances (Merriam-Webster, 2003). The chemicals comprising the materials in all
three of these agents are protected by the patent law proprietary rules. Some of the chemicals
have been identified through investigations led by environmentalists and investigative journalists
seeking to uncover the particular chemical base that forms the coal washing process (Fox, 2010).
Table 2 shows a list of toxic chemicals and heavy metals that has been found in coal
slurry (Ohio Valley Environmental Coalition, 2015). Many of the chemical compounds are
known carcinogens, neurotoxins and genotoxins. To expedite further discussions, the medical
definitions of these terms are listed, “... carcinogens are cancer-causing substances or agents...”
(American Heritage Medical Dictionary, 2007); “... neurotoxins are substances that damage,
destroy or impair the function of nerve tissue...” (Gale Encyclopedia of Medicine, 2008); and
“... genotoxins are any substances or agents that damage DNA...” (Farlex Partner Medical
Dictionary, 2012). The health implications of chronic exposure to heavy metals found in coal
slurry are discussed in detail in Chapter two, but include a plethora of health problems from
cancer to intestinal lesions, miscarriages and birth defects (Aurora Lights Appalachian
Mountaintop Removal, 2015; Ohio Valley Environmental Coalition, 2015 SourceWatch, 2015).
The toxicity of the coal slurry is dependent on the type of chemicals used in the CPPs washing
process. Toxins can include acrylamide, butyl benzyl phthalate, hexachlorobenzene,
17
naphthalene, chlorophenyl, phenyl ether, and dichlorobenzidine in addition to heavy metals such
as mercury, arsenic, lead and nickel (Ohio Valley Environmental Coalition, 2015).
Table 2. Chemicals and Heavy Metals Found in Coal Slurry
Aniline Dibenzofuran Acrylamide
Acenaphthene Dibutyl phtalate Hexachloro-1,3-Butadiene
Acenapthylene Diethyl phthalate Hexa-Cl-1,3-Cyclopentadiene
Anthracene Dimethyl phthalate 1,2,4-trichlorobenzene
Benzidine Dioctylphthalate 1,2-Dichlorobenzene
Benzo(a)anthracene Fluoranthene 1,3-Dichlorobenzene
Benzo(a)pyrene Fluorene 1,4-Dichlorobenzene
Benzo(b)fluoranthene Hexachlorobenzene 2,4-Dinitrotoluene
Benzo(ghi)perylene Hexachloroethane 2,6-Dinitrotoluene
Benzo(k)fluoroanthene Indeno(1,2,3-c,d)pyrene 2-Chloronaphtalene
Benzyl alcohol Isophorone 2-Methylnapthalene
bis(2-ethylhexyl)phthalate N-Nitrosodi-n-propylamine 2-Nitroaniline
bis(2-chloroethoxy)-methane N-Nitrosodiphenylamine 3-3'-Dichlorobenzidine
bis(2-chloroethyl)ether Naphthalene 3-Nitroaniline
bis(2-chloroisopropyl)ether Nitrobenzene 4-Bromophenyl phenyl ether
Butyl benzyl phthalate Phenanthrene 4-Chloroaniline
Chrysene Pyrene 4-Chhlorophenyl phenyl ether
Dibenzo(a,h)anthracene 4-Nitroaniline
Aluminum Copper Potassium
Antimony Iron Selenium
Arsenic Lead Silver
Barium Magnesium Sodium
Beryllium Manganese Strontium
Cadmium Mercury Tin
Calcium Molybdenum Vanadium
Chromium Nickel Zinc
Cobalt
Chemicals Found in Slurry and Sludge
Heavy Metals Found in Coal Slurry
Source: Kentucky Division of Water. DOW-DES Analytical Data File. Martin Co.Coal.Co.Slurry Release Data.xls
http://www.sludgesafety.org/what-coal-slurry/chemicals-found-coal-sludge-and-slurry
Coal processing also includes acrylamides, some of which are known carcinogens. The
toxic levels of many of these chemicals produce coal slurry that cannot be released directly into
the environment, it must be stored on site at the facility where it was produced. The Big Bend

18
facility has coal ash and slurry, which are stored within site disposal ponds, the majority of
which are unlined, on the land in Apollo Beach (EPA Site Certification Big Bend, 1980).
Pollution from coal consumption is also generated from burning coal at CFPPs. If these
impurities are not captured by pollution control equipment, they are released into the
atmosphere. Sub-bituminous coal has a lower heating value than bituminous coal, and power
plants often choose to burn bituminous coal despite its higher toxicity. Pound per pound, the
bituminous coal provides more power (EH&E, 2011; Union of Concerned Scientists, 2010).
This means that CFPPs that use bituminous and sub-bituminous coal produce more pollution
during the process of burning coal. The least efficient form of coal in energy per pound
(BTU/lb) is lignite coal. TECO burns some lignite coal, mined from a processing facility it owns
and operates in Corbin, Kentucky (TECO, 2014).
Government Responses to Coal Fire Plants
In 2005, the US Environmental Protection Agency set new limits on hazardous air
pollutants released into the atmosphere from coal and oil-fired power plants. Figure 1 shows
HAP air emission by Industry, revealing that electric utilities produce a significant amount of air
pollutants introduced into the atmosphere. Electric utilities produce 57% more HAPs than the
closest competing industrial sector (Environmental Integrity Project, 2011). This legislation,
known as the Utility Air Toxic Rule, set new limits on emissions of hazardous air pollutants.
This represented the first time that the EPA placed federal limits on mercury, arsenic, lead,
hydrochloric acid, hydrofluoric acids, dioxins and other toxic substances from CFPPs (USEPA,
2014). Table 3 shows the specific HAP emissions that contribute to CFPP pollution.
Additionally, the American Lung Association (ALA) commissioned a report on the public health
and environmental impacts of Hazardous Air Pollutant (HAP) emissions from CFPPs that acts as

19
2010 Hazardous Air Pollutant (HAP) Air Emissions by Industry
Source: America's Top Power Plant Toxic Air Polluters, Environmental Integrity Project, 2011.
http://www.environmentalintegrity.org/documents/Report-TopUSPowerPlantToxicAirPolluters.pdf
Figure 1. Hazardous Air Pollutant Emissions by Industry Table 3. Contributions of Coal-Fired Power Plants to Selected Hazardous Air Pollutants
15%
Emissions of Hazardous Air Pollutants from Coal-Fired Plants, Environmental Health & Engineering, 2011
11%
Contributions of Coal-Fired Power Plants to Selected Hazardous Air Pollutant Emissions
Chromium
Cobalt
Lead
34%
Cadmium
76%
60%
28%
30%
20%
Data obtained from USEPA, 2007
Hazardous Air Pollutant Percentage of Point Source Emissions
Acid Gases (Hydrochloric Acid and Hydrofluoric Acid)
Arsenic
Beryllium
46%
25%
Mercury
All Non-Mercury Metal HAPs E mitted by
Coal-Fired Power Plants
Manganese
http://www.lung.org/assets/documents/healthy-air/coal-fired-plant-hazards.pdf

20
a useful resource for the general public (ALA, 2011). Adverse effects reported included: damage
to eyes, skin and breathing passages; negative effects on the kidneys, lungs and nervous system;
potential to cause cancer; impairment of neurological function, and the ability to learn; and
pulmonary and cardiovascular disease (USEPA 1998, 2011a, 2011b, 2014)
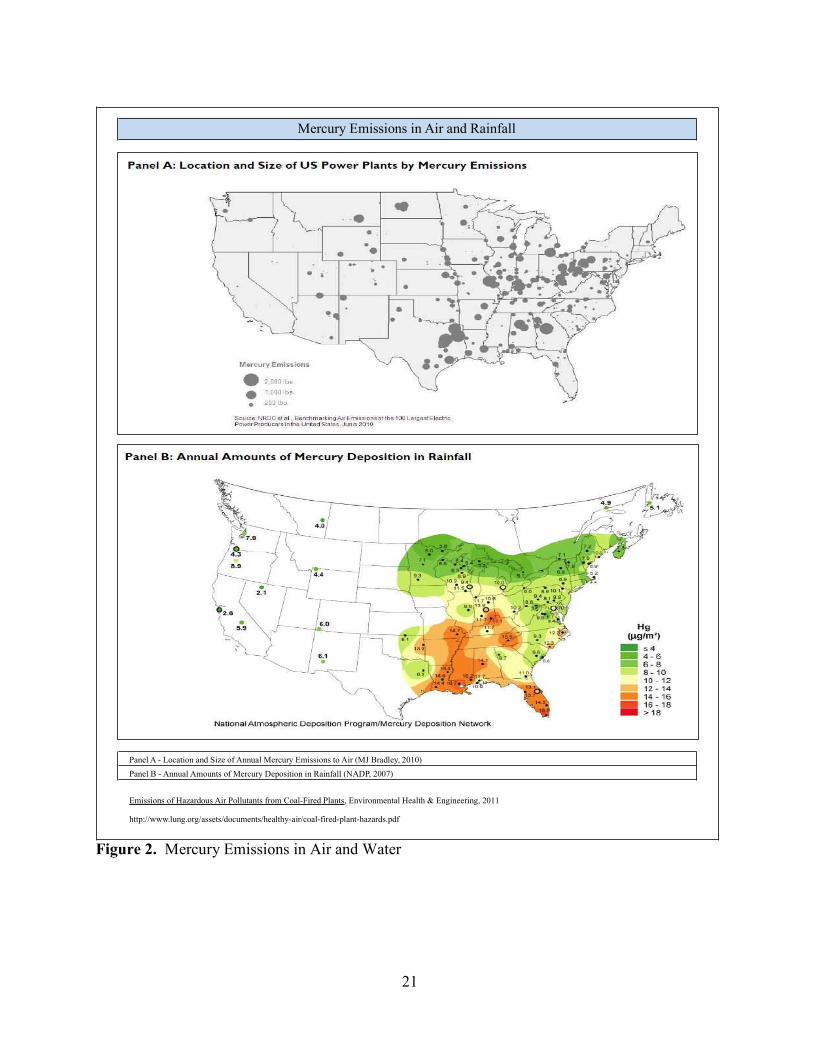
Public health risks associated with exposure to mercury in food and metal in airborne fine
particulate matter are notable. CFPPs significantly contribute to deposits of mercury in soil and
water. Mercury deposits to the earth’s surface from the air can make its way into waterways
where it is converted into methyl-mercury (USEPA, 2014). Figure 2 illustrates Mercury
emissions in both air and rainfall. The Figure shows the location and size of the CFPPs
responsible for these emissions as well as the annual amounts deposited by rainfall into
waterways, surface, and groundwater sources (EH&E, 2011).
The EPA has also found fine particulate matter to be a cause of cardiovascular disease.
Hazardous air pollutants such as arsenic, beryllium, cadmium, chromium, lead, manganese,
nickel, radium, selenium, and other metals, are found in the particulate matter emitted from
CFPPs. In recent population-based health impact studies, particulate matter was estimated to
account for an average of $3.7 billion in annual health care costs (NRC, 2010; USEPA, 2014).
In addition, the environmental impacts of powerful hazardous air pollutant emissions include
acidification of the environment, accumulation of toxic metals, contamination of water supplies,
reduced visibility due to haze and the degradation of buildings close to the point source
(Cordiano, 2011; FDEP Emission Inventory, 2011).
As previously noted, Florida currently ranks third in the nation for worst power plant
generated toxic air emissions, particularly carbon pollutants. A report released by Environment
Florida using 2011 federal Toxic Release Inventory (TRI) data ranked these CFPPs nationwide.
21
http://www.lung.org/assets/documents/healthy-air/coal-fired-plant-hazards.pdf
Mercury Emissions in Air and Rainfall
Panel A - Location and Size of Annual Mercury Emissions to Air (MJ Bradley, 2010)
Panel B - Annual Amounts of Mercury Deposition in Rainfall (NADP, 2007)
Emissions of Hazardous Air Pollutants from Coal-Fired Plants, Environmental Health & Engineering, 2011
Figure 2. Mercury Emissions in Air and Water

22
Florida’s power plants produce 49% of statewide emissions of carbon pollutants. Even more
relevant for this study was TECO’s ranking in the state. The Big Bend facility was second for
carbon emissions (Klas, 2011; Ramos, 2013). A further environmental concern is the level of
water pollutants that harm drinking water and damage natural habitats for wildlife in and around
the CFPPs. This occurs due to the leaching of toxic chemicals from a variety of sources
including coal slurry, coal fly ash, as well as a variety of airborne pollutants from the facility’s
stacks that are introduced into waterways surrounding the source point (EH&E, 2011).
In 2013 the Political Economy Research Institute (PERI), produced a Toxic 100 Index
that included the Big Bend facility in Apollo Beach. PERI describes their methodology for
arriving at their data and subsequent conclusions. Big Bend is listed as a significant polluter,
with toxic release inventory data from the EPA collected in 2010. They incorporate three factors
into their risk screening assessment tool. The “fate and transport” which is how the chemical
spreads from the point source to a geographic area. The actual toxicity of the chemical and the
danger it poses, based on a per-pound scale. The third element in the equation is the actual
population affected in the geographic area (PERI, 2013).
The PERI report further breaks down this population by minority and poor shares in a
community. Based on the 2013 PERI report, TECO’s Big Bend facility contains a 13.6% Poor
Share and a 36.6% Minority Share for purposes of environmental justice reporting. The PERI
report cites the EPA data on the local meteorological patterns, temperature and ground
topography, combined with data on the height of the Stacks and exit velocity of toxic gases for
up to a 31 mile or 50 km radius from the point source to obtain the percentage of population
affected.

23
The Toxic Release Inventory (TRI) program also tracks chemicals that can specifically
cause cancers or other chronic human health effects, significant adverse acute health effects in
humans, as well as significant environmental effects classified as adverse. Electric companies
that use combustible coal or oil to generate power must report their data for the toxic release
inventory. Of the 567 companies that reported to the EPA in 2013, based on data obtained in
2010, Big Bend ranked 471 of those 567, with number one on that list being the CFPP emitting
the most toxic pollutants. The EPA updates the TRI, as chemicals are labeled hazardous by the
Food and Drug Administration and federally legislated. TRI’s list is complete through 2014 with
changes sent to each reporting facility. The EPA currently tracks 689 toxic chemicals emitted
from CFPPs through this TRI program (EPA Toxic Release Inventory, 2013).
In this case study, water pollutants have been examined due to the violations of the CWA
at the previously mentioned Big Bend facility. Table 4 presents a list of the Top Ten Industrial
Sectors with the most hazardous Water Pollution. Electrical utilities top the list, as they did in
Table 4. Industrial Sectors with the Most Hazardous Water Pollution
Rank Industrial Sector 1 Total Number of Facilities Hazard Share (% of Total)
Amount of Chemicals
Released to Surface Water
(pounds)
Amount of Chemicals
Transferred to POTWS 2
1 Electric Utilities 370 55.81 2,672,902 6,756
2 Chemicals 1267 17.37 29,014,457 87,113,726
3 Primary Metals 763 12.21 28,001,950 12,104,662
4 National Security 51 8.01 15,176,990 75,496
5 Paper 247 3.05 17,864,769 24,020,189
6 Petroleum 179 1.34 21,039,437 3,551,759
7 Wood Products 99 0.62 30,868 44,194
8 Metal Mining 34 0.30 486,766 6,847
9 Electrical Equipment 227 0.29 5,089 1,295,405
10 Fabricated Metals 1029 0.21 1,463,015 12,079,890
http://documents.foodandwaterwatch.org/doc/Toxic_Flood.pdf
(1) As classified under the North American Industry Classification System (NACS).
(2) Publicly owned treatment works.
Industrial Sectors with the Most Hazardous Water Pollution
Source: Food & Water Watch/PERI analysis of data from the USEPA Toxics Release Inventory and Risk Screening Environmental Indicators.

24
the air pollutant sector. This table lists not only the amount of chemical released into surface
water, either through direct discharge or atmospheric release producing acid rain, it also lists
chemicals that can be transferred to Publicly Owned Treatment Water Stations (POTWS). What
is compelling in this Table is the percent share of the total Hazard. Although the electric utilities
may not necessarily produce the highest level in pounds of pollution emitted to waterways, it has
the highest hazard share total due to the number, and output of the stations. 55.81% of the total
hazardous emissions are directly attributable to utility companies (EPA Toxic Release Inventory,
2013).
Table 5 provides information on the Top 10 Hazardous Industrial Water Pollutants. It
provides the ranking of the pollutant, percent hazard share in the waterways, health risks
Table 5. Top Ten Industrial Hazardous Water Pollutants
Rank PollutantHazard
Share (%)Health Risks Industrial Sources
1 Arsenic and Arsenic Compounds 60.60 CancerWaste product from glass and electronics
manufacturing and from electricity generation
2 Hydrazine Compounds 11.69 CancerPesticides, rocket fuel, boiler water treatments,
pharmaceuticals
3 Nitroglycerin 7.97 Harm to cardiovascular and central nervous system Explosives, rocket fuels and medicines
4 Acrylamide 4.85 Cancer, nervous system and blood problems Used in plastics, adhesives and cosmetics
5 Polycyclic Aromatic Compounds 2.62 Cancer, disruption of endocrine systemTire manufacturing, paper mills, electricity
generation, and oil refineries
6 Acetaldehyde 2.15 Cancer Manufacturing of many food additives
7 Acrylonitrile 2.05 CancerManufacuring of acrylic/modacrylic fibers and some
other products (i.e., plastics)
8 4,4'-Methylenedianiline 1.38 CancerChemical used to make polyurethane foams and
other industrial products
9 Ethylene Oxide 1.09 CancerManufacturing of a variety of industrial products
(i.e., solvents)
10 Dioxane 1.07 Cancer, liver and kidney damage Solvent in chemical manufacturing
http://documents.foodandwaterwatch.org/doc/Toxic_Flood.pdf
Top Hazardous Industrial Water Pollutants, 2009
Source: Food & Water Watch/PERI analysis of data from the USEPA Toxics Release Inventory and Risk Screening Environmental Indicators.

25
associated with each pollutant, as well as the industrial sources that significantly contribute to
their emission.
When analyzing the information in Table 5, it is interesting to note that the contaminants
listed as primarily associated with CFPP emissions are the most prevalent. All of the pollutants
listed can come into contact with the water supply through atmospheric fallout, groundwater run-
off, and POTWS pollution, which can occur as a result of this run-off from leaching into existing
waterways and groundwater from disposal ponds located in and around the point source.
Theoretical Implications
Issues of environmental and corporate/white collar crime have been overlooked by
criminologists despite research which suggests that these issues are important for understanding
this type of criminal behavior, and how crimes that involve the wealthy and powerful affect the
public. Environmental crime is absent from a majority of criminology journals and textbooks,
and when it materializes, it is a generalization of the theory and literature on the subject. The
basic tenets of environmental crime involve corporate entities rather than individuals as the
perpetrators of deviant behavior. The victimization of people as a “community” of individuals
rather than as a single individual as a victim of crime is the basis of green victimization. The
community health and welfare is violated by a larger corporate entity and that should concern the
individuals that make up a community or neighborhood. A study of peer reviewed journals in
criminology by Lynch and colleagues (2004) revealed that only 4% of articles dealt with issues
of environmental harm and “1 in 1,568 pages” in 16 criminology textbooks had sections related
to environmental crime (Lynch, McGurrin, and Fenwick, 2004).
There are three criminological theories that are applicable to environmental issues
included in this case study. Rational Choice (RC) theory is based on the principles of a free-
26
market economic structure (Lynch, Burns & Stretesky, 2008; Stretesky, 2006). The theory
proposes that environmental crimes will occur when the benefits (profits) of the act outweigh the
penalties if discovered by law enforcement. The corporation will act in a way that promotes the
most benefit for itself and stakeholders, the defining concept in a rational corporate climate.
Criminologists accept RC as an explanation for deviant behavior and that its application to a
company is well documented. Corporate crime is rarely done individually but in the pursuit of
company interests, and Cressey (1995) refers to the “corporate citizen” and the biological citizen,
again referring to the corporation as an entity made up of many individuals acting as a unit as
well as the individual citizen acting as a member of the community entity. (Cressey, 1995;
Michalowski & Kramer, 2007). Deterrence theory explores rational choice with added deterrents
which include the following: 1) The establishment of punishment(s) with speed and severity; 2)
The notoriety of a crime permeates through mainstream and social media outlets moments after
an announcement; and 3) Name recognition of the type of environmental crime with a
corporation, through the “court of public opinion” is universal in current society. Social media
has become a preventative measure for law enforcement and a powerful deterrent for corporate
malfeasance. “Corporations are more rational than an individual,” (Lynch, Patterson & Childs,
2010) and are more likely to be swayed from a criminal act, due to the potential criminal, civil
and public relations penalties that result from litigation (Lynch et al. 2008; Lynch et al. 2010;
Paternoster & Simpson, 1996; Tittle & Paternoster, 2000). In another study it was tendered that
corporations, like individuals have a social conscience that can be motivated positively and
negatively, by publicity (Maitland, 1986).
Routine Activities Theory (RAT) is also applicable to environmental crime, particularly
corporate environmental crime. RAT is generally applied to an individual; however, it is

27
applicable when a large, multi-faceted corporation is viewed by the public, as an individual
entity, just as RC theories have postulated. At this point, the three tenets of this theory are
applicable. (1) A motivated offender. A large corporate entity, with fiscal year profits and
shareholder interests, could be considered a motivated offender, with a profit margin as the end
result of the criminal act; (2) A suitable target or potential victim. In environmental crimes,
these can include but would not be limited to - humans, domestic animals, wildlife, and the
ecosystem of the area; (3) The absence of capable guardians, or those who stand against the
victimization. In the case of corporate environmental crimes the absence of regulatory agency
action(s) and adequate legal representation for members of the public against the corporate
entity, would qualify. Everyday life has potential victims, and the combination of these three
elements lead to actual victimization in the case of corporate environmental crime (Kubrin,
Stucky & Krohn, 2009). Any of these three criminological theories could be applied to
environmental crime committed by a corporation for profit. The RC concept that the company
will put its potential gains ahead of the possible repercussions of those actions for the benefit of
the company fits with the RAT concept of a motivated offender, this case the company choosing
an act of environmental crime in pursuit of potential profit with the deterrent in both cases being
the possibility of negative mass media exposure as well as association with a particular type of
environmental injustice. The RAT concept of the suitable target or potential green victims in the
case currently under study, is synonymous with the potential victim having no alternative to the
victimization through the lack of guardianship. The three elements of RAT must coordinate
together for the corporate entity to be successful in the environmental injustice to be not only
successful in profits, but also in its invisibility to those it victimizes. If that invisibility were

28
shattered, the possible deleterious effects on the company would be a plausible deterrent to the
commission of an environmental crime.
Three types of research would be relevant in addressing the environmental crimes
produced at TECO’s Big Bend power plant. They include research on: (1) corporate crime;
(2) state-corporate crime; and (3) green criminology. This typology requires a definition of
environmental crime, and is still being debated by the criminological community.
Corporate/white collar crime by its name implies a class inequality. Environmental
criminologists define crime as an inherently deviant act that is universal across time and place.
The corporation that owns a CFPP in China has the same responsibility as one located in Africa,
South America or the United States (Lynch et al. 2010). State-corporate crime has been
identified as “crimes of the powerful” (Lynch & Michalowski, 2006). Michalowski has referred
to these corporate powerhouses as “crimes of capital” which include those institutions that
facilitate the accumulation of capital (Michalowski, 1985). This is in reference to “... legal acts
that cause harm equal to or greater than that caused by crime...” (Michalowski, 1985). In the
1980’s the EPA evaluated the cost of workplace illness due to toxins and pollution damages at an
annual rate of $23 billion dollars (Michalowski, 1985). The cost of treatment of controllable
toxins in human disease cause by environmental HAPs is $40 billion (Green & Berry, 1985).
Further, the loss of income and lost tax revenues is estimated at an additional $1.2 billion (Green
& Berry, 1985). Researchers suggest that lax regulatory enforcement of laws that apply to
corporate crime and criminals emboldens corporate environmental criminals who put the profit
margin before public safety and security. In this case study the EPA, FDEP and the DOJ, which
brokered the Settlement Agreement between the parties is, in part, responsible for the
misappropriation of environmental justice.

29
State-corporate crimes examine how state and corporate behavior intersect to produce
crime, or the ways in which the state and corporations interact to produce crime. These crimes
include “... environmental crimes, bribery, price fixing, violations of work-place safety, fraud...
cost between $174 and $231 billion annually...” (Kramer, 1984). These crimes can be quite
costly, and though dated, Reiman (1995) estimated their costs to be $1 trillion annually.
Green criminologists have undertaken studies of a wide range of green crimes, law and
injustice. Of particular relevance to the current discussion is the use of political economic theory
and in particular the use of treadmill of production theory (ToP). ToP theory is a political
economic theory that describes how the economic system of production (i.e., the treadmill of
production) that emerged following World War II changed, leading to accelerating production
and ecological destruction. The ToP produces ecological destruction, or what ToP theory calls
ecological disorganization in two ways. First through ecological withdrawals of raw materials
needed for the treadmill production process. As the treadmill accelerates, more and more raw
materials input is needed, including the fossil fuel and chemical energy used to run the treadmill
Second, the increased level of production also causes the volume of pollution or ecological
additions to expand.
In recent years, green criminologists have used this approach to examine a number of
ways in which the ToP affects pollution, environmental justice, and the enforcement and
effectiveness of law. For example, Long and colleagues (2012) hypothesize that treadmill
organization and its political expression allowed CFPPs to use political campaign contributions
to respond to environmental punishments.
The general theoretical structure how ToP produces pollution, green crime,
environmental injustice, and affects legal processes has been pieced together from prior

30
empirical studies by (Lynch et al. 2013). Those prior green studies have produced important
empirical results related to a variety of political economic questions related to green
criminological theory. For example, Lynch & Stretesky (2013) analyzed the distribution of
informal water monitoring programs across the US, and whether community characteristics were
useful in predicting that distribution. Predicting the distribution of community water monitoring
programs has important environmental justice implications since the US EPA helps assist
communities in establishing those programs and uses information from those programs to
enforce environmental regulations. Lynch & Stretesky (2013) found that African-American and
Hispanic communities were less likely to have community water monitoring organizations, and
that the higher a community’s income, the more likely it was to have a community water
monitoring program. These results suggest the existence of two forms of environmental injustice
relating to water monitoring programs: one with a race and ethnicity dimension, and another with
a class dimension (Stretesky & Lynch, 2013). Prior green criminological studies also indicate
the existence of environmental injustice in the enforcement of laws (Lynch, Stretesky & Burns,
2004a, 2004b; Stretesky & Lynch, 1999, 2002, 2011). Prior green criminological studies have
also assessed whether EPA’s self-audit policies are effective, finding that this program does not
work as suggested in improving the self-reporting of significant environmental crimes (Stretesky
& Lynch, 2009a). Green criminologists have also produced empirical evidence that the US, a
central driver in the international treadmill of production, facilitates the expanded production of
carbon dioxide pollution through its trade and consumption associations with other nations
(Stretesky & Lynch, 2009b). Though the number of relevant empirical green criminological
studies related to political economic explanations of green crime and justice are limited, to date
these studies have provided empirical support for ToP arguments.

31
Conclusion
Over the past two decades, green criminology has drawn increased attention to
environmental pollution, green crime, green victimization and green violence as important
criminological issues. In the present study, the focus is on these concerns in relation to CFPPs, a
topic that has only recently received the attention of green criminologists
(Lynch & Barrett, 2015). The larger threat that CFPPs can impose on the ecosystem around the
point source is threefold. First, a determination of when the harms become criminal acts, and
when are they controlled by either state of federal regulatory agencies. Relevant research
focuses on the roles played by economics and politics in shaping and enforcing these laws that
determine future levels of harm and CEV in the communities that surround CFPPs. If our
ecosystem is treated as a commodity, then the misuse of that commodity should be penalized by
criminal law, just as in trade (Gore, 2009).
Second, green criminological research has called attention to environmental
justice/injustice as important green criminological concerns, including efforts to examine
corporate responsibilities toward the prevention of environmental racism. It identifies
specifically how race, class, and ethnicity shape environmental hazards and could assess the
scope and impact of environmental racism in communities where CFPPs are located throughout
the United States. In November 2012, a report generated by the National Association for the
Advancement of Colored People (NAACP), the Indigenous Environmental Network, and the
Little Village Environmental Justice Organization, noted that the EPA found certain members of
a population were more immediately impacted by climate changes, including HAPs in air and
water. Those affected included people living in poverty, the elderly, those already in failing or
poor health conditions, the disabled, those living with few natural resources such as indigenous

32
populations to a region, and the percentage of minority populations in a geographic region close
to a CFPP. Additionally, environmental racism can occur in residential areas where high
temperatures require air conditioning and the inability of those below the poverty line to have
access to this or any air filtration system (NAACP, 2012).
Finally, and most critical to survival, are the adverse affects that CFPPs can cause for
ecosystem stability, humans and non-humans alike. Green criminologists have argued for the
need to examine adverse health consequences and ecological destruction as indicators of green
crime and victimization (Lynch & Stretesky, 2014).
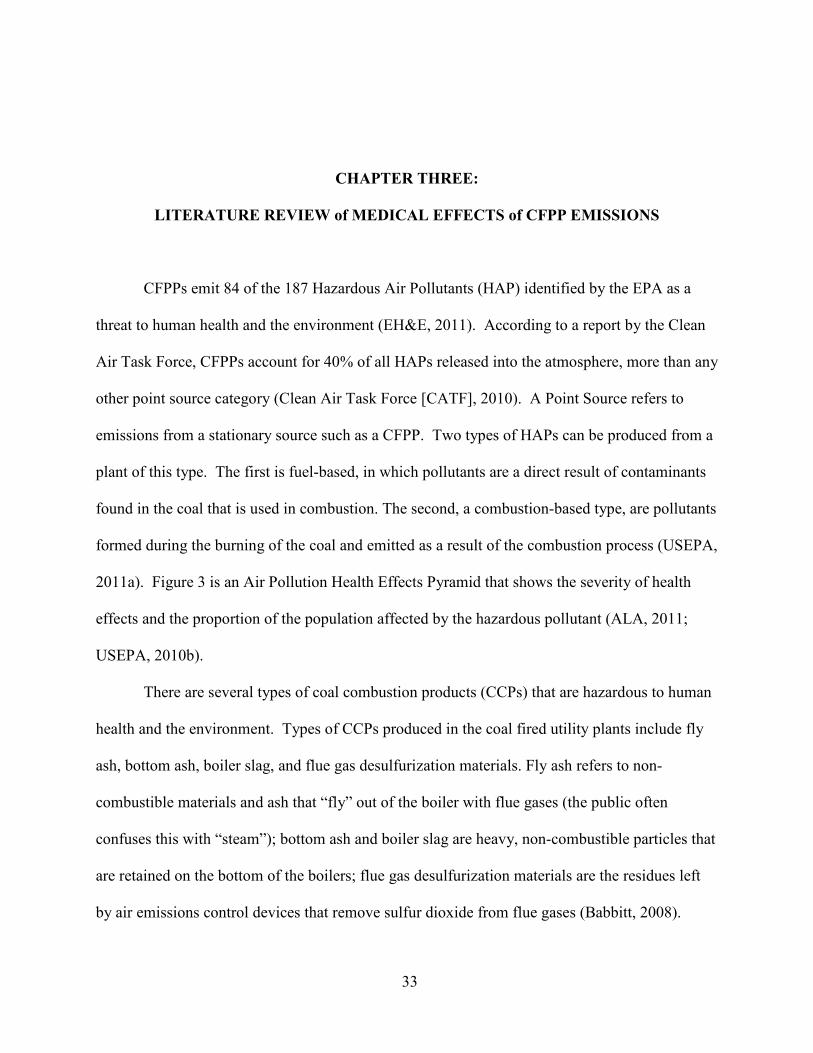
33
CHAPTER THREE:
LITERATURE REVIEW of MEDICAL EFFECTS of CFPP EMISSIONS
CFPPs emit 84 of the 187 Hazardous Air Pollutants (HAP) identified by the EPA as a
threat to human health and the environment (EH&E, 2011). According to a report by the Clean
Air Task Force, CFPPs account for 40% of all HAPs released into the atmosphere, more than any
other point source category (Clean Air Task Force [CATF], 2010). A Point Source refers to
emissions from a stationary source such as a CFPP. Two types of HAPs can be produced from a
plant of this type. The first is fuel-based, in which pollutants are a direct result of contaminants
found in the coal that is used in combustion. The second, a combustion-based type, are pollutants
formed during the burning of the coal and emitted as a result of the combustion process (USEPA,
2011a). Figure 3 is an Air Pollution Health Effects Pyramid that shows the severity of health
effects and the proportion of the population affected by the hazardous pollutant (ALA, 2011;
USEPA, 2010b).
There are several types of coal combustion products (CCPs) that are hazardous to human
health and the environment. Types of CCPs produced in the coal fired utility plants include fly
ash, bottom ash, boiler slag, and flue gas desulfurization materials. Fly ash refers to non-
combustible materials and ash that “fly” out of the boiler with flue gases (the public often
confuses this with “steam”); bottom ash and boiler slag are heavy, non-combustible particles that
are retained on the bottom of the boilers; flue gas desulfurization materials are the residues left
by air emissions control devices that remove sulfur dioxide from flue gases (Babbitt, 2008).
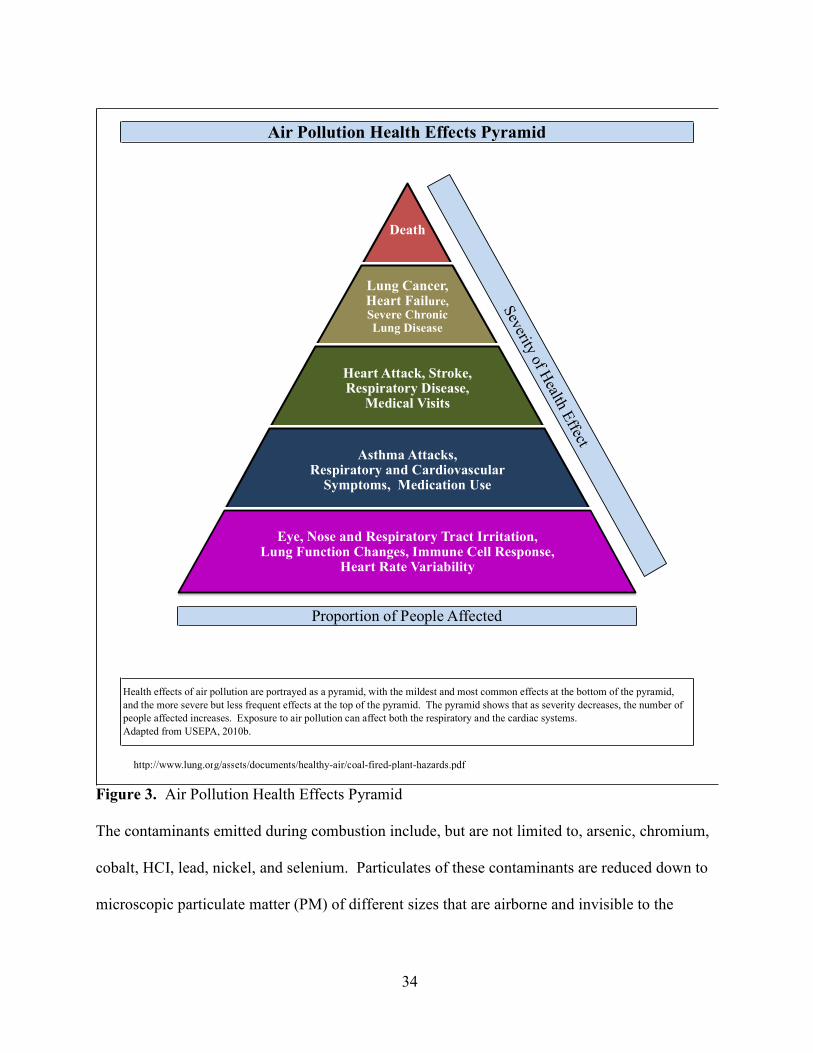
34
Air Pollution Health Effects Pyramid
Proportion of People Affected
Health effects of air pollution are portrayed as a pyramid, with the mildest and most common effects at the bottom of the pyramid,
and the more severe but less frequent effects at the top of the pyramid. The pyramid shows that as severity decreases, the number of
people affected increases. Exposure to air pollution can affect both the respiratory and the cardiac systems.
Adapted from USEPA, 2010b.
http://www.lung.org/assets/documents/healthy-air/coal-fired-plant-hazards.pdf
Death
Lung Cancer, Heart Failure, Severe Chronic Lung Disease
Heart Attack, Stroke, Respiratory Disease,
Medical Visits
Asthma Attacks, Respiratory and Cardiovascular
Symptoms, Medication Use
Eye, Nose and Respiratory Tract Irritation, Lung Function Changes, Immune Cell Response,
Heart Rate Variability
Severity of H
ealth Effect
Figure 3. Air Pollution Health Effects Pyramid
The contaminants emitted during combustion include, but are not limited to, arsenic, chromium,
cobalt, HCI, lead, nickel, and selenium. Particulates of these contaminants are reduced down to
microscopic particulate matter (PM) of different sizes that are airborne and invisible to the

35
eye. PM can be further reduced into particulate matter (PM > 10 μm) fine particulate matter (PM
>2.5 μm), and ultrafine particulate matter (PM > 0.1 nm; there are 2,500 nm per 2.5 μm; (Biswas &
Wu, 2005). The ultrafine PM 2.5 is the most dangerous to the environment, human health and
communities that surround CFPPs. Figure 4 illustrates the relative sizes of particulate matter.
The second section of the figure illustrates ultrafine particles and their relationship to known
objects, with nanoparticles even smaller. (Biswas & Wu, 2005).
The immediate health impact of these contaminants depends on several factors: (a) how
long the pollutant is airborne, (b) physical dynamics of the power plant emitting the toxin, (c) the
weather conditions around the plant, and (d) how close the population is to the source point. The
distribution of HAPs into the environment and the average length of time they remain airborne
depend on the “atmospheric residence time” (EH&E, 2011) that varies for different types of
CFPPs, due to the weather systems and ground speed of the wind in and around the facility. The
immediate impact is within one mile from the point source. If there is a normal ground-level
wind speed in the area, HAPs can travel between five and ten miles from their point source in an
hour (EH&E, 2011). The HAPs can also be deposited on the ground or in the water and can be
transformed through chemical reactions into acid rain. This type of atmospheric conditions is two
to three hours in duration and limited to a fifteen to thirty mile radius from the point source
(EH&E, 2011).
Table 6 elucidates residence time of HAPs in the atmosphere. Some of these
contaminants travel farther in the atmosphere and become global pollutants, traveling hundreds
of thousands of miles on wind and air currents (EH&E, 2011). The table indicates not only the
residence time the pollutant can stay active in the atmosphere as a hazard to human and non-
human species, but also the range of a pollutant’s impact in travel time. A CFPP now has the

36
http://www.epa.gov/ord/ca/quick-finder/particulate-matter.htm
http://www.aqfairbanks.com/science/
Relative Sizes of Particulate Matter
Figure 4. Relative Sizes of Particulate Matter

37
potential to become not only a local hazard, but as mentioned earlier, a state, national and global
polluter. A study of CFPPs in New England discovered that public health damages were two to
five times greater for communities near the facilities (5 miles or less to the point source) than
those living at distances farther from the plant (Levy & Spengler, 2002). Atmospheric residual
contamination can be generated by CFPPs for hundred of miles, carried on wind and sea
currents. Although the immediate environmental effects are within thirty miles of a point source,
Table 6. Residence Time of Hazardous Air Pollutants in the Atmosphere
HAP Group Indicator Pollutant(s) Residence Time 1 Likely Range of Transport
Mercury Methylmercury 7-10 days Local, regional, global
Arsenic 7-9 days (lifetime) Local, regional, global
Beryllium 10 days (lifetime) Local, regional, global
Cadmium 1-10 days (lifetime) Local, regional, global
Chromium Up to 7-10 days Local, regional, global
Nickel Up to 30 days (half-life) Local, regional, global
Manganese Several days (half-life) Local, regional
Selenium 1-10 days Local, regional, global
Lead Up to 10 days Local, some regional
Radioisotopes Uranium, Radium Not reported Local, regional, global 2
Chlorinated Dibenzo-P-Dioxins 0.5 - 9.6 days (lifetime) Local, regional, global
Dibenzofurans 4 days (half-life) Local, regional
Chlorodibenzofuran (CDFs) More than 10 days (half-life) Local, regional, global
Aldehydes Formaldehyde <20 hours (half-life) Local
Benzene4-6 hour (half-life in presence of Nox
and SO2)Local
Xylene 8-14 hours (half-life) Local
Toluene 13 hours (half-life) Local
Ethylbenzene 2 days (half-life) Local
HCl/HF 1-5 days (half-life) Local, regional, global
HCN 530 days (half-life) Local, regional, global
Polycyclic Aromatic Hydrocarbons
(PAHs)
Benzo-A-Anthracene, Benzo-A-Pyrene,
Flruoranthene, Chrysene, Dibenzo-A-
Anthracene
Up to several days (lifetime) Local, regional, global
http://www.lung.org/assets/documents/healthy-air/coal-fired-plant-hazards.pdf
(1) Atmospheric residence time based upon lifetime or half-life as reported in chemical specific profiles published by the Agency for Toxic Substances and Disease Registry and the World
Health Organization available on-line (ATSDR, 2011; WHO, 2011).
(2) Assumed to be a component of fine particles.
Residence Time of Hazardous Air Pollutants in the Atmosphere
Metals
Dioxins/Furans
Volatile Organic Compounds
Emissions of Hazardous Air Pollutants from Coal-Fired Plants, Environmental Health & Engineering, 2011
Acid Gases

38
CFPPs are global polluters (ALA, 2011). Figure 5 illustrates the Spatial Range of Impact, which
presents the succession of emission from the point source to creation of a global pollutant.
http://www.lung.org/assets/documents/healthy-air/toxic-air-report.pdf
Figure 5. Spatial Range of Impact CFA and PM have been discussed in an earlier section, but it should be noted that fine
particulate matter is broken down into various categories and have quite different EPA
regulatory guidelines based on their breakdown and absorption rates. Emissions are referred to
as primary particulate matter, and secondary particulate matter. These chemicals react in the
atmosphere. Primary particulate matter is released directly into the atmosphere from a point
source and a reaction occurs from interaction with atmospheric conditions. Secondary
particulate matter is formed in the atmosphere after the initial release from the point source when
a chemical reaction takes place between the primary particle emissions. Secondary particle
emissions are noteworthy due to their ability to form at a variety of distances from the point

39
source. CFPPs produce the fine PM that contains secondary particle emissions, and the danger
resides in the effect of the spatial range of impact (USEPA, 2004).
CFPP emissions produce a class of air pollutants known as fine PM. Fine PM is defined
as aerosols that are smaller than 2.5 micrometers - smaller than the width of a human hair. In
addition to posing a hazard to human health and the environment, many of the metal HAPs
emitted from CFPPs become part of the fine particulate matter pollution in the United States
(USEPA 2009a, 2011). Inhalation of the PM (2.5 μm) over both short and long periods of time is
recognized to cause cardiovascular effects, including heart attacks and death, chronic lung tissue
damage and changes in blood chemistry that can cause clots. When inhaled, some particles
deposit along the respiratory tract, while others penetrate deeply into the lungs where they can
enter the bloodstream. Chronic exposure is also a likely cause of hospital admissions for
breathing problems and worsening of existing respiratory illnesses such as asthma (EH&E, 2011;
USEPA, 2009a).
The physical and chemical properties of coal fly ash (CFA) account for many of the
carcinogens listed at dangerous levels in the Apollo Beach plant. A discussion of the overall
health effects of coal fly ash show that the CFA assimilates many of these fine particulates, and
the HAPs accumulated during the fuel-combustion process are subsequently released into the
atmosphere. The concentration of hazardous waste in coal fly ash is dependent on the type coal
used, mineral content and composition, source of the coal (environmental area where it was
removed) as well as the conditions of the boiler in which the fuel combustion takes place. Four
major components are silica, aluminum oxide, calcium oxide, and iron oxide. Minor
components include magnesium oxide, sodium oxide and titanium oxide, potassium oxide,
phosphorus oxide, and sulfur trioxide (Cantrell, Brye, Miller, Mason & Fairey, 2014). The

40
emissions of sulfur trioxide from CFPP’s are currently being studied as a hazardous pollutant
(Sporl et al., 2014) as the rate of absorption of this HAP is dependent on the flue gas
desulfurization process employed by the utility. High levels of this compound can also have an
effect on the operation of the boilers and combustion units of the CFPP (Srivastava, Miller,
Erickson, & Jambhekar, 2004).
Trace amounts of heavy metals such as arsenic, barium cadmium, chromium, copper,
lead, mercury, molybdenum, nickel, selenium, strontium, vanadium and zinc, are also found in
coal fly ash (ALA, 2011; EH&E, 2011). The health effects of these HAPs are shown in Table 7.
This table shows the effects on human health and the environment by the Class of HAP and the
notable HAPs within each class. All of the pollutants produced at the Big Bend facility can be
found on this Table. The most direct influence on the community and surrounding environment
are from emissions of PM found in CFA content.
Health and Environmental Effects of CFPP Pollutants
There are two types of fly ash, Class C, which is produced from sub-bituminous coal and
has concentrated PM contaminants (20/50%). Class F ash is normally produced from bituminous
and anthracite coal combustion facility and has equally concentrate forms of PM contaminants in
different chemical combinations (10/70%). The study, conducted by Cantrell and colleagues
(2014), focused on selenium concentrations in CFPP fly ash in Arkansas and its effect on the
atmosphere and water supply of communities surrounding the plant. The water solubility of
selenium that had accumulated in the landfill was found to be higher and a significant health
hazard (Cantrell et al. 2014).

41
Table 7. Properties of Hazardous Air Pollutants Emitted From Coal Fired Utilities
Class of HAP Notable HAPs Environmental Hazards
Acid GasesHydrogen Chloride, Hydrogen
Fluoride
Acid precipitation, damage to crops and
forests.
Dioxins and Furans 2, 3, 7, 8- Tetrachlorodioxin (TCDD)
Deposits into rivers, lakes and oceans and is
taken up by fish and wildlife. Accumulates
in the food chain.
Mercury MethylmercuryTaken up by fish and wildlife. Accumulates
in the food chain.
Arsenic, Beryllium, Cadmium,
Chromium, Nickel, Selenium,
Manganese
Accumulates in soil and sediments. Soluble
forms may contaminate water systems.
Lead
Harms plants and wildlife; accumulates in
soils and sediments. May adversely affect
land and water ecosystems.
Polynuclear Aromatic
Hydrocarbons (PAH)
Naphthalene, Benzo-A-Anthracene,
Benzo-A-Pyrene, Benzo-B-
Fluoranthene, Chrysene, Dibenzo-A-
Anthracene
Exists in the vapor or particulate phase.
Accumulates in soil and sediments.
Radium
Uranium
Aromatic Hydrocarbons including
Benzene, Toluene, Ethylbenzene,
Xylene
Aldehydes including Formaldehyde
Carcinogen: lung and lymphatic system. Kidney
disease.
May cause irritation of the skin, eyes, nose, and
throat; difficulty in breathing; impaired function of
the lungs; delayed response to a visual stimulus;
impaired memory; stomach discomfort; and effects
to the liver and kidneys. May also cause adverse
effects to the nervous system. Benzene is a known
carcinogen.
Deposits into rivers, lakes and oceans and is
taken up by fish and wildlife. Accumulates
in soils, sediments, and in the food chain.
Degrade through chemical reactions in the
atmosphere and contribute to carbon based
radicals that contribute to formation of
ground-level ozone and its human health
effects.
Non-Mercury Metals and
Metalloids (excluding
radioisotopes)Damages the developing nervous system, may
adversely affect learning, memory, and behavior.
May cause cardiovascular and kidney effects,
anemia and weakness of ankles, wrists, and fingers.
Carcinogens: lung, bladder, kidney, skin. May
adversely affect nervous, cardiovascular, dermal,
respiratory and immune systems.
Toxicological and Environmental Properties of Hazardous Air Pollutants (HAPs) Emitted from Electric Generating Stations Fueled By Coal
Hazardous information compiled from toxicological profiles and concise chemical assessment documents for specific pollutants published by the Agency for Toxic Substances and Disease
Registry and World Health Organization and available on-line (ATSDR, 2011; WHO, 2011).
http://www.lung.org/assets/documents/healthy-air/coal-fired-plant-hazards.pdf
Radioisotopes
Volatile Organic Compounds
Probable carcinogen: lung and nasopharyngeal
cancer. Eye, nose and throat irritation, respiratory
symptoms.
Probable carcinogens. May attach to small
particulate matter and deposit in the lungs. May
have adverse effects to the liver, kidney, and testes.
May damage sperm cells and cause impairment of
reproduction.
Carcinogen: lung and bone. Bronchopneumonia,
anemia, brain abcess.
Human Health Hazards
Irritation to skin, eye, nose, throat, breathing
passages.
Probable carcinogen: soft tissue sarcomas,
lymphomas, and stomach carcinomas. May cause
reproductive and developmental problems, damage
to the immune system, and interference with
hormones.
Damage to brain, nervous system, kidneys and
liver. Causes neurological and developmental birth
defects.

42
A study conducted by Gilmour and colleagues (2004), concluded that CFA containing
fine and ultrafine particles were more capable of causing chronic pulmonary inflammation. For
CFPPs using a sub-bituminous coal system, ultrafine PM is more toxic than fine PM. This study
was conducted on female mice of breeding age as well as male rats. The toxicity found in the
lungs and pulmonary inflammation were consistent with previous studies but produced evidence
that the chemical composition of the aerosol of ultrafine PM was dependent on the coexistence
of type of coal used, as well as the amount of zinc present in the samples. The results suggest
that ultrafine PM particles were far more toxic to lung and pulmonary health than fine or course
PM particles (Gilmour, O’Connor, Dick, Miller, & Linak, 2004).
Borcherding and colleagues (2013) discovered that CFA is considered a poorly soluble
particle comprised of various carcinogenic metals. This is important since the majority of CFA
(up to 99%) are collected and deposited in landfills, providing a potential environmental harm
due to the deposit of transition metals into the water supply and redistribution into the
atmosphere leading to global environmental impacts. Epidemiological studies show strong
correlations between respiratory infections and fine PM resulting in cystic fibrosis, and COPD.
CFA’s can also be a source for bacteria in biological fluids, as those found in airway surfaces.
Airway surface liquids (ASL) can be found in the sweat glands, the porous membranes
surrounding the lungs, and in the ducts of the pancreas, and are therefore potentially detrimental
to human health (Borcherding, Chen, Caraballo, Baltrusaitis, Pezzulo, Zabner, et al. 2013). The
World Health Organization (WHO) reported that acute respiratory infections (ARIs) are the
leading cause of acute illnesses worldwide and one of the most important causes of morbidity
across the age spectrum. Ambient air pollutants are one of the main components in particulate
matter and are responsible for the development of ARIs. Particulate matter can cause a chemical

43
reaction with ambient air in the atmosphere, resulting in either primary or secondary PM. WHO
concluded by stating that CFA concentrations in fine particulate matter are related to daily
exposure in humans and pose potential public health risks, such as impaired lung function and
immune mechanisms in the body (Borcherding et al. 2013).
Another study, commissioned by the Health Effects Institute, used data from the National
Morbidity, Mortality and Air Pollution Study (NMMAPS), which is the largest time-series study
of adverse health consequences associated with exposure to environmental pollutants to date
(Samet, Zeger, Dominici, Curriero, Coursac, Dockery, et al. 2000). Results from the Samet and
colleagues study (2000), show a positive relationship between fine particular matter and
pulmonary mortality, cardiovascular disease, COPD, and pneumonia in patients over 65 years of
age. These findings were comparable to those found in the Harvard Six Cities Study (Dockery,
Pope, Xu, Spengler, Ware, Fay, et al. 1993; Laden, Neas, Dockery & Schwartz, 2000) which
showed associations between ultrafine particulate matter (PM 2.5μm) that were two times higher
in areas surrounding a CFPP compared to those in a large urban area with heavy traffic and
automobile emissions. The Harvard Six Cities Study exhibited that PM 2.5 μm was associated
with risk of mortality from cardiopulmonary diseases. An increase in the absorption of ultrafine
particulate matter was associated with an 8-18% increase in mortality from illnesses ranging
from heart disease to cardiac arrest. This PM absorption was associated with chest pain and an
increase in lifestyles considered sedentary with little to no physical activity (Dockery et al. 1993;
Laden et al. 2000).
Residual fly ash containing high concentrations of transitional metals has been shown to
induce changes in human skin cells, while dogs exposed to similar CFA in a Boston study
showed increased problems in lung tissue and circulatory system due to the inhalation of

44
vanadium and nickel (Clarke, Couli, Renisch, Catalano, Killingsworth & Koutrakis, 2000). The
composition of the PM is important to assess the human and environmental risks in ambient air
and water supplies. The combustion from a CFPP can reach target sites within the human body
through ASLs, adding to known lifestyle risk factors for cardiovascular disease such as diet,
tobacco smoke and stress (DelFino, Sioutas, & Malik, 2005).
Personal exposure to a pollutant, particularly those found in fine and ultrafine types of
particulate matter, will depend on the proximity to the source of the pollutant and the level of
exposure in the microenvironment. A study involving 22 students in Kampur, India, measured
fine, ultrafine, course and inhalable PM exposures, and proximity of the ambient air that was
closest to the point source. In the study, students walked a specified distance close to a point
source that emitted ultrafine PM. Proximity to the point source was seen as the single largest
contributing factor to pollutant exposure and possible health risk (Devi, Gupta, Jat & Tripathi,
2013). For decades the scientific community has been aware of the hazards of PM, however, the
emerging field of nanotechnology has the ability to measure even smaller nanoparticles and their
possible adverse effects on human health and the environment.
There is growing concern that nanoparticles could be potentially detrimental to the
environment and to human health (Biswas & Wu, 2005). Sulfates and hydrocarbons are the
major components of the particle. Ultrafine particles that contain metals could be producing
lethal nanoparticles as a by-product (Biswas & Wu, 2005). The human body has three major
contact points with the environment to intake nanoparticles: the skin, the lungs and the
gastrointestinal tract (Hussain, Ullah, Rehman, Khan, Muhammad, & Kahn, F., et al. 2009).
Recommendations from this and other studies suggest the need to develop control techniques
that reduce mass concentration of coarse and fine PM, thereby preventing the formation of

45
ultrafine PM and nanoparticles. Further recommendations from multiple studies encourage the
development of new sampling methods for PM, further research into the characterization of
metals contained in ultrafine PM and finally, the identification and classification of indoor and
outdoor ambient sources of ultrafine PM that could develop into dangerous and potentially lethal
nanoparticles (Biswas & Wu, 2005).
Dioxins represent the most toxic of all man-made chemicals. CFPPs produce dioxin
during the fuel-combustion process. Dioxin exposure causes a wide variety of adverse effects
from lethal outcomes to biochemical changes within the body as well as introduction of drug
metabolizing enzymes in the body. All species display sensitivity to lethal dioxin levels. Death
in the adult of a species is preceded by severe body weight loss known as “wasting syndrome”
(Birnbaum, 2015). Biochemical effects to dioxin exposure can be shown in responses to
enzymes, growth factors and hormones in the body (Birnbaum, 2015). Increases in thyroid
hormones are associated with exposure to dioxins as well as birth defects in pregnant women
(Birnbaum, 2015). Dioxin exposure has been linked to cancer, endometriosis, embryo/fetal
malformations and birth defects, and chronic respiratory illnesses, in both animals and humans
(Birnbaum, 2015).
Effects of CFPP Pollutants on Wildlife
Freshwater contamination is also a major concern for the health and welfare of wildlife,
and in the case of the Big Bend facility, particularly the manatees that congregate below the
Apollo Beach plant. The manatee viewing center located at the south side of the facility, directly
below the stacks is a popular tourist attraction at the facility. It has been established that the air
with the most density of HAPs occurs within one mile of a point source, therefore, the manatee
viewing station would be at risk for airborne as well as water-soluble contaminants. A study

46
conducted by Harmon & Wiley (2011), sampled freshwater organisms and the effects of water
contaminants on their health and morbidity. The study focused on groundwater, storm water,
and non-point source pollution including metals, hydrocarbons, aromatic hydrocarbons and
polycyclic hydrocarbons (Harmon & Wiley, 2011). Fish were more sensitive and showed
significant decreases in survival when exposed to water pollutants containing metal contaminants
(McQueen, Johnson, Rogers & English, 2010). Freshwater and sediments contaminated with
trace amounts of cadmium, nickel, chromium, lead, titanium, zinc, and manganese were
biologically accumulated in the bodies of fish, by species and were influenced by feeding
strategies of the species studied, and the particles ingested in a given area (Cid, Ibanez,
Palanques & Prat, 2010). Arsenic toxicity has also been reported in several aquatic organisms
(Daus, Weiss & Altenburger, 2010). Hexavalent chromium showed changes in enzyme activity,
DNA damage, as well as liver and kidney damage in several species studied (Velma &
Tchounwou, 2010). Increased lead intake was found on the skin, gills, eyes, liver, and intestines
of the organisms studied. If these organisms are a source in the natural food chain, human intake
may follow (Ahmed & Bibi, 2010). Stream dwelling organisms exposed to mercury suffer DNA
changes and transfer from mother to fetus. Noticeable accumulation of mercury in fish tissues,
delayed development and decreased motor activity in fish, as well as genotoxins were noted in
mullet in Portugal (Pereira, Guilherme, Barroso, Verschaeve, Pacheco & Mendo, 2010a). Nickel
and selenium exposure also result in toxicity to the existing environments of fish and
microorganisms studied (Browne & Lutz, 2010; Cloran, Burton, Hammerschmidt, Taulbee,
Custer & Bowman, 2010). Zinc accumulation in tissues of freshwater organisms has been found
to affect the rate of fish population increases and density of a species in a given area (Sanchez-
Ortiz, Sarma & Nandini, 2010; Wang & Guan, 2010).

47
The protection of freshwater aquifers and ultimately the drinking water supplies of areas
surrounding CFPPs continue to be a primary concern for activists and members of communities
within the critical atmospheric contaminant radius of the facility. Table 8 shows the top
hazardous drinking water contaminants. This table not only indicates the type of contaminant in
the water supply, but supplies information on the health effects from exposure to the
contaminant. In addition, it indicates the most common point source for the contaminant
entering the drinking water supply.
Conclusion
Pollutants associated with burning coal cause numerous adverse health consequences for
humans and non-humans alike. Among the lethal consequences of ingesting coal fire pollutants
are cancers of all types, particularly of the liver, kidney and lungs. Included in this list of
additional health effects are pulmonary diseases, asthmatic conditions, gastro-intestinal lesions,
skin abrasions and several types of dermatitis. All of these conditions have been associated with
ingesting CFA pollutants through airborne PM as well as through the weathering and leaching of
toxins through groundwater.
Monitoring the source points of these contaminants is vital for the health and welfare of
the human population as well as the continued care of domestic animals, wildlife, and
endangered species in the affected areas. In the waters of Tampa Bay surrounding the Big Bend
facility, manatees are a state and federally protected endangered species (FWS, North Florida
Ecological Services Office, 2015). The negative effects of the contaminants in CFPPs on
freshwater organisms that serve as part of the food chain for the manatee, will ultimately affect
the overall sustainability of the species in this area.

48
Table 8. Top Hazardous Drinking Water Contaminants
ContaminantMax Contaminant
Level Goal (mg/L)1
Max Contaminant
Level (mg/L)2
Potential Health Effects from Long-term
Exposure above the MCL
Common Sources of Contaminant in
Drinking Water
Arsenic 0 0.010 as of 01/23/06Skin damage or problems with circulatory systems,
and may have increased risk of getting cancer
Erosion of natural deposits; runoff from orchards,
runoff from glass and electronicsproduction wastes
Beryllium 0.004 0.004 Intestinal lesions
Discharge from metal refineries and coal-burning
factories; discharge from electrical, aerospace, and
defense industries
Cadmium 0.005 0.005 Kidney damage
Corrosion of galvanized pipes; erosion of natural
deposits; discharge from metal refineries; runoff
from waste batteries and paints
Chromium (total) 0.1 0.1 Allergic dermatitisDischarge from steel and pulp mills; erosion of
natural deposits
Short term exposure: Gastrointestinal distress
Long term exposure: Liver or kidney damage
People with Wilson's Disease should consult their
personal doctor if the amount of copper in their
water exceeds the action level
Infants and children: Delays in physical or mental
development; children could show slight deficits in
attention span and learning abilities
Adults: Kidney problems; high blood pressure
Mercury (inorganic) 0.002 0.002 Kidney damage
Erosion of natural deposits; discharge from
refineries and factories; runoff from landfills and
croplands
Selenium 0.05 0.05Hair or fingernail loss; numbness in fingers or toes;
circulatory problems
Discharge from petroleum refineries; erosion of
natural deposits; discharge from mines
Dioxin (2,3,7,8-
TCDD)zero 0.00000003 Reproductive difficulties; increased risk of cancer
Emissions from waste incineration and other
combustion; discharge from chemical factories
Contaminant Secondary Standard
Copper 1.0 mg/L
Iron 0.3 mg/L
Manganese 0.05 mg/L
Zinc 5 mg/L
National Secondary Drinking Water Standards
(1) Maximum Contaminant Level Goal (MCLG) - The level of a contaminant in drinking water below which there is no known or expected risk to health. MCLGs allow for a margin of safety
and are non-enforceable public health goals. Maximum Contaminant Level (MCL) - The highest level of a contaminant that is allowed in drinking water. MCLs are set as close to MCLGs as
feasible using the best available treatment technology and taking cost into consideration. MCLs are enforceable standards. Maximum Residual Disinfectant Level Goal (MRDLG) - The level of
a drinking water disinfectant below which there is no known or expected risk to health. MRDLGs do not reflect the benefits of the use of disinfectants to control microbial contaminants.)
Treatment Technique (TT) - A required process intended to reduce the level of a contaminant in drinking water.
(2) Units are in milligrams per liter (mg/L) unless otherwise noted. Milligrams per liter are equivalent to parts per million (PPM).
(7) Lead and copper are regulated by a treatment technique that requires systems to control the corrosiveness of their water. If more than 10% of tap water samples exceed the action level, water
systems must take additional steps. For copper, the action level is 1.3 mg/L, and for lead is 0.015 mg/L.
Top Hazardous Drinking Water Contaminants, 2009
Copper 1.3 TT7 ; Action Level=1.3Corrosion of household plumbing systems; erosion
of natural deposits
http://water.epa.gov/drink/contaminants/
Lead 0 TT7; Action Level=0.015Corrosion of household plumbing systems; erosion
of natural deposits

49
Airborne contaminants and those that are weathered into the water through acidification,
air current travel, or leaching through the soil need to be closely monitored. The Big Bend
facility has toxic levels of several contaminants discussed in this chapter, including lead, nickel,
and ultrafine particulate matter containing heavy metals, and the resulting negative health effects
on the communities up to five miles from the plant (CATF, 2011). Negative effects, both in the
environment and immediate health risks to human and non-humans have been found to be most
concentrated at one mile from the point source (EH&E, 2011). The residual effects from five to
thirty miles from the CFPP will present health and environmental effects that the EPA monitors
for environmental justice infractions as well as data that can be used to investigate allegations of
environmental racism in these communities (PERI, 2013).

50
CHAPTER FOUR:
THE BIG BEND FACILITY
Tampa Electric Company: A Business Profile
It is important to understand how a CFPP functions to dissect the environmental
problems associated with electrical production from a CFPP. Electricity has been essential in
American culture, business, and its economy since discovery and development in the 18th
century. The background of TECO as a business entity is critical in understanding the operations
of the facility. The following information is from their 2014 Corporate Sustainability Report to
Shareholders.
TECO Energy (TE) is listed on the NYSE and is an investor-owned public utility holding
company, headquartered in Tampa, Florida. The company has been supplying utility needs in
Florida for 120 years. TECO Energy has holdings in regulated electric and natural gas utilities.
The company has three other utility-based holdings and serves 700,000+ customers in West
Central Florida. TECO Coal Corporation, an unregulated coal mining and processing facility
headquartered in Corbin, Kentucky that mine coal in Kentucky, Tennessee and Virginia and ship
nearly 6 million tons of coal annually to domestic utilities (other than Tampa Electric) as well as
customers in Asia and Europe.
The final holding is TECO People’s Gas Company, established when TECO formed an
agreement with Continental Energy Systems LLC to purchase the New Mexico Gas Company.
New Mexico Gas Company was a natural gas utility headquartered in Albuquerque, New

51
Mexico. TECO has absorbed this company and as of the last quarter of 2014 it is TECO
People’s Gas, supplying natural gas to 350,000 residential consumers in many of Florida’s
metropolitan areas.
TECO’s base holdings are quite diversified and have a regulated electric utility capacity
of almost 4,700 megawatts. The Big Bend facility has a 1,730 megawatt capacity with Stacks 1,
2, 3, and 4 with an additional 60 megawatts of capacity using a separate natural gas and fuel oil-
fired peaking unit. Big Bend has a 38% share of TECO’s total energy capacity (TECO
Corporate Sustainability Report, 2014). TECO Energy, Inc. (TE) is currently trading at $19.5 a
share on the New York Stock Exchange with a 31% positive stock rating (FlashRatings, Oil and
Gas Investment, 2015).
The Operation of a Coal Fire Plant
“Coal power is a rather simple process. In most plants, the chunks of coal are crushed
into a fine powder, fed into a combustion unit, and burned at high temperature. Heat from the
burning coal is used to produce steam, which powers turbines that generate electricity.”
(IECG, 1996) In the early days of steam-produced electricity, wood fires were used. The labor
hours necessary to gather the wood for such high heat combustion along with constant demand
made this system impractical. In the 1920s, a process known as pulverized coal firing was
developed. Advantages of this system were a higher combustion temperature yielding more
steam. Improved thermal efficiency and lowered requirements for ambient air usage provided a
constant flow of steam to power the turbines and created continuous electricity. By the 1940s
the cyclone furnace was in operation. This technology, which was considered revolutionary,
allowed the combustion of poorer grade coal with less ash production from the fine powder and a
more efficiently run turbine system. Currently, coal fire power plant technologies are still based

52
on the same methods used in the 1920s through the 1940s. Technological improvements in
computer operations have made coal power the most common method of modern electricity
production. Cyclone furnaces required even less processing of the raw coal. Cyclone furnaces
have the capacity to burn poorer grade coal with up to twenty-five percent additional moisture
and ash content. A poorer grade of coal is more cost efficient for the coal combustion process
(CCP). The cyclone furnace is a large cylinder, jacketed with water piping that absorbs
extremely high heat, creating steam. This steam is then converted to electricity. Additionally,
steam protects the burner from melting down due to the extreme temperatures (IECG, 1996;
Union of Concerned Scientists, 2010).
In coal production systems, the raw coal is pulverized into a fine powder that burns as
easily and efficiently as gas. Computers control the “feeding rate” of coal into the boiler, the
amount of air needed for drying, and transportation of the pulverized coal. Pieces of the coal are
crushed between cylindrical rollers that move between two tracks. The coal is washed in a
chemical solution to remove impurities and fed into the pulverizing unit, along with air heated to
650 degrees Fahrenheit. As the coal becomes crushed by the rolling actions, the hot air dries it
and blows the usable fine coal powder out to be used as fuel (Union of Concerned Scientists,
2010).
A high powered fan blows the heated air into pulverized coal at one end of the cylinder
and at the same time additional heated air is injected along the cylinder causing the coal/air
mixture to swirl in a “cyclone” motion. The whirling of the air and the coal enhances the
burning properties producing extremely high heat and high combustion temperatures (The
cylinder is synonymous with a turbine.) Steam spins the turbine blades. The turbine, connected
to a cylinder of insulated wire coils inside magnets, or to magnets inside of wire coils (whichever

53
the manufacturer prefers) that spin in relation to each other. As it moves through the magnetic
field, a current is induced in the generator’s coil. High voltage power transmitted from
multiple utility power generation plants is synchronized and interconnected, forming the North
American Power Grid (Gore, 2009). Electricity from the grid is distributed through a network of
disconnects, circuit breakers, protective relays and step-down transformers to utility substations
that deliver the power to end-users. Homeowners are one type of end-user that consumes this
electricity.
With the cyclone process, slag remains on the walls insulating the burner, retaining heat,
while the rest drains through a trench in the bottom to a collection tank where it solidifies and
can then either be collected for recycling or disposal. The collection of coal ash is a significant
financial incentive for the use of cyclone furnace technology. Cyclone technology empties
approximately 40% of the coal ash with the exhaust fumes, while pulverizing methods empty
approximately 80% of the coal ash with the exhaust fumes. For greater efficiency and
profitability, the goal is to have more coal powder burned with less accumulated ash (Abresist
Corporation, 2013).
There are distinct disadvantages to cyclone technology. The coal requires low sulfur
content in order for the ash to melt for collection in the tanks. High power fans are necessary to
move the larger raw coal chunks and air through the furnace, producing additional nitrogen oxide
pollutants compared to the pulverized combustion method. Coal burners require annual
replacement due to erosion of the liners in the turbines.
The Tampa Bay Times ranked Florida as the third worst in the nation for power plant
generated toxic air, while Tampa Electric’s Big Bend Power Plant was listed by name in the
article as one of the largest polluters in the state, even as the industry continues to sanitize their

54
environmental image with residents of Florida and environmental action groups around the
United States (Klas, 2011; Ramos, 2013; TECO, 2014). In 2000, owing to previous violations at
the Big Bend Facility, TECO and the USEPA entered into an agreement to settle prior
environmental violations. This settlement has drawn public criticism. Environmental protests
and rallies have occurred at the Big Bend facility since the EPA settlement in 2000. The most
recent protest was in 2011 when 150 protesters blocked the main entrance into the Big Bend
facility. Occupy Wall Street and EarthFirst, a small environmental group, based in St.
Petersburg, joined forces. Six protesters chained themselves to PVC pipe and blocked US 41
and Wyandotte Road near the entrance of the facility. TECO officials were quick to point out
that the protest did not cause any disruption in the daily operation of its Big Bend Facility (Klas,
2011). The Apollo Beach Plant has become a rallying point for environmentalists who wish to
see coal-fired power plants shut down in the state of Florida, and across the United States.
The Big Bend Facility
TECO describes its Big Bend facility as follows:
“…. Big Bend has four coal-fired units with a combined output of more than 1,700 megawatts. The first unit began service in 1970; the second and third generating units were added in 1973 and 1976 respectively; and Unit Four was added in 1985. A natural gas- and fuel oil-fired peaking unit was installed in 2009 to provide additional power during periods of peak demand. Big Bend uses flue gas desulfurization systems or scrubbers, which remove sulfur dioxide when the coal is burned. The scrubber for Unit Four began operation in 1984 and since 1995 has simultaneously scrubbed Unit Three as well. The scrubber for Units One and Two began operation at the end of 1999. The scrubber system complies with standards set by US CAA amendments of 1990 and removes 95% of sulfur dioxide from all four units. Use of electrostatic precipitators to remove particulate matter from the stacks was completed in 2004. In 2009, a
60 megawatt natural gas and fuel oil-fired peaking unit at Big Bend support TECO’s commitment to power for its customers. During the scrubbing process coal combustion gases are sprayed with a mixture of water and limestone. Sulfur oxides react with the spray to form gypsum. TECO recycles all of its gypsum. Gypsum is used in drywall for construction, in cement and concrete and in agriculture as a soil nutrient or fertilizer. Fly ash, a fine particulate matter that results from the combustion of coal and is collected in the electrostatic precipitators in all four Big Bind Units, is used in the cement and

55
concrete industries. Slag, which is collected at the bottom of the furnace, is a hard, glass- like material with many reuses, including cement production. The hard quality of the slag makes it valuable to use as a high-velocity blast material to clean ships, storage tanks and other large metal surfaces…” (TECO, 2015).
TECO promotional materials relay that recycling these hazardous materials is beneficial
for the environment. Gypsum can be produced in two forms, naturally occurring and FGD or
flue-gas desulfurization. FGD Gypsum is a byproduct of desulfurization of flue gasses from the
stacks of CFPPs. Pollutants captured from the smoke stack can be purified into a hard substance
and manufactured into gypsum, generally for use in drywall and plaster. The chemical
composition of both natural and FGD gypsum are the same. Natural gypsum is a non-toxic
mineral. Environmentalists see FGD gypsum differently, as the stack is releasing many more
pollutants and the gypsum is not considered pure when it is captured (Gypsum Association,
2015).
Slag, as indicated on the company site (TECO, 2015) is a glass-like by-product, collected
on the bottom of the coal furnaces. Coal slurry, also known as coal sludge, is the product
produced when slag begins funneling out of the furnace collection area. The slag forms at high
temperature at the bottom of the boilers, it is channeled out of the furnace and water and
chemicals are poured over it. With rapid cooling, a chemical reaction takes place and gives the
slag a cement-like consistency. The slag has now become coal slurry and can be pumped into
ponds or beds for recycling. The dangers of coal slurry and the HAPs associated with this
substance have been discussed in detail in Chapter two. CFA has been discussed at length in
Chapter three. Sections on gypsum and slag from the TECO company site are promotions to
induce consumer confidence that these materials are not hazardous. Coal fly ash has been on
environmental watch lists since the CAA became law in the l970’s. Gypsum and slag are other

56
byproducts that have been on many environmental watch lists and according to the
Environmental Integrity Project “have no good use” (Environmental Integrity Project, 2011).
Florida is ranked 14th in the nation in morbidity due to HAP’s produced by CFPPs
(CATF, 2007). The toxins identified as hazardous to both human health and the environment,
are in Chapter three listed on Table 7. PM and the detrimental health effects of dioxins have
been discussed in Chapter three. These HAPs are emitted from the CFPP in Apollo Beach, but
fall within EPA boundaries of an “acceptable” level of pollutant. CFPPs in particular produce
Hydrochloric Acid (HCl), hydrofluoric acids, dioxins, as well as sulfur dioxide and nitrogen
oxide that contribute to atmospheric acidity and water contamination (EH&E, 2011).
Toxins of Concern at TECO’s Big Bend Facility
In December 2011, The Environmental Integrity Project released a report that indicated
electric utilities produced over 200 million pounds of toxic air emissions in a single year.
Florida ranked 11th in excesses of arsenic, chromium, cobalt, hydrochloric acid (HCI), lead,
mercury, nickel, and selenium emissions and in several areas the Big Bend Plant is mentioned by
name.
Table 9 shows the national rankings for lead emissions by CFPPs. Big Bend ranked 29th
in the nation for emitting excesses of lead into the air (Environmental Integrity Project, 2011). In
2010, Big Bend released 710 pounds of lead (Pb) into the atmosphere. Exposure to lead affects
the blood, the nervous, immune, renal and cardiovascular systems. Lead exposure can also cause
gastrointestinal symptoms, severely damage the brain and kidneys, and may cause reproductive
effects. Early childhood and prenatal exposures are associated with slowed cognitive
development, and learning deficits such as ADHD. Large doses of some lead compounds are
known to cause cancer (Barbosa, Tanus-Santos, Gerlach & Parsons, 2005; EH&E, 2011).

57
Table 9. Top Lead Emitters, Big Bend Ranked 29th
Rank Facility State Owner Lead (lbs)
1 Paradise Fossil Plant KY U.S. Tennessee Valley Authority 2,607
2 Milton R Young Station ND Minnkota Power Cooperative, Inc. 1,557
3 Brunner Island Steam Electric Station PA PPL 1,513
4 Montour Steam Electric Station PA PPL 1,379
5 San Miguel TX San Miguel TX San Miguel Electric Cooperative, Inc. 1,374
6 J H Campbell Generating Plant MI Consumers Energy 1,371
7 Bowen Steam Electric Generating Plant GA Southern Co 1,348
8 Bruce Mansfield Power Plant PA FirstEnergy Generation Corp 1,348
9 Gibson Generating Station IN Duke Energy Corp 1,291
10 Wabash River Generating Station IN Duke Energy Corp 1,289
11 Ghent Station KY LG&E & KU Energy LLC 1,230
12 Mill Creek Station KY LG&E & KU Energy LLC 1,201
13 Chena Power Plant AK Aurora Energy LLC 1,127
14 Hatfield Power Station PA Allegheny Energy, Inc. 1,062
15 Walter Scott Jr Energy Center IA Berkshire Hathaway 1,060
16 Big Sandy Plant KY American Electric Power 1,059
17 Shawville Station PA Genon Energy, Inc. 1,043
18 DE Karn JC Weadock Generating Plant MI Consumers Energy 1,022
19 EME Homer City Generation LP PA Edison International 905
20 Bonanza Power Plant UT Deseret Power Electric Cooperative 857
21 IPL Petersburg IN AES Corp 823
22 Clifty Creek Station IN Ohio Valley Electric Corp 805
23 Wansley Steam Electric Generating Plant GA Georgia Power Co 799
24 George Neal North IA Berkshire Hathaway 780
25 Birchwood Power Facility VA Birchwood Power Partners LLC 772
26 Colstrip Steam Electric Station MT PPL Montana LLC 772
27 Plum Point Energy Station AR Plum Point Services Company, LLC 759
28 Cope Station SC Cope Station SC SCAN 724
29 Big Bend Power Station FL TECO Energy, Inc. 710
30 Harrison Power Station WV Allegheny Energy, Inc. 668
31 Boswell Energy Center MN Allete, Inc. 665
32 Baldwin Energy Complex IL Dynegy, Inc. 663
33 Gavin Plant OH American Electric Power 660
34 Wateree Station SC SCANA 659
35 JM Stuart Station OH The Dayton Power & Light Company 656
36 Branch Steam Electric Generating Plant GA Southern Co 655
37 Amos Plant WV American Electric Power 642
38 Kammer/Mitchell Plant WV American Electric Power 641
39 Labadie Energy Center MO Ameren Corp 636
40 Riverton Generating Station KS The Empire District Electric Co 589
Top Power Plant Lead Emitters - 2010
Lead is emitted in two forms as a pollutant: metallic and chemical. Airborne lead most
commonly appears in particulate matter as an oxide (PbO, Pb3O4, and PbO2) and can come from
a variety of sources, including coal mining and non-ferrous metal production (Meng, 2014).
These emissions are the primary causes of lead exposure in communities close to a CFPP and the

58
health consequences of that proximity (Shea, 2007). The lead particulates can enter the body
through inhalation or the ingestion of lead-contaminated food, water, soil, dust and paint (Ayres
& Olsen, 2011). Lead absorbed through inhalation accounts for up to 90% of lead absorption
and is the primary intake method for both adults and children. Children absorb lead at a higher
rate and are more susceptible to its effects compared to the adult population. The respiratory
rates of children are higher than adults; higher heart rate and O2 saturation levels in the blood
may contribute to the effect between childhood and adult lead absorption levels in the
bloodstream (Meng, 2014).
Big Bend is also a leader in the production of environmental nickel emissions. Nickel
(Ni) is described as a transitional metal that is discharged into the air, water, and soil through a
variety of natural and industrial methods including CFPP, combustion and incineration. The
EPA has suggested that the inhalation health risks associated with consumption of nickel (Ni) to
the maximum individual risk, exceeded that from all other HAPs, due to its relatively high
concentration, generally 1-4 wt%. It has known carcinogenic properties and is found in high
concentrations in fly ash from the plumes exiting CFPP stacks. This prompted EPA to impose
limits on the concentration of Ni allowed in fly ash; 0.0002 lb./MWh output, as a basis for
residual electrical power plants (Galbreath, Schultz, Toman, Nyberg, Huggins, Huffman, et al.
2005). EPA began rigorous investigations of Ni concentrations in CFPP input and output levels.
Nickel dermatitis, consisting of itching of the fingers, hands, and forearms, is the most common
effect in humans following skin contact with nickel. Human and animal studies have reported an
increased risk of lung and nasal cancers from exposure to nickel dusts (EH&E, 2011). The EPA
has classified nickel dust, nickel sub-sulfide, and nickel carbonyl as human carcinogens
(USEPA, 2014). Table 10 shows top nickel emitters in the US. The Big Bend facility appears

59
44th on this national list. The plant emitted 970 pounds of nickel byproduct into the atmosphere
in 2010 (EH&E, 2011). The EPA had originally estimated the Ni compound mixture to have a
50% carcinogenic effect on human health. A 2002 study of two electric utility steam-generated
plants found that this percentage was over-estimated and that further research is needed to
determine the exact percentage of Ni compound mixtures in nitrogen oxide and nickel sulfate in
the atmosphere and its impact on human health (Galbreath et al. 2005).
Major pollutants found at Big Bend also include arsenic (As), which the EPA has
classified as a carcinogen. As an air pollutant, it has been shown to be associated with lung
cancer, while ingestion has been linked to skin cancer and also bladder, liver and lung cancers.
Acute high-level inhalation exposure to arsenic dust or fumes can cause central and peripheral
nervous system disorders. Chronic exposure is associated with gastrointestinal effects, anemia,
neuropathy, skin lesions and liver or kidney damage (EH&E, 2011).
Arsenic is a known by-product of fly ash (EH&E, 2011) and it becomes airborne through
absorption into fine particulate matter and is released through the steam-generated plumes
emanating from the CFPP stacks. Of great concern is the water-soluble state arsenic compounds
maintain in coal fly ash storage ponds near the plant. As the compound degrades, environmental
harm and exposure occur due to leaching of the pollutant into groundwater sources and
subsequent soil absorption (Cantrell et al. 2014). CFPP waste includes two forms of Chromium:
Trivalent Chromium (CrIII) and Hexavalent Chromium Cr(VI). CrIII is an essential element in
humans and is much less toxic that Cr(VI). Acute and inhalation exposure to Cr(VI) can cause
shortness of breath, coughing, and wheezing. Chronic exposure can cause perforations and
ulcerations of the membranes in the nose and heart, and other diseases of the respiratory system
(EH&E, 2011). Hexavalent chromium has been found in fly ash concentrate

60
Table 10. Top Nickel Emitters, Big Bend Ranked 44th
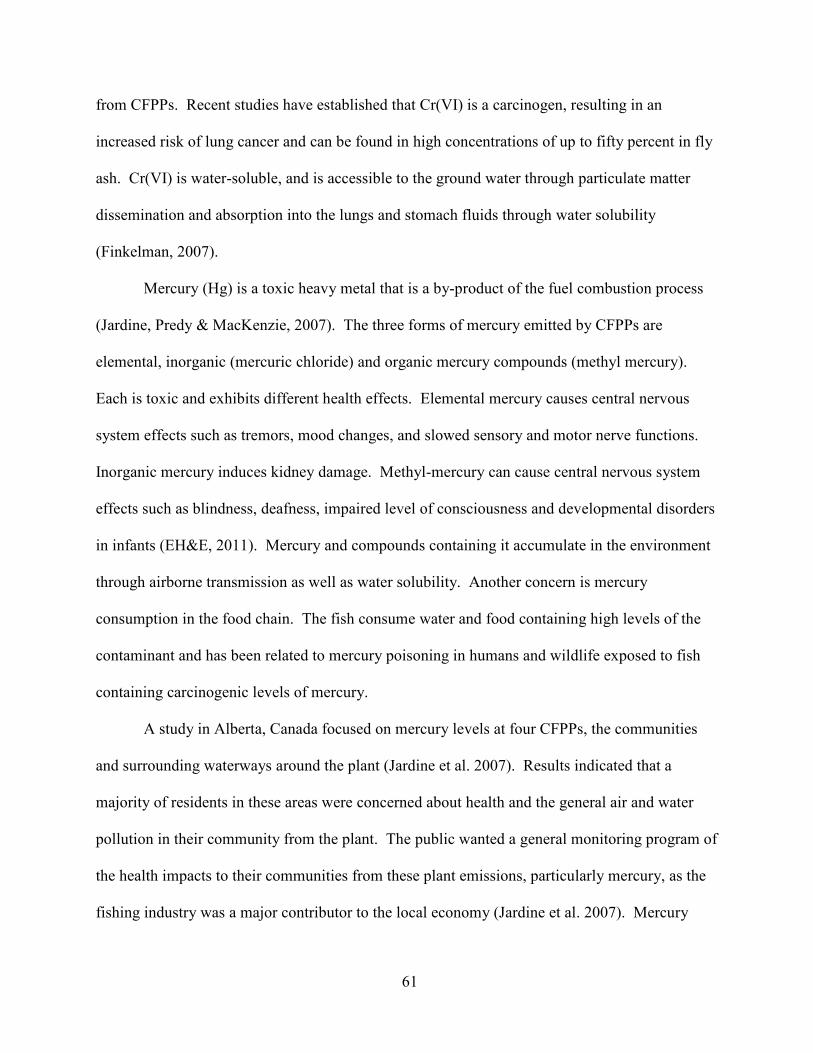
61
from CFPPs. Recent studies have established that Cr(VI) is a carcinogen, resulting in an
increased risk of lung cancer and can be found in high concentrations of up to fifty percent in fly
ash. Cr(VI) is water-soluble, and is accessible to the ground water through particulate matter
dissemination and absorption into the lungs and stomach fluids through water solubility
(Finkelman, 2007).
Mercury (Hg) is a toxic heavy metal that is a by-product of the fuel combustion process
(Jardine, Predy & MacKenzie, 2007). The three forms of mercury emitted by CFPPs are
elemental, inorganic (mercuric chloride) and organic mercury compounds (methyl mercury).
Each is toxic and exhibits different health effects. Elemental mercury causes central nervous
system effects such as tremors, mood changes, and slowed sensory and motor nerve functions.
Inorganic mercury induces kidney damage. Methyl-mercury can cause central nervous system
effects such as blindness, deafness, impaired level of consciousness and developmental disorders
in infants (EH&E, 2011). Mercury and compounds containing it accumulate in the environment
through airborne transmission as well as water solubility. Another concern is mercury
consumption in the food chain. The fish consume water and food containing high levels of the
contaminant and has been related to mercury poisoning in humans and wildlife exposed to fish
containing carcinogenic levels of mercury.
A study in Alberta, Canada focused on mercury levels at four CFPPs, the communities
and surrounding waterways around the plant (Jardine et al. 2007). Results indicated that a
majority of residents in these areas were concerned about health and the general air and water
pollution in their community from the plant. The public wanted a general monitoring program of
the health impacts to their communities from these plant emissions, particularly mercury, as the
fishing industry was a major contributor to the local economy (Jardine et al. 2007). Mercury

62
controls in the atmosphere are dependent on the CFPPs operating characteristics and design. As
the EPA began to maintain stricter control, options for CFPPs ability to achieve the reductions
diminished, due to high cost of construction, and the costs associated with the implementation of
new technologies (Brown, Smith, Hargis & O’Dowd, 1999). The EPA report on HAPs
suggested that mercury emissions were of particular concern for CFPP operators and the
communities that surround them (Finkelman, 2007).
Selenium (Se) is a naturally occurring essential element. In high concentrations,
exposure to inhaled elemental selenium, hydrogen selenide, and selenium dioxide can result in
respiratory effects such as irritation of mucous membranes, pulmonary edema, severe bronchitis,
and bronchial pneumonia. Chronic exposure to selenium, in food and water, causes skin
discoloration, deformation and loss of nails, loss of hair, excessive tooth decay and discoloration,
lack of mental alertness, and listlessness. Selenium sulfide has been shown to have carcinogenic
effects in animals (EH&E, 2011). Se is a potential groundwater and airborne carcinogen due to
its presence in coal fly ash. Of all the inorganic CCPs, particularly in fly ash, selenium is
hazardous due to the transference of Se from the coal to the ash through a physical,
condensation-absorption process. Se has the narrowest range between what is considered
beneficial and detrimental to both species occupying land and sea. Human exposure has a
narrow range, and is biologically accumulated, through both the food chain and the water supply.
Recreational water use such as those found in pools, natural waterways, and groundwater runoff
are examples of how this contaminant can be absorbed through the skin and find its way into
waterways. As a result, the water in a community’s drinking supply is often in danger from high
levels of Se as well (Cantrell et al. 2014; EH&E, 2011).
63
Current levels considered acceptable by the EPA are 50 ug Se/L in drinking water. Fly
ash has a mean Se concentration of 14 mg Se/kg (about 280 times the EPA MCL level for
drinking water) and can range between 5.5 and 46.9 mg of Se/kg (Cantrell et al., 2014). Se can
be released from the over 43,900,000 metric tons of bottom and fly ash stored in coal ash
landfills (some of which are protectively lined and many that are unlined) in the US annually.
The leaching of Se from a coal ash landfill could contribute to environmental harm to fish,
wildlife and human health, through weathering or leaching through these ponds. Se can also be
released from stored fly ash and become airborne and mobile in groundwater if the landfill does
not have a proper liner (Cantrell et al. 2014). There are eleven landfills on site at Big Bend and
ten are unlined at this time (Clean Air Coalition, 2010).
Hydrochloric Acid (HCl) is corrosive to the eyes, skin and mucous membranes. Acute
exposure can cause eye, nose and respiratory tract irritation and inflammation and pulmonary
edema in humans. Acute oral exposure can cause damage to the mucous membranes and contact
with the human skin can produce severe burns and scarring. Chronic exposure to HCl has been
reported to cause gastritis, chronic bronchitis, and skin abrasions. Electric utilities are the top
industrial source of HCl emissions, releasing 164,839,701 pounds of HCI into the air in 2010
(EH&E, 2011).
As illustrated above the Big Bend facility emits a number of pollutants known to affect
human health. Appendix A, Table A1 shows HAP emission totals from 2005 to 2013 for the Big
Bend facility. Also, this review indicates that the Big Bend facility ranks poorly (a top polluter)
among CFPPs in the nation. This level of emission has caused TECO to be sited for federal
environmental violations. The next section reviews those violations.

64
The Lawsuits
This section addresses federal environmental violations at TECO’s Big Bend power
station. Figure 6, TECO Big Bend Timeline of Significant Events, gives a visual illustration of
the actions taken by the EPA, FDEP and Big Bend, that influenced or impacted the lawsuits,
settlement, compliance and enforcement issues referenced within this study. Although both the
Gannon and Big Bend facilities are part of the lawsuit, the list of sanctions will only be examined
for Big Bend.
The FDEP teamed with the EPA to file a Notice of Violation (NOV) for plant infractions
of the CAA and Permit Violations. The NOV was given to TECO for the Big Bend and Gannon
power stations pursuant to sections 113(a)(1) of the Clean Air Act (CAA), 42 U.S.C.
§7413(a)(1). These are permit violations by TECO were for modifications to the plant that were
not properly permitted.
From 1971 to 1998 TECO modified their smoke stacks to increase wattage and service
more customers. The DOJ, on behalf of the EPA, filed a lawsuit against TECO on November 3,
1999, alleging TECO violated the Prevention of Significant Deterioration (PSD) requirements of
Part C of the CAA, 42. U.S.C. §§ 7470-7492. The EPA alleged that TECO failed to obtain a
PSD permit and apply Best Available Control Technology (BACT) before proceeding with
various power plant modifications completed between 1991 and 1996. Modifications included
replacements of boiler equipment, high temperature re-heater, water wall, cyclone, and the
furnace floor.
The FDEP filed a lawsuit against TECO on December 7, 1999, which mirrored the EPA
lawsuit. The lawsuit was filed on behalf of the state of Florida for Region 4 and re-delegated to
the Director of the Air, Pesticides and Toxics Management Division of the Environmental

65
EP
A estab
lished
.
Clean
Air A
ct passed
by
Co
ng
ress, NA
AQ
S in
itial stan
dard
s set.
Natio
nal A
ction
on
Air Q
uality.
EPA
defin
es air po
llutio
n lev
els.
Co
ng
ress passes C
lean W
ater Act.
First w
aste water p
ermits Issu
ed b
y E
PA.
Co
ng
ress passes S
afe Drin
kin
g W
ater Act.
EPA
pro
hib
its po
lluters fro
m receiv
ing
federal m
on
ey.
Reso
urce C
on
servatio
n an
d R
ecov
ery A
ct passed
by
co
ng
ress.
To
xic S
ub
stances C
on
trol A
ct passed
by
con
gress.
Natio
nal d
rink
ing
water stan
dard
s go
into
effect.
Clean
Air A
ct amen
dm
ents, C
FP
Ps req
uired
to ad
op
t scru
bb
er techn
olo
gy.
Clean
Water A
ct amen
ded
to in
clud
e tox
ic po
llutio
n
con
trols.
EPA
sets new
lead air p
ollu
tion
stand
ards.
EPA
ado
pts th
e Bu
bb
le Po
licy.
Co
ng
ress creates Su
perfu
nd
Pro
gram
(CE
RC
LA
).
En
viro
nm
ental ju
stice mo
vem
ent starts.
Am
end
men
ts to R
CR
A o
f hazard
ou
s and
solid
waste.
Disco
very
of o
zon
e dep
letion
.
Safe D
rink
ing
Water A
ct amen
dm
ents, E
PA reg
ulates
ov
er 10
0 co
ntam
inan
ts and
exp
and
ed en
forcem
ent
po
wer.
Wetlan
ds E
cosy
stem P
rotectio
n b
y E
PA.
Co
ng
ress Passes E
CR
A, E
merg
ency
Plan
nin
g an
d
Rig
ht T
o K
no
w A
ct for ch
emical safety.
Re
gu
lato
ry A
gen
cy
Actio
n
12
/3/7
0
12
/31
/70
4/3
0/7
1
10
/1/7
1
10
/8/7
2
3/2
/73
12
/16
/74
4/1
7/7
5
9/3
0/7
6
10
/11/7
6
6/2
5/7
7
8/8
/77
12
/28
/77
9/2
9/7
8
12
/3/7
9
12
/10
/80
9/1
5/8
2
12
/4/8
4
5/1
6/8
5
6/1
9/8
6
10
/6/8
6
10
/17
/86
1972 1973 1974 1975 1978 1979 1980 1982 1984 1985
Big
Ben
d U
nit T
wo
(Stack
2) b
egin
s service.
TE
CO
app
lies for site licen
se to b
uild
Un
it Fo
ur
(Stack
4).
TE
CO
installs F
GD
(Scru
bb
er) for U
nit 4
.
TE
CO
Big
Ben
d U
nit F
ou
r (Stack
4) b
ecom
es o
peratio
nal as a co
al bu
rner.
TE
CO
Ac
tion
1970 1971 1976 1977 1986
TE
CO
issued
site license to
bu
ild B
ig B
end
Facility.
Big
Ben
d U
nit O
ne (S
tack 1
) beg
ins serv
ice.
Big
Ben
d U
nit T
hree (S
tack 3
) beg
ins serv
ice.
Figure 6. TECO Big Bend Timeline of Significant Events

66
EPA
laun
ches th
e To
xic R
elease Inv
ento
ry.
To
xic W
aste Co
ntro
l. Hazard
ou
s waste m
ust b
e treated
befo
re disp
osal.
Po
llutio
n P
reven
tion
Act is sig
ned
.
Co
ng
ress passes th
e Clean
Air A
ct amen
dm
ents, acid
rain
con
trols, an
d su
lfur d
iox
ide em
ission
from
po
wer
plan
ts.
Caro
l M. B
row
ner b
ecom
es EP
A A
dm
instrato
r un
der
Presid
ent C
linto
n.
EPA
Ru
les sulfu
r dio
xid
e acid rain
ing
redien
t. Will
beco
me a co
mm
od
ity fo
r sale. Em
ission
righ
ts cou
ld
be trad
ed.
EP
A P
asses the In
terim E
nh
anced
Su
rface Water
Treatm
ent R
ule
Presid
ent C
linto
n issu
es Ex
xecu
tive O
rder p
rioritizin
g
env
iron
men
tal justice fo
r min
orities in
low
inco
me
po
pu
lation
s.
EPA
has n
ew stan
dard
s for ch
emical p
lants, to
xic air
po
llutan
ts.
Bro
wn
fields P
rog
ram started
.
EPA
establish
es on
line p
resence.
Safe D
rink
ing
Water A
ct amen
dm
ents. A
ffirmed
cu
stom
ers righ
t to b
e info
rmed
by
ind
ustry
of
chem
icals in d
rink
ing
water.
NA
AQ
S stan
dard
s for o
zon
e, PM
.
EP
AiIssu
es mo
re string
ent N
AA
QS
stand
ards fo
r sm
og
and
soo
t.
EPA
issues N
otice o
f Vio
lation
to T
EC
O o
n b
ehalf o
f F
lorid
a DE
P.
FD
EP
files lawsu
it miro
rring
EPA
lawsu
it.
FD
EP
settles lawsu
it with
Co
nsen
t Fin
al Jud
gm
ent.
EPA
reaches S
ettlemen
t Ag
reemen
t.
Flo
rida P
ub
lic Serv
ice Co
mm
ission
closes d
ock
et w
itho
ut ad
dressin
g C
on
sent F
inal Ju
dg
men
t agreed
to.
EP
A A
dm
insitrato
r sign
s Glo
bal P
ersistent O
rgan
ic P
ollu
tants T
reaty.
Reg
ula
tory
Ag
ency
Actio
n
4/1
9/9
0
5/8
/90
11/5
/90
11/1
5/9
0
19
91
1/2
1/9
3
3/5
/93
6/3
0/9
3
2/1
6/9
4
3/1
/94
6/3
0/9
4
11/1
0/9
4
19
95
8/6
/96
8/8
/96
7/1
7/9
7
11/3
/19
99
12
/7/1
99
9
12
/16
/19
99
2/2
9/2
00
0
2/2
9/2
00
0
5/2
3/0
1
1991 1995 1997 2001
Mo
dificatio
ns to
Un
it 2 co
nd
ucted
with
ou
t perm
it.
TE
CO
Uses F
GD
(Scru
bb
er) from
Un
it 4 to
scrub
U
nit 3
simu
ltaneo
usly.
TE
CO
agrees to
up
date ex
isting
electrostatic
precip
itators.
TE
CO
Actio
n
Mo
dificatio
ns an
d p
ermit v
iolatio
n o
n U
nit 1
, and
ad
ditio
ns fo
r Un
it 2 w
itho
ut p
ermit.
TE
CO
installs F
GD
(Scru
bb
ers) for U
nits 1
& 2
. T
EC
O receiv
es No
tice of V
iolatio
n fro
m E
PA an
d
FD
EP. T
EC
O F
iles petitio
n fo
r FP
C to
app
rov
e plan
to
com
ply
with
Clean
Air A
ct and
imp
lemen
tation
of
Co
nsen
t Fin
al Jud
gm
ent w
ith F
DE
P o
nly.
TE
CO
sign
s settlemen
t agreem
ent (C
on
sent D
ecree). 6
/2 T
EC
O p
etition
s for co
st recov
ery, Un
its 1-3
FG
D
Plan
. 8/1
8 T
EC
O p
etition
s for ap
pro
val o
f cost
recov
ery fo
r redu
ction
pro
gram
s in P
M an
d N
Ox
E
missio
n, U
nits 1
-3. T
EC
O req
uired
to im
plem
ent $
5
millio
n in
EP
A ap
pro
ved
pro
jects dem
on
strating
em
ission
s redu
ction
of H
AP
s, $2
millio
n in
research
and
po
llutio
n m
easurem
ent in
the T
amp
a Bay
estuary.
1994 1996 1999 200019931990
Figure 6. (continued) TECO Big Bend Timeline of Significant Events

67
En
ergy
Act o
f 20
05
passed
by
con
gress. C
on
tains
"Hallib
urto
n L
oo
ph
ole" restrictin
g E
PA
, and
establish
ing
Pro
prietary
Ru
le.
EPA
streng
then
s NA
AQ
S S
tand
ards fo
r PM
.
EPA
Issues G
rou
nd
water R
ule.
EPA
establish
es social m
edia p
resence.
EPA
establish
es mew
natio
nal lead
stand
ards, T
enfo
ld
Decrease.
TV
A K
ing
ston
coal fly
ash slu
rry sp
ill. EPA
scrutin
izes all CF
PP
s.
EPA
regu
lates green
ho
use g
ases un
der th
e Clean
Air
Act.
EPA
Estab
lises stricter ozo
ne stan
dard
s.
Green
ho
use g
as repo
rting
beco
mes m
and
atory.
Cro
ss State A
ir Po
llutio
n ru
le establish
ed.
EPA
issues n
ation
al stand
ards fo
r mercu
ry em
ission
s
from
po
wer p
lants.
EPA
pro
po
ses first carbo
n p
ollu
tion
stand
ards fo
r new
po
wer p
lants.
EPA
up
dates stan
dard
s for o
il and
natu
ral gas H
AP
s.
EPA
establish
es mo
re string
ent N
AA
QS
stand
ards fo
r
PM
.
EPA
establish
es new
Clean
Air S
tand
ards fo
r bo
ilers.
Su
prem
e Co
urt ru
les that u
nd
er CA
A, E
PA
has
auth
ority
to reg
ulate C
FP
Ps acro
ss state lines.
EPA
establish
es first gu
idelin
es to cu
t carbo
n
po
llutio
n fro
m ex
isting p
ow
er plan
ts.
Cro
ss State A
ir Po
llutio
n R
ule rep
laces Clean
Air
Interstate R
ule (ak
a CA
TR
).
Reg
ula
tory
Ag
en
cy A
ction
20
02
20
04
7/2
9/0
5
9/2
1/0
6
10
/12
/06
7/2
6/0
7
10
/16
/08
12
/27
/08
12
/7/0
9
1/6
/10
11
/22
/10
7/7
/11
12
/21
/11
3/2
7/1
2
8/2
8/1
2
12
/14
/12
12
/20
/12
20
13
4/2
9/1
4
6/2
/14
1/1
/15
2002 2004 2005 2007 2009 2013 2015
TE
CO
ord
ered to
install $
3 m
illion
wo
rth o
f
com
bu
stion
con
trols to
limit N
O2
emissio
ns.
TE
CO
op
eration
alizes electrostatic p
recipitato
rs to
remo
ve P
M fro
m all u
nits.
TE
CO
pro
hib
ited fro
m b
urn
ing
coal in
any
gen
eration
system
shu
t do
wn
or co
nv
erted to
natu
ral gas. T
EC
O
requ
ired to
surren
der allo
cation
credits to
barter o
r sell
to o
ther u
tilities.
Natu
ral gas an
d fu
el oil fired
peak
ing
un
it installed
and
op
eration
alized.
EC
HO
repo
rts Un
specified
Fed
erally R
epo
rtable
Facility
CA
A V
iolatio
n in
4th
Qu
arter. Title V
Perm
it
Vio
lation
, 4th
Qu
arter. CW
A V
iolatio
n all fo
ur
qu
arters.
EC
HO
repo
rts Hig
h P
riority
CA
A V
iolatio
n fo
r To
tal
PM
, and
un
declared
vio
lation
of C
WA
.
TE
CO
Actio
n
TE
CO
requ
ired to
com
ply
with
all settlemen
t
con
ditio
ns b
y en
d o
f year. S
ettlemen
t pro
vid
es TE
CO
Big
Ben
d w
ith an
Op
t-Ou
t clause.
EC
HO
repo
rts 2 C
WA
"Sch
edu
le Ev
ent U
nach
ieved
and
no
t Rep
orted
: Ach
ieve F
inal C
om
plian
ce with
Em
ission
or D
ischarg
e Lim
ts", 2n
d th
rou
gh
4th
Qu
arters.
EC
HO
repo
rts CW
A v
iolatio
n all fo
ur q
uarters, w
ith
sign
ificant n
on
-com
plian
ce in 1
st Qu
arter.
EC
HO
repo
rts Hig
h P
riority
Vio
lation
of C
AA
for
To
tal PM
(2n
d th
rou
gh
4th
qu
arters), CW
A V
iolatio
n
(all fou
r qu
arters) with
sign
ificant n
on
-com
plian
ce in
2n
d Q
uarter. T
itle V P
ermit V
iolatio
n, 1
st Qu
arter.
2006 2008 2010 2011 2012 2014
Figure 6. (continued) TECO Big Bend Timeline of Significant Event

68
Protection Agency, Region 4. Shortly after FDEP filed its lawsuit, TECO and FDEP settled the
suit by entering a Consent Final Judgment (CFJ). The CFJ became effective on December 16,
1999. On December 23, 1999, TECO filed a petition for Commission approval of its plan to
comply with CAA (docket # 992014-EI). TECO’s proposed CAA compliance plan outlined the
implementation requirements and timetables of the CFJ. The EPA lawsuit remained unresolved
even though TECO and FDEP had reached settlement.
TECO continued independent negotiations with the EPA to resolve their concerns. On
February 29, 2000, TECO and EPA signed a settlement agreement (Consent Decree) that was
filed with the US Circuit Court in Tampa. After TECO signed the Consent Decree with the EPA
the Commission closed the docket without addressing TECO’s proposed plan to implement the
CFJ agreed to by the state DEP. On June 2, 2000, TECO petitioned for approval of cost
recovery of the Big Bend Units 1, 2, and 3 Flue Gas Desulfurization System Optimization
System and Utilization Program (FDG plan) through the Environmental Cost Recovery Clause.
The Commission found that the plan qualified for recovery through the Environmental Cost
Recovery Clause. On August 18, 2000, TECO petitioned for approval of cost recovery of two
programs, the PM program and the Reduction of Nitrogen Oxide Emissions Program at Big
Bend Units 1, 2, and 3. TECO states that both the PM and NOx program costs will be allocated
to rate classes on an energy basis because the programs are CAA compliance activities. Put
simply, the responsibility for all Settlement costs would shift to the TECO consumer base. The
Commission approved the plans to open a docket number to address the eligibility of TECO PM
and N0x program for recovery through the Environmental Cost Recovery Clause (FDEP Case
File, 10/2000).

69
The Clean Air Act (CAA), passed in 1970, saw Congress exempt existing facilities like
Big Bend from the new regulations whose permits passed in 1970 for construction. However, it
was clear that this grandfathering would not last forever and that older facilities would eventually
have to make modifications to meet CAA standards (see Alabama Power v Castle, 1979). In
cases of major modifications, the source must obtain a PSD permit or a nonattainment MSR
permit in order to achieve the lowest possible emission rate.
One of the issues with the Big Bend facility was its non-attainment status with the
NAAQS. A listing of the NAAQS standards, for the toxins of concern at Big Bend, appears in
Appendix A, Table A2. What is the difference between attainment and non-attainment? Florida
SIP 62-402.340 designates attainment, nonattainment and maintenance areas. Attainment areas
meet Ambient Air Quality Standards, while nonattainment areas do not. Some are, however,
also listed as “unclassifiable” areas by the State. Once classified, the EPA is the governing body
over a facility, and EPA can change the attainment status of an area. Hillsborough County is
currently unclassifiable for the pollutant, sulfur dioxide. Hillsborough and Pinellas counties are
under Air Quality Maintenance area classification for ozone air pollutants. For particulate
matter, the portion of Hillsborough County that falls within the area of the circle having a center-
point at the intersection of U.S. 41 South and State Road 60, and a radius of 7.46 miles, is
designated as an air quality maintenance area. As of January 1, 1996, the area within a radius of
3.12 miles centered at UTM coordinates 226.18 miles east, 1922.21 miles north; zone 17, in
Hillsborough County is designated as an air quality maintenance area for lead pollutants (ECHO,
2013).
Another issue in the suit against TECO involved modifications and construction of a
facility in attainment and non-attainment areas. The Florida SIP requires that no construction or

70
operation on a major modification project on a stationary source, such as a stack or scrubber, can
occur in an area designated as attainment or nonattainment without first obtaining a permit
(A40). The Florida SIP also stipulates the same for non-attainment areas. SIP requires obtaining
an air construction permit that meets all requirements of the rule 62-402.340. These rules are all
state and federally enforceable, pursuant to Sections 110 and 113 of the Clean Air Act.
The Big Bend plant was classified as follows with respect to attainment and non-
attainment: (1) in attainment for NO2 and SO2 from 1980 to the present; (2) non-attainment for
particulate matter from 1980 to April 2, 1990; (3) EPA, Region 4 area has been designated as
attainment since 1990; (4) for Ozone the area has been classified as non-attainment from 1980 to
February 5, 1996 and attainment thereafter.
Specific Legal Violations
The Notice of Violation was filed in 1997 and went to trial in 1999 in Civil Court. The
following sections detail the various legal violations at TECO’s Big Bend Facility as noted in the
following: United States Environmental Protection Agency, Region 4 v Tampa Electric
Company, (1997); Notice of Violation EPA – CAA – 2000 – 04 – 0007 (EPA, 2007).
Article 19. “On numerous occasions between 1979 and the date of this notice TECO has
made modifications at its Big Bend Station as defined by both 40 CFR Section 52.21 and Florida
SIP Rule 62-212.400, F.A.C. These modifications included, but are not limited to, the following
individual internals on Units 1 and 2 in 1994 and 1991 respectively; and high temperature re-
heater replacement and water wall addition for Unit 2 in 1994.” (EPA, 2007)
Article 20. “For each of the modifications that occurred at the Big Bend Station, TECO
did not obtain a PSD permit pursuant to 40 CFR Section 52.21 and Florida SIP Rule 62-212.400,
F.A.C.; a nonattainment NSR per pursuant to a 40 CFR Section 52.24 and Rule 62-212.400,

71
F.A.C.; or a minor NSR permit pursuant to Rule 62-212.300, F.A.C. In addition, for
modifications after 1992, no information was provided to the permitting agency of actual
emissions after the modification as required by 40 CFR Section 52.21(b)(21)(v) and Rule 62-
210.200(12)(d), F.A.C.” (EPA 2007)
Article 21. None of these modifications fall within the “routine maintenance, repair and
replacement” exemption found at 40 CFR Section 52.21 (b)(2)(iii)(a) and Florida SIP Rule 62-
210.200 (183)(a)1a, F.A.C. Each of these changes was an expensive capital expenditure
performed infrequently at the plant that constituted the replacement and/or redesign of a boiler
component with a long useful life. In each instance, the change was performed to increase
capacity, regain lost capacity, and/or extend the life of the unit. In many instances, the original
component was replaced with a component that was substantially redesigned in a manner that
increased emissions. That the “routine maintenance, repair and replacement” exemption does
not apply where construction activity is at issue was known to the utility industry since at least
1988 when EPA issued a widely publicized applicability determination regarding utility
modifications at a Wisconsin Electric Power Co. (“WEPCO”) facility. EPA’s interpretation of
this exemption was upheld by the court of appeals in 1990. Wisconsin Electric Power Co. v.
Reilly, 893 F.2d 901 (7th Cir. 1990).
Article 22. None of these modifications fall within the “increase in hours of operation or
in the production rate” exemption found at 40 CFR § 52.21(b)(2)(iii)(f), or Florida regulation 62-
210.200 (183)(a)2., F.A.C. This exemption is limited to stand-alone increases in operating hours
or production rates, not where such increases follow or are otherwise linked to construction
activity. That the hours of operation/rates of production exemption does not apply where
construction activity is at issue was known to the utility industry since at least 1988 when EPA

72
issued a widely publicized applicability determination regarding utility modifications at a
Wisconsin Electric Power Co. (“WEPCO”) facility. EPA’s interpretation of this exemption was
upheld twice by the court of appeals, in 1989 and in 1990, Puerto Rican Cement Co. v EPA, 889
F. 2D 292 (1st Cir. 1989) and Wisconsin Electric Power Co. v Reilly, 893 F. 2d 901 (7th Cir.
1990).
Article 23. None of these modifications fall within the “demand growth” exemption
found at 40 CFR Section 52.21 (b)(33)(ii) and Florida SIP Rule 62-210.200 (12) (d), F.A.C.,
because for each modification a physical change was performed which resulted in the emissions
increase.
Article 24. Each of these modifications resulted in a net significant increase in emissions
from Big Bend Station for NOx, SO2 and/or PM as defined by 40 CFR Sections 52.21 (b)(3) and
(23) and Florida SIP Rule 62-212.400 (2)(e) 2, F.A.C.
Article 25. “Therefore, TECO violated and continues to violate 40 CFR Section 52.21
and Florida SIP Rule 62-212.400, F.A.C., for the prevention of significant deterioration; 40 CFR
Section 52.24 and Rule 62-212.500, F.A.C., for preconstruction review for non-attainment areas;
and /or Rule 62-212.300, F.A.C., by constructing and operating modifications at the Big Bend
Station without the necessary permit required by the Florida SIP.”
Article 26. Each of these violations exists from the date of start of construction of the
modification until the time that TECO obtains the appropriate NSR permit and operates the
necessary pollution control equipment to satisfy the Florida SIP.
The Enforcement Section of the Lawsuit relays that the EPA will fine TECO $25,000 per
day for each violation on or before January 30, 1997 and $27,500 for each violation after January

73
30, 1997. Respondents can confer with the EPA concerning these charges in an effort to reach
an informal settlement of the charges (USEPA, 2007).
Limitations of the Lawsuits
It is interesting to note that no actions by TECO at Big Bend prior to 1997 are addressed
in this NOV, despite the fact that the power plant had been operational since 1971. Potential
penalties are suggested, but no clear indication of CAA violations are mentioned, and there are
no indications of violations to the CAA or the National Drinking Water Standards. Coal ash
from unlined ponds has been contaminating waterways and aquifers surrounding the facility
which could impact the drinking water supply (Clean Water Coalition, 2011). This is not
mentioned in the lawsuit or addressed in any subsequent motions, even though CWA regulations
were enacted in 1972 and the Safe Drinking Water Act provided for regulations in 1974.
Environmental groups monitoring the Big Bend facility estimate that in 1997, when the lawsuit
was brought forward, the Big Bend Plant was one of the leading polluters in the state of Florida,
emitting in excess of 31,764 tons of nitrogen oxide, and 84,491 excess tons of sulfur dioxide,
both air and water soluble (EH&E, 2011).
Big Bend benefited for years under a loophole in the 1970 CAA and its 1977
Amendments. It allowed existing plants and those under construction to be exempt from
pollution standards for new sources. Utility companies convinced Congress that existing power
plants, with an expected life of 25-30 years would soon retire and it would be a waste to retrofit
them with pollution control equipment. Although the 1990 CAA Amendments required
reductions of SO2 and NOx, older plants like Big Bend still polluted at four to ten times that of
new plants (CATF, 2007). In 1997, just prior to the lawsuit, Big Bend was still exempt from

74
basic clean air standards, while it continued to be ranked among the dirtiest 100 CFPPs in the
nation (Florida Clean Power Coalition, 1997).
Settlement of the Lawsuits
Two months later, in February 2000, the EPA announced a landmark CAA case
settlement against Tampa Electric Company in President Clinton’s National Enforcement
Initiative. Administrator Carol M. Browner represented the government in the Clinton-Gore
administration’s efforts to provide the people of Florida with cleaner, healthier air. No court
action was taken, and a settlement with TECO was reached. The settlement required TECO to:
(1) pay a $3.5 million dollar civil penalty; (2) install permanent emission-control equipment; (3)
implement a series of interim pollution reduction measures to reduce emissions while the
permanent controls were designed and installed; and (4) retire pollution emission allowances that
TECO or others could use or sell to others to emit additional pollutants into the environment.
The settlement requires TECO to spend $10-11 million dollars on environmentally beneficial
projects in the region to mitigate the impact of emissions from the company’s plants.
An interesting caveat to the settlement is that requirements are conditional on whether or
not Florida law allows the company to pass on the cost of compliance in the settlement to its
customer base. Currently, TECO charges three fees to its utility customers. Basic charges are
calculated based on kilowatt hours used, the cost of maintaining equipment such as meters and
electrical wiring, meter reading, and maintaining customer records. Basic charges are incurred
even if no electricity is used in a given month. An Energy Charge includes all other costs of
producing electricity, except fuel. Here is the caveat: it includes conservation, environmental and
capacity cost recovery charges. That cost is 5.4 cents per kilowatt-hour up to 1,000, and 6.6
cents for anything after 1000 kilowatt-hours.

75
As with most corporate penalties, TECO has been able to pass their settlement penalties
along to their customers. The lawsuit and subsequent settlement assert that this power plant had
illegally released massive amounts of air pollutants contributing to some of the most severe
environmental problems in the ecosystem. Yet, legally, through the ECRC, TECO could recover
those costs from its customers.
As noted, under the Department of Justice agreement, TECO was required to pay all
penalties, install first class pollution control equipment, and develop interim pollution control
measures, while final permanent controls are selected, designed and installed. Furthermore,
improved scrubbers to trap more sulfur dioxide were stipulated. In 2001 the company has
mandatory updates to the optimization, operation, and maintenance of existing electrostatic
precipitators, which will keep more particulate matter from reaching the atmosphere. Starting in
2002, TECO was to install $3 million dollars worth of combustion controls to reduce NO2
emissions. TECO was to continue stringent emission limits for key pollutants NOx, SO2 and PM
during the decree and after. Starting in 2005, TECO was not to burn coal at any Big Bend
electric generation system that TECO either shuts down or changes over to natural gas.
These settlement conditions were phased in over a ten-year period, to end in 2010. The
settlement provides an opt-out clause for Big Bend. They can choose to shut down the power
plants if their obligations cannot be met, or if business conditions call for restoring electric
generating capacity that cannot meet the requirements of the law.
TECO’s Compliance to the Settlement: What Have They Done?
As of December 2, 2014, TECO’s Big Bend Plant has significant violations of the CAA.
When inspected in December of 2012, the plant was cited for three consecutive quarters in
noncompliance and one quarter was in significant violation. TECO has had one informal

76
enforcement action within the last 5 years. Penalties assessed on these infractions amount to $0.
The 2011 on-site inspection found current significant violation of the Harmful Particle Emission
standards through the first quarter of 2015. There have been no penalties assessed in the twelve
consecutive quarters of noncompliance and for four significant violations. The EPA website lists
TECO’s current significant violation as “Violation Unaddressed.” The FDEP has issued
multiple Notices of Violation that have not been addressed or resolved. Significant air pollutants
are ozone, lead and particulate matter.
TECO was not cited for violation of the CWA for many years. In the past five years
TECO has had the following CWA violations and actions: one informal enforcement action,
three formal enforcement actions and one case (referred) to the EPA for settlement. Penalties
assessed on these infractions total $0. This lack of the legal enforcements by EPA and FDEP
with regard to significant violations in toxic emissions and permitting violations indicates that
TECO does not fear the regulatory deterrents currently available to the state and federal
government. The precedent being set with this lack of regulatory oversight is one in which
TECO will continue to be out of compliance with the law and have no fear of reprisal from
government agencies. With respect to water violations and pollution, TECO’s Big Bend plant
has had significant violations since 2011 for excessive nitrogen levels in the water up to 114%
over legal limits. Since July 1, 2011, TECO has been in violation of CWA with permits and
resolutions pending. Table 11 is an EPA Civil Enforcement Case Report on the TECO facility
addressing one of the many CWA infractions. It is interesting to note that EPA lists the CWA
infractions, its non-voluntarily disclosure, and the penalties assessed to date at $0, with TECO
paying $100 for the cost of the EPA filing the Action with the Court (ECHO, 2014). This is
another example of a deterrent relegated to an ineffective measure for law enforcement agencies

77
that protect the communities surrounding the plant and for TECOs continued green victimization
of those communities.
Table 11. Clean Water Act Case Report
http://echo.epa.gov/enforcement-case-report?id=04-2014-4755
Settlement Entered Date: 6/2/14 Cost Recovery: $0
Facilities in Settlement (FRS ID): 110008319505 SEP Cost: --
Settlement Lodged Date: -- Compliance Action Cost: $100
Case Summary
6/2/14 - ADMINISTRATIVE ORDER ISSUED. THE ANNUAL DMR-QA STUDY FOR 2014 IS KNOWN AS STUDY 34. ON FEB 12, 2014, RESPONDENT RECEIVED A CERTIFIED LETTER FROM EPA ISSUED PURSUANT
TO CWA SEC 308 ALONG WITH FORMS AND INSTRUCTIONS ON HOW TO FILL OUT THE DMR-QA FOR STUDY 34. THE SECTION 308 LETTER REQUIRED THAT RESPONDENT SUBMIT TO EPA THE RESULTS OF
CERTAIN TEST INFO, INCLUDING THE NAME AND ADDRESS OF THE LAB PERFORMING THE ANALYSIS FOR RESPONDENT AND THE IDENTITY OF THE ANALYTES SPECIFIED IN THEIR NPDES PERMIT. THE
DEADLINE FOR RESPONDENT TO SUBMIT ITS DMR-QA STUDY 34 TO EPA REGION 4 WAS MARCH 21, 2014. ON MARCH 13, 2014, EPA, BY MEMORANDUM SENT TO THE DMR-QA REGIONAL AND STATE
COORDINATORS EXTENDED THE DEADLINE TO RESPOND TO THE SECTION 308 LETTER TO APR 4, 2014. BASED ON RECORDS MAINTAINED BY EPA, RESPONDENT HAS FAILED TO SUBMIT THE REQUIRED
INFO IN THE TIMEFRAME REQUIRED BY EPA'S SECTION 308 LETTER. THEREFORE, EPA HAS DETERMINED THAT RESPONDENT IS IN VIOLATION OF SECTION 308(a) OF THE CWA. ORDER REQUIRES:
RESPONDENT SHALL HAVE 45 DAYS AFTER THE EFFECTIVE DATE TO CONDUCT THE DMR-QA STUDY AND/OR SUBMIT THE REPORT TO EPA.
Enforcement Conclusion Settlement Enforcement Conclusion Dollar Amounts
$0
$100
$0
Penalties - Case Level
Total Cost Recovery:
Enforcement Conclusion Type: Administrative Compliance Orders Federal Penalty Assessed or Agreed To: $0
Enforcement Conclusion Name:TAMPA, FLORIDA, CITY OF / BIG
BEND STATIONState/Local Penalty Assessed: --
Final Order Issued
EPA
CWA-04-2014-4755
Enforcement Type:
Branch:
Violations:
--
Unilateral Administrative Order
Without Adjudication
--
--
No
--
CWA 309A AO For Compliance
Violations Of Reporting Requirements
DOJ Docket Number:
Total Federal Penalty Assessed or
Agreed To:
Total State/Local Penalty Assessed:
Total SEP Cost:
Total Compliance Action Cost:
$0
$0
--
Result of Voluntary Disclosure?
Multi-media Case?
TAMPA, FLORIDA, CITY OF / BIG
BEND STATION
EPA Civil Enforcement Case Report, TECO Big Bend Power Plant
Basic Information
Relief Sought:
Enforcement Outcome:
Headquarters Division:
Court Docket Number:
Case Number:
Case Name:
Case Category:
Case Status (as of 06/02/2014):
Case Lead:
04-2014-4755
Administrative - Formal
In the Plant’s twelfth quarter of noncompliance, they reverted back to a “Significant
Violation” level in nitrogen emission totals. The EPA lists these as significant non-compliance

78
violations, Category 1. To date penalties assessed by the EPA to TECO are $0. On June 2,
2014, the state DEP filed a lawsuit with the EPA for CWA violations unaddressed by TECO, and
the website indicates that the case was settled the same day. No penalties were incurred for the
suit filed in June 2014. These violations are significant to the extent that they impact Tampa
Bay’s watershed. Tampa Bay is the watershed under this facility, along with Hillsborough Bay,
and the Alafia River as receiving waterways. In 2013, TECO reported that its Big Bend facility
released 81,818 pounds of toxic chemicals at the site as surface water discharges and total Toxic
Air Emissions totaling 329,492 pounds (ECHO, 2013). These examples confirm TECOs
continued assurance that no deterrent measures will be fully executed and they can continue to
pollute without serious legal ramifications.
Figure 7, TECO Big Ben Site Layout, highlights an aerial view of the layout of the Big
Bend facility with all of the intake and outlets sites as well all of the storage and disposal areas
for HAPs, including coal fly ash.
Assessments from Environmental Groups
Big Bend is cited in several conservation reports for non-compliance with settlement
conditions. EarthJustice (2012) listed TECO’s Big Bend Facility as having 11 Coal Ash ponds
(10 unlined) and 1 slag landfill located in Hillsborough County. They further list the amount of
coal ash generated per year in Florida at 6.1 million tons, 7th in the U.S. for coal ash generation.
According to the EPA database, the ponds at Big Bend cover a total of 50 acres of surface area,
flanked by Tampa Bay, Hillsborough Bay, and the Alafia River. EarthJustice (2012) further
reports that TECO’s Big Bend Station’s off-site groundwater pollutants exceed federal drinking
water standards and Florida cleanup target levels for thallium, sulfate, chloride and manganese.
Arsenic in on-site groundwater was measured at 11 times the drinking water standard, and many

79
other pollutants were also measured at levels far above Florida groundwater cleanup target levels
at on-site locations. Thallium was measured in off-site groundwater at more than twice the
federal standard, and at groundwater monitoring locations closer to coal ash disposal areas, at 8
times the federal standard (ECHO, 2015; EarthJustice, 2012; Environmental Integrity Project,
2011).
The Clean Water Action Coalition of Florida has also performed a Waste Profile of the
Big Bend Station focusing on its coal ash production. Total ash generated by the facility in 2010
was 1.05 billion pounds. In 2011, 9.79 billion pounds – an 830% increase in one year. Very
little of this ash is stored offsite or sold. In 2011, almost 9 billion of the 9.79 billion pounds was
stored on site at the Big Bend facility. In 2011, 83,575 pounds of HAPs in the air and water that
were produced at Big Bend were disclosed to regulatory agencies, with accompanying warnings
about the ingestion of the dust produced as a byproduct of CFA.
Off site, Big Bend uses Plant Polk which has one disposal pond without any protective
measures to prevent toxic contamination and one landfill with minimally acceptable
environmental protections (EarthJustice, 2012). Even with these disclosures, the plant contends
that is in full compliance with all EPA safety standards, according to the company website and
recent report to Shareholders (TECO, 2014).
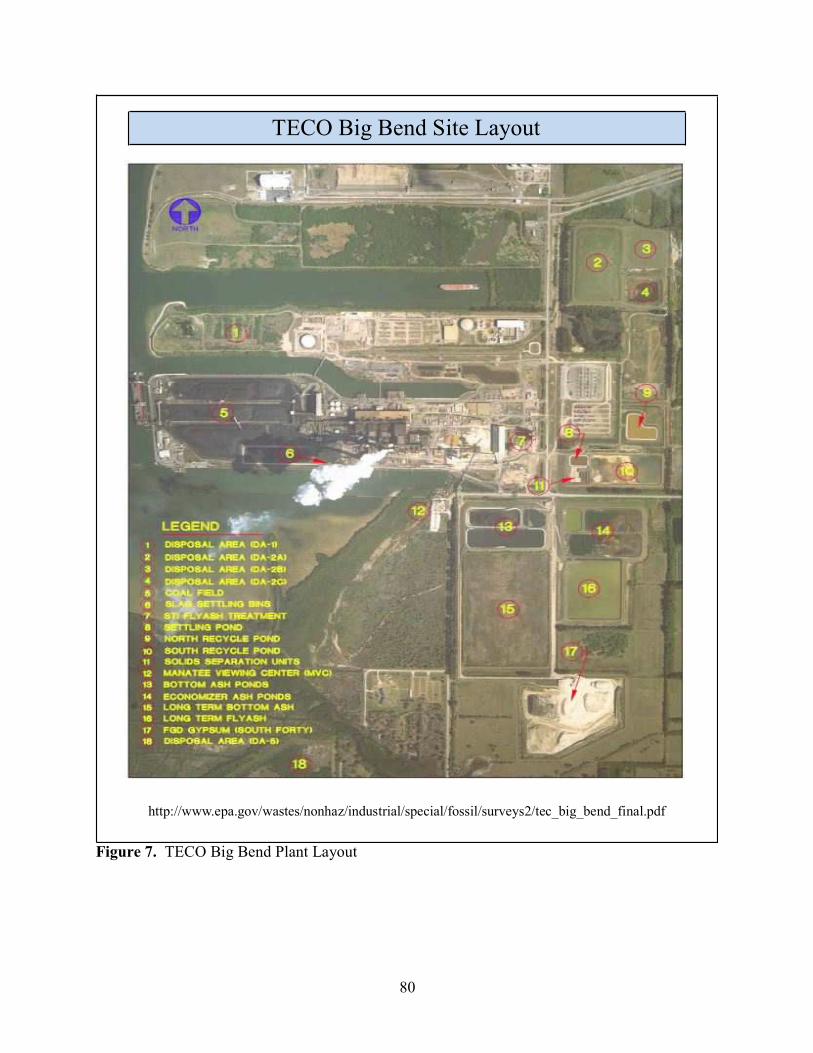
80
TECO Big Bend Site Layout
http://www.epa.gov/wastes/nonhaz/industrial/special/fossil/surveys2/tec_big_bend_final.pdf
Figure 7. TECO Big Bend Plant Layout

81
CHAPTER FIVE:
METHODS
This chapter presents a case study analysis of legal violation, environmental justice, and
health effects associated with TECO’s Big Bend facility. The broader research questions related
to environmental justice addressed whether communities surrounding this CFPP are adversely
impacted, and whether this situation can be defined as an instance of environmental
injustice/racism.
Research Philosophy
The case study represents a unique presentation of data for analysis and discussion. The
case study is a qualitative methodology that can be approached in a variety of ways based on the
research questions. The two approaches to case study methodology that have been emulated
here are those of Stake (1995) and Yin (2003, 2009). Both of these methods cover the topic of
the case study, but focus on a different set of questions than those in this thesis. Stake (1995)
employed interviews or focus groups, but selected specific boundaries for the research in both
the time, and the type of action(s) applicable to the case study.
Case studies have boundaries in time and the actions being researched. In this case, the
boundary is set in time with TECO’s Big Bend facility from 1970 to the present, and their
actions since their operationalization. These are research areas where data collection was
compiled over a specific period of time and from a variety of sources for comparative analysis.

82
Yin’s (2003, 2009) methodology uses the same premise and lists five basic elements for
an effective case study; 1) Research question(s); 2) Purpose of the study; 3) Unit(s) of analysis;
4) Suppositions based on the logical analyses that link the data collected to the purpose of the
study; 5) Specific criteria for the interpretation of the data (Yin, 2003, 2009). The research
questions, purpose of study and unit of analysis for this study were reviewed above. Issues
related to the data selected for analysis are examined below.
The case study unit of analysis is a CFPP. At issue is whether the pollutants emitted by
the Big Bed facility have adverse, unequally distributed potential health impacts. The unit of
analysis was limited to a 5 mile radius around the Big Bend facility. It has been established that
the 1, 3, and 5 mile radius from the CFPP create the most hazardous conditions for human health
and the environment through the emission of toxic HAPs (EH&E, 2011).
The final aspect of case study research is the basic criteria necessary to make fair and
impartial observations that will reflect an unbiased interpretation of the data collected
(Yin, 2003, 2009). The data collected for this case study was used for comparative analysis, and
came from a variety of sources. These include federal and state level government data, research
documents from non-governmental organizations (such as the ALA), not-for-profit organizations
(such as the NAACP), Tampa Electric Company, and companies designated by TECO to collect
data and compile research on their behalf.
This is a descriptive case study that attempts to describe an event and the real-life context
in which it occurred (Baxter and Jack, 2008; Yin, 2003). Many medical case studies have used
this type of methodology effectively (Baxter and Jack, 2008). The medical effects described in
Chapters two and three give ample reason to use this comparative qualitative typology. Not only
is it widely used in medical and psychological case studies, it provides the author an opportunity

83
to research the entire background of CFPPs for descriptive purposes. The data collection was
significantly expanded to include various types of hazardous air and water pollutants resulting
from plant operations that contribute to both human and environmental hazards.
Research Site and Demographics
Tampa Electric’s Big Bend CFPP is located on Wyandette Road, Apollo Beach, Florida,
EPA Region 4. TECO employs 3,799 in their workforce, and occupies close to 1,500 acres of
land in south Hillsborough County, Florida. Fifty acres of that land has been designated for
storage, disposal, and transport of hazardous waste.
Demographic data included public information on residents living near the TECO
facility, and could be used to address environmental justice/racism issues. Demographic and
environmental data used in this case study included: total persons within the area; land area;
water area; population density (in square miles); percent minority; persons below the poverty
level (poor share); households on pubic assistance; households in area, housing units in the area;
racial composition; age compositions; education level (persons 25 and older), and income
breakdown by household (ECHO, 2015). These data were collected for 1,3, and 5 miles from
Big Bend. Five miles from the point source is the scale used by government reporting agencies
to gather data for research and analysis on a wide variety of concerns, including pollutant levels.
It is the standard by which other nongovernmental organizations measure and replicate the data
collected by the government. Demographic data on the percentage minority and percentage of
those below the poverty level were obtained from PERI sources (PERI, 2013). Other
information from this site includes toxic air releases (in pounds) and a “toxic score.” The toxic
score is calculated by quantity of pollutants, multiplied by the exposure of pollutants, multiplied

84
by the population density of the area affected. PERI also lists the company’s TRI ratings on each
pollutant that is reported to the government.
Data Collection Methods
This study used secondary data from existing source materials and did not require
Internal Review Board approval, as the data is public and no individual identifiers are included.
There were no direct contacts with any individuals in the documents, nor any interviews
conducted for this case study. A request for secondary data from FDEP is included as
Appendix A.
Data collection and comparative analysis were the primary method applied to the study.
Document review from a variety of sources was used to examine the data and prevent bias in the
analysis and presentation of results. Many sources, including previous studies, newspaper
articles, documentary films, court documents, reports by government agencies, private
individuals, corporate documents, private organizations, not-for-profit agencies, and educational
reference materials were analyzed. Table 12, titled “Document Inventory,” lists the source of the
data, the method by which it was obtained, and most importantly why it was selected and
incorporated into the array of data for analysis (Dodge, 2011; Gordin, 2006).
Data Analysis Process
In the social sciences, the qualitative nature of the case study method lends itself to a
more interpretive analytical procedure. It is a creative, continuous process that begins with the
collection of the data and should remain uninterrupted through to analysis and the presentation of
results. The concept of using steps in the qualitative data analysis process provides the
researcher with the necessary transparency and validity; the data can be replicated for analysis,

85
Table 12. Document Inventory
Document
Resource Document Title
Distribution
Media Source Rationale for Inclusion
American Lung Association
Toxic Air: The Case for Cleaning Up CFPPs, 3/2011
Internet http://www.lung.org/assets/documents/healthy-air/toxic-air-report.pdf
Human and environmental hazards of HAPs
Center for Investigative Reporting
Dirty Business, 2009 Internet
http://www.cultureunplugged.com/play/6861/Dirty-Business--Clean-Coal-and-the-Battle-for-Our-Energy-Future
Information on coal industry from mining to CFPP polluting
Clean Air Task Force
The Toll From Coal, 9/2010 Internet http://www.catf.us/resources/publications/files/The_Toll_from_Coal.pdf \
Morbidity rates from CFPPs
Clean Water Action Florida
Big Bend Power Station : A Waste Profile of Coal Ash, 2012
Internet
http://cleanwater.org/files/[email protected]/Big%20Bend%20Coal%20Ash%20Waste%20Profile%20Clean%20Water%20Action%202012.pdf
Toxic water pollutants emitted from Big Bend
Dewberry & Davis, LLC
Coal Combustion Residue Impoundment Round 9 – Dam Assessment Report
Internet
http://www.epa.gov/wastes/nonhaz/industrial/special/fossil/surveys2/tec_big_bend_final.pdf http://www.epa.gov/osw/nonhaz/industrial/special/fossil/surveys2/tec_big_bend_comments.pdf http://www.epa.gov/osw/nonhaz/industrial/special/fossil/surveys2/tec_big_bend_draft.pdf
Third Party Engineering Study Final, Commentary, and Draft
DOJ Settlement Agreement Internet http://www.justice.gov/archive/opa/pr/2000/February/085enrd.htm
Conditions of settlement agreement USEPA
Earthjustice Florida and Coal Ash: Disposal, Contamination, and Inadequate Regulation, 2012
Internet http://earthjustice.org/sites/default/files/files/Florida-Ash-Fact-Sheet-2014-12.pdf
TECO Big Bend coal ash ponds and landfill
Earthjustice, Clean Air Task Force
Comments on the US EPA’s CCW Damage Case Assessment, 2/11/2008
Internet
http://www.catf.us/resources/filings/power_plant_waste/NODA082907_Appendix_C_EPA_s_Damage_Case_Assessment_Contamination_Ignored.pdf
Environmental watchdog group response to EPA regarding TECO non-compliance at Big Bend
EH&E, Inc. Emissions of Hazardous Air Pollutants from CFPPs, 3/2011
Internet http://www.lung.org/assets/documents/healthy-air/coal-fired-plant-hazards.pdf
CFPP emissions, HAPs, health and environmental impacts
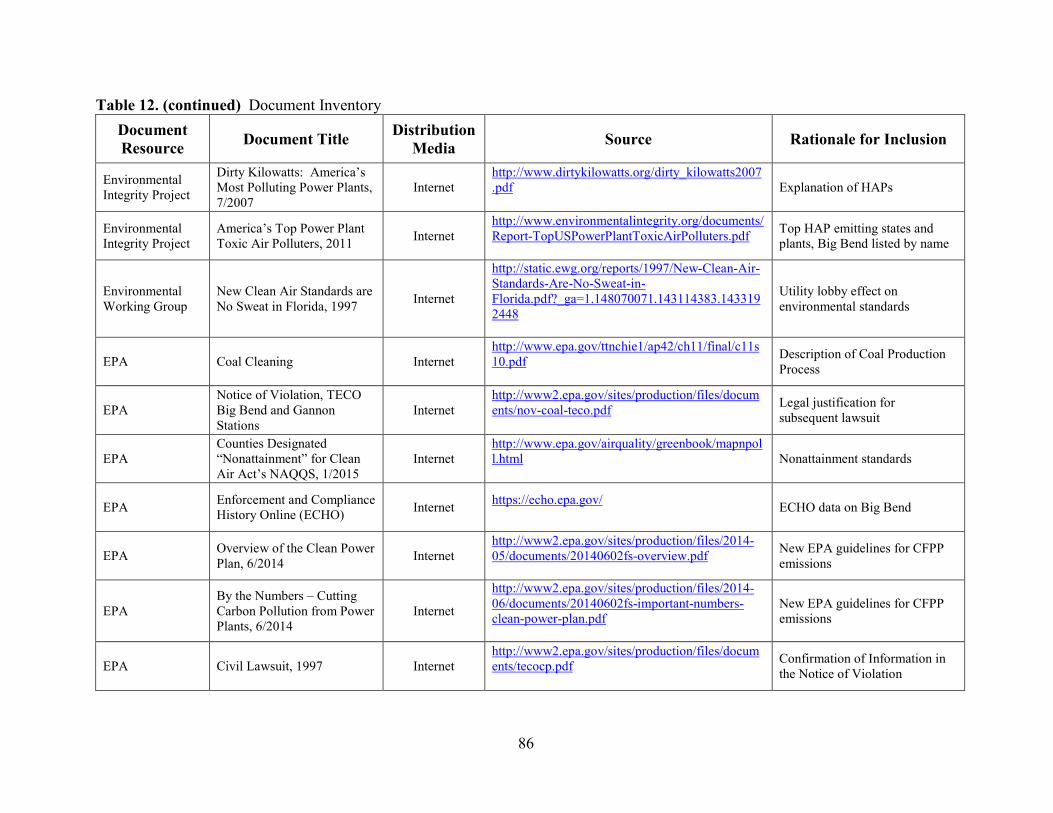
86
Table 12. (continued) Document Inventory
Document
Resource Document Title
Distribution
Media Source Rationale for Inclusion
Environmental Integrity Project
Dirty Kilowatts: America’s Most Polluting Power Plants, 7/2007
Internet http://www.dirtykilowatts.org/dirty_kilowatts2007.pdf
Explanation of HAPs
Environmental Integrity Project
America’s Top Power Plant Toxic Air Polluters, 2011
Internet http://www.environmentalintegrity.org/documents/Report-TopUSPowerPlantToxicAirPolluters.pdf
Top HAP emitting states and plants, Big Bend listed by name
Environmental Working Group
New Clean Air Standards are No Sweat in Florida, 1997
Internet
http://static.ewg.org/reports/1997/New-Clean-Air-Standards-Are-No-Sweat-in-Florida.pdf?_ga=1.148070071.143114383.1433192448
Utility lobby effect on environmental standards
EPA Coal Cleaning Internet http://www.epa.gov/ttnchie1/ap42/ch11/final/c11s10.pdf
Description of Coal Production Process
EPA Notice of Violation, TECO Big Bend and Gannon Stations
Internet http://www2.epa.gov/sites/production/files/documents/nov-coal-teco.pdf
Legal justification for subsequent lawsuit
EPA Counties Designated “Nonattainment” for Clean Air Act’s NAQQS, 1/2015
Internet http://www.epa.gov/airquality/greenbook/mapnpoll.html
Nonattainment standards
EPA Enforcement and Compliance History Online (ECHO)
Internet https://echo.epa.gov/
ECHO data on Big Bend
EPA Overview of the Clean Power Plan, 6/2014
Internet http://www2.epa.gov/sites/production/files/2014-05/documents/20140602fs-overview.pdf
New EPA guidelines for CFPP emissions
EPA By the Numbers – Cutting Carbon Pollution from Power Plants, 6/2014
Internet
http://www2.epa.gov/sites/production/files/2014-06/documents/20140602fs-important-numbers-clean-power-plan.pdf
New EPA guidelines for CFPP emissions
EPA Civil Lawsuit, 1997 Internet http://www2.epa.gov/sites/production/files/documents/tecocp.pdf
Confirmation of Information in the Notice of Violation

87
Table 12. (continued) Document Inventory
Document
Resource Document Title
Distribution
Media Source Rationale for Inclusion
FDEP Mercury TMDL for the State of Florida
Internet http://www.dep.state.fl.us/water/tmdl/docs/tmdls/mercury/Mercury-TMDL.pdf
CWA, FDEP Air Regulation for CFPPs
FDEP Final Orders Modifying Conditions of Certification
Internet http://publicfiles.dep.state.fl.us/Siting/Outgoing/Web/Big_Bend/Modifications/
FDEP Legalizing Changes to Site Certification
FDEP Big Bend Power Station State Facility Documents
Internet http://dep.state.fl.us/siting/certified_facilities_map/power_plants/SWD/big_bend.htm
Response from FDEP to request for Big Bend Unit 4 Natural Gas Conversion
FDEP Conditions of Certification, TECO Big Bend Unit 4, 2013
Internet http://publicfiles.dep.state.fl.us/Siting/Outgoing/Web/Certification/pa79_12_2013_R.pdf
Design and performance criteria
Florida Clean Power Coalition
Florida’s Dirty Dinosaurs, 1997
Internet http://www.fcan.org/Clean_Air/dirty_dinosaurs.htm
HAP emissions timeline
Florida Public Service Commission
Review of Coal Combustion Residual Storage and Disposal Processes of the Florida Electric Industry, 12/2011
Internet http://www.psc.state.fl.us/publications/pdf/electricgas/ReviewCoal_2011.pdf
Coal CCR sales/storage/disposal for TECO Big Bend
HBO Documentary
Gasland, Fox, 2010 Internet https://www.youtube.com/watch?v=6mp4ELXKv-w
Oil and gas industry background, trade secret and proprietary information within 2005 Energy Act
IECG Coal Fired Power Generation Internet http://www.rst2.edu/ties/acidrain/IEcoal/how.htm
History of CFP generation
Independent Science News
How EPA Faked the Entire Science of Sewage Sludge Safety: A Whistleblower’s Story, 6/2014
Internet
http://www.independentsciencenews.org/health/how-epa-faked-the-entire-science-of-sewage-sludge-safety-a-whistleblowers-story/
Exposure of coal slurry hazards from within EPA

88
Table 12. (continued) Document Inventory
Document
Resource Document Title
Distribution
Media Source Rationale for Inclusion
NAACP, IEN, LVEJO
Coal Blooded: Putting Profits Before People
Internet http://www.naacp.org/page/-/Climate/CoalBlooded.pdf
Environmental Justice
National Institute on Money in State Politics
Powering The Sunshine State, Barber, 4/2009
Internet http://classic.followthemoney.org/press/Reports/FloridaClimate.pdf
State utility lobby influences on environmental legislation of CFPPs
OpenSecrets Influence and Lobbying, Electric Utilities, 2013-2014
Internet http://www.opensecrets.org/industries/indus.php?Ind=E08
Impact of electric utility lobby on federal lawmakers
PERI Toxic 100 Index, 2013 Internet
http://grconnect.com/tox100/2013/index.php?search=yes&database=t1&detail=1&datype=T&reptype=a&company2=&company1=&parent=TECO&chemfac=fac&advbasic=bas
TRI data on Big Bend with environmental justice data
PERI Toxic Flood, 5/2013 Internet
http://documents.foodandwaterwatch.org/doc/Toxic_Flood.pdf#_ga=1.40061220.708338430.1433188654
Hazardous water pollutants, industrial water polluters
Powermag Big Bend’s Multi-Unit SCR Retrofit
Internet http://www.powermag.com/big-bends-multi-unit-scr-retrofit/
Power industry trade publication on TECO Big Bend
Right To Know Network
Toxic Release Inventory, 2013
Internet
http://www.rtknet.org/db/tri/tri.php?dbtype=C&combined_name=Tampa+Electric+Co+Big+Bend+Power+Station&rsei=y&sortp=D&reporting_year=2013&datype=T&reptype=f&detail=3&submit=GO
Big Bend facility detailed TRI report
Rolling Stone Magazine
The Dark Lord of Coal Country, Goodell, 2010
Internet http://www.rollingstone.com/politics/news/the-dark-lord-of-coal-country-20101129
Background on coal mining industry
Sourcewatch Big Bend Station,2/2011 Internet http://www.sourcewatch.org/index.php/Big_Bend_Station
Death and disease attributable to fine PM from Big Bend

89
Table 12. (continued) Document Inventory
Document
Resource Document Title
Distribution
Media Source Rationale for Inclusion
State of Florida Public Service Commission
Memorandum RE: Cost Recovery Clause, 10/2000
Internet http://www.floridapsc.com/library/filings/00/12649-00/12649-00.pdf#search=001186
TECO request to pass on cost of settlement to consumer base
Tampa Bay Online
150 Protesters, Law Enforcement Face Off at Big Bend Plant
Internet http://tbo.com/ap/politics/-protesters-law-enforcement-face-off-at-big-bend-plant-478783
Environmental protest against CFPPs
Tampa Bay Times
Dirty Air: Florida Ranks Third Worst for Power Plant Generated Toxic Air, Klas 7/20/2011
Internet
http://www.tampabay.com/blogs/the-buzz-florida-politics/content/dirty-air-florida-ranks-third-worst-power-plant-generated-toxic-air
Florida CFPP general information, Big Bend listed by name
Tampa Bay Times Under Scott, DEP Undergoes Drastic Change, 10/18/2014
Internet
http://www.tampabay.com/news/environment/under-scott-department-of-environmental-protection-undergoes-drastic-change/2202776
Changes in FDEP permitting
TECO 2014 Corporate Sustainability Report
Internet http://www.tecoenergy.com/files/executivesummary.pdf
TECO Corporate Viewpoint
TECO Site Certification Application, Big Bend Station Unit 4, 1980
Internet http://publicfiles.dep.state.fl.us/Siting/Outgoing/Web/Big_Bend/SCA/TECO_BB_SCA.pdf
Demographic Data, Sequence of Operation
TECO Big Bend Power Station Home Page
Internet http://www.tampaelectric.com/company/ourpowersystem/powerstations/bigbend/
General information on TECO Big Bend
WUSF News Study: Florida Third-Worst for Power Plant Pollution, Ramos, 9/2013
Internet http://wusfnews.wusf.usf.edu/post/study-florida-third-worst-power-plant-pollution
Information on CFPPs in Florida, Big Bend mentioned by name
90
further application, and defense of the results. The six steps can be reproduced in a linear
fashion (Dodge, 2011), but do not necessarily have to be followed in a linear manner. This is a
creative element for the researcher and a process can be followed without strict adherence to
linear movement. In descriptive case studies, where data is continuously added and/or amended
as the availability of new information is accessed, the steps in the process of dissemination
fluctuate constantly. The six steps (Cresswell, 2005) are as follows: (1) Organization and
preparation of the data for analysis. (2) Read through the collection of data thoroughly.
(3) Begin a detailed analysis with coding of data, if necessary. Although coding was not
necessary for this comparative analysis; separation of different categories of data that were
applicable for the study were applied. (4) Descriptions and categories are generated for analysis.
For this case study, categories were generated including Environmental Justice, TECO legal
materials, and Health effects while compiling the data and updated as new information was
obtained. (5) Demonstrate how the categories will be presented in the qualitative, descriptive
analysis. For this step, the categories of data were collected, compared, and data tables created
for the reader to easily interpret a discussion of the results. Chapter six presents several tables
that show this comparative analysis using the combination of the collective data, particularly
demographic data and information on particular hazardous pollutants of concern at the Big Bend
facility. (6) Interpret the meaning of the data. Through the categorization of the data, and
analysis of the wide variety of source materials, the author was able to present results.
Generalizations on the causal inferences could then be initiated regarding the primary research
questions presented at the conclusion of Chapter one.

91
Ethics
The research did not harm the subject of the case study, and all materials were collected
through public domain sites. Data acquired for this study were of a secondary analytic nature
therefore the confidentiality and privacy of subjects was not in question. As no human subjects
were used in the study, no interviews or focus groups were conducted, and the researcher did no
formal field observations at the Big Bend facility, Institutional Review Board (IRB) approval
was not required.
Limitations
Limitations of the case study are inherent in the amount of information that can be
obtained on the Big Bend facility through public domain outlets. The Internet has a vast amount
of public documentation, however, certain proprietary information could not be obtained and
therefore a complete picture of the activities and pollutants from this facility cannot be reported.
The author used multiple sources to confirm information on the portions of the Big Bend facility
that are open to public scrutiny. Government reporting of toxic emissions is done by the facility,
and therein is the limitation; the current regulatory reporting process. The reporting facility can
omit sections of data, with no explanation. The 2013 TRI report for Big Bend, the most current
reporting to EPA, contains sections of missing data and TECO is not legally compelled to
produce this information. EPA and FDEP rely on the facility to report accurately, therefore the
accuracy of data is contingent upon the reliability and validity of reports furnished by TECO.
Conclusion
In summary, the methods used in this case study have been identified in order to answer
the research questions posed regarding Tampa Electric’s history of compliance with the
Settlement condition of the lawsuit. The questions of environmental justice and racism within

92
the communities surrounding Big Bend are issues on a larger scale that require thorough
investigation and analysis of data from multiple sources. The use of unobtrusive methods using
existing data with the collection and analysis of these secondary sources allowing for an
unbiased look at the facility and its effect on the communities that surround it.
The presentation of the findings through investigation and analysis of the data are
reported in Chapter six and a discussion of these findings with the larger issues of environmental
justice and environmental racism explored in Chapter seven.

93
CHAPTER SIX:
THE BIG BEND CASE STUDY: RESEARCH QUESTIONS AND
RESULTS OF INQUIRY
This chapter reviews the results of the analysis of this study’s research questions. Table
13 shows the various research inquiries, documents used in the comparison and analysis of data,
and the specific research questions identified in those documents. Each of these inquiries is
discussed in turn below.
Research Question 1
The first research question examined whether the EPA actions in the 2000 settlement
agreement fit the environmental crimes that TECO had been charged with. TECO appears to
have operated without much regulatory oversight from its initiation in 1970 to the FDEP NOV
filed in November 1997. This is due to grandfathering clauses in the original CAA under which
TECO qualified by a matter of months. Older power plants were not held to the same regulatory
standards as newer facilities, as the EPA felt they would be out of operation within 25 years.
The NOV cites multiple permitting violations and toxic emissions from modification to Big
Bend Units 1 and 2 from 1991 to 1996. FDEP and TECO reach a CFJ in December 1999
wherein TECO agrees to multiple emissions controls and penalties for its Big Bend facility. In
late December 1999, TECO filed a petition for approval of compliance with the FDEP
implementations of CAA and CFD timetables.
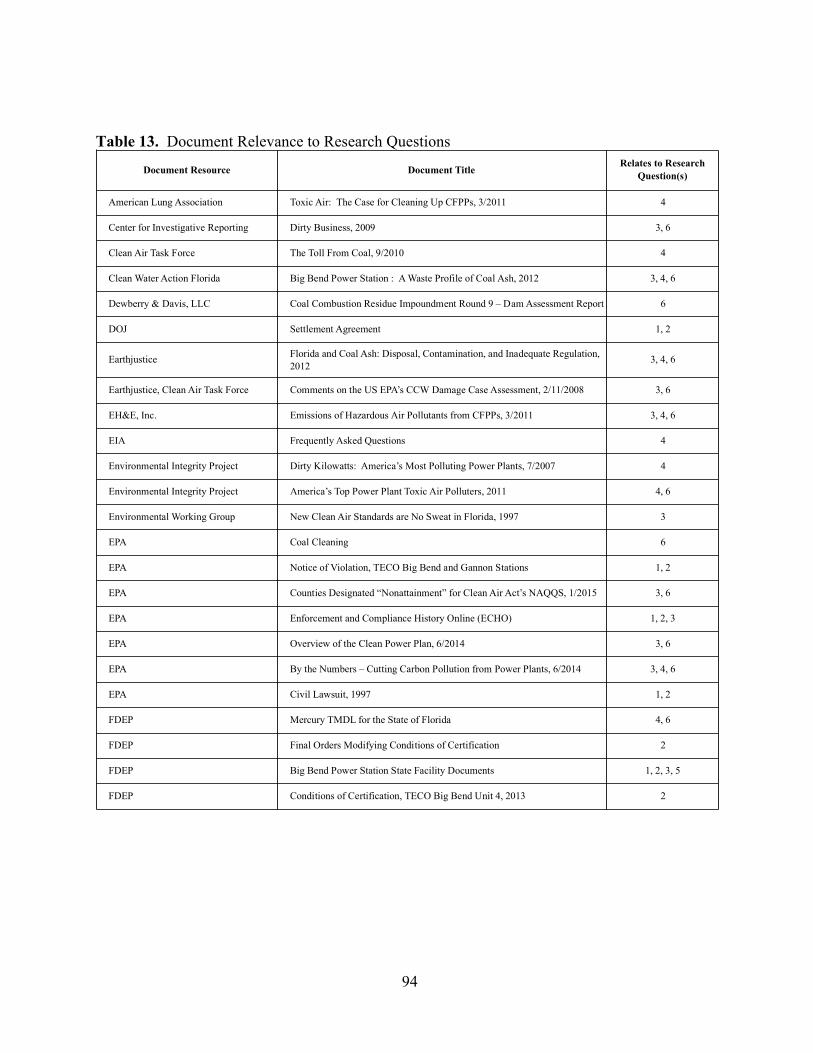
94
Table 13. Document Relevance to Research Questions
Document Resource Document TitleRelates to Research
Question(s)
American Lung Association Toxic Air: The Case for Cleaning Up CFPPs, 3/2011 4
Center for Investigative Reporting Dirty Business, 2009 3, 6
Clean Air Task Force The Toll From Coal, 9/2010 4
Clean Water Action Florida Big Bend Power Station : A Waste Profile of Coal Ash, 2012 3, 4, 6
Dewberry & Davis, LLC Coal Combustion Residue Impoundment Round 9 – Dam Assessment Report 6
DOJ Settlement Agreement 1, 2
EarthjusticeFlorida and Coal Ash: Disposal, Contamination, and Inadequate Regulation,
20123, 4, 6
Earthjustice, Clean Air Task Force Comments on the US EPA’s CCW Damage Case Assessment, 2/11/2008 3, 6
EH&E, Inc. Emissions of Hazardous Air Pollutants from CFPPs, 3/2011 3, 4, 6
EIA Frequently Asked Questions 4
Environmental Integrity Project Dirty Kilowatts: America’s Most Polluting Power Plants, 7/2007 4
Environmental Integrity Project America’s Top Power Plant Toxic Air Polluters, 2011 4, 6
Environmental Working Group New Clean Air Standards are No Sweat in Florida, 1997 3
EPA Coal Cleaning 6
EPA Notice of Violation, TECO Big Bend and Gannon Stations 1, 2
EPA Counties Designated “Nonattainment” for Clean Air Act’s NAQQS, 1/2015 3, 6
EPA Enforcement and Compliance History Online (ECHO) 1, 2, 3
EPA Overview of the Clean Power Plan, 6/2014 3, 6
EPA By the Numbers – Cutting Carbon Pollution from Power Plants, 6/2014 3, 4, 6
EPA Civil Lawsuit, 1997 1, 2
FDEP Mercury TMDL for the State of Florida 4, 6
FDEP Final Orders Modifying Conditions of Certification 2
FDEP Big Bend Power Station State Facility Documents 1, 2, 3, 5
FDEP Conditions of Certification, TECO Big Bend Unit 4, 2013 2

95
Table 13. (continued) Document Relevance to Research Questions
Document Resource Document TitleRelates to Research
Question(s)
Florida Clean Power Coalition Florida’s Dirty Dinosaurs, 1997 4, 6
Florida Public Service CommissionReview of Coal Combustion Residual Storage and Disposal Processes of the
Florida Electric Industry, 12/20112, 6
HBO Documentary Gasland, Fox, 2010 3, 6
IECG Coal Fired Power Generation 2
Independent Science NewsHow EPA Faked the Entire Science of Sewage Sludge Safety: A
Whistleblower’s Story, 6/20144
NAACP, IEN, LVEJO Coal Blooded: Putting Profits Before People 3, 4, 6
National Institute on Money in State
PoliticsPowering The Sunshine State, Barber, 4/2009 2, 3
OpenSecrets Influence and Lobbying, Electric Utilities, 2013-2014 2, 3
PERI Toxic 100 Index, 2013 3, 4, 6
PERI Toxic Flood, 5/2013 4, 6
Powermag Big Bend’s Multi-Unit SCR Retrofit 2
Right To Know Network Toxic Release Inventory, 2013 3, 4, 6
Rolling Stone Magazine The Dark Lord of Coal Country, Goodell, 2010 6
Sourcewatch Big Bend Station,2/2011 2, 3, 4, 6
State of Florida Public Service
CommissionMemorandum RE: Cost Recovery Clause, 10/2000 1, 2
Tampa Bay Online 150 Protesters, Law Enforcement Face Off at Big Bend Plant 3, 6
Tampa Bay TimesDirty Air: Florida Ranks Third Worst for Power Plant Generated Toxic Air,
Klas 7/20/20112, 3, 6
Tampa Bay Times Under Scott, DEP Undergoes Drastic Change, 10/18/2014 2, 6
TECO 2014 Corporate Sustainability Report 2
TECO Site Certification Application, Big Bend Station Unit 4, 1980 1, 2, 5
TECO Big Bend Power Station Home Page 2
WUSF News Study: Florida Third-Worst for Power Plant Pollution, Ramos, 9/2013 2, 3, 6
TECO reached agreements to settle these issues with EPA (Consent Decree, February,
2000) and FDEP. The consent decree includes the requirements of the CFJ but altered the
timeline for compliance dates. Additionally, a civil penalty was assessed, which banned TECO
from selling or banking SO2 emission allocation credits, and TECO was required expenditures of
up to $9 million on NOx emission controls. After TECO signed this landmark settlement with

96
the EPA, it filed for a closure of the CFJ with FDEP. The Docket was closed in April 2000,
without TECO having to address specifics of the FDEP’s CFJ.
In June 2000, TECO filed and received approval for recovery costs associated with
complying with prior environmental violations. Costs recovery was allowed despite the
existence of prior and current violations.
Despite prior violations, in March 2000, TECO was awarded a government contract for
services until September 2007 from the Air Force to provide electric services and refrigeration
and air conditioning components in the amount of $44.2 million. In addition, TECO was
awarded a contract for electric services from the Department of Veterans Affairs from July to
September 2000, in the amount of $1.16 million. Total contracts for FY 2000 from the federal
government exceeded $45 million.
The civil penalty assessed in the Settlement was $3.5 million with an additional $10
million to be spent in improvements to facilities and emissions controls. The environmental
allotment for the Tampa Bay estuary was $2 million dollars. All of these penalties were phased
in over a 10 year period ending December 31, 2010. The federal government also allowed an
opt-out clause in the original settlement agreement of February 2000 that stipulated if it could
not adequately provide the monetary support to complete Settlement provisions, TECO could
shut down the Big Bend facility with no further penalty.
Given the numerous violations, one can conclude that the settlement agreement did not
appear to fit the crimes with which TECO was charged. The civil penalties did not pose a
financial burden to the company. TECO did not admit any wrongdoing either to the
communities that surround the plant or the ecosystem of the affected area. In addition, they
passed the cost of settlement onto the customers through the ECRC as well as a final opt-out

97
clause written into the agreement should they not meet their legal obligations to the communities
surrounding Big Bend. Some might argue that a $13.5 million settlement is substantial, and
certainly, with respect to fines received by other corporate violators with a smaller operation and
fewer FY profits for similar offenses, the fine is substantial. Currently, there is no objective
mechanism for determining whether penalties received for an environmental crime are
substantial or adequate within the legal system. The judge hands down a ruling in a case of this
nature, and the disposition of the court on the imposition of damages and/or penalties, can leave
this assessment open to subjective interpretations.
Research Question 2
The second research query investigated whether TECO’s commitment to honor the terms
of the settlement agreement and provide environmental justice to the communities that surround
the Big Bend facility had been honored.
TECO’s noncompliance history under both CAA and CWA legislation indicates that
TECO is not providing environmental justice to these communities. The settlement stipulated
that TECO would comply with emissions regulations through the original settlement deadline
and beyond its termination. This is clearly not the case, as noncompliance with both permitting
and emissions are documented in ECHO’s compliance records. The outside firm of Dewberry
and Davis, LLC, hired by TECO to assess their waste management, originally gave them a
“poor” rating in April 2011 with an amended rating of “fair” in the final report by December of
that same year. The report cites a lack of supporting documentation for disposal sites and ash
pond analysis. Visual inspection and photographic reporting were the basis of the report and the
company lists TECO’s documentation as an area for improvement in future inspections. They
indicated an ash pond with a split liner that could be an environmental hazard. Additionally,

98
TECO’s use of the ECRC to pass the cost of settlement conditions onto its customers would
qualify as an environmental injustice to these communities through economic hardship.
Research Question 3
The third research question explored whether non-compliance issues create a form of
environmental injustice through unequal distribution of pollutants. Figure 8 shows an aerial
view of Communities that are affected by Big Bend within a 10 mile radius.
= 1 Mile = 3 Miles = 5 Miles = 10 Miles
1, 3, 5 and 10 Mile Areas Around TECO Big Bend
Figure 8. Communities That Surround Big Bend within a Ten Mile Radius The TECO plant has been in noncompliance with CAA and CWA regulatory emissions for PM
and significant violations and non-compliance for 13 consecutive quarters since 2011. Chapter
three explored the health hazard and impacts of PM matter in both the air and water. It was
established that one to five miles from the point source was most hazardous to human health,
wildlife, and the environment. The most affected communities are Apollo Beach, areas of

99
Gibsonton, and Ruskin. It has been shown that the most detrimental effects occur within this
radius, these communities would be prone to the health hazards of air and groundwater
contamination. The manatee population situated directly below the emission stacks in the
viewing station is particularly vulnerable to PM and HAPs emitted through the plumes in air and
water.
Research Question 4
The fourth research inquiry focused on plant emissions and negative health impacts. Do
they constitute environmental injustices in the form of environmental racism against low income
and minority population in and around the site? Does the demographic data support this
conclusion?
Table 14 shows demographic data for 1, 3, and 5 miles from the point source. In
addition, PERI data indicates the poor and minority share of the community in this area. A link
to this information can be found in the Table 10 document inventory found in Chapter five. Big
Bend affects over 45,000 persons within a five mile radius and ECHO reports that 42% of that
population are racial and ethnic minorities. In comparison, Census data indicates that 17% of
Hillsborough County residents are African-American, and that 25% are Hispanic. Clearly the
percentage of minority resident near the Big Bend facility has a disproportionate minority
concentration. Whether that constitutes definitive evidence of environmental injustice cannot be
determined without further, future analysis.
In addition, 27% of that population lives below the poverty level. This is significantly
higher than the mean percentage of persons below poverty level for Hillsborough County, which

100
Table 14. Demographic Proile of Area Surrounding Big Bend Power Station
http://echo.epa.gov/detailed-facility-report?fid=110008319505#TRIinfo
TECO Big Bend Power Station
Demographic Profile of Surrounding Area (1, 3 and 5 Miles from Source Point)
1 Mile 3 Miles 5 Miles 1 Mile 3 Miles 5 Miles 1 Mile 3 Miles 5 Miles
Radius of Area 1 3 5 Land Area 68% 57% 59% Households in Area 89 6,741 16,216
Center Latitude 27.795252 27.795252 27.795252 Water Area 32% 43% 41% Housing Units in Area 118 7,827 18,657
Center Longitude -82.403209 -82.403209 -82.403209 Population Density 84/sq.mi. 1,085/sq.mi. 992/sq.mi.Household on Public
Assistance1 211 467
Total Persons 178 17,579 45,530 Percent Minority 10% 32% 42%Persons Below Poverty
Level52 4,659 12,030
Persons (%) Persons (%)
Race Breakdown 1 Mile 3 Miles 5 Miles Age Breakdown 1 Mile 3 Miles 5 Miles
White: 164 (92.13%) 14,218 (80.88%) 33,341 (73.23%) Child 5 years and younger 5 (2.81%) 1,300 (7.4%) 3,971 (8.72%)
African-American 3 (1.69%) 1,799 (10.23%) 6,626 (14.55%) Minors 17 years and younger 15 (8.43%) 4,276 (24.32%) 12,800 (28.11%)
Hispanic Origin 5 (2.81%) 3,173 (18.05%) 10,326 (22.68%) Adults 18 years and older 162 (91.01%) 13,303 (75.68%) 32,730 (71.89%)
Asian/Pacific 8 (4.49%) 430 (2.45%) 1,169 (2.57%) Seniors 65 years and older 93 (52.25%) 2,307 (13.12%) 4,477 (9.83%)
American Indian 1 (.56%) 64 (.36%) 170 (.37%)
Other/Multiracial 3 (1.69%) 1,068 (6.08%) 4,224 (9.28%)
Persons (%) Households (%)
Education Level (Persons 25 &
Older)1 Mile 3 Miles 5 Miles Income Breakdown 1 Mile 3 Miles 5 Miles
Less than 9th Grade 4 (2.38%) 453 (3.88%) 1,217 (4.59%) Less than $15,000 6 (6.25%) 426 (6.55%) 1,019 (6.83%)
9th through 12th Grade 15 (8.93%) 1,043 (8.94%) 2,604 (9.82%) $15,000 - $25,000 13 (13.54%) 532 (8.18%) 1,308 (8.76%)
High School Diploma 57 (33.93%) 3,292 (28.2%) 7,656 (28.88%) $25,000 - $50,000 32 (33.33%) 1,681 (25.85%) 3,897 (26.11%)
Some College/2-year 52 (30.95%) 3,903 (33.44%) 8,689 (32.78%) $50,000 - $75,00 16 (16.67%) 1,447 (22.25%) 3,306 (22.15%)
2,418 (37.18%) 5,397 (36.16%)B.S./B.A. or More 40 (23.81%) 2,982 (25.55%) 6,342 (23.92%) Greater than $75,000 29 (30.21%)
is 15%. Again, whether or not this difference specifically constitutes definitive evidence of
environmental injustice require further, complex GIS analysis.
Within the five-mile radius, 14% of the population has not achieved a high school
education and 20% live on an annual income of less than $25,000. For Hillsborough County
13% of the population have less than a high school education, and a mean income of $27,149.
These indicators suggest that it is unlikely that there is a form of environmental injustice in this
case related to income and education. For the year studied (2011), Census reporting used the
federal standards for the poverty level. This figure represents a two parent household with four
children and the level the government considered the poverty line for that year.
Finally, the number of minors is significant with ECHO reporting 28% of those persons
listed within the five-mile radius are 17 years of age or younger. Children five and younger

101
constitute 9% of the population living in the affected area. The figures for Hillsborough County
are 23% and 6% respectively. These figures indicate that the young are not unequally impacted
by the facility.
Of the 178 persons listed as living within one mile of the point source, 52 people (29%)
within this population are in the most hazardous area for health effects. Ten percent of this
population is minority, with 11% of these persons, 17 years or younger, and 11% in this area
without a high school diploma. Further breakdown of the poverty levels in this region indicated
that 20% of the population who live within one mile has an annual income of $25,000 or less.
The elderly population of this area, those 65 years and older are a population of concern
for the disproportionate effects of toxic pollutants. Research indicates that this population is as
vulnerable to toxic emissions as the very young. For this case study, the five mile radius was
used to determine significant impacts on environmental justice issues. The senior citizen
communities, including assisted living facilities and retirement communities within the
geographic area around Big Bend, were 10%. If the research radius had been expanded to 10 or
15 miles this number would have increased. This warrants further research into the impacts on
the elderly and infirm residents of this community who are particularly vulnerable to HAPs in
the atmosphere.
PERI indicated scores for environmental justice research. The basis for their reporting is
the TRI index of HAPs reported by each facility. The most recent PERI breakdowns for TECO
Big Bend indicated the following: EJ Poor Share 13.6% and EJ Minority Share 36.7%,
calculated based on information from the 2010 Census information. Poor share is percentage of
people living below the federal poverty line, while EJ Minority Share is the percentage of racial
and ethnic minorities. The EPA also provides a “Toxic Score” for the facility. According to

102
PERI, TECO Energy Inc. released 517,850 pounds of toxic emissions into the atmosphere in
2010. Big Bend was responsible for 299,110 pounds of these emissions, accounting for 58% of
total emissions and over all TECO Big Bend accounts for 91% of the Company’s toxic score
emissions. The data provided from PERI indicates environmental injustices in both non-
compliance issues as well as negative health impacts to the communities that surround Big Bend.
The PERI data serves to answer research question four and supports the conclusions drawn for
research questions one and three.
Additionally, health impacts are shown in Table 15. Florida ranked 14th in the nation in
mortality rates, hospital admissions, and heart attacks attributable to HAP emissions from
CFPPs. Table 15 reveals those directly attributable to the Big Bend facility. These figures,
acquired in February 2011, show 17 fatalities directly attributable to Big Bend toxic emissions.
In comparison, the Hillsborough County Sheriff’s Office Homicide Section investigated 35
fatalities in 2011 (HCSO, 2011). In a community profile compiled for the health department in
2010/2011, the death rate is higher in Hillsborough County than for the State of Florida; 728 v
656 per 100,000 persons (Hillsborough County Health Profile 2010/2011). The value of negative
health impacts for 2010 directly attributable to Big Bend were estimated to be over $127 million
dollars. Appendix A, Table A3 lists health impacts from CFPPs on a national scale for
comparison to state and local data, which appears in Table 15. The total expenses for death and
disease attributed nationally estimated at $619 million for 2010. The dollar amount for Big Bend
is almost 20% of the national scale.
Part of addressing environmental justice issues relates to determining the unequal
exposure of a population to pollutants. Above it was noted that the population near the Big Bend
facility has high concentrations of African Americans and Hispanics. Part of assessing whether

103
Table 15. Health Impacts Attributable to Big Bend Facility
http://www.catf.us/resources/publications/files/The_Toll_from_Coal.pdf
Asthma Attacks 240 $12,000
http://www.sourcewatch.org/index.php/Big_Bend_Station
Source: "Find Your Risk from Power Plant Pollution," Clean Air Task Force interactive table, accessed
February 2011
Heart Attacks 23 $2,500,000
Chronic Bronchitis 9 $4,200,000
Hospital Admissions 13 $290,000
ER Visits for Asthma 14 $5,000
Type of Impact Annual Incidence Valuation
Mortality 17 $120,000,000
Death and Disease Attributable to Big Bend
State Health Impacts (Annual 2010 est.)
Rank State Mortality Hospital Admissions Heart Attacks
14 Florida 313 228 435
they are subject to environmental injustice includes examining their exposure to environmental
toxins. Table 16 shows total releases into air and surface groundwater from Big Bend from 2005
to 2013. Blank cells indicated a failure by TECO to report an emission. With the exception of
emissions for HCl, sulfuric acid and zinc, which declined, and dioxin, hydrogen fluoride, and
Nickel, which remained constant, there were increases in emissions in the remaining nine
reported pollutants, while insufficient data were available to assess the quantity of five emitted
pollutants. Table 16 reveals a similar pattern of toxic air emissions and total surface water
discharge TRI pollutants for total pollution at Big Bend. TRI for total air emissions has

104
decreased 35% since 2005, while surface water discharges have increased by over 70%. Total
offsite releases have increased from 6,531 pounds to 61,677 pounds, or by 944%.
Table 16. Toxic Release Inventory Pollution Report Big Bend Facility, 2005 - 2013
YearTotal Air
Emissions
Surface Water
Discharges
Off-Site
Transfers to
POTWs
Underground
InjectionsReleases to Land
Total On-site
Releases
Total Off-site
Releases
2005 1,163,130 11,656 0 7,637 1,182,423 6,531
2006 1,178,001 7,171 0 18,222 1,203,394 28,846
2007 1,193,976 11,882 0 17,700 1,223,558 103,749
2008 1,317,176 36,595 0 1,886 1,355,657 81,674
2009 1,130,910 5,458 0 16,895 1,153,263 67,767
2010 921,696 9,768 0 1,874 933,338 77,411
2011 881,645 8,377 0 0 890,022 75,350
2012 286,225 872 0 0 287,097 92,239
2013 329,492 81,818 0 0 411,310 61,677
33572TMPLC13031
33572TMPLC13031
http://echo.epa.gov/detailed-facility-report?fid=110008319505#TRIinfo
TRI Pollution Prevention Report, TECO Big Bend Power Station
TRI Facility ID
33572TMPLC13031
33572TMPLC13031
33572TMPLC13031
33572TMPLC13031
33572TMPLC13031
33572TMPLC13031
33572TMPLC13031
These figures question TECO’s environmental commitment to communities surrounding
the Big Bend facility. Since the settlement agreement compliance deadline of 12/31/2010,
current groundwater contaminants remain a significant hazard. Total PM emissions have not
been in compliance for 5 quarters. These issues have been present since 2011 and continue to
the first quarter of 2015. In 2008, EarthJustice reported significant groundwater contaminants
with elevated levels of boron, sulfate, and heavy metals in coal ash disposal area 2. Arsenic was
reported at 11 times the maximum contaminant level (MCL), thallium at 8 times the MCL and
fluoride at 4 times the MCL. Secondary maximum contaminant levels (SMCLs) were much
higher with Boron in groundwater at 700 times the SMCL, manganese was 240 times its SMCL
and sulfate was 128 times the SMCL level for Florida guidance concentrations. EarthJustice also
found contaminants measure in groundwater at the gypsum storage area at Big Bend exceeded
boron standard by 40 times the SMCL and 66 times for iron and manganese by 11 times the
SMCL for Florida guidance concentrations. In light of the gross contamination in primary and

105
secondary MCLs they recommended that EPA investigate the facility for its potential threat to
health and the environment, and list it as a damage case.
Over all, these rudimentary assessments suggest some potential evidence of
environmental injustice for residents near the Big Bend facility. Further and more complex
analysis is, however, required to reach a more definitive conclusion on this matter.
Research Question 5
The fifth inquiry lies at the heart of environmental racism. Did TECO intentionally
choose the Big Bend site due to the expected population demographics, or is this environmental
dilemma a consequence of normal population growth? This is the most difficult question to
quantify in a single case study. Internal documents from TECO indicated company awareness
that potential population growth in the area surrounding the plant was probable. In their 1980
application for Site Licensing for Unit 4, TECO goes into detail about the regional demography
within a five- mile radius of the proposed facility. They calculate population growth in
Hillsborough County from 1960 to 1970 and approximate the population growth in surrounding
towns. They continue to estimate population growth through 1977 for this report. They
projected a 69% increase in Hillsborough County population from 1970 to 1977 and a 74%
increase in the Gibsonton population. Ruskin was calculated at an even higher 116.5%. With
these figures included in a report dated August 1980, it would appear that TECO was well aware
that this area would have a population surge that could impact the health and welfare of persons
living within that five-mile radius. One cannot speculate on the intent of the company. But, the
figures that TECO presented to the Florida DEP for Site Certification, would certainly indicate
that they knew the area was going to have a “substantial increase in population” (TECO Site
Certification, 1980, p. 2.2-1). Whether or not TECO had any indications that the deleterious

106
environmental impacts of the plant might change the racial and ethnic composition of the
affected area cannot be ascertained from these data. The available data, therefore, do not allow
conclusions to be reached on this question.
Research Question 6
The final research inquiry explores whether negative ecological impacts from CFPP
emissions constitute a form of environmental injustice to the communities that surround Big
Bend. The number of endangered species listed in the TECO Site Certification Report of 1980
indicates that TECO was aware of how many land, air, and water species would be affected by
toxic emissions from the plant. In this report, Section 2.3 lists regional, historic, scenic, cultural
and natural landmarks that could be affected. Section 2.7 lists the ecology affected with
terrestrial and aquatic species listed by name and type. The manatee population discussed in
Chapter two is included in this report, however, there is no data predicting adverse effects on the
population. The report deals with operations for monitoring the wildlife and ecosystems but
makes no predictions on adverse effects to the wildlife population. Current data on wildlife
health for Hillsborough County, such as a broad-based wildlife health survey, does not currently
exist, and limits the ability to answer this question.
Conclusion
In sum, the research questions have been identified and information pertinent to the
discussion presented for review. The data can be replicated from more than one source (e.g.,
Table 12, and Table 13). As noted above, there is some preliminary evidence of certain forms of
environmental injustice in the area. This suggests that further research on this question is
warranted.
107
CHAPTER SEVEN:
DISCUSSION, FUTURE RESEARCH AND CONCLUSION
Discussion
Three main themes have been repeated within this case study. First is TECO’s response
to the charges brought against their Big Bend facility in the initial NOV and subsequent lawsuits,
as well as their compliance history since the settlement in 2000. The second involved questions
of environmental justice. The third included an analysis of detrimental health effects associated
with CFPPs.
TECO’s Responses and Compliance History
TECO’s rapid response to the original lawsuit raised some interesting questions. The
FDEP filed in November 1997, proceeded with formal legal action in 1999, and was joined by
the EPA in November 1999. Both filings, and the FDEP response by a CFJ occurred within one
month. By the conclusion of December 1999, TECO had formalized its CFJ with the FDEP and
was left to deal with only formal charges brought by the EPA. The DOJ, on behalf of the EPA,
announced just two months later that it had settled with TECO in a landmark environmental
agreement.
TECO settled with both state and federal regulatory agencies in rapid succession. In a
judicial system where lawsuits can take months and years to settle, TECO managed to conclude
regulatory concerns in what can only be described as record time. The conditions of the
settlement agreement between TECO and EPA are public knowledge, but how the parties arrived
108
at the agreement so expeditiously are a matter for speculation. TECO’s monetary investment in
improvements and civil penalties assessed by the government amounted to just short of $15
million dollars. TECO’s legal maneuvering included the closure of the Docket on its FDEP case.
TECO was not held accountable for the provisions of the Florida CFJ, only the provision of the
CFJ that the EPA included in their lawsuit. In addition to this legal injustice to the state, TECO
then filed for reimbursement for all the pollution controls and monitoring equipment stipulated in
the final settlement with the EPA. In October 2000, TECO filed for relief through the
Environmental Cost Recovery Clause. The court approved the request. TECO was allowed to
pass the cost of all renovations, pollution controls, and monitoring onto its customers through
systematic rate increases. The government’s settlement agreement included a ten year time
frame for all compliance issues as well as an opt-out clause for TECO in the event it could not
complete the necessary renovations and remain financially solvent.
In the investigation of the legal timing of proceedings, research uncovered a few
interesting caveats. TECO began legal proceedings in November 1999 and concluded an
agreement to settle in February 2000. Cost recovery was requested in October 2000 and a legal
agreement reached by the end of 2000. Curiously, TECO had government contracts pending
with both the Department of Defense and the Department of Veterans Affairs that were set to
begin in 2000. TECO would have been vetted thoroughly and in the final stages of the contract
bidding process for any companies that desired those government contracts. However, despite
these time constraints, TECO was awarded two large government contracts immediately
following the settlement agreement. In March 2000, the Department of Defense awarded TECO
a seven year contract to supply electric services and refrigeration and air conditioning
components for the Air Force in the amount of $44.2 million dollars. The Department of

109
Veterans Affairs entered into a $l.16 million dollar contract with TECO in July 2000. The
timing of these contracts, so close to the settlement agreement with the EPA and the DOJ’s
involvement, present a possible conflict of interest.
TECO has been regularly awarded government contracts throughout the settlement
period. The total obligation amount to TECO in government contracts from 2000 to the present
day is $87.7 million dollars. Was it necessary for the government to provide a ten year window
for compliance and an opt-out clause for TECO? With over $45.36 million dollars in
government contracts already in the bidding process, the settlement posed no danger to TECO’s
financial stability. TECO received financial assistance through the ECRC and passed on costs to
its customers. With the amount of money in government contractual obligations pending for an
additional six years, was the ECRC necessary, and did the communities around Big Bend suffer
a financial hardship due to rate increases? This is an argument that the community should have
been made aware of at the time of the settlement agreement. TECO had received and completed
their contract to the Department of Veterans Affairs when it applied for ECRC assistance. These
actions by TECO were not in the interests of the communities that surround Big Bend.
The second research question involved TECO’s compliance history with the conditions
of the settlement. TECO promoted its environmental record, and compliance history as being
up-to-date (TECO, 2014). However, reports compiled by government oversight agencies, third
party contractors for TECO, as well as environmental watchdog groups, indicated a different
reality. TECO’s historic and current non-compliance in CAA and CWA regulations show a
disregard for the health concerns of the communities surrounding the plant. Significant
noncompliance in PM emissions, as well as CWA violations for 13 consecutive quarters, shows a
lack of environmental responsibility for wildlife and human health issues. Various reports have

110
cited 10 unlined ash ponds as well as damage in the protective liner of the single ash pond that
contains a protective liner.
TECO has been cited in the past for a lack of documentation to support their maintenance
schedules, lack of proper documentation on pollution monitoring equipment, and permit
violations. In 2008, EarthJustice reported significant groundwater contamination at the Big Bend
location, but EPA did not investigate the allegations. No cases seeking damages were filed, no
violations issued, and no penalties were assessed on TECO. Clearly, TECO has not shown
consistency in regulatory compliance, but demonstrates a continued lack of commitment to the
long term health and welfare of the communities surrounding Big Bend through these
inconsistencies in compliance history. The question of effective deterrence for large
corporations involved in environmental crimes is highlighted in this case study. Without
effective deterrent programs implemented and vigorously enforced, the corporate crimes
committed against the environment will continue unimpeded. The regulatory agencies are
responsible for this arm of law enforcement for the constituency of this area. Without any
deterrence, the crimes will simply continue.
Environmental Justice Issues
The current levels of HAP emission make a strong case for environmental injustice,
particularly to those communities within a five-mile radius of Big Bend. In the past 10 years,
there has been significant residential and business development in Apollo Beach, Ruskin and
western portions of Gibsonton. The housing units occupying the eastern shores of Tampa Bay
are within one to three miles of the point source. The continued residential development in this
area, along with the construction of a large hospital, is of concern as they are all within the five-
mile radius of the facility.

111
Further investigation of the current demographic constituency would provide a more
accurate picture for those pursuing the environmental justice issues regarding the unequal
distribution of toxic air and water emissions surrounding Big Bend, as some of the events listed
here have occurred since the last Census.
The current demographic data supplied by ECHO and PERI would suggest further
investigation into alleged environmental racism by TECO is needed. ECHO reported a 42%
minority base and PERI gave TECO a 36% minority share. The differences in percentages could
be due to the breakdown of ethnic and minority demographics in the community and the
calculated distances from the point source. ECHO maintains its search within the five-mile
radius while the minority share of PERI is up to a 31 miles from the point source. This could
account for the differences in percentage of minority population. The poverty shares and
demographics in level of household income are calculated in the same way. The data reported
on poverty levels in this area, as well as those who do not have a high school education, are
disturbing at 26%, and provide additional support for an allegation of environmental racism.
These data indicate an environmental justice issue in these communities. Further
research to expand the range of demographic information would solidify the argument. The
PERI data should be narrowed to the same demographic area as the ECHO data, or ECHO data
expanded to a wider area, in order to confirm what each agency has calculated as poor and
minority affected areas of concern, however, both sets of data suggest that environmental
injustices have occurred to the poor and minority populations. Ten to fifteen miles from the
point source the population is largely residential and has a considerable number of senior
citizens, 65 and over. As the data has shown, the elderly and children have the most significant
health concerns with regard to HAPs in the air and water. Further study is warranted to

112
determine if there is an unequal distribution of pollutants effecting this vulnerable population as
the current five mile radius is not sufficient for a conclusion to be reached regarding this
population.
The current study cannot state that TECO intended to commit any environmental justice
infractions. TECO’s internal documentation indicated that the company was aware of the
potential for expansion in this demographic region. Additional internal documentation needs to
be reviewed in order to come to a more decisive conclusion on TECO’s motivation for choosing
the site at Big Bend as opposed to other sites that were proposed in 1970. Those records were
not obtainable through the public domain, however, all site applications are public record and
this information should be obtained for further research and scrutiny. The motives behind the
choice of this location may not ever be known. Therefore, criminal intent with regard to
environmental justice would be difficult to prove in court without a direct witness or statement
from within TECO. The mens rea of TECO management is purely subjective, however, reports
suggest that there were indicators of significant population increases in the area surrounding the
plant contained in the report and subsequent site application.
Ecological impacts have been documented throughout the case study. Health and
environmental impacts on non-human life forms and specifically endangered species through the
HAPs emitted in air and water within the five mile radius of Big Bend are well documented.
These HAPs can have effects beyond the five mile radius through the atmospheric residual times
specific to each toxin. The danger to freshwater, groundwater and specifically the waters of
Tampa Bay, Hillsborough Bay and the Alafia River are a concern for there are many species that
depend on the land and water resources to sustain life. The manatee population is of great
concern as they congregate directly below the stacks in the southeastern section of the Bay
113
closest to the point source. TECO has planned to open a Conservation and Technology Center in
cooperation with the Tampa Aquarium. It will be interesting to note what species will be
included in this new Center and what impacts the HAPs from Big Bend will have on that
community of wildlife. The Center will be located in a piece of land adjacent to the current
manatee viewing station.
With respect to the third major question about health impacts, a significant number of
studies were reviewed on that issue. As noted throughout that review, CFPP pollutants have
extensive and significant health impacts that appear to warrant further environmental regulation
to protect pubic health.
The Utility Lobby
The final area for discussion is the utility lobby, at both the federal and state levels. The
Oil and Gas Lobby is influential. It is one of the largest lobbying organizations, both in
corporation participation, and political PAC contributions to both political parties. Recently,
politicians were supported with PAC contributions from the Oil and Gas Lobby in excess of
$368,000 dollars in the 2012 mid-term elections (OpenSecrets.org, 2014).
Florida imports coal to burn in CFPPs around the state at a cost of over $307 million
dollars annually (Union of Concerned Scientists, 2010). Renewable energy sources are not
promoted in the state of Florida as sustainable for the future. Solar and wind energy are not on
the lobbying agenda for our State politicians. For consumers wanting to use renewables, the
costs are exorbitant, and renewables are even prohibited in some areas. Solar panels, for
instance, are not permitted in certain residential areas and many homeowners find it cost
prohibitive to install solar in their homes. The utility lobby in the State Legislature has donated
in excess of $2 million dollars to various campaigns in Florida’s 2013-14 midterm elections.

114
PAC lobbying efforts have increased, with $5 million donated in 1990 to over $18 million
dollars in total campaign contributions donated through 2014. Whether this affects the ability of
our regulatory agencies to effectively monitor utility companies presents an interesting research
topic.
Under our current legislative leadership, the FDEP has less time to review a claim and no
time to consider a claimant before issuing an environmental permit in the state. Permitting
turnaround time has changed from 44 days to 2 days. Duke, Florida Power and Light, and TECO
are all financial contributors to this large political action committee, which state legislators are
eligible to receive; “ ... Following an established pattern, Republicans will continue to promote
less regulation than Democrats, although public opinion has been, and will be, a wild card in this
trend. Few presidents (or politicians) have been able to ignore public concern for the
environment though some have tried...” (Lynch et al. 2014; p.291). The representative for state
Congressional District 11 in the House of Representatives, where the Big Bend plant is located,
is Richard B. Nugent. According to Insidegov.com and based on ratings from various national
interest groups between 2012 and 2014. Representative Nugent’s agenda was “strongly pro-
business, strongly against animal rights, strongly against environmental regulation. According to
inside.gov resources, Representative Nugent, “strongly opposes” prioritizing green energy
issues. He received $9,000 of his estimated $211,830 in PAC contributions from utility
companies in Florida including TECO (insidegov.com, 2015).
On June 2, 2014, President Obama proposed the Clean Action Plan, to cut carbon
emissions from CFPPs like Big Bend. On April 17, 2015, the EPA enacted CFR Parts 257 and
261 in a final rule that deal with hazardous and solid waste management systems, and the
disposal of coal combustion residuals from electric utilities. These new regulations will fall

115
under sections of RCRA and are of the overall Clean Action Plan to reduce emissions and HAPs
into the atmosphere (gpo.gov, 2015). It remains to be seen if Congress will support the President
in efforts to clean up CFPP waste and emission of HAPs.
Implications for Future Research and Conclusion
There are several issues raised in this case study that warrant further research. First, are
the regulatory responses by the EPA and FDEP to CFPP violations of the CAA and the CWA.
How can environmental justice be implemented when the agencies dedicated to oversight are not
enforcing current laws? At the very least, penalties should be paid for infractions TECO’s Big
Bend facility has displayed. How are the utility lobby efforts putting pressure on the nation’s
regulatory agencies through PAC contributions to legislators? These questions hold a host of
potential research inquiries. Who is contributing? How much money is devoted to utility
concerns, particularly legislation that affects CFPPs?
Further research into CEV and green victimization need to be addressed within current
criminological theory. Green criminologists have tasked themselves with the application of
current criminological theory to the broader interpretation necessary to apply these theories to
environmental law and crime. Deviant behaviors by corporations, state-corporate crime and
crimes committed by nations against the environment need to be vigorously researched in order
to establish a global consensus of the definition of crime and punishment in this very broad area
of criminology. This study has focused on three distinct criminological theories that can be
applied to corporate environmental crime on a global scale. The RC and Deterrence theories
have been applied to green violence and explored extensively in the literature by scholars in
green criminology such as Lynch, Michalowski, Stretesky, Burns, Barrett and colleagues. RAT
has shown itself to be an equally viable explanation for corporate malfeasance and further

116
research using this criminological premise is warranted for questions regarding the crime and
punishments for environmental injustice, including the environmental crime committed by
TECO and those of similar typology.
A broader study of issues concerning environmental racism around CFPPs at Big Bend,
and a broader study of the CFPPs in Florida that have the same megawatt capacity or higher,
would be a contribution to the environmental justice literature. Are the demographics in these
areas the same as those at Big Bend, or are there significant differences between them? The
comparison would provide a clearer picture of possible environmental racism and injustices to
communities around a CFPP such as Big Bend. Future studies could expand the five-mile radius
to a 10, 15 or even 30 miles radius to investigate environmental injustices to a broader spectrum
of communities. Additionally, further research on impacts to minorities, or the impoverished of
these communities to determine specific instances of environmental racism could be explored.
Future research on the complete CWA profile at the Big Bend facility would provide a
wider profile of ecological harm to human and non-humans. More information on groundwater
contamination and the potential for pollutants to enter the drinking water supply of the
communities within the five mile radius would provide more information to environmentalists
who study environmental justice and corporate malfeasance. Many rural communities rely on
well water, which can be contaminated by groundwater pollutants and further effect the health
and welfare of the inhabitants. Research into specific contaminants found in the drinking water
supply that are in areas surrounding CFPPs such as Big Bend would be advantageous for the
completion of the larger environmental justice picture.
In conclusion, this study of Big Bend revealed many inconsistencies in regulation and
oversight of this facility. In order for the inhabitants of these communities to receive proper

117
environmental protection, an immediate, decisive response from EPA and FDEP is necessary.
When infractions occur, penalties should be assessed and fines paid in accordance with the law.
Until then, communities surrounding Big Bend will continue to pay the price in poor health,
morbidity rates, and a declining ecosystem. Researching this case found no grassroots or
environmental organizations directly involved in the investigation of either environmental
injustices or environmental racism in the affected communities that surround Big Bend.
Suggestions for future research include a focus on community activism that promotes a dialogue
between TECO and the affected communities. A study on the direct impacts of HAPs produced
at Big Bend on the wildlife in the area, particularly the manatee population, coupled with
wildlife in the new Conservation Center is warranted. Baxter and Jack (2008) said, “...the case
study is an excellent opportunity to gain tremendous insight into a case...enables the researcher
to gather data...to illuminate the case.” I could not agree more with this statement, with respect
to the study of TECO’s Big Bend utility plant. The businesses, property owners, homeowners,
and the general public surrounding Big Bend have a right to know exactly what is in the air and
water of their community.

118
REFERENCES
Abel, T. D. (2008). Skewed Riskscapes and Environmental Injustice: A Case Study of
Metropolitan St. Louis, Environmental Management, 42, 232-248.
doi:10.1007/s00267-008-9126-2
Abresist Corporation, Urbana, IN & Tampa Electric Company, Tampa, FL. (2013). Basalt lined
Abrasion Resistant Pipes from Abresist Save Utility Ten Years of Annual Maintenance
Costs. Kalenborn Wear Protection Solutions. Retrieved September 11, 2014, from
albresist.com: http://www.abresist.com/CaseHistories/TampaElectric.htm
Ahmed, M. S., & Bibi, S. (2010). Uptake and Bioaccumulation of Water Borne Lead (Pb) in the
Fingerlings of a Freshwater Cyprinid, Catla, Catla L. Journal of Animal and Plant
Science, 20, 201-207.
American Lung Association. (2011). Recommendation of Medical Community on Mercury
emissions. Retrieved Spetember 11, 2014, from www.lung.org: http://www.lung.org/get-
involved/advocate/advocacy-documents/epa-mercury-other-health.pdf
American Lung Association. (2011). Toxic Air: The Case for Cleaning Up Coal-fired Power
Plants. Retrieved September 11, 2014, from
http://www.lung.org/assets/documents/healthy-air-toxic-air-report.pdf
American Lung Association. (2011). Toxic Air: Supplemental Table of Electric Generating Coal
Fired Power Plants. [Supplement to Toxic Air: The Case for Cleaning Up Coal-fired
Power Plants], Retrieved September 11, 2014, from
http://www.lung.org/assets/documents/healthy-air/supplemental-table-of-power.pdf
119
Aurora Lights Appalachian Mountaintop Removal. (2015). Public Health & Coal Slurry.
Retrieved March 31, 2015, from auroralights.org:
http://auroralights.org/map_project/theme.php?theme-prenter&a
Ayers, R. E., & Olson, J. L. (2011). Setting National Ambient Air Quality Standards in the Clean
Air Act Handbook. USEPA. Domike & Zacaroli (Eds).
Babbitt, C., & Lindner, A. S. (2008). A Life Cycle Comparison of Disposal and Beneficial Use
of Coal Combustion Products in Florida. Part 1: Methodology and Inventory of Materials,
Energy, and Emissions. Int J LCA , 13 (3), 202-211. DOI:
http://dx.doi.org/10.1065/lca2007.07.353
Barber, D. (2009, April 22). Powering the Sunshine State. Retrieved December 2, 2014, from
http://www.followthemoney.org/research/institute-reports/powering-the-sunshine- state/
Barbosa, F., Tanus-Santos, J. E., Gerlach, R. F., & Parsons, P. J. (2005). A Critical Review of
Biomarkers Used for Monitoring Human Exposure to Lead: Advantages, Limitations, and
Future Needs. Environmental Health Perspectives , 113 (12), 1669-1674.
Bartz, R.S., TECO, Hoornaert, P.G., & Massa, A.N., Sargent & Lundy, LLC. (2010, March 1).
big-bends-multi-unit-scr-retrofit. Powermag.com Retrieved September 11, 2014, from
http://.powermag.com/big-bends-multi-unit-scr-retrofit/.
Baxter, P., & Jack, S. (2008). Qualitative Case Study Methodology: Study Design and
Implementation for Novice Researchers. The Qualitative Report , 13 (14), 544-559.
Birnbaum, L. S. (1995). Developmental Effects of Dioxins. [Supplement 7: Estrogens in the
Environment] Environmental Health Perspectives, 103, 89-94.
Biswas, P., & Wu, C. Y. (2005). Nanoparticles and the Environment. Journal of Air & Waste
Management Association , 55, 708-746.

120
Borcherding, J. A., Chen, H., Caraballo, J. C., Baltrusaitis, J., Pezzulo, A. A., Zabner, J., et al.
(2013). Coal Fly Ash Impairs Airway Antimicrobial Peptides and Increases Bacterial
Growth. (I. D. Olivier Neyrolles, Ed.) PLoS ONE , 8 (2): e57673.
doi:10.1371/journal.pone/005673
Bradbury, J., & Hansen, S. (2011, April 19). Myths and Facts about US EPA Standards.
Retrieved April 2015, from http://www.wri.org/blog/2011/04/myths-and-facts-about-us-
epa-standards-0
Brickey, K. (2008). Environmental Crime: Law, Policy, Prosecution. New York, NY:
Aspen Publishing.
Brown, T., Smith, D. N., Hargis Jr., R. A., & O'Dowd, W. J. (1999). Mercury Measurement and
Its Control: What We Know, Have Learned, and Need to Further Investigate. Journal of
the Air & Waste Management Association , 49 (6), 628-640.
doi:10.1080/10473289.10463844
Browne, R. A., & Lutz, D. (2010). Lake Ecosystem Effects Associated with Top-Predator
Removal Due to Selenium Toxicity. Hydrobiologia , 655, 137-148.
Bull, P. (Producer), Goodell, J. (Writer), & Bull, P. (Director). (2011). Dirty Business: Clean
Coal and the Battle for our Energy Future [Motion Picture]. United States of America.
Bullard, R. D. (2002). Confronting Environmental Racism in the Twenty-First Century.
Retrieved February 2015, from http://www.worlddialogue.org/content.php?id=179
Cantrell, M. A., Brye, K. R., Miller, D. M., Mason, E., & Fairey, J. (2014). Extraction
Characteristics of Selenium as Affected by Coal Fly Ash Type, Water Extractant, and
Extraction Time. Journal of Environmenal Protection , 5, 1126-1144.
http://dx.doi.org/10.4236/jep.2014.512111
121
Carcinogen. (n.) In American Heritage medical dictionary online (2007 ed.). Retrieved April
2015, from http://medical-dictionary.thefreedictionary.com/carcinogen
Chambliss, W. & Haas A.Y. (2012). Criminology: Connecting Theory, Research & Practice.
New York, NY: McGraw-Hill Companies, Inc.
Cid, N., Ibanez, C., Palanques, A., & Prat, N. (2010). Patterns of Metal Bioaccumulation in Two
Filter-Feeding Macroinvertebrates: Exposure Distribution, Inter-Species Differences and
Variability across Developmental StagesDifferences. Scientific Total Environment , 408,
2795-2806.
Clarke, R. W., Couli, B., Reinisch, U., Catalano, P., Killingsworth, C. R., & Koutrakis, P.
(2000). Inhaled concentrated ambient particles are associated with meatologic and
bronchoalveolar lavage changes in canines. Environmental Health Perspectives , 108,
1179-1187.
Clean Air Task Force. (2010). The Toll from Coal: An updated Assessment of Death and
Disease from America's Dirtiest Energy Source. Retrieved September 2014, from
http://www.catf.us/resources/publications/files/The_Toll_from_Coal.pdf
Clean Water Action Florida. (2012). Big Bend Power Station; A Waste Profite of Coal Ash.
Clean water.org. Retrieved 2014, from
http://cleanwater.org/files/[email protected]/Big%20Bend%20Coal%20Ash%20Wa
ste%20Profile%20Clean%20Water%20Action%202012.pdf
Cloran, C. E., Burton, G. A., Hammerschmidt, C. R., Taulbee, W. K., Custer, K. W., &
Bowman, K. L. (2010). Effects of Suspended Solids and Dissolved Organic Carbon on
Nickel Toxicity. Environmental Toxicological Chemicals , 29, 1781-1787.

122
Cole, L., & Foster, S. R. (2001). From the ground up: Environmental racism and the rise of the
environmental justice movement. New York, NY: University Press.
Cordiano, V. (2011). Review of Coal Combustion Residual Storage and Disposal Processes of
the Florida Electric Industry. Florida Public Service Commission and the Office of
Auditing and Performance Analysis. Retrieved September 2014, from
http://www.psc.state.fl.us/publications/pdf/electricgas/ReviewCoal_2011.pdf
Cresswell, J. W. (2005). Qualitative research design: An interactive approach (2nd Ed.)
Thousand Oaks, CA: Sage Publications.
Cressy, D.R. (1995). The Poverty of Theory in Corporate Crime Research. In Lauder, S.L. &
Adler, F. (Eds.), Advances in Criminological Theory, Chapter 3. Retrieved from
https://books.google.com/books?id=RJ7PftMXx2oC&printsec=frontcover&
source=gbs_ge_summary_r&cad=0#v=onepage&q&f=false
Dantzker, M. L., & Hunter, R. (2012). Research Methods for Criminology and Criminal Justice
(3rd ed). Sudburry, Masachusetts: Jones and Bartlett Learning, LLC.
Daus, B., Weiss, H., & Altenburger, R. (2010). Uptake and Toxicity of Hexafluroroarsenate in
Aquatic Organisms. Chemosphere , 78, 307-312.
Delfino, R. J., Sioutas, C., & Malik, S. (2005). Potential Role of Ultrafine Particles in
Associations between Airborne Particle Mass and Cardiovascular Health. Environmental
Health Perspectives , 113 (8), 934-946. Assessed: February 24, 2015
Delmas, M., Russo, M. V., & Montes-Sancho, M. J. (2007). Deregulation and Environmental
Differentiation in the Electric Utility Industry. Strategic Management Journal , 28 (2),
189-209.

123
Devi, J. J., Gupta, T., Jat, R., & Tripathi, S. N. (2012). Measurement of personal and integrated
exposure to particulate matter and co-pollutant gasses. Environmental Science Pollution
Resources , 20, 1632-1648. doi:10.1007/s11356-012-1179-3
Dewberry & Davis, LLC. (2011, December). Coal Combustion Residue Impoundment Round 9-
Dam Assessment Report. Retrieved January 2015, from
http://www.epa.gov/wastes/nonhaz/industrial/special/fossil/surveys2/
te_big_bend_final.pdf
Dockery, D., Pope, A., Xu, X., Spengler, J., Ware, J., Fay, M., et al. (1993). An Association
between air pollution and mortality in six U.S. cities. New England Journal of Medicine ,
329 (24), 1753-1759.
Dodge, P. R. (2011). Managing school behavior: a qualitative case study (Doctoral
Dissertation). Available from Iowa State University Digital Repository.
EarthJustice. (2012, August). Florida and Coal Ash: Disposal, Contamination, and Inadequate
Regulation. earthjustice.org. Retrieved September 2014, from
http://earthjustice.org/sites/default/files/fl-coal-ash-factsheet-0812.pdf
Earthjustice; Clean Air Task Force;. (2008). Comments on the U.S. Environmental Protection
Agency's Coal Combusion Waste Damage Case Assessment (July 2007). Retrieved
March 31, 2015, from
http:/www.catf.us/resources/filings/power_plant_wate_NODA082907_Appendix_C_EP
A_s_ Damage_Case_Assesssment_Contamination_Ignored.pdf
Energy Information Administrataion. (2015). Frequently Asked Questions. Retrieved December
2014, from http://ww.eia.gov/tools/faqs
124
Environmental Health and Engineering. (2011). Emissions of Hazardous Air Pollutants from
Coal-fired Power Plants. Retrieved September 2014, from http://www.lung.org/healthy-
air/outdoor/resources/toxic-air-report/
Environmental Integrity Project. (2007). Dirty Killowatts: America's Most Polluting Power
Plants. Retrieved September 2014, from
http://www.dirtykilowatts.org.dirty_killowatts2007.pdf
Environmental Integrity Project. (2011). America's Top Pwer Plant Toxic Air Polluters.
Retrieved September 2014, from http://environmentalintegrity.org/documents/Report-
TopUSPowerPlantToxicAirPolluters.pdf
Environmental Justice Network. (2015). Environmental Justice/Environmental Racism.
Retrieved May 2015, from http://www.ejnet.org/ej/
Environmental Protection Agency. (1995). AP-42, Chapter 11.10: Coal Cleaning. Retrieved
March 2014, from http://www.epa.gov/ttnchie1/ap42/ch11/final/c11s10.pdf
Environmental Protection Agency. (1997). Notice of Violation - Tampa Electric Company.
Retrieved September 11, 2014, from
http://www2.epa.gov/sites/production/files/documents/nov-coal-teco.pdf
Environmental Protection Agency. (1999). Civil Complaint against Tampa Electric Company.
Retrieved September 11, 2014,
fromhttp://www2.epa.gov/sites/production/files/documents/tecocp.pdf
Environmental Protection Agency. (2000). U.S. Settles Landmark Clean Air Act Case Against
Utility Company. Retrieved September 2014, from
http://ww.justice.gov/archive/opa/pr/2000/February/085enrd.htm.

125
Environmental Protection Agency. (2009). Water: Drinking Water Contaminants. Retrieved
February 25, 2015, from http://water.epa.gov/drink/contaminants/index.cfm
Environmental Protection Agency. (2014). By the Numbers - Cutting Caron Pollution from
Power Plants. Retrieved February 2015, from
http://www2.epa.gov/sites/productions/files/2014-06/documents/20140602fs-
important-numbers-clean-power-plan.pdf
Environmental Protection Agency. (2014). Common Air Pollutants. Retrieved September 2014,
from http://epa.gov/oaqps001/urbanair/index.html
Environmental Protection Agency. (2014). Environmental Justice. Retrieved March 2015, from
http://www.epa.gov/environmentaljustice/plan-ej/
Environmental Protection Agency. (2014). Environmental Protection Agency Green Book:
Counties designated non-attainment. Retrieved September 2014, from
http://www.epa.gov/airquality/greenbook/mapnpoll.html.
Environmental Protection Agency. (2014). Overview of the Clean Power Plan. Retrieved
February 2015, from http://www2.epa.gov/sites/productions/files/2014-
05/documents/20140602fs-overview.pdf Environmental Protection Agency. (2015).
Clear Protection for Clean Water. Retrieved March 2015, from http://www.epa.gov/
Environmental Protection Agency. (2015). EJ View. Retrieved March 2015, from
http://epamap14.epa.gov/ejmap/ejmap.aspx
Environmental Protection Agency. (2015). EnvironFacts Report Big Bend. Retrieved
March 11, 2015, from
http://oaspub.epa.gov/enviro/tris_control.tris_print?tris_id=33572TMPLC13031

126
Environmental Protection Agency. (2015). History of the EPA. Retrieved May 2015, from
http://www2.epa.gov/aboutepa/epa-history
Environmental Protection Agency. (2015). Toxic Release Inventory, hazardous pollutants.
Retrieved March 2015, from http://epa.gov/toxic-release-inventory-tri-program/tri-listed
chemicals
Environmental Protection Agency Enforcement and Compliance History Online. (2014).
Detailed Facility Report, Big Bend. Retrieved December 2, 2014, from
http://echo.epa.gov/detailed- facility-report?fid=110008319505
Environmental Working Group. (1997). New Clean Air Standards are No Sweat in Florida.
Retrieved September 2014, from http://static.ewg.org/reports/1997/New-Clean-Air-
Standards-Are-No-Sweat-in-Florida.pdf?_ga=1.1.48070071.143114383.1433192448
Everglades Earth First! (2012, August 31). Earth First! Blockades TECO Coal Plant at RNC in
Tampa. Retrieved September 2014, from
https://earthfirstnews.wordpress.com/2012/08/31/earth-first-blockades-coal-plant-at-
rnc-in-tampa/#more-10126
Ewall, Esq., M. (2012). Legal Tools for Environmental Equity vs. Environmental Justice.
Sustainable Development Law & Policy , XIII (1), 4-13.
Fennell, D. (1994). Cost and Quality of Fuels for Electric Utility Plants. Upland, PA:
Diane Publishing Company.
Fernandez, A., Davis, S. B., Wendt, J., Cenni, R., Young, R. S., & Witten, M. L.
(2001, February 22). Particulate emission from biomass combustion. Nature , 409,
p. 998.
127
Finkelman, R. B. (2007). Health Impacts of Coal: Facts and Fallacies. AMBIO: A Journal of the
Human Enviornment , 36 (1), 103-106. doi:http://dx.doi.org/10.1579/0044-
7447(2007)361103:HloCFAJ2.0.CO;2
Fisher, B. E. (1999). Most Unwanted . Environmental Health Perspectives , 107 (1), A18-A23.
Assessed February 24, 2015, http://www.jstor.org/stable/3434279
Flashratings, Oil and Gas Investment. (2015). Flashratings for Tampa Electric Compamy (TE).
Retrieved May 2015, from http://www.flashratings.com/stocks/5638-TE
Flocculant (n.) In Merriam-Webster Dictionary. (2003). Retrieved 2015, from
http://www.merriam-webster.com/dictionary/flocculent
Florida Clean Power Coalition. (1997). Florida's Dirty Dinosaurs. Retrieved September 11,
2014, from http://www.fcan.org/Clean_Air/dirty_dinosaurs.htm.
Florida Consumer Action Network. (2014). Florida Clean Power Coalition fights for Clean Air.
Retrieved September 2014, from
http://www.fcan.org/Clean_Air/fcan_clean_air_page.php
Florida Department of Environmental Protection. (1980, August). Site Certification Application,
Unit 4. Retrieved September 2014, from
http://publicfiles.dep.state.fl.us/Siting/Outgoing/Web/Biig_Bend/SCA/
TECO/_BB_SCA.pdf
Florida Department of Environmental Protection. (2012). Florida TMDL for the State of Florida.
Retrieved September 2014, from
http://www.dep.state.fl.us/water/tmdl/docs/tmdls/mercury/Mercury-TMDL.pdf

128
Florida Department of Environmental Protection. (2013, Juy 23). Conditions of Certification -
Big Bend Utility Plant. Retrieved September 11, 2014, from
http://publicfiles.dep.state.fl.us/Siting/Outgoing/Web/Certification/pa79_12_2013_R.pdf
Florida Department of Environmental Protection. (2014). Emissions Inventory: descriptions and
definitions. Retrieved September 2014, from
http://www.dep.state.fl.us/air/emission/inventory.htm
Florida Department of Environmental Protection. (2015, May 21). Big Bend Power Station State
Facility Documents. Retrieved May 21, 2015, from
http://dep.state.fl.us/siting/certified_facilities_map/power_plants/SWD/big_bend.htm
Florida Department of Health. (2011). Hillsborough County Health Department 2010/2011
Community Health Profile. Retrieved March 11, 2015, from
http://www.floridahealth.gov/provider-and-partner-resources/community-
partnerships/floridamapp/state-and-community-reports/hillsborough-
county/_documents/hillsborough-cha.pdf
Florida Public Service Commission. (2000, October 5). TECO request for ECRC. Retrieved
February 25, 2015, from
http://www.psc.state.fl.us/library/FILINGS/00/12649-00/12649-00.pdf
Franz, A. (2011). Crimes against water: The non-enforcement of state water pollution laws.
Crime, Law and Social Change , 56 (27).
FWS North Florida Ecological Services Office. (2015). Fish & Wildlife Services, Manatees of
North Florida. Retrieved January 2015, from
http://www.fws.gov.northflorida/Manatee/manatee-gen-facts.htm

129
Galbreath, K., Schulz, R. L., Toman, D., Nyberg, C., Huggins, F. E., Huffman, G. P., et al.
(2005). Nickel and Sulfur Speciation of Residual Oil Fly Ashes from Two Electric Utility
Steam-Generating Units. Journal of the Air & Wate Management Association , 55 (3),
309-318. Retreived from http://dx.doi.org/10.1080/1043289.2005.10464626
Genotoxic (n.) In Medical Dictionary (2007). Retrieved April 2015, from http://medical-
dictionary.thefreedictionary.com/genotoxic
Genotoxin (n.) In Farlex Partner Medical Dictionary (2012). Retrieved April 2015, from
http://medical-dictionary.thefreedictionary.com/genotoxin
Gilmour, M. I., O'Connor, S., Dick, C. A., Miller, C. A., & Linak, W. P. (2004). Differential
Pulmonary Inflammation and in Vitro Cytotoxicity of Size-Fractionated Fly Ash Particles
from Pulverized Coal Combusion. Journal of the Air & Waste Management Association ,
54 (3), 286-295. doi: 10.1080/10473289.2004.10470906
Gonzalez, T., & Saarman, G. (2014). Regulating Pollutants, Negative externalities, and Good
Neighbor Agreements: Who Bears the Burden of Protecting Communities? Ecology Law
Quarterly , 41 (37), 37-80.
Goodell, J. (2010, November 29). The Dark Lord of Coal Country. Rolling Stone Magazine .
Gordin, P. (2006). An instrumental case study of the phenomenon of collaboration in the process
of improving community college developmental reading and writing instruction
(Doctoral Dissertation). Retrieved from University of South Florida Scholar Commons
Gore, A. (2009). Our Choice: A Plan to Solve the Climate Crisis. Emmaus, PA: Rodale, Incl.
Green, M., & Berry, J. F. (1985). White Collar Crime is BIG Business. The Nation , 240,
689-795.

130
Gypsum Association. (2015). What is Gypsum? Retrieved March 2015, from
http://www.gypsum.org/about/gypsum-101/what-is-gypsum/
Hagan, F. (2014). Research Methods in Criminla Justice and Criminology (Ninth Edition ed.).
Upper Saddle River, New Jersey: Pearson Education Inc.
Harder, A., & Kendall, B. (2014). Supreme Court to Review EPA Rule on Power Plant
Emissions. Retrieved September 2014, from http://online.wsj.com/articles/supreme-court-
to-review-epa-rule-on-power-plant-emissions-1416942022
Harmon, S. M., & Wiley, F. E. (2011). Effects of Pollution on Freshwater Organisms. Water
Environment Research , 83 (10), 1733-1788.
Hillsborough County Sheriff's Office. (2011). Annual Report. Retrieved April 2015, from
www.hcso.tampa.fl.us: https://www.google.com/webhp?sourceid=chrome-
instant&ion=1&espv=2&ie=UTF-
8#q=hillsborough%20county%20sheriff%20office%20annual%20report%202011
Hussain, J., Ullah, R., Rehman, N., Khan, A. L., Muhammad, Z., Khan, F., et al. (2010).
Endogenous transitional metal and proximate analysis of selected medicinal plants from
Pakistan. Journal of Medicinal Plants Research , 4 (3), 267-270. Retrieved from
http://www.academic journals.org/JMPR
Independent Science News. (2014, June 9). How EPA Faked the Entire Science of Sewage
Sludge Safety: A Whitstleblower's Story. Retrieved April 2015, from
http:/www.independentsciencenews.org/health/how-epa-faked-the-science-of sewage-
sludge-safety-a-whistleblowers-story/

131
Insidegov.com. (2015). Tampa Electric Company in Tampa FL., Contracting Profile. Retrieved
March 2015, from http://government-contractors.insidegov.com/l/362914/Tampa-
Electric-Company-in-Tampa-FL
International Energy Coal Generation Facilities. (1996). Coal Fired Power Generation.
Retrieved September 2014, from http://www.rst2.edu/ties/acidrain/IEcoal/how.htm
Jardine, C., Predy, G., & MacKenzie, A. (2007). Stakeholder Participation in Investigating the
Health Impacts from Coal-Fired Power Generating Stations in Alberta, Canada. Journal
of Risk Research , 10 (5), 693-714. doi:.org/10.1080/13669870701447956
Jones, K., & Ozaeta, M. (2014). Regulation of carbon emissions for existing power plants under
the Clean Air Act S 111. Retrieved September 2014, from
http://vjel.vermontlaw.edu/topten/regulation-carbon-emissions-existing-power-plants-
clean-air-act-%C2%A7-111
Klas, M. (2011, July 20). Dirty air: Florida ranks third worst for power plant generated toxic
air. Retrieved September 11, 2014, from http://www.tampabay.com/blogs/the-buzz-
florida-politics/content/dirty-air-florida-ranks-third-worst-power-plant-generated-toxic-
air
Kramer, R. C. (1984). Corporate Criminality: the Development of an Idea. In E. Hochstedler,
Corporations as Criminals. Beverly Hills, CA: Sage.
Kubrin, C., Stucky, T., & Krohn, M. (2009). Researching Theories of Crime and Deviance.
New York, NY: Oxford University Press, Inc.
Laden, F., Neas , L. M., Dockery, D. W., & Schwartz, J. (2000). Association of fine particuate
matter from different sources with daily mortality in six US cities. Environmental Health
Perspectives , 108, 941-947.
132
Laney, A. S., & Weissman, D. N. (2014). Respiratory Diseases Caused by Coal Mine Dust.
Journal of Occupational Health and Environmental Medicine, 56 (10S), S18-S22.
Lavelle, M., & Coyle, M. (1992). The National Law Journal , 15 (2).
Levy, J. I., & Spengler, J. D. (2002). Modeling the benefits of power plant emissions controls in
Massachusetts. Journal of the Air and Waste Management Association , 52, 5-18.
Long, M., Stretesky, P., Lynch, M. J., & Fenwick, E. (2012). Crime in the Coal Industry:
Implications for Green Criminology and Treadmill of Production. Organization &
Environment , 25 (3), 328-346.
Lynch, M. J. (1990). The greening of criminology: A perspective for the 1990s. The Critical
Criminologist , 2 (3), 3-4, 11-12.
Lynch, M. J., & Barrett, K. L. (2015). Death Matters: Victimization by Particle Matter from
Coal Fired Power Plants in the US, a Green Criminological Viewpoint. Green
Criminology
Lynch, M. J., & Michalowski, R. (2006). A Primer in Radical Criminology (4th ed.) Monsey,
NY: Criminal Justice Press.
Lynch, M. J., & Michalowski, R. (2010). Primer in Radical Criminology (4th ed.) Boulder,
Colorado: Lynne Rienner Publishers, Inc.
Lynch, M. J., & Stretesky, P. B. (2013). The Distribution of Water-Monitoring Organizations
Across States: Implications for Community Policing. Policing: An International Journal
of Police Strategies and Management , 36 (1), 6-26.
Lynch, M. J., Burns, R. G., & Stretesky, P. B. (2008). Environmental Law, Crime and Justice.
New York, NY: LFB Scholarly.

133
Lynch, M. J., Burns, R. G., & Stretesky, P. (2014). Environmental Law, Crime, and Justice
(2nd ed.) LFB Scholarly Publishing LLC.
Lynch, M. J., Long, M. A., Barrett, K. L., & Stretesky, P. B. (2013). Is it a Crime to Produce
Ecological Disorganization? Why Green Criminology and Political Economy Matter in
the Analysis of Global Ecological Harms. British Journal of Criminology , 55 (6), 997-
1016.
Lynch, M. J., McGurrin, D., & Fenwick, M. (2004). Disappearing act: The representation of
corporate crime research in criminological literature. Journal of Criminal Justice , 32 (5),
389-398.
Lynch, M. J., Patterson, E. B., & Childs, K. (2010). Racial Divide: Racial and Ethnic Bias in the
Criminal Justice System. Boulder, Colorado: Lynne Rienner Publishers, Inc.
Lynch, M. J., Stretesky, P. B., & Burns, R. G. (2004a). Determinants of Enviornmental Law
Violation Fines Against Oil Refineries: Race, Ethnicity, Income and Aggregation Effects.
Society and Natural Resources , 17 (4), 333-347.
Lynch, M. J., Stretesky , P. B., & Burns, R. G. (2004b). Slipperty Business: Race, Class and
Legal Determinants of Penalties Against Petroleum Refineries. Journal of Black Studies,
34 (3), 421-440.
McQueen, A. D., Johnson, B. M., Rodgers, J. H., & English, W. R. (2010). Campus Parking Lot
Stormwater Runoff: Physicochemical Analyses and Toxicity Tests Using Ceriodaphnia
dubia and Pimephales promelas. Chemosphere , 79, 561-569.
Meng, Q. (2014). Adding Fuel to the Flames: Why EPA's New Source Review Progam Under
The Clean Air Act Exacerbates Lead Pollution in Lead NonAttainment Areas.
Vermont Journal of Environmental Law , 16, 121-151.
134
Michalowski, R. J. (1985). Law, Order and Power. New York, NY: Random House.
Michalowski, R. J. and Kramer, R. C. (2007) State-Corporate Crime and Criminological Inquiry.
In Pontell, H. N. and Geis, G. (Eds.) International Handbook of White-Collar and
Corporate Crime (pp. 200-219). doi: 10.1007/987-0-387-34111-8_10.
NAACP; IEN; LVEJO;. (2012). Coal Blooded: Putting Profits Before People. Retrieved March
2015, from http://www.naacp.org/page/-/Climate/CoalBlooded.pdf
National Research Council (2010). Verifying Greenhouse Gas Emissions, Report in Brief.
earthandlife, December 8, 2010 for NAC. Retrieved from http://www.scribd.com/
doc/44923364/Verifying-Greenhouse-Gas-Emissions-Report-in-Brief
Neurotoxin (n.). In Gale Encyclopedia of Medicine. (2008). Retrieved April 2015, from
http://medical-dictionary.thefreedictionary.com/neurotoxin
Nijhuis, M. (2014, April). Can Coal Ever Be Clean? Retrieved October 17, 2014, from
http:/ngm.national.geographic.com/2014/04/coal/nijhuis-text.
Ohio Valley Environmental Coalition (2015). What is Coal Slurry? sludgesafety.org
Retrieved March 31, 2015, from http://sludgesafety.org/what-coal-slurry
Openjurist.org. (1990). Wisconsin Electric Company v Reilly. Retrieved September 2014, from
http://openjurist.org/893/f2d/901
Opensecrets.org. (2014). Oil & Gas Contributions. Retrieved September 2014, from
http://opernsecrets.org/industries/indus.php?ind=E01.
Osnos, E. (2014, April 7). Chemical Valley; The coal industry, the politicians, and the big spill.
The New Yorker Magazine .
Paternoster, R., & Simpson, S. (1996). Sanction Threats and Appeals to Morality: Testing a
Rational Choice Model of Corporate Crime. Law and Society Reivew , 30, 549-584.

135
Pereira, C. S., Guilherme, S., Barroso, C. M., Verschaeve, L., Pacheco, M. G., & Mendo, S.
(2010a). Evaluation of DNA Damage Induced by Environmental Exposure to Mercury in
lisa aurata Using the Comet Assay. Arch. Environ. Contam. Toxicol. , 58, 112-122.
Pittman, C. (2014, October 18). Under Scott, Department of Environmental Protection
undergoes drastic change. Retrieved October 22, 2014, from
http://www.tampabay.com/news/environment/under-scott-department-undergoes-
drastic-change
Political Economic Research Institute. (2013). A Toxic Flood: Why We Need Stronger
Regulations to Protect Pubic Health From Industrial Water Pollution. Retrieved
February 2015, from http://documents.foodandwaterwatch.org/doc/
Toxic_Flood.pdf=_ga=1.40061220.708338430.1433188654
Political Economy Research Intitute. (2013). Toxic 100 Index. Retrieved March 2015, from
http://grconnect.com/tox100/2013/index.php?search=yes&database=t1&detail=1&datype
=T&reptype=a&company2=&company1=&parent=TECO&chemfac=fac&advbasic=bas
Potter, G. R. (2010). What is green criminology? Retrieved February 2015, from
http://www.greencriminology.org/monthly/WhatIsGreenCriminology.pdf
Potter, G. R. (2015). What is Green Criminology. Retrieved February 2015, from
http://www.academia.edu/1572519/What_is_Green_Criminology
Ramos, Y. (2013, September 11). Study: Florida Third-Worst for Power Plant Pollution.
Retrieved February 25, 2015, from http://wusfnews.wusf.usf.edu/ost/study-florida-third-
worst-power-plant-pollution
Reiman, J. (1995). The Rich Get Richer and the Poor Get Prison. Boston, MA: Allyn and Bacon.

136
Samet, J. M., Zeger, S., Dominici, F., Curriero, F., Coursac, I., Dockery, D. W., et al. (2000).
The National Morbidity, Mortality, and Air Pollution Study Part II: Morbidity and
Mortality from Air Pollution in the United States. Cambridge, MA: Health Effects
Institute.
Sanchez-Ortiz, J. R., Sarma, S. S., & Nandini, S. (2010). Comparative Population Growth of
Ceriodaphnia dubia and Daphnia pulex (Cladocera) Exposed to Zinc. Journal of
Environmental Science Heal. A. , 45, 37-41.
Shadish, W., Cook, T., & Campbell, D. (2002). Experimental and Quasi-Experimental Designs
for Generalized Causal Inference. Belmont, CA: Wadsworth Cengage Learning.
Shea, K. (2007). Global Climate Change and Children's Health. Pediatrics , 120 (5),
e1359-e1367.
Sludgesafety. (2015). Chemicals Found in Coal Sludge and Slurry. Retrieved March 31, 2015,
from: http://sludgesafety.org/whta-coal-slurry/chemicals-found-coal-sludge-and-slurry
Sludgesafety. (2015). Slurry and Human Health. Retrieved March 31, 2015, from
http://sludgesafety.org/print/what-coal-slurry/slurry-and-human-health
SourceWatch. (2012, August 16). Big Bend Station. Retrieved February 25, 2015, from
http://www.sourcewatch.org/index.php?title=Big_Bend_Station
SourceWatch. (2013, April 25). Coal sludge. Retrieved March 31, 2015, from
http://www.sourcewatch.org/index.php/Coal_sludge
Sporl, R., Maier, J., Belo, L., Shah, K., Stanger, R., Wall, T., et al. (2014). Mercury and SO3
Emission in Oxy-fuel Combusion. Energy Procedia , 63, 386-402.

137
Srivastava, R. K., Miller, C. A., Erickson, C., & Jambhekar, R. (2004). Emission of Sulfur
Trioxide from Coal-Fired Pwer Plants. Journal of the Air & Waste Management
Association, 54 (6), 750-762. doi.org/10.1080/10473289.2004.10470943
Stake, R. (1995). The art of case study research: Perspectives on practice. Thousand Oaks, CA:
Sage Publications.
Stokes IV, S. C., Hood, D. B., Zokovitch, J., & Close, F. T. (2010). Blueprint for
Communicating Risk and Preventing Environmental Injustice. Journal of Health Care
for the Poor and Underserved, 21 (1), 35-52. doi: 10.1353/hpu.0.0234
Stretesky, P. B. (2006). Corporate self-policing and the environment. Criminology , 44, 671-708.
Stretesky, P. B., & Lynch, M. J. (1999). Environmental Justice and Prediction of Distance to
Accidental Chemical Releases in Hillsborough County, Florida. Social Science
Quarterly, 80 (4), 830-846.
Stretesky, P. B., & Lynch, M. J. (2002). Environmental Hazards and School Segregation in
Hillsborough, 1987-1999. The Sociological Quarterly , 43 (4), 553-573.
Stretesky, P. B., & Lynch, M. J. (2009). A Cross-National Study of the Association Between Per
Capita Carbon Dioxide Emissions ad Exports to the United States. Social Science
Research , 38, 239-250.
Stretesky, P. B., & Lynch, M. J. (2009a). Does Self-Policing Reduce Chemical Emissions? A
Further Test of the EPA Self Audit Policy. Social Science Research , 38 (1), 239-250.
Stretesky, P. B., & Lynch, M. J. (2011). Coal Strip Mining, Mountain Top Removal and the
Distribution of Enviornmental Violations Across the United States, 2002-2008.
Landscape Research , 36 (2), 209-230.

138
Stretesky, P., Huss, S., & Lynch, M. J. (2012). Density Dependence and Specialized
Environmental Justice Organizations, 1970-2008. The Social Science Journal , 49 (3),
343-351.
Stretesky, P., Huss, S., Lynch, M. J., Zahran, S., & Childs, R. (2011). The founding of
Environmental Justice Organizations Across US Counties During the 1990s and 2000s:
Civil Rights and Enviornmental Movement Cross Effects. Social Problems , 58 (3),
330-360.
Stretesky, P. B., Long, M. A., & Lynch, M. J. (2013). Does environmental enforcement slow the
treadmill of production? The relationship between large monetary penalties, ecological
disorganization and toxic releases within offending corporations. Journal of Crime and
Justice , 36 (2), 235-249.
Tampa Electric Company. (2014). 2014 Corporate Sustainabiity Report. Retrieved March 2015,
from http://www.tecoenergy.com/files/executivesummary.pdf
Tampa Electric Company. (2015). Big Bend Power Station. Retrieved from
http://www.tampaelectric.com/company/ourpowersystem/powerstations/bigbend/
The Right-To-Know Network. (2013). RCRIS Report on Big Bend. Retrieved February 2015,
from http://www.rtknet.org/db/rcris/rcris.php?reptype=f&handler_id=FLD000654640&
detail= 3&datype=T&database=rcris
Tittle, C., & Poternoster, R. (2000). Social Deviance and Crime: An Organizational and
Theoretical Approach. Los Angeles, CA: Roxbury.
Topping, J. J. (2007). Will Texas and Florida be Decisive Battleground of U.S. Carbon Wars?
Retrieved September 11, 2014, from http://climate.org/topics/national-action/texas-
florida-carbon-wars.html

139
Trigaux, R. (2009, December 21). Did we just wave goodbye to last new Florida Coal Plant?
Retrieved September 11, 2014, from
http://www.tampabay.com/news/business/energy/did-we-just-wave-goodbye-to-last-new-
florida-coal-plant/1060413
Union of Concerned Scientists. (2010). Burning Coal, Burning Cash Florida's Dependence on
Imported Coal. Retrieved September 2014, from
http://www.uscusa.org/burningcoalburningcash
Union of Concerned Scientists. (2010). How Coal Works., How coal is mined. Retrieved
September 2014, from http:/www.ucsusa.org/clean_energy/our-energy-choices/coal-and-
other-fossil-fuels/how-coal-works.html#bf-toc-4
Union of Concerned Scientists, & Lockbaum, D. (2011). The NRC full report 2010. Retrieved
January 2015, from
http://www.ucsusa.org/sites/default/files/legacy/assets/documents/nuclear_power/nrc-
2010-full-report.pdf
US Environmental Protection Agency. (1998). Final guidelines for incorporating environmental
justice concerns in EPA's NEPA compliance analysis. Environmental Protection Agency,
Office of Federal Activitives. Washington, D.C.: Office of Federal Activities.
US Environmental Protection Agency. (2004). Airborne particulate matter. Retrieved January
2015, from http://cfpub.epa.gov/particulate_matter
US Environmental Protection Agency. (2007). Sediment Toxicity Identification Evaluation
(TIE); Phases I, II, and III Guidance Document. Retrieved from http://www.solutions-
project.eu/wp-content/uploads/2014/03/U.S.-EPA-2007.pdf
140
US Environmental Protection Agency. (2009a). Integrated Science Assessment for Particulate
Matter, 2/10/2010. Retrieved January 2015, from
http://www.epa.gov/isa/particulatematter/600/r-08/139F
US Environmental Protection Agency. (2010b). Health Effects of Air Pollution. Retrieved
January 2015, from http://www.epa.gov.oar.caa.Healthslides.pdf
US Environmental Protection Agency. (2011a). National Emissions Standards for Hazardous
Air Pollutants: Industrial, Commercial, and Institutional Boilers and Process Heaters,
EPA-HQ-OAR-2002-0058. Retrieved September 2014, from
http://www.epa.gov/airquality/combustion/docs/20110221majorsourceboilers.pdf
US Environmental Protection Agency. (2011b). Regulatory Impact Analysis: National
Emissions Standards for Hazardous Air Pollutants: Industrial, Commercial, and
Institutional Boilers and Process Heaters,. Retrieved September 2014, from
http://www.epa.gov/airquality/combustion/docs/boilerria20100429.pdf
US Environmental Protection Agency. (2015, February 2015). Summary of Executive Order
12898. Retrieved June 2015, from http://www2.epa.gov/laws-regulations/summary-
executive-order-12898-federal-actions-address-environmental-justice
Velma, V., & Tchounwou, P. B. (2010). Chromium-Induced Biochemical, Genotoxic and
Histopathologic Effects in Liver and Kidney of Goldfish, Carassius auratus. Mutat. Res.-
Gen. Tox. En. , 698, 43-51.
Wang, W. X., & Guan, R. (2010). Subcellular Distribution of Zinc in Daphnia magna and
Implication for Toxicity. Environ. Toxicol. Chem. , 29, 1841-1848.
Whitehouse.gov. (2015). Climate Change and President Obama's Climate Action Plan.
Retrieved March 2015, from https://www.whitehouse.gov/climate-change

141
Wikipedia. (2015, March 2). Coal Preparation Plant. Retrieved March 31, 2015, from
http://en.wikipedia.org/wiki/Coal_preparation_plant
Wikipedia. (2014, May 11). New Source Review. Retrieved September 11, 2014, from
https://en.wikipedia.org/wiki/New_Source_Review
Winger, D., Gray, H. (Producers), & Fox, J. (Director). (2010). Gasland [Motion Picture].
HBO Documentary.
Yin, R. K. (2003). Applications of case study research (2nd ed.). Thousand Oaks, CA:
Sage Publications.
Yin, R. K. (2009). Case study research: Design and methods (4th ed.). Thousand Oaks, CA:
Sage Publications.
142
APPENDICES
Appendix A: Florida Department of Environmental Protection Communication

143
Appendix B: Supplementary Tables
Table B1. Toxic Release Inventory of Big Bend Facility, 2005 - 2013
Chemical Name 2005 2006 2007 2008 2009 2010 2011 2012 2013
AMMONIA 9,958 30,991 104,250
ARSENIC COMPOUNDS 314 610 1,379 1,046 1,007 986 1,044 1,234 867
BARIUM COMPOUNDS 2,515 6,820 16,060 10,720 10,899 10,350 9,680 11,890 10,426
BERYLLIUM COMPOUNDS 89 215 520 366 358 347 338 418 385
CHROMIUM COMPOUNDS(EXCEPT
CHROMITE ORE MINED IN THE TRANSVAAL
REGION)
1,362 3,437 7,643 5,467 5,373 5,205 4,939 6,142 5,452
COBALT COMPOUNDS 323 870 1,930 1,366 1,312 1,246 1,190 1,479 1,440
COPPER COMPOUNDS 1,266 2,050 3,410 2,780 2,748 2,660 2,630 3,137 2,730
DIOXIN AND DIOXIN-LIKE COMPOUNDS 2 2 2 2 2 2 2 2 2
HYDROCHLORIC ACID (1995 AND AFTER ACID
AEROSOLS ONLY)265,427 300,000 270,000 273,488 250,000 260,000 280,000 91,000 133,000
HYDROGEN FLUORIDE 22,782 26,000 23,000 23,474 22,000 23,000 24,000 25,600 24,000
LEAD COMPOUNDS 1,218 2,621 6,322 4,552 4,462 4,332 4,422 5,284 2,051
MANGANESE
MANGANESE COMPOUNDS 2,120 5,400 11,380 7,930 7,978 7,680 7,030 8,930 7,530
MERCURY COMPOUNDS 139 166 160 154 111 93 92 36 42
MOLYBDENUM TRIOXIDE
NAPHTHALENE 59 53 53 50 54 55 56 50
NICKEL COMPOUNDS 3,086 8,170 17,280 12,530 12,180 11,500 10,760 13,479 3,352
NITRIC ACID 0 0
POLYCYCLIC AROMATIC COMPOUNDS
SULFURIC ACID (1994 AND AFTER ACID
AEROSOLS ONLY)866,063 840,000 890,000 1,006,122 850,000 629,484 568,570 157,000 142,000
VANADIUM COMPOUNDS 5,309 14,900 34,700 24,080 24,230 22,770 21,900 27,450 24,600
XYLENE (MIXED ISOMERS) 120 110 110 110 140 120 119 110
ZINC COMPOUNDS 16,939 20,800 33,400 32,100 28,210 30,900 28,600 26,080 10,700
TRI Total Releases and Transfers in Pounds by Chemical and Year, TECO Big Bend Power Station
http://echo.epa.gov/detailed-facility-report?fid=110008319505#TRIinfo

144
Appendix B: Supplementary Tables (continued)
Table B2. National Ambient Air Quality Standards
Primary/Secondary Averaging Time Level Form
8-hour 9 ppm
1-hour 35 ppm
primary 1-hour 100 ppb98th percentile of 1-hour daily maximum
concentrations, averaged over 3 years
primary and secondary Annual 53 ppb (2) Annual Mean
primary and secondary 8-hour 0.075 ppm (3)Annual fourth-highest daily maximum 8-hr
concentration, averaged over 3 years
primary Annual 12 µg/m3 annual mean, averaged over 3 years
secondary Annual 15 µg/m3 annual mean, averaged over 3 years
primary and seondary 24-hour 35 µg/m3 98th percentile, averaged over 3 years
PM10 primary and secondary 24-hour 150 µg/m3 Not to be exceeded more than once per year on
average over 3 years
primary 1-hour 75 ppb (4)99th percentile of 1-hour daily maximum
concentrations, averaged over 3 years
secondary 3-hour 0.5 ppm Not to be exceeded more than once per year
http://www.epa.gov/air/criteria.html
Nitrogen Dioxide
[75 FR 6474, Feb 9, 2010]
[61 FR 52852, Oct 8, 1996]
Ozone
[73 FR 16436, Mar 27, 2008]
Particle Pollution
12/14/2012
PM2.5
Sulfur Dioxide
[75 FR 35520, Jun 22, 2010]
[38 FR 25678, Sept 14, 1973]
(1) Final rule signed October 15, 2008. The 1978 lead standard (1.5 µg/m3 as a quarterly average) remains in effect until one year after an area is designated for the 2008 standard, except that in areas designated nonattainment for the 1978, the
1978 standard remains in effect until implementation plans to attain or maintain the 2008 standard are approved.
(2) The official level of the annual NO2 standard is 0.053 ppm, equal to 53 ppb, which is shown here for the purpose of clearer comparison to the 1-hour standard.
(3) Final rule signed March 12, 2008. The 1997 ozone standard (0.08 ppm, annual fourth-highest daily maximum 8-hour concentration, averaged over 3 years) and related implementation rules remain in place. In 1997, EPA revoked the 1-hour
ozone standard (0.12 ppm, not to be exceeded more than once per year) in all areas, although some areas have continued obligations under that standard (“anti-backsliding”). The 1-hour ozone standard is attained when the expected number of
days per calendar year with maximum hourly average concentrations above 0.12 ppm is less than or equal to 1.
(4) Final rule signed June 2, 2010. The 1971 annual and 24-hour SO2 standards were revoked in that same rulemaking. However, these standards remain in effect until one year after an area is designated for the 2010 standard, except in areas
designated nonattainment for the 1971 standards, where the 1971 standards remain in effect until implementation
EPA has set National Ambient Air Quality Standards for six principal pollutants, which are called "criteria" pollutants. They are listed below. Units of measure for the standards are parts per
million (ppm) by volume, parts per billion (ppb) by volume, and micrograms per cubic meter of air (µg/m3). As of October 2011.
National Ambient Air Quality Standards (NAAQS)
primary Not to be exceeded more than once per yearCarbon Monoxide
[76 FR 54294, Aug 31, 2011]
Pollutant [final rule cite]
primary and secondaryRolling 3 month
average0.15 µg/m3 (1) Not to be exceeded
Lead
[73 FR 66964, Nov 12, 2008]

145
Appendix B: Supplementary Tables (continued)
Table B3. National Health Impacts from Coal Fired Power Plants
http://www.catf.us/resources/publications/files/The_Toll_from_Coal.pdf
Asthma Attacks 217,600 $11
Lost Work Days 1,627,800 $150
Heart Attacks 20,400 $2,230
Chronic Bronchitis 8,000 $3,560
Hospital Admissions 9,700 $230
ER Visits for Asthma 12,300 $5
Health Impact Incidence (Annual) Valuation ($ Millions)
National Power Plant Impacts (2010 est.)
Mortality 13,200 $96,300