takeaway food consumption and its associations with diet quality and abdominal obesity
TRANSCRIPT

BioMed Central
International Journal of Behavioral Nutrition and Physical Activity
ss
Open AcceResearchTakeaway food consumption and its associations with diet quality and abdominal obesity: a cross-sectional study of young adultsKylie J Smith*1, Sarah A McNaughton2, Seana L Gall1, Leigh Blizzard1, Terence Dwyer1,3 and Alison J Venn1Address: 1Menzies Research Institute, University of Tasmania, Hobart Tasmania 7000, Australia, 2Centre for Physical Activity & Nutrition Research, Deakin University, Burwood Victoria 3125, Australia and 3Murdoch Childrens Research Institute, Royal Children's Hospital, Parkville Victoria 3052, Australia
Email: Kylie J Smith* - [email protected]; Sarah A McNaughton - [email protected]; Seana L Gall - [email protected]; Leigh Blizzard - [email protected]; Terence Dwyer - [email protected]; Alison J Venn - [email protected]
* Corresponding author
AbstractBackground: Few studies have investigated the associations of takeaway food consumption with overalldiet quality and abdominal obesity. Young adults are high consumers of takeaway food so we aimed toexamine these associations in a national study of young Australian adults.
Methods: A national sample of 1,277 men and 1,585 women aged 26–36 completed a self-administeredquestionnaire on demographic and lifestyle factors, a 127 item food frequency questionnaire, usual dailyfrequency of fruit and vegetable consumption and usual weekly frequency of takeaway food consumption.Dietary intake was compared with the dietary recommendations from the Australian Guide to HealthyEating. Waist circumference was measured for 1,065 men and 1,129 women. Moderate abdominal obesitywas defined as ≥ 94 cm for men and ≥ 80 cm for women. Prevalence ratios (PR) were calculated using logbinomial regression. Takeaway food consumption was dichotomised, with once a week or less as thereference group.
Results: Consumption of takeaway food twice a week or more was reported by more men (37.9%) thanwomen (17.7%, P < 0.001). Compared with those eating takeaway once a week or less, men eatingtakeaway twice a week or more were significantly more likely to be single, younger, current smokers andspend more time watching TV and sitting, whereas women were more likely to be in the workforce andspend more time watching TV and sitting. Participants eating takeaway food at least twice a week wereless likely (P < 0.05) to meet the dietary recommendation for vegetables, fruit, dairy, extra foods, breadsand cereals (men only), lean meat and alternatives (women only) and overall met significantly fewer dietaryrecommendations (P < 0.001). After adjusting for confounding variables (age, leisure time physical activity,TV viewing and employment status), consuming takeaway food twice a week or more was associated witha 31% higher prevalence of moderate abdominal obesity in men (PR: 1.31; 95% CI: 1.07, 1.61) and a 25%higher prevalence in women (PR: 1.25; 95% CI: 1.04, 1.50).
Conclusion: Eating takeaway food twice a week or more was associated with poorer diet quality and ahigher prevalence of moderate abdominal obesity in young men and women.
Published: 28 May 2009
International Journal of Behavioral Nutrition and Physical Activity 2009, 6:29 doi:10.1186/1479-5868-6-29
Received: 15 October 2008Accepted: 28 May 2009
This article is available from: http://www.ijbnpa.org/content/6/1/29
© 2009 Smith et al; licensee BioMed Central Ltd. This is an Open Access article distributed under the terms of the Creative Commons Attribution License (http://creativecommons.org/licenses/by/2.0), which permits unrestricted use, distribution, and reproduction in any medium, provided the original work is properly cited.
Page 1 of 13(page number not for citation purposes)

International Journal of Behavioral Nutrition and Physical Activity 2009, 6:29 http://www.ijbnpa.org/content/6/1/29
BackgroundConsuming takeaway or fast food is becoming more prev-alent in Australia [1] and around the world [2,3].Although there are no standard definitions, fast food isthe term used in North America and typically includesfood that can be obtained quickly such as burgers, fries,pizza and fried chicken. Takeaway is the common termused in Australia and includes fast food and other "takeout" meal options such as Thai and Indian food. Themajority of previous studies were conducted in the USAand focused on fast food. Although it is known that take-away and fast food consumption is higher in younger agegroups than older age groups [4-9] and consumption offast food has been shown to increase from adolescence toyoung adulthood [10], there is little research focusing onthe correlates of takeaway food consumption in youngadults. Furthermore, the socio-economic and lifestylecharacteristics of individuals eating takeaway food havenot previously been reported separately for men andwomen [4,6-9]. It is important to see if the characteristicsassociated with high takeaway food consumption differbetween men and women and to identify groups that con-sume high levels of takeaway food.
A high frequency of takeaway and fast food consumptionhas been linked to poorer diet quality including a lowerintake of vegetables [5,7,8,11], wholegrains [7], low fatdairy [7] and fruit [7,9,11], a higher intake of total fat andsaturated fat [8,11], sodium [11] and non-diet carbonatedsoft drinks [4]. Although these studies have shown anassociation between takeaway and fast food frequencyand individual foods, food groups or nutrients, only oneprevious study from Spain in 1999 measured overall dietquality [9]. However, in this study, the fast food variableincluded only four items (hamburgers, cheeseburgers, BigMacs and French fries [9]) and excluded other commonforms of takeaway food such as pizza, fried chicken,Indian, Chinese and Thai food.
In addition to poorer diet quality, an association betweentakeaway and fast food consumption and body weight hasbeen reported. The Coronary Artery Risk Development inYoung Adults (CARDIA) study in the USA found partici-pants who ate fast food more than twice a week at baselinein 1985 and at the 15 year follow-up had gained an extra4.5 kg compared with participants who ate fast food lessthan once a week at both time points [7]. In Spain, partic-ipants eating fast food more than once per week had anincreased likelihood of being obese (OR 1.29; P = 0.057)compared with non-consumers [9]. In an Australian studyin 1996, women eating takeaway once per week were 15%less likely to maintain their weight over a four year periodcompared with women who ate takeaway never or nomore than once per month [12].
Most studies examining associations of fast food or takea-way food consumption and obesity have used body massindex (BMI) as a measure of obesity. Waist circumferenceis thought to be a better indicator of cardiovascular dis-ease and type 2 diabetes risk than BMI [13,14] as fat dis-tributed around the waist is more harmful than overallobesity. In addition, young adults with high muscle massmight be misclassified as being overweight when usingBMI, though the proportion misclassified is not known.One previous study investigating Australian adults livingin rural areas during 2001–2003 found no associationbetween high takeaway food consumption and abdomi-nal obesity [15] when using waist circumference as a con-tinuous variable. The authors did not report their findingsusing recommended cut points for waist circumference todefine obesity [16].
The aims of this cross-sectional study of young adults wereto examine the socio-economic and lifestyle factors asso-ciated with takeaway food consumption in men andwomen; and to examine associations of takeaway foodconsumption with diet quality and abdominal obesity.
MethodsParticipantsThe Childhood Determinants of Adult Health (CDAH)Study is a follow-up of children who participated in the1985 Australian Schools Health and Fitness Survey(ASHFS), a nationally representative study of 8,498 chil-dren aged 7–15 years [17].
During 2001–2002 participants were traced through elec-toral rolls, telephone directories, the National DeathIndex and contact with class mates. Of the 6,840 (80%)participants successfully traced, 5,170 (61%) wereenrolled in the CDAH study and invited to complete ques-tionnaires and attend one of 34 study clinics around Aus-tralia for physical measurements. The clinics were held ineach state and territory of Australia during 2004–2006,when the participants were aged 26–36 years. Clinicsinvolved a range of physical assessments includinganthropometric measurements. In total, questionnaireswere completed by 2,881 participants, and 2,410attended study clinics. The number of participants attend-ing clinics was lower than those enrolled in the CDAHstudy largely due to the burden of attending the clinic(approximately three hours of testing) and the distanceneeded to travel.
The study was approved by the Southern Tasmania Healthand Medical Research Ethics Committee and all partici-pants gave informed consent.
Page 2 of 13(page number not for citation purposes)

International Journal of Behavioral Nutrition and Physical Activity 2009, 6:29 http://www.ijbnpa.org/content/6/1/29
Dietary AssessmentFood intakes and habits were measured using a 127 itemfood frequency questionnaire (FFQ) and a food habitsquestionnaire (FHQ). The FFQ asked for the averagenumber of times each food and beverage was consumedover the previous twelve months. For each item partici-pants were asked to choose one of nine response optionsranging from "never or less than once a month" to "six ormore times per day". Daily equivalents were calculated foreach FFQ item, assuming one serve was consumed at eacheating occasion [18,19]. The mid value was used when theresponse option included a range of values and missingitems were given a value of zero. The FFQ was a modifiedversion of one previously used in the 1995 NationalNutrition Survey [19-22] and was based on an existingFFQ developed for Australian populations [23].
The FHQ included questions on takeaway food consump-tion, daily fruit and vegetable consumption, and fre-quency of trimming fat from meat. The takeaway foodquestion asked "How many times per week would youusually eat hot takeaway meals (e.g. pizza, burgers, friedor roast chicken, Chinese/Indian/Thai takeaway)". Partic-ipants could choose one of five answers ranging from "Idon't eat takeaway" to "6–7 meals per week". For analysis,the answers were dichotomised to less than twice per weekor twice a week or more as there were small numbers inthe lowest and the two higher frequency groups. To assessits validity, responses to the takeaway food question werecompared with reported consumption of foods in the FFQthat are commonly eaten as takeaway foods (fried fish,meat pie/sausage roll/other savoury pasties, pizza, ham-burger, hot chips/roast potato/potato wedges).
Daily fruit and vegetable consumption came from the twoshort questions: "how many serves of fruit/vegetables(excluding potatoes) do you usually eat each day". Exam-ples of serving sizes were given and the response optionswere "I don't eat this food", "1 serve or less", "2–3 serves","4–5 serves" or "6 or more serves". These short questionshave been used in previous studies [19,24] and have beenshown to be valid measures for fruit and vegetable intake[25].
Questions from the FHQ and FFQ were used to determineif participants were complying with sex and age-specificrecommendations in the Australian Guide to Healthy Eat-ing (AGHE) [26]. The AGHE has been developed toencourage the public to adopt healthy eating patterns byhighlighting the foods that help meet nutrient recommen-dations and provides two recommended patterns of eat-ing. The recommended eating pattern used in this analysisis the most commonly used and is consistent with publichealth messages that promote consumption of five serv-ings of vegetables and two servings of fruit per day [27].
This eating pattern is also the more conservative of thetwo for vegetables, fruits and dairy for men. The AGHErecommends adults consume the following number ofserves from the five food groups each day: two servings offruit, five servings of vegetables, two servings of dairy, oneserving of lean meat or alternatives and six to twelve serv-ings of breads and cereals for men and four to nine serv-ings of breads and cereals for women.
Foods that do not fit into the five food groups are "extra"foods and are high in fat, salt and sugars and provide veryfew essential nutrients [26]. The AGHE recommends thatthese foods be eaten in small amounts. Examples of extrafoods include ice cream, cream, cakes, sweet pies, desserts,sweet biscuits, chocolate biscuits, savoury pastry, pizza,hamburgers, hot chips, fried fish, chocolate, other confec-tionary, crisps, dressings, mayonnaise, jam, creamy dips,fruit drink, cordial, soft drink and all alcohol. The guide-lines recommend limiting the number of "extra" foods tono more than three servings per day for men and no morethan two and a half servings per day for women. For anal-ysis the extra foods variable was created excluding thetakeaway food items (hamburgers, pizza, hot chips, friedfish and savoury pastry), so that takeaway food itemscould be distinguished separately.
For comparison with the AGHE, information on dailyservings of fruit and vegetables came from the short ques-tions in the FHQ. Daily serves of breads and cereals, dairy,lean meat and alternatives and extra foods were obtainedfrom summing daily equivalents calculated from the FFQ(see Appendix 1 for items included in each food group).For breads and cereals, the lowest recommended valuewas used, and for extra foods participants not exceedingthe upper limit were classified as meeting the recommen-dation. In line with the Dietary Guidelines for AustralianAdults [28] high fat meats were not included in the meatand alternatives food group. However, some meat itemsthat would be considered lean if the visible fat wasremoved were included as lean meats (see Appendix 1) ifparticipants reported in the FHQ that they "usually"trimmed the fat from their meat either before or aftercooking. The analysis of fruit and vegetable intake wasalso repeated using items from the FFQ.
Anthropometric measurementsFor the anthropometric measurements, participants werestanding and dressed in light clothing without shoes. Allmeasurements were made by trained staff. Waist circum-ference was measured in triplicate over light clothing atthe narrowest point between the lower costal border andthe iliac crest, at the end of normal expiration. Measure-ments were taken using a Lufkin steel (non-stretch) tapemeasure and were recorded to the nearest 0.5 cm. Moder-ate abdominal obesity was defined as ≥ 94 cm for men
Page 3 of 13(page number not for citation purposes)

International Journal of Behavioral Nutrition and Physical Activity 2009, 6:29 http://www.ijbnpa.org/content/6/1/29
and ≥ 80 cm for women. These cut points were defined bythe World Health Organization and are associated with anincreased risk of metabolic complications associated withabdominal obesity [16].
Body weight was measured using a Heine portable scale(Heine, Dover, NH, USA) and recorded to the nearest 0.1kg. Height was measured using a portable Leicester stadi-ometer (Invicta, Leicester, UK) and recorded to the nearest0.1 cm. BMI (kg/m2) was calculated from height andweight.
CovariatesDemographic variables included age, sex, education (clas-sified as school only, vocational, university), employmentstatus (working versus not in the workforce) and maritalstatus (married or living as married versus other). Smok-ing was classified based on self report as never, former orcurrent smoker.
The long version of the International Physical ActivityQuestionnaire (IPAQ) [29] was used to assess frequency,duration and intensity of physical activity. Participantswere asked to report the number of days in the previousweek they had done each activity for more than 10 min-utes at a time, and how long they would usually spenddoing each activity. The leisure time physical activity(LTPA) domain was used in the analysis. Weekday andweekend sedentary behaviour over the previous week wasalso estimated using the IPAQ. Participants reported theaverage amount of time they had spent sitting on week-days and weekend days during the previous week. Thisquestion has been shown to have acceptable reproducibil-ity (one week test-retest reliability intraclass correlationrange of 0.74–0.89) and comparative validity (rank corre-lation with one week accelerometer counts range of 0.20– 0.51) [29]. In addition, participants' reported total timespent watching television, videos or DVDs when it was themain activity they were doing. This question has also beenshown to have acceptable reproducibility (one week test-retest intraclass correlation coefficient 0.82) and compar-ative validity (rank correlation with three day sedentarybehaviour log 0.3) [30].
The frequency of consumption of nine alcoholic bever-ages from the FFQ and their average alcohol concentra-tion [31] was used to estimate the number of standarddrinks (10 gram of alcohol) consumed per week.Responses of never or less than once per month weregiven a value of zero. Participants were classified as non-drinkers, drinkers who consume up to 14 drinks per week,or drinkers who consume more than 14 drinks per week.These groups are based on Australian alcohol guidelinesfor low-risk drinking [32].
AnalysisPrevalence ratios estimated using log binomial regressionor Poisson regression with robust standard errors [33]were used to summarise the associations of socio-eco-nomic and lifestyle variables, and moderate abdominalobesity with takeaway food consumption. Analyses wereconducted separately for men and women. Covariatesincluded in the adjusted analyses of obesity and takeawayfood consumption were those that plausibly were causallyrelated to the outcome or were markers of other factorscausally related to the outcome, were not intermediate onthe postulated pathway, and produced at least a 10%change in the parameter estimate for the study factor.They included age, LTPA, television viewing (log trans-formed) and employment status. Continuous variableswere entered into the model as continuous covariates.Additional adjustments for marital status, education,smoking status, alcohol intake and other measures ofphysical activity did not materially alter the results. Inter-actions between takeaway food consumption and othercovariates were assessed by including product terms asadditional covariates.
Chi square analysis was used to examine the associationbetween takeaway food consumption and meeting thedietary recommendations in the AGHE [26].
All statistical analyses were conducted with STATA soft-ware (version 9.2, 2007, Statacorp, College Station,Texas).
ResultsIn total, 2,881 participants answered the dietary question-naires. Nineteen participants did not answer the takeawayfood question and were excluded from all analyses. Theremaining 2,862 participants were included in the analy-sis of socio-demographic and lifestyle factors associatedwith takeaway food consumption. The dietary recommen-dation analysis excluded 78 women who were pregnant atthe time of data collection because different dietary rec-ommendations exist for pregnant women. A further 99participants were excluded from the dietary recommenda-tion analysis because they failed to provide responses to10% or more of the FFQ items (n = 2,685 for analysis).The abdominal obesity analysis was restricted to clinicattendees who had anthropometric measurements andexcluded pregnant women (n = 2,194 for analysis).
The socio-demographic characteristics and anthropomet-ric measurements (for clinic attendees) of 2,862 partici-pants (99.3% of questionnaire respondents) are shown inTable 1. The mean waist circumference (cm) was 89.5 (SD10.6) for men and 78.2 (SD 11.4) for women. Men had amean BMI of 26.5 (SD 4.2) kg/m2, while women had amean BMI of 25.0 (SD 5.2) kg/m2.
Page 4 of 13(page number not for citation purposes)

International Journal of Behavioral Nutrition and Physical Activity 2009, 6:29 http://www.ijbnpa.org/content/6/1/29
While the study sample was derived from a nationally rep-resentative sample of children first measured in 1985,only one third participated in the follow-up in adulthood.Compared with the general Australian population of sim-ilar age (25–34 years) this study sample had a higher pro-portion of participants who were married or living asmarried (57% of men and 64% of women in the generalpopulation [34]), and a higher proportion of profession-als/managers (40% of men and 38% of women in thegeneral population [35]). The proportion of participantswho were classified as overweight or obese (BMI ≥ 25 kg/m2) was similar to the general population (58% of menand 35% of women [36]).
Takeaway food consumptionThe majority of participants (62.1% men and 82.3%women) ate takeaway once a week or less (Figure 1). Menconsumed takeaway more frequently than women, with37.9% of men and 17.7% of women eating takeaway atleast twice a week (P < 0.001).
Our validation analysis showed takeaway food consump-tion from the short question in the FHQ was consistentwith reported consumption of foods that are commonlyeaten as takeaway food in the FFQ. Intake of the takeawaytype foods was higher in participants who reported in theshort question that they ate takeaway twice a week ormore (52.8%, 404/765) than in participants whoreported eating takeaway once a week or less (17.8%, 373/2097).
Takeaway food consumption and socio-economic and lifestyle variablesMen who consumed takeaway at least twice a week weremore likely to be single, younger, current smokers, tospend more time watching TV and to spend more time sit-ting (Additional File 1). Women who consumed takeawayat least twice a week were more likely to be single, in theworkforce, and to spend more time watching TV and sit-ting.
Achieving the dietary recommendationsThe proportions of data that were missing were less than10% in all food groups apart from lean meat and alterna-tives (37%). The proportions of missing data in each foodgroup were not significantly different by takeaway foodconsumption, with the exception of lean meat; those con-suming takeaway twice a week or more had more missingdata (P = 0.043 for men, P = 0.033 for women).
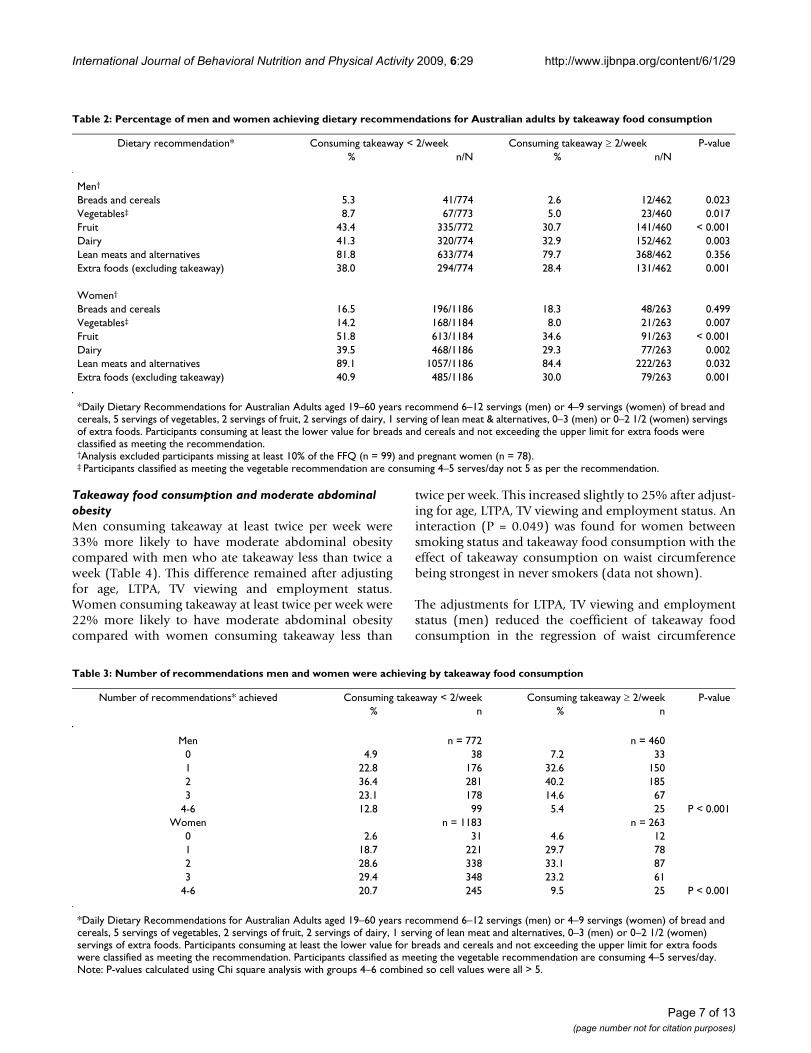
Overall, compliance with the dietary recommendationswas low, except for the lean meat and alternatives recom-mendation. Compliance was generally lower in partici-pants who ate takeaway food more frequently (Table 2).Men who ate takeaway twice a week or more were signifi-cantly less likely to achieve the dietary recommendationsfor breads and cereals, vegetables, fruit, dairy, and extrafoods. A similar result was found for women with thoseeating takeaway twice a week or more being significantlyless likely to achieve the dietary recommendations for veg-etables, fruit, dairy, lean meat and alternatives, and extra
Table 1: Socio-demographic and anthropometric characteristics of participants
Men (n = 1277)* Women (n = 1585)*% n % n
Age (mean, SD) 31.7 2.6 31.6 2.6Married/living as married 66.9 854 72.2 1144Education
University 37.3 475 45.1 714Vocational 35.7 455 26.0 412School only 26.9 343 28.9 457
OccupationProfessional/Manager 57.1 719 49.0 763White collar 7.6 96 26.5 421Blue collar 31.7 399 5.1 79Not in workforce 3.6 45 19.5 303
BMI (kg/m2)†
Normal (< 25 kg/m2) 38.4 409 62.0 701Overweight (25 – 29.9 kg/m2) 45.4 483 23.8 269Obese (≥ 30 kg/m2) 16.2 172 14.2 160
Waist circumference (cm)†
Normal 72.4 771 65.9 744Moderate abdominal obesity‡ 27.6 294 34.1 385
* Sample sizes vary due to missing data (range 1,259 to 1,277 for men, 1,557 to 1,585 for women).† Anthropometric measurements in clinic attendees only and exclude pregnant women (men n = 1,065, women n = 1,129)‡ Moderate abdominal obesity was defined as ≥ 94 cm for men and ≥ 80 cm for women
Page 5 of 13(page number not for citation purposes)

International Journal of Behavioral Nutrition and Physical Activity 2009, 6:29 http://www.ijbnpa.org/content/6/1/29
foods. Overall participants eating takeaway twice a weekor more met fewer of the dietary recommendations (Table3).
When we repeated the fruit and vegetable analysis usingdaily intakes calculated from the FFQ, the intake of vege-tables (men and women) and fruit (men only) was higherthan with the short questions. This meant that a highernumber of participants were classified as meeting theserecommendations. However, the proportion meeting therecommendations remained significantly lower in partic-ipants who ate takeaway more frequently. This is consist-ent with the results using the short questions from theFHQ.
Milk in hot beverages was not included in the main anal-ysis of the dairy food group because doing so could over-estimate dairy intake for people who only add a smallamount of milk to their hot drink. When we includedmilk consumed in hot beverages, we found a greater pro-portion of participants met the recommendations fordairy intake. For men, the difference between the takea-way food groups was no longer significant (71.0% con-
suming takeaway foods once a week or less versus 73.5%consuming takeaway food twice a week or more, P =0.337), whereas, for women, those eating takeaway oncea week or less remained more likely to meet the guidelinescompared with those eating takeaway twice a week ormore (78.4% versus 68.4%, respectively, P = 0.001).
Factors associated with moderate abdominal obesityMen with moderate abdominal obesity were more likelyto be married (P < 0.005), older (P = 0.005) and watchmore TV (P = 0.001). There was a non-linear trend foreducation where men with higher education were morelikely to have moderate abdominal obesity (P < 0.001).Women with moderate abdominal obesity tended to beolder (P = 0.024), less educated (P < 0.001), not in theworkforce (P < 0.001), current smokers (P = 0.018), non-drinkers (P = 0.001), spend more time watching TV (P <0.001), less physically active (P = 0.007), and to havemore children (P = 0.002).
Frequency of takeaway food consumption for men and womenFigure 1Frequency of takeaway food consumption for men and women. Difference between men (n = 1,277) and women (n = 1,585), P < 0.001.
Page 6 of 13(page number not for citation purposes)
International Journal of Behavioral Nutrition and Physical Activity 2009, 6:29 http://www.ijbnpa.org/content/6/1/29
Takeaway food consumption and moderate abdominal obesityMen consuming takeaway at least twice per week were33% more likely to have moderate abdominal obesitycompared with men who ate takeaway less than twice aweek (Table 4). This difference remained after adjustingfor age, LTPA, TV viewing and employment status.Women consuming takeaway at least twice per week were22% more likely to have moderate abdominal obesitycompared with women consuming takeaway less than
twice per week. This increased slightly to 25% after adjust-ing for age, LTPA, TV viewing and employment status. Aninteraction (P = 0.049) was found for women betweensmoking status and takeaway food consumption with theeffect of takeaway consumption on waist circumferencebeing strongest in never smokers (data not shown).
The adjustments for LTPA, TV viewing and employmentstatus (men) reduced the coefficient of takeaway foodconsumption in the regression of waist circumference
Table 2: Percentage of men and women achieving dietary recommendations for Australian adults by takeaway food consumption
Dietary recommendation* Consuming takeaway < 2/week Consuming takeaway ≥ 2/week P-value% n/N % n/N
Men†
Breads and cereals 5.3 41/774 2.6 12/462 0.023Vegetables‡ 8.7 67/773 5.0 23/460 0.017Fruit 43.4 335/772 30.7 141/460 < 0.001Dairy 41.3 320/774 32.9 152/462 0.003Lean meats and alternatives 81.8 633/774 79.7 368/462 0.356Extra foods (excluding takeaway) 38.0 294/774 28.4 131/462 0.001
Women†
Breads and cereals 16.5 196/1186 18.3 48/263 0.499Vegetables‡ 14.2 168/1184 8.0 21/263 0.007Fruit 51.8 613/1184 34.6 91/263 < 0.001Dairy 39.5 468/1186 29.3 77/263 0.002Lean meats and alternatives 89.1 1057/1186 84.4 222/263 0.032Extra foods (excluding takeaway) 40.9 485/1186 30.0 79/263 0.001
*Daily Dietary Recommendations for Australian Adults aged 19–60 years recommend 6–12 servings (men) or 4–9 servings (women) of bread and cereals, 5 servings of vegetables, 2 servings of fruit, 2 servings of dairy, 1 serving of lean meat & alternatives, 0–3 (men) or 0–2 1/2 (women) servings of extra foods. Participants consuming at least the lower value for breads and cereals and not exceeding the upper limit for extra foods were classified as meeting the recommendation.†Analysis excluded participants missing at least 10% of the FFQ (n = 99) and pregnant women (n = 78).‡ Participants classified as meeting the vegetable recommendation are consuming 4–5 serves/day not 5 as per the recommendation.
Table 3: Number of recommendations men and women were achieving by takeaway food consumption
Number of recommendations* achieved Consuming takeaway < 2/week Consuming takeaway ≥ 2/week P-value% n % n
Men n = 772 n = 4600 4.9 38 7.2 331 22.8 176 32.6 1502 36.4 281 40.2 1853 23.1 178 14.6 67
4-6 12.8 99 5.4 25 P < 0.001Women n = 1183 n = 263
0 2.6 31 4.6 121 18.7 221 29.7 782 28.6 338 33.1 873 29.4 348 23.2 61
4-6 20.7 245 9.5 25 P < 0.001
*Daily Dietary Recommendations for Australian Adults aged 19–60 years recommend 6–12 servings (men) or 4–9 servings (women) of bread and cereals, 5 servings of vegetables, 2 servings of fruit, 2 servings of dairy, 1 serving of lean meat and alternatives, 0–3 (men) or 0–2 1/2 (women) servings of extra foods. Participants consuming at least the lower value for breads and cereals and not exceeding the upper limit for extra foods were classified as meeting the recommendation. Participants classified as meeting the vegetable recommendation are consuming 4–5 serves/day. Note: P-values calculated using Chi square analysis with groups 4–6 combined so cell values were all > 5.
Page 7 of 13(page number not for citation purposes)

International Journal of Behavioral Nutrition and Physical Activity 2009, 6:29 http://www.ijbnpa.org/content/6/1/29
because those factors were negatively (LTPA) or positively(TV viewing, employment status of men) correlated withwaist circumference. Adjusting for age and employmentstatus (women) increased the coefficient of takeaway foodconsumption because those factors were negatively(employment status of women) or positively (age) corre-lated with waist circumference. In multivariable analysis,these four factors were significant predictors of consum-ing takeaway food at least twice a week.
Using BMI in place of waist circumference as the outcomevariable, an association with takeaway food consumptionwas only found for men classified as being obese thoughthis association was not statistically significant. In con-trast, women eating takeaway food twice a week or morehad a significantly higher prevalence of overweight andobesity.
DiscussionWe have shown takeaway food consumption is associatedwith a poorer diet quality and a higher prevalence of mod-erate abdominal obesity in young Australian adults. Dif-ferent socio-economic and lifestyle factors are associatedwith a higher frequency of takeaway food consumption inmen and women.
Differences in the methods used to ascertain takeawayand fast food consumption and the definition of takeawayor fast food used make it difficult to compare findingsacross studies. The frequency of takeaway food consump-tion in the current study was higher than that reported ina Mediterranean population (aged 24–75 years) whereonly 1.1% were consuming fast food at least twice perweek but only hamburgers, cheese burgers, Big Macs and
French fries were included as fast food [9]. A study in theUSA reported 30% of men and 24% of women (aged 20years and older) had consumed fast food on at least oneof the two days studied using 24-hour diet recalls [4].
The socio-economic and lifestyle characteristics we foundto be associated with higher frequency of takeaway foodconsumption were similar to those found in previousstudies: younger age [5,8], being single [7,9] and watchingmore television [7]. However, to our knowledge this is thefirst study to report characteristics of takeaway food con-sumption separately for men and women. Being singleand spending more time watching TV and sitting wereassociated with takeaway food consumption in bothsexes. In men, being younger and a current smoker werealso associated with takeaway consumption whereas inwomen, there was an association with employment sta-tus.
We found men consumed takeaway more frequently thanwomen, which is consistent with some studies [6,37], butnot others [8,9]. In contrast to a previous study [7] wefound no significant association between takeaway foodconsumption and alcohol consumption in men orwomen.
Studies of socio-economic position and diet quality reportthat people of lower socio-economic status consume dietsthat are higher in energy dense foods such as takeawayfoods [38]. However, our measures of socio-economic sta-tus (employment status and education) in this sample ofyoung Australian adults do not support this. Participantswho were not in the workforce were not high consumersof takeaway food, possibly because they could not afford
Table 4: Prevalence ratios of overweight and obesity for frequency of takeaway food consumption
Frequency of takeaway food consumption % n/N Unadjusted PR 95% CI AdjustedPR*
95% CI
MenWC ≥ 94 cm < 2/week 24.4 158/647 1.00 1.00
≥ 2/week 32.5 136/418 1.33 1.10, 1.62 1.31 1.07, 1.61BMI ≥ 25 kg/m2 < 2/week 61.8 400/647 1.00 1.00
≥ 2/week 61.2 255/417 0.99 0.90, 1.10 0.98 0.88, 1.09BMI ≥ 30 kg/m2 < 2/week 14.7 95/647 1.00 1.00
≥ 2/week 18.5 77/417 1.26 0.96, 1.65 1.21 0.90, 1.63Women†
WC ≥ 80 cm < 2/week 32.7 297/909 1.00 1.00≥ 2/week 40.0 88/220 1.22 1.02, 1.48 1.25 1.04, 1.50
BMI ≥ 25 kg/m2 < 2/week 36.5 332/910 1.00 1.00≥ 2/week 44.1 97/220 1.21 1.02, 1.44 1.22 1.03, 1.45
BMI ≥ 30 kg/m2 < 2/week 13.3 121/910 1.00 1.00≥ 2/week 17.7 39/220 1.33 0.96, 1.85 1.29 0.93, 1.80
PR = prevalence ratio, calculated using log binomial regression. WC = waist circumference.*Adjusted for age, leisure time physical activity, TV viewing and employment status.†Pregnant women (n = 78) were excluded from this analysis.
Page 8 of 13(page number not for citation purposes)

International Journal of Behavioral Nutrition and Physical Activity 2009, 6:29 http://www.ijbnpa.org/content/6/1/29
to purchase it, and education had no association withtakeaway food consumption. Previous studies investigat-ing associations between income and takeaway food con-sumption have reported mixed results with some studiesreporting participants with a high income to be the high-est consumers [6,11], some showing participants with alow income to be the highest consumers [5], and yet oth-ers showing no association [15]. Education also showsmixed results with the majority of studies being consistentwith our finding of no association [6,8,15], but othershave reported positive associations with high education[9] or low education [7].
The number of participants achieving individual dietaryrecommendations was very low and lowest in participantswho were eating takeaway food more frequently. This sug-gests takeaway food is not just an additional food item inan otherwise healthy diet but is associated with a numberof other unhealthy eating behaviours, possibly by displac-ing healthier items from the diet. Our findings are similarto previous studies from the USA and Spain that report ahigher frequency of takeaway or fast food consumption isassociated with a lower intake of fruit, vegetables anddairy [5,7-9]. A higher frequency of takeaway food con-sumption was associated with a lower intake of breadsand cereals in men and a lower intake of lean meats andalternatives in women. Overall participants eating takea-way food more frequently met fewer of the dietary recom-mendations. This supports the previous study in Spainthat examined overall diet quality, where participants eat-ing fast food at least twice per week had the lowest adher-ence to the Healthy Eating Index and the MediterraneanDiet Score [9].
This is the first study to show that young adults eatingtakeaway more frequently have a somewhat higher preva-lence of moderate abdominal obesity as measured bywaist circumference. Women eating takeaway food twicea week or more had a higher prevalence of being over-weight or obese as defined by a BMI ≥ 25 kg/m2 and thisassociation remained significant after adjusting for covari-ates. However, in men, an association was only seen at thehigher level of BMI (≥ 30 kg/m2) and the association wasnot significant. While we were unable to adjust for energyintake, because this was not available from the FFQ, wedid take into account key determinants of energy intakeby stratifying the analysis by sex and adjusting for age andphysical activity levels. Due to the cross-sectional analysis,we cannot be certain of the direction of a causal relation-ship between takeaway food consumption and abdomi-nal obesity. Although our study sample comes from acohort study, longitudinal analysis is not possible becausecomparable dietary data were not collected in childhood.Previous studies have found an association between take-
away and fast food consumption and BMI [9] and changesin weight over time [5,7,12,39].
There are several limitations with the dietary recommen-dation analysis. First, the response option for the vegeta-ble question combined four and five serves per day, andthe proportion meeting the vegetable recommendation(at least five daily serves) is likely to be lower than thatreported here. In addition, compliance with the lean meatand alternatives recommendation may be overestimateddue to the large number of items included in this variable.However, previous national data show consumption ofmeat and alternatives is high in Australian adults [40].Second, although we excluded from the analysis partici-pants who had not adequately completed the question-naire (those that failed to complete > 90% of the FFQ), wewere left with occasional non-responses to items by theremaining respondents. These were assigned a value ofzero on the grounds that a non-response indicated therespondent did not eat that food. However, some of thesemissing items may have been overlooked by the respond-ent. If so, this would have resulted in under-estimation ofthe proportions of respondents meeting the dietary rec-ommendations. It is reassuring that this measurementerror did not appear to be differential between the twotakeaway food groups, with the exception of the lean meatand alternatives food group. Third, the guidelines recom-mend consuming wholegrain breads and cereals; apartfrom bread, the FFQ did not distinguish between whole-grain and non-wholegrain items. Fourth, components ofmixed dishes were not included as items in the foodgroups and may be under-estimated. Mixed dishes aregenerally difficult to assess using FFQs [41].
A strength of this study was that we asked about usualtakeaway food consumption and, in addition to foodavailable from the main fast food chains (McDonalds,Pizza Hut, KFC etc), our takeaway food variable includedother popular takeaway food options such as Indian, Thaiand Chinese foods. Furthermore, this is the first study toreport associations of takeaway food consumption withlifestyle factors separately for men and women. We didthis because we were interested in examining potential sexdifferences in takeaway food consumption to betterunderstand the predictors of this eating behaviour. Otherstrengths include the use of a FFQ that has been used inprevious national surveys, and examining overall dietquality, which has been done in only one previous study.
ConclusionIn this large nationwide study of young Australian adultswe found participants consuming takeaway food at leasttwice per week met fewer of the dietary recommendationsand had a modestly higher prevalence of moderateabdominal obesity compared with participants consum-
Page 9 of 13(page number not for citation purposes)

International Journal of Behavioral Nutrition and Physical Activity 2009, 6:29 http://www.ijbnpa.org/content/6/1/29
ing takeaway once a week or less. Initiatives to reducetakeaway food consumption or to promote healthier take-away food options have the potential to improve dietquality and prevent obesity.
AbbreviationsFFQ: food frequency questionnaire; FHQ: food habitsquestionnaire; IPAQ: international physical activity ques-tionnaire; LTPA: leisure time physical activity; PR: preva-lence ratio; WC: waist circumference.
Competing interestsThe authors declare that they have no competing interests.
Authors' contributionsKS performed the statistical analysis and drafted the man-uscript. SM provided nutritional advice and helped draftthe manuscript. SG provided analytical and interpretiveadvice and helped draft the manuscript. LB provided sta-tistical support and critical revision of the manuscript. TDwas involved in conceptualisation of the study and pro-vided critical revision of the manuscript. AV was involvedin the conceptualisation of the study, acquisition of dataand helped draft the manuscript. All authors read andapproved the final manuscript.
Appendix 1 – Items from food frequency questionnaire that were included in daily equivalentsBreads and cerealsWhite bread, toast or rolls
Wholemeal/mixed grain bread, toast or rolls
English muffin, bagel or crumpet
Flat bread (e.g. pita, chapatti)
Dry or savoury biscuits, crispbread, crackers
Muesli
Cooked porridge
Breakfast cereal
Rice (white or brown)
Pasta (including filled), noodles
DairyFlavoured milk drink (e.g. milkshake, iced coffee, hotchocolate)
Milk as a drink
Milk added to breakfast cereal
Yoghurt, plain or flavoured (including fromage frais)
Cheddar and other cheeses
Soy milk
Lean meat, fish, eggs* Mince dishes (e.g. rissoles, meatloaf)
* Mixed dishes with beef, veal, lamb, pork (e.g. casserole,stir fry)
* Beef, veal – roast, chop or steak
* Lamb – roast, chop
* Pork – roast, chop
* Mixed dishes with chicken, duck, turkey (e.g. casserole,stir-fry)
* Chicken, turkey, duck – roast, steamed or barbequed
Canned fish (e.g. tuna, salmon, sardines)
Fresh fish – steamed, baked, grilled
Frozen fish – steamed, baked, grilled
Mussels/oysters
Lobster/crayfish/yabbies
Calamari/squid
Prawns
Other seafood
Egg
Almonds, walnuts, hazelnuts
Cashews
Coconuts
Peanuts
Pistachio
Seeds – pumpkin, sesame, pine nuts, tahini
Page 10 of 13(page number not for citation purposes)

International Journal of Behavioral Nutrition and Physical Activity 2009, 6:29 http://www.ijbnpa.org/content/6/1/29
Other nuts, seeds
Baked beans
Other beans, lentils
* These items were only included as lean meat if partici-pant indicated in the food habits questionnaire that fatwas usually trimmed from their meat either before or aftercooking.
Extra foods – excluding takeawayCream or sour cream
Ice cream
Cakes, sweet muffins, scones or pikelets
Sweet pies or sweet pastries
Other pudding or desserts
Plain, sweet biscuits
Cream, chocolate biscuits
Chocolate (including chocolate bars e.g. Mars bar™)
Other confectionary
Potato chips, corn chips, Twisties™ etc
Oil and vinegar dressing
Mayonnaise or other creamy dressings
Jam, marmalade, syrup or honey
Creamy dips and spreads
Fruit juice drink or fruit cordial
Cordial
Soft drinks (including flavoured mineral water)
Light beer
Medium strength beer
Full strength beer
Red wine
White wine or champagne/sparkling wine
Wine cooler
Spirit-based mixed drinks (e.g. Lemon Ruski™)
Sherry/port/fortified wines
Spirits, liquers
Other alcoholic drinks (e.g. cider)
Fruit and vegetablesNote: Daily equivalents of fruits and vegetables wereobtained from short questions in the food habits ques-tionnaire.
Additional analysisVegetablesGreen/mixed salad (including lettuce, tomato etc) in asandwich
Green/mixed salad (including lettuce, tomato etc) as aside-salad with a main meal
Stir-fried or mixed vegetables
Vegetable casserole
Sweet potato
Pumpkin
Peas (including snow peas)
Green beans
Silverbeet/spinach
Broccoli
Cauliflower
Brussel sprouts, cabbage, coleslaw
Carrots
Mushrooms
Capsicum
Sweetcorn, corn on the cob
Zucchini, eggplant, squash
Cucumber
Page 11 of 13(page number not for citation purposes)

International Journal of Behavioral Nutrition and Physical Activity 2009, 6:29 http://www.ijbnpa.org/content/6/1/29
Tomatoes (except when in a 'mixed salad')
Lettuce (except when in a 'mixed salad')
Celery (except when in a 'mixed salad')
Onion or leek
Soy beans, tofu
Baked beans
Other beans, lentils
FruitsFruits – dried frozen, canned
Fresh fruit salad
Apple or pear
Orange, mandarin, grapefruit
Banana
Peach, nectarine, plum or apricot
Mango or paw paw
Pineapple
Grapes or berries
Melon (watermelon, rockmelon or honeydew melon)
Other fruit not listed
Additional material
AcknowledgementsThis study was funded by grants from the National Health and Medical Research Council, the National Heart Foundation, the Tasmanian Commu-nity Fund, and Veolia Environmental Services. We gratefully acknowledge the aid of sponsors of the Childhood Determinants of Adult Health study (Sanitarium, ASICS, and Target), and the contributions of the study's project manager Ms Marita Dalton, all other project staff, and the study par-ticipants. Sarah A McNaughton and Seana Gall are supported by National
Health & Medical Research Council (NHMRC) Public Health Postdoctoral Fellowships. The funding bodies had no role in the analysis or preparation of the manuscript.
References1. Australian Bureau of Statistics: Cafes, restaurants and catering
services, Australia 2006–07. Canberra 2008.2. Nielsen SJ, Siega-Riz AM, Popkin BM: Trends in Food Locations
and Sources among Adolescents and Young Adults. PreventiveMedicine 2002, 35:107-113.
3. Nielsen SJ, Siega-Riz AM, Popkin BM: Trends in Energy Intake inUS between 1977 and 1996: Similar Shifts Seen across AgeGroups. 2002, 10:370-378.
4. Bowman SA, Vinyard BT: Fast food consumption of U.S. adults:impact on energy and nutrient intakes and overweight sta-tus. J Am Coll Nutr 2004, 23:163-168.
5. French SA, Harnack L, Jeffery RW: Fast food restaurant useamong women in the Pound of Prevention study: dietary,behavioral and demographic correlates. Int J Obes Relat MetabDisord 2000, 24:1353-1359.
6. Mohr P, Wilson C, Dunn K, Brindal E, Wittert G: Personal and life-style characteristics predictive of the consumption of fastfoods in Australia. Public Health Nutrition 2007, 10:1456-1463.
7. Pereira MA, Kartashov AI, Ebbeling CB, Van Horn L, Slattery ML,Jacobs DR Jr, Ludwig DS: Fast-food habits, weight gain, and insu-lin resistance (the CARDIA study): 15-year prospective anal-ysis. Lancet 2005, 365:36-42.
8. Satia JA, Galanko JA, Siega-Riz AM: Eating at fast-food restau-rants is associated with dietary intake, demographic, psycho-social and behavioural factors among African Americans inNorth Carolina. Public Health Nutr 2004, 7:1089-1096.
9. Schroder H, Fito M, Isabel Covas M: Association of fast food con-sumption with energy intake, diet quality, body mass indexand the risk of obesity in a representative Mediterraneanpopulation. Br J Nutr. 2007, 98(6):1274-1280.
10. Niemeier HM, Raynor HA, Lloyd-Richardson EE, Rogers ML, WingRR: Fast food consumption and breakfast skipping: predic-tors of weight gain from adolescence to adulthood in anationally representative sample. J Adolesc Health 2006,39:842-849.
11. Paeratakul S, Ferdinand DP, Champagne CM, Ryan DH, Bray GA:Fast-food consumption among US adults and children: die-tary and nutrient intake profile. J Am Diet Assoc 2003,103:1332-1338.
12. Ball K, Brown W, Crawford D: Who does not gain weight? Prev-alence and predictors of weight maintenance in youngwomen. Int J Obes Relat Metab Disord 2002, 26:1570-1578.
13. Canoy D, Boekholdt SM, Wareham N, Luben R, Welch A, Bingham S,Buchan I, Day N, Khaw KT: Body fat distribution and risk of cor-onary heart disease in men and women in the European Pro-spective Investigation Into Cancer and Nutrition in Norfolkcohort: a population-based prospective study. Circulation 2007,116:2933-2943.
14. Zhang C, Rexrode KM, van Dam RM, Li TY, Hu FB: Abdominalobesity and the risk of all-cause, cardiovascular, and cancermortality: sixteen years of follow-up in US women. Circulation2008, 117:1658-1667.
15. Simmons D, McKenzie A, Eaton S, Cox N, Khan MA, Shaw J, ZimmetP: Choice and availability of takeaway and restaurant food isnot related to the prevalence of adult obesity in rural com-munities in Australia. Int J Obes (Lond) 2005, 29:703-710.
16. World Health Organization: Obesity: preventing and managingthe global epidemic. Geneva: World Health Organization; 1998.
17. Dwyer T, Gibbons LE: The Australian Schools Health and Fit-ness Survey. Physical fitness related to blood pressure butnot lipoproteins. Circulation 1994, 89:1539-1544.
18. Ball K, Mishra GD, Thane CW, Hodge A: How well do Australianwomen comply with dietary guidelines? Public Health Nutr 2004,7:443-452.
19. McNaughton SA, Ball K, Crawford D, Mishra GD: An index of dietand eating patterns is a valid measure of diet quality in anAustralian population. J Nutr 2008, 138:86-93.
20. Mishra G, Ball K, Arbuckle J, Crawford D: Dietary patterns of Aus-tralian adults and their association with socioeconomic sta-
Additional file 1Socio-economic and lifestyle factors associated with consuming takea-way food at least twice a week.Click here for file[http://www.biomedcentral.com/content/supplementary/1479-5868-6-29-S1.docx]
Page 12 of 13(page number not for citation purposes)

International Journal of Behavioral Nutrition and Physical Activity 2009, 6:29 http://www.ijbnpa.org/content/6/1/29
Publish with BioMed Central and every scientist can read your work free of charge
"BioMed Central will be the most significant development for disseminating the results of biomedical research in our lifetime."
Sir Paul Nurse, Cancer Research UK
Your research papers will be:
available free of charge to the entire biomedical community
peer reviewed and published immediately upon acceptance
cited in PubMed and archived on PubMed Central
yours — you keep the copyright
Submit your manuscript here:http://www.biomedcentral.com/info/publishing_adv.asp
BioMedcentral
tus: results from the 1995 National Nutrition Survey. Eur JClin Nutr 2002, 56:687-693.
21. Worsley A, Blasche R, Ball K, Crawford D: Income differences infood consumption in the 1995 Australian National NutritionSurvey. Eur J Clin Nutr 2003, 57:1198-1211.
22. Savige GS, Ball K, Worsley A, Crawford D: Food intake patternsamong Australian adolescents. Asia Pac J Clin Nutr 2007,16:738-747.
23. Australian Bureau of Statistics: National Nutritional SurveyUsers' Guide 1995. Canberra 1998.
24. Crawford D, Ball K, Mishra G, Salmon J, Timperio A: Which food-related behaviours are associated with healthier intakes offruits and vegetables among women? Public Health Nutr 2007,10:256-265.
25. Coyne T, Ibiebele TI, McNaughton S, Rutishauser IH, O'Dea K, HodgeAM, McClintock C, Findlay MG, Lee A: Evaluation of brief dietaryquestions to estimate vegetable and fruit consumption –using serum carotenoids and red-cell folate. Public Health Nutr2005, 8:298-308.
26. Smith A, Kellet E, Schmerlaib Y: The Australian Guide to HealthyEating. Canberra: Commonwealth Department of Health and Fam-ily Sevices; 1998.
27. Go for 2&5 [http://www.gofor2and5.com.au/]28. National Health and Medical Research Council: Dietary Guidelines
for Australian Adults. Canberra 2003.29. Craig CL, Marshall AL, Sjostrom M, Bauman AE, Booth ML, Ains-
worth BE, Pratt M, Ekelund U, Yngve A, Sallis JF, Oja P: Interna-tional physical activity questionnaire: 12-country reliabilityand validity. Med Sci Sports Exerc 2003, 35:1381-1395.
30. Salmon J, Owen N, Crawford D, Bauman A, Sallis JF: Physical activ-ity and sedentary behavior: a population-based study of bar-riers, enjoyment, and preference. Health Psychol 2003,22:178-188.
31. Standard Drink Guide [http://www.alcohol.gov.au/internet/alcohol/publishing.nsf/Content/standard]
32. National Health and Medical Research Council: Australian alcoholguidelines for low-risk drinking: Draft for public consultation.Australia 1997.
33. Spiegelman D, Hertzmark E: Easy SAS Calculations for Risk orPrevalence Ratios and Differences. Volume 162. Oxford UnivPress; 2005:199-200.
34. Australian Bureau of Statistics: Census of Population and Hous-ing. Australia 2001.
35. Australian Bureau of Statistics: Census of Population and Hous-ing. Australia 2006.
36. Australian Bureau of Statistics: National Health Survey: Sum-mary of Results. Canberra 2004.
37. Larson NI, Neumark-Sztainer DR, Story MT, Wall MM, Harnack LJ,Eisenberg ME: Fast food intake: longitudinal trends during thetransition to young adulthood and correlates of intake. J Ado-lesc Health 2008, 43:79-86.
38. Drewnowski A, Specter SE: Poverty and obesity: the role ofenergy density and energy costs. Am J Clin Nutr 2004, 79:6-16.
39. Duffey KJ, Gordon-Larsen P, Jacobs DR Jr, Williams OD, Popkin BM:Differential associations of fast food and restaurant food con-sumption with 3-y change in body mass index: the CoronaryArtery Risk Development in Young Adults Study. Am J ClinNutr 2007, 85:201-208.
40. Australian Bureau of Statistics: National Nutrition Survey:Selected Highlights, Australia, 1995. Canberra 1997.
41. Cade J, Thompson R, Burley V, Warm D: Development, validationand utilisation of food-frequency questionnaires – a review.Public Health Nutr 2002, 5:567-587.
Page 13 of 13(page number not for citation purposes)